Abstract
To explore the relationship between total cyanide and easily liberatable cyanide in cyanide tailings and its impact on the environment, the leaching and release characteristics of total cyanide and easily liberatable cyanide in a tailings pond were studied using a dynamic leaching experiment, and a dynamic model was established. The results show that the release concentration of total cyanide in cyanide tailings is higher than that of easily liberatable cyanide. With the increase in leaching time, the release of cyanide is more sensitive to leaching intensity. The first-order kinetic, second-order kinetic, modified Elovich, double constant, and parabolic diffusion equations were used to fit the cumulative release of cyanide. According to the kinetic results of cyanide cumulative release, in addition to the first-order kinetic equation, the other four equations revealed good fitting for the cyanide leaching process, which shows that cyanide released under simulated rainwater leaching was not simply via surface diffusion, but controlled by multiple factors.
1. Introduction
Leaching refers to the natural infiltration of rainwater leading to the dissolution of mineral salts, chemical elements, or organic substances in the upper layer and migration to the lower layer [1]. Leachate produced by leaching enters the water body and soil, causing serious metal pollution and damaging the ecological environment. According to statistics, billions of tons of tailings are produced in China every year, accounting for about 50% of China’s total output of bulk industrial solid waste [2]. Most tailings ponds have no corresponding leachate collection and treatment facilities, which are generally diluted by rainwater or industrial water and discharged, seriously polluting the surrounding water and soil environment.
There are many kinds of waste stored in tailings pond (blast furnace tailings, mine waste rock tailings, etc.), but there are many rainfall factors that affect the release of heavy metals from each waste. Therefore, in order to meet the needs of economic and social development, it is urgent to solve these key problems. Generally speaking, a solid waste can be used to objectively analyze the leaching concentration of polluting ions under the condition of a leaching model, such as the study of the release of static and dynamic leached Sb in the tailings of the blast furnace, mine waste, and tailings in Lengshuijiang, Hunan, China [3], the leaching characteristics of uranium from metallurgical waste and ores in the Singhbhum East district [4], and the acidification of the water quality and great increase in the hardness of water due to leachate [5,6]. These studies yielded numerous favorable results. Nevertheless, few studies have been aimed at the release characteristics of pollutants in nonferrous metal mines, especially in cyanide tailings. The vast majority of gold produced every year in the world is extracted using cyanide leaching technology. In the 21st century, China gradually became the largest gold-producing country, in which more than 90% of gold plants adopt cyanidation technology [7,8,9,10]. With the decrease in gold bearing grade, the discharge of cyanide tailings continues to increase. At present, an area of tens of thousands of square kilometers in China are occupied due to the accumulation of cyanide tailings. In addition, the economic loss caused by the pollution of cyanide tailings every year is up to 10 billion USD [11,12,13,14]. Previous studies on the harm of cyanide tailings mainly focused on the content of heavy metals. Qian et al. [15] and Qiu et al. [16] found that some heavy metals in cyanide tailings were released in high concentration under the leaching action when they treated the leaching water of a cyanide tailings pond. However, the environmental and biological hazards of cyanide tailings are not only reflected in the heavy-metal content, but also largely dependent on the toxic release of cyanide into the environment. Griffiths et al. [17] found that the tailings discharge concentration exceeded the industry standard wildlife protective limit of 50 mg/L weak acid dissociable cyanide. At the same time, Donato et al. [18] suggested the need for a decision-making tool to derive an appropriate cyanide discharge concentration into tailings systems. It can be seen that, under long-term weathering and rain leaching, the cyanide tailings in the open air may release cyanide and enter the air, water, and soil, thereby polluting the environment, which poses a great threat to the ecosystem and environment.
Therefore, this work studied the release characteristics of total cyanide and easily liberatable cyanide released from cyanide tailings through a dynamic leaching test, as well as evaluated the hazard degree of the two pollutants, aiming to reveal the pollution characteristics of cyanide tailings and provide a theoretical basis for the prevention and control of cyanide tailings.
2. Materials and Methods
2.1. Materials
The cyanide tailings used in this research were provided by Haoyao’erhudong gold deposit in Urat, Inner Mongolia, China. The climate in the area is typical continental climate, with annual precipitation of 233.7 mm and evaporation of 2646.2 mm. Furthermore, the highest temperature in the summer can approach 40 °C, the lowest temperature in the winter can go below −32 °C, and the annual average temperature is 3–6.8 °C, representing a continental arid climate. Chemical analysis of cyanide tailings was conducted using an inductively coupled plasma optical emission spectrometer (ICP-OES, Avio500, PerkinElmer, Waltham, MA, USA). The results obtained are shown in Table 1.

Table 1.
The ICP chemical analysis of cyanide tailings (wt.%).
2.2. Leaching Experiment
For the leaching test, cyanide tailings were used to simulate rainwater leaching at a flow rate of 2.5–10 mL/(min·kg) for 11 days. The initial leaching solution pH value was manually configured at 6–7. The simulated dynamic leaching experimental device is shown in Figure 1. The leaching column was plexiglass with a height of 50 cm and a radius of 4 cm. The bottom was sealed with a plexiglass plate with a 2 mm diameter circular hole. In order to prevent sample loss and ensure uniform distribution of the leaching solution, an inert quartz sand, nonwoven fabric and qualitative filter paper were laid on the bottom and upper layers of the leaching column, respectively. The fresh cyanide tailings were divided into 1 kg aliquots and used to fill the leaching column. The isolation temperature (room temperature 20–22 °C), wind force, and light of the leaching solution were maintained. Under different leaching intensity (0.5 mm/min, 1.5 mm/min, and 2.0 mm/min) and temperature (2 °C, 12 °C, and 22 °C), the effect of leaching on the degradation of cyanide tailings was investigated. Samples were taken at certain intervals to determine the content of cyanide in the leaching solution. Three sets of the same leaching device were used to carry out the experiment.
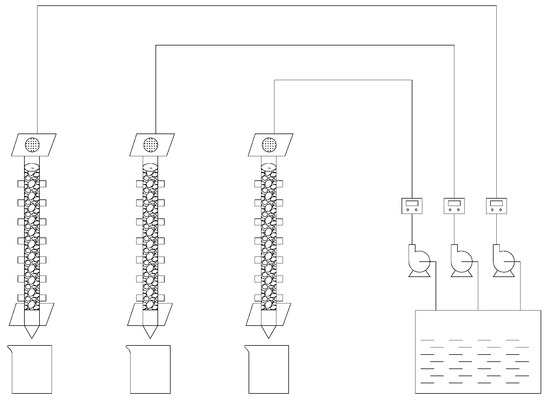
Figure 1.
Schematic diagram of a simulated dynamic leaching experiment device.
2.3. Analysis Methods
Water quality determination, cyanide flow injection analysis (FIA), and a spectrophotometric method were used to determine the concentration of total cyanide and easily liberatable cyanide, with a standard deviation less than 5%. After filtration of the leaching solution obtained in Section 2.2, the supernatant was taken and adjusted using acid (the measured pH of total cyanide is < 2, while the measured pH of easily liberatable cyanide is 4). Then, hydrolysis and UV digestion were carried out at 140 °C under high temperature and pressure, and the released hydrogen cyanide gas was absorbed by sodium hydroxide solution. Under neutral conditions, cyanide in the absorption solution reacts with chloramine T to produce cyanogen chloride, and then reacts with pyridine to produce glutaraldehyde, finally forming condensed red-purple compounds with barbituric acid. The absorbance was measured using a visible spectrophotometer, and the concentration of total cyanide and easily liberatable cyanide in the leaching solution was calculated.
The chemical composition of cyanide tailings was detected using an inductively coupled plasma optical emission spectrometer (ICP-OES, Avio500, PerkinElmer, Waltham, MA, USA). The chemical composition of the sample is shown in Table 1. The morphology of the sample was analyzed using a SEM (EVO18, ZEISS, Oberkochen, Germany).
3. Results and Discussion
3.1. Effect of Leaching Intensity on Leaching
Figure 2a,b show the change in total cyanide and easily liberatable cyanide concentration with leaching time under leaching intensities of 0.5 mm/min, 1.5 mm/min, and 2.0 mm/min. The cyanide in the leaching solution decreased with the increase in leaching intensity. Under the same condition, the concentration of total cyanide and easily liberatable cyanide decreased with time, and, in the initial stage, the concentration of cyanide decreased sharply. After leaching for 15 h, the concentrations with a leaching intensity of 2 mm/min were 82.8 mg/L and 16.4 mg/L for total cyanide and easily liberatable cyanide, respectively. At this time, at a leaching intensity of 1.5 mm/min and 0.5 mm/min, the total cyanide concentrations were 243 mg/L and 678 mg/L, respectively, and the easily liberatable cyanide concentrations were 22.3 mg/L and 72.2 mg/L, respectively. This may be because, compared with the low and medium leaching intensity, the higher leaching intensity caused a greater leaching shear force on the leaching residue [19]. The stronger scouring force on the microstructure of cyanide tailings led to their serious erosion. Water and air enter into the cyanide tailings and react as shown in Equations (1) and (2) [20,21]. Therefore, the increase in leaching intensity led to a decrease in cyanide concentration in the leaching solution. To the end, the concentration of cyanide leaching solution tended to gradually stabilize, effectively reaching 0 after 104 h of leaching. It is worth noting that, at 0.5 mm/min intensity, this result took 176 h. It can be seen that the leaching intensity and leaching time had an effect on the concentration of cyanide.
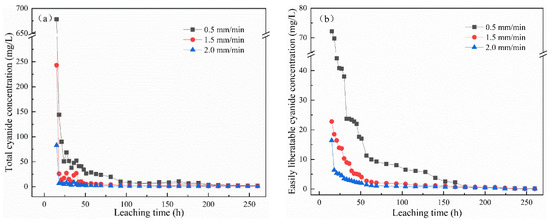
Figure 2.
Effect of leaching intensity on the concentration of (a) total cyanide and (b) easily liberatable cyanide at different timepoints.
3.2. Effect of Leaching Temperature on Cyanide Leaching
When the leaching intensity was 2 mm/min, the changes in total cyanide concentration and easily liberatable cyanide concentration with leaching time under leaching temperatures of 2 °C, 12 °C, and 22 °C are shown in Figure 3a,b. With the increase in leaching temperature, the content of cyanide in the leaching solution decreased. At the same leaching temperature, the concentrations of total cyanide and easily liberatable cyanide decreased with the increase in leaching time. The total cyanide concentration gradually stabilized after 36 h of leaching, reaching less than 10 mg/L, and the easily liberatable cyanide concentration gradually tended to 0 after leaching for 42 h. The dissolution of cyanide is an exothermic reaction. According to Equations (1) and (2), in the temperature range of 0–35 °C, the changes in reaction enthalpy and entropy were < 0, indicating that the reaction would be spontaneous at low temperature [22]. Therefore, the leaching temperature had little effect on the concentration of cyanide in the leaching solution.
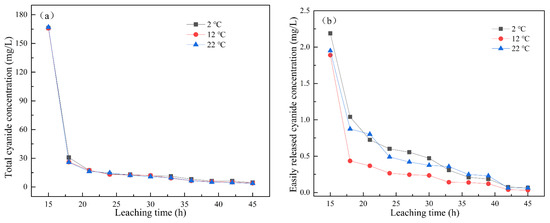
Figure 3.
Effect of leaching temperature on the concentration of (a) total cyanide and (b) easily liberatable cyanide at different timepoints.
3.3. Kinetic Study on the Cumulative Release of Cyanide
3.3.1. Effect of Different Leaching Intensity on Cumulative Release of Cyanide
The change in the cumulative release of total cyanide and easily liberatable cyanide with time is shown in Figure 4. It was found that the cumulative release of total cyanide was little affected by a low leaching intensity, while the cumulative release of easily liberatable cyanide decreased with the increase in leaching intensity. It can be seen from Figure 4a,b that, in the whole cyanide leaching process, with the extension of the leaching time, the leaching cumulative release of total cyanide and easily liberatable cyanide showed two stages: initial high-speed accumulation followed by a slow and continuous growth trend. Moreover, different leaching intensities had different effects on the cumulative release of cyanide. The main reason may be that the cyanide on the surface of the cyanide tailings entered into the leaching solution at a fast speed. The second stage was a relatively slow release process due to the content of cyanide in the tailings gradually decreasing and slowly diffusing into the solution.
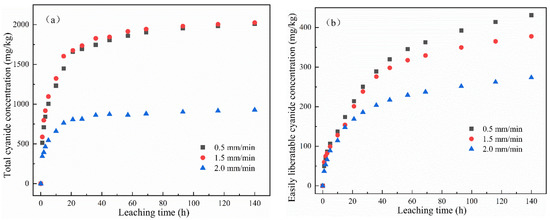
Figure 4.
Effect of leaching intensity on cumulative release of (a) total cyanide and (b) easily liberatable cyanide at different timepoints.
3.3.2. Establishment of Dynamic Model
The leaching models used by researchers mainly include first-order, second-order, double constant, parabolic diffusion, and Elovich kinetic equations [22,23,24]. The kinetic equation is obtained from the rate equation according to different reaction mechanisms. Therefore, by fitting the experimental data with different equations, the leaching mechanism of the actual process can be determined [25].
Aiming at the release of cyanide during the leaching process, the present work studied the kinetic model of cumulative release concentration. The data were fitted using first-order, second-order, double constant, parabolic diffusion, and Elovich kinetic equations to understand the leaching mechanism [26,27]. Their basic parameters are shown in Table 2.
Table 2.
Basic parameters of different dynamic models.
3.3.3. Reaction Rate Constant
Figure 5 and Figure 6 respectively show the first-order kinetics and second-order kinetics of the cumulative release of total cyanide and easily liberatable cyanide in cyanide tailings under leaching intensities of 0.5 mm/min, 1.5 mm/min, and 2.0 mm/min over time. According to the linear fitting equation, the correlation coefficient of the second-order equation was significantly higher than that of the quasi-first-order equation (R2 > 0.97). Therefore, the release behavior of cyanide in the simulated rain leaching process conformed to a second-order dynamic equation. The theoretical eluviation equilibrium calculated from the second-order fitting equation was also the closest to the actual amount of eluviation, proving the validity of the equation in describing the surface behavior of cyanide tailings. With the increase in leaching intensity, k2 had an increasing trend. To this end, the degradation rate of cyanide was significantly increased, indicating that the cyanide leaching process was not simply surface diffusion.
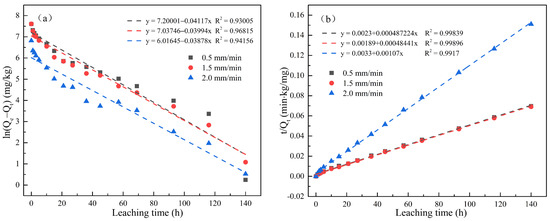
Figure 5.
Linear regressions between (a) ln(Qe − Qt) and (b) t/Qt of the accumulation release amount for total cyanide.
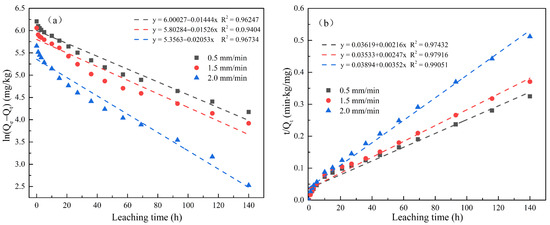
Figure 6.
Linear regressions between (a) ln(Qe − Qt) and (b) t/Qt of accumulation release amount for easily liberatable cyanide.
3.3.4. Diffusion Rate Constant
As reported in the literature, the double constant equation is often used to describe uniform energy distributions, the parabolic diffusion equation is controlled by multiple diffusion mechanisms, and the Elovich equation is more suitable for describing some complicated release mechanisms [26,27]. Therefore, the cumulative release of total cyanide and easily liberatable cyanide under different leaching intensities in Figure 4 was fitted using the Elovich, double constant, and parabola diffusion equations with the change in leaching time (as shown in Figure 7 and Figure 8). It can be seen from the fitting results of the kinetic equations in Table 3 and Table 4 that the correlation when fitting the total cyanide using different equations was as follows: R2Elovich > R2double constant > R2parabola diffusion, whereas Sedouble constant < SeElovich < Separabola diffusion. According to the correlation coefficient, the Elovich equation was better than the double constant and parabola diffusion equations. According to the standard error, the double constant diffusion equation was best. Therefore, we can highlight the Elovich equation and double constant equation are suitable for describing the release process of total cyanide. For the kinetic description of easily liberatable cyanide, it can be seen from Figure 8 and Table 3 and Table 4 that the correlation coefficients of the three kinetic equations were greater than 0.93, and the Elovich fitting effect was best at R2 > 0.98.
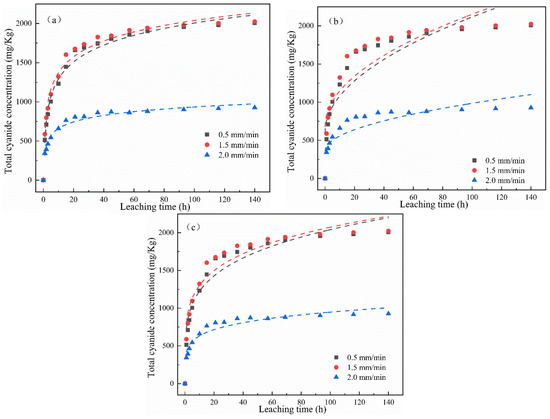
Figure 7.
Nonlinear fitting using (a) Elovich, (b) parabolic diffusion, and (c) double constant equations of total cyanide cumulative release over time under different leaching intensity.
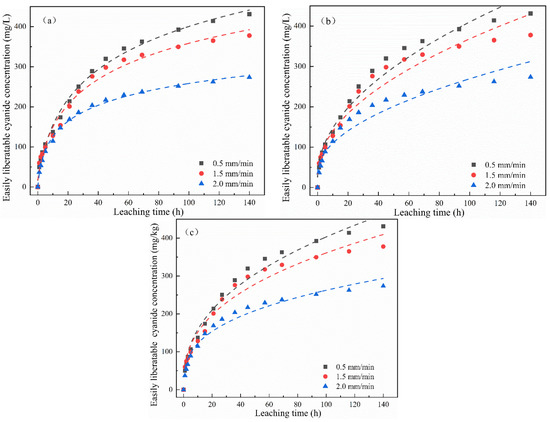
Figure 8.
Nonlinear fitting using (a) Elovich, (b) parabolic diffusion, and (c) double constant equations of easily liberatable cyanide cumulative release over time under different leaching intensity.
Table 3.
Fitted results of release kinetics for cyanide from cyanide tailings under simulated arain.
Table 4.
Coefficients of determination (R2) and standard errors (Se) of three kinetics equations.
3.4. Leaching Residue Analysis
Figure 9a1,b1 show the morphologic changes of cyanide tailings before and after dynamic leaching, respectively. After dynamic leaching, the surface of the cyanide tailings was broken, and a higher leaching intensity led to a greater corrosion effect of the cyanide tailings and a more severe surface fragmentation. The surface of cyanide tailings after leaching was smoother and more angular than that of the original sample, due to the oxidation–reduction reaction of the minerals on the surface under leaching erosion and precipitation into the leaching filtrate. Comparing the pore state of cyanide tailings before and after leaching, it can be seen that the number of pores on the surface of cyanide tailings after leaching was reduced, with some being blocked by broken minerals, which is why cyanide precipitation is reduced with the increase in rainfall duration. It is not difficult to find that the main elements in the cyanide tailings before and after leaching included Si, O, Ca, and Al with trace amounts of Cu and Fe (Figure 9a2,b2). EDS analysis shows that the main minerals in cyanide tailings existed in a gangue form (quartz, feldspar, etc.) and pyrite (Figure 9a3,b3). In addition, these wastes also contained other harmful heavy metals, such as As. As the main metal associated with Au, the impact of its leaching on the surrounding environment cannot be ignored.
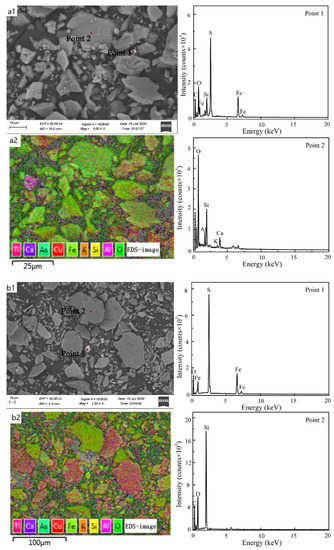
Figure 9.
SEM-EDS analysis of cyanide tailings (a1,a2) before dynamic leaching, and (b1,b2) after dynamic leaching.
4. Conclusions
The dynamic experiment of leaching cyanide tailings using simulated rain revealed that the release concentration of total cyanide and easily liberatable cyanide was higher than the sewage discharge standard, indicating that the prevention and control of cyanide pollution in cyanide tailings cannot be ignored. Furthermore, the influence of leaching intensity on the release of cyanide was greater than the influence of the temperature, and, as the leaching intensity increased, the reaction rate gradually increased, while the cumulative release of cyanide gradually decreased. The cumulative release process of total cyanide could be fitted using the second-order, Elovich, and double constant kinetic equations. The cumulative release process of easily liberatable cyanide could be fitted using the second-order, Elovich, double constant, and parabola diffusion equations. It can be seen that the leaching process of cyanide is a heterogeneous dispersion process, involving not a simple first-order reaction, but a diffusion factor and a complex release process.
Author Contributions
Conceptualization, Q.L. and L.T.; methodology, Q.L. and Y.Z.; formal analysis, Q.Z.; investigation, Q.L., Y.Z. and C.C.; resources, Z.L.; writing—original draft, Q.Z.; visualization, H.Y. and L.T.; funding acquisition, Z.L., H.Y. and L.T. All authors have read and agreed to the published version of the manuscript.
Funding
This research was funded by the National Key R&D Program of China, grant numbers 2018YFC1902001 and 2018YFC1902002.
Data Availability Statement
Data that support the findings of this study are available from the corresponding author upon reasonable request.
Conflicts of Interest
The authors declare no conflict of interest.
References
- Li, Z.; Zheng, Z.; Zhao, L.; Li, M. Leaching Release Rule of Metal Elements in Tailings and Pollution Evaluation. Ind. Water Wastewater 2022, 53, 45–50. [Google Scholar]
- Song, S.; Chu, J.; Zhang, H. Study on Environmental Risk Assessment and Control Countermeasures of Tailings pond in a Mountainous Area of North China. IOP Conf. Ser. Earth Environ. Sci. 2020, 585, 012095. [Google Scholar] [CrossRef]
- Ren, B.; Zhou, Y.; Ma, H.; Deng, R.; Zhang, P.; Hou, B. Sb release characteristics of the solid waste produced in antimony mining smelting process. J. Mater. Cycles Waste Manag. 2016, 20, 193–200. [Google Scholar] [CrossRef]
- Patra, A.C.; Sumesh, C.; Mohapatra, S.; Sahoo, S.; Tripathi, R.; Puranik, V. Long-term leaching of uranium from different waste matrices. J. Environ. Manag. 2010, 92, 919–925. [Google Scholar] [CrossRef]
- Guo, X.; Shi, H.; Xu, M. Static and dynamic leaching experiments of heavy metals from fly ash-based geopolymers. J. Wuhan Univ. Technol. Sci. Ed. 2013, 28, 938–943. [Google Scholar] [CrossRef]
- Liu, Z.-R.; Zeng, K.; Zhao, W.; Li, Y. Effect of Temperature on Iron Leaching from Bauxite Residue by Sulfuric Acid. Bull. Environ. Contam. Toxicol. 2008, 82, 55–58. [Google Scholar] [CrossRef]
- Dai, X.; Breuer, P.; Jeffrey, M. Comparison of activated carbon and ion-exchange resins in recovering copper from cyanide leach solutions. Hydrometallurgy 2010, 101, 48–57. [Google Scholar] [CrossRef]
- Dai, X.; Jeffrey, M.; Breuer, P. A mechanistic model of the equilibrium adsorption of copper cyanide species onto activated carbon. Hydrometallurgy 2010, 101, 99–107. [Google Scholar] [CrossRef]
- Lv, C.; Ding, J.; Qian, P.; Li, Q.; Ye, S.; Chen, Y. Comprehensive recovery of metals from cyanidation tailing. Miner. Eng. 2014, 70, 141–147. [Google Scholar] [CrossRef]
- Luque-Almagro, V.M.; Moreno-Vivián, C.; Roldán, M.D. Biodegradation of cyanide wastes from mining and jewellery industries. Curr. Opin. Biotechnol. 2016, 38, 9–13. [Google Scholar] [CrossRef]
- Zhao, Q.; Yang, H.; Tong, L. Adsorption characteristics of CN− species on the chalcopyrite surface and its response to flotation. Sep. Purif. Technol. 2021, 276, 119322. [Google Scholar] [CrossRef]
- Yu, X.J.; Zhang, Y.L.; Li, H.M. Recovery of Iron from Cyanide Tailings with Reduction Roasting–Water Leaching- Magnetic Separation. Adv. Mater. Res. 2011, 396–398, 486–489. [Google Scholar]
- Laitos, J.G. Cyanide, Mining, and the Environment. Pace Environ. Law Rev. 2013, 30, 869. [Google Scholar]
- Brüger, A.; Fafilek, G.; Restrepo-Baena, O.J.; Rojas-Mendoza, L. On the volatilisation and decomposition of cyanide contaminations from gold mining. Sci. Total Environ. 2018, 627, 1167–1173. [Google Scholar] [CrossRef]
- Qian, L.; Li, B.; Chen, X.; Li, X.; Lin, H. Leaching Characteristics and Release Rule of Heavy Metals from Gold Tailings. J. Southeast Univ. (Nat. Sci. Ed.) 2020, 50, 1084–1089. [Google Scholar] [CrossRef]
- Qiu, L.; Liu, Y.; Guo, X.; Wang, Y.; Dai, G. Experimental Study on Synergistic Treatment of Cyanide and Arsenic in Leaching Water of Gold Heap Leaching. Gold 2021, 42, 87–90. [Google Scholar]
- Griffiths, S.R.; Smith, G.B.; Donato, D.B.; Gillespie, C.G. Factors influencing the risk of wildlife cyanide poisoning on a tailings storage facility in the Eastern Goldfields of Western Australia. Ecotoxicol. Environ. Saf. 2009, 72, 1579–1586. [Google Scholar] [CrossRef]
- Donato, D.; Nichols, O.; Possingham, H.; Moore, M.; Ricci, P.; Noller, B. A critical review of the effects of gold cyanide-bearing tailings solutions on wildlife. Environ. Int. 2007, 33, 974–984. [Google Scholar] [CrossRef]
- Zhang, Y.; Ren, B.; Hursthouse, A.; Deng, R.; Hou, B. Leaching and Releasing Characteristics and Regularities of Sb and As from Antimony Mining Waste Rocks. Pol. J. Environ. Stud. 2019, 28, 4017–4025. [Google Scholar] [CrossRef]
- Adams, M.D. Impact of recycling cyanide and its reaction products on upstream unit operations. Miner. Eng. 2013, 53, 241–255. [Google Scholar] [CrossRef]
- Kuyucak, N.; Akcil, A. Cyanide and removal options from effluents in gold mining and metallurgical processes. Miner. Eng. 2013, 50–51, 13–29. [Google Scholar] [CrossRef]
- Gong, X.; Qi, S.; Lv, C.; Su, Q. Simulation of Organochlorine Pesticides Release Kinetics from Sediments of Honghu Lake. Res. Environ. Sci. Vol. 2010, 23, 1351–1354. [Google Scholar] [CrossRef]
- Tang, Y.; Shen, T.; Meng, Z. A kinetic study on the mechanisms of metal leaching from the top surface layer of copper aluminates and copper ferrites. Environ. Geochem. Health 2019, 41, 2491–2503. [Google Scholar] [CrossRef] [PubMed]
- Zhou, W.; Zhang, Y.; Li, W.; Jia, H.; Huang, H.; Li, B. Adsorption isotherms, degradation kinetics, and leaching behaviors of cyanogen and hydrogen cyanide in eight texturally different agricultural soils from China. Ecotoxicol. Environ. Saf. 2019, 185, 109704. [Google Scholar] [CrossRef] [PubMed]
- Boukobza, E.; Bar-Nes, G.; Ben-David, O.K.; Carmeli, B. Modeling of strontium leaching from carbonated Portland cement pastes using a simplified diffusion-kinetic analytical model. Appl. Geochem. 2018, 100, 258–267. [Google Scholar] [CrossRef]
- Özer, A.; Özer, D.; Ekiz, H.I. The Equilibrium and Kinetic Modelling of the Biosorption of Copper(II) Ions on Cladophora crispata. Adsorption 2005, 10, 317–326. [Google Scholar] [CrossRef]
- McLaughlan, R.G.; Al-Mashaqbeh, O. Simple models for the release kinetics of dissolved organic carbon from woody filtration media. Bioresour. Technol. 2009, 100, 2588–2593. [Google Scholar] [CrossRef]


Publisher’s Note: MDPI stays neutral with regard to jurisdictional claims in published maps and institutional affiliations. |
© 2022 by the authors. Licensee MDPI, Basel, Switzerland. This article is an open access article distributed under the terms and conditions of the Creative Commons Attribution (CC BY) license (https://creativecommons.org/licenses/by/4.0/).