Abstract
Numerous studies have focused on the mechanical properties of shale specimens to support hydraulic fracturing in shale gas engineering. However, the failure modes of shale specimens containing a pre-existing flaw are still not clear. A series of uniaxial compression tests were conducted on shale specimens containing a pre-existing flaw coupled with acoustic emission (AE) technology and a high-speed camera. A slow enough and variable loading speed scheme (0–50 kN: 0.1 kN/s, 50–100 kN: 0.05 kN/s; 100-failure: 0.02 kN/s) is adopted to allow microcracks to fully develop. The damage mechanism in the mesoscale from moment tensor inversion of the AE signals and the cracking behaviors on the macroscale were associated. Both the pre-existing flaw and the bedding layers had significant influences on the mechanical characteristics, progressive cracking, and failure modes of the shale specimens. The peak stress increases fluctuated as the bedding layer angle increases, and the maximum and minimum values take place at and , respectively. In addition, the pre-existing flaw, the bedding layers, and the compression stress field jointly control the failure modes of the shale specimens. It was found that the specimen failed due to tension splitting, the specimen failed due to tension splitting and shear across the matrix, the specimen failed due to shear across the shale matrix and shear along the bedding layers, and the specimen failed due to tension along the bedding layers and shear across the shale matrix. The study can provide some references to the construction of complex crack networks in shale gas engineering.
1. Introduction
In the past few decades, shale gas exploration has caught the attention of researchers worldwide. The development of horizontal drilling and hydraulic fracturing technology depends on the improved knowledge of the mechanical properties of shale [1]. Extensive studies have suggested that the shale has a strong anisotropy, as the bedding layers and their orientations significantly affect the mechanical properties of shale specimens [2,3,4]. Studying the failure properties and mechanisms are of great interest for geo-engineers that are associated with shale gas or underground space.
Traditionally, the deformation [5], strength [6], cracking process, and failure modes [7] are investigated with cylindrical intact shale specimens in compression tests. The bedding layer inclinations that are induced by the long-time sedimentation effect induce anisotropy [8,9,10], which is a necessary factor when studying the mechanical properties of shale. He et al. [11] studied the cracking patterns of shale when encountering hard grains at the micro-scale. Tien et al. [12] tested rock-like materials and recognized two kinds of failure modes: non-sliding failure along the discontinuities and sliding along the discontinuities. Wu et al. [13] suggested three types of failure crack morphologies in the uniaxial compression test, along the bedding layers, along the vertical axis, and coalescence between the bedding layers and the vertical axis. Via X-ray computer tomography (CT) analysis and post uniaxial compression tests, Wang et al. [14] found that the crack density was highest when the bedding layers were oriented horizontally, and the high-anisotropic cracking properties of shale samples were determined by the structure of the specimens. Duan et al. [15] further detected the progressive failure process of shale specimens via in situ CT technology. Hou et al. [16] pointed out that more cracks occurred in the specimens with vertical bedding layers rather than the specimens with horizontal bedding layers.
The abovementioned achievements help to improve the understanding of the mechanical properties of shale. Natural rock mass consists of flaws, such as holes, fissures, fault, etc. The brittle fracture in rock materials is believed to be significantly related to the cracks that are initiated from natural defects [17]. Since the 1960s, cracking initiation, propagation, and coalescence process in rock or transparent rock-like materials have been extensively investigated [18,19,20]. Wong and Einstein [21] systematically studied the cracking behavior of marble specimens with pre-existing flaws. The cracks tended to initiate from the pre-existing flaws and they were divided into three kinds of tensile cracking modes and three kinds of shear cracking modes. Based on this conclusion, Zhang and Wong [22] analyzed the stress field distribution around the pre-existing flaw, and they reported the incremental development process of cracks. These studies can provide significant references for studying the failure modes of flawed shale specimens. In recent years, some researchers have started to pay close attention to the mechanical properties of flawed shale. Lei et al. [10] studied the failure process of shale in three-point bending tests and estimated tensile or shear micro-damage with a numerical method. Han et al. [23] drilled a hole in a shale center, and the influences of the hole diameter on shale deformation and failure in uniaxial compression tests were studied. Morgan and Einstein [24] and Zhang et al. [25] tested the rock bridge coalescence behaviors in flaw pairs in Opalinus shale. However, the influences of pre-existing flaws superimposing bedding layers on rock cracking regularities and mechanisms are still not clear. To solve this problem, this research focuses on the combination of a special-angle pre-existing flaw (60°) and variable-angle bedding layer (from 0° to 90°). When the angle between the pre-existing flaw and the horizontal direction is 60°, the pre-existing flaw has the most severe effect on rock failure as the shear stress is biggest, which is the worst situation and so should be studied.
Acoustic emission (AE) technology was used to monitor rock cracking behaviors in real-time. Besides the widely used parameter-based analysis, the waveform-based analysis method, such as frequency spectrum analysis [26,27] and the moment tensor (MT) inversion method, are now gradually being focused on to further explain the failure mechanism of rock materials [28]. The MT inversion method was proposed in the 1990s [29,30] and developed for its dominance in source location, distinguishing microcrack types, and depicting the direction of crack motion. Graham et al. [31] tested granite in triaxial compression tests and pointed out that MT sources were distributed obliquely, indicating significant shear failure. Chang and Lee [32] further reported that shear cracks occupied up to approximately 60% of the total cracks in similar tests. Some researchers also devoted themselves to shale failure mechanism evaluation. For example, Chong et al. [33] established a discrete element-moment tensor model and conducted AE characteristics analysis It was concluded that the linear tensile cracks occupied the largest number for Brazilian tests, verifying the feasibility of MT inversion in shale. Zhai et al. [34] studied the failure modes of shale cylinders via the MT method, identifying matrix-tensile, matrix-shear, layer-tensile, and layer-shear failure modes, but the cracking process is not given. However, the progressive cracking history and failure mechanism is rarely studied via the MT method. Furthermore, more applications of the MT method in physical experiments are needed.
In this paper, a series of uniaxial compression tests were conducted on rectangular shale specimens to reveal the mechanical properties, progressive cracking behaviors, and mechanisms considering special-angle pre-exiting flaws and variable-angle bedding layers. The experimental acousto-optic-mechanical coupled system is constructed, in which AE is an acoustic method that can help with revealing the cracks activities and failure mechanisms on the mesoscale, and the high-speed camera can capture cracking behaviors optically on the macroscale. The progressive cracking and failure mechanism of shale specimens that are affected by bedding layers and a pre-existing flaw is first studied from the associated macroscale-mesoscale aspect.
2. Experiments Setup
2.1. Shale Specimen
The studied black shale comes from a shale gas enrichment region in Chongqing province, southwest China. Figure 1 shows the shale structure at the meter-scale, centimeter-scale, and micrometer-scale. The debris in Figure 1b comes from the specimen after the uniaxial compression test. Shale has a stratiform macroscopic structure due to the long-time sedimentation of minerals and clay. As shown in Figure 1c, natural flaws and bedding layers are inherent microscopic structures.
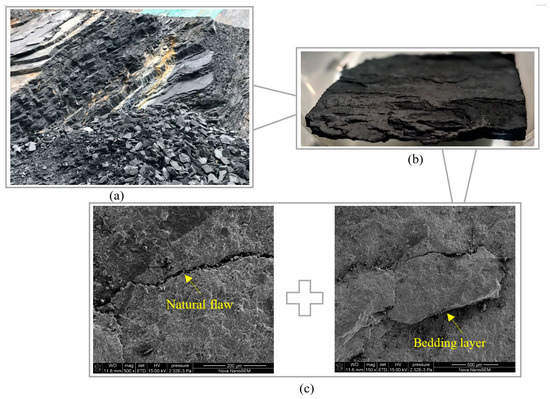
Figure 1.
Shale in the (a) meter-scale, (b) centimeter-scale, and (c) micrometer-scale.
The big-block shale outcrop was cut into small blocks and then polished into appropriate 78 mm × 32 mm × 152 mm rectangular specimens. The size of the specimens is shown in Figure 2. The angle between the bedding layers and the horizontal axis , , , and . An artificially prefabricated pre-existing flaw, , was created in the specimen center. The physical parameters are listed in Table 1.
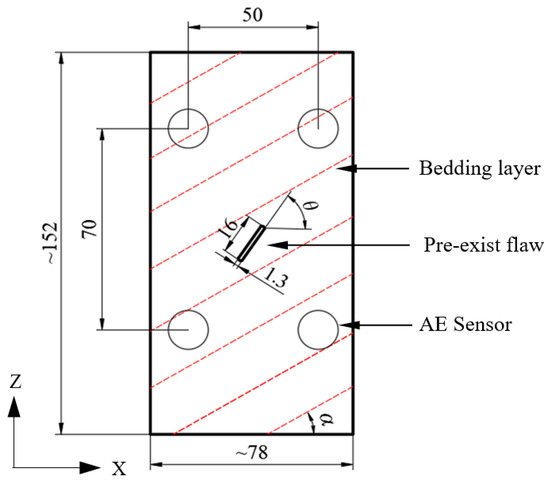
Figure 2.
Schematic diagram of the shale specimen (Unit: mm).

Table 1.
The physical and mechanical parameters of the shale specimens.
A speckle field is made by painting the specimen front surface and speckled with black dots so as to identify the strain field with digital image correlation (DIC). However, the evolution of the strain field is not focused on in this article, and the high-quality images that were captured from the high-speed camera are only used to demonstrate the cracking behaviors. Note that the locations of the AE sensors were protected and prevented from being painted to prevent any possible interference to the received AE signals.
2.2. Equipment
Figure 3 shows the acousto-optic-mechanical coupled testing system. An eight-channel AE monitor system from the Physical Acoustic Company was used. A total of eight wide-frequency WD sensors (response frequency range is 125 kHz–1000 kHz) were symmetrically arranged on the front and back surfaces, as shown in Figure 2. The signals from the AE sensors were amplified by 40 dB with preamplifiers. The threshold was set to 40 dB. A high-speed industrial high-speed camera with the resolution ratio of 2048 × 2048 pixels was synchronously adopted to monitor the real-time cracking of the shale specimens.
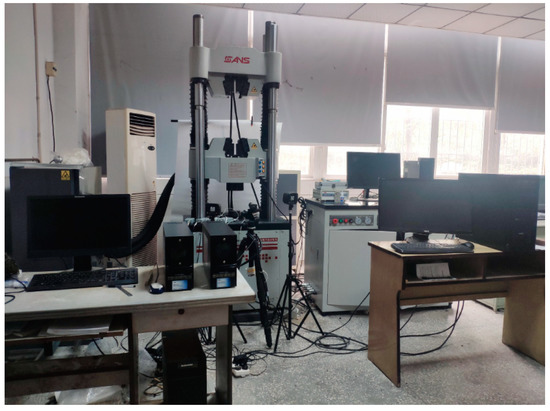
Figure 3.
Setting up of the testing system.
The slow loading speed, as shown in Table 2, provided sufficient time for crack nucleation and growth [35]. The slow loading speed and long loading time is a feature of the present study. Meanwhile, the speed of picture capture was variable at each loading stage due to the limited storage space. The fastest was 50 frames per second when the failure was oncoming, and the slowest was one frame every 2 s in the 0–50 kN loading period.
Table 2.
The loading speeds.
3. Test Results
Figure 4 shows the stress-strain curves of the tested specimens. The number “shale 0°-3” indicates the third shale specimen. The stress-strain curve of each specimen experiences similar evolution stages. When the stress is relatively low, the curve convexes downward due to natural holes and fissures being compressed. A linear stage is then observed as the stress increases and the specimen enters the linear-elastic stage. A sharp decrease occurs after reaching peak strength due to force-control loading. The evolution of peak stress is counted in Figure 5. The peak stress increases fluctuated as the angle increases. The maximum value appears at , while the minimum value appears at . This is highly related with the cracking behaviors that are shown in Figure 6.
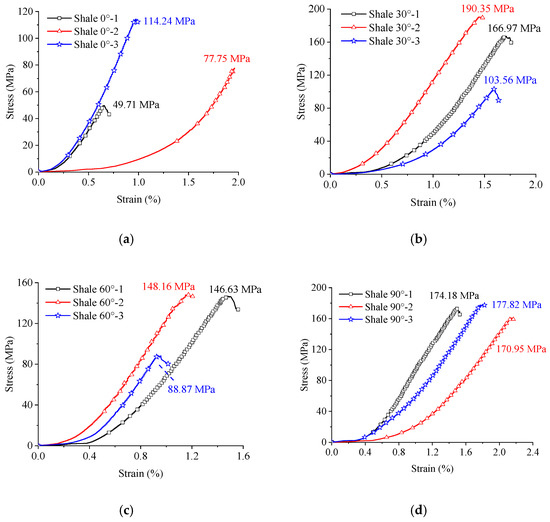
Figure 4.
Stress-strain curves of the flawed shale specimens: (a) , (b) , (c) , and (d) .
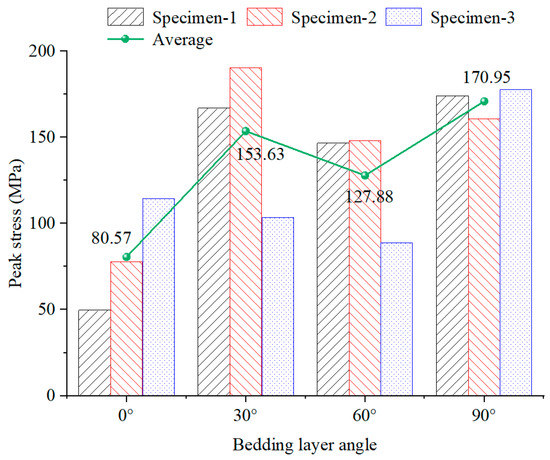
Figure 5.
Evolution of peak stress.
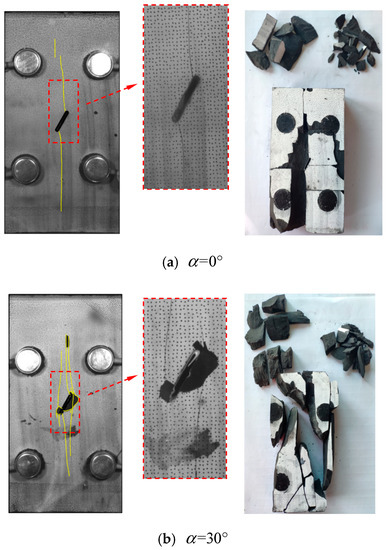
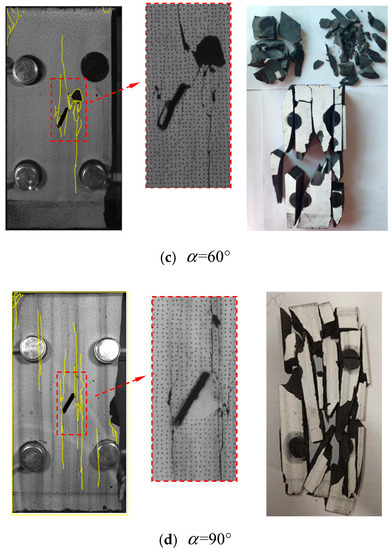
Figure 6.
Final distribution of cracks and broken fragments.
Figure 6 shows the cracking behaviors of the flawed shale specimens under the effect of different bedding layer inclinations. Increasing complexity is observed as the bedding layers gradually change from horizontal to vertical.
In Figure 6a, the number of cracks is the lowest when the bedding layers are horizontal. The wing cracks initiate from both tips of the pre-existing flaw, crossing the bedding layers in an approximate orthometric direction. The specimen finally breaks into several large blocks. When , multiple wing cracks and anti-wing cracks initiate from flaw tips, and they gradually change to the direction of the vertical compression stress during propagation. Surface local peeling around the flaw can be observed. The specimen finally breaks into large blocks, small blocks, and debris.
For the specimen in Figure 6c, apart from the wing cracks and anti-wing cracks that were observed around the pre-existing flaw, a long crack propagating parallel to the vertical compression direction was also observed. Small cracks branch from the main crack. Similar to the specimen, the specimen finally breaks into large blocks, small blocks, and debris. The number of cracks reaches a maximum value when , as shown in Figure 6d. Most of the cracks develop along the vertical bedding layers. The broken specimen mainly consists of slender blocks.
A bedding layer angle not only determines the cracking path, but also affects the crack number. The crack number increases and cracking becomes complex as increases. The crack numbers of and are obviously fewer than those of the and specimens. The minimum appears at as the cracks simply propagate and cut the bedding layers, while the maximum value appears at as multiple cracks concentrate in the center area.
The maximum axial strain values of the and specimens are larger than those of the and specimens [13]. For the and specimens, the normal stress component is greater than the shear stress component on the bedding layers, as indicated in Figure 4b. A larger normal stress component results in the holes and natural fractures being easily compressed, which may account for the large maximum axial strain of the and specimens. For and specimens, relatively small strain indicates that the shale specimens with large bedding layer angles are relatively difficult to compress. The work that is done by external force is converted into more fracture energy and few strain energy, making more cracks nucleation, initiation, and propagation. This is consistent with the phenomenon that the and specimens have more cracks and the distribution of the cracks is more complicated.
4. Evaluation of the Cracking Process
4.1. AE Energy
Knill et al. [36] described AE parameters, including amplitude, AE energy, and AE count in their study. AE energy can be determined by integrating the voltage record with time. Compared with the AE count, AE energy is more suitable for evaluating the magnitude of the activities of cracks due to its sensitivity to waveform amplitude and duration [37].
The cracking process of each shale specimen is roughly divided into three stages according to the evolution of AE energy, as shown in Figure 7. In Stage Ι, the microstructures, e.g., holes and natural cracks, are compressed, and the cumulative AE signals slightly increase. A sudden increase in the AE energy is observed at the end of Stage Ι, corresponding to the appearance of the first crack. In Stage Ⅱ, the microcracks initiate, propagate, and coalesce with each other, leading to the cumulative AE energy quickly increasing. Several sudden increases in the AE energy can occasionally be observed. In Stage Ⅲ, the cracks develop unstably, leading to a sharp increase in the cumulative AE energy. However, the situation of the specimen is slightly different. The three stages occupy nearly the same time periods, but the cumulative AE energy keeps increasing with similar rates in both Stages Ⅱ and Ⅲ, and the cracking behaviors are frequent in both Stages Ⅱ and Ⅲ, indicating severe cracking activities for the specimen.
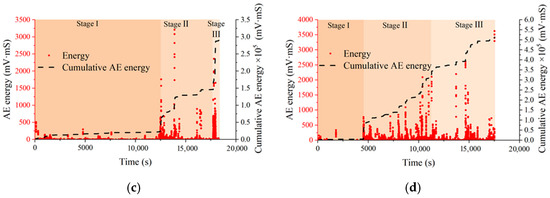
Figure 7.
AE energy and cumulative AE energy. (a) , (b) , (c) , and (d) .
The highest maximum cumulative AE energy occurs in the specimen, and the lowest value occurs in the specimen. However, Hou et al. [16] pointed out that the AE activities of the intact specimen are much more frequent than the intact specimen. The pre-existing flaw leads to the differences in the cracking behaviors, as well as AE activities.
4.2. MT Inversion
As the distribution of MT sources reflects the damage in the microscopic instead of macroscopic level [26], the term “microcrack” is used to distinguish the microdamage from the visible cracks.
4.2.1. Theory of MT
The MT inversion involves source location and identification of tensile and shear properties. Firstly, the microcrack source location is detected with the method of the Simplex algorithm [38].
where is the observed arrival time, i.e., the onset time of P wave decided by the Akaike information criterion (AIC) [39,40]. The AIC recognition process is shown in Figure 8, in which the blue line indicates the waveform and the red line indicates the AIC function curve. is the calculated arrival time, determined by the absolute time and the distance between the source and AE sensor:
where is the source coordinate and is the sensor coordinate. is wave velocity, and the wave velocities of shale specimens are listed in Table 1. We get the optimal source location when has a minimum value.
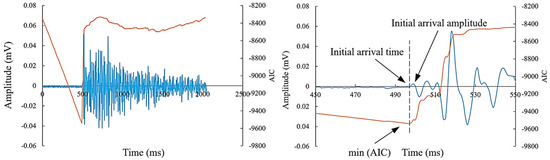
Figure 8.
Extraction of the initial arrival time and the initial arrival amplitude of the P wave.
Secondly, the simplified Green’s function for moment tensor analysis (SiGMA) method [24] is adopted to conduct MT inversion analysis.
where, is a calibration coefficient, is the amplitude of first motion, is the reflection coefficient between vector and the direction of the observation surface, is the distance between the microcrack source and AE sensor.
The MT is symmetric, six independent unknowns should be resolved. Thus at least first motions from six channels are required to determine the MT components.
As shown in Figure 9, the MT is always decomposed to identify the microcrack kinematics, including a compensated linear vector dipole (CLVD) part, a double-couple (DC) part, and an isotropic part (ISO) [41].
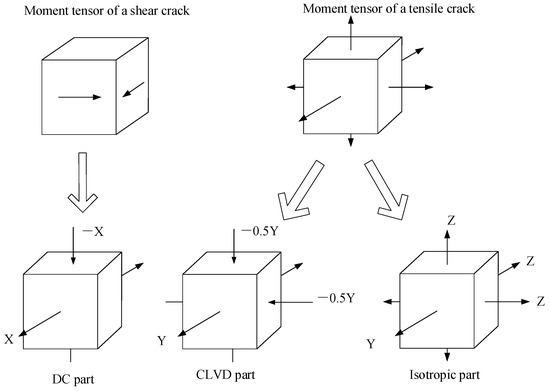
Figure 9.
Decomposition of eigenvalues into a DC part, CLVD part, and an ISO part.
Equation (4) represents the relative relationship among three normalized eigenvalues of MT, and parameters X, Y, and Z are shear ratio, deviatoric tensile ratio, and isotropic tensile ratio, respectively. Parameter X can represent the contribution of shear motion in a microcrack behavior. means a pure shear microcrack, while the . means a pure tensile microcrack. As indicated by Ohtsu [23], microcracks can be classed into tensile microcracks (), mixed microcracks (), and shear microcracks ().
4.2.2. MT Inversion Results
Figure 10 is a schematic diagram of microcrack element and motion direction of microcrack surfaces. Blue, red, and green elements indicate tensile, mixed, and shear microcracks, respectively.
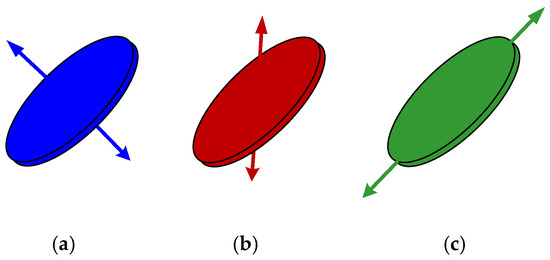
Figure 10.
(a) Tensile microcrack; (b) mixed microcrack; and (c) shear microcrack.
Figure 11 shows the (i) cracking processes from the high-speed camera, (ii) AE events location from MT inversion, and finally (iii) MT locating as a function of time.
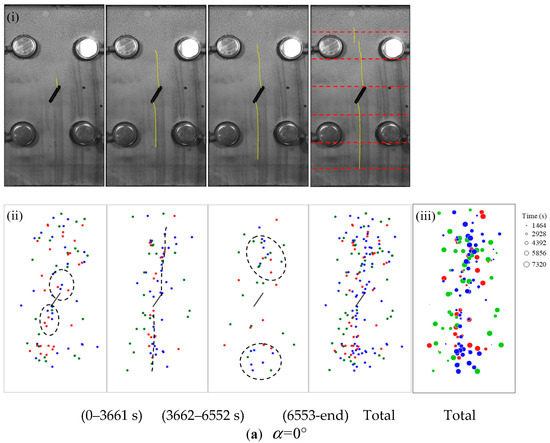
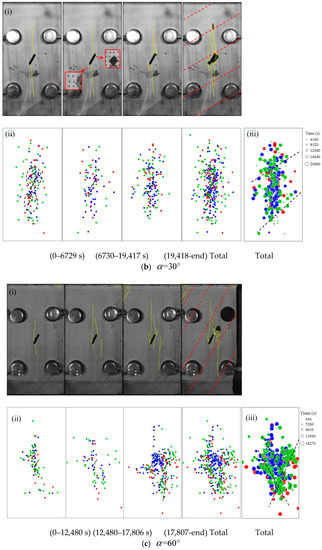
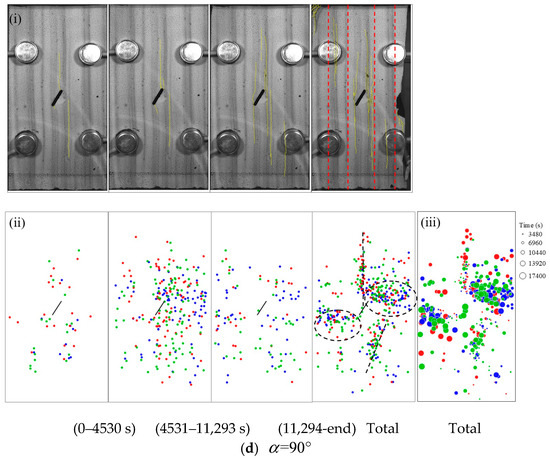
Figure 11.
Moment tensor inversion results. Red dashed lines indicate the direction of bedding layers. (a) , (b) , (c) , and (d) . In each subfigure, (i) the cracking process as captured by the CCD camera, (ii) distribution of MT as time advances, and (iii) distribution of MT whose size is the function of time. As indicated in Figure 10, tensile, mixed, and shear microcracks are each represented by blue, red, and green points.
The characteristics of the specimen are different from the other specimens due to its unique cracking process. In Figure 11a, the cracks initiate from the pre-existing flaw tips and then propagate towards the upper and lower ends of the specimen. In the 0–3661 s period, only a few microcracks are distributed around the pre-existing flaw tips, while the other microcracks have a scattered distribution. In the 3662–6552 s period, the tensile microcracks are distributed along the vertical direction, as indicated by the black dashed line, and the shear microcracks have a scattered distribution. In the 6553 s-end period, the number of the MT locations is less than that in the 0–3661 s and 3662–6552 s periods. What is more, most microcracks are not directly related to the flaw and they distributed far away. Finally, in Figure 11a(iii), larger points indicate the later appearance of the AE activities. Tensile microcracks contribute greatly to the macro-damage of the specimen. The wing cracks are remarkably widened and lengthened under the increasing uniaxial stress, and the tensile microcracks join into the wing cracks in this growing process. The tensile microcracks cut the horizontal bedding layers, speeding up their failure process. This is why the specimen has a low uniaxial compression strength as shown in Figure 4, and a relatively low total cumulative AE energy as shown in Figure 7. The pre-existing flaw significantly affects the cracking process of the flawed shale specimens under uniaxial compression stress.
Figure 11b shows the failure characteristics of the specimen. In the 0–6729 s period, a pair of wing cracks initiate from pre-existing flaw tips. Due to the MT inversion results in Figure 11b(ii), both tensile and shear microcracks developed in the zones around the tips of the pre-existing flaw. In the 6730–19,417 s period, local surface spalling is observed in the upper tip zone, and an anti-wing crack is observed from the lower tip. Although the macro-damage is not well-developed in this process, the MT locations have a scattered distribution, and the microcracks keep nucleating [25]. After 19,417 s, more secondary cracks initiate and propagate from the pre-existing cracks. For the specimen, tensile microcracks concentrate along the vertical loading direction in the specimen center. The shear microcracks distribute not only round the macro-damage, but also along the approximate 30°–60° direction to the horizontal direction.
Figure 11c shows the failure properties of the specimen. In the 0–12,480 s period, a wing crack and an anti-crack initiate from the flaw at the lower tip, and the wing crack propagates longer than the anti-wing crack. The anti-wing crack gradually closes in the later test. After 17,806 s, the MT inversion locations concentrate around the macro-damage. Both tensile and shear microcracks are abundant. In Figure 11c(iii), shear microcracks concentrated along the bedding layers and in the approximate 60° direction to the horizontal direction, as shown by the dashed lines. The shear microcracks seem to contribute greatly to the final failure of the specimen.
Figure 11d shows the time series of the cracking process of the specimen. A pair of wing cracks initiate from flaw tips as a result of stress concentration. The wing crack that is emitted from the upper tip develops longer than the one that is initiated from the lower tip. The MT inversion results show that most of the microcracks are concentrated in the local areas, as depicted by the dashed circles and dashed lines. However, in each loading period, the MT inversion locations have a scattered distribution, which is different from the other specimens. Tensile microcracks are more likely to occur in the vertical bedding layers compared with the other bedding layer orientations. The random tensile microcracks may account for the difference in the location characteristics between the specimen and the other specimens.
Figure 12 shows the time series of the shear ratio. For shear microcracks, the shear ratio () is minus 0.6. For tensile microcracks, the shear ratio () is minus 0.4. The mathematic operation aims at making the shear ratios of the shear/tensile microcracks distribute symmetrically around the time-axis. Figure 13 shows the statistical quantity ratio of the shear/mixed/tensile components in each specimen.
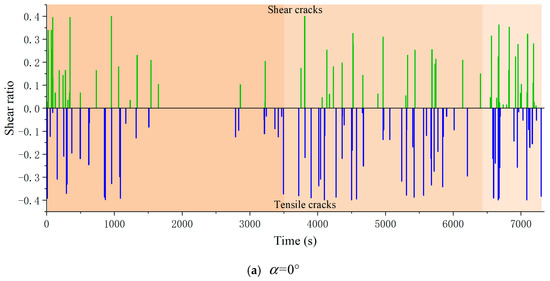
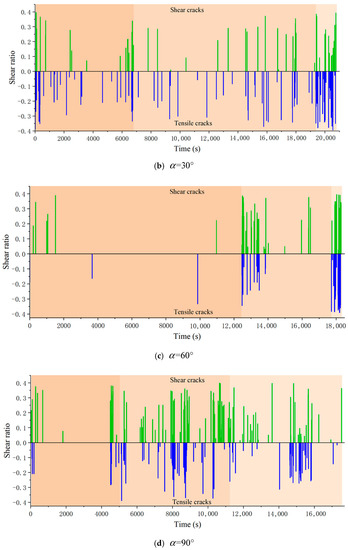
Figure 12.
The evolution of the shear ratio as a function of time for each specimen. (a) , (b) , (c) , and (d) .
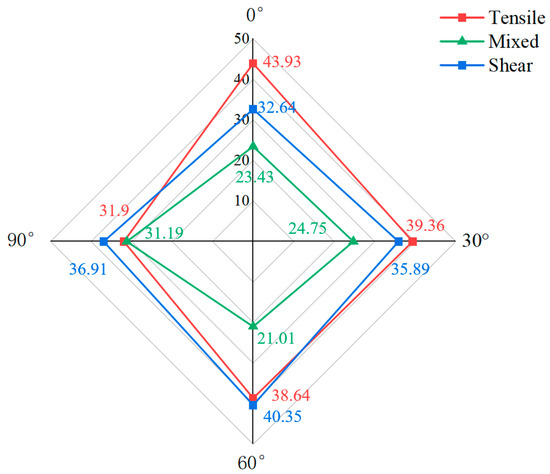
Figure 13.
Quantity ratio of tensile, mixed, and shear microcracks.
For rock material macroscopic cracking behaviors, a crack is always classified into either a tensile crack or shear crack by observing the morphologies [18,35]. However, the MT inversion results show that the tensile and shear microcracks are always concomitant in the shale specimens, meaning that a crack is composed of both tensile and shear microcracks [29].
As the bedding layers orientate from the horizontal to vertical direction, the quantity ratio of tensile microcracks declines and the quantity ratio of shear microcracks increases in fluctuation. For the specimen, the tensile microcracks occupy 42.93% and the shear microcracks occupy 32.64%. The specimen fails in a tensile manner when the cracks are propagating and cutting the horizontal bedding layers. For the specimen, the tensile microcracks occupy 39.36% and the shear microcracks occupy 35.89%. The failure of the specimen is controlled by the tension splitting and shear across the shale matrix. For the specimen, the tensile microcracks occupy 38.64% and the shear microcracks occupy 40.35%. Shear across the matrix and along the bedding layer is the main failure mode. For the specimen, the tensile microcracks occupy 31.90% and the shear microcracks occupy 36.91%. Tension along the bedding layers and shear across matrix occur in the specimen. When the two opposite surfaces of the crack become further apart under the increasing uniaxial stress, the separated columns are subjected to uniaxial stress and shear microcracks occur in the shale matrix.
5. Discussion
Compared with intact shale specimens, the cracking process and failure mechanism of the flawed shale specimens are quite different. The failure morphology and failure modes of the intact cylindrical shale specimens [14] and the flawed shale specimens are compared in Table 3.
Table 3.
Sketch of crack distribution and failure modes of the intact (Wang et al. [14]) and flawed shale specimens.
The number and distribution of cracks are quite different for these two kinds of shale specimens, especially for the specimen. Failure of the intact specimen is dominated by tensile failure across the matrix and shear sliding along the bedding layers, and the failure is most severe. It has the highest crack density and uniaxial compression strength compared with other bedding layer orientations. The morphology of the cracks is much more complicated than the flawed specimen, whose failure is controlled by the tensile failure across the bedding layers. The cracking behavior of shale specimens with horizontal bedding layers is greatly controlled by pre-existing flaws.
Shear crossing along the bedding layers is observed for the intact shale specimen, and the quantity and crack density is the second highest. However, under the effect of a pre-existing flaw, tension splitting and shear across the matrix occur to the shale specimen. Compared with the intact shale specimen, the quantity of main cracks in the central zone is much lower in the flawed specimen.
In the intact shale specimen, the specimen has the lowest crack density. However, the quantity of cracks in the and flawed specimens are almost equivalent, reaching a high value. Shear sliding occurs in the intact specimen. The crack morphology and MT inversion indicate that shear crossing the matrix and shear along the bedding layers occur in the flawed specimen.
Multiple parallel cracks are observed in the intact and flawed shale specimens, indicating that the vertical bedding layers, instead of the flaw, have a controlling effect on the failure mode of the shale specimen with vertical bedding layers. Combined with the 36.91% proportion of shear microcracks due to MT inversion, the failure mode of the shale specimen can be recognized as tension along the bedding layers and shear across matrix.
Three factors, including the stress concentration effect around the pre-existing flaw, the weak bedding layers, and the uniaxial compression stress, jointly influence shale specimens failure mode. The microcracks compete with each other to initiate and propagate under the balance of these three factors. As a kind of sedimentary rock, the effects of bedding layers on the cracking behaviors and failure modes should not be ignored. However, the pre-existing flaw predominantly affects the failure mode of the flawed shale specimen.
6. Conclusions
The cracking behaviors and failure modes of shale specimens containing a pre-existing flaw were studied in a series of uniaxial compression tests. The associated macroscale-mesoscale failure properties that were affected by different bedding layer inclinations were investigated. The research work supports the following conclusions.
The failure properties of shale specimens containing a pre-existing flaw were significantly different from the intact shale specimens. The uniaxial compression strength decreases as the bedding layers incline from the vertical to the horizontal direction. The evolution regularities of the uniaxial compression strength were decided by the failure modes. There were three factors, including the stress concentration effect around the pre-existing flaw, the weak bedding layers, and the uniaxial compression stress, that jointly control the failure mode of the shale specimens.
For the flawed shale specimen, the number of cracks was at a minimum and the failure was simple with a pair of wing-cracks that cut the orthometric bedding layers during propagation, and the shale specimen failed due to tensile splitting. The pre-existing flaw decided the lifetime of the shale specimen. The failures of and specimens were complicated as they were controlled by both the pre-existing flaw and the bedding layers. Tension splitting and shear across the matrix occurred to the shale specimen. The specimen failed mainly due to shear across the shale matrix and shear along the bedding layers. When , the cracks initiated from the pre-existing flaw and propagated along the vertical direction. Tension along the bedding layers and shear in the shale matrix contributed to the failure of the specimen.
The MT inversion method is an effective method for revealing the mesoscopic mechanical mechanism of shale specimen. The tensile and shear microcracks coexisted in the uniaxial compression tests. The quantity ratio of the tensile microcracks decreased while that of the shear microcracks increased in fluctuation as the angle increased. Both tensile microcracks and shear microcracks occupied approximately 30%–50% of all shale specimens. The competition and balance of tensile and shear microcracks contributed to the final failure of rock specimens.
Author Contributions
Conceptualization, investigation, supervision, writing—original draft, funding acquisition, Y.B.; Funding acquisition, project administration, Q.X.; formal analysis, validation, J.D.; Investigation, writing—review and editing, X.F. All authors have read and agreed to the published version of the manuscript.
Funding
The authors acknowledge the financial support of the Fund of Chongqing Key Laboratory of Geomechanics & Geoenvironment Protection (LQYTKFJJ2020002) and project (52209122) from National Natural Science Foundation of China.
Conflicts of Interest
The authors declare no conflict of interest.
References
- Zhang, C.; Dong, D.; Wang, Y.; Guan, Q. Brittleness evaluation of the Upper Ordovician Wufeng–Lower Silurian Longmaxi shale in Southern Sichuan Basin, China. Energy Explor. Exploit. 2017, 35, 430–443. [Google Scholar] [CrossRef]
- Wang, H.; Shi, Z.; Sun, S. Biostratigraphy and reservoir characteristics of the Ordovician Wufeng Formation—Silurian Longmaxi Formation shale in the Sichuan Basin and its surrounding areas, China. Pet. Explor. Dev. 2021, 48, 1019–1032. [Google Scholar] [CrossRef]
- Li, Y.; Xue, L.; Wu, X. Study on acoustic emission and X-ray computed-tomography characteristics of shale samples under uniaxial compres-sion tests. Environ. Earth Sci. 2019, 78, 173. [Google Scholar] [CrossRef]
- Rybacki, E.; Reinicke, A.; Meier, T.; Makasi, M.; Dresen, G. What controls the mechanical properties of shale rocks?—Part I: Strength and Young’s modulus. J. Pet. Sci. Eng. 2015, 135, 702–722. [Google Scholar] [CrossRef]
- Jin, Z.; Li, W.; Jin, C.; Hambleton, J.; Cusatis, G. Anisotropic elastic, strength, and fracture properties of Marcellus shale. Int. J. Rock Mech. Min. Sci. 2018, 109, 124–137. [Google Scholar] [CrossRef]
- Kim, K.Y.; Zhuang, L.; Yang, H.; Kim, H.; Min, K. Strength Anisotropy of Berea sandstone: Results of X-Ray computed tomography, compression tests, and discrete modeling. Rock Mech. Rock Eng. 2016, 49, 1201–1210. [Google Scholar] [CrossRef]
- Khanlari, G.; Rafiei, B.; Abdilor, Y. An Experimental Investigation of the Brazilian Tensile Strength and Failure Patterns of Laminated Sandstones. Rock Mech. Rock Eng. 2015, 48, 843–852. [Google Scholar] [CrossRef]
- Liu, C.; Yin, G.; Li, M.; Deng, B.; Song, Z.; Liu, Y.; Yin, S. Shale permeability model considering bedding effect under true triaxial stress conditions. J. Nat. Gas Sci. Eng. 2019, 68, 102908. [Google Scholar] [CrossRef]
- Wang, Y.; Li, H.; Mitra, A.; Han, D.; Long, T. Anisotropic strength and failure behaviors of transversely isotropic shales: An experimental investigation. Interpretation 2020, 8, L59–L70. [Google Scholar] [CrossRef]
- Lei, B.; Zuo, J.; Liu, H.; Wang, J.; Xu, F.; Li, H. Experimental and numerical investigation on shale fracture behavior with different bedding properties. Eng. Fract. Mech. 2021, 247, 107639. [Google Scholar] [CrossRef]
- He, J.; Li, X.; Yin, C.; Zhang, Y.; Lin, C. Propagation and characterization of the micro cracks induced by hydraulic fracturing in shale. Energy 2020, 191, 116449. [Google Scholar] [CrossRef]
- Tien, Y.M.; Kuo, M.C.; Juang, C.H. An experimental investigation of the failure mechanism of simulated transversely isotropic rocks. Int. J. Rock Mech. Min. Sci. 2006, 43, 1163–1181. [Google Scholar] [CrossRef]
- Wu, Y.; Li, X.; He, J.; Zheng, B. Mechanical Properties of Longmaxi Black Organic-Rich Shale Samples from South China under Uniaxial and Triaxial Compression States. Energies 2016, 9, 1088. [Google Scholar] [CrossRef]
- Wang, Y.; Li, C.H.; Hu, Y.Z. Experimental investigation on the fracture behavior of black shale by acoustic emission monitoring and CT image anal-ysis during uniaxial compression. Geophys. J. Int. 2018, 213, 660–675. [Google Scholar] [CrossRef]
- Duan, Y.; Feng, X.; Li, X.; Yang, B. Mesoscopic damage mechanism and a constitutive model of shale using In-Situ X-ray CT device. Eng. Fract. Mech. 2022, 269, 108576. [Google Scholar] [CrossRef]
- Hou, P.; Gao, F.; Yang, Y.; Zhang, X.; Zhang, Z. Effect of the layer orientation on mechanics and energy evolution characteristics of shales under uniaxial loading. Int. J. Min. Sci. Technol. 2016, 26, 857–862. [Google Scholar] [CrossRef]
- Wang, H.; Dyskin, A.; Pasternak, E. Comparative analysis of mechanisms of 3-D brittle crack growth in compression. Eng. Fract. Mech. 2019, 220, 106656. [Google Scholar] [CrossRef]
- Morgan, S.P.; Johnson, C.A.; Einstein, H.H. Cracking processes in Barre granite: Fracture process zones and crack coalescence. Int. J. Fract. 2013, 180, 177–204. [Google Scholar] [CrossRef]
- Park, C.H.; Bobet, A. Crack initiation, propagation and coalescence from frictional flaws in uniaxial compression. Eng. Fract. Mech. 2010, 77, 2727–2748. [Google Scholar] [CrossRef]
- Zhang, T.; Zhou, X.; Qian, Q. Drucker-Prager plasticity model in the framework of OSB-PD theory with shear deformation. Eng. Comput. 2021. [Google Scholar] [CrossRef]
- Wong, L.N.Y.; Einstein, H.H. Systematic evaluation of cracking behavior in specimens containing single flaws under uniaxial compression. Int. J. Rock Mech. Min. Sci. 2009, 46, 239–249. [Google Scholar] [CrossRef]
- Zhang, X.P.; Wong, L.N.Y. Cracking processes in rock-like material containing a single flaw under uniaxial compression: A numerical study based on parallel bonded-particle model approach. Rock Mech. Rock Eng. 2011, 45, 711–737. [Google Scholar] [CrossRef]
- Han, G.; Liang, Q.; Bao, R.; Zhou, Y. Influence of Circular Hole Diameter on Deformation and Failure of Longmaxi Shale. Geotech. Geol. Eng. 2022, 40, 2605–2613. [Google Scholar] [CrossRef]
- Morgan, S.P.; Einstein, H.H. Cracking processes affected by bedding planes in Opalinus shale with flaw pairs. Eng. Fract. Mech. 2017, 176, 213–234. [Google Scholar] [CrossRef]
- Zhang, X.; Li, X.; Liu, Y.; Liu, W.; Li, Q.; Li, L. Experimental study on crack propagation and failure mode of fissured shale under uniaxial compression. Theor. Appl. Fract. Mech. 2022, 121, 103512. [Google Scholar] [CrossRef]
- Li, L.R.; Deng, J.H.; Zheng, L.; Liu, J.F. Dominant frequency characteristics of acoustic emissions in white marble during direct tensile tests. Rock Mech. Rock Eng. 2017, 50, 1337–1346. [Google Scholar] [CrossRef]
- Ban, Y.; Fu, X.; Xie, Q. Revealing the laminar shale microdamage mechanism considering the relationship between fracture geometrical mor-phology and acoustic emission power spectrum characteristics. Bull. Eng. Geol. Environ. 2020, 79, 1083–1096. [Google Scholar] [CrossRef]
- Hu, G.; Yang, T.; Zhou, J.; Yu, Q.; Xie, L.; Liu, H.; Zhao, Y. Mechanism of surrounding rock failure and crack evolution rules in branched pillar recovery. Minerals 2017, 7, 96. [Google Scholar] [CrossRef]
- Ohtsu, M. Acoustic Emission Theory for Moment Tensor Analysis. J. Res. Nondestruct. Eval. 1995, 6, 169–184. [Google Scholar] [CrossRef]
- Ohtsu, M. Post-analysis of SiGMA code for acoustic emission moment tensor analysis. NDT E Int. 1999, 32, 243–244. [Google Scholar]
- Graham, C.C.; Stanchits, S.; Main, I.G.; Dresen, G. Comparison of polarity and moment tensor inversion methods for source analysis of acoustic emission data. Int. J. Rock Mech. Min. Sci. 2010, 47, 161–169. [Google Scholar] [CrossRef]
- Chang, S.H.; Lee, C.I. Estimation of cracking and damage mechanisms in rock under triaxial compression by moment tensor analysis of acoustic emission. Int. J. Rock Mech. Min. Sci. 2004, 41, 1069–1086. [Google Scholar] [CrossRef]
- Chong, Z.; Li, X.; Hou, P.; Chen, X.; Wu, Y. Moment tensor analysis of transversely isotropic shale based on the discrete element method. Int. J. Min. Sci. Technol. 2017, 27, 507–515. [Google Scholar] [CrossRef]
- Zhai, M.; Xue, L.; Bu, F.; Yang, B.; Huang, X.; Liang, N.; Ding, H. Effects of bedding planes on progressive failure of shales under uniaxial compression: Insights from acoustic emission characteristics. Theor. Appl. Fract. Mech. 2022, 119, 103343. [Google Scholar] [CrossRef]
- Wong, L.N.Y.; Xiong, Q. A method for multiscale interpretation of fracture processes in Carrara marble specimen containing a single flaw under uniaxial compression. J. Geophys. Res. Solid Earth 2018, 123, 6459–6490. [Google Scholar] [CrossRef]
- Knill, J.; Franklin, J.; Malone, A. A study of acoustic emission from stressed rock. Int. J. Rock Mech. Min. Sci. 1968, 5, 87–121. [Google Scholar] [CrossRef]
- Wang, C.; Bao, T.; Lu, H.; Liu, L.; Lu, Z.; Li, W.; Yu, Q. Variation regulation of the acoustic emission energy parameter during the failure process of granite under uniaxial compression. Mater. Test. 2015, 52, 755–761. [Google Scholar] [CrossRef]
- Prugger, A.F.; Gendzwill, D.J. Microearthquake location: A nonlinear approach that makes use of a simplex stepping procedure. Bull. Seismol. Soc. Am. 1988, 78, 799–815. [Google Scholar] [CrossRef]
- Akaike, H. Markovian representation of stochastic processes and its application to the analysis of autoregressive moving average process. Ann. Inst. Stat. Math. 1974, 26, 363–387. [Google Scholar] [CrossRef]
- Lei, X.; Kusunose, K.; Rao, M.V.M.S.; Nishizawa, O.; Satoh, T. Quasi-static fault growth and cracking in homogeneous brittle rock under triaxial compression using acoustic emission monitoring. J. Geophys. Res. Solid Earth 2000, 105, 6127–6139. [Google Scholar] [CrossRef]
- Yang, S.; Jing, H. Strength failure and crack coalescence behavior of brittle sandstone samples containing a single fissure under uniaxial compression. Int. J. Fract. 2011, 168, 227–250. [Google Scholar] [CrossRef]


Publisher’s Note: MDPI stays neutral with regard to jurisdictional claims in published maps and institutional affiliations. |
© 2022 by the authors. Licensee MDPI, Basel, Switzerland. This article is an open access article distributed under the terms and conditions of the Creative Commons Attribution (CC BY) license (https://creativecommons.org/licenses/by/4.0/).