Article

Effects of Alkanolamine Absorbents in Integrated Absorption–Mineralization

by
Chanakarn Thamsiriprideeporn
* and
Suekane Tetsuya
Department of Mechanical Engineering, School of Energy Science and Technology, Tokyo Institute of Technology, 2 Chome-12-1 Ookayama, Meguro City, Tokyo 152-8550, Japan
*
Author to whom correspondence should be addressed.
Minerals 2022, 12(11), 1386; https://doi.org/10.3390/min12111386
Submission received: 26 September 2022 / Revised: 16 October 2022 / Accepted: 28 October 2022 / Published: 30 October 2022

Abstract

:
Integrated absorption–mineralization (IAM) involves the transformation of CO2 in a chemical-based solution with brine used as the absorbent to form insoluble carbonates and is promising for carbon capture, utilization, and storage. Various types of absorbents such as monoethanolamine (MEA), diethanolamine (DEA), triethanolamine (TEA), and aminomethyl propanol (AMP) were examined in multicycle integrated absorption–mineralization (multicycle IAM) involving absorption, precipitation, and regeneration steps between 20 °C and 25 °C at atmospheric pressure in order to reveal their performance in terms of CO2 absorption and conversion and absorbent degradation. We found that 5 wt.% AMP offered 89.5% CO2 absorption capacity per unit of absorbent converted into the amount of solid carbonate within 4 cycles. In addition, it was moderately degraded by 64.02% during the first cycle and then reduced from 30% to 10% in the next cycle (>2 cycles). In comparison with MEA, which was used as the initial absorbent, AMP provided a fivefold increase in the speed of multicycle IAM.

1. Introduction

Around 11,000 global-climate-related disasters resulted in over 475,000 deaths and 77% of total economic losses, USD 2.5 trillion, for 160 countries in the previous two decades [1,2]. As the negative consequences of the climate crisis have been widely expanded, the decarbonization has received significant emphasis [3,4]. Carbon dioxide (CO2) emissions are recognized as a major cause of the climate crisis, and those emissions significantly increased in 2021, reaching 36.4 billion metric tons [5,6,7].
Negative emission technologies have been proposed to remove CO2 emissions from industrial and power plants, which is a sustainable technology to long-term reduce and store CO2. Carbon capture, utilization, and storage (CCUS) is one of the promising techniques that can be deployed to continue commercial feasibility. By capturing CO2 in specified storage facilities, CCUS technology ensures harmful emissions are prohibited from being released into the atmosphere, including economic benefits accrued by applying CO2 [8,9,10,11]. According to CO2 capture, various technologies such as physical and chemical absorption, adsorption, and membrane have been developed and supported for the postcombustion capture process [12]. Utilization and storage of CO2 have been demonstrated for extensive applications, both nonconversion and conversion use, approximately 230 metric tons per year [13]. CO2-based building material is one of the pathways for CO2 utilization and storage, which requires low-energy intensity compared with fuel and chemical conversions [8]. As CO2 reacts with minerals or waste products, such as iron slag, to form insoluble carbonates, CO2 gases might be permanently stored and supplied as a feedstock [14,15,16].
There are two representative approaches to convert CO2 into carbonate: direct and indirect [17]. In the direct approach, supercritical CO2 is injected and reacted with Ca–Mg–Fe-rich rock containing metal oxide (such as CaO), resulting in the formation of carbonates. It has the advantage of trapping CO2 at temperatures above 600 °C [12,18]. However, this operation possesses certain shortcomings, such as large amounts of heat and pressure consumption to activate the reactivity of carbonation. To reduce the activation energy, an indirect approach as an aqueous technique is proposed. CO2 absorption in the indirect approach involves transforming the phase of CO2. CO2 through its ionic form (CO23− or HCO3) spontaneously reacts with metal ions (such as Ca2+) then precipitates to form carbonates [17]. Furthermore, cost estimation of CO2 absorption in aqueous alkanolamine consumes USD 62–80 per ton of CO2 [19,20], whereas direct CO2 capture consumes USD 125–335 per ton of CO2 [21].
Integrated absorption–mineralization (IAM) [22] refers to the process of desorbing and mineralizing CO2 captured by aqueous alkanolamine solvents, which has been developed to mitigate the cost of CO2 removal, low carbonate utilization, and environmental concerns in the long term. To minimize the intense energy requirement and improve CO2 capture efficiency, the absorbent absorbs CO2 from the atmosphere and carries it to mineralize through three processes—absorption, precipitation, and regeneration. Moreover, IAM processes were further developed by repeating those processes to maximize the usage of recycled absorbents and improve the formation of carbonates, despite gradual absorbent degradation during IAM cycles [22,23]. Thus, multicycle integrated CO2 absorption–mineralization (multicycle IAM) applies to the reproducible process of absorption, precipitation, and regeneration by reusing the absorbent multiple times [24].
The mineral supplement for mineralizing CO2 absorption comes from industrial brine waste, for instance, byproducts of oil refineries, power plants, textile and leather processing, desalination, and mining. The brine waste is composed of exceedingly intense concentrations of metal ions such as Na+, Ca2+, and Mg2+ ions, including various contaminants. Instead of treatment, these brine wastes are applied in precipitation to form carbonates [17,24]. The general separation technology and membrane spent USD 0.75–2.5 million and USD 1–1.5 million for 100 gallons per minute, respectively [25,26]. The multicycle IAM can offer high productivity without disrupting or reorganizing the current processes in manufacturing systems.
The conventional absorbent used in the industrial CO2 removal technology is an amine-based solution because of its CO2 capture capacity and ease of modification. Alkanolamine-based absorbents contain two functional groups: (a) the amino group (RNH2, RNH, and RN; R is the alkyl group), which is involved in CO2 capture; and (b) the hydroxyl group (OH), which offers solubility in an aqueous solution. Alkanolamine absorbents can be classified into primary, secondary, tertiary, and steric hindrance amines [27,28].
Monoethanolamine (MEA), a primary amine, is commonly used for gas scrubbing on an industrial scale because it has high CO2 capture performance and reasonable cost [28,29]. Furthermore, aqueous MEA solution was used as in multicycle IAM, and the preliminary results suggested that the regenerated MEA could be efficiently recycled in the gas scrubber without the treatment process and that it increased CO2 absorption and conversion [24]. Even though the MEA absorbent was suitable for CO2 removal, its high energy consumption and erosiveness have raised environmental concerns [30]. In addition, the oxidative and thermal degradation of MEA obstructed its CO2 capture performance [31].
To minimize the disadvantages of MEA, alternative alkanolamine-based absorbents were examined. For instance, diethanolamine (DEA) and triethanolamine (TEA) as secondary and tertiary amines are ethanolamide derivatives obtained from MEA production. In addition, aminomethyl propanol (AMP) as a steric hindrance amine involves the combination of primary and secondary amine structures in the amino group.
Therefore, the absorbent type is a significant factor that can explain why these absorbents suit multicycle IAM. In this study, various aqueous alkanolamine absorbents such as MEA, DEA, TEA, and AMP were used in multicycle IAM, and their ability to transform CO2 gases into insoluble carbonates has been investigated in conjunction with the absorbent properties.
Multicycle IAM starts with the absorption of CO2 emissions through the aqueous alkanolamine absorbent. The primary (RNH2), secondary (RNH), and steric hindrance (RNH2) amines are able to form both carbamate and bicarbonate ions. Those amines directly react with CO2 gases in the zwitterion mechanism (RNHCOO), generating bicarbonate ions (HCO3) and protonated amine (RNH3+), as shown in Equations (1) and (2) [32,33].
CO 2 + RNH 2 RNHCOO + RNH 3 +
CO 2 + RNHCOO + 2 H 2 O 2 HCO 3 + RNH 3 +
According to a specific structure of steric hindrance amine, the large volume of alkyl groups constrained its structure in spins. The unstable carbamate and hydrolysis are easily transformed into the products, resulting in higher capture performance. On the other hand, CO2 gases dissolute in tertiary amine (NH) and form only a bicarbonate ion and protonated amine because its chemical structure misses the N–H bond, as shown in Equation (3) [33]. Furthermore, the carbamate generation pathway provides a higher heat of formation than bicarbonate generation [34].
CO 2 + RN + H 2 O HCO 3 + RNH 3 +
Then, in the precipitation process, the bicarbonate ion and protonated amine from the carbamate and bicarbonate formations react with metal ions (Ca2+ and Mg2+ ions) contained in the solution [35] to produce insoluble carbonates (Equations (4) and (5)) [36,37], as follows:
HCO 3 + 2 RNH 3 + + CaCl 2 2 RNH 3 Cl + CaCO 3
HCO 3 + 2 RNH 3 + + MgCl 2 2 RNH 3 Cl + MgCO 3
Furthermore, the precipitation process is performed twice to enhance carbonate production. At the end of a cycle, in the regeneration process, the used alkanolamine absorbent is prepared to absorb CO2 emissions in the next cycle by injecting a nonreactive gas (N2) to regenerate the absorbent without internal changes [38]. The regenerated absorbent is repeatedly used through multicycle IAM until it is no longer used.
In this research, the characteristics of absorption and conversion were examined using aqueous alkanolamine-based absorbents such as MEA, DEA, TEA, and AMP through the multicycle integrated CO2 absorption–mineralization (multicycle IAM). Parameters such as CO2 absorption capacity and rate, CO2 conversion, absorbent degradation, and optimal operation time were considered. The production of carbonates can be sufficient in several industries such as construction (building material), textile, plastic, paint, and agriculture [39].

2. Materials and Methods
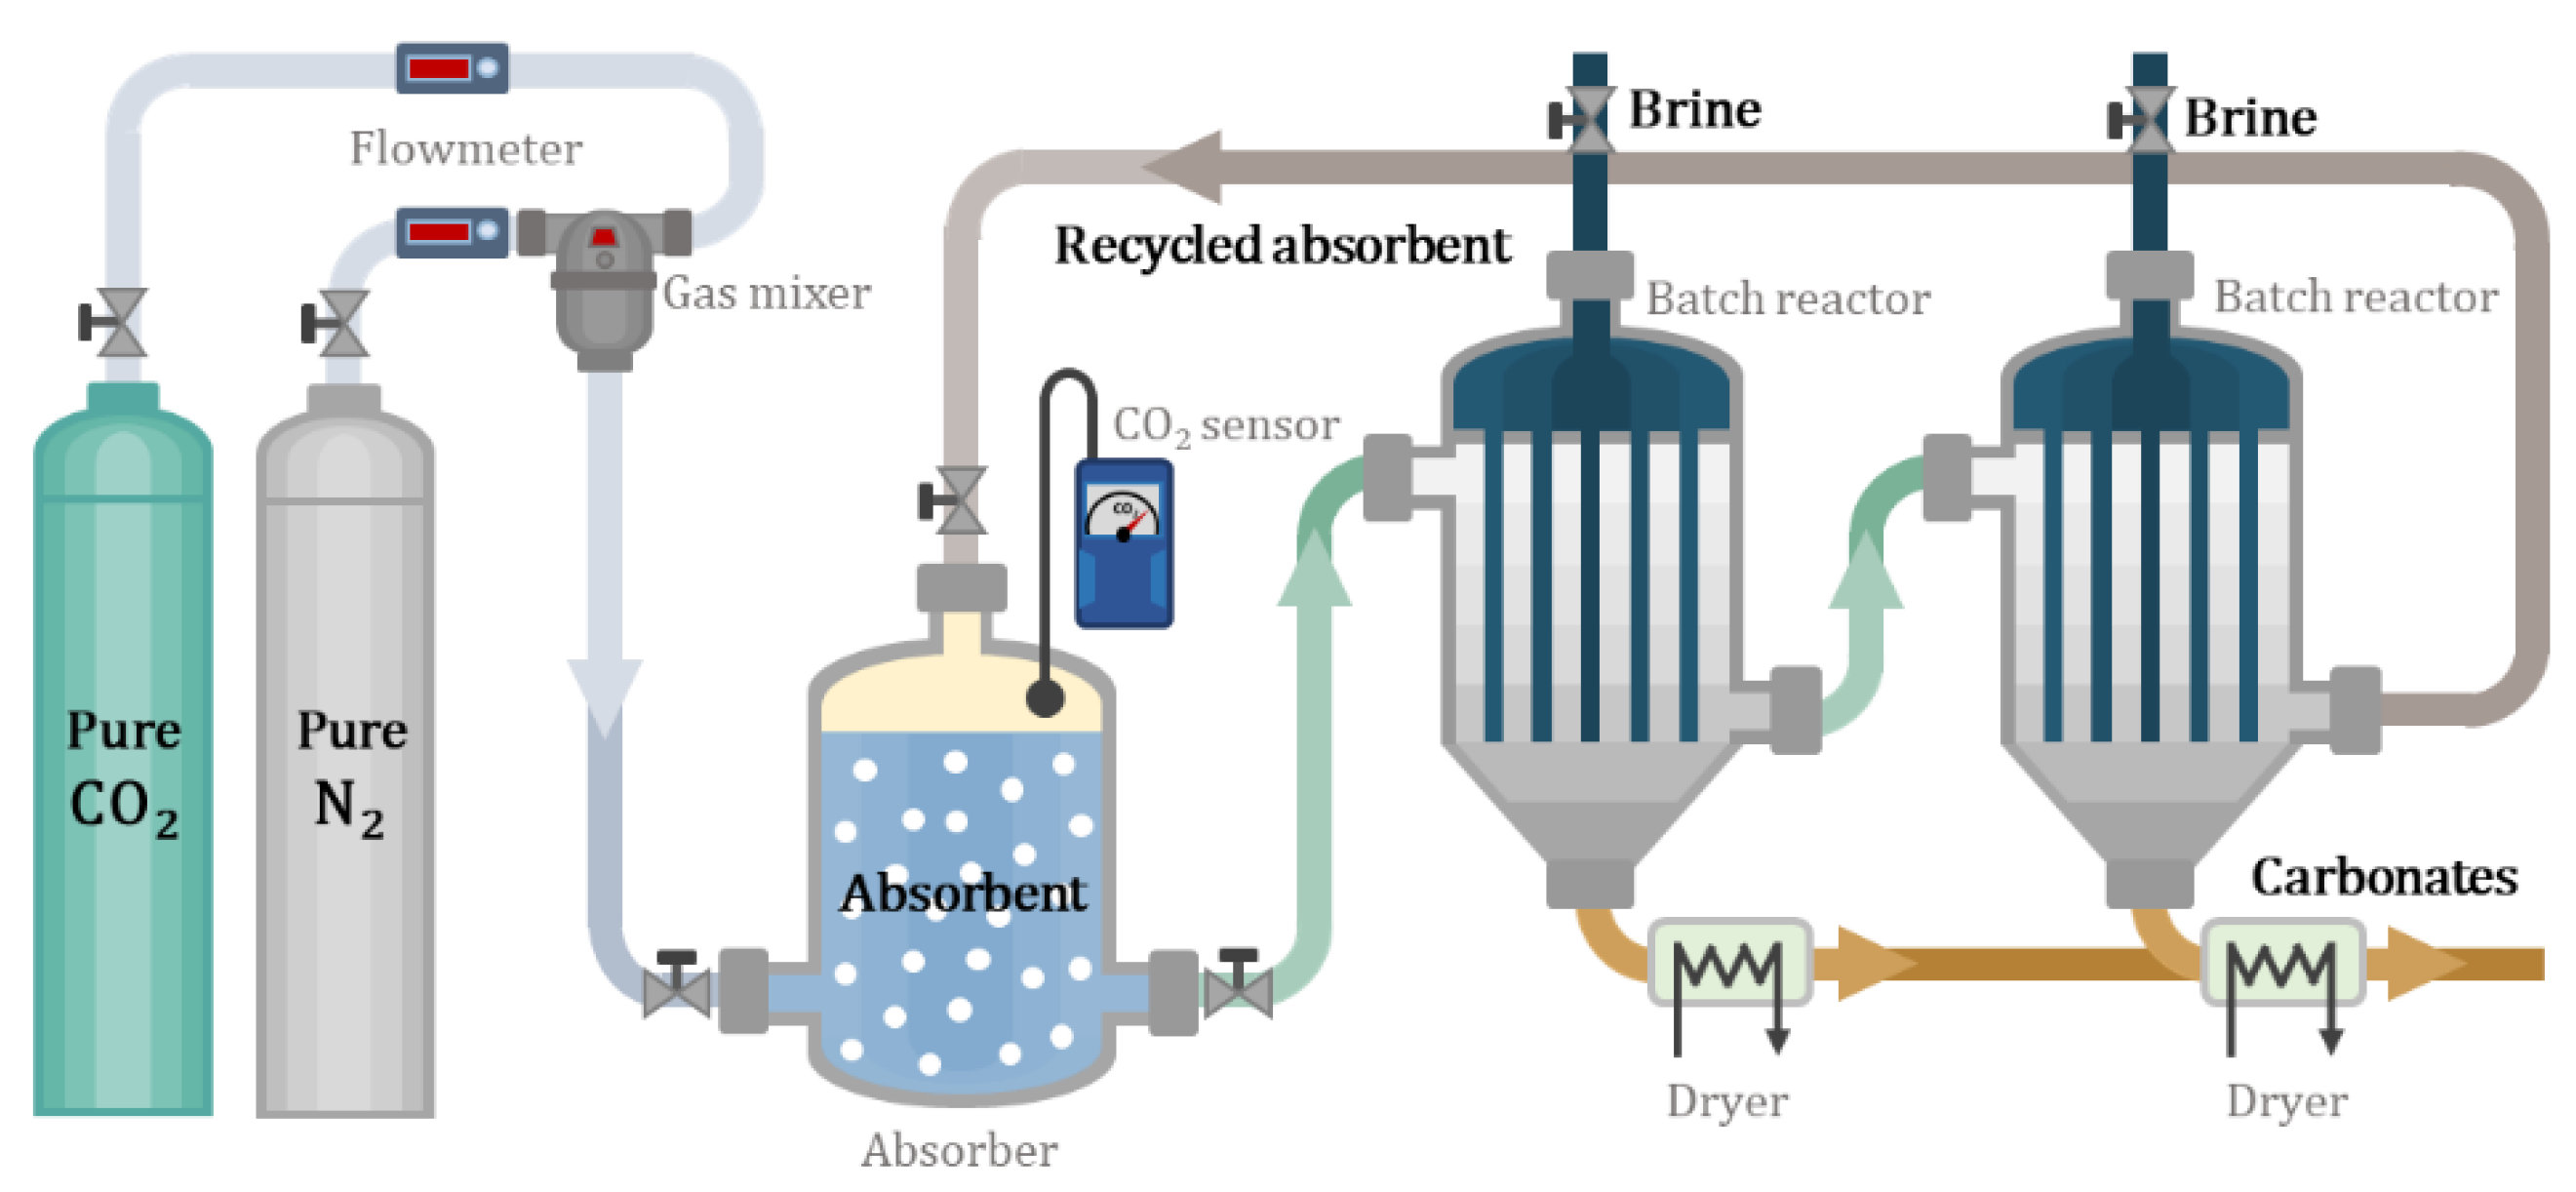
Four aqueous alkanolamine absorbents were examined during the three steps of multicycle integrated CO2 absorption–mineralization (multicycle IAM)—absorption, precipitation, and regeneration between 20 °C and 25 °C at atmospheric pressure (standard conditions). MEA (>99.0%,Chemical Abstract Service (CAS): 141-43-5), DEA (>99.0%, CAS: 111-42-2), TEA (>99.0%, CAS: 102-71-6), and AMP (>99.0%, CAS: 124-68-5) were purchased from Kanto Chemical Co., Inc. (Tokyo, Japan) and prepared with deionized water at concentrations of 5, 10, and 15 wt.%. CaCl2 (22,000 ppm) and MgCl2 (21,000 ppm) were dissolved in deionized water to prepare a brine solution [17]. In the feed line, 13.0 vol.% CO2 contained CO2 (>99%) and N2 (>99%) to model the flue gas. Furthermore, aqueous alkanolamine solutions were regenerated by pure N2.
The first cycle of IAM is called cycle 1, and the cycles after the regeneration are sequentially called cycles 2 and 3. The experimental equipment used is shown in Figure 1.

2.1. Absorption

On a laboratory scale, the absorber was designed to have a 60 mm inner diameter and 30 cm height. The device precisely controlled 13.0 vol.% CO2 in 180 mL/min of inlet mixed gas through the flowmeters. The CO2 concentration of the column outlet was measured with the CO2 sensor (nondispersive infrared type, range: 0.04–20.0 vol.%, Ichinen Jikco Co., Ltd., COZY-1, Tokyo, Japan) [40]. Pure N2 (30 mL/min ) was injected into the column for 10 min to remove air and humidity before CO2 absorption. The mixed gas was fed into the column containing a 300-mL aqueous alkanolamine absorbent (Table 1), and the absorbent extended its limit when the CO2 concentration at the outlet became 13.0 vol.%. The CO2 absorption capacity of the absorbents was investigated.
The CO2 absorption capacity [41] is a function of gas flow rate, gas composition, and absorption time, as described in Equation (6):
A c = PM   RTm ( y o y i ) Q Δ t
where Ac is the number of moles of CO2 absorbed per mole of absorbent, P is the standard pressure, M is the molecular weight of CO2, R is the gas constant (8.314 m3·Pa·K−1·mol−1), T is the standard temperature, m is the absorbent mass, y is the gas composition, i and o are the inlet and the outlet, respectively, Q is the gas flow rate at standard conditions, and ∆t is the time between the start and end of CO2 absorption. Furthermore, the CO2 absorption rate describes the speed of absorption, which is defined as the CO2 absorption capacity per unit time.
Table 1. Properties of alkanolamine-based absorbents collected data from literature. Vega et al., 2018 [28] identified chemical structure of amines. Chen et al., 2018 [42] summarized limitations of various amines. Smith 1995 [43] created a program of chemical structure of amines. Rinker et al., 1996 [44] explained the advantages and disadvantages of MEA, DEA, and AMP. Liu et al., 2021 [45,46] explained the advantages and disadvantages of TEA.
AlkanolamineClassificationChemical StructureAdvantageDisadvantage
Monoethanolamine
(MEA)
Primary amineOH–C2H4–NH2
Minerals 12 01386 i001
  • High absorption capacity
  • Unusable for mixed gases
  • High corrosiveness
  • High toxicity
  • High energy consumption
Diethanolamine
(DEA)
Secondary amineHN(CH2CH2OH)2
Minerals 12 01386 i002
  • Using in gas scrubber
  • High absorption capacity
  • Low corrosiveness
  • Low degradation
  • Low toxicity
  • Low solubility in water
  • High energy consumption
Triethanolamine
(TEA)
Tertiary amineN(CH2CH2OH)3
Minerals 12 01386 i003
  • Stability
  • Low corrosiveness
  • Low degradation
  • Low toxicity
  • Low absorption capacity
  • High viscosity
  • High cost
Aminomethyl propanol
(AMP)
Steric hindrance amineH2NC(CH3)2CH2OH
Minerals 12 01386 i004
  • High absorption capacity
  • Low corrosiveness
  • High viscosity
  • High toxicity
  • High cost

2.2. Precipitation

Precipitation was performed twice to decrease the number of IAM cycles while maintaining the performance of CO2 absorption and conversion. In the first precipitation, the aqueous alkanolamine absorbent saturated with CO2 (300 mL) was mixed with a 100-mL brine solution. Solid carbonates spontaneously formed within a few seconds; the mixture reached a steady state when strung for 30 min at 500 rpm. The carbonates were filtered via a filter paper (No.5A, 150 mm) and dried for 10–20 min by heating (60 °C). In the second precipitation, 50 mL of additional brine solution was fed to extract more carbonates using the same process.
Nevertheless, the volume increase (150 mL) with the addition of the brine solution in every precipitation process was abandoned to maintain the initial volume of the absorbent. This is necessary to ensure the accuracy of CO2 absorption capacity calculations.

2.3. Regeneration

The absorption column was then used as the regenerator to eject CO2 residual gases in the mixture (300 mL) by injecting 30 mL/min of pure N2. The regeneration process was completed when the CO2 concentration at the outlet decreased to below 0.04 vol.%. The regenerated aqueous alkanolamine absorbent was repetitiously used in the next cycle of CO2 absorption.
The cycle of IAM for each alkanolamine absorbent finished when no more carbonates precipitated.

3. Results

In multicycle integrated CO2 absorption–mineralization (multicycle IAM), which includes absorption, precipitation (first and second), and regeneration, the characteristics of MEA, DEA, TEA, and AMP were investigated. In cycle 1, the absorbent exhibits its full performance in terms of CO2 absorption. The next absorptions involve reabsorption by reusing the absorbent, precipitation, and regeneration, named as cycles 2 and 3.

3.1. Effects of the Developed Model of CO2 Absorption Capacity

The formula of the CO2 absorption capacity was altered to be more accurate with the additional functions of temperature, pressure, and gas constant, as mentioned in Equation (6). Due to the reuse of the aqueous MEA absorbent in multicycle IAM, the CO2 absorption capacity was investigated in the first absorption (cycle 1) with 5, 10, and 15 wt.% MEA under standard conditions. The experimental results of MEA were validated with the developed model of CO2 absorption capacity, as shown in Figure 2.
The variation in MEA concentration is related to the CO2 absorption capacity: higher concentrations slightly impact the absorption capacity compared with lower concentrations. The average CO2 absorption capacity was 574.33, 528.86, and 503.95 g of CO2 absorbed per kilogram of MEA solvent when MEA concentration was 5, 10, and 15 wt.%, respectively. The calculation error of CO2 absorption capacity ranged from 2.74 to 16.20%. Furthermore, these results were similar to those reported in the literature [17,24,46,47,48]. However, the amount of CO2 absorbed varied because of independent factors, such as human error or external factors. Therefore, the model of CO2 absorption capacity was used for DEA, TEA, and AMP for more accuracy.

3.2. Effects of the Increased Number of Precipitation Steps

The previous study [24] showed a single step of precipitation under standard conditions, whereas we performed precipitation twice (100 and 50 mL), and the results were compared, as shown in Figure 3.
In Figure 3, the general bars refer to the previous study (single step of precipitation), and the strip pattern bars refer to the current study (double steps of precipitation). The double steps of precipitation reduced the number of IAM cycles from 11 to 9 while preserving the efficiency of CO2 absorption capacity. To increase the steps of precipitation, more solid carbonates were generated from the CO2–MEA mixture, approximately 23.89–34.08%. In addition, the overall absorption time was slightly reduced by 4.11%. Hence, in this experiment, precipitation was repeated twice to improve the yield of carbonate production, including the reduction of the operation time in multicycle IAM.

3.3. Comparison of Absorption in Alkanolamine Absorbents

MEA was extended as a result of the precipitation’s increasing steps. In order to compare these experimental results with those of other absorbents that were extensively investigated in this study, such as DEA, TEA, and AMP, through the repeated cycle of integrated absorption–mineralization (multicycle IAM), two parameters, CO2 absorption capacity and CO2 absorption rate, were examined to determine the characteristics of CO2 absorption in all those aqueous alkanolamine-based absorbents. Experiments were conducted at varying concentrations from 5, 10, and 15 weight percent.

3.3.1. CO2 Absorption Capacity

The amount of CO2 absorbed in each alkanolamine absorbent, which evaluates the absorption process in the multicycle integrated absorption–mineralization cycle (multicycle IAM), is described by the CO2 absorption capacity (Equation (4)) [41]. In multicycle IAM, the first cycle demonstrates the maximum CO2 absorption capacity of the fresh absorbent. For optimal resource use, the alkanolamine absorbents are prepared for multiple uses. As a result, the purpose of recycled absorbents can enhance CO2 absorption. Therefore, the amount of CO2 absorption capacity is defined as the total of each absorbent’s CO2 absorption capacity during each cycle. Although all aqueous alkanolamine absorbents with the highest concentration (15 wt.%) had the highest CO2 absorption capacity, these quantities were not considerably bigger than the lowest concentration (5 wt.%), as shown in Figure 4a,c. In addition, the rate of CO2 absorption capacity will discuss how rapidly a 5 wt.% concentration of those absorbents ran (Section 3.3.2).
Figure 4 shows the CO2 absorption capacity of 5, 10, and 15 wt.% aqueous alkanolamine absorbents at equilibrium for each cycle. The amount of absorbed CO2 was expressed in unit of grams of CO2 per kilogram of the absorbent. Cycle 1 of the experiment demonstrates the maximum CO2 absorption capacity for MEA, DEA, TEA, and AMP absorbents, which was 407.42, 113.37, 34.21, and 79.77 g·CO2/kg·absorbent, respectively. As the cycle was repeated (>2 cycles), the amount of CO2 absorbed in each absorbent dropped to less than 30 g·CO2/kg·absorbent. The contribution to the cumulative effect >2 cycles was therefore small; 5 wt.% MEA, DEA, and AMP provided higher reabsorption values than the higher concentrations of these absorbents as 73.88, 63.02, and 71.93 g·CO2/kg·absorbent, respectively, whereas 15 wt.% TEA provided 96.01 g·CO2/kg·absorbent (Figure 4a).
The order of the amount of CO2 absorption capacity was MEA >> DEA > AMP > TEA, in which MEA had a much higher amount than those of DEA and AMP, while the yield of TEA was the lowest in cycle 1. On the other side, the amount of CO2 absorption capacity in >2 cycles of MEA, DEA, and AMP was small, whereas the result of TEA was 68% of the total CO2 absorption capacity in the completed cycle.
In conclusion, the concentration of the aqueous alkanolamine absorbents MEA, DEA, TEA, and AMP slightly affected how much CO2 they could absorb. The operating time of finished IAM cycles was improved by the lower absorbent content (5 wt.%). By using a fresh absorbent at cycle 1, the maximum capacity for each absorbent was obtained. In cycle 1, MEA had the maximum CO2 absorption capacity (407.42 g·CO2/kg·absorbent). In contrast with >2 cycles, the amount of CO2 absorption capacity in each absorbent was gathered lower than 30 g·CO2/kg·absorbent. TEA profited from >2 cycles, with the maximum value being 96.01 g·CO2/kg·absorbent.
Furthermore, Figure 4 compares the amount of CO2 converted with the amount of CO2 absorbed in each absorbent. It is difficult to compare all aqueous alkanolamine absorbents based on CO2 absorption capacity because their utilization depends on the viability of their applications. The amount of carbonate generation will be discussed in the next section (Section 3.4).

3.3.2. CO2 Absorption Rate

The CO2 absorption rate, which is expressed in CO2 absorbed per kilogram of absorbent per unit of time, indicates how much CO2 is absorbed in an aqueous absorbent during the operating time. In cycle 1 of multicycle IAM, the CO2 absorption rate profiles demonstrated a similar direction, which gradually reduced, as shown in Figure 5. The concentration of each absorbent was related to the absorption rate due to the amount of absorbed CO2 divided by a unit of the absorbent. Furthermore, the absorption rate was governed by the absorbent’s viscosity, depending on its concentration [41]. The molecules of CO2 gases were difficult to spread in high absorbent concentrations, which has a high viscosity, resulting in a low absorption rate.
Figure 5 shows that the highest CO2 absorption rate of MEA, DEA, TEA, and AMP absorbents was 7.40, 3.51, 3.15, and 4.12 g·CO2/kg·absorbent s−1 (Tables S3, S6, S9, and S12), respectively, as impacted by their lowest concentration (5 wt.%). Because MEA has more N–H functions than DEA does in its structure, it can produce more stabilized zwitterion to increase CO2 absorption [50]. AMP offered a rather high rate since the stand N–H in its planar form favored absorbing CO2 [33]. Similar tendencies in cycle 1 were seen in the rate profiles of MEA, DEA, and AMP, which drastically initially decreased before becoming moderately reduced. Conversely, the rates of TEA were gradually decreasing.
The operation time in cycle 1 of MEA appeared to be the highest of all concentrations, taking up to 2.27 h at a concentration of 5 wt.%, compared with DEA, TEA, and AMP, which took 47, 4.17, and 16.67 min, respectively.
As noted, these CO2 absorption results in MEA were slightly different compared with the previous study [24] as a result of the incomplete control of the gas phase. CO2 gases as a dispersed phase exhibit nonuniform flow in aqueous MEA; therefore, the rate of CO2 absorption capacity slightly differed due to inconsistent gas–liquid mixing.
Figure 6 represents the rate of CO2 absorbed in each absorbent in the repeat cycles of IAM (>2 cycles). The concentrations of each absorbent remained to have an influence on the rate of CO2 absorption capacity over the operation time. However, low concentrations (5 wt.%) had a significant positive effect on these rates in each succeeding cycle. However, in cycle 2, the highest rates of CO2 absorption for 5 wt.% MEA, DEA, TEA, and AMP absorbents were 1.49, 1.54, 2.10, and 2.19 g·CO2/kg·absorbent s−1 (Tables S3, S6, S9, and S12), respectively. This rate had decreased to an average of 54% compared with cycle 1. Then, the absorbents’ rates declined from 30% to 10%.
The amount of CO2 absorbed over time in MEA absorbents was noticeably reduced by 80% due to the comparison of cycle 1 as fresh absorbents (Figure 5) and >2 cycles as recycled absorbents (Figure 6). DEA and AMP had CO2 absorption rates in >2 cycles that were comparable with MEA, whereas TEA had the opposite results. In addition, the operation time in >2 cycles corresponded to CO2 absorption rates of each absorbent; that time is reduced for every repeated cycle in a multicycle IAM.
In summary, the CO2 absorption rates of aqueous alkanolamine absorbents, MEA, DEA, TEA, and AMP were controlled by their concentration. In multicycle IAM, the results of cycle 1 indicated the maximum capacity for each absorbent due to the use of fresh absorbent. As shown in Figure 5, the lower absorbent concentration substantially affected higher concentrations because of the amount of absorbed CO2 divided by the unit of absorbent and absorbent viscosity. Thus, the injected CO2 gases were easier to dissolve at lower viscosities or absorbent concentrations. MEA (5 wt.%) provided the highest rate of absorption as 7.40 g·CO2/kg·absorbent s−1 (Table S3). However, during the first and the next cycles of IAM, the rate of CO2 absorption in each absorbent decreased by 80, 54, 37, and 45% for MEA, DEA, TEA, and AMP, respectively (Figure 5). These gaps were found to comply with the absorbent degradation. Hence, MEA was intensely degraded up to 80% of the initial CO2 absorption rate in >2 cycles, whereas the other absorbents were slightly degraded, despite having similar degradation after cycle 2 (30% to 10%).
Since its first operation, MEA has produced positive outcomes in terms of both the capacity and rate of CO2 absorption. At a concentration of 5 wt.%, MEA required up to 2.81 h of operation time to achieve those values. Therefore, there was extensive discussion regarding the employment of MEA in multicycle IAM.
However, TEA and AMP were two outstanding candidate absorbents for multiple uses. Only 30% to 10% of TEA might be lost during each cycle, and 5 wt.% regenerated TEA could be reused up to 10 times, accumulating more than 68% of the CO2 absorption capacity during the completed cycle. On the other hand, the regenerated AMP offered the rather high CO2 absorption capacity and rate throughout the operation, 151.74 g·CO2/kg·absorbent and 4.12 g·CO2/kg·absorbent s−1 (Table S12) within 36.33 min.

3.4. Comparison of Conversion in Alkanolamine Absorbents

Solid carbonate is the key achievement of multicycle IAM. In the process of precipitation, the brine solution, containing Ca2+ and Mg2+ ions, is supplied into the mixture of dissolved CO2 gases in aqueous alkanolamine absorbents to generate insoluble carbonates. Therefore, two steps of precipitation were added in these experiments to increase carbonate generation. Furthermore, CO2 conversion was indicated by the amount of mixture converted into the amount of carbonate generation. The conversion of CO2 absorbed into carbonate is one of the parameters to identify the optimal adsorbent in order to improve the CO2 utilization by repeating the IAM cycle.
Figure 4 presents the amount of carbonate generation in the unit of grams of carbonate mixture per kilogram of the absorbent in every cycle. The higher amount of carbonate generation in each cycle was caused by the higher concentration of these absorbents based on the greater amount of CO2 absorption capacity. For the IAM cycle, in cycle 1, the amount of solid carbonate was found to be smaller than the amount of CO2 absorbed in each absorbent because CO2 molecules bonded in the function of N–H in the absorbent; thus, the performance of CO2 capture was declined in cycle 2 due to absorbent degradation. For example, for 5 wt.% concentration, the amount of solid carbonate recovered from MEA, DEA, and TEA decreased by one-third, whereas, for AMP, it decreased by half between cycle 1 and cycle 2. In contrast, the CO2 absorption capacity sharply reduced, especially for MEA. However, the cumulative amount of solid carbonate raised approximately 3.3–7.5 times for MEA, DEA, and AMP, and up to 12 times for TEA compared with that in cycle 1. As a result, the multicycle IAM has the ability to gather the amount of carbonate production throughout every subsequent cycle.
Despite losses occurring during the transformation of the amount of CO2 absorbed in absorbent to carbonates, as illustrated in Figure 4, the amount of carbonate generation was in the order of MEA >> AMP > DEA > TEA. Compared with cycle 1, the cumulative amount of solid carbonate of TEA was the highest. Interestingly, in the case of MEA, the cumulative amount of solid carbonate in >2 cycles was pretty small. Although MEA had the highest CO2 absorption capacity, its ability to recover solid carbonate was low in the repeated cycles. As a result of the low recovering process of MEA, a large degradation in MEA occurred. Nevertheless, DEA and AMP were similar to MEA in terms of solid carbonate accumulation in >2 cycles.

4. Discussion

IAM processes sought to improve the amount of carbonate generation from CO2 absorbed in the absorbent by reusing the absorbent in many cycles. One of the criteria for selecting the most suitable absorbent to enhance CO2 storage and utilization was the conversion of absorbed CO2 into carbonate. The experiments were performed using aqueous MEA, DEA, TEA, and AMP absorbents under standard conditions through multicycle IAM, which involved the repetition of absorption, precipitation, and regeneration. The solid carbonates were formed by reacting the brine solution with the dissolved CO2 in the absorbent. The reused absorbent could be recycled until its degradation. Moreover, the degradation of the absorbent was examined under various conditions. The effects of concentration, CO2 absorption capacity and rate, carbonate generation, and CO2 conversion were investigated.

4.1. Degradation of Alkanolamine Absorbents

The recycled aqueous alkanolamine absorbent was utilized to extract maximum efficiency due to the operation of the multicycle IAM. However, it is obvious that some of the absorbents’ capability, such as their ability to absorb CO2, was lost throughout cycles 1 and 2 (Figure 4). Degradation of the absorbent is the presence of a decreasing CO2 capture performance [24].
During the operation of the cycle of IAM, unwanted reactions and uncontrollable degradation of the absorbents during the absorption process by autoxidation occurred (oxidative degradation). The ability to capture CO2 was decreased when the products were oxidized to the function of N–H in the absorbent [51]. In addition, heat is released in solid carbonate formation during the precipitation process in which the absorbent molecules were degraded in each cycle (thermal degradation); thus, the efficiency of CO2 absorbed in each absorbent was lower [52,53] By dividing the difference in CO2 absorption capacity during that cycle by the CO2 absorption capacity in cycle 1, the degradation efficiency of the absorbent was determined by finding out the mechanism of absorbent degradation as follows:
Degradation   efficiency = A c , 0 A c , n A c , 0 × 100 %
where Ac, o and Ac, n are the initial CO2 absorption capacity in cycle 1 and CO2 absorption capacity at cycle n, respectively.
The fresh absorbent’s capacity to absorb CO2 was maximum in cycle 1. We assumed that cycle 1 would not undergo significant degradation. On the other side, >2 cycles, the ability of the absorbent to absorb CO2 throughout each cycle was calculated in order to examine the absorbent degradation, as shown in Figure 7.
Figure 7 displays the degradation efficiency of each absorbent through the cycle of IAM. If an absorbent’s degradation efficiency approaches 100%, it indicates that the absorbent has lost its capacity to absorb CO2. As a consequence, an absorbent that can be utilized in the IAM cycle multiple times should have a low degradation efficiency since the initial cycle.
The concentration of the absorbent was found to comply with absorbent degradation. For each concentration, the degradation efficiency extremely increased in cycle 2 and slightly next cycle in order. High concentration (15 wt.%) had a vast effect on the degradation efficiency (more than 85%) than the lower concentrations, disrupted by the uncontrollable side reactions, resulting in the reducing ability of CO2 capture. Hence, the lowest concentration, 5 wt.%, might avoid the higher degree of degradation in each absorbent.
In cycle 2, the degradation efficiency of 5 wt.% MEA started at 92.22%, resulting in lower performance of CO2 capture in repeated cycles. An amount of 5 wt.% DEA and AMP showed a moderate value in which the absorbent degraded by 77.48% and 64.02%. Although Equations 1 and 2 show that MEA, DEA, and AMP can produce carbamate and bicarbonate ions, the rates of CO2 absorption capacity are different [32,33]. It is contrary to TEA, which barely degraded (43%) because of its symmetric structure [33]. Although TEA has the potential to enhance both reuse and degradation efficiency, the CO2 absorption capacity and carbonate generation still need considerable improvement. As a result, AMP is a desirable alternative absorbent for both CO2 absorption capacity and carbonate generation, in which the efficiency of degradation is acceptable.

4.2. CO2 Conversion of Alkanolamine Absorbents

The measurable quantity of absorbed CO2 that can be converted to carbonates is referred to as CO2 conversion. The goal of this study was to improve the production of carbonates by precipitating CO2 that was absorbed in absorbents. As a result, based on CO2 conversion, the absorbent type and concentration, and optimal repeated cycles were determined for maximizing yield in the shortest operation time in the multicycle IAM.
When CO2 is converted, it transforms into new chemical forms that still contain carbon in it. The conversion in this experiment indicates how much of the absorbed CO2 in those absorbents converts to solid carbonates, which is calculated according to Equation (8) [17,54]. The management of carbon included the conversion and use of CO2.
Percent   conversion = Amount   of   carbonate   generation Amount   of   CO 2   absorbed
As the IAM cycle is expanded, Figure 8 demonstrates the progression of CO2 conversion of alkanolamine absorbents as a percentage of carbonate generation in relation to the amount of CO2 absorbed. The percentage of CO2 conversion for each concentration of absorbents tends to rise with each following IAM cycle, resulting in more of solid carbonate formation produced per unit of CO2 absorbed. However, the effect of CO2 conversion was less apparent in some absorbents including MEA, DEA, and AMP in later cycles of operation because the amount of carbonate generation formed throughout that cycle was smaller than the whole amount of CO2 absorbed. Therefore, the optimal IAM cycle for each absorbent may be determined to produce the most solid carbonate based on the percent CO2 conversion.
In comparison with higher concentrations, 5 wt.% of each absorbent resulted in the best results. DEA and AMP were exceptional absorbents with high percent CO2 conversion of 72.90% and 86.93%, yet MEA and TEA exhibited percent CO2 conversion of 59.42% and 54.11%, respectively, in the completed IAM cycle. Additionally, we discovered that four cycles that produced the largest quantity of CO2 absorbed in AMP were converted into solid carbonate at a percentage of 89.54% when considering the optimal IAM cycle.
As shown in Figure 9, there is a correlation between the amount of CO2 absorption capacity and CO2 conversion in each concentration of alkanolamine absorbents at the end of the cycle. This means that when choosing suitable absorbents for a multicycle IAM, it is important to consider these two factors into account.
Two types of absorbents are shown on the graph that have the potential to be employed in multicycle IAM: MEA, which displays the greatest CO2 absorption capacity; and AMP, which enhances the transformation of absorbed CO2 into solid carbonate. The use of the AMP absorbent is one way of operating a multicycle IAM to improve CO2 utilization since more of the absorbed CO2 could be converted into products, achieving the objective of this research. Compared with MEA, which provides good results in terms of the most CO2 absorption capacity but consumes the longest time, AMP offers both a relatively high CO2 absorption capacity and the highest CO2 conversion in a short operation time. In addition, the degradation efficiency of AMP is acceptable.
For this study, the maximized reused absorbents while enhancing more carbonates were an essential factor; therefore, the most suitable alkanolamine absorbent was selected to fulfill the aim of multicycle IAM. Considering 4 IAM cycles (optimal cycles), we found that 5 wt.% AMP had the highest percent CO2 conversion compared with the other absorbents. About 89.54% of the amount of CO2 absorbed was transformed into solid carbonate. Although AMP had moderate CO2 absorption capacity and rate, their potential for CO2 conversion was promising for long-term CO2 removal, capture, and sequestration. In the completed multicycle IAM for 5 wt.%, AMP (33 min) were five times faster than MEA (2.81 h). Therefore, AMP might offer both high CO2 capture performance and carbonate generation within a short operation time.

5. Conclusions

Various aqueous alkanolamine-based absorbents with differential chemical structures such as MEA, DEA, TEA, and AMP were studied for the optimal operation of multicycle integrated CO2 absorption–mineralization (multicycle IAM). This research aimed to eliminate large-volume CO2 emissions that lead to environmental concerns in terms of energy consumption, re-released pollutant, and water disposal. Furthermore, multicycle IAM was developed to improve the efficiency of CO2 absorption and CO2 conversion within a shortened operating time. Especially, the degradation of absorbents was evaluated.
The reusable aqueous alkanolamine absorbent, which is durable and active for CO2 absorption, is a key to the successful operation of the IAM cycle. The study aimed to increase the amount of CO2 absorbed and converted with reasonable operating costs and environmental concerns. MEA, DEA, TEA, and AMP were used, and the suitable absorbent type was determined based on three parameters—CO2 absorption capacity and rate, CO2 conversion, and absorbent degradation over the overall operation time, which is the summation of the total time spent in each cycle.
The experimental results indicated that CO2 absorption capacity and rate were in the order of MEA >> DEA > AMP > TEA in cycle 1 of IAM. The degradation efficiency of each absorbent was 92.22%, 77.48%, 43%, and 64.02% in MEA, DEA, TEA, and AMP, respectively. On the other hand, >2 cycles of IAM were the most significant parameter for multiple operations in which the rate and capacity of CO2 were in the order of TEA > AMP ≈ DEA ≈ MEA with similar degradation as 30% to 10% (Figure 5 and Figure 6). The TEA absorbent had excellent repeatability with low degrading efficiency, but CO2 absorption capacity and rate, carbonate formation, and CO2 conversion need to be modified. TEA may, therefore, be able to provide an answer in some industries.
In consequence, four-cycle 5 wt.% AMP was the most suitable potential absorbent for the multicycle IAM, providing 143.34 g of CO2 per kilogram of the absorbent and 128.34 g of carbonates per kilogram of the absorbent (33 min). About 89.5% of the amount of CO2 absorbed in AMP was converted into carbonates, exceeding previously reported results (5 wt.% MEA, 60% approximately). We expect that the large-scale production of carbonates can be a new source for the construction and agriculture industries. Furthermore, the pH level for disposal water was between 7.2 and 7.8, which was in the range of safe discharge. In addition, the overall operation time of AMP was faster (approximately 5 times) than MEA (2 h), which had the highest CO2 absorption capacity [24]. It means that the energy consumption of the AMP was significantly lower than MEA. In addition, 64.02% of AMP was moderately degraded during cycles 1 and 2, and its efficiency in the next cycle (>2 cycles) was orderly decreased to 30%–10%. Therefore, 5 wt.% AMP was the most suitable absorbent for multicycle IAM.

Supplementary Materials

The following supporting information can be downloaded at: https://www.mdpi.com/article/10.3390/min12111386/s1, Table S1. CO2 absorption rate of 15 wt.% MEA over operation time. [Unit of CO2 absorption rate: g·CO2/kg·Absorbent s−1]. Table S2. CO2 absorption rate of 10 wt.% MEA over operation time. [Unit of CO2 absorption rate: g·CO2/kg·Absorbent s−1]. Table S3. CO2 absorption rate of 5 wt.% MEA over operation time. [Unit of CO2 absorption rate: g·CO2/kg·Absorbent s−1]. Table S4. CO2 absorption rate of 15 wt.% DEA over operation time. [Unit of CO2 absorption rate: g·CO2/kg·Absorbent s−1]. Table S5. CO2 absorption rate of 10 wt.% DEA over operation time. [Unit of CO2 absorption rate: g·CO2/kg·Absorbent s−1]. Table S6. CO2 absorption rate of 5 wt.% DEA over operation time. [Unit of CO2 absorption rate: g·CO2/kg·Absorbent s−1]. Table S7. CO2 absorption rate of 15 wt.% TEA over operation time. [Unit of CO2 absorption rate: g·CO2/kg·Absorbent s−1]. Table S8. CO2 absorption rate of 10 wt.% TEA over operation time. [Unit of CO2 absorption rate: g·CO2/kg·Absorbent s−1]. Table S9. CO2 absorption rate of 5 wt.% TEA over operation time. [Unit of CO2 absorption rate: g·CO2/kg·Absorbent s−1]. Table S10. CO2 absorption rate of 15 wt.% AMP over operation time. [Unit of CO2 absorption rate: g·CO2/kg·Absorbent s−1]. Table S11. CO2 absorption rate of 10 wt.% AMP over operation time. [Unit of CO2 absorption rate: g·CO2/kg·Absorbent s−1]. Table S12. CO2 absorption rate of 5 wt.% AMP over operation time. [Unit of CO2 absorption rate: g·CO2/kg·Absorbent s−1].

Author Contributions

Conceptualization, C.T. and S.T.; methodology, C.T.; software, C.T.; validation, C.T. and S.T.; formal analysis, C.T.; investigation, C.T. and S.T.; resources, C.T. and S.T.; data curation, C.T.; writing—original draft preparation, C.T.; writing—review and editing, C.T. and S.T.; visualization, C.T.; supervision, S.T.; project administration, C.T.; funding acquisition, S.T. All authors have read and agreed to the published version of the manuscript.

Funding

This research received no external funding.

Data Availability Statement

Data are provided in Supplementary Materials.

Acknowledgments

The first author would like to acknowledge the support of the Japanese Government (Monbukagakusho: MEXT).

Conflicts of Interest

The authors declare no conflict of interest. The funders had no role in the design of the study; in the collection, analyses, or interpretation of data; in the writing of the manuscript; or in the decision to publish the results.

References

  1. O’Brien, G.; O’keefe, P.; Rose, J.; Wisner, B. Climate change and disaster management. Disasters 2006, 30, 64–80. [Google Scholar] [CrossRef] [PubMed]
  2. Carrington, D. Guardian. Climate Crisis: 11,000 Scientists Warn of ‘Untold Suffering’, London, 2019. Available online: https://www.theguardian.com/environment/2019/nov/05/climate-crisis-11000-scientists-warn-of-untold-suffering (accessed on 10 September 2022).
  3. Bataille, C.; Åhman, M.; Neuhoff, K.; Nilsson, L.J.; Fischedick, M.; Lechtenböhmer, S.; Solano-Rodriquez, B.; Denis-Ryang, A.; Stieberth, S.; Waismana, H.; et al. A review of technology and policy deep decarbonization pathway options for making energy-intensive industry production consistent with the Paris Agreement. J. Clean. Prod. 2018, 187, 960–973. [Google Scholar] [CrossRef] [Green Version]
  4. Rhodes, C.J. The 2015 Paris climate change conference: COP21. Sci. Progress 2016, 9, 97–104. [Google Scholar] [CrossRef] [PubMed]
  5. Haug, N.; Geyrhofer, L.; Londei, A.; Dervic, E.; Desvars-Larrive, A.; Loreto, V.; Pinior, B.; Thurner, S.; Klimek, P. Ranking the effectiveness of worldwide COVID-19 government interventions. Nat. Hum. Behav. 2022, 4, 1303–1312. [Google Scholar] [CrossRef]
  6. Tiseo, I. Annual production of plastics worldwide from 1950 to 2020 (in million metric tons). Stat. Stat. Portal 2021, 10, 2021. [Google Scholar]
  7. Legg, S. IPCC, 2021: Climate Change 2021-the Physical Science basis. Interaction 2021, 49, 44–45. [Google Scholar]
  8. IEA. CCUS in Clean Energy Transitions, Paris, 2020. Available online: https://www.iea.org/reports/ccus-in-clean-energy-transitions (accessed on 10 September 2022).
  9. Baylin-Stern, A.; Berghout, N. Is Carbon Capture too Expensive? Paris, 2021. Available online: https://www.iea.org/commentaries/is-carbon-capture-too-expensive (accessed on 10 September 2022).
  10. Bachu, S. Identification of oil reservoirs suitable for CO2-EOR and CO2 storage (CCUS) using reserves databases, with application to Alberta, Canada. Int. J. Greenh. Gas Control. 2016, 44, 152–165. [Google Scholar] [CrossRef]
  11. Yu, S.; Horing, J.; Liu, Q.; Dahowski, R.; Davidson, C.; Edmonds, J.; Liu, B.; Mcjeona, H.; McLeod, J.; Patel, P.; et al. CCUS in China’s mitigation strategy: Insights from integrated assessment modeling. Int. J. Greenh. Gas Control. 2019, 84, 204–218. [Google Scholar] [CrossRef]
  12. Yu, C.; Huang, C.; Tan, C. A review of CO2 capture by absorption and adsorption. Aerosol Air Qual. Res. 2012, 12, 745–769. [Google Scholar] [CrossRef] [Green Version]
  13. IEA. Putting CO2 to Use, Paris, 2019. Available online: https://www.iea.org/reports/putting-co2-to-use (accessed on 10 September 2022).
  14. Teir, S.; Eloneva, S.; Fogelholm, C.J.; Zevenhoven, R. Dissolution of steelmaking slags in acetic acid for precipitated calcium carbonate production. Energy 2007, 32, 528–539. [Google Scholar] [CrossRef]
  15. Huntzinger, D.N.; Gierke, J.S.; Kawatra, S.K.; Eisele, T.C.; Sutter, L.L. Carbon dioxide sequestration in cement kiln dust through mineral carbonation. Environ. Sci. Technol. 2009, 43, 1986–1992. [Google Scholar] [CrossRef] [PubMed]
  16. Eloneva, S.; Said, A.; Fogelholm, C.J.; Zevenhoven, R. Preliminary assessment of a method utilizing carbon dioxide and steelmaking slags to produce precipitated calcium carbonate. Appl. Energy 2012, 90, 329–334. [Google Scholar] [CrossRef]
  17. Kang, D.; Jo, H.; Lee, M.G.; Park, J. Carbon dioxide utilization using a pretreated brine solution at normal temperature and pressure. Chem. Eng. J. 2016, 284, 1270–1278. [Google Scholar] [CrossRef]
  18. Solis, B.H.; Cui, Y.; Weng, X.; Seifert, J.; Schauermann, S.; Sauer, J.; Shaikhutdinov, S.; Freund, H.J. Initial stages of CO2 adsorption on CaO: A combined experimental and computational study. Phys. Chem. Chem. Phys. 2017, 19, 4231–4242. [Google Scholar] [CrossRef] [Green Version]
  19. Ali, H.; Eldrup, N.H.; Normann, F.; Skagestad, R.; Øi, L.E. Cost estimation of CO2 absorption plants for CO2 mitigation–method and assumptions. Int. J. Greenh. Gas Control. 2019, 88, 10–23. [Google Scholar] [CrossRef]
  20. Raksajati, A.; Ho, M.T.; Wiley, D.E. Reducing the cost of CO2 capture from flue gases using aqueous chemical absorption. Ind. Eng. Chem. Res. 2013, 52, 16887–16901. [Google Scholar] [CrossRef]
  21. IEA. Direct Air Capture, Paris, 2022. Available online: https://www.iea.org/reports/direct-air-capture (accessed on 15 September 2022).
  22. Wang, Y.; Song, L.; Ma, K.; Liu, C.; Tang, S.; Yan, Z.; Yue, H.; Liang, B. An integrated absorption–mineralization process for CO2 capture and sequestration: Reaction mechanism, recycling stability, and energy evaluation. ACS Sustain. Chem. Eng. 2021, 9, 16577–16587. [Google Scholar] [CrossRef]
  23. Rochelle, G.T. Conventional amine scrubbing for CO2 capture. Absorption-based post-combustion capture of carbon dioxide. Woodhead Publ. 2016, 2016, 35–67. [Google Scholar] [CrossRef]
  24. Thamsiriprideeporn, C.; Suekane, T. Investigation and development of the multicycle of CO2 mineralization with wastewater under standard conditions. Greenh. Gases Sci. Technol. 2021, 12, 67–84. [Google Scholar] [CrossRef]
  25. Soliman, M.N.; Guen, F.Z.; Ahmed, S.A.; Saleem, H.; Khalil, M.J.; Zaidi, S.J. Energy consumption and environmental impact assessment of desalination plants and brine disposal strategies. Process Saf. Environ. Prot. 2021, 147, 589–608. [Google Scholar] [CrossRef]
  26. Samco Technologies, Inc. How Much Does It Cost to Treat Brine for Reuse and/or Disposal? 2018. Available online: https://samcotech.com/cost-treat-brine-reuse-disposal/ (accessed on 20 September 2022).
  27. Li, Y.N.; He, L.N.; Diao, Z.F.; Yang, Z.Z. Carbon capture with simultaneous activation and its subsequent transformation. Adv. Inorg. Chem. 2014, 66, 289–345. [Google Scholar] [CrossRef]
  28. Vega, F.; Cano, M.; Camino, S.; Fernández, L.M.G.; Portillo, E.; Navarrete, B. Solvents for carbon dioxide capture. Carbon Dioxide Chem. Capture Oil Recovery 2018, 1, 142–163. [Google Scholar] [CrossRef]
  29. Vega, F.; Sanna, A.; Maroto-Valer, M.M.; Navarrete, B.; Abad-Correa, D. Study of the MEA degradation in a CO2 capture process based on partial oxy-combustion approach. Int. J. Greenh. Gas Control. 2016, 54, 160–167. [Google Scholar] [CrossRef]
  30. Einbu, A.; Pettersen, T.; Morud, J.; Tobiesen, A.; Jayarathna, C.K.; Skagestad, R.; Nysæther, G. Energy assessments of onboard CO2 capture from ship engines by MEA-based post combustion capture system with flue gas heat integration. Int. J. Greenh. Gas Control. 2022, 113, 103526. [Google Scholar] [CrossRef]
  31. Lv, B.; Guo, B.; Zhou, Z.; Jing, G. Mechanisms of CO2 capture into monoethanolamine solution with different CO2 loading during the absorption/desorption processes. Environ. Sci. Technol. 2015, 49, 10728–10735. [Google Scholar] [CrossRef] [PubMed]
  32. Sánchez-Bautista, A.; Palmero, E.M.; Moya, A.J.; Gómez-Díaz, D.; La Rubia, M.D. Characterization of alkanolamine blends for carbon dioxide absorption. Corrosion and regeneration studies. Sustainability 2021, 13, 4011. [Google Scholar] [CrossRef]
  33. Kim, Y.E.; Lim, J.A.; Jeong, S.K.; Yoon, Y.I.; Bae, S.T.; Nam, S.C. Comparison of carbon dioxide absorption in aqueous MEA, DEA, TEA, and AMP solutions. Bull. Korean Chem. Soc. 2013, 34, 783–787. [Google Scholar] [CrossRef] [Green Version]
  34. Hadri, N.E.; Quang, D.V.; Rayer, A.V.; Abu-Zahra, M.R. Development of amine-blend systems for CO2 post-combustion capture. In Proceedings of the 4th international gas processing symposium; Elsevier: Amsterdam, The Netherlands, 2015; pp. 59–68. [Google Scholar] [CrossRef]
  35. Wincek, R.T.; Miller, B.G.; Johnson, D.K.; Decker, G.E.; Hart, P.J.; DE, W.P.U.G.N.; No, S. On-Site Treatment of Brine. The Energy Institute and Hart Resource Technologies, Inc., 2002. Available online: http://citeseerx.ist.psu.edu/viewdoc/download?doi=10.1.1.164.2188&rep=rep1&type=pdf (accessed on 13 August 2022).
  36. Smit, B.; Reimer, J.A.; Oldenburg, C.M.; Bourg, I.C. Introduction to carbon capture and sequestration; World Scientific: Singapore, 2014. [Google Scholar] [CrossRef]
  37. Steel, K.M.; Alizadehhesari, K.; Balucan, R.D.; Bašić, B. Conversion of CO2 into mineral carbonates using a regenerable buffer to control solution pH. Fuel 2013, 111, 40–47. [Google Scholar] [CrossRef]
  38. Yiin, B.S.; Margerum, D.W. Non-metal redox kinetics: Reactions of trichloramine with ammonia and with dichloramine. Inorg. Chem. 1990, 29, 2135–2141. [Google Scholar] [CrossRef]
  39. Eloneva, S.; Teir, S.; Salminen, J.; Fogelholm, C.J.; Zevenhoven, R. Fixation of CO2 by carbonating calcium derived from blast furnace slag. Energy 2008, 33, 1461–1467. [Google Scholar] [CrossRef]
  40. Yamasaki, H.; Kamei, S.; Kuroki, T.; Okubo, M. Adsorbed CO2 dissociation using argon and helium nonthermal plasma flows. IEEE Trans. Ind. Appl. 2020, 56, 6983–6989. [Google Scholar] [CrossRef]
  41. Huertas, J.I.; Gomez, M.D.; Giraldo, N.; Garzón, J. CO2 absorbing capacity of MEA. J. Chem. 2015, 2015, 965015. [Google Scholar] [CrossRef] [Green Version]
  42. Chen, P.C.; Cho, H.H.; Jhuang, J.H.; Ku, C.H. Selection of Mixed Amines in the CO2 Capture Process. C 2021, 7, 25. [Google Scholar] [CrossRef]
  43. Smith, T.J. MolView: A program for analyzing and displaying atomic structures on the Macintosh personal computer. J. Mol. Graph. 1995, 13, 122–125. [Google Scholar] [CrossRef]
  44. Rinker, E.B.; Ashour, S.S.; Sandall, O.C. Kinetics and modeling of carbon dioxide absorption into aqueous solutions of diethanolamine. Ind. Eng. Chem. Res. 1996, 35, 1107–1114. [Google Scholar] [CrossRef]
  45. Liu, B.; Cui, Z.; Tian, W. The Kinetics Investigation of CO2 Absorption into TEA and DEEA Amine Solutions Containing Carbonic Anhydrase. Processes 2021, 9, 2140. [Google Scholar] [CrossRef]
  46. Park, S.W.; Choi, B.S.; Lee, J.W. Chemical absorption of carbon dioxide with triethanolamine in non-aqueous solutions. Korean J. Chem. Eng. 2006, 23, 138–143. [Google Scholar] [CrossRef]
  47. Yeh, A.C.; Bai, H. Comparison of ammonia and monoethanolamine solvents to reduce CO2 greenhouse gas emissions. Sci. Total Environ. 1999, 228, 121–133. [Google Scholar] [CrossRef] [Green Version]
  48. Zhu, D.; Fang, M.; Zhong, L.; Zhang, C.; Luo, Z. Semi-batch experimental study on CO2 absorption characteristic of aqueous ammonia. Energy Procedia 2011, 4, 156–163. [Google Scholar] [CrossRef] [Green Version]
  49. OriginLab Corp. OriginPro2021 Manual, 2021. Available online: https://www.originlab.com/doc/Origin-Help/PD-Dialog-Line-Tab (accessed on 6 August 2022).
  50. Jensen, J.H.; Gordon, M.S. On the Number of Water Molecules Necessary to Stabilize the Glycine Zwitterion. J. Am. Chem. Soc. 1995, 117, 8159–8170. [Google Scholar] [CrossRef]
  51. Chi, S.; Rochelle, G.T. Oxidative degradation of monoethanolamine. Ind. Eng. Chem. Res. 2002, 41, 4178–4186. [Google Scholar] [CrossRef]
  52. McCann, N.; Phan, D.; Wang, X.; Conway, W.; Burns, R.; Attalla, M.; Graeme, P.; Maeder, M. Kinetics and mechanism of carbamate formation from CO2 (aq), carbonate species, and monoethanolamine in aqueous solution. J. Phys. Chem. A 2009, 113, 5022–5029. [Google Scholar] [CrossRef] [PubMed]
  53. Vevelstad, S.J.; Eide-Haugmo, I.; da Silva, E.F.; Svendsen, H.F. Degradation of MEA; a theoretical study. Energy Procedia 2011, 4, 1608–1615. [Google Scholar] [CrossRef]
  54. Benyahia, F.; Eljack, F.T. Overview of Conversion of Greenhouse Gas Carbon dioxide to Hydrocarbons. In Proceedings of the 2nd Annual Gas Processing Symposium, Doha, Qatar, 10–14 January 2010; Elsevier: Amsterdam, The Netherlands, 2010. [Google Scholar]
Figure 1. Experimental equipment used for multicycle IAM.
Minerals 12 01386 g001
Figure 2. Validated curve of CO2 absorption capacity in aqueous MEA absorbent adapted from literature. Kang et al., 2016 [17] used a stirred reactor with 400 mL of 5, 10, and 30 wt.% of aqueous MEA and 290 mL/min of 15 vol.% of CO2 diluted in flue gas (temperature varied from 25 to 70 °C and atmospheric pressure). Huertas et al., 2015 [41] used a stirred reactor with 500 mL of <50 wt.% solvent and <1 mL/min of 50 vol.% of CO2 gas injection (temperature controlled 25 °C and atmospheric pressure). Yeh and Bai, 1999 [47] used a reactor with 200 mL of 7–35 wt.% solvent and 2–10 mL/min of 8–16 vol.% of CO2 diluted in clean air (temperature varied from 10 to 40 °C and atmospheric pressure), which further calculated absorption capacity in different temperature from Zhu et al., 2011 [48]. The curve was fitted to the Allometric1 model in Origin software (data analysis software) [49].
Minerals 12 01386 g002
Figure 3. Difference of carbonate generation between precipitation in single and double steps in multicycle IAM.
Minerals 12 01386 g003
Figure 4. Amount of CO2 absorption capacity and amount of solid carbonate of MEA, DEA, TEA, and AMP absorbents in multicycle IAM for (a) 5, (b) 10, and (c) 15 wt.% absorbent concentrations.
Minerals 12 01386 g004aMinerals 12 01386 g004b
Figure 5. CO2 absorption rates at 5, 10, and 15 wt.% aqueous MEA, DEA, TEA, and AMP in cycle 1 of multicycle IAM. The rate was evaluated by the amount of absorbed CO2 in every 10 s (Tables S1–S12). In addition, DEA, TEA, and AMP patterns are more clearly displayed in the chart below.
Minerals 12 01386 g005
Figure 6. CO2 absorption rates at (a) 5, (b) 10, and (c) 15 wt.% aqueous MEA, DEA, TEA, and AMP in >2 cycles of multicycle IAM. The rate was evaluated by the amount of absorbed CO2 in every 10 s (Tables S1–S12).
Minerals 12 01386 g006aMinerals 12 01386 g006b
Figure 7. Degradation efficiency of 5, 10, and 15 wt.% MEA, DEA, TEA, and AMP absorbents in multicycle IAM.
Minerals 12 01386 g007
Figure 8. Percentage conversion of 5, 10, and 15 wt.% MEA, DEA, TEA, and AMP absorbents in multicycle IAM.
Minerals 12 01386 g008
Figure 9. Correlation between amount of CO2 absorption capacity and CO2 conversion in 5, 10, and 15 wt.% MEA, DEA, TEA, and AMP absorbents at the completion of the cycle of multicycle IAM.
Minerals 12 01386 g009
Publisher’s Note: MDPI stays neutral with regard to jurisdictional claims in published maps and institutional affiliations.

