Article

Hydrochemical and Isotope (18O, 2H and 3H) Characteristics of Karst Water in Central Shandong Province: A Case Study of the Pingyi-Feixian Region

1
Shandong Institute of Geological Survey, Ji’nan 250013, China
2
No.1 Institute of Geology and Mineral Resources Exploration of Shandong Province, Ji’nan 250100, China
3
Shandong Engineering Laboratory for High-Grade Fe Ores Exploration and Exploitation, Ji’nan 250100, China
4
Institute of Hydrogeology and Environmental Geology, Chinese Academy of Geological Science, Shijiazhuang 050061, China
*
Author to whom correspondence should be addressed.
Minerals 2022, 12(2), 154; https://doi.org/10.3390/min12020154
Submission received: 19 November 2021 / Revised: 23 January 2022 / Accepted: 24 January 2022 / Published: 27 January 2022

Abstract

:
Karst water serves as an important water supply source in northern China. Hydrochemical and isotope (18O, 2H, and 3H) characteristics are invaluable tools to identify water–rock interaction activities in karst water systems. In this study, the investigation of hydrogeological conditions, hydrogeochemistry, and hydrogen and oxygen isotopes of karst water revealed: (1) HCO3-Ca-type water is widely distributed throughout the study area, while HCO3-Ca·Mg-type water appears in the direct recharge areas and the discharge areas; karst water of the HCO3·Cl, Cl·HCO3, and Cl types is scattered in low-land areas; (2) karst water has high δ18O, which may be due to the dissolution and exchange of 18O from the surrounding carbonate rocks in the western discharge zone; and (3) the 3H concentration of karst water is strongly correlated with the content of major ions (Ca2+, Mg2+, HCO3, SO42−, and Cl) and it increases along the flow path. It was also revealed that the karst water in the discharge areas is mixed with lateral recharge (infiltration recharge from surface water).

1. Introduction

Each karst water system has its own storage, transport, and regulatory functions and constantly exchanges water with other system components, resulting in changes in water quantity and quality as the entire system interacts with the external environment [1,2,3,4,5,6,7,8,9,10,11,12,13,14].
The hydrochemical characteristics of karst water, as well as the isotope (18O, 2H, and 3H), are direct indicators of spatial variations in water quantity and quality [15,16,17,18,19,20,21,22,23]. The hydrochemistry of karst water is generally focused on the distribution of major ions (K+, Na+, Ca2+, Mg+, HCO3, SO42−, and Cl). 2H and 18O are stable isotopes that are widely used to retrieve information about the sources, areas, and times of karst water recharge. This information is acquired by comparing the isotope composition of karst water with that in global or regional water bodies, indicating the recharge source of karst water. 3H is a natural radioactive isotope of hydrogen with a half-life of 12.32 years. Due to atmospheric nuclear tests in the 1950s and in the early 1960s, the 3H concentration in precipitation increased sharply; it peaked at 1868 TU in 1963 [24] and declined every year until reaching 32 TU in 2001 (from the precipitation monitoring station of IAEA in Shijiazhuang), identifying 3H as a good indicator of whether the recharge sources of karst water formed before or after these nuclear tests (1952). In recent years, a large number of karst water studies have explored the structures, hydrodynamic processes, and hydrochemical evolution patterns of karst water systems based on analyses and measurements of major ions and isotopes (18O, 2H, and 3H), especially in the karst water areas of northern China [25,26,27,28,29,30,31,32,33,34,35,36,37,38,39].
In this case study, a hydrogeological survey, with a scale of 1/50,000, was carried out in the Pingyi–Feixian region at central Shandong Province, China. The aim of this study was to reveal the spatial distribution characteristics of major ions and isotopes (18O, 2H, and 3H) to provide insight into the hydrochemical evolution patterns of the karst water system.

2. Hydrogeological Setting of Karst Water in the Study Region

2.1. Geological Setting

The Pingyi–Feixian karst region in the central zone of Shandong Province, China, is situated at 117°30′–118°00′ E and 35°10′–35°30′00″ N, and it covers 596 km2. According to monitoring data from the Feixian and the Pingyi meteorological stations, in Shandong Province from 1971 to 2013 the annual mean precipitation in the area is 798 mm and the annual mean evapotranspiration is 1536 mm. The precipitation from June to August accounts for approximately 65% of the annual precipitation. As shown in Figure 1, the region is characterized by hilly landforms, with a surface elevation of 100–500 m, and the strata generally dip toward the north and east, which is consistent with the topography.
The region has the following karstic formations composed of thick carbonate rocks: (1) the Mantou Formation (∈2m) of the Changqing Group; (2) the Gushan Formation (∈3–4g), the Zhangxia Formation (∈3z), the Chaomidian Formation (∈4O1c), and the a, b, and c sections of the Sanshanzi Formation (O1sa, O1sb, and O1sc) of the Jiulong Group; and (3) the Dong Huangshan Formation (O2d), Bei’anzhuang Formation (O2b), Tuyu Formation (O2t), Wuyangshan Formation (O2w), Gezhuang Formation (O2g), and Badou Formation (O2–3b) of the Majiagou Group. Moreover, the region is covered by Quaternary deposits on both banks of the Junhe River, Zhutian River, and Wenliang River and in near low-lying valleys. Strata of Neogene, Cretaceous, and Carboniferous are distributed sporadically in the relatively flat zone in the northern part of the study area. Intrusive rocks and metamorphic rocks are mainly distributed in the low mountainous zones in the middle and southern regions of the study area. There are a series of fault structures in the southeast direction and four deep faults in the north and south directions.

2.2. Hydrogeological Characteristics of Karst Aquifers

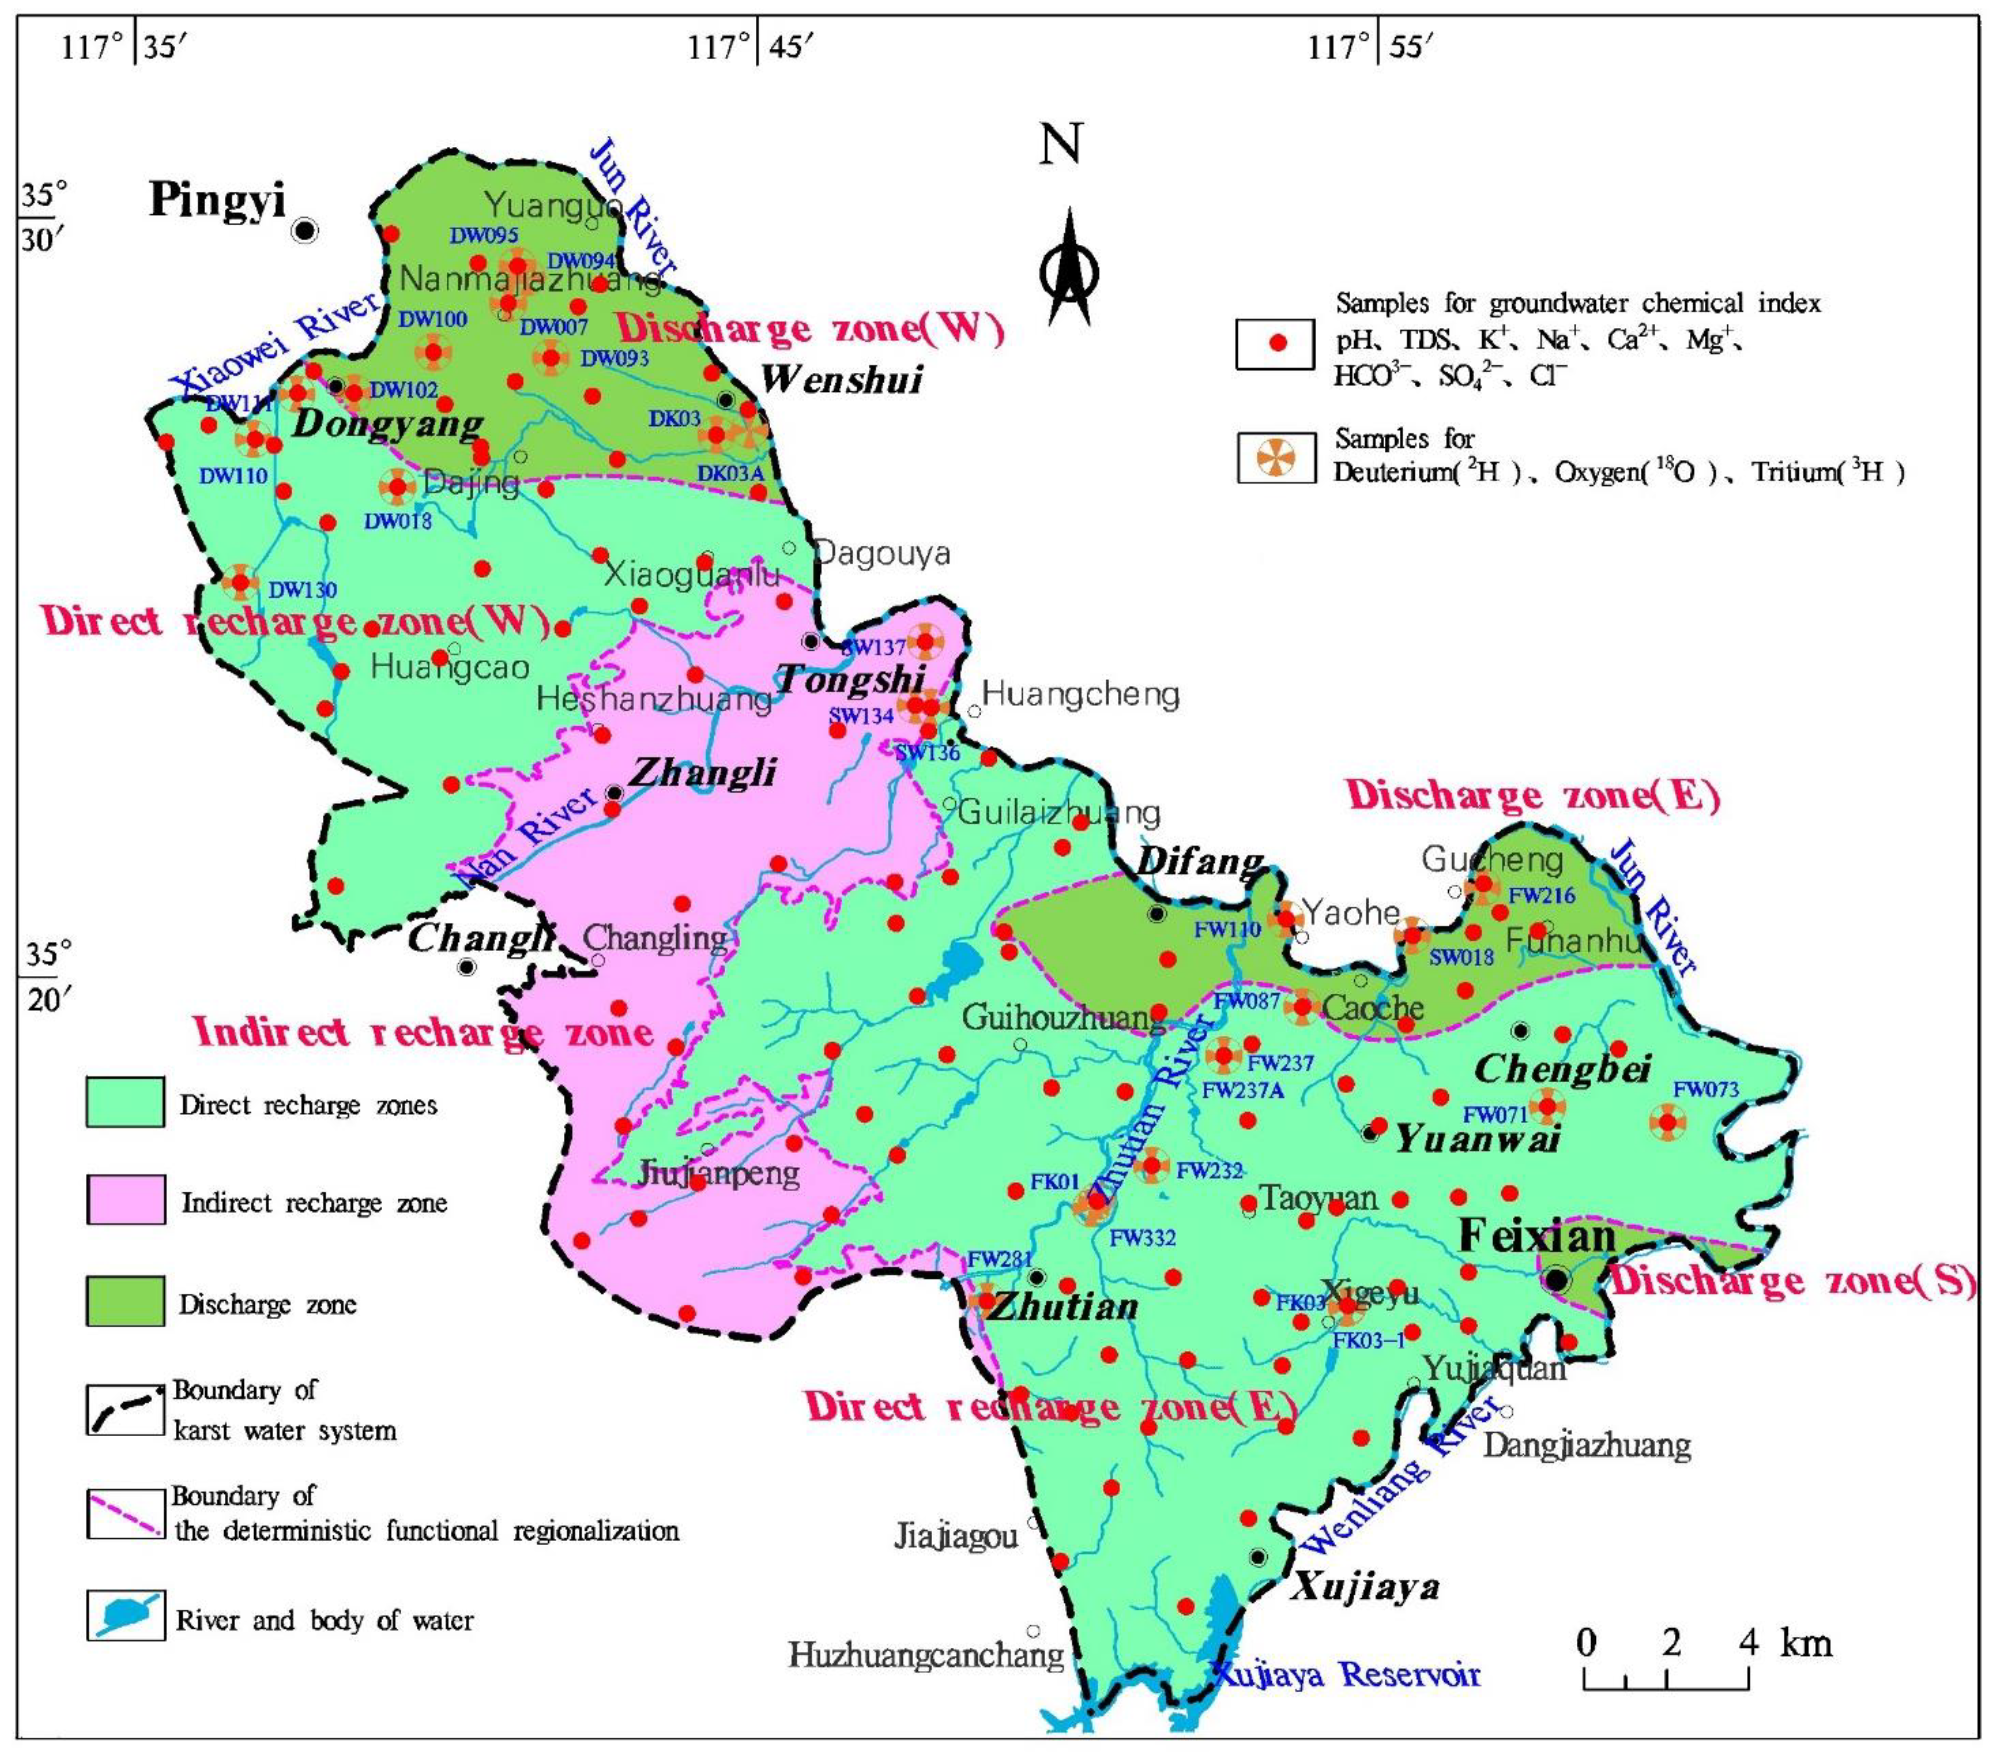
Combining the previous research and the findings of this study, the karst region was divided into six zones according to hydrogeological conditions (Figure 2): two direct recharge zones, one indirect recharge zone, and three discharge zones [40].
The direct recharge zones consist of zones W and E, which are situated in the Changli–Dongyang area of Pingyi County and the Zhutian–Yuanwai area of Feixian County, respectively. The karst landscape is characterized by clustered hill valleys with hilly and low-mountain terrain in which seasonal rivers are distributed in a plumose pattern. The strata lithology is mainly limestone and dolomite intercalated with shale ranging from the Mantou Formation of the Changqing Group to the Sanshan Formation of the Jiulong Group. The strata are mostly bare, with a precipitation infiltration coefficient of 0.17–0.21, referring to the ratio of the amount of water infiltrated by precipitation to the amount of precipitation in the same period [40]. Surface karst landforms such as karst grooves and crevices are widespread, allowing a large amount of precipitation to directly infiltrate the underground karst water system as recharge.
The indirect recharge zone, which is situated in the Changli–Zhangli–Tongshi area in the middle of the study region, has a hilly and low-mountain terrain. The strata lithology is mainly metamorphic rocks such as gneiss, granite, and diorite porphyrite formed in the Upper Archean, as well as intrusive rocks formed at various stages. Some areas in the zone are partly covered with Cambrian carbonate rocks intercalated with mud shale. The precipitation infiltration coefficient in this region is 0.05–0.08 [40]. A small amount of precipitation infiltrates as groundwater recharge, forming shallow weathering fissure water, while most precipitation forms surface runoff that enters carbonatite-dominated areas, where the surface water infiltrates the karst aquifer as recharge.
The discharge zones consist of zones W, E, and S, which are situated in the Dongyang–Wenshui area of Pingyi County, the Difang–Chengbei area of Feixian County, and the urban area of Feixian County, respectively. The landforms are characterized by karst basins with loose surface Quaternary deposits and low-lying valleys. The karst strata are mainly limestone, dolomite, and argillaceous limestone (occasionally containing gypsum) of the Majiagou Group with well-developed karst crevices, pores, and caves in which the water yield of a single well exceeds 1000 m3/d.

2.3. Exploitation of Karst Water

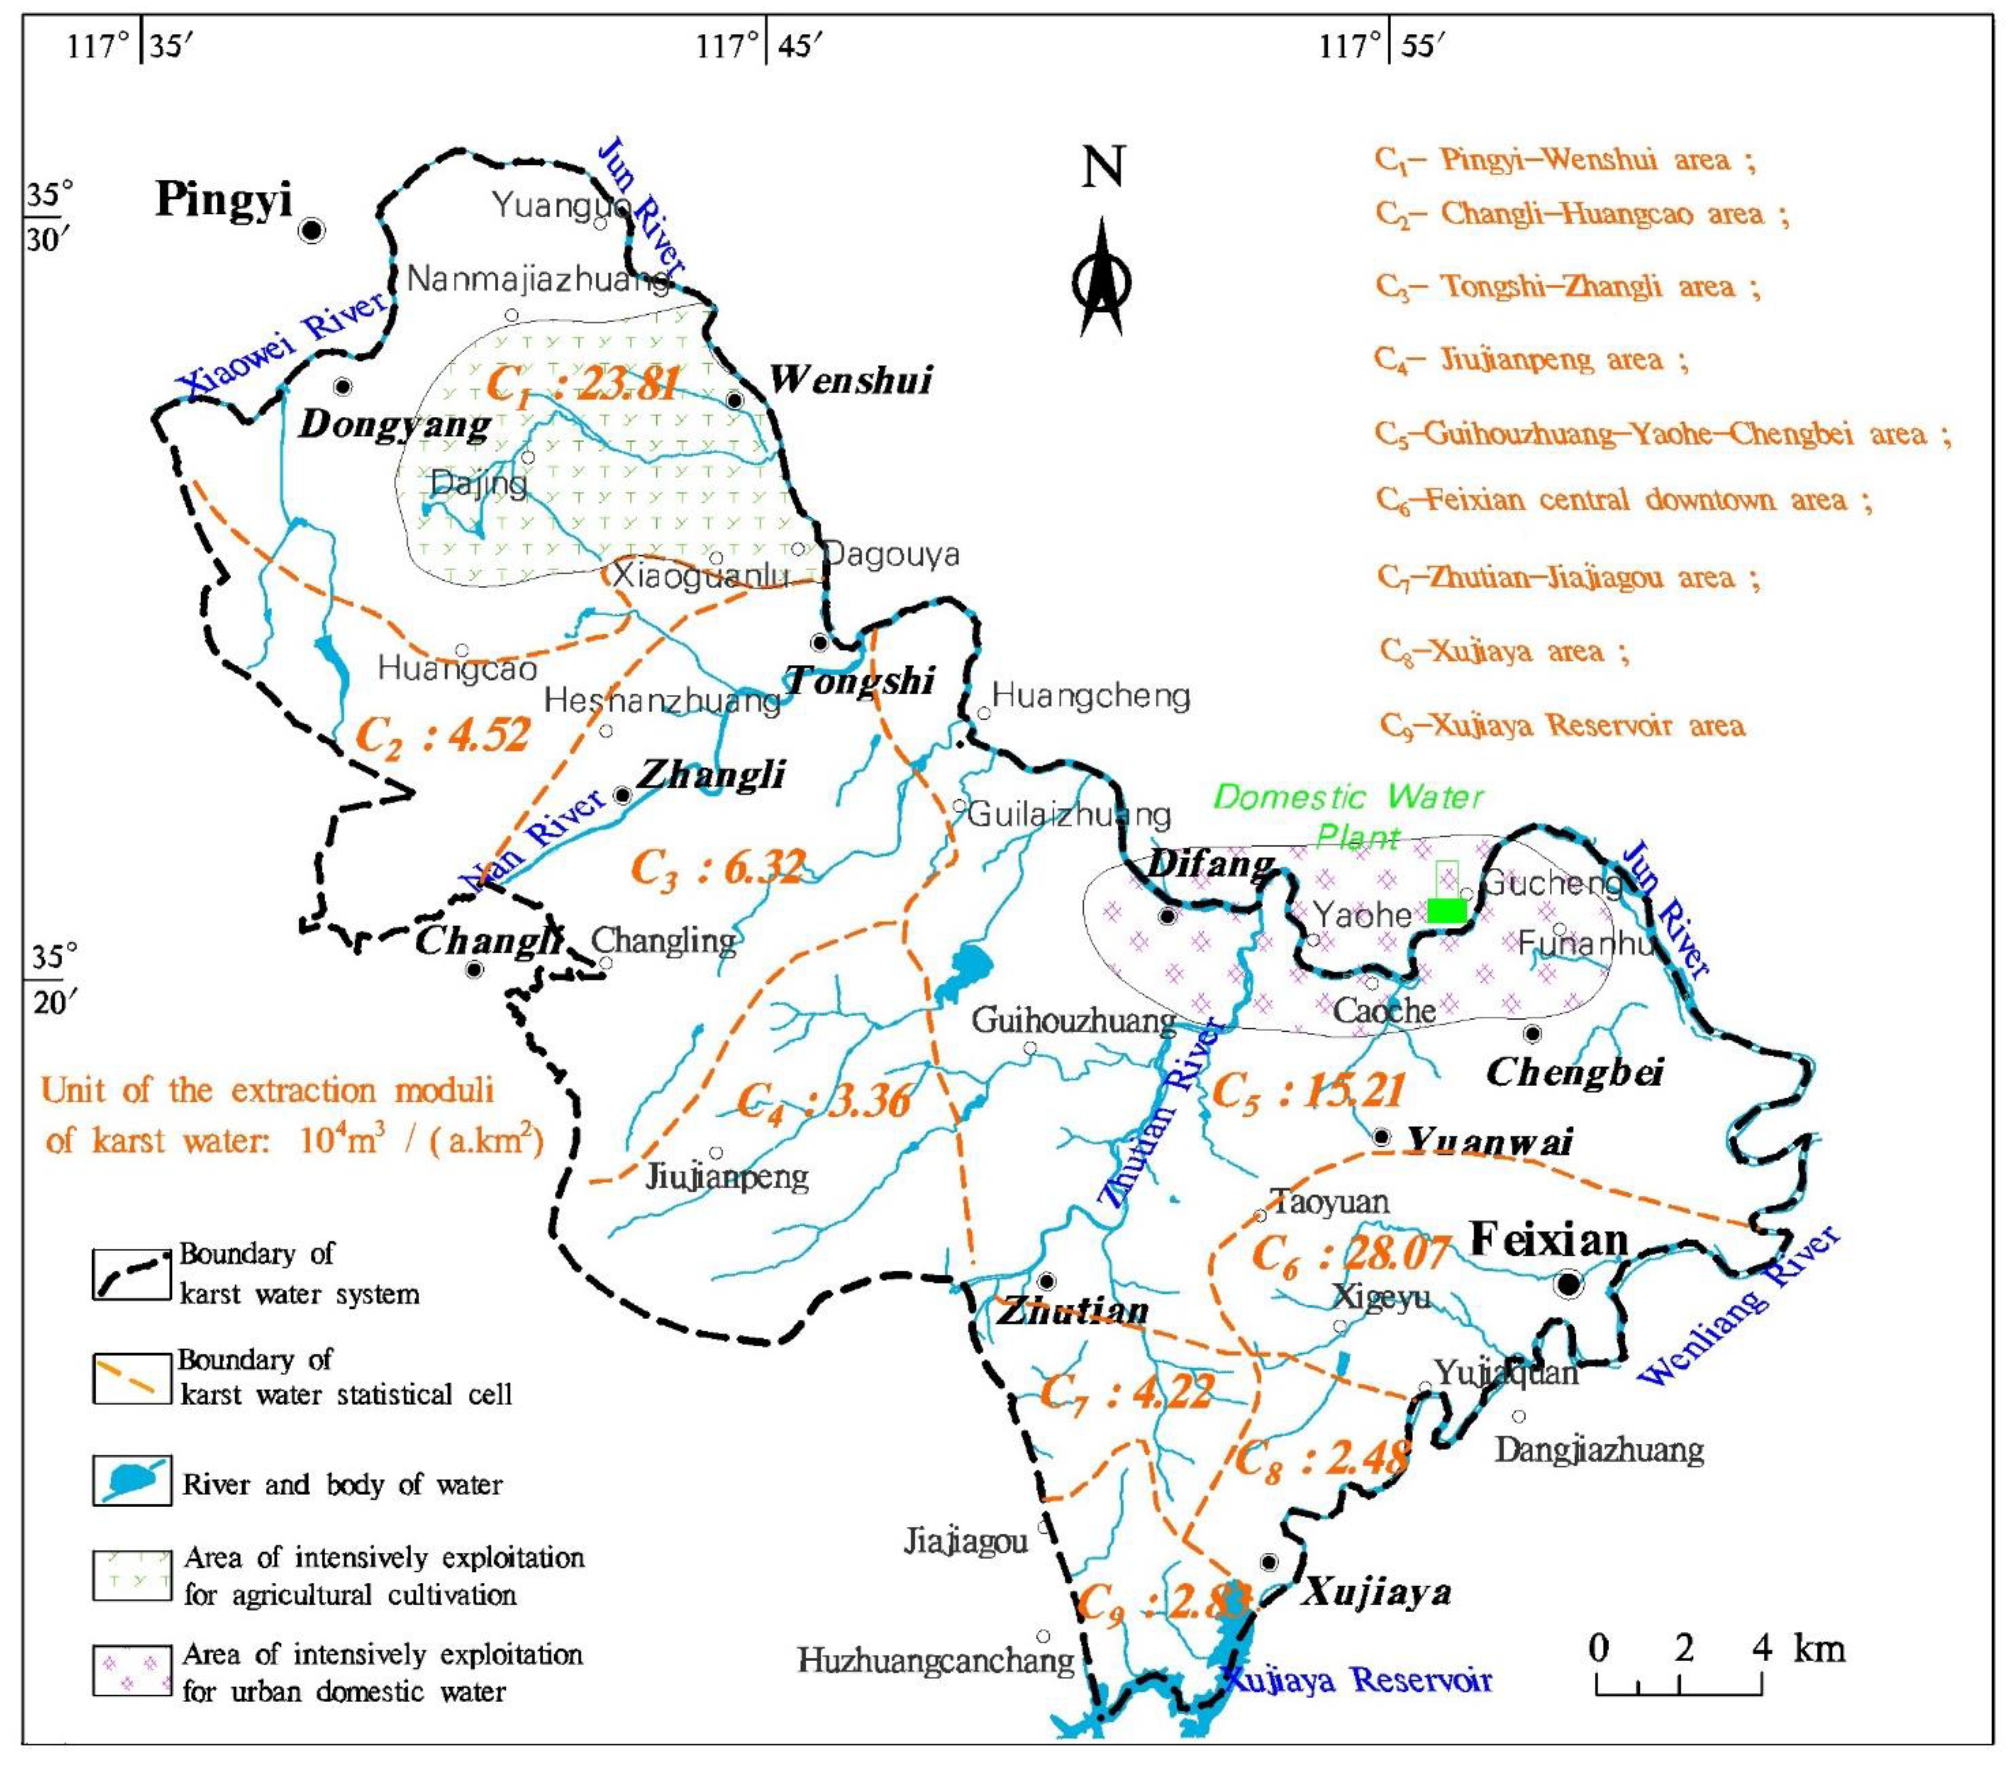
Karst water is mainly used for agricultural irrigation in the Dongyang–Wenshui area of Pingyi County inside zone W and for urban residential consumption in the Difang–Chengbei area of Feixian County inside zone E. It is extracted from motor-pumped wells and the water yield of a single well is generally less than 300 m3/d, although it can reach as high as 2.4 × 10³ m3/d for domestic water plants in Feixian County.
The total exploitation volume of karst water in 2013 and in 2015 was 82.2 million m3 and 108.9 million m3, respectively, increasing by 18.9% to 144.3 million m3 in 2017. In this study, the whole area was divided into nine units (C1–C9) according to hydrological conditions and the extraction modulus (defined as the volume of karst water extracted per km2 and year) was calculated for each unit. As shown in Figure 3, the extraction moduli of karst water in the units ranged from 2.48 × 10⁴ m3/(a·km2) to 28.07 × 10⁴ m3/(a·km2) in 2017. Notably, the extraction modulus exceeded 20 × 104 m3/(a·km2) in both the Wenshui unit (C1) of Pingyi County and the Feixian County unit (C6), where artificial extraction is relatively concentrated, followed by 15.21 × 10⁴ m3/(a·km2) in C1 and less than 10 × 104 m3/(a·km2) in other units.

3. Materials and Methods

In this study, 78 karst water samples were collected in the direct recharge zones: 22 karst water samples in the indirect recharge zone and 32 karst water samples in the discharge zones (Figure 4). The sampling period for 28 typical samples of major ions (K+, Na+, Ca2+, Mg2+, HCO3, SO42−, and Cl) and isotopes (18O, 2H and 3H) was October–November 2013. The sampling depth was 0–370 m in boreholes (Table 1). The sampling sites were selected so the upstream–downstream relationship of karst water in the region would be revealed by subsequent analyses.
During sampling and testing of the karst water, three samples were collected at each sampling site, placed in airtight 1.0 L polyethylene plastic bottles without head space, and stored. 18O,2H and 3H isotope measurements were conducted at the Institute of Hydrogeology and Environmental Geology, Chinese Academy of Geological Sciences.
The detection of major ions in water adopted the standardized method of China’s geology and mineral industry. Flame emission spectrometry was used to determine K+ and Na+, ethylenediamine tetraacetic acid disodium titration was used for Ca2+ and Mg2+, argentometric titration for Cl, Ethylenediamine tetraacetic acid disodium–barium titration for SO42−, and acidimetry acid titration for HCO3. Specifically, water δ18O was measured using the CO2-H2O equilibration method, while water δ2H was determined using the chromium reduction method. The analyses were conducted using a MAT-253 Gas Isotope Ratio Mass Spectrometer with a precision of σ ≤ 0.1‰ and σ ≤ 2‰, respectively. The water concentration of 3H was determined by the electrolytic concentration method using an ultra-low background 1220 Quantulus liquid scintillation spectrometer with a precision of σ ≤ 0.6 TU.

4. Results and Discussion

4.1. Hydrochemical Characteristics of Karst Water

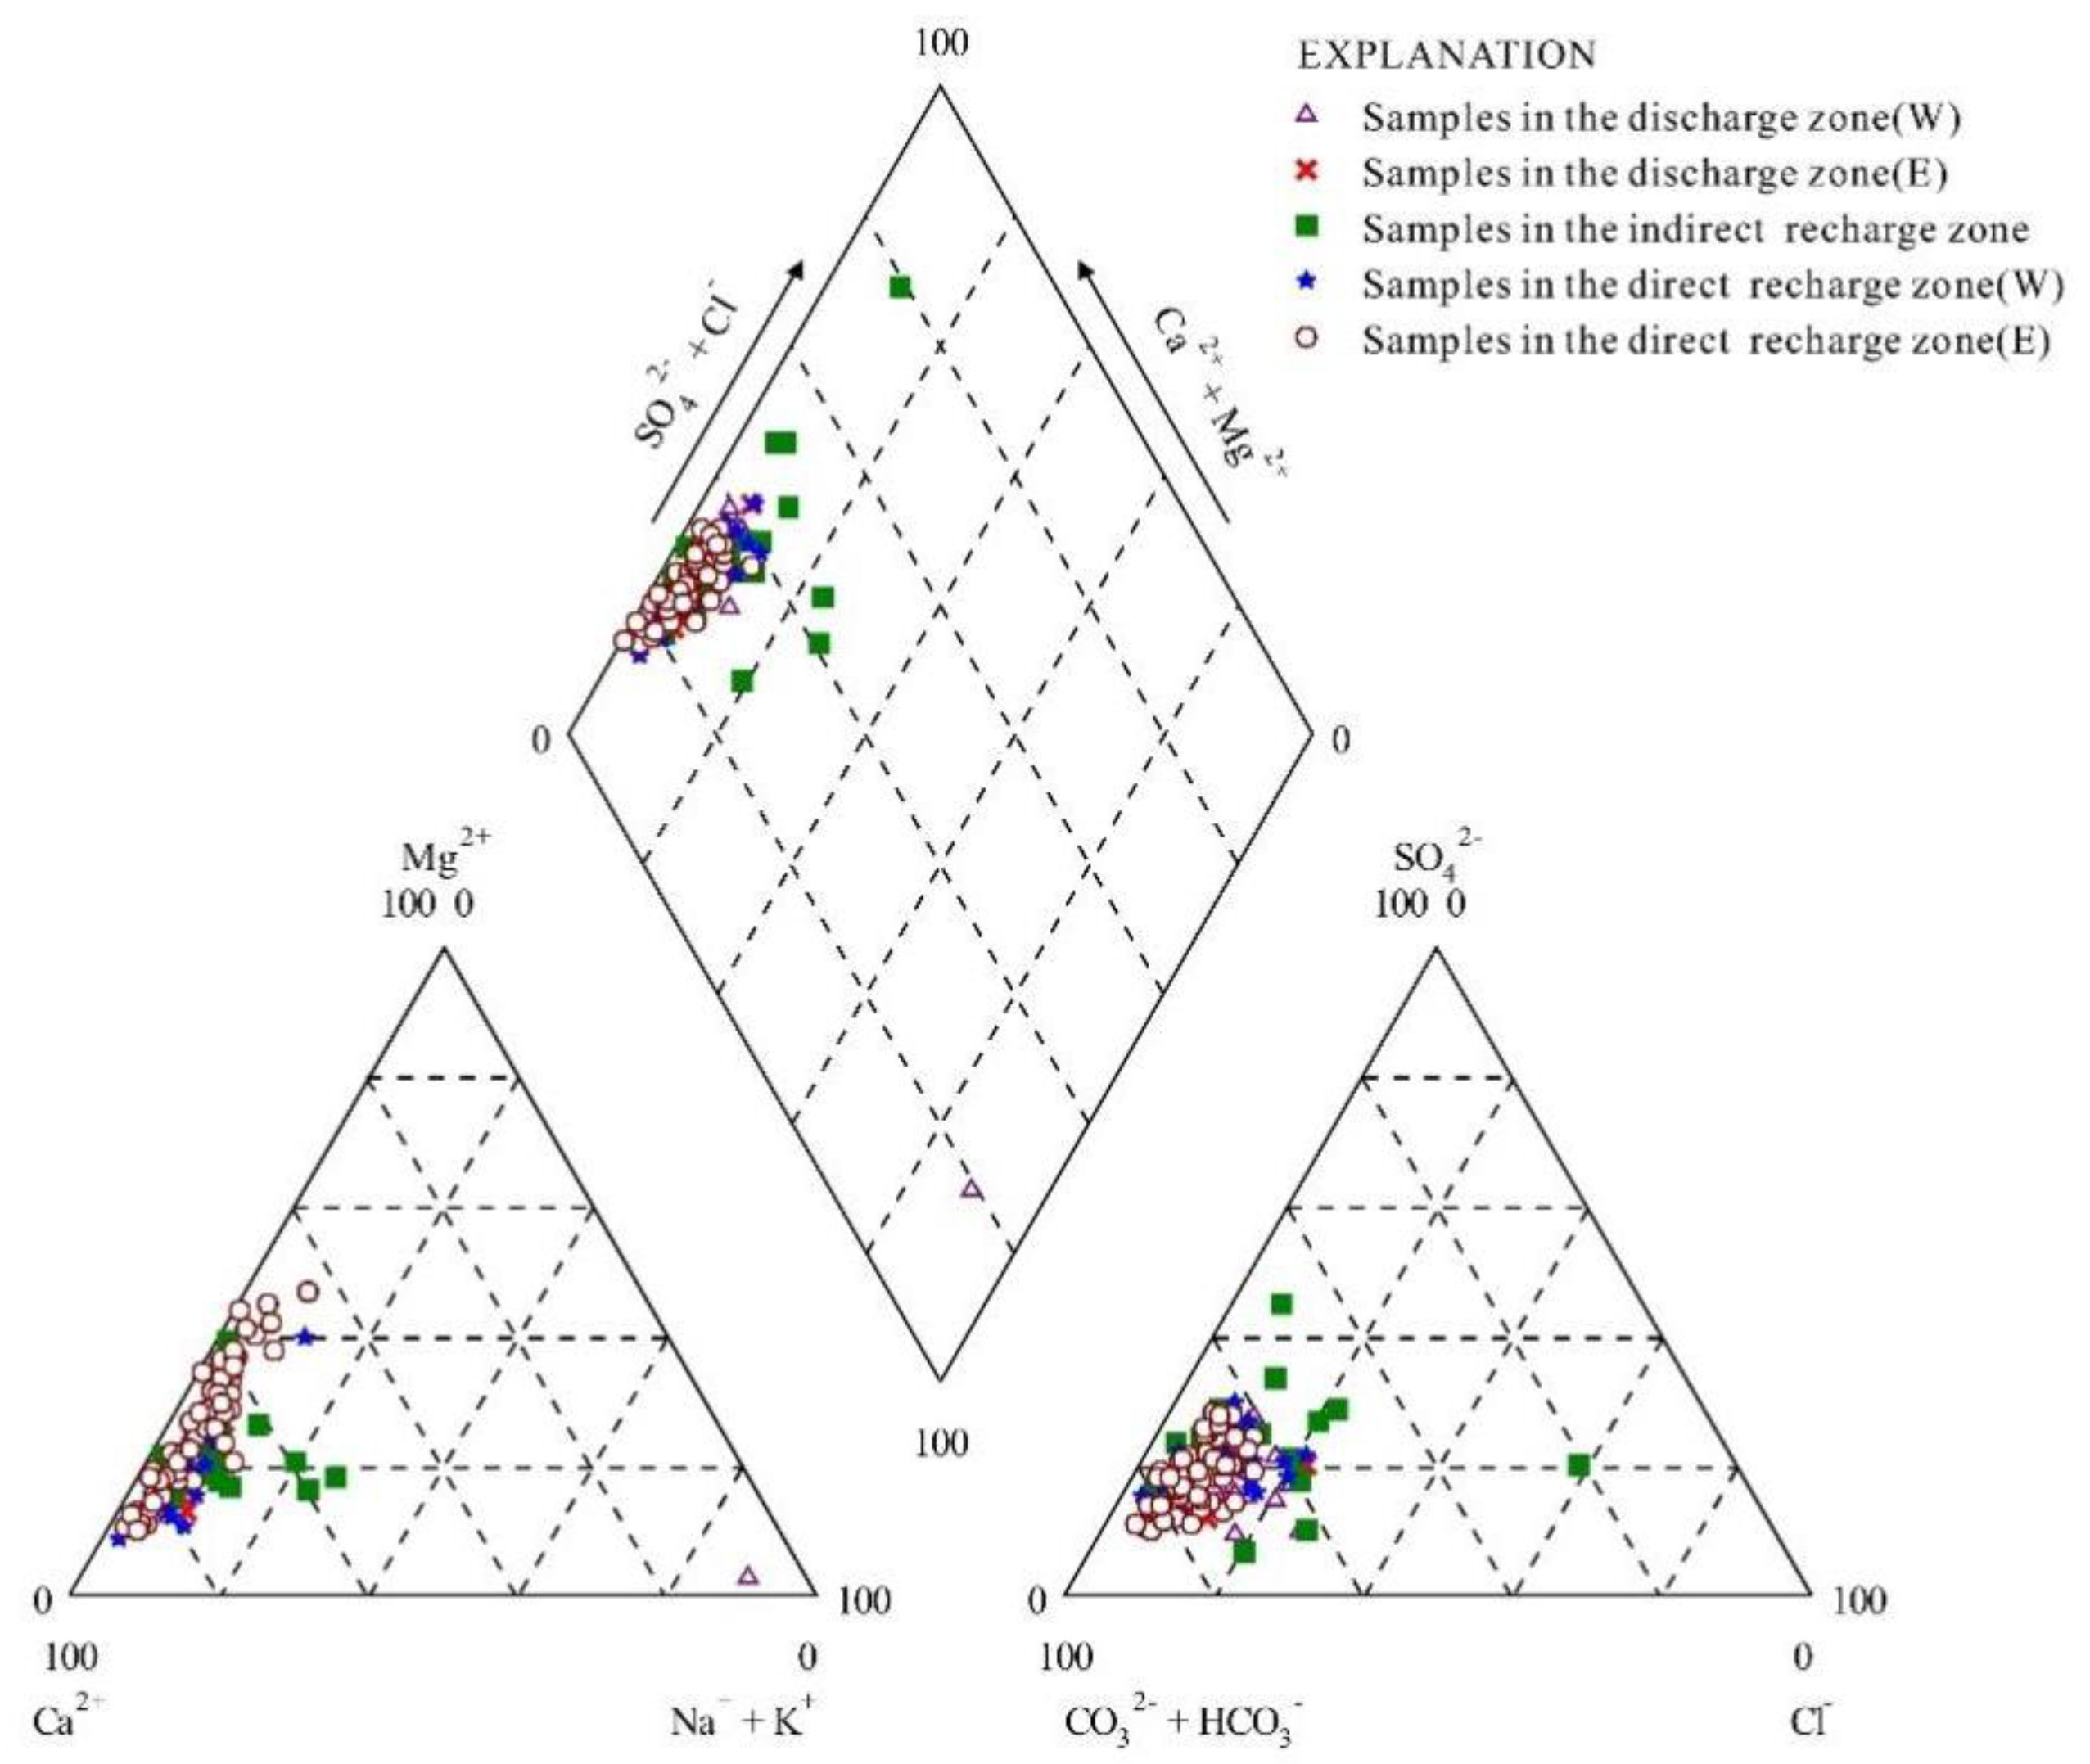
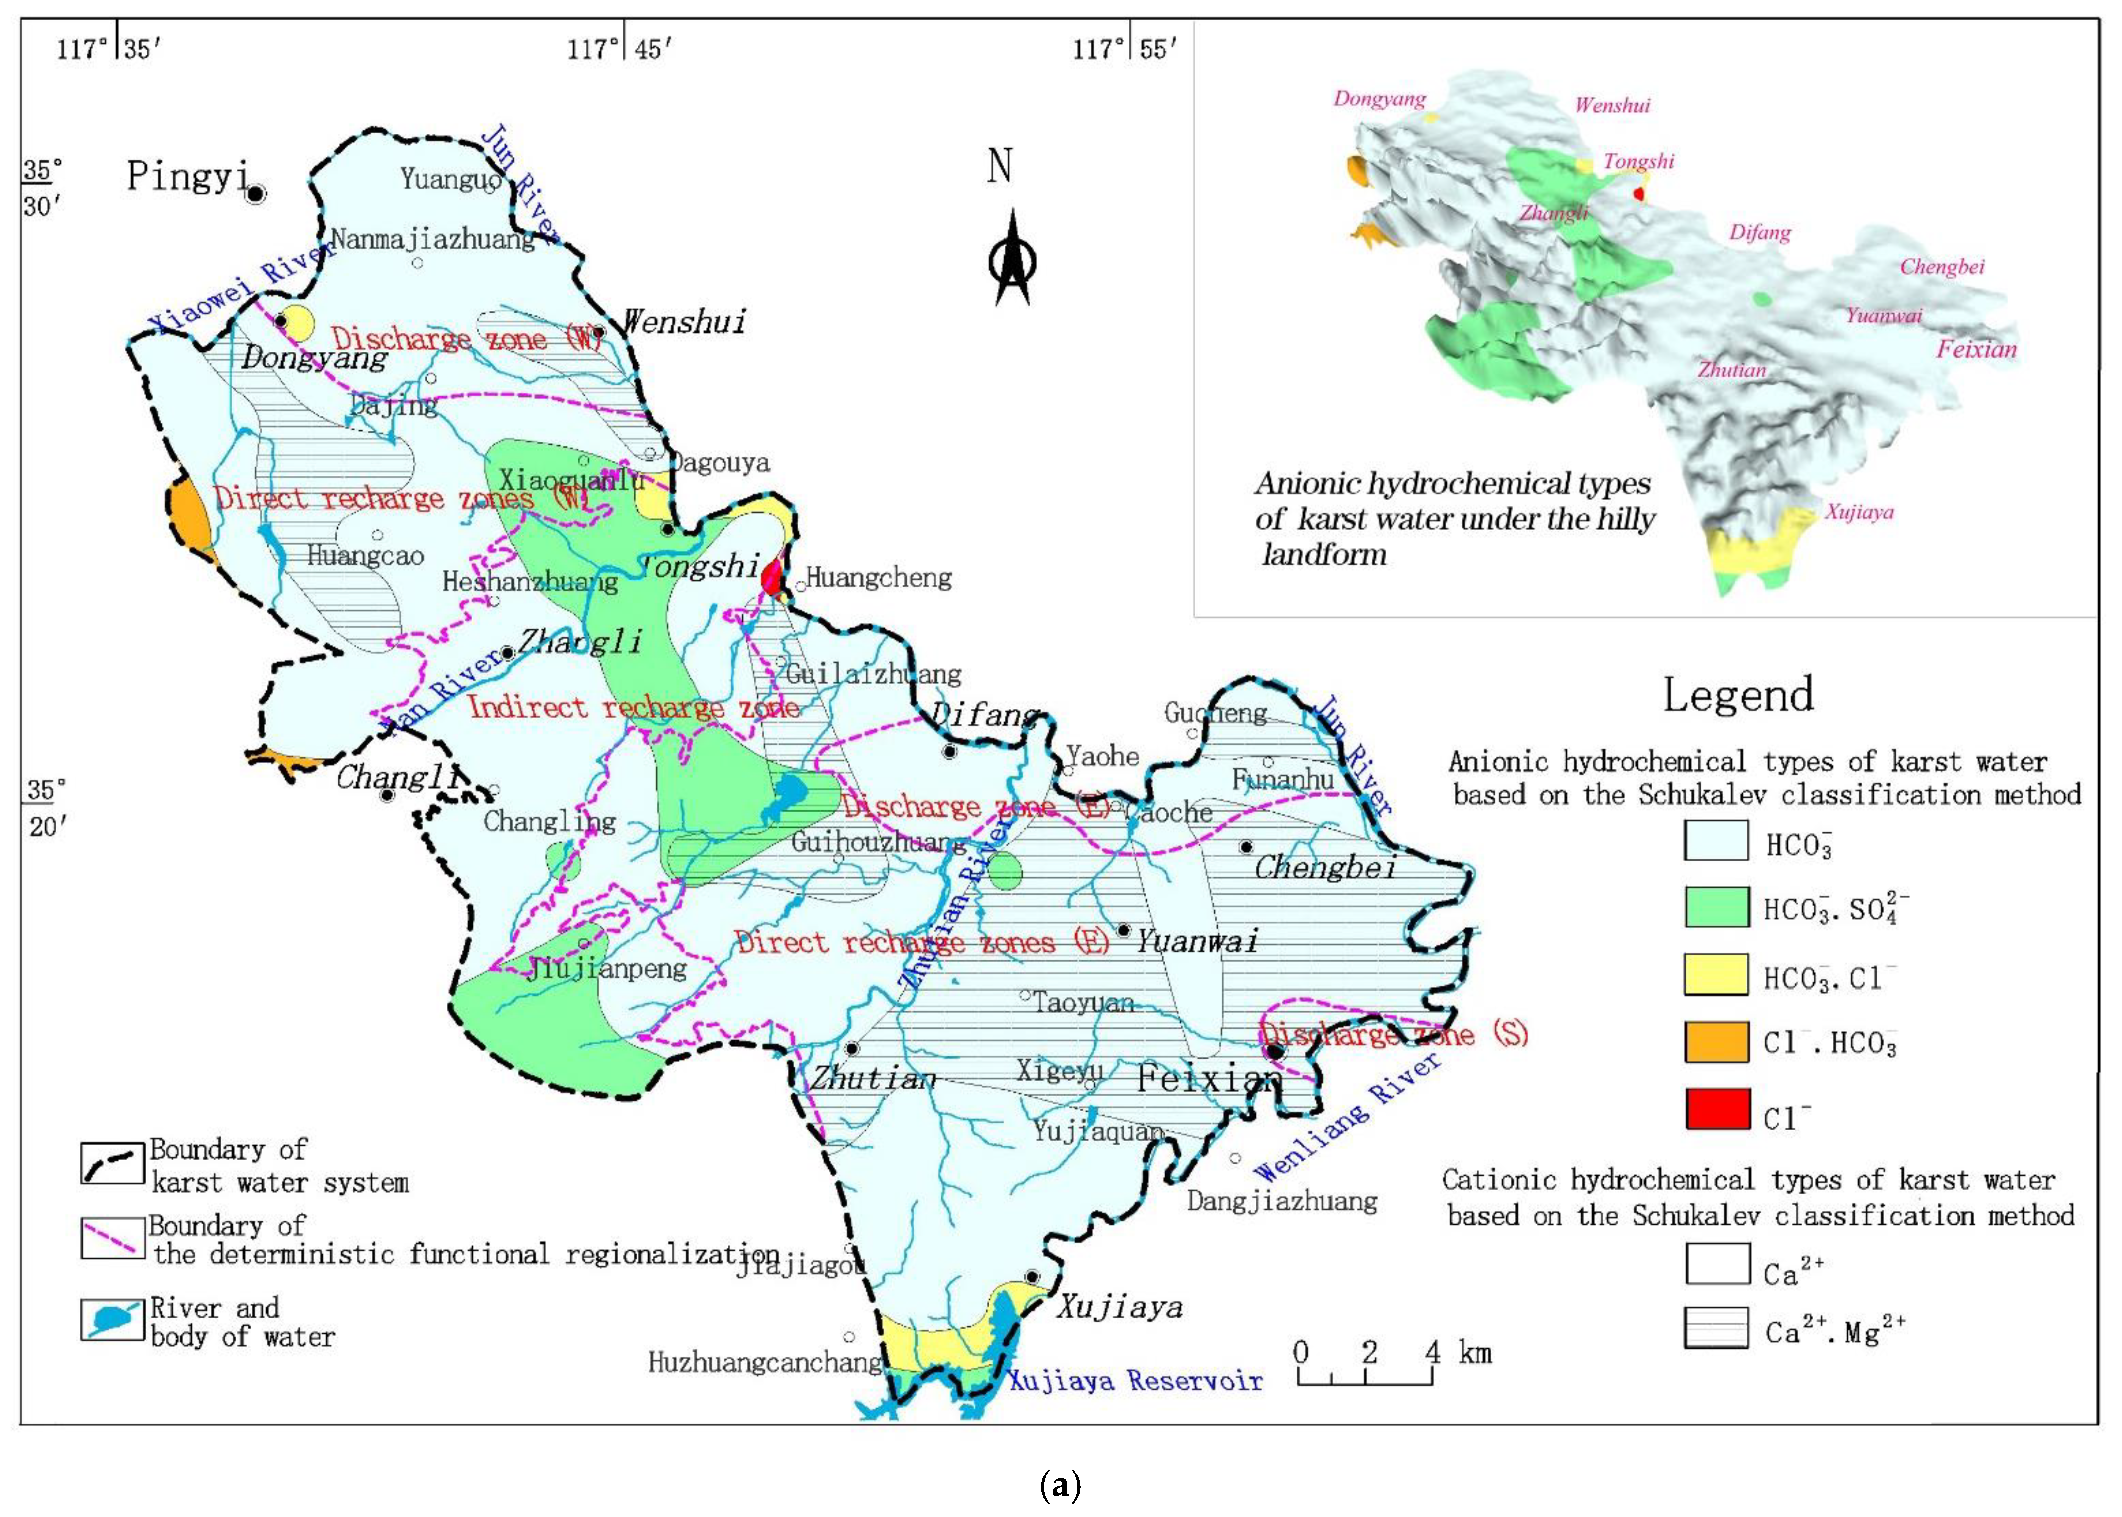
Water samples were subjected to hydrochemical classification based on the values of the major ions (Schukalev classification), as shown in Table 2 and in Figure 5 and Figure 6a,b. Karst water types in the study area included the HCO3-Ca type, HCO3-SO4-Ca type, and HCO3-Ca-Mg type. The water type was found to mainly be HCO3-Ca-type and HCO3-SO4-Ca type in the indirect recharge zone, while the main karst water types in the direct recharge and discharge zones were found to be HCO3-Ca-Mg and HCO3-Ca. Direct recharge zone E and discharge zone E, which are both in the eastern portion of the study region, were found to have a significantly higher proportion of HCO3-Ca·Mg-type karst water than that in western direct recharge zone W and discharge zone W. Among the anions accounting for greater than 25% of the total, HCO3 was found to be widespread in the whole study area, with a combination of HCO3 and SO42− mainly distributed in the central portion, which mainly features exposed metamorphic rocks of gneiss, granite, diorite porphyrite, and intrusive rocks, while Cl was found to be distributed sporadically in low-lying area. Cations were found to have a more obvious distribution pattern in the study region, with karst water abundant in both Ca2+ and Mg2+ primarily distributed in the main flow zones.
The distribution frequencies of TDS in karst water are shown in Figure 6c. The karst water samples of the indirect recharge zone presented TDS levels in the range of 248–1949 mg/L, of which samples with TDS levels of 400–500 and 500–600 mg/L accounted for 32% and 18%, respectively. The direct recharge zones had karst water TDS levels in the range of 323–899 mg/L: 400–500, 500–600, and 600–700 mg/L constituted the major intervals, especially for direct recharge zone E, where such water samples accounted for 35%, 31%, and 28% of the total samples, respectively. The karst water samples of the discharge zones had TDS levels in the range of 278–1059 mg/L, of which samples with TDS levels of 500–600 mg/L and 600–700 mg/L accounted for 49% and 32%, respectively. In particular, samples with TDS levels of 500–600 and 600–700 mg/L accounted for the highest proportions, with 55% and 48% in discharge zones W and E, respectively.

4.2. 2H and 18O Isotope Characteristics of Karst Water

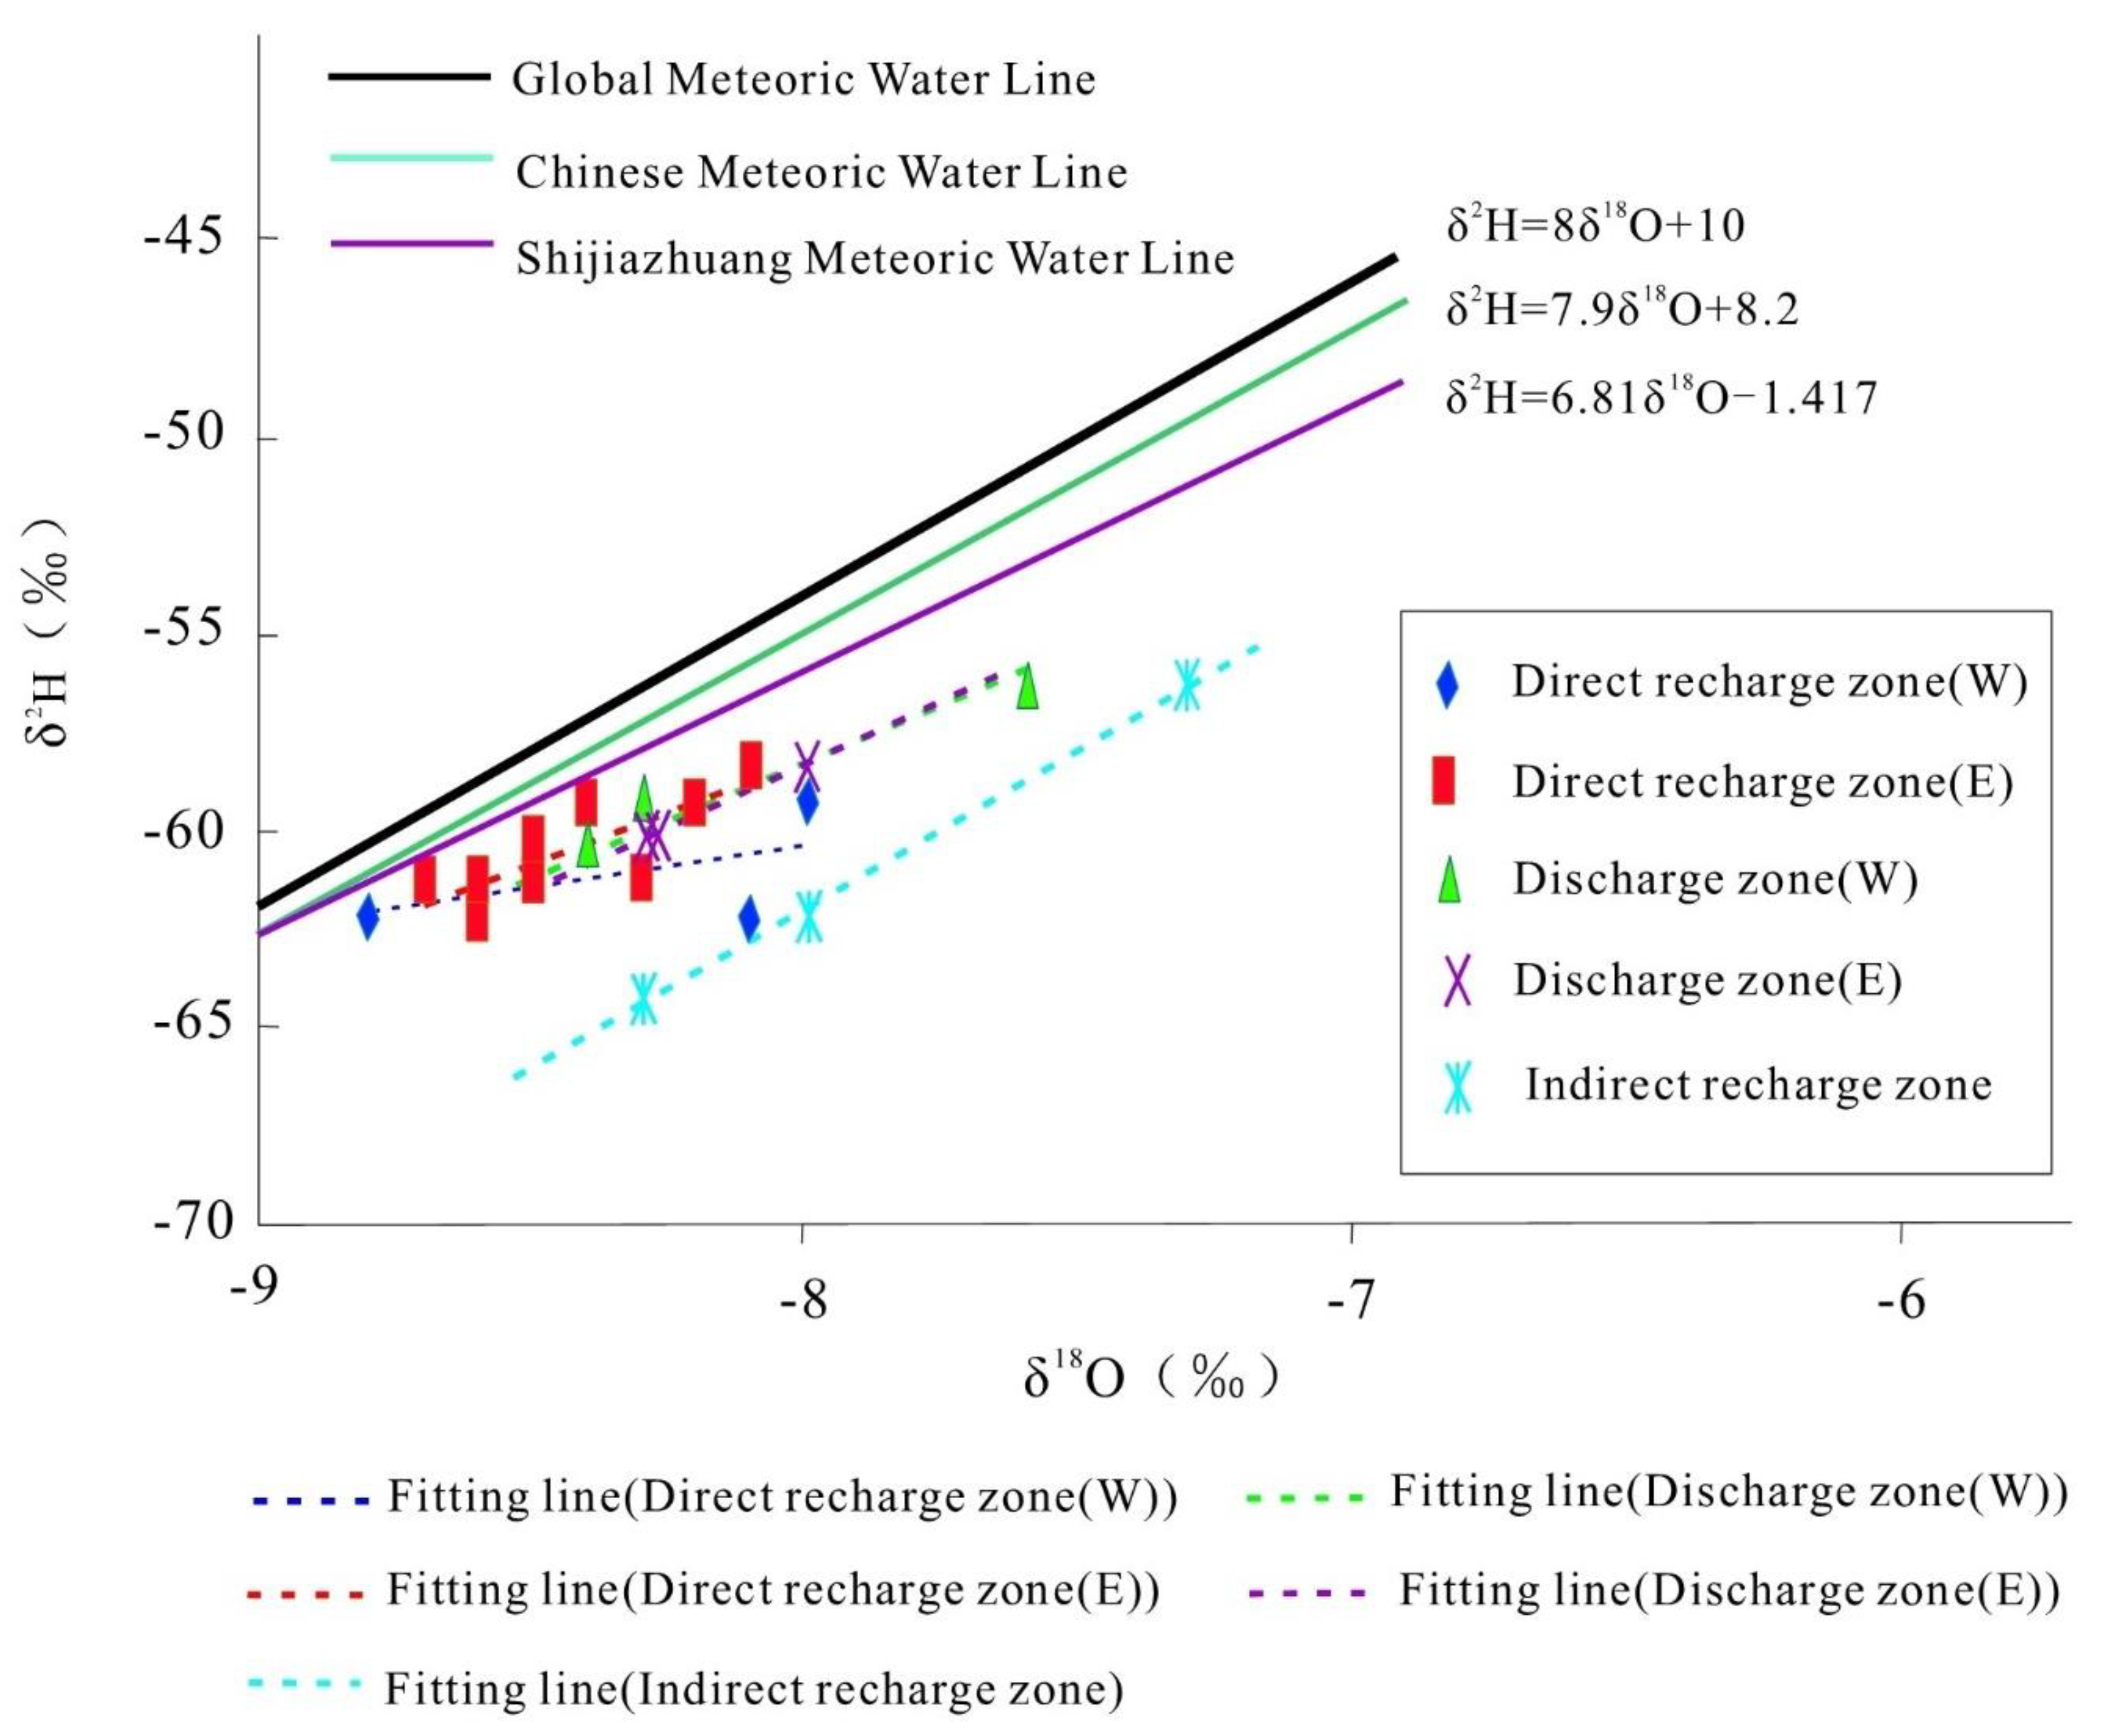
As shown in Table 2, the measured δ2H and δ18O values of karst groundwater ranged, respectively, from −70‰ to −56‰, with an average of −60‰, and from −8.8‰ to −7.3‰, with an average of −8.3‰. As shown in Figure 7, the δ18O and δ2H values of karst water in the entire region were roughly distributed along the meteoric water lines, reflecting that the regional groundwater originated from precipitation. The δ18O-δ2H line of the study region was below the global meteoric water line [41], the China meteoric water line [27], and the meteoric water line of Shijiazhuang (Hebei Province), which is typical of northern China [42] and indicative of a continental effect. Specifically, the karst water in the study region underwent strong evaporation, thereby deviating from the global meteoric water line.
Linear regression of karst water δ2H against karst water δ18O for each zone revealed that the line fitting the indirect recharge zone was most similarly shaped to the meteoric water lines, followed by the lines fitting the discharge zones; while, the lines fitting the direct recharge zones had significantly smaller slopes than the meteoric water lines, reflecting that the water–rock interaction is weakest in the indirect recharge area and that the karst water in the direct recharge area features significant solution filtration in the runoff process, thereby increasing the degree of 18O isotope fractionation in the karst water.
The measured δ18O and δ2H values and the fitting lines for direct recharge zone E coincided well with those of discharge zone E, suggesting good runoff conditions in the two zones and, therefore, rapid karst water recharge. The δ18O values of discharge zone W were greater than those of direct recharge zone W, suggesting the karst water underwent strong evaporation after the recharge of precipitation in this zone in which the main outcrop is composed of limestone and dolomite intercalated with shale from the Mantou Formation of the Changqing Group to the Chaomidian Formation of the Jiulong Group. Moreover, the vadose zone is widely distributed in direct recharge zone W, where the vadose water undergoes evaporation and thus has a higher δ18O than precipitation. Such vadose water provides leakage recharge to deep karst water, thereby increasing the karst water δ18O. The slope of the fitting line of direct recharge zone E was close to the slopes of the meteoric water lines but significantly greater than the slope of direct recharge zone W, indicating a weaker evaporation effect on karst water in direct recharge zone E compared to direct recharge zone W. The δ18O–δ2H fit of discharge zone E coincided with that of discharge zone W, suggesting the karst water of discharge zone E features a similar 18O and 2H isotope composition to that of discharge zone W due to joint recharge from precipitation infiltration and river water leakage.

4.3. 3H Isotope Characteristics of Karst Water

As shown in Table 2, the 3H concentration in precipitation is 12.6 TU, which is significantly higher than that in karst water (by 5.5–12.2 TU), indicating the 3H concentration decreased naturally in the process of precipitation supplying karst water. Moreover, the 3H concentration of the karst water samples was observed to have the following major relationships with the five zones (Figure 8):
(1)
The 3H concentration generally increased with an increase in runoff distance. The lowest concentration was observed at the boundaries of karst watersheds (i.e., sampling sites DW130 and FW071). Sampling sites with 3H concentrations <7.5 TU were found to be mainly located at the front edge of the direct recharge zones (i.e., sampling sites FW281, FW232, FW332, and FK01). Sampling sites with 3H concentrations of 7.5–8.5 TU were located primarily inside the direct recharge zones (i.e., sampling sites FW237A, FW237, FK03-1, and FW087), while sampling sites with 3H concentrations of 9.0–12.5 TU were principally inside the discharge zones and at some near-boundary areas of the direct recharge zones relative to the discharge zones.
(2)
Discharge zones W and E both had significantly lower 3H concentrations distributed in a belt-like pattern. These low-value areas coincided with areas featuring the large-scale artificial extraction of karst water, indicating that karst water extraction induced old karst water that flowed from the aquifer to the extraction areas.
(3)
Changes in 3H concentrations were larger closer to large-scale extraction areas.

4.4. Hydrochemical Evolution of Karst Water

The dissolution of rocks and the precipitation of ions in the karst water during karst water flow determine the concentrations of major ions (Ca2+, Mg2+, HCO3, SO42−, and Cl). However, the 3H in karst water is supplied by precipitation and surface water, and its concentration increases with an increase in cumulative recharge. Together, the dynamics of 3H and major ions represent the hydrodynamic characteristics of karst water.

4.4.1. Dissolution and Precipitation of Carbonate Rocks

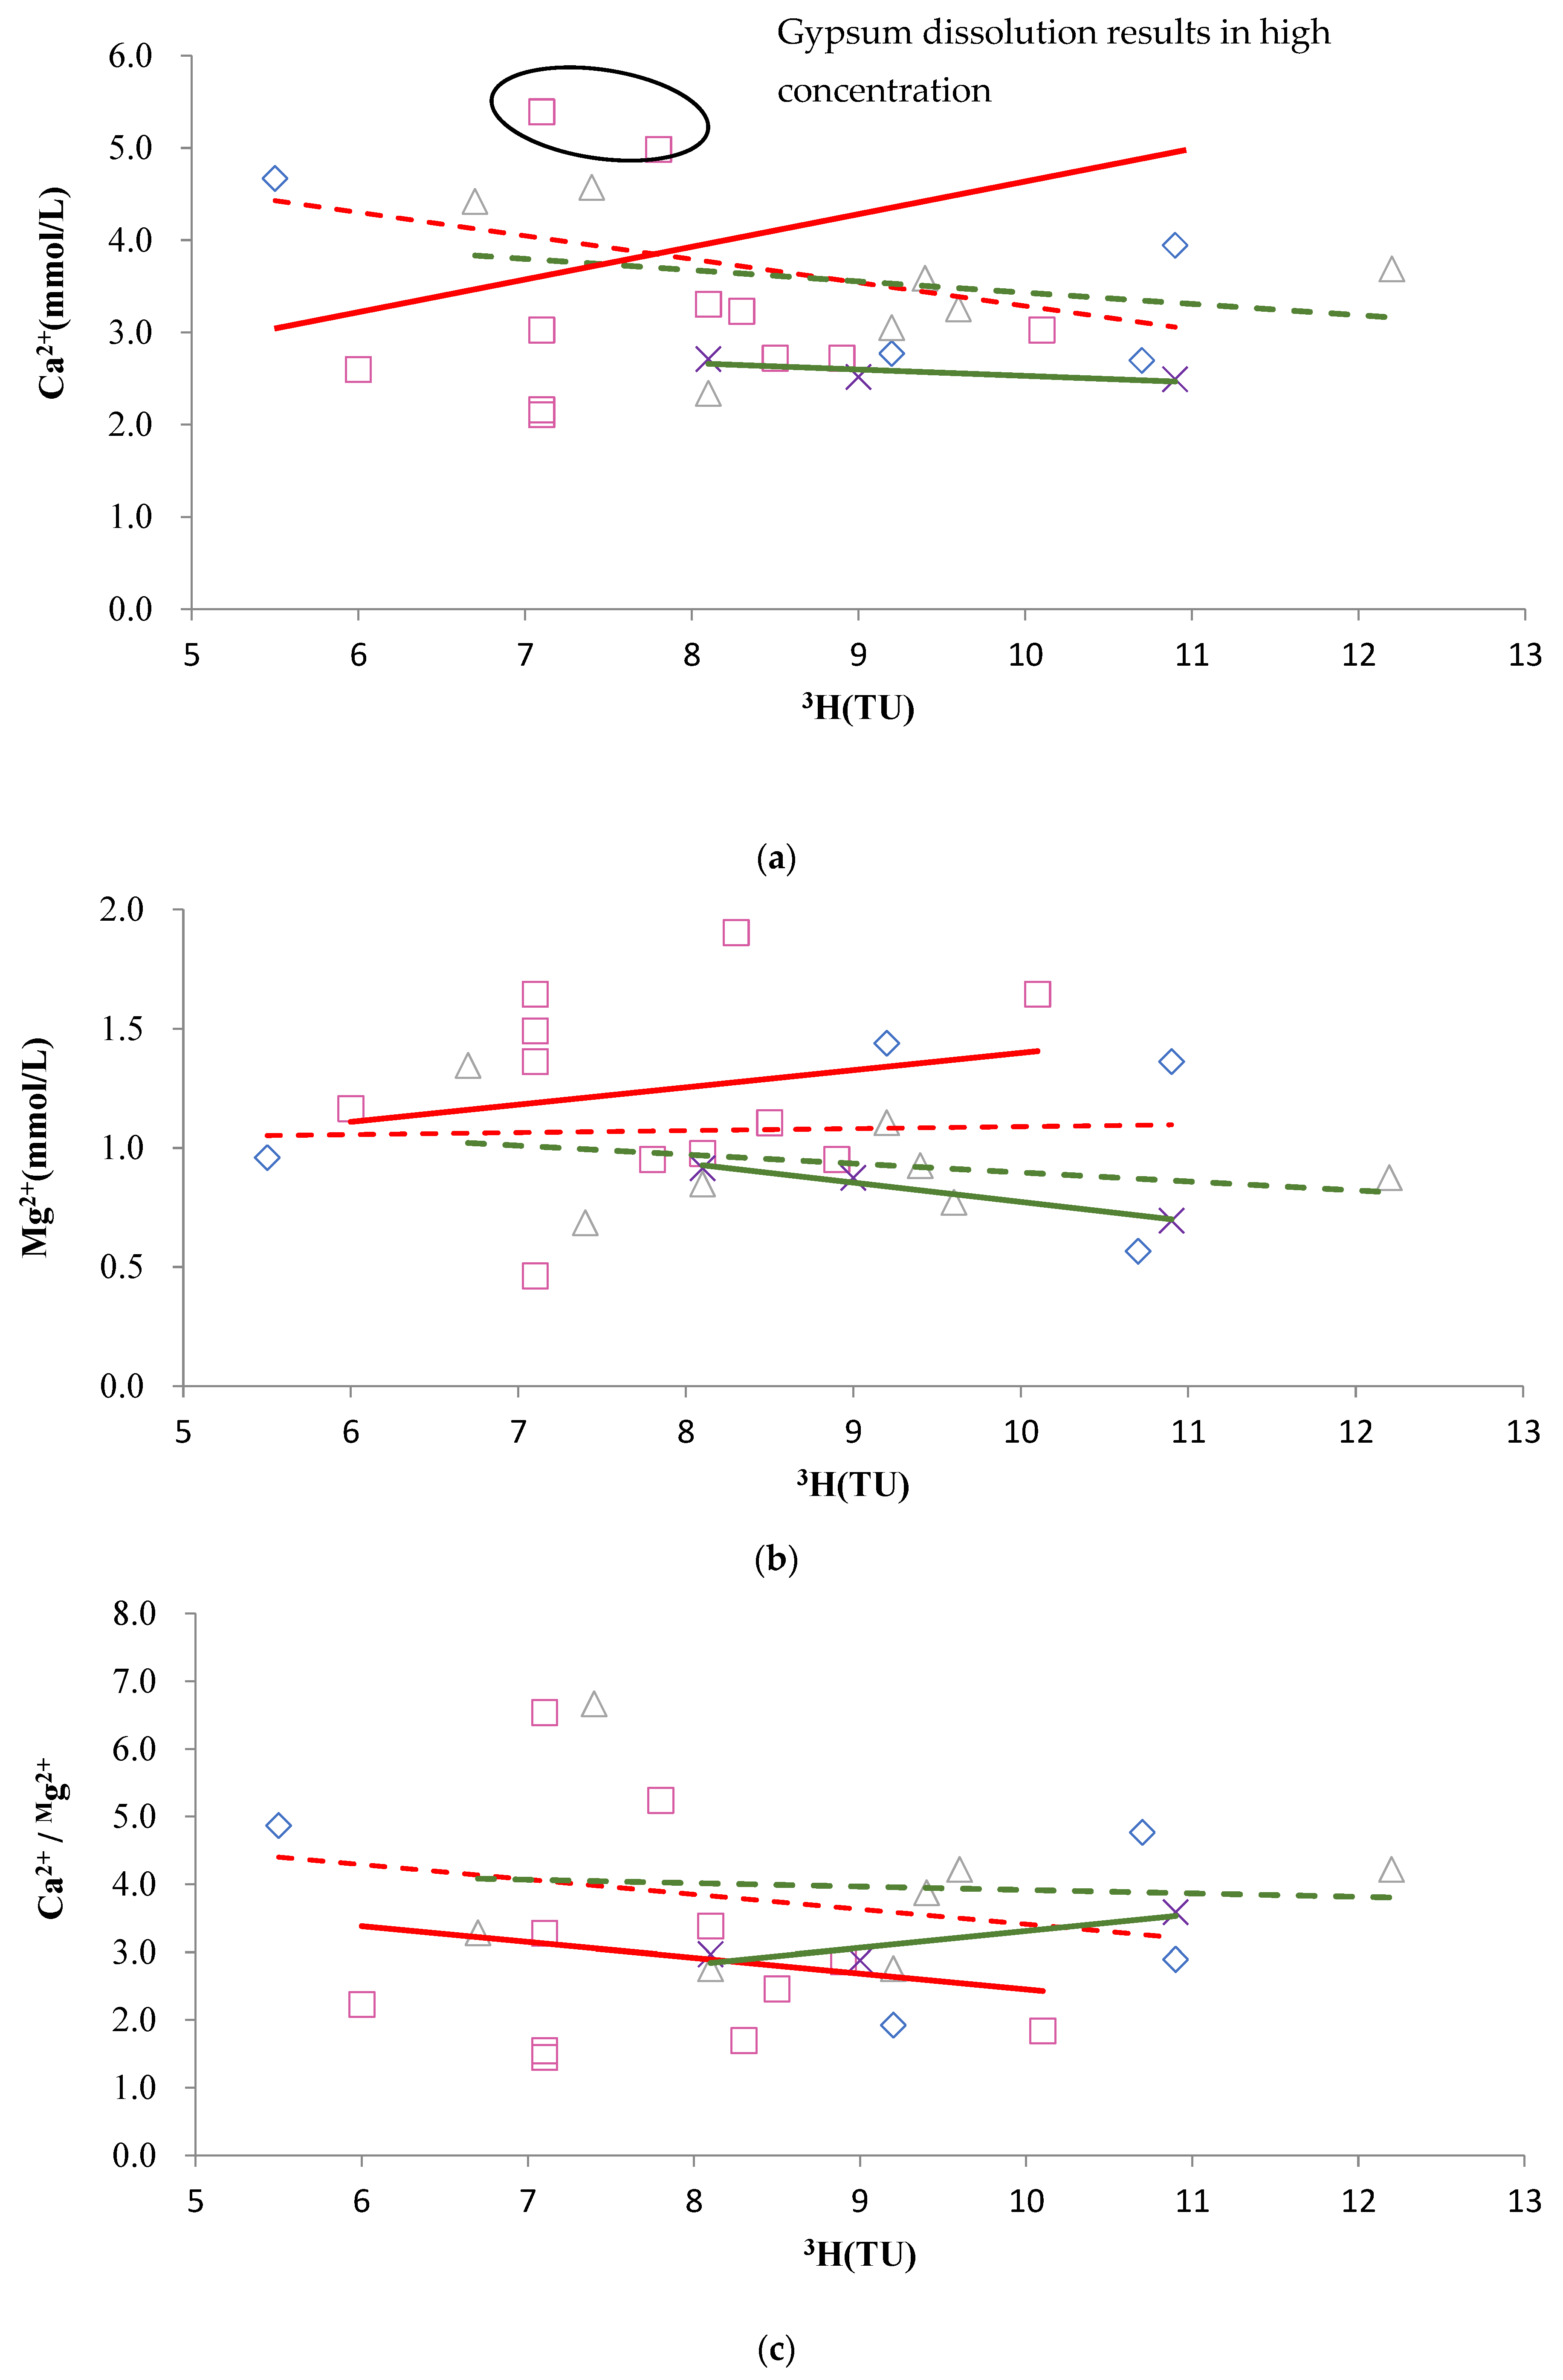
The concentrations of Ca2+, Mg2+, and HCO3 are mainly subject to carbonate rock erosion by CO2-rich karst water and the precipitation process. The relationship between the Ca2+ molar concentration and 3H concentration is shown in Figure 9a. Because of the large amount of surface water infiltration recharge to karst aquifers in direct recharge zone E and discharge zone E of the eastern study region, Ca2+ ions are mostly dissolved during karst water flow. Moreover, sampling sites FW237A and FW332 exhibited significantly higher concentrations of Ca2+ and SO42− relative to the surrounding sampling sites, which suggests that, in addition to the dissolution of carbonate rocks, the two sampling sites were simultaneously influenced by the dissolution of CaSO4 intercalated in the carbonate. However, the Ca2+ molar concentration was negatively correlated with the 3H concentration in direct recharge zone W and discharge zone W, indicating the karst aquifers in these zones were mainly recharged by deep lateral flow from outside the study region, while Ca2+ in the karst water underwent precipitation during the recharge process. The relationship of the Mg2+ molar concentration versus 3H concentration, which is shown in Figure 9b, suggests three different patterns: (1) the intensive dissolution and leaching of Mg2+ from carbonate rocks in direct recharge zone E; (2) the significant dilution of Mg2+ in discharge zone E by a large amount of karst water discharged from upstream; and (3) a relatively stable Mg2+ molar concentration in direct recharge zone W and discharge zone W, where the dilution effect of karst water recharge from surface water infiltration is offset by the dissolution and leaching of Mg2+ from the surrounding rocks.
Changes in the ratio of Ca2+ and Mg2+ molar concentrations (Figure 9c) further confirm that direct recharge zones E and W gradually experience a transition from carbonate mineral dissolution to calcium ions precipitation under the flow of karst water. Specifically, as the free CO2 in karst water is gradually exhausted and the erosivity of karst water is weakened during the interactions of karst water with rocks, calcium ions precipitation gradually increases and the Ca2+/Mg2+ ratio decreases. The positive correlation between Ca2+/Mg2+ and the 3H concentration in discharge zones E and W suggests a large amount of CO2-rich precipitation infiltrates as recharge to karst aquifers, thereby increasing the dissolution of Ca2+.
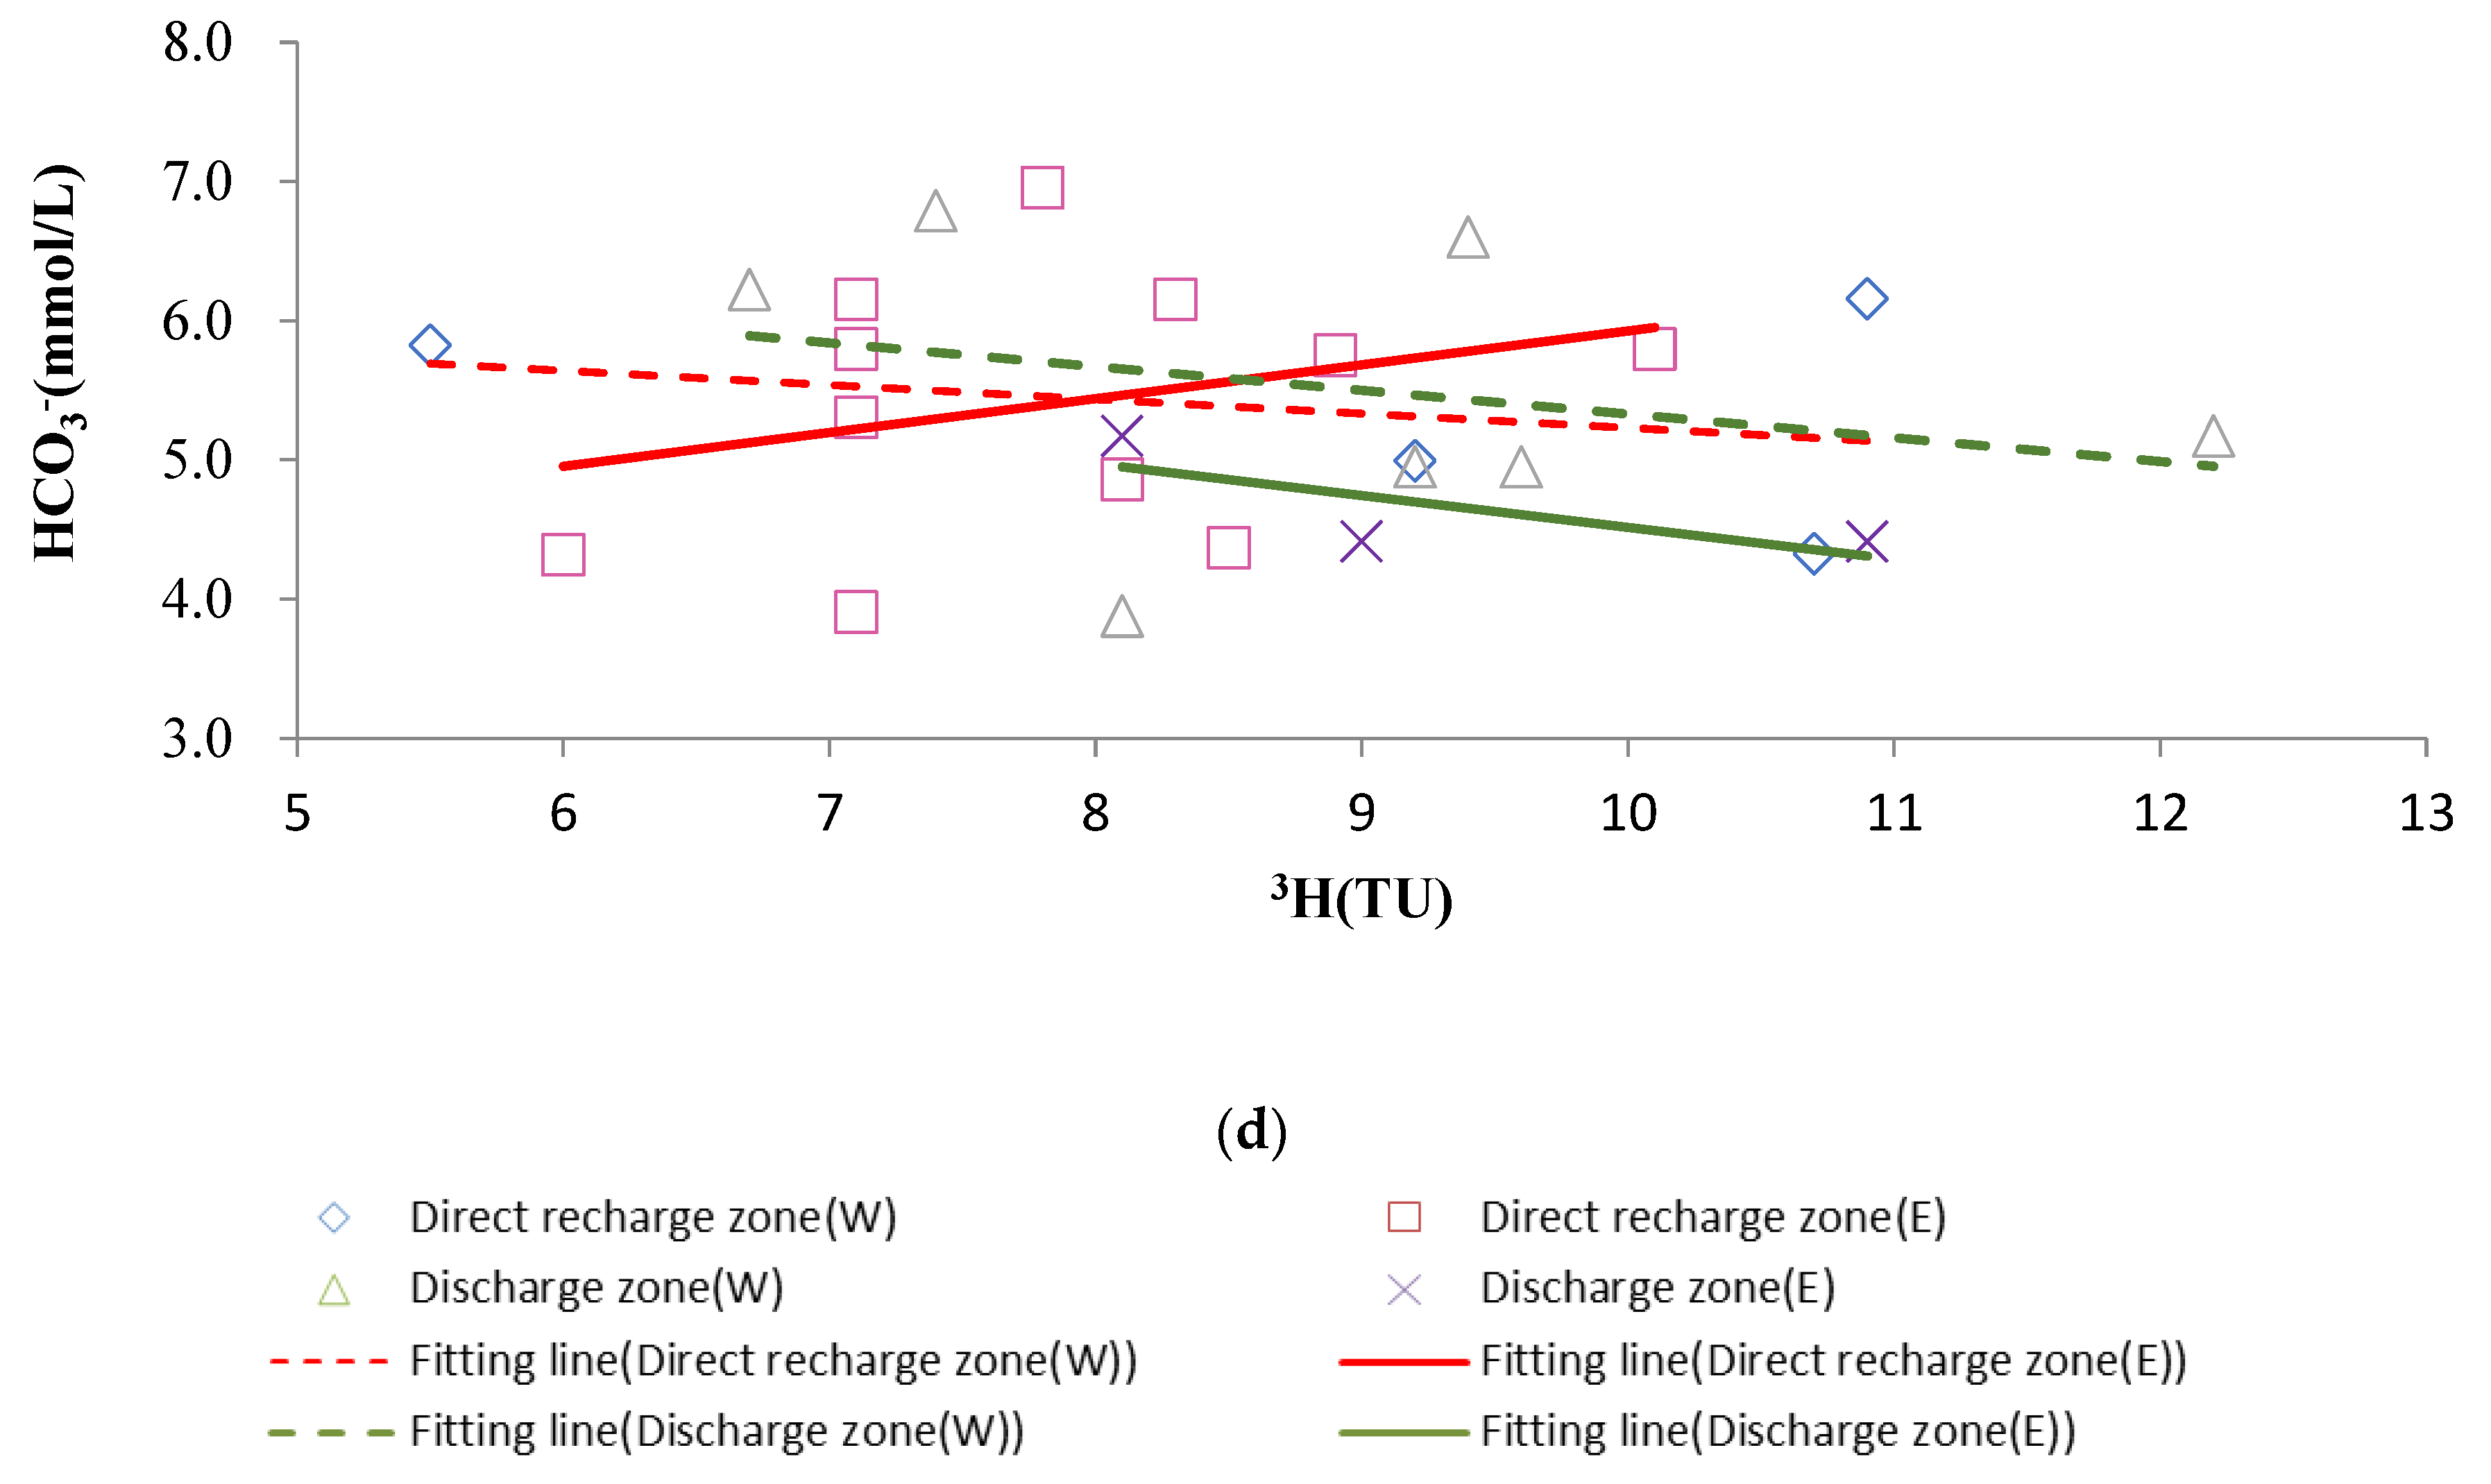
There is a positive correlation between the HCO3 molar concentration and 3H concentration (Figure 9d) in direct recharge zone E, where karst aquifers continue to receive a large amount of surface infiltration recharge as surface runoff flows carrying CO2 and 3H into karst water. In contrast, there is a negative correlation between the HCO3 concentration and 3H concentration in direct recharge zone W and in discharge zones W and E. This result indicates that strong water–rock interactions occur in the lateral runoff of the deep karst aquifers such that the increased HCO3 concentration due to surface infiltration recharge fails to compensate for the consumed HCO3 concentration during lateral flow recharge, thereby decreasing the HCO3 concentration in karst water.

4.4.2. Dissolution of Sulfate Rocks

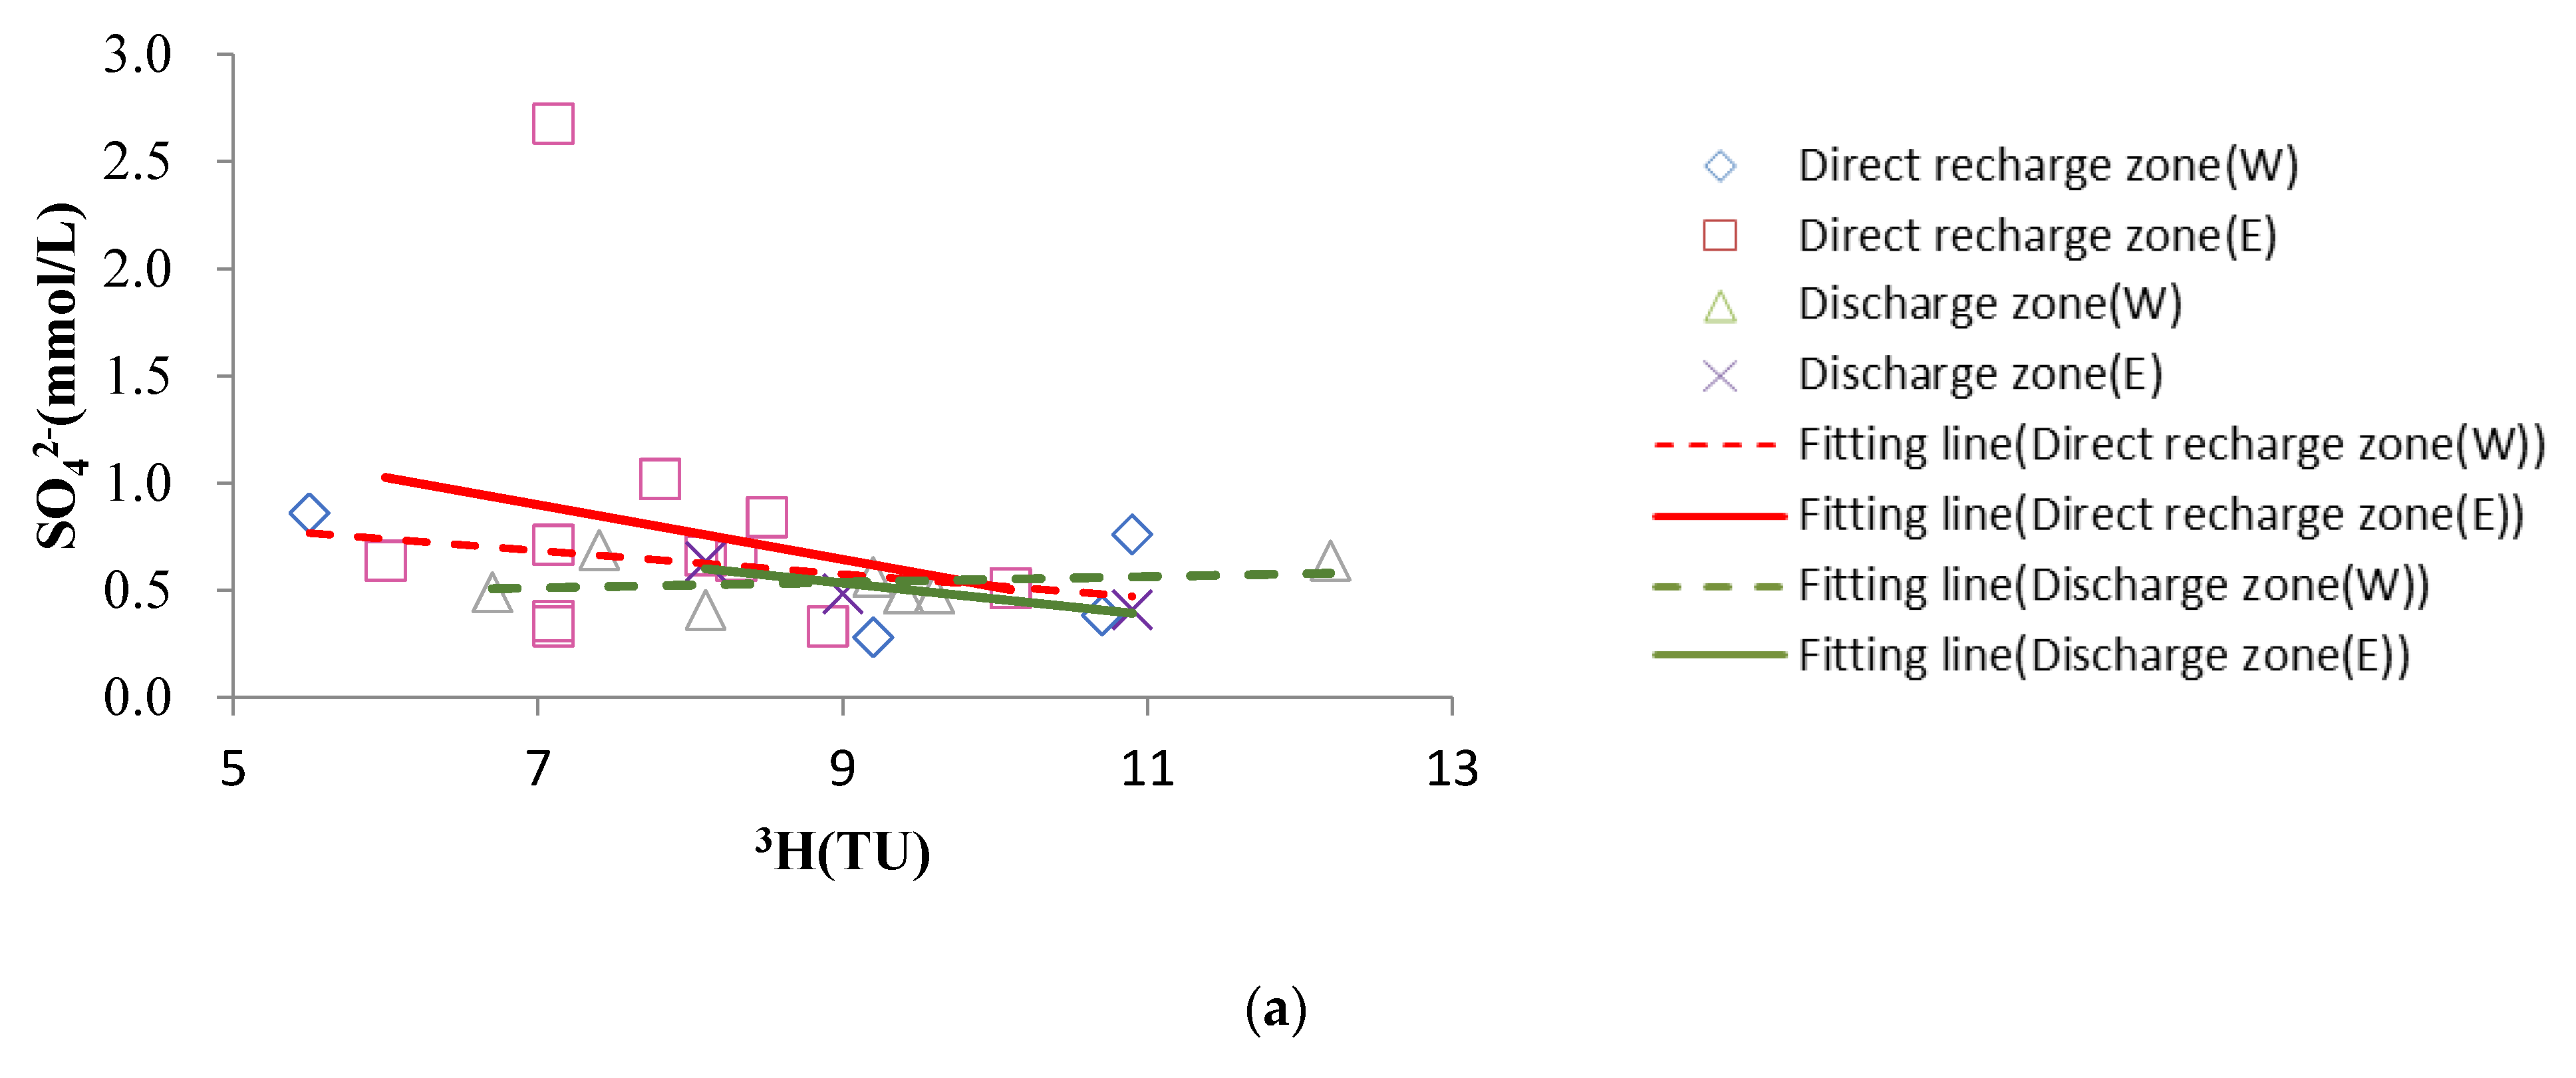
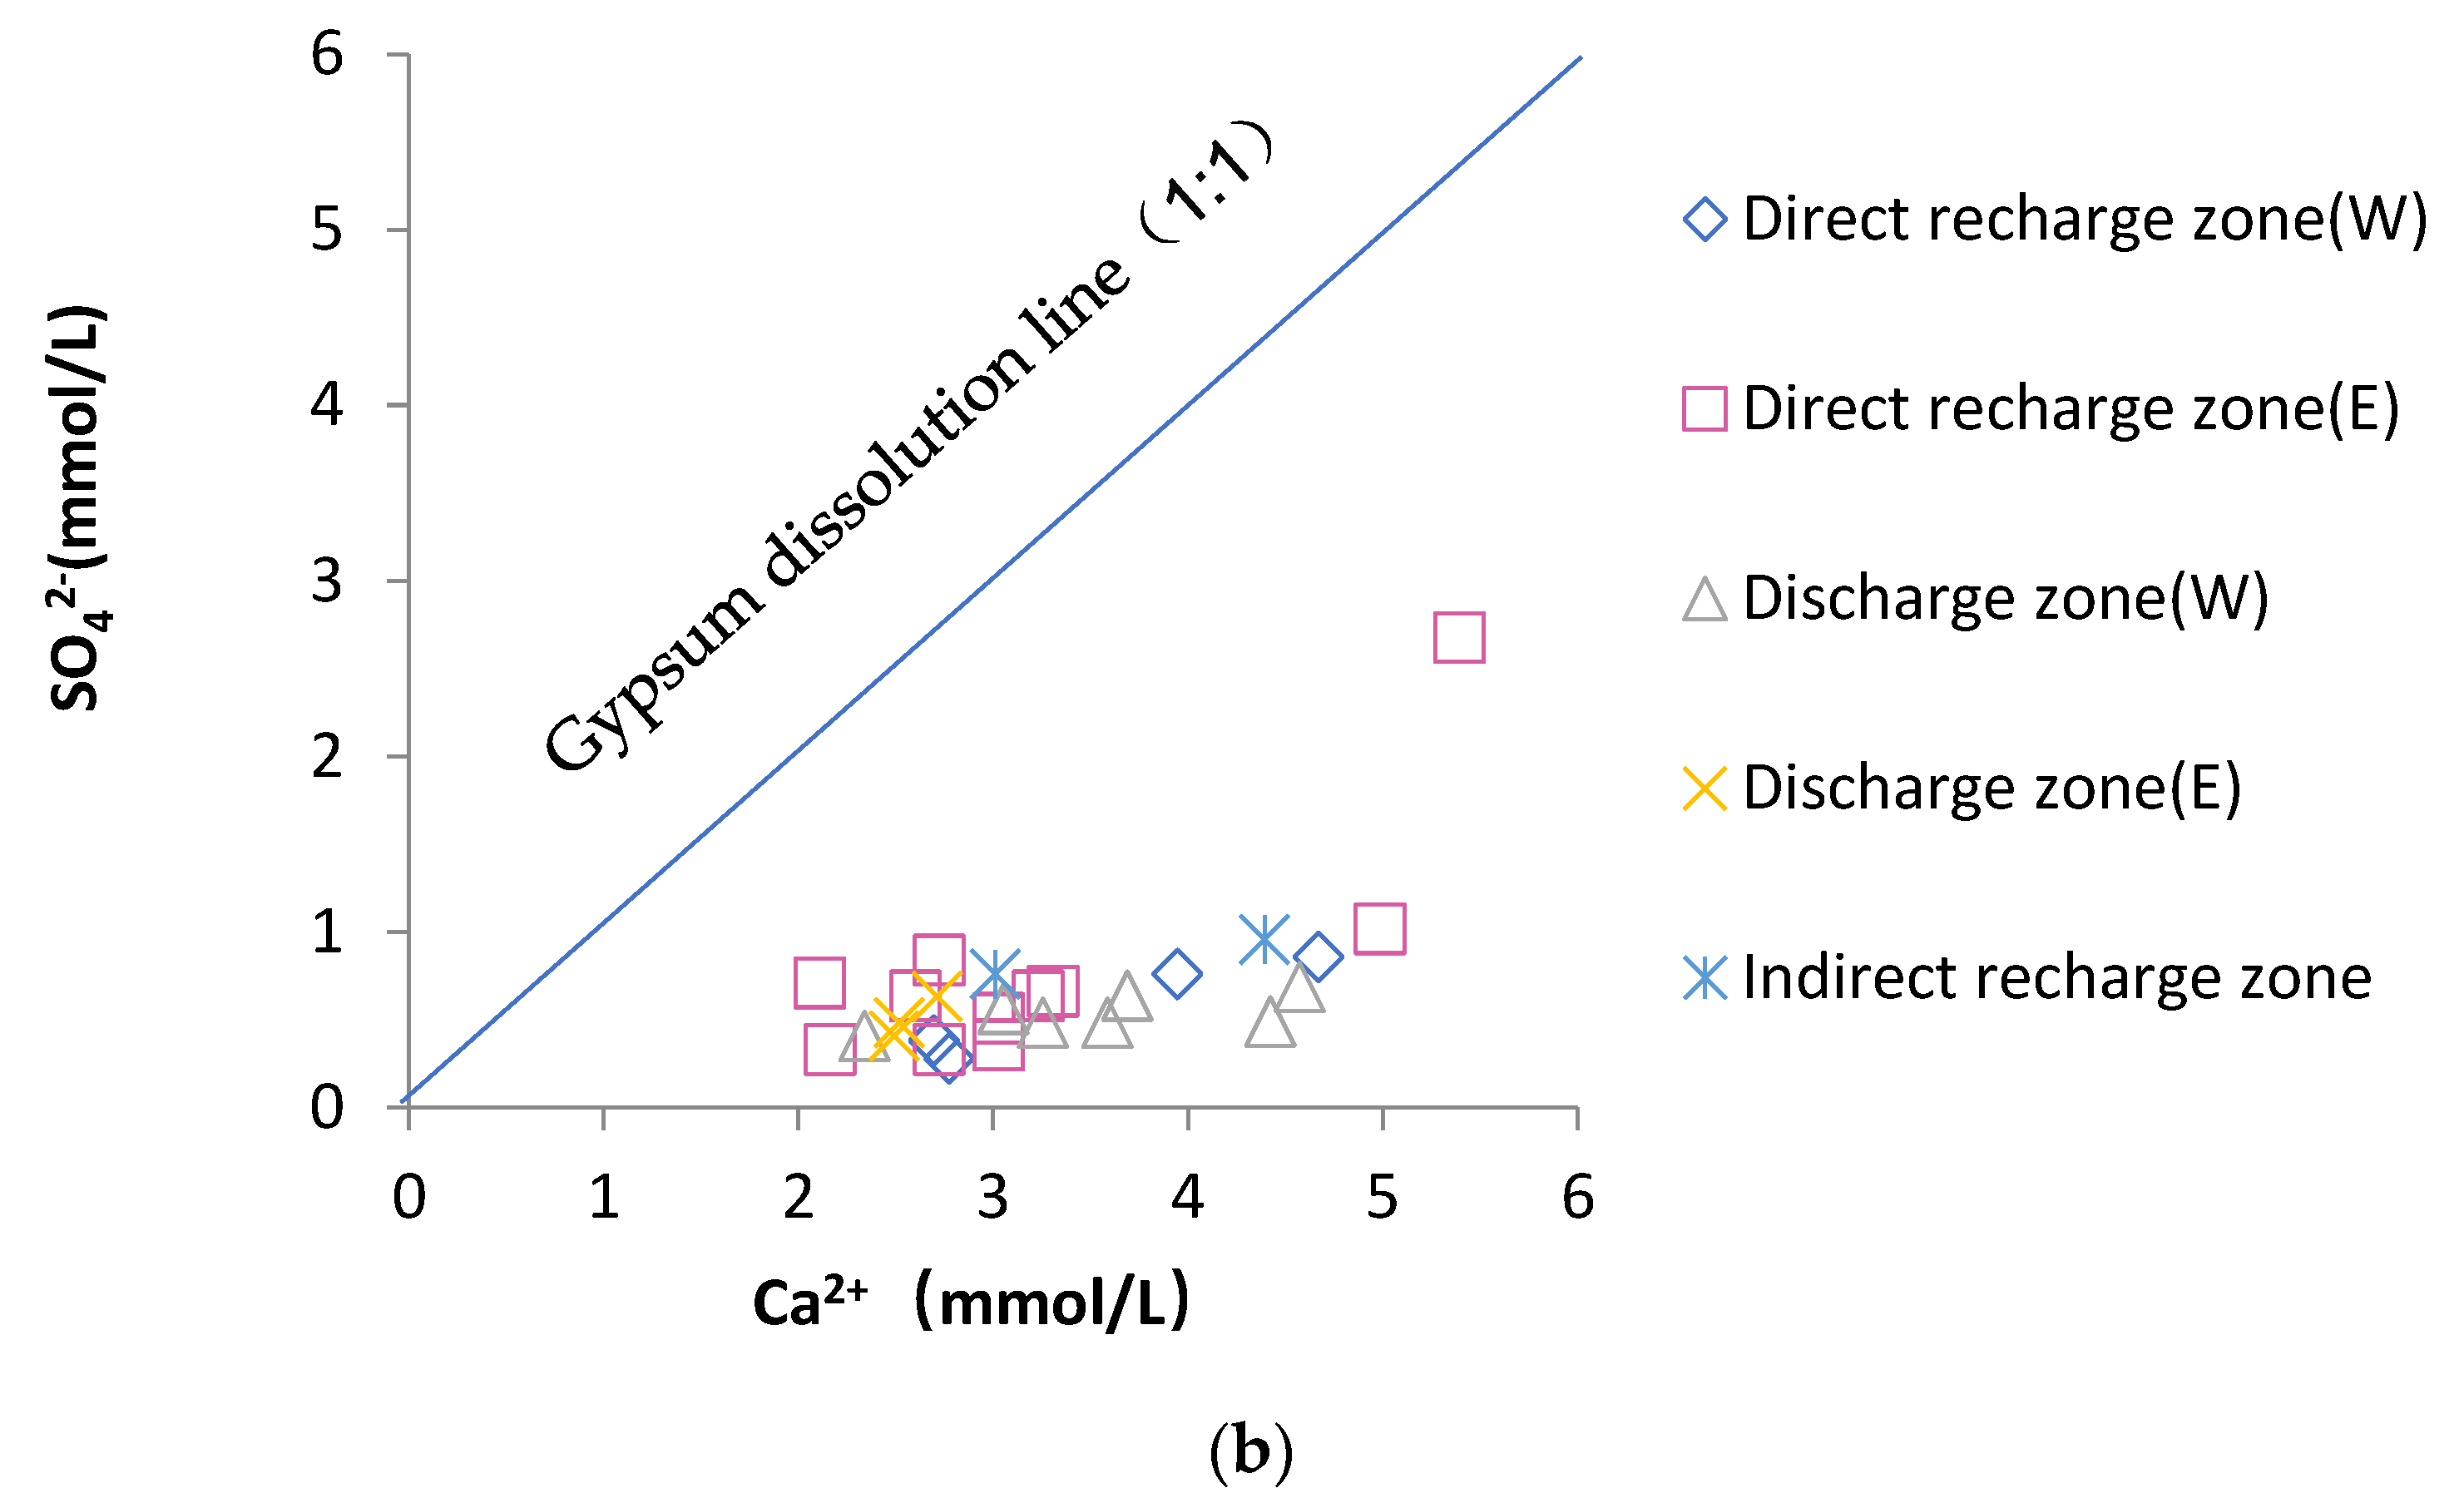
As shown in Figure 10a, there is a negative correlation between the SO42− molar concentration and 3H concentration in direct recharge zones E and W, as well as in discharge zone E, indicating the SO42− that dissolved and leached from rocks during the water–rock interaction was diluted by surface infiltration recharge. In contrast, the SO42− molar concentration was found to be positively correlated with 3H in discharge zone W, suggesting the presence of higher strength water–rock interactions leading to the dissolution and leaching of SO42− when compared with other zones. In addition, the scatter plot of SO42− versus Ca2+ (Figure 10b) shows the data points reflecting the molar concentrations of SO42− and Ca2+ in karst water were significantly below the gypsum dissolution line of slope 1:1. However, the scatterings in the eastern area of the direct recharge area are close to a 1:1 straight line, indicating the concentration of Ca2+ released from the gypsum is far less than that produced by the limestone in the study area and that gypsum dissolution is stronger in recharge zone E than in other areas.

4.4.3. Dissolution of Chlorides

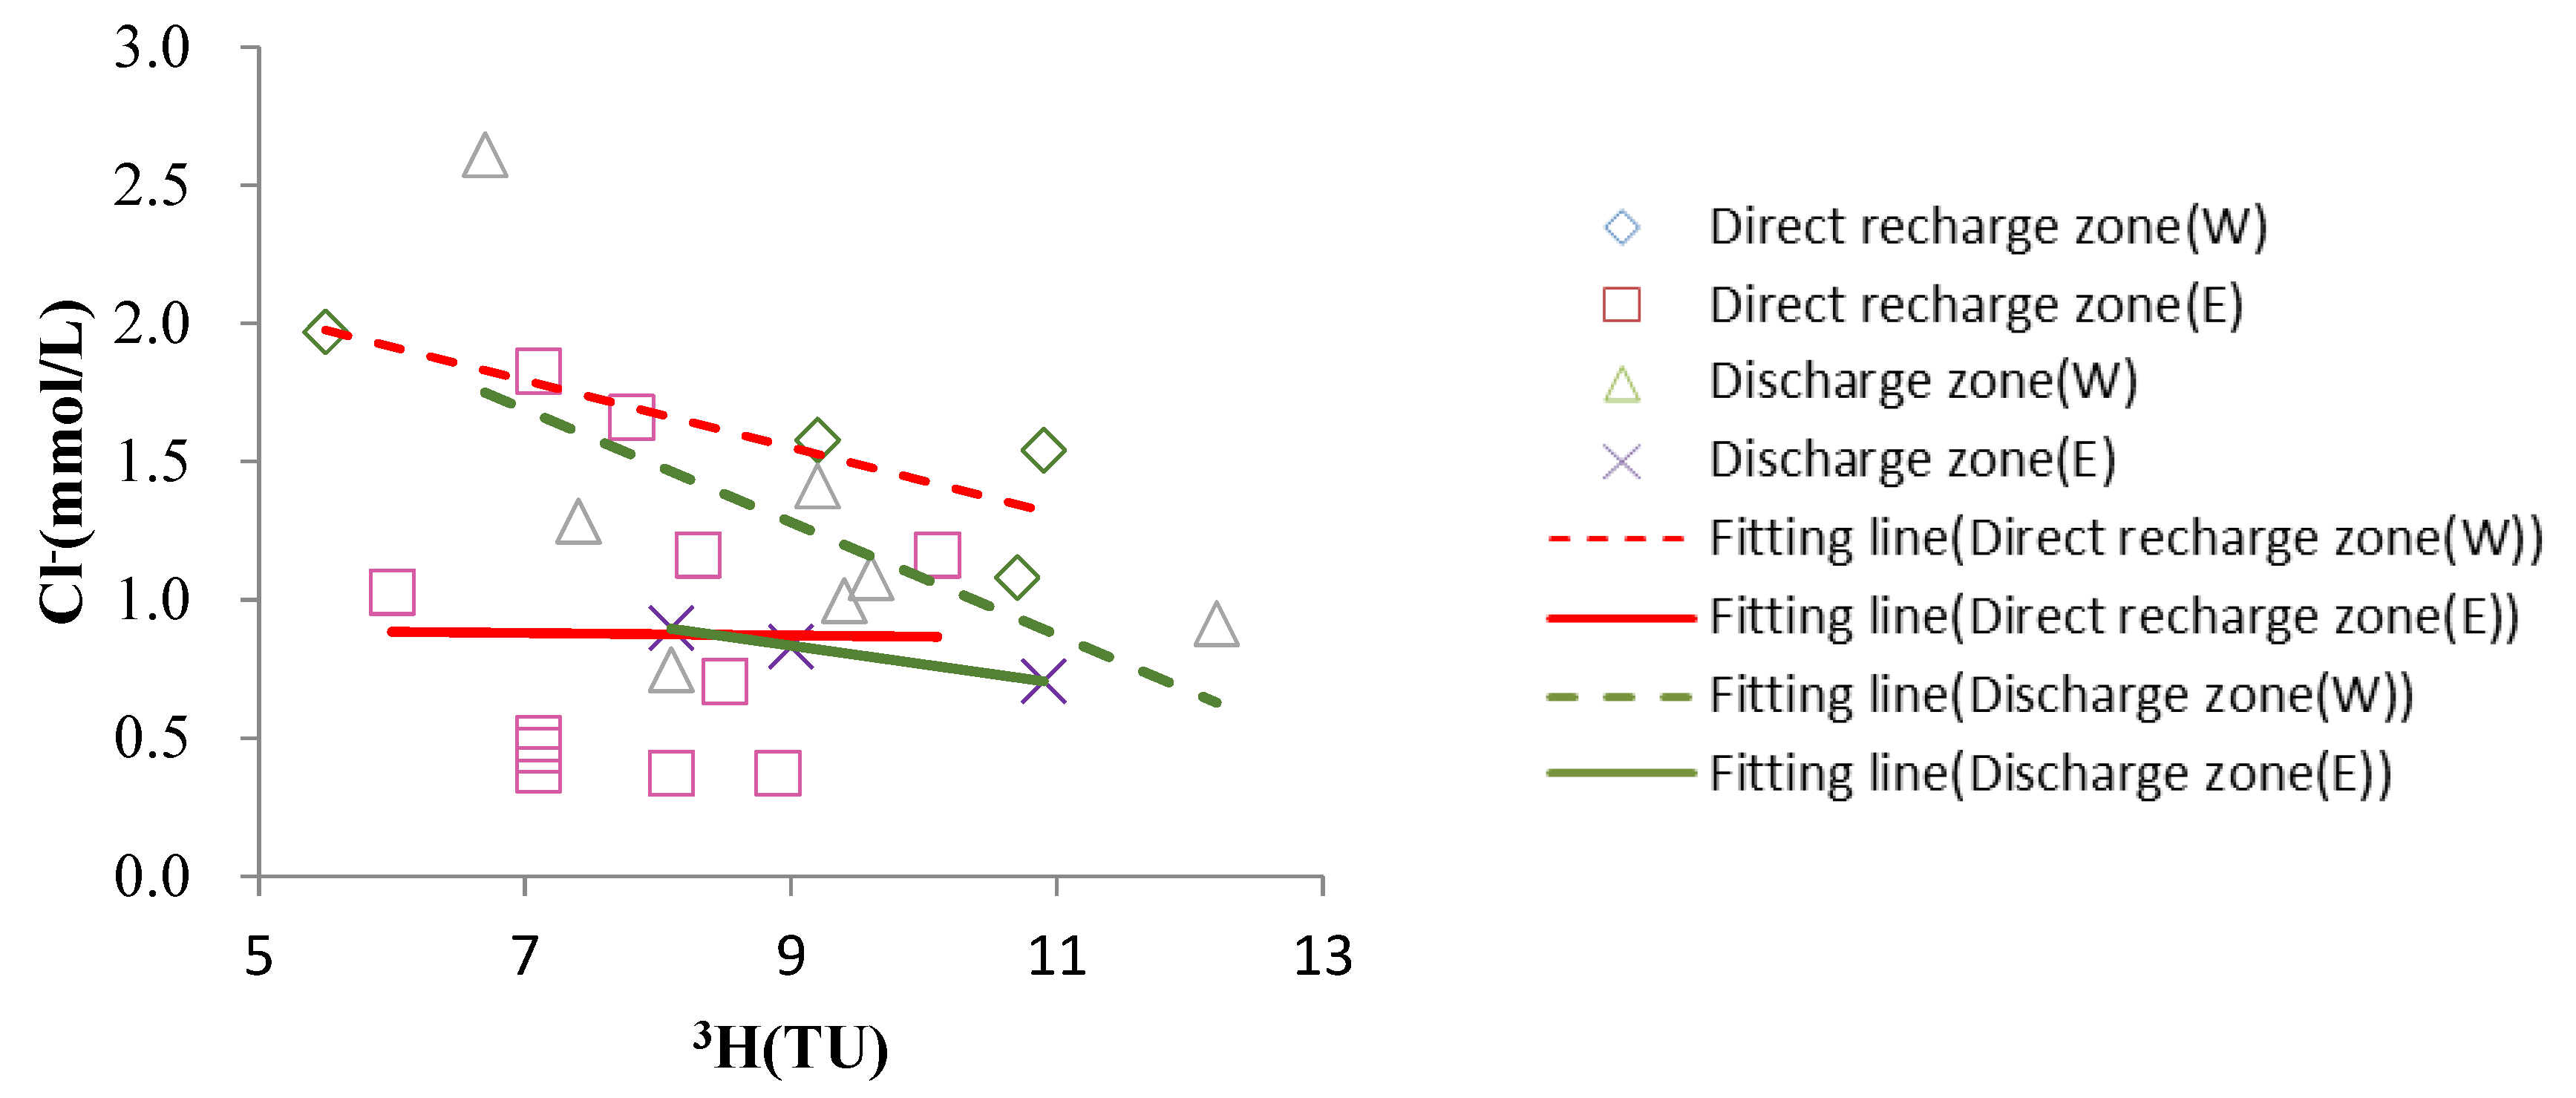
Except for the abnormally high Cl concentration at SW136, the Cl concentration in the study area was found to range from 13.27 to 92.67 mg/L due to the dissolution of soluble halite rocks intercalated between mudstone and shale interbeds in the carbonate rocks. The karst water level is shallow and the evaporation is strong in the low-lying shallow discharge zones, leading to high Cl concentrations. Additionally, there is a decrease in Cl concentration with an increasing 3H concentration (Figure 11) in each zone, indicating the continuous dilution of Cl as a readily soluble and migratable component in the flow process of karst water.

5. Conclusions

Based on the hydrochemical and isotope (18O, 2H and 3H) investigation of karst water, the following conclusions can be provided:
(1)
Shallow karst water of the HCO3-Ca type with a short flow path is ubiquitous in the study region, while karst water of the HCO3-Ca·Mg type with a long flow path is present in both the direct recharge and discharge zones. The interactions of karst water with carbonate, sulfate, and halite result in a variety of hydrochemical processes such as dissolution, precipitation, mixing, and dilution. Overall, karst water has a slightly lower degree of mineralization in the direct recharge zones than in the discharge zones. In contrast, the indirect recharge zone suffers from a relatively closed condition with TDS up to 1949 mg/L, indicative of long-term water–rock interactions.
(2)
The δ18O-δ2H fitting line of karst water in the indirect recharge zone has the closest slope to the meteoric water lines, while the slopes of the fitting lines in the direct recharge zones are significantly lower than those of the meteoric water lines. The δ18O-δ2H fitting line of recharge zone E coincides with that of discharge zone E, indicating rapid karst water recharge. Moreover, δ18O of karst water is relatively high in discharge zone W, which may be attributed to the dissolution and leaching of 18O from carbonate rocks.
(3)
The 3H value of karst water increases along the flow path and it is generally higher than 9.0 TU in the discharge zones, where intensive exploitation of karst water has produced increased karst water flow in the surrounding areas, led to significant mixing between karst water receiving surface infiltration recharge and karst water receiving lateral recharge, and yielded larger changes in 3H concentrations.

Author Contributions

Conceptualization, C.L.; methodology, W.W. and G.Z.; software, H.Z. and J.W.; validation, H.Z.; formal analysis, W.W.; investigation, W.W. and J.W.; resources, C.L.; data curation, C.L.; writing—original draft preparation, W.W.; writing—review and editing, W.W.; visualization, Y.G.; supervision, G.Z.; project administration, C.L. and W.W.; funding acquisition, C.L. and W.W. All authors have read and agreed to the published version of the manuscript.

Funding

This work was financially supported by the National Natural Science Foundation of China (No. 62171435), the Geological Survey Fund of Shandong Province (No. 202013, No. 202113) and No.1 Institute of Geology and Mineral Resources of Shandong Province (No. 2020DW02).

Data Availability Statement

The data used to support the findings of this study are included within the article.

Acknowledgments

The authors give special thanks to the Linyi Bureau of Land and Resources, Shandong Province, China, for providing the data on water levels and evaporation.

Conflicts of Interest

The authors declare no conflict of interest.

References

  1. Klimchouk, A.B.; Aksem, S.D. Gypsum karst in the western Ukraine: Hydrochemistry and solution rates. Carbonates Evaporites 2002, 17, 142–153. [Google Scholar] [CrossRef]
  2. White, W.B. Karst hydrology: Recent developments and open questions. Eng. Geol. 2002, 65, 85–105. [Google Scholar] [CrossRef]
  3. Escolero, O.A.; Marin, L.E.; Steinich, B.; Pacheco, A.J.; Cabrera, S.A.; Alcocer, J. Development of a Protection Strategy of Karst Limestone Aquifers: The Merida Yucatan, Mexico Case Study. Water Resour. Manag. 2002, 16, 351–367. [Google Scholar] [CrossRef]
  4. Valerie, P.; Michel, B. The protection of a karst resource from example of the Larzac karst plateau (south of France): A matter of regulations or a matter of process knowledge. Eng. Geol. 2002, 65, 107–116. [Google Scholar]
  5. Hess, J.W. Methods in Karst Hydrogeology. Ground Water 2008, 46, 172. [Google Scholar] [CrossRef]
  6. Turpaud, P.; Zini, L.; Ravbar, N.; Cucchi, F.; Petrič, M.; Urbanc, J. Development of a Protocol for the Karst Water Source Protection Zoning: Application to the Classical Karst Region (NE Italy and SW Slovenia). Water Resour. Manag. 2018, 32, 1953–1968. [Google Scholar] [CrossRef]
  7. Brkić, Ž.; Kuhta, M.; Hunjak, T. Groundwater flow mechanism in the well-developed karst aquifer system in the western Croatia: Insights from spring discharge and water isotopes. Catena 2018, 161, 14–26. [Google Scholar] [CrossRef]
  8. He, X.; Wu, J.; Guo, W. Karst Spring Protection for the Sustainable and Healthy Living: The Examples of Niangziguan Spring and Shuishentang Spring in Shanxi, China. Expo. Health 2019, 11, 153–165. [Google Scholar] [CrossRef]
  9. Chang, Y.; Wu, J.; Jiang, G.; Zhao, X.; Zhang, Q. Investigating the appropriate model structure for simulation of a karst catchment from the aspect of spatial complexity. Environ. Earth Sci. 2019, 78, 13. [Google Scholar] [CrossRef]
  10. Zaree, M.; Javadi, S.; Neshat, A. Potential detection of water resources in karst formations using APLIS model and modification with AHP and TOPSIS. J. Earth Syst. Sci. 2019, 128, 76. [Google Scholar] [CrossRef] [Green Version]
  11. Narany, T.S.; Bittner, D.; Disse, M.; Chiogna, G. Spatial and temporal variability in hydrochemistry of a small-scale dolomite karst environment. Environ. Earth Sci. 2019, 78, 273. [Google Scholar] [CrossRef]
  12. Jiang, C.; Gao, X.; Hou, B.; Zhang, S.; Zhang, J.; Li, C.; Wang, W. Occurrence and environmental impact of coal mine goaf water in karst areas in China. J. Clean. Prod. 2020, 275, 123813. [Google Scholar] [CrossRef]
  13. Gao, X.; Wang, W.; Hou, B.; Gao, L.; Zhang, J.; Zhang, S.; Li, C.; Jiang, C. Analysis of karst groundwater pollution in Northern China. Carpol. Sin. 2020, 39, 287–298. [Google Scholar]
  14. Eftimi, R. Karst and karst water recourses of Albania and their management. Carbonates Evaporites 2020, 35, 69. [Google Scholar] [CrossRef]
  15. Gao, X.; Wang, Y.; Wu, P.; Guo, Q. Trace elements and environmental isotopes as tracers of surface water–groundwater interaction: A case study at Xin’an karst water system, Shanxi Province, Northern China. Environ. Earth Sci. 2010, 59, 1223–1234. [Google Scholar] [CrossRef]
  16. Rao, P.N.; Prasad, K.M.; Madhusudhan, B.J.; Krishna, V.S.R.; Anand, A.V.S.S.; Madhnure, P. Impact of urbanization on groundwater quality in Vijayawada urban agglomeration, the new capital region of Andhra Pradesh, India—A baseline study. J. Geol. Soc. India 2016, 87, 539–552. [Google Scholar] [CrossRef]
  17. Keshavarzi, M.; Baker, A.; Kelly, B.F.J.; Andersen, M.S. River–groundwater connectivity in a karst system, Wellington, New South Wales, Australia. Hydrogeol. J. 2017, 25, 557–574. [Google Scholar] [CrossRef]
  18. Lesser, L.E.; Mora, A.; Moreau, C.; Mahlknecht, J.; Hernández-Antonio, A.; Ramírez, A.I.; Barrios-Piña, H. Survey of 218 organic contaminants in groundwater derived from the world’s largest untreated wastewater irrigation system: Mezquital Valley, Mexico. Chemosphere 2018, 198, 510–521. [Google Scholar] [CrossRef]
  19. Jampani, M.; Hülsmann, S.; Liedl, R.; Sonkamble, S.; Ahmed, S.; Amerasinghe, P. Spatio-temporal distribution and chemical characterization of groundwater quality of a wastewater irrigated system: A case study. Sci. Total Environ. 2018, 636, 1089–1098. [Google Scholar] [CrossRef]
  20. Hamad, A.; Baali, F.; Hadji, R.; Zerrouki, H.; Besser, H.; Mokadem, N.; Legrioui, R.; Hamed, Y. Hydrogeochemical characterization of water mineralization in Tebessa-Kasserine karst system (Tuniso-Algerian Transboundry basin). Euro-Mediterr. J. Environ. Integr. 2017, 3, 7. [Google Scholar] [CrossRef]
  21. Shamsi, A.; Karami, G.H.; Hunkeler, D.; Taheri, A. Isotopic and hydrogeochemical evaluation of springs discharging from high-elevation karst aquifers in Lar National Park, northern Iran. Hydrogeol. J. 2019, 27, 655–667. [Google Scholar] [CrossRef]
  22. Jiang, Y.; Cao, M.; Yuan, D.; Zhang, Y.; He, Q. Hydrogeological characterization and environmental effects of the deteriorating urban karst groundwater in a karst trough valley: Nanshan, SW China. Appl. Hydrogeol. 2018, 26, 1487–1497. [Google Scholar] [CrossRef]
  23. Shen, Y.; Wang, D.; Chen, Q.; Tang, Y.; Chen, F. Large heterogeneity of water and nutrient supply derived from runoff of nearby rock outcrops in karst ecosystems in SW China. Catena 2018, 172, 125–131. [Google Scholar] [CrossRef]
  24. Doney, S.C.; Glover, D.M.; Jenkins, W.J. A model function of the global bomb tritium distribution in precipitation, 1960–1986. J. Geophys. Res. 1992, 97, 5481–5492. [Google Scholar] [CrossRef]
  25. Glynn, P.D.; Plummer, L.N. Geochemistry and the understanding of ground-water systems. Appl. Hydrogeol. 2005, 13, 263–287. [Google Scholar] [CrossRef]
  26. Liu, L.; Chen, X.; Xu, G.; Shu, L. Use of hydrologic time-series data for identification of hydrodynamic function and behavior in a karstic water system in China. Appl. Hydrogeol. 2011, 19, 1577–1585. [Google Scholar] [CrossRef]
  27. Zhao, M.; Hu, Y.; Zeng, C.; Liu, Z.; Yang, R.; Chen, B. Effects of land cover on variations in stable hydrogen and oxygen isotopes in karst groundwater: A comparative study of three karst catchments in Guizhou Province, Southwest China. J. Hydrol. 2018, 565, 374–385. [Google Scholar] [CrossRef]
  28. Cardona, A.; Carlos, G.O.; Manuel, M.M.; Gerardo, O.F.; Luis, G.H. Hydrogeochemical characterization and evolution of a regional karst aquifer in the Cuatrociénegas area, Mexico. Environ. Earth Sci. 2018, 77, 785. [Google Scholar] [CrossRef]
  29. Eltarabily, M.G.; Negm, A.; Yoshimura, C.; Takemura, J. Groundwater Modeling in Agricultural Watershed under Different Recharge and Discharge Scenarios for Quaternary Aquifer Eastern Nile Delta, Egypt. Environ. Model. Assess. 2017, 23, 289–308. [Google Scholar] [CrossRef]
  30. Luiz, T.B.P.; da Silva, J.L.S.; Filho, L.L.V.D. Hydrogeochemical modeling of fluoride contents in groundwater in outcrop area of Guarani Aquifer System, southern Brazil. Geol. USP-Ser. Cient. 2019, 19, 69–82. [Google Scholar] [CrossRef] [Green Version]
  31. Viaroli, S.; Di Curzio, D.; Lepore, D.; Mazza, R. Multiparameter daily time-series analysis to groundwater recharge assessment in a caldera aquifer: Roccamonfina Volcano, Italy. Sci. Total Environ. 2019, 676, 501–513. [Google Scholar] [CrossRef] [PubMed]
  32. Huang, H.; Chen, Z.H.; Wang, T. Groundwater source identification incarbonate-hosted deposit using hydrogeochemistry, hydrogen and oxygen isotope method. Hydrogeol. Eng. Geol. 2019, 46, 19–26. [Google Scholar]
  33. Guo, Y.; Qin, D.; Sun, J.; Li, L.; Li, F.; Huang, J. Recharge of River Water to Karst Aquifer Determined by Hydrogeochemistry and Stable Isotopes. Water 2019, 11, 479. [Google Scholar] [CrossRef] [Green Version]
  34. Yang, P.; Luo, D.; Hong, A.; Ham, B.; Xie, S.; Ming, X.; Wang, Z.; Pang, Z. Hydrogeochemistry and geothermometry of the carbonate-evaporite aquifers controlled by deep-seated faults using major ions and environmental isotopes. J. Hydrol. 2019, 579, 124116. [Google Scholar] [CrossRef]
  35. Li, C.; Gao, X. Assessment of Groundwater Quality at Yuncheng Basin: Denotation for the Water Management in China. Ground Water 2018, 57, 492–503. [Google Scholar] [CrossRef]
  36. Li, C.; Gao, X.; Wang, W.; Zhang, X.; Zhang, X.; Jiang, C.; Wang, Y. Hydro-biogeochemical processes of surface water leakage into groundwater in large scale karst water system: A case study at Jinci, northern China. J. Hydrol. 2021, 596, 125691. [Google Scholar] [CrossRef]
  37. Iacurto, S.; Grelle, G.; De Filippi, F.M.; Sappa, G. Karst Spring Recharge Areas and Discharge Relationship by Oxygen-18 and Deuterium Isotopes Analyses: A Case Study in Southern Latium Region, Italy. Appl. Sci. 2020, 10, 1882. [Google Scholar] [CrossRef] [Green Version]
  38. Ribeiro, C.G.; Veláusqez, L.; Fleming, P. Origin of spring waters employing a multiparametric approach with special focus on stable isotopes 2H and 18O in the Lagoasanta Karst region, Southern Brazil. Isot. Environ. Health Stud. 2020, 56, 158–169. [Google Scholar] [CrossRef]
  39. Wang, F.; Chen, H.; Lian, J.; Fu, Z.; Nie, Y. Seasonal recharge of spring and stream waters in a karst catchment revealed by isotopic and hydrochemical analyses. J. Hydrol. 2020, 591, 125595. [Google Scholar] [CrossRef]
  40. Wang, W. Functional Regionalization and Renewable Capacity of Karst Water System in the Semi-humid Area, Central Southern Shandong Province. Ph.D. Thesis, China University of Geosciences (Beijing), Beijing, China, 2019. [Google Scholar]
  41. Craig, H. Isotopic Variations in Meteoric Waters. Science 1961, 133, 1702–1703. [Google Scholar] [CrossRef]
  42. Li, Y.J.; Zhang, M.J.; Wang, S.J.; Li, Z.Q.; Li, X.F. Spatial distribution of δ18O in China’s precipitation based on a secondary variable of temperature. Prog. Geogr. 2011, 30, 1387–1394. [Google Scholar]
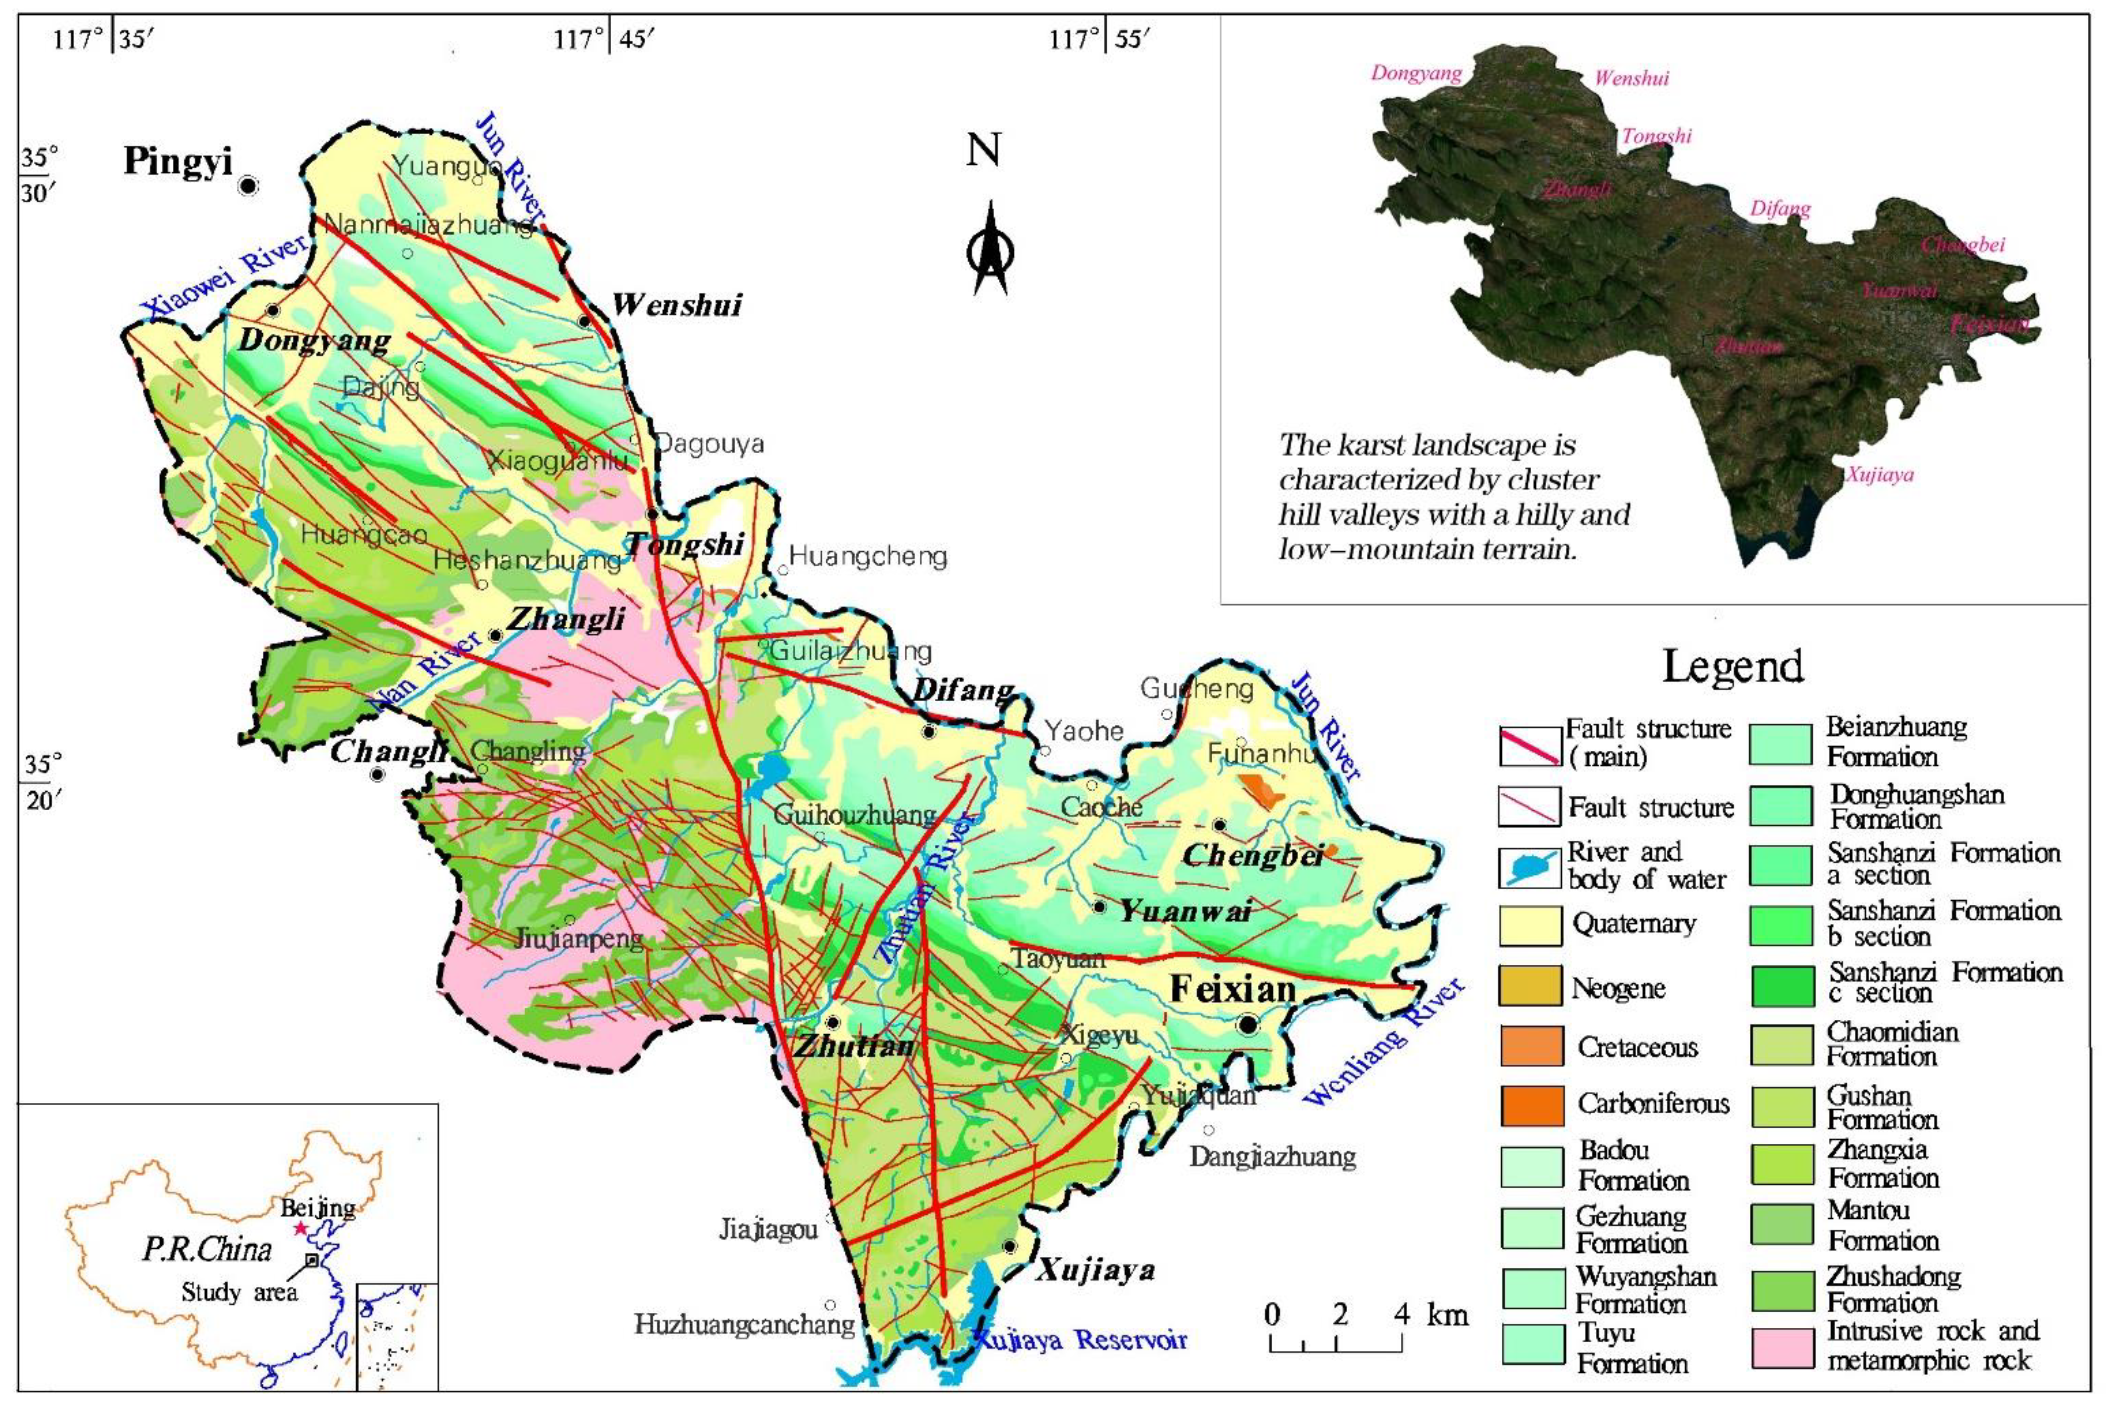
Figure 1. Geological structure map of the study region.
Minerals 12 00154 g001
Figure 2. Zoning of the study region based on the hydrochemical characteristics of karst water.
Minerals 12 00154 g002
Figure 3. Zoning of the study region to calculate the extraction modulus of karst water.
Minerals 12 00154 g003
Figure 4. Karst water sampling sites in the study region.
Minerals 12 00154 g004
Figure 5. Piper trilinear diagram for the classification of karst water in each zone.
Minerals 12 00154 g005
Figure 6. Distribution of hydrochemical types of karst water. (a) Zoning of the study region based on the hydrochemical types of karst water; (b)The proportion of hydrochemical types in the total number of samples in each zone; (c) The proportion of TDS levels in the total number of samples in each zone.
Minerals 12 00154 g006aMinerals 12 00154 g006b
Figure 7. Scatter plots of δ2H versus δ18O of karst water.
Minerals 12 00154 g007
Figure 8. Distribution characteristics of the tritium (3H) values of karst water.
Minerals 12 00154 g008
Figure 9. Correlation between the concentration of 3H and major carbonate rock-related ions in karst water. (a) Correlation between the concentration of 3H and Ca2+; (b) Correlation between the concentration of 3H and Mg2+; (c) Correlation between the concentration of 3H and the ratio of Ca2+ and Mg2+; (d) Correlation between the concentration of 3H and HCO3.
Minerals 12 00154 g009aMinerals 12 00154 g009b
Figure 10. Correlation between the concentration of 3H and major sulfate rock-related ions in karst water. (a) Correlation between the concentration of 3H and SO42−; (b) Correlation between the concentration of Ca2+ and SO42−.
Minerals 12 00154 g010aMinerals 12 00154 g010b
Figure 11. Correlation between the concentration of Cl and 3H concentration in karst water.
Minerals 12 00154 g011
Table 1. Typical hydrochemical and isotopic samples of precipitation and karst water.
Sample No.Sampling DateSampling LocationSampling Depth (m)Notes
FxjNovember 2013Feixian County Precipitation
SW134November 2013Pingyi County85–200Indirect recharge zone
SW136November 2013Pingyi County9–88
SW137November 2013Pingyi County8–27
DW018November 2013Pingyi County60–187Direct recharge zone(W)
DW110November 2013Pingyi County18–26
DW111November 2013Pingyi County0–141
DW130November 2013Pingyi County14–170
FK03-1October 2013Feixian County4–32Direct recharge zone(E)
FW281November 2013Feixian County30–73
FW237AOctober 2013Pingyi County80–100
FW332October 2013Feixian County18–80
FW071October 2013Feixian County50–120
FW073October 2013Feixian County0–88
FW237October 2013Pingyi County80–100
FW087November 2013Feixian County40–170
FK03October 2013Feixian County29–202
FK01October 2013Feixian County80–325
FW232November 2013Feixian County200–370
DW093November 2013Pingyi County28–40Discharge zone(W)
DW094October 2013Pingyi County16–20
DK03AOctober 2013Pingyi County0–301
DW007October 2013Pingyi County40–150
DW100November 2013Pingyi County180
DW102November 2013Pingyi County150
DK03October 2013Pingyi County0–301
SW018October 2013Feixian County15–88Discharge zone(E)
FW110October 2013Feixian County20–200
SW216October 2013Feixian County15–200
Table 2. Chemical composition of the water samples.
Sample No.pHδ2H (‰)δ18O (‰)3H (TU)TDS
(mg/L)
K+
(mg/L)
K+
(mmol/L)
Na+
(mg/L)
Na+
(mmol/L)
Ca2+
(mg/L)
Ca2+
(mmol/L)
Mg2+
(mg/L)
Mg2+
(mmol/L)
HCO3
(mg/L)
HCO3
(mmol/L)
SO42
(mg/L)
SO42
(mmol/L)
Cl
(mg/L)
Cl
(mmol/L)
Notes
Fxj/−60−9.212.6///////////////Precipitation
SW1347.6−64−8.37.2678.20.890.02316.70.72120.43.0126.51.10288.74.7373.10.7636.51.03Indirect recharge zone
SW1367.2−62−8.08.91949.21.560.04066.72.90415.510.3971.12.96254.24.17188.61.96410.311.56
SW1377.4−56−7.38.0929.61.110.02832.01.39175.84.3932.31.35389.16.3891.90.9686.62.44
DW0187.4−60−8.310.9859.91.110.02820.00.87157.83.9532.71.36375.66.1673.10.7654.71.54Direct recharge zone(W)
DW1107.3−62−8.19.2695.41.110.02810.00.43110.92.7734.61.44304.74.9926.90.2856.01.58
DW1117.8−59−8.010.7519.70.440.0117.50.33107.92.7013.60.57263.94.3336.70.3838.31.08
DW1307.5−62−8.85.5898.70.670.01726.21.14186.84.6723.00.96355.25.8282.50.8669.91.97
FK03–17.8−58−8.18.3793.20.330.00814.20.62129.23.2345.71.90375.46.1561.20.6441.31.16Direct recharge zone(E)
FW2817.4−61−8.77.1554.20.440.0112.50.11121.13.0311.10.46323.75.3134.30.3617.70.50
FW237A7.6−60−8.57.8964.20.330.00820.00.87199.44.9922.80.95424.46.9697.91.0259.01.66
FW3327.9−59−8.47.11167.31.220.03136.01.57215.75.3939.51.65375.46.15257.12.6864.91.83
FW0717.7−60−8.56.0596.80.330.00813.30.58104.02.6028.01.16263.64.3261.30.6436.51.03
FW0737.4−62−8.68.9579.80.330.0083.30.14108.92.7222.80.95350.95.7531.80.3313.30.37
FW2377.4−61−8.58.1662.60.220.0064.20.18132.33.3123.50.98296.54.8663.70.6613.30.37
FW0878.0−61−8.38.5586.80.440.0117.50.33108.92.7226.51.11266.64.3780.80.8425.10.71
FK037.5−59−8.210.1718.90.440.01111.70.51121.13.0339.51.65353.65.8049.00.5141.31.16
FK017.7−61−8.67.1579.51.330.0348.80.3886.52.1635.81.49353.65.8031.80.3316.20.46
FW2327.9−62−8.67.1533.90.440.0115.00.2284.42.1132.71.36238.53.9168.40.7113.70.39
DW0937.2−70−8.97.4868.10.220.00613.30.58183.04.5716.50.69414.26.7966.00.6945.61.28Discharge zone(W)
DW0947.5−59−8.29.2681.71.440.03715.00.65122.13.0526.51.11302.04.9553.90.5650.11.41
DK03A7.4−59−8.38.4725.60.440.01110.80.47143.53.5922.20.93402.66.6046.50.4835.41.00
DW0077.6−61−8.512.2714.30.440.0117.90.34147.53.6921.00.87315.65.1761.20.6432.40.91
DW1007.7−56−7.69.6656.00.440.01111.70.51130.23.2618.50.77302.04.9546.50.4838.31.08
DW1027.5−59−8.36.7880.50.560.01415.00.65176.94.4232.31.35379.76.2247.10.4992.72.61
DK037.9−60−8.48.1500.10.330.0085.80.2593.62.3420.40.85236.73.8839.20.4126.50.75
SW0187.6−60−8.310.9530.50.560.0149.20.4099.72.4916.70.69269.34.4139.20.4125.10.71Discharge zone(E)
FW1107.4−58−8.08.1606.41.70.04415.00.65108.52.7121.90.91315.55.1760.80.6331.90.90
SW2167.6−58−8.09.0535.71.220.0319.20.40100.72.5221.00.87269.34.4146.50.4829.50.83
Publisher’s Note: MDPI stays neutral with regard to jurisdictional claims in published maps and institutional affiliations.