Article

An Improved Capacity Model of the Cone Crushers Based on the Motion Characteristics of Particles Considering the Influence of the Spatial Compound Motion of the Mantle

1
National Engineering Research Center for Equipment and Technology of Cold Strip Rolling, Yanshan University, Qinhuangdao 066004, China
2
School of Mechanical Engineering, Yanshan University, Qinhuangdao 066004, China
*
Author to whom correspondence should be addressed.
Minerals 2022, 12(2), 235; https://doi.org/10.3390/min12020235
Submission received: 13 January 2022 / Revised: 8 February 2022 / Accepted: 10 February 2022 / Published: 11 February 2022
(This article belongs to the Special Issue Comminution and Comminution Circuits Optimisation)

Abstract

:
Capacity is the important indicator of the cone crushers, which is determined by the motion characteristics of particles. The spatial compound motion of the mantle, which rotates both around the central axis of the cone crusher and its central axis, was analyzed to develop motion characteristic equations of particles. The velocity distribution of particles with different motion characteristics was determined by solving the motion characteristic equations of particles using the coordinate system transformation matrix. An improved capacity model of the cone crushers based on the motion characteristics of particles considering the influence of the spatial compound motion of the mantle was established by analyzing the velocity of particles in the upward and downward direction zones of the choke-level and the influence of circumferential deflection of particles on the velocity in the radial direction. A reduced-scale cone crusher with various rotational speeds was used to simulate cone crushers with different motion characteristics of the particles passing through the choke-level. The average error between the capacity calculated by the improved capacity model and the capacity determined according to the experimental data was 5.96%. Therefore, the accuracy of the improved capacity model was verified. The improved capacity model was used in the capacity calculation of the ZS200MF cone crusher; the error was 7.4% compared with the measured value at the production site; thus, the applicability of the improved capacity model is proved. The influences of four typical parameters of the cone crusher on capacity were investigated based on the improved capacity model, which provides theoretical support for the development of new high-efficiency cone crusher and the optimization of existing equipment.

1. Introduction

A cone crusher is a core component of the particle crushing process employed in various industrial sectors [1]. Capacity is one of the most important indexes of cone crushers, which determines the performance of the cone crusher and is directly related to the economic benefits of equipment users. The capacity model of the cone crusher reveals the features of the physical process of particles passing through the choke-level in the crushing chamber. Capacity can be calculated according to the structural and operating parameters of the cone crusher, providing theoretical guidance for the design of the crushing chamber and optimization of the parameters. Therefore, it holds important theoretical significance and practical value.
The capacity of the cone crushers was investigated theoretically by many scholars. Gauldie [2,3] proposed an empirical model of capacity by analyzing the structure of various crushing equipment. Briggs [4,5] and Bearman [6] presented a theoretical model of cone crusher capacity by evaluating the influence of mantle motion on the falling motion characteristics of particles. Evertsson [7,8] established a capacity model considering the motion characteristics of particles with sliding and free-falling based on the two-dimensional analysis of the force and acceleration of particles. Lindqvist [9,10] investigated the influence of motion characteristics of particles moving downward in choke-level on the capacity of the cone crusher. Based on the continuum model of particles [11], Oliver et al. [12] explored the capacity of the cone crusher, which was simplified to a two-dimensional channel. Zhang et al. [13] investigated the motion characteristics of the particles affected by the spatial compound motion of the mantle and explored the path of the particles in the crushing chamber. As computer numerical simulation technology advances, the discrete element method (DEM) was gradually adopted in the research of cone crusher capacity [14,15,16]. Herbst et al. [17] and Lichter et al. [18] firstly used DEM to simulate the crushing process of particles in the cone crusher. Li et al. [19] used DEM to simulate the motion of the particles on the chute instead of the crushing chamber and compared it with the experiment to analyze the influence of the particle motion characteristics on the capacity. According to the simulation of cone crusher capacity and comparison with laboratory experiments, Johansson et al. [20] examined the influence of rotational speed on cone crusher capacity. Delaney et al. [21] and Cleary et al. [22] simulated the path of particles in a cone crusher using commercial DEM software, and the capacity of the cone crusher was determined by calculating the throughput. Flávio et al. [23] developed a DEM model with polyhedral particles for simulating the crushing process of three materials in a laboratory-scale cone crusher and explored the effects of CSS, eccentric throw and speed on crusher performance. Chen et al. [24] discussed the influence of the concave curve radius, eccentric angle, and mantle shaft speed of the gyratory crusher on the crushing chamber performance based on the DEM analysis model. Cheng et al. [25] established a real-time dynamic model based on the multibody dynamic and discrete element method, and the paths of particles in the inertia cone crusher with sliding, free-fall, and squeezing were obtained visually. However, in the existing research of the capacity model of the cone crusher, the particularity of the structure of the cone crusher is not considered, the influence of the spatial compound motion of the mantle on the motion characteristics of the particles is ignored, and the velocity variation along the radial direction when the particles pass through the choke-level is not investigated. Thus, the velocity characteristics of particles passing through the choke-level in the crushing chamber cannot be precisely described, which inevitably affects the calculation accuracy of the cone crusher capacity model. As a result, it is necessary to focus on the motion characteristics of the particles through the choke-level affected by the spatial compound motion of the mantle to establish a more accurate cone crusher capacity model.
By analyzing the particularity of cone crusher structure, the influence of spatial compound motion of mantle on the motion characteristics of the particles was explored. The force and acceleration of particles with different motion characteristics were analyzed by using the coordinate system transformation matrix, and the motion characteristic equations of particles were developed. The velocity of particles with different motion characteristics passing through the choke-level was investigated, and the influence of the circumferential deflection of particles on the velocity in the radial distribution was considered, so an improved capacity model of the cone crushers based on the motion characteristics of particles considering the influence of the spatial compound motion of the mantle was established. The improved capacity model improved the capacity calculation accuracy of cone crushers, through which the particles pass with different movement characteristics. Therefore, it provides theoretical support for the development of new high-efficiency crushers and optimization of existing equipment.

2. Motion Characteristics of Particles Affected by Spatial Compound Motion of the Mantle

The spatial compound motion of the mantle has a significant influence on the motion characteristics of the particles in direct contact with the mantle, thus, affecting the capacity of the cone crusher. As a result, it is necessary to investigate the spatial compound motion of the mantle in order to provide theoretical guidance for establishing a cone crusher capacity model.

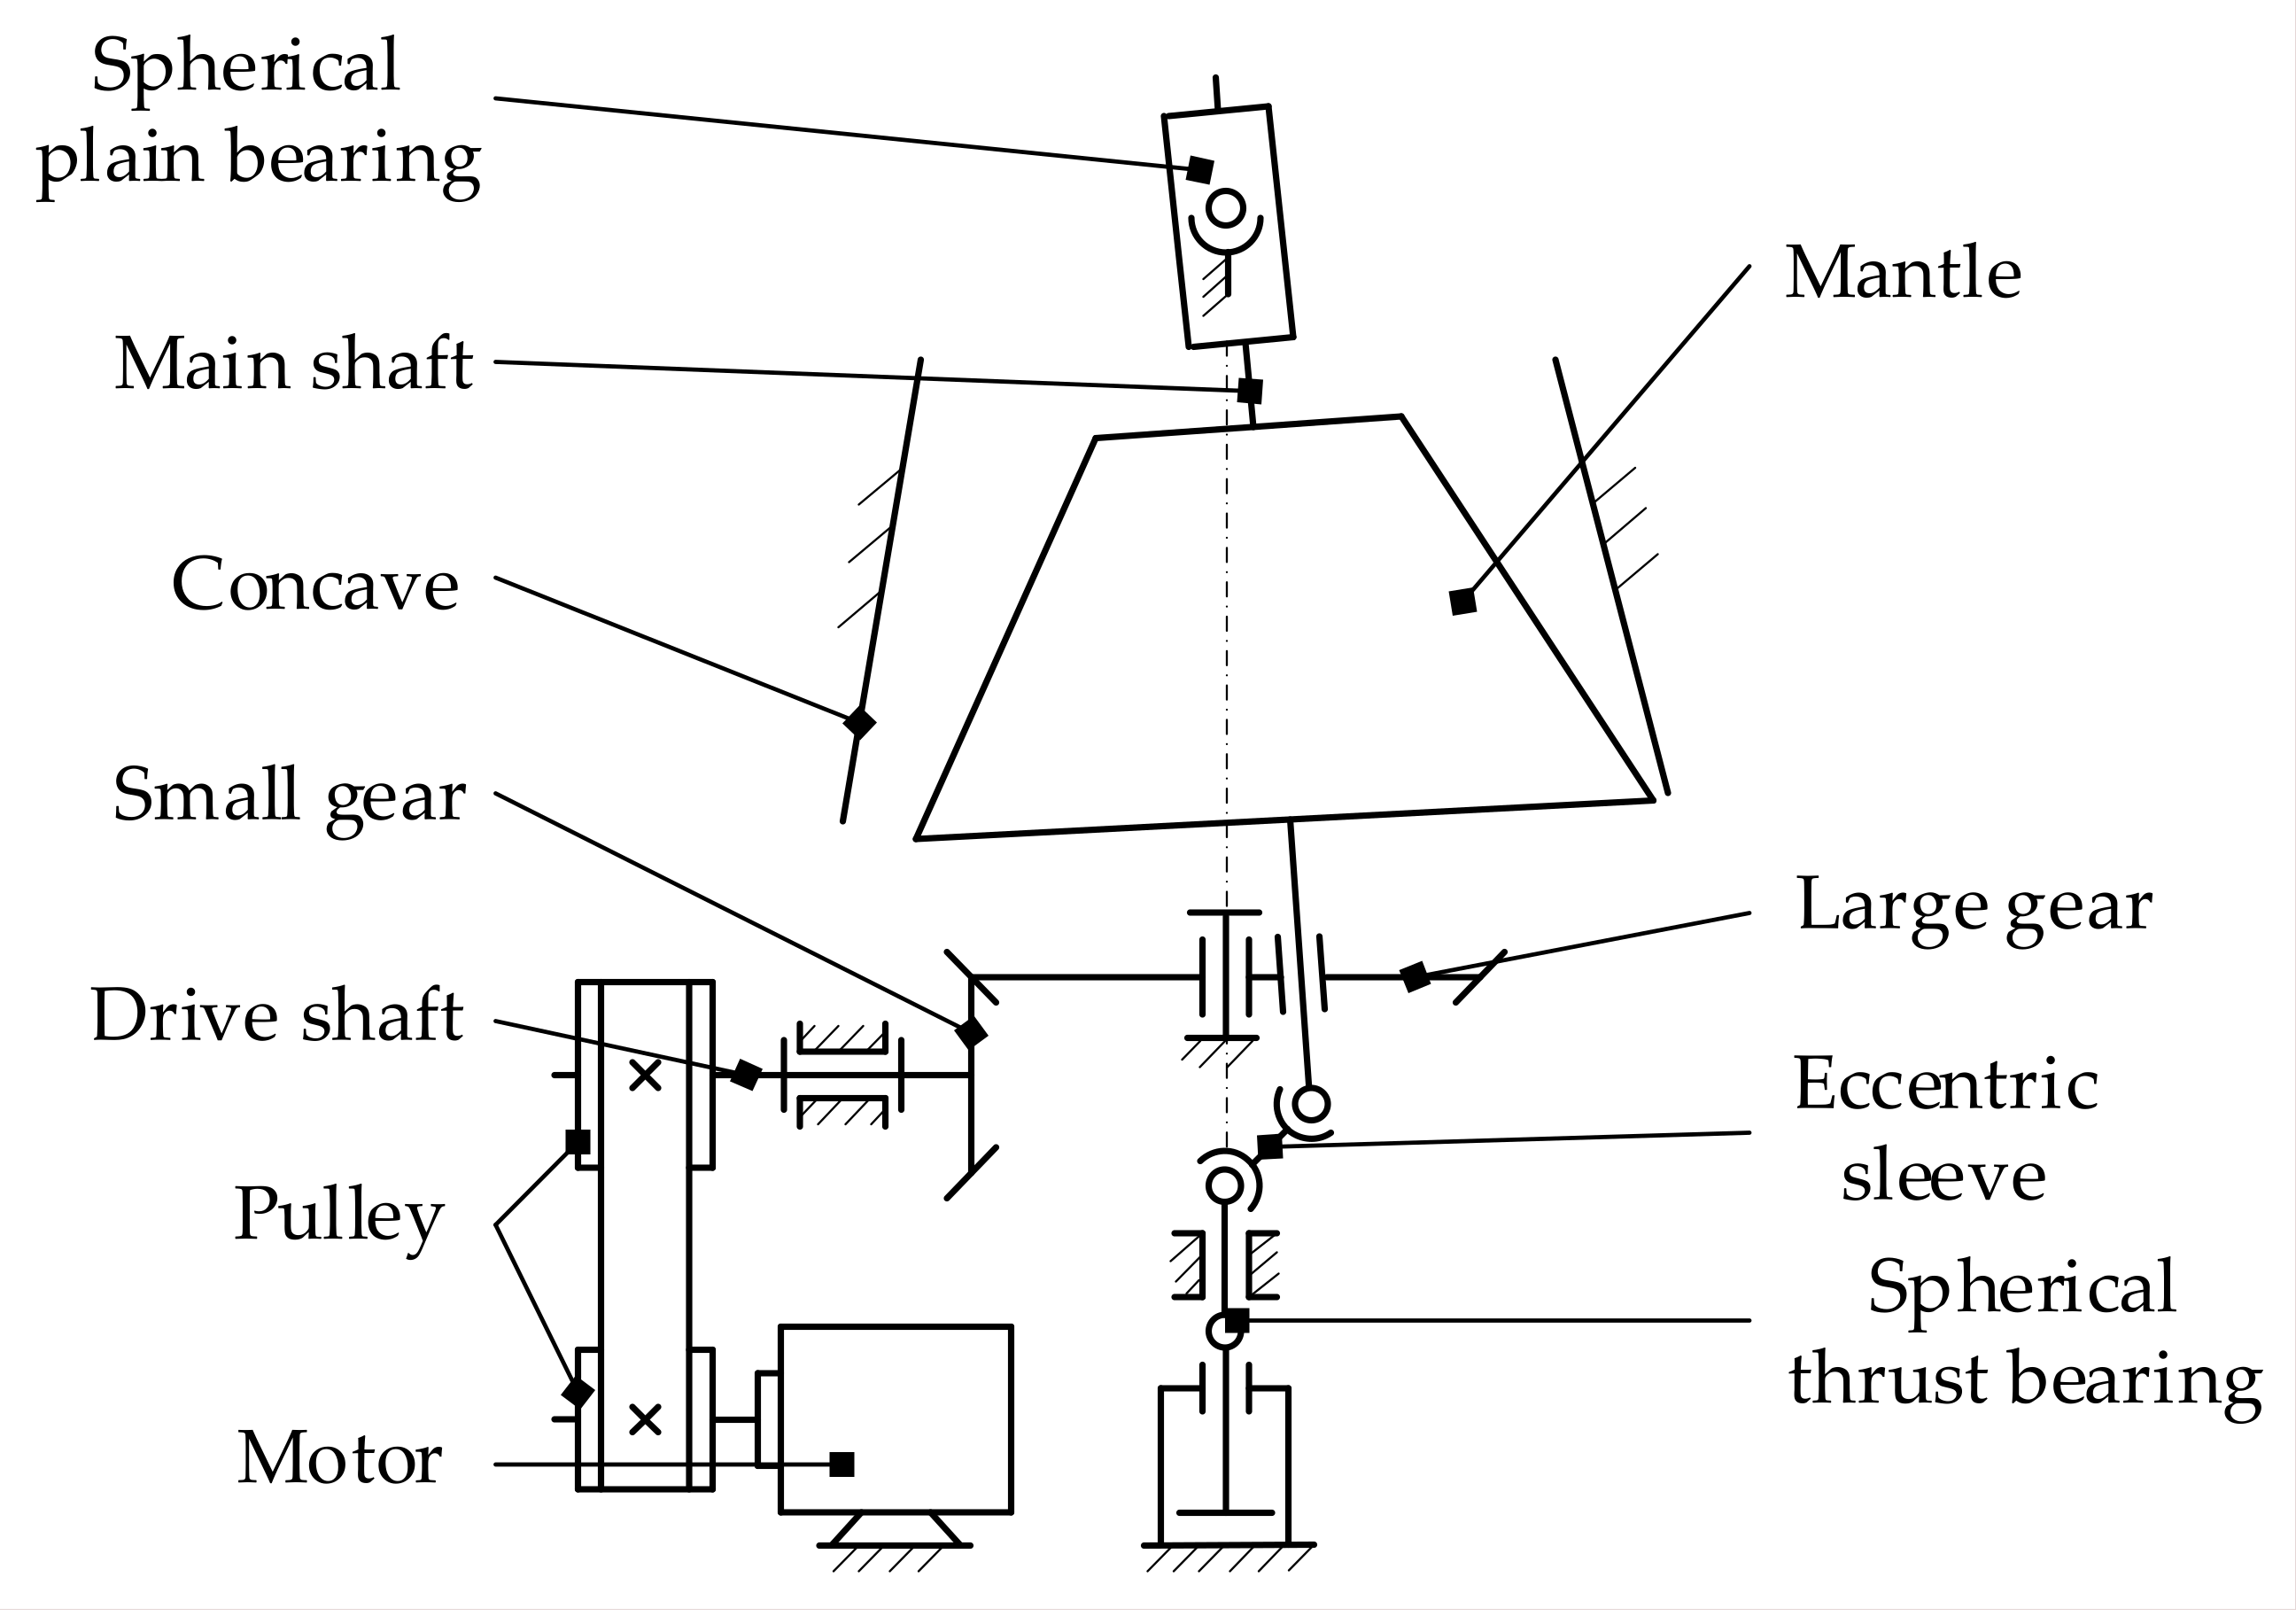
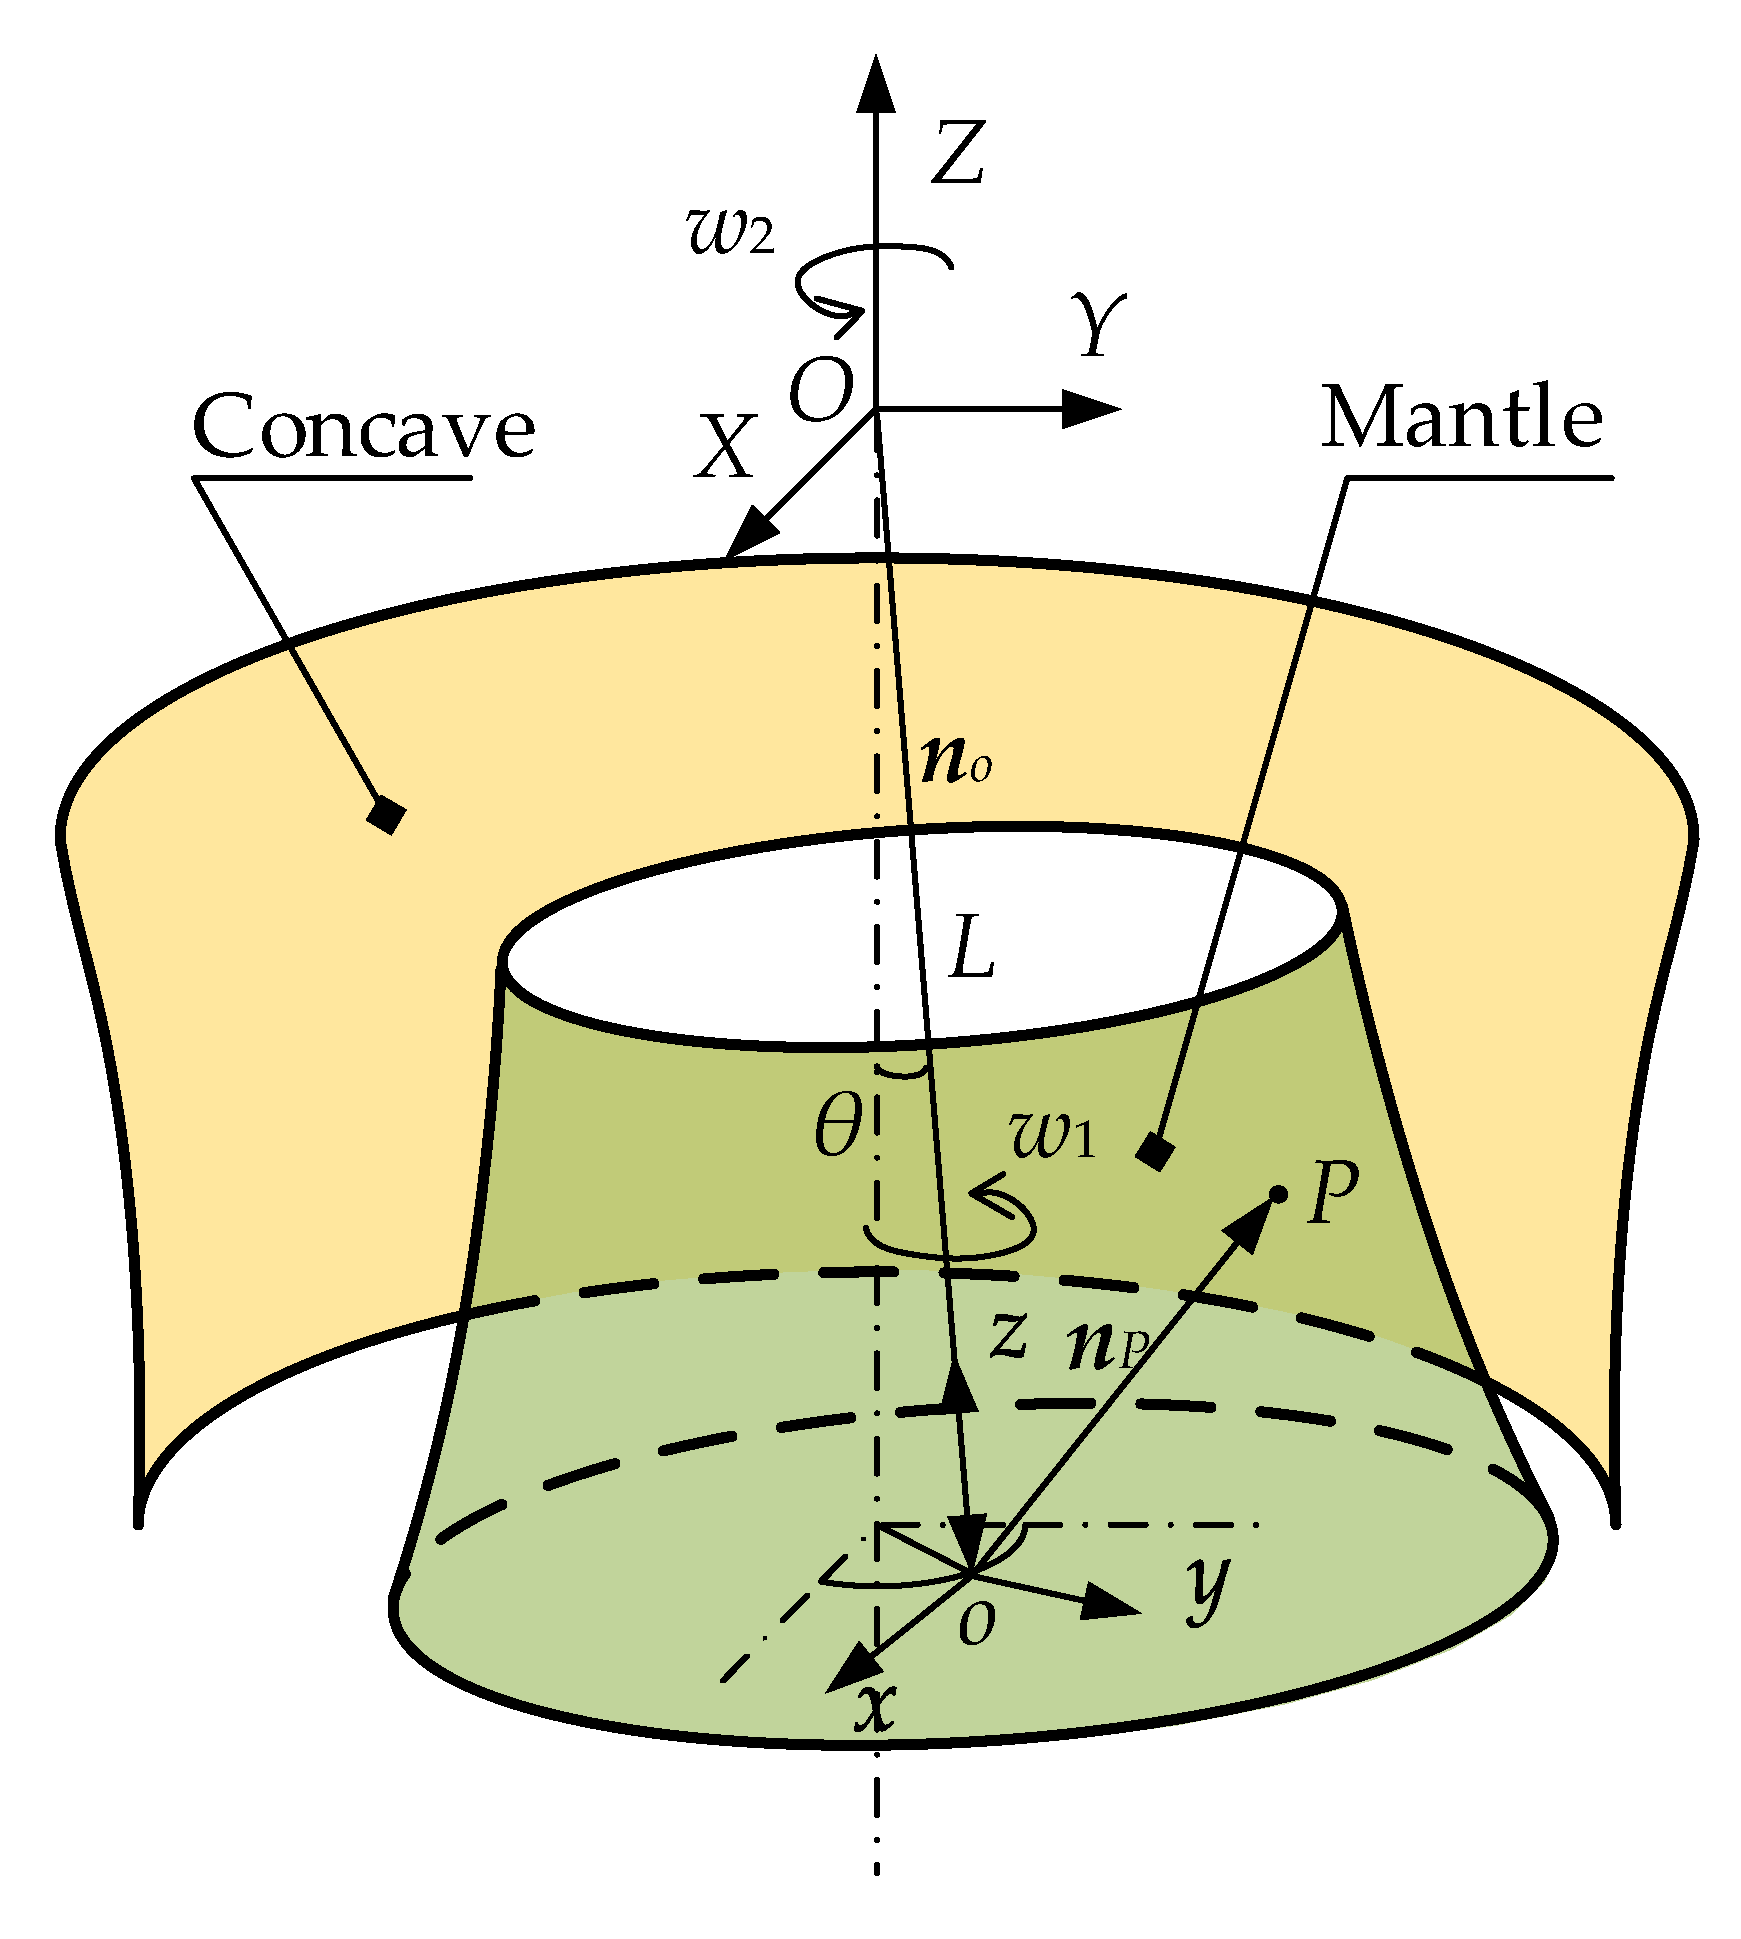
2.1. Spatial Compound Motion of the Mantle

The structural principle diagram of a certain model cone crusher is shown in Figure 1. The power from the motor was passed into the cone crusher through the pulley, which caused the small gear to rotate around the drive shaft. Due to the engagement of the small gear with the large gear, the eccentric sleeve assembled with the large gear was forced to rotate. The main shaft was assembled in the eccentric sleeve, where the upper end was fixed by the spherical plain bearing, and the lower end was supported by the spherical thrust bearing. The mantle was fixed to the main shaft. Since the rotation of the eccentric sleeve forced the main shaft to rotate around the central axis of the cone crusher, the particles in the crushing chamber were crushed by the reciprocating motion of the mantle and concave. Due to the friction between the crushed particles and the mantle, the mantle rotated around its central axis. As a result, the spatial compound motion of the mantle was the rotation both around the central axis of the cone crusher and its central axis.

2.2. Motion Characteristics of Particles in the Crushing Chamber

Particles exhibit various motion characteristics during the crushing process in the crushing chamber, which is affected by the spatial compound motion of the mantle. The motion characteristics of particles can be classified into three types depending on whether they are in contact with the mantle or not: spatial sliding, free-falling, and spatial compound falling. The relative spatial position of the particle with various motion characteristics and the mantle are shown in Figure 2.
As shown in Figure 2, the mantle rotated both around the central axis of the cone crusher and its central axis, resulting in a reciprocating motion of the mantle and concave. When the mantle moved towards the concave to the limit position, the particles were crushed by the mantle and concave; then, the surface close side setting (CSS) was formed by the mantle surface. When the mantle moved away from the concave to the limit position; the particles were released by the mantle and concave; then, the surface open side setting (OSS) was formed by the mantle surface. As a result, the mantle reciprocated between the surface CSS and surface OSS. As shown in Figure 2a, the motion characteristic of the particle was spatial sliding. When the mantle moved from the surface CSS to the surface OSS, the particle was released by the mantle and concave. In the spatial sliding from point A of surface CSS to point B of surface OSS, the particle maintained contact with the mantle. When the particle slid down along the mantle surface, it moved with the mantle from the spatial compound motion. As shown in Figure 2b, the motion characteristic of the particle was free-falling. When the particle was released by the mantle and concave, it fell freely from point A of the surface CSS to point B of the surface OSS. In this process, the particle did not contact the mantle. As shown in Figure 2c, the motion characteristic of the particle was spatial compound falling. When the particle began to fall freely from point A of surface CSS, it did not contact with the mantle surface. At a certain moment, the particle contacted the mantle surface at point C. After the contact, the particle slid from point C of the mantle surface to point B of the surface OSS. In this process, the particle always preserved contact with the mantle.

2.2.1. Coordinate System Transformation Matrix

In order to accurately describe the motion characteristics of particles in the crushing chamber, it is necessary to develop the motion characteristic equations of particles based on the spatial analysis of the force and acceleration components of particles. The absolute motion of particles can be synthesized by the relative motion of particles relative to the mantle surface and the traction motion of the contact point between the mantle surface and the particles. As a result, a coordinate system transformation matrix that can transform the coordinates and vectors in the dynamic coordinate system fixed on the mantle to the global coordinate system fixed on the cone crusher must be developed, thereby providing theoretical support for establishing and solving the particle motion characteristic equation in the same coordinate system.
The position of the dynamic coordinate system and the global coordinate system is shown in Figure 3. The origin O of the global coordinate system OXYZ was fixed at the center of the spherical plain bearing of the cone crusher; the Z-axis was aligned with the central axis of the cone crusher. The origin o of the dynamic coordinate system oxyz was fixed at the bottom center of the mantle; the z-axis was aligned with the central axis of the mantle. The mantle rotated at angular velocity w2 around the central axis of the cone crusher, as well as around its central axis at angular velocity w1. L represents the distance between the origin of the dynamic coordinate system and the global coordinate system. The angle between the central axis of the mantle and the central axis of the cone crusher is expressed as θ. The position vector of the origin o of the dynamic coordinate system in the global coordinate system is denoted by no. The position vector of the particle P in the dynamic coordinate system is denoted by nP.
Based on the coordinate system transformation theory [26], the coordinate system transformation matrix can be expressed as Equations (1) and (2).
P X Y Z = P X P Y P Z 1 = k x X k y X k x Y k y Y k z X x X k z Y y Y k x Z k y Z 0 0 k z Z z Z 0 1 p x p y p z 1 = K 4 p x y z
N X Y Z = N X N Y N Z 1 = k x X k y X k z X k x Y k y Y k z Y k x Z k y Z k z Z n x n y n z 1 = K 3 n x y z
where PXYZ and pxyz are the positions in the global coordinate system and the dynamic coordinate system. NXYZ and nxyz are the vectors in the global coordinate system and the dynamic coordinate system. X, Y, Z, x, y, and z denote the components of coordinates in the global coordinate system and the dynamic coordinate system. NX, NY, NZ, nx, ny and nz are the components of vectors in the global coordinate system and the dynamic coordinate system. kxX, kxY, kxZ, kyX, kyY, kyZ, kzX, kzY, kzZ, xX, yY and zZ are the elements of the coordinate system transformation matrix. K4 denotes the coordinate system transformation matrix of the coordinate. K3 denotes the coordinate system transformation matrix of the vector.
According to the structural and operating parameters of the cone crusher, the elements in the coordinate system transformation matrix can be expressed as follows.
k x X = sin w 1 t sin w 2 t + cos w 1 t cos w 2 t cos θ
k x Y = sin w 1 t cos w 2 t + cos w 1 t s i n w 2 t cos θ
k x Z = cos w 1 t sin θ
k y X = cos w 1 t sin w 2 t sin w 1 t cos w 2 t cos θ
k y Y = cos w 1 t cos w 2 t sin w 1 t sin w 2 t cos θ
k y Z = sin w 1 t sin θ
k z X = cos w 2 t sin θ
k z Y = sin w 2 t sin θ
k z Z = cos θ
x X = L cos w 2 t sin θ
y Y = L sin w 2 t sin θ
z Z = L cos θ

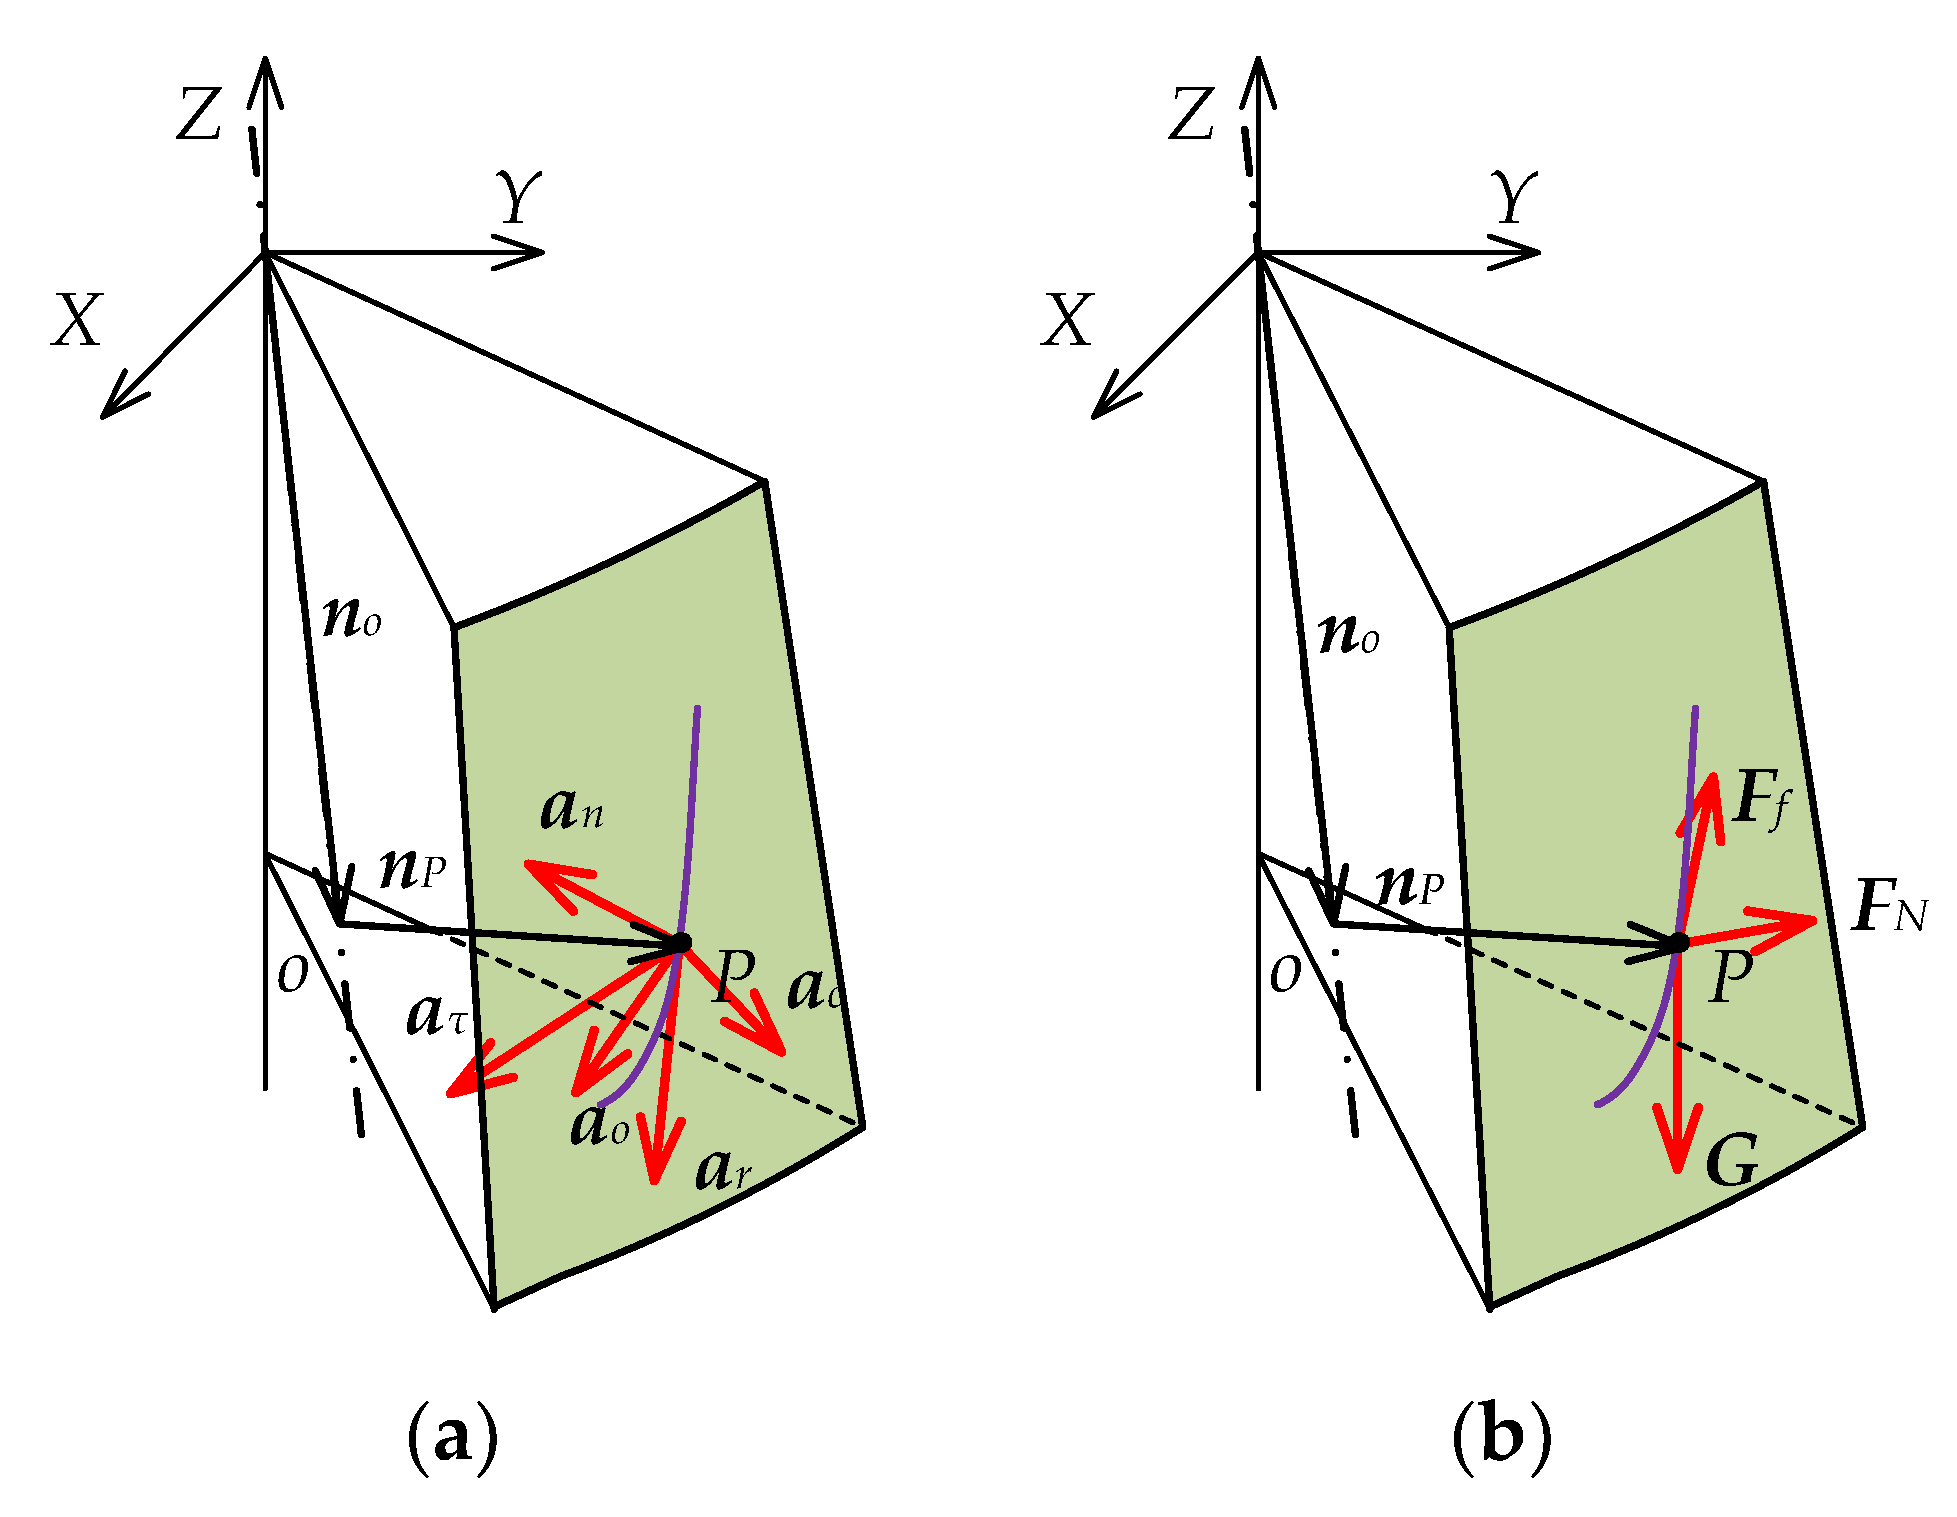
2.2.2. Motion Characteristic Equations of the Particles

Motion Characteristic Equation of the Particle with Spatial Sliding

The particle P in the crushing chamber was selected as the research object. When the motion characteristic of particle P was spatial sliding, it slid along the mantle surface and moved with the mantle in the spatial compound motion. In this process, the particle remained in contact with the mantle. The force and acceleration components of the particle P are shown in Figure 4.
As shown in Figure 4a, the absolute acceleration ap of the particle P was composed of the following components: the acceleration ao of the origin o of the dynamic coordinate system, the normal acceleration an and tangential acceleration aτ of the contact point between the particle and the mantle, the relative acceleration ar of the particle sliding on the mantle, and the Coriolis acceleration ac generated by the motion of the dynamic coordinate system, as shown in Equation (15).
a P = a o + a n + a τ + a r + a c
Since the dynamic coordinate system oxyz fixed on the mantle rotated around the central axis of the cone crusher, the acceleration ao of the origin o of the dynamic coordinate oxyz can be expressed as Equation (16).
a o = d 2 n o d t 2 = d 2 L s i n θ c o s w 2 t d t 2 d 2 L s i n θ s i n w 2 t d t 2 d 2 L c o s θ d t 2 = w 2 2 L s i n θ c o s w 2 t w 2 2 L s i n θ s i n w 2 t 0
The second derivative of the particle position vector nP in the dynamic coordinate system can be used to determine the relative acceleration ar of the particle.
a r = d 2 n P d t 2 = d 2 x d t 2 d 2 y d t 2 d 2 z d t 2
Since the mantle rotates around its central axis, the normal acceleration an and tangential acceleration aτ of the of contact point between the particle P and the mantle can be expressed as Equations (18) and (19).
a n = w 1 × w 1 × n P
a τ = w 1 × n P
The Coriolis acceleration ac of the contact point between the mantle and the particle can be expressed as Equation (20).
a c = 2 w 1 × n p
In combined Equations (15–20), the absolute acceleration ap of particle P with spatial sliding in the global coordinate system can be expressed as Equation (21).
a P = n o + n p + w 1 × w 1 × n P + w 1 × n P + 2 w 1 × n p
As shown in Figure 4b, the resultant force of particle P consists of the following parts: the support force FN of the mantle to particle P, the friction force Ff between the mantle and the particle P, and gravity G.
F P = F N + F f + G
The support force FN on the particle P perpendicular to the mantle surface can be expressed as Equation (23).
F N = F N 2 f s x , y , z x 2 2 + 2 f s x , y , z y 2 2 + 2 f s x , y , z z 2 2 2 f s x , y , z x 2 2 f s x , y , z y 2 2 f s x , y , z z 2
where f s x , y , z denotes the equation of the mantle surface.
The friction force Ff between the particle P and the mantle surface is proportional to the support force FN, and the direction is opposite to its motion relative to the mantle. As a result, the friction force Ff of particle P can be expressed as Equation (24).
F f = μ F N d x d t 2 + d y d t 2 + d z d t 2 d x d t d y d t d z d t
where μ denotes the friction coefficient between particle and mantle surface.
The gravity G of particle P can be expressed as Equation (25).
G = 0 0 m g
where m is the weight of the particle P, g denotes the gravitational acceleration.
According to Newton’s second law, the motion characteristic equation of the particle with spatial sliding can be expressed as Equation (26).
F N + F f + G m a P = 0
Through the coordinate transformation matrix K4 and K3, the coordinates and vectors in the dynamic coordinate system are transformed into the global coordinate system, and the Equation (26) is decomposed along the X-axis, Y-axis, and Z-axis of the global coordinate system.
f X x , y , z , x , y , z , x , y , z , g , w 1 , w 2 , θ , μ , L , F N = 0
f Y x , y , z , x , y , z , x , y , z , g , w 1 , w 2 , θ , μ , L , F N = 0
f Z x , y , z , x , y , z , x , y , z , g , w 1 , w 2 , θ , μ , L , F N = 0
The combining Equations (27)–(29) include not only algebraic terms such as x, y, z, and FN, but also first-order and second-order differential terms such as x’, y’, z’, x’’, y’’, and z’’. As a result, the combining equations of the particle with spatial sliding are nonlinear second-order differential-algebraic equations (DAEs). By solving the DAEs, the motion characteristics of particle with spatial sliding were obtained.

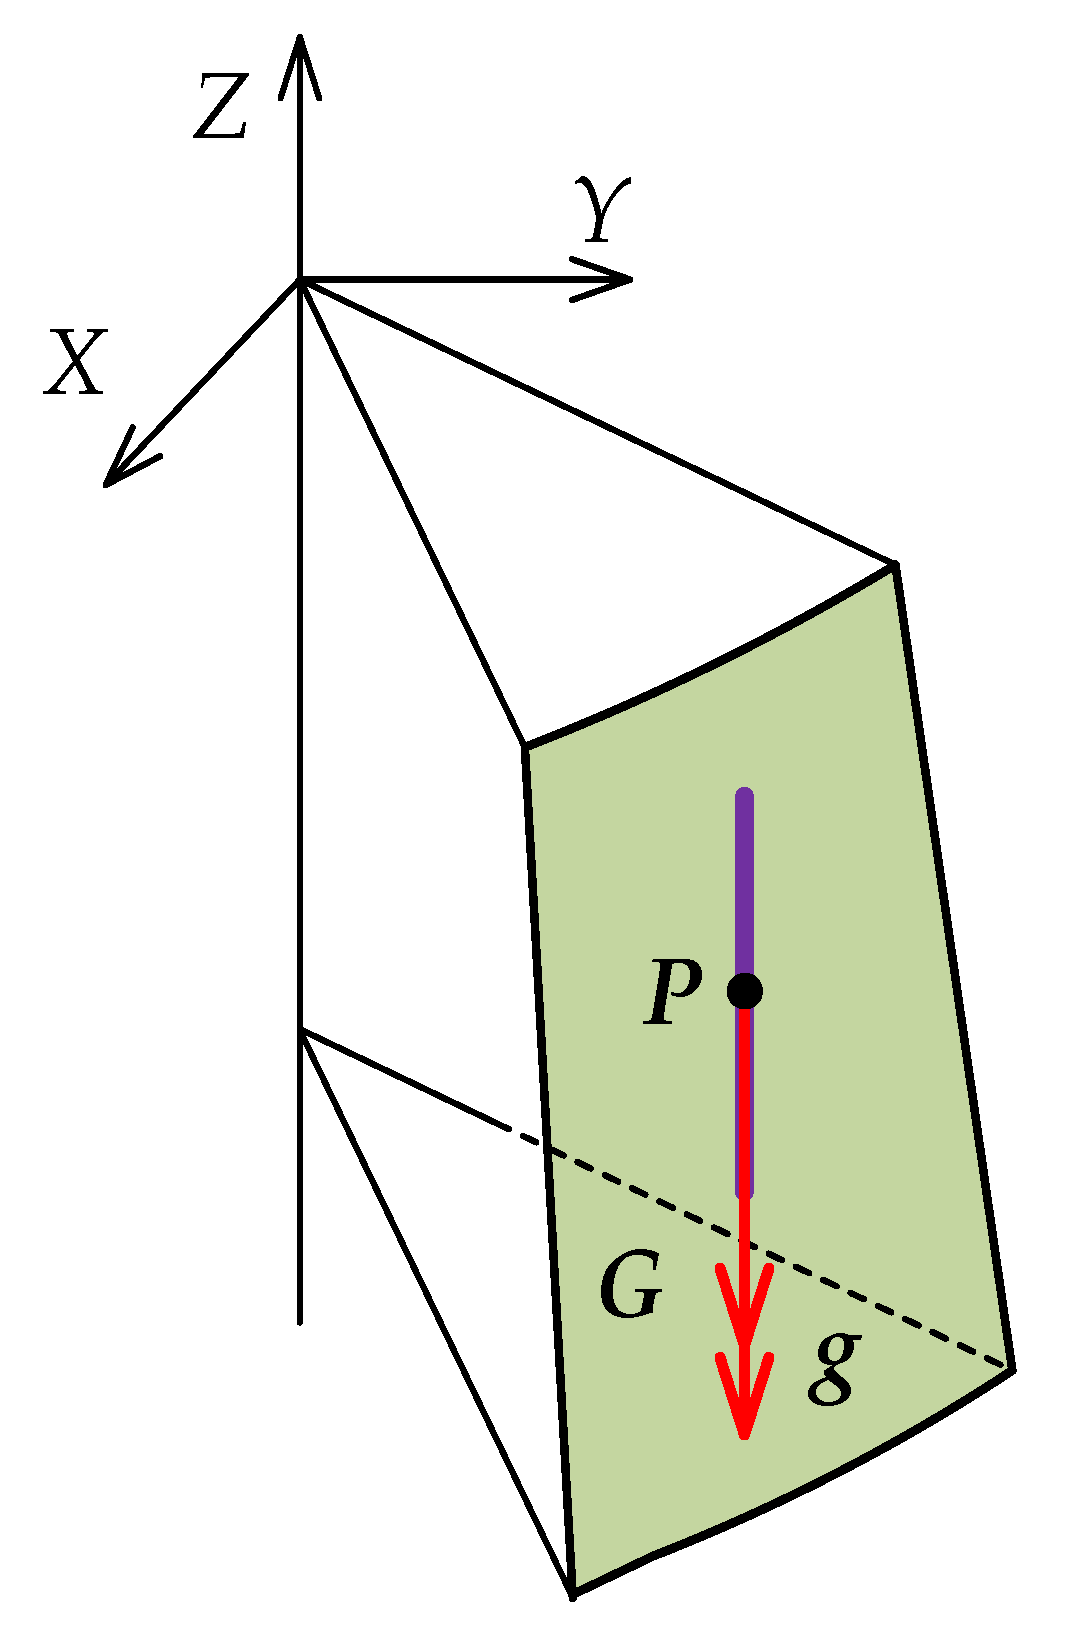
Motion Characteristic Equation of the Particle with Free-Falling

The particle P in the crushing chamber was selected as the research object. When the particle P was released by the mantle and concave, the motion characteristic of the particle P was free-falling, as it was only affected by gravity in the falling process. The force and acceleration components of the particle P are shown in Figure 5.
During the free-falling of the particle, the size and direction of gravity G are constant. Thus, the motion characteristic equation of particle P with free-falling can be expressed as Equation (30).
X Y Z = X 0 Y 0 Z 0 0 0 g t 2 2
where X, Y, and Z represent the real-time position of the particle in the global coordinate system. X0, Y0, and Z0 denote the initial position of the particle in the global coordinate system. t is the time of free-falling.
At a certain time, the free-falling particle P contacted with the mantle. The contact point was not only the end point of the free-falling of the particle P, but also a point on the mantle surface with the spatial compound motion. According to the coordinate system transformation matrix K4, the coordinates of the contact point between the particle P and the mantle surface can be solved by the Equation (31).
X 0 Y 0 Z 0 g t 2 2 1 = K 4 x y z 1
where x, y, and z represent the real-time position of the particle in the dynamic coordinate system.
By combining Equations (30) and (31), the free-falling time of particles P was solved, and the motion characteristic equation of particle with free-falling was developed.

Motion Characteristic Equation of the Particle with Spatial Compound Falling

The motion characteristic of the particle with the spatial compound falling both possessed the features of spatial sliding and free-falling. Particle P freely fell as it was released by the mantle and concave. At a certain time, the particle P contacted with the mantle and slid on the mantle surface. As a result, the spatial compound falling of particle P was composed of a free-falling part and a spatial sliding part. In the free-falling part of particle P, the free-falling time and the coordinates of the contact point were determined by the initial coordinates of particle P and the motion characteristic equation of free-falling. The coordinates of the contact point and the free-falling time are taken as the initial state of the spatial sliding part of particle P. According to the motion characteristic equation of spatial sliding, the motion characteristics of the spatial sliding of particle P can be solved. Thus, all the motion characteristics of the particle P with spatial compound falling were achieved.

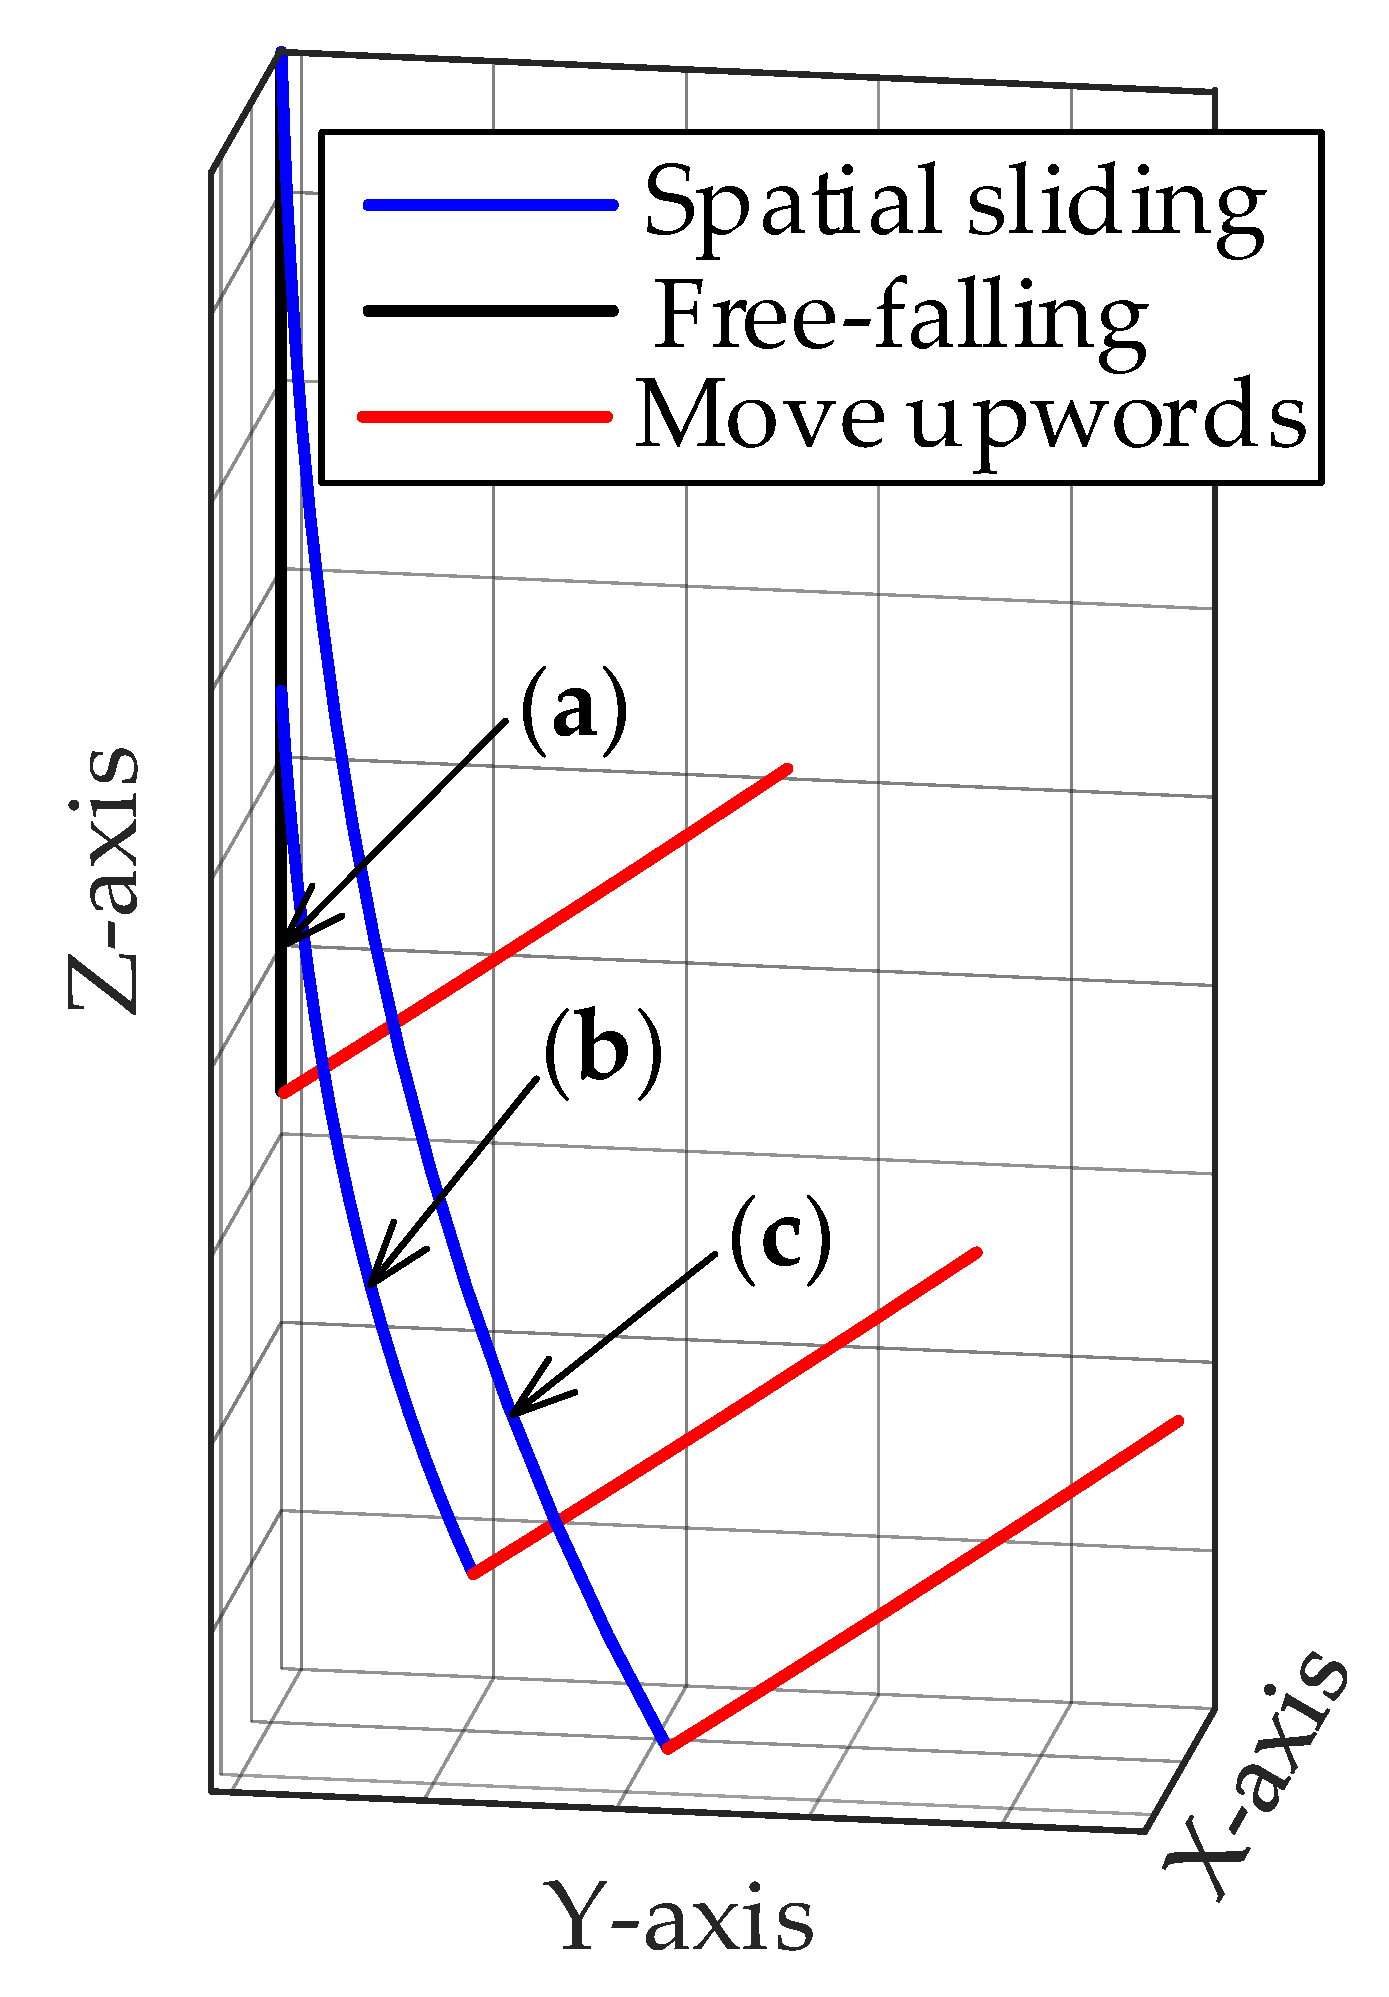
2.2.3. Path of Particle Affected by the Spatial Compound Motion of the Mantle

By investigating the force and acceleration of particles affected by the spatial compound motion of the mantle, the motion characteristic equations of particles with spatial sliding, free-falling, and spatial compound falling were established. As shown in Figure 6, the paths of the particles in a single crushing cycle were determined by solving the motion characteristic equations of particles with various motion characteristics.
As shown in Figure 6, the paths of particles with spatial sliding, free-falling, and spatial compound falling include both identical and dissimilar components in a crushing cycle. The paths of the particles with all three motion characteristics possess an upward curve caused by the upward movement together with the mantle. Because the particle with spatial sliding directly contacts with the mantle during the falling process, the motion characteristic of the particle was affected by the spatial compound motion of the mantle. As a result, the particle followed an arc-shaped path that was circumferentially deflected around the central axis of the cone crusher. Due to the fact that the particle with free-falling was never in contact with the mantle during the falling process, the path of the particle was always a straight line. The path of the particle with spatial compound falling combined the features of the paths of spatial sliding and free-falling. When the particle fell freely in the process of spatial compound falling, the path of the particle was straight and did not deflect circumferentially around the central axis of the cone crusher. As the particle was in contact with the mantle, the motion characteristic of the particle changed to spatial sliding; the path of the particle was arc-shaped and deflected circumferentially around the central axis of the cone crusher.

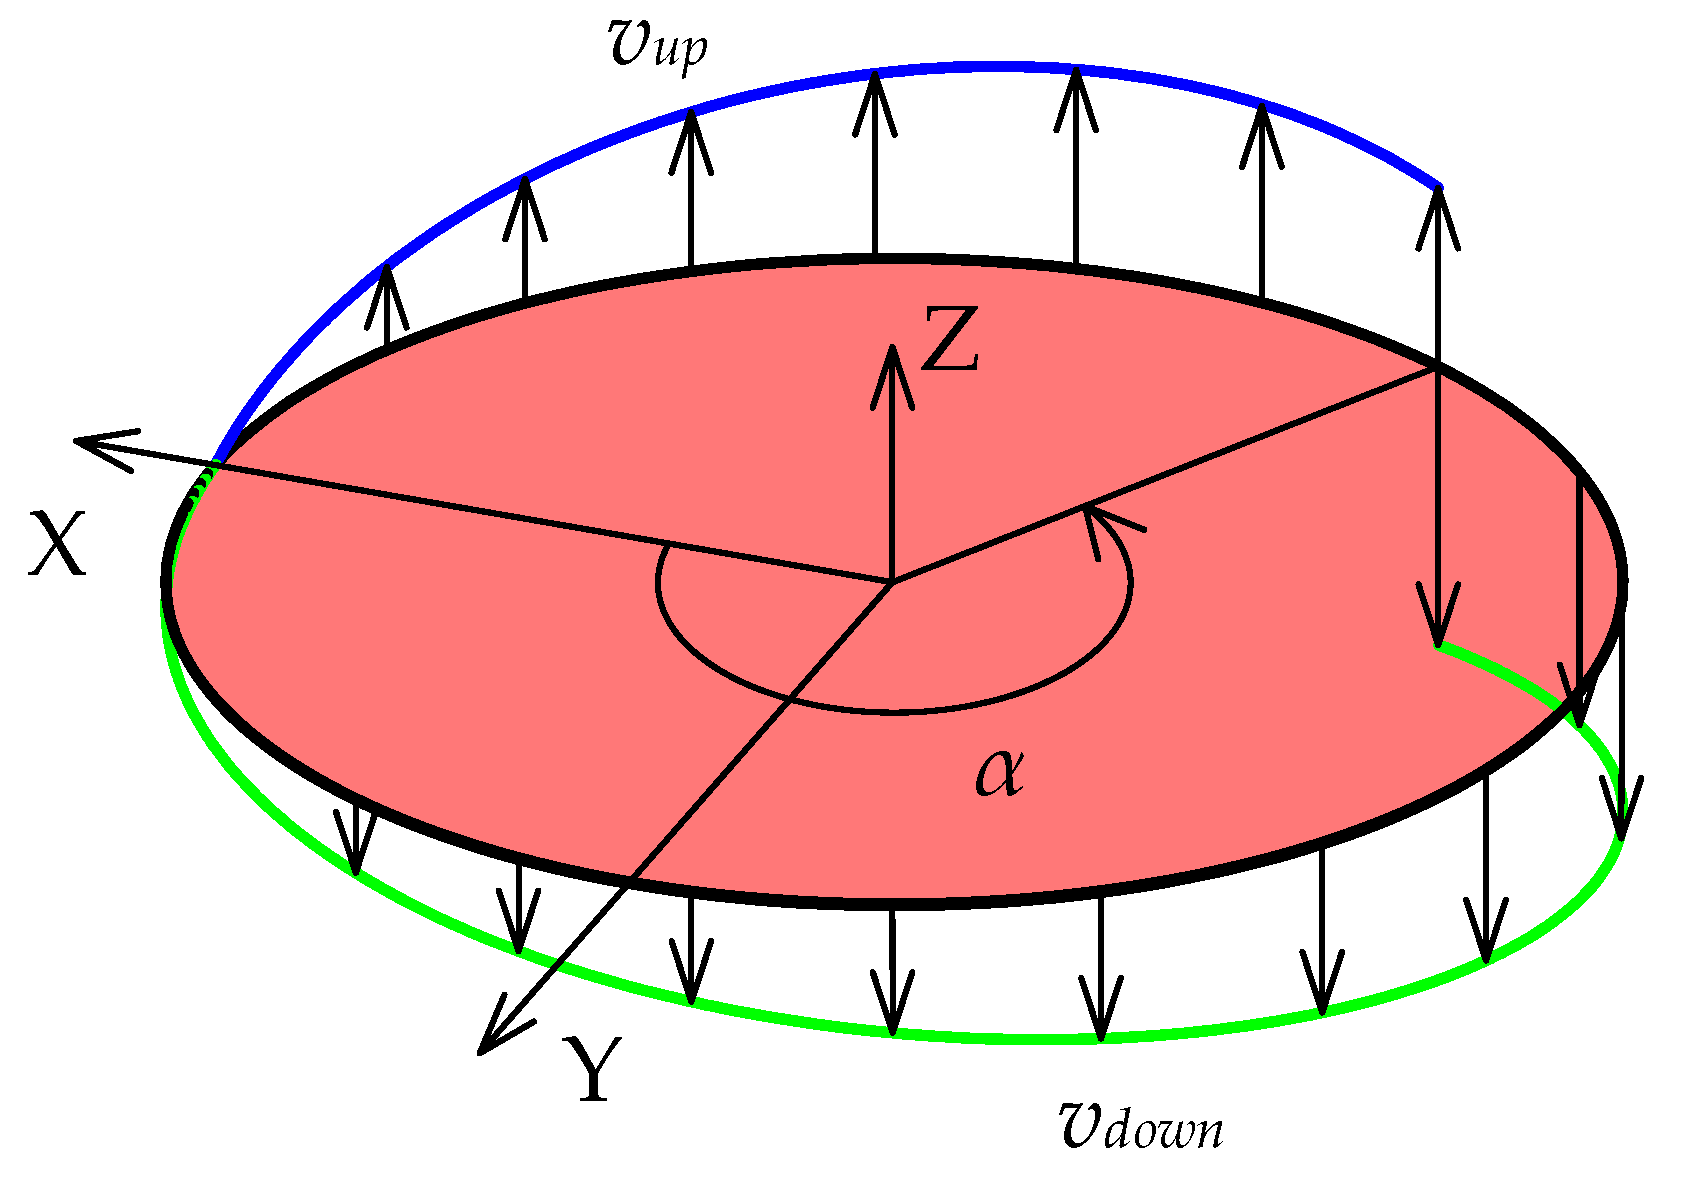
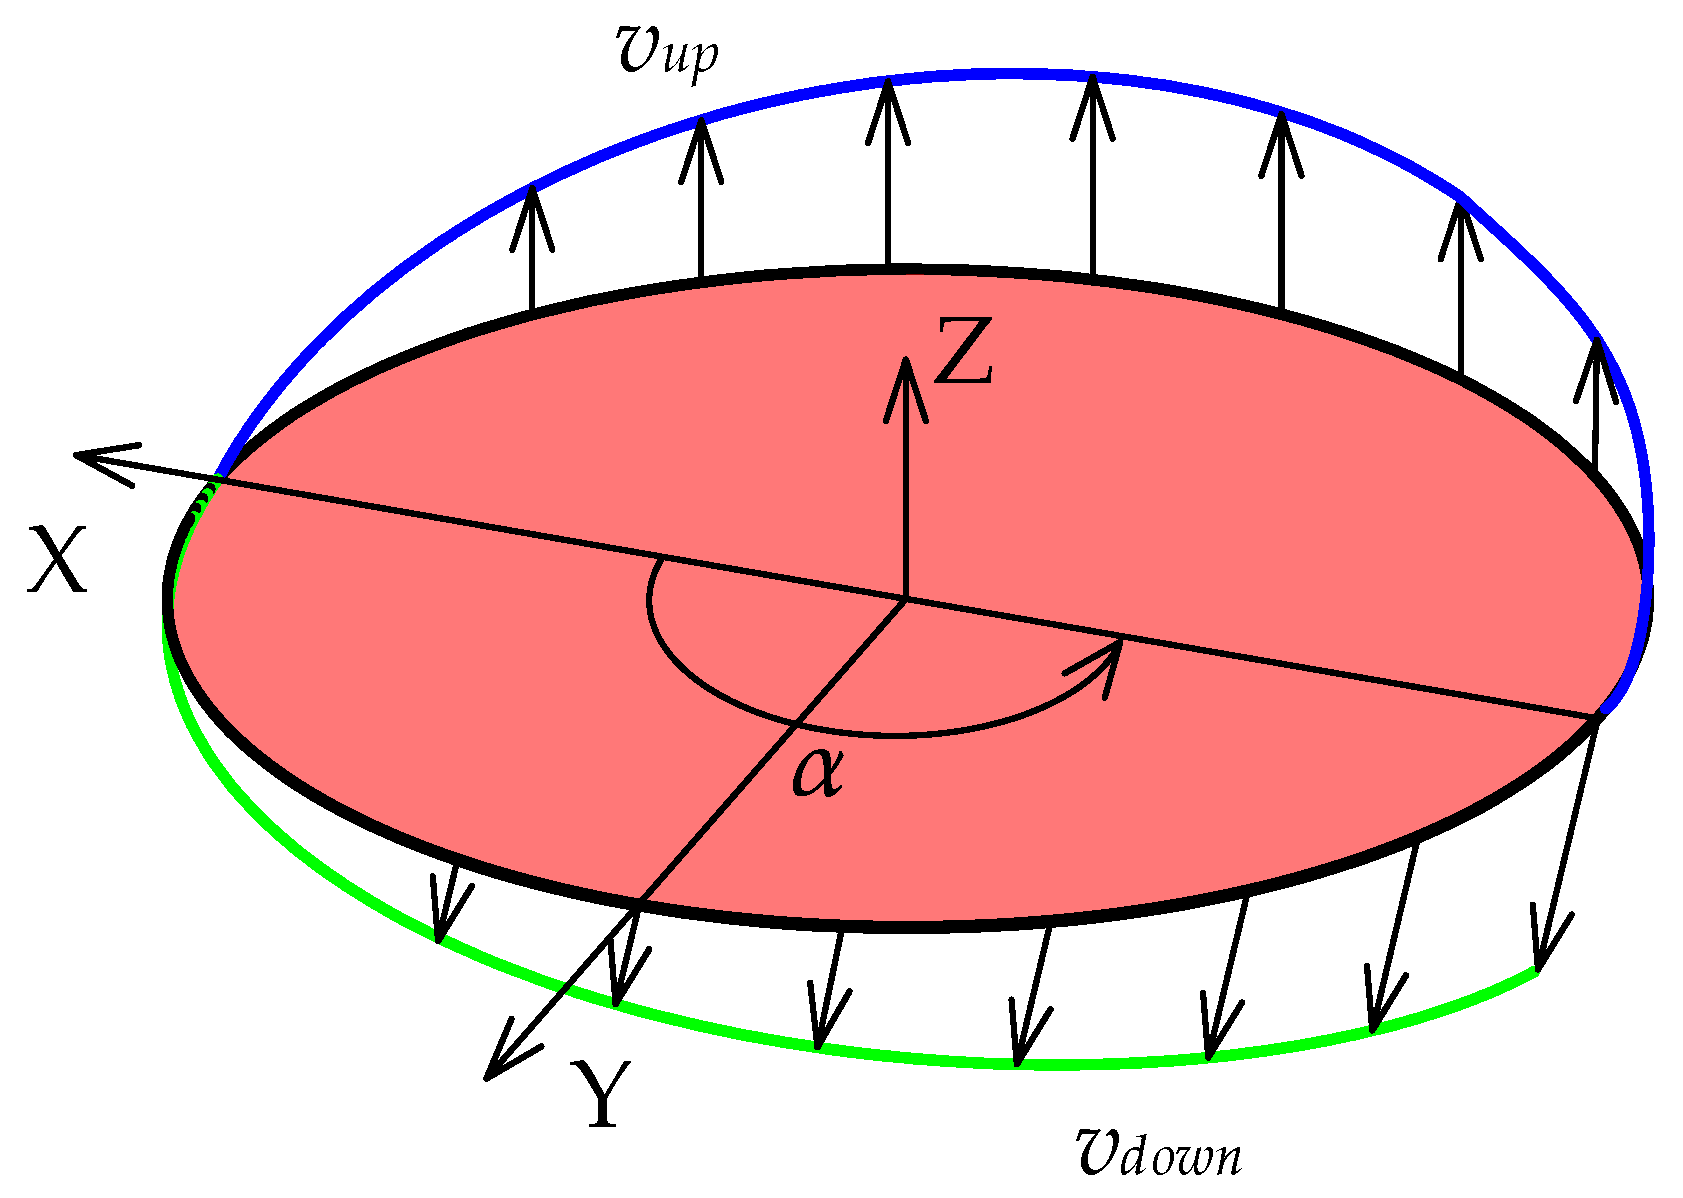
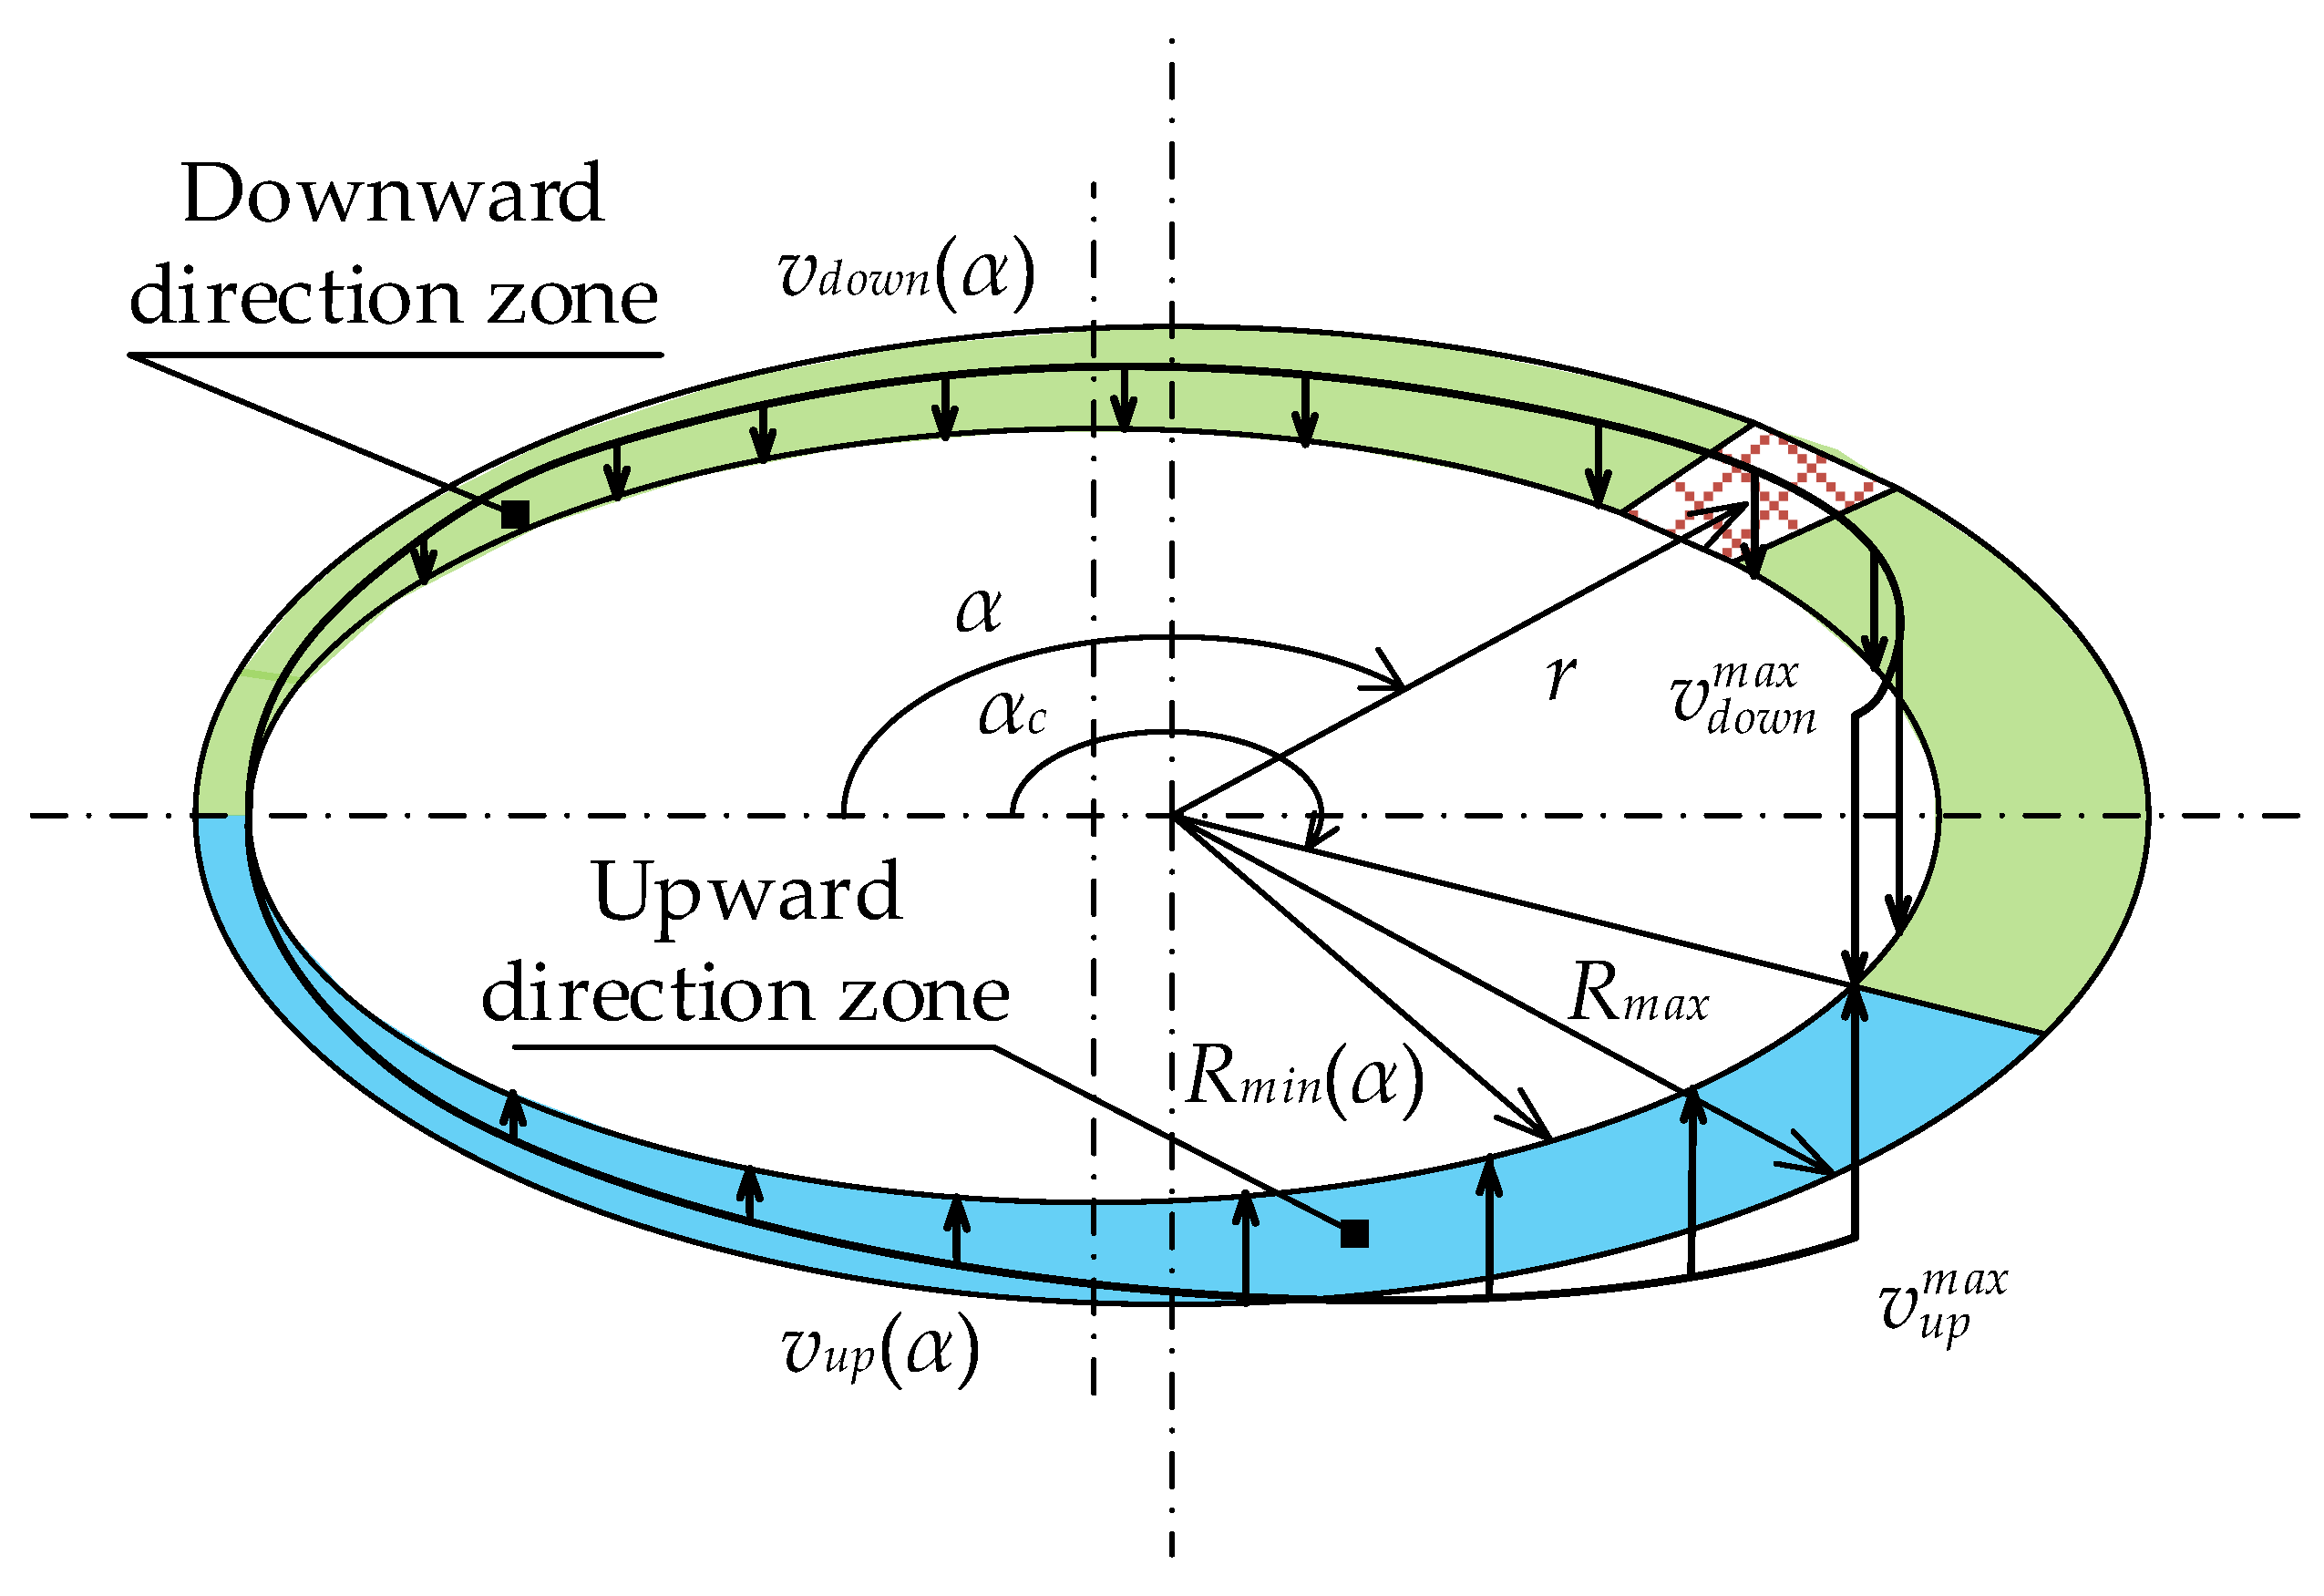
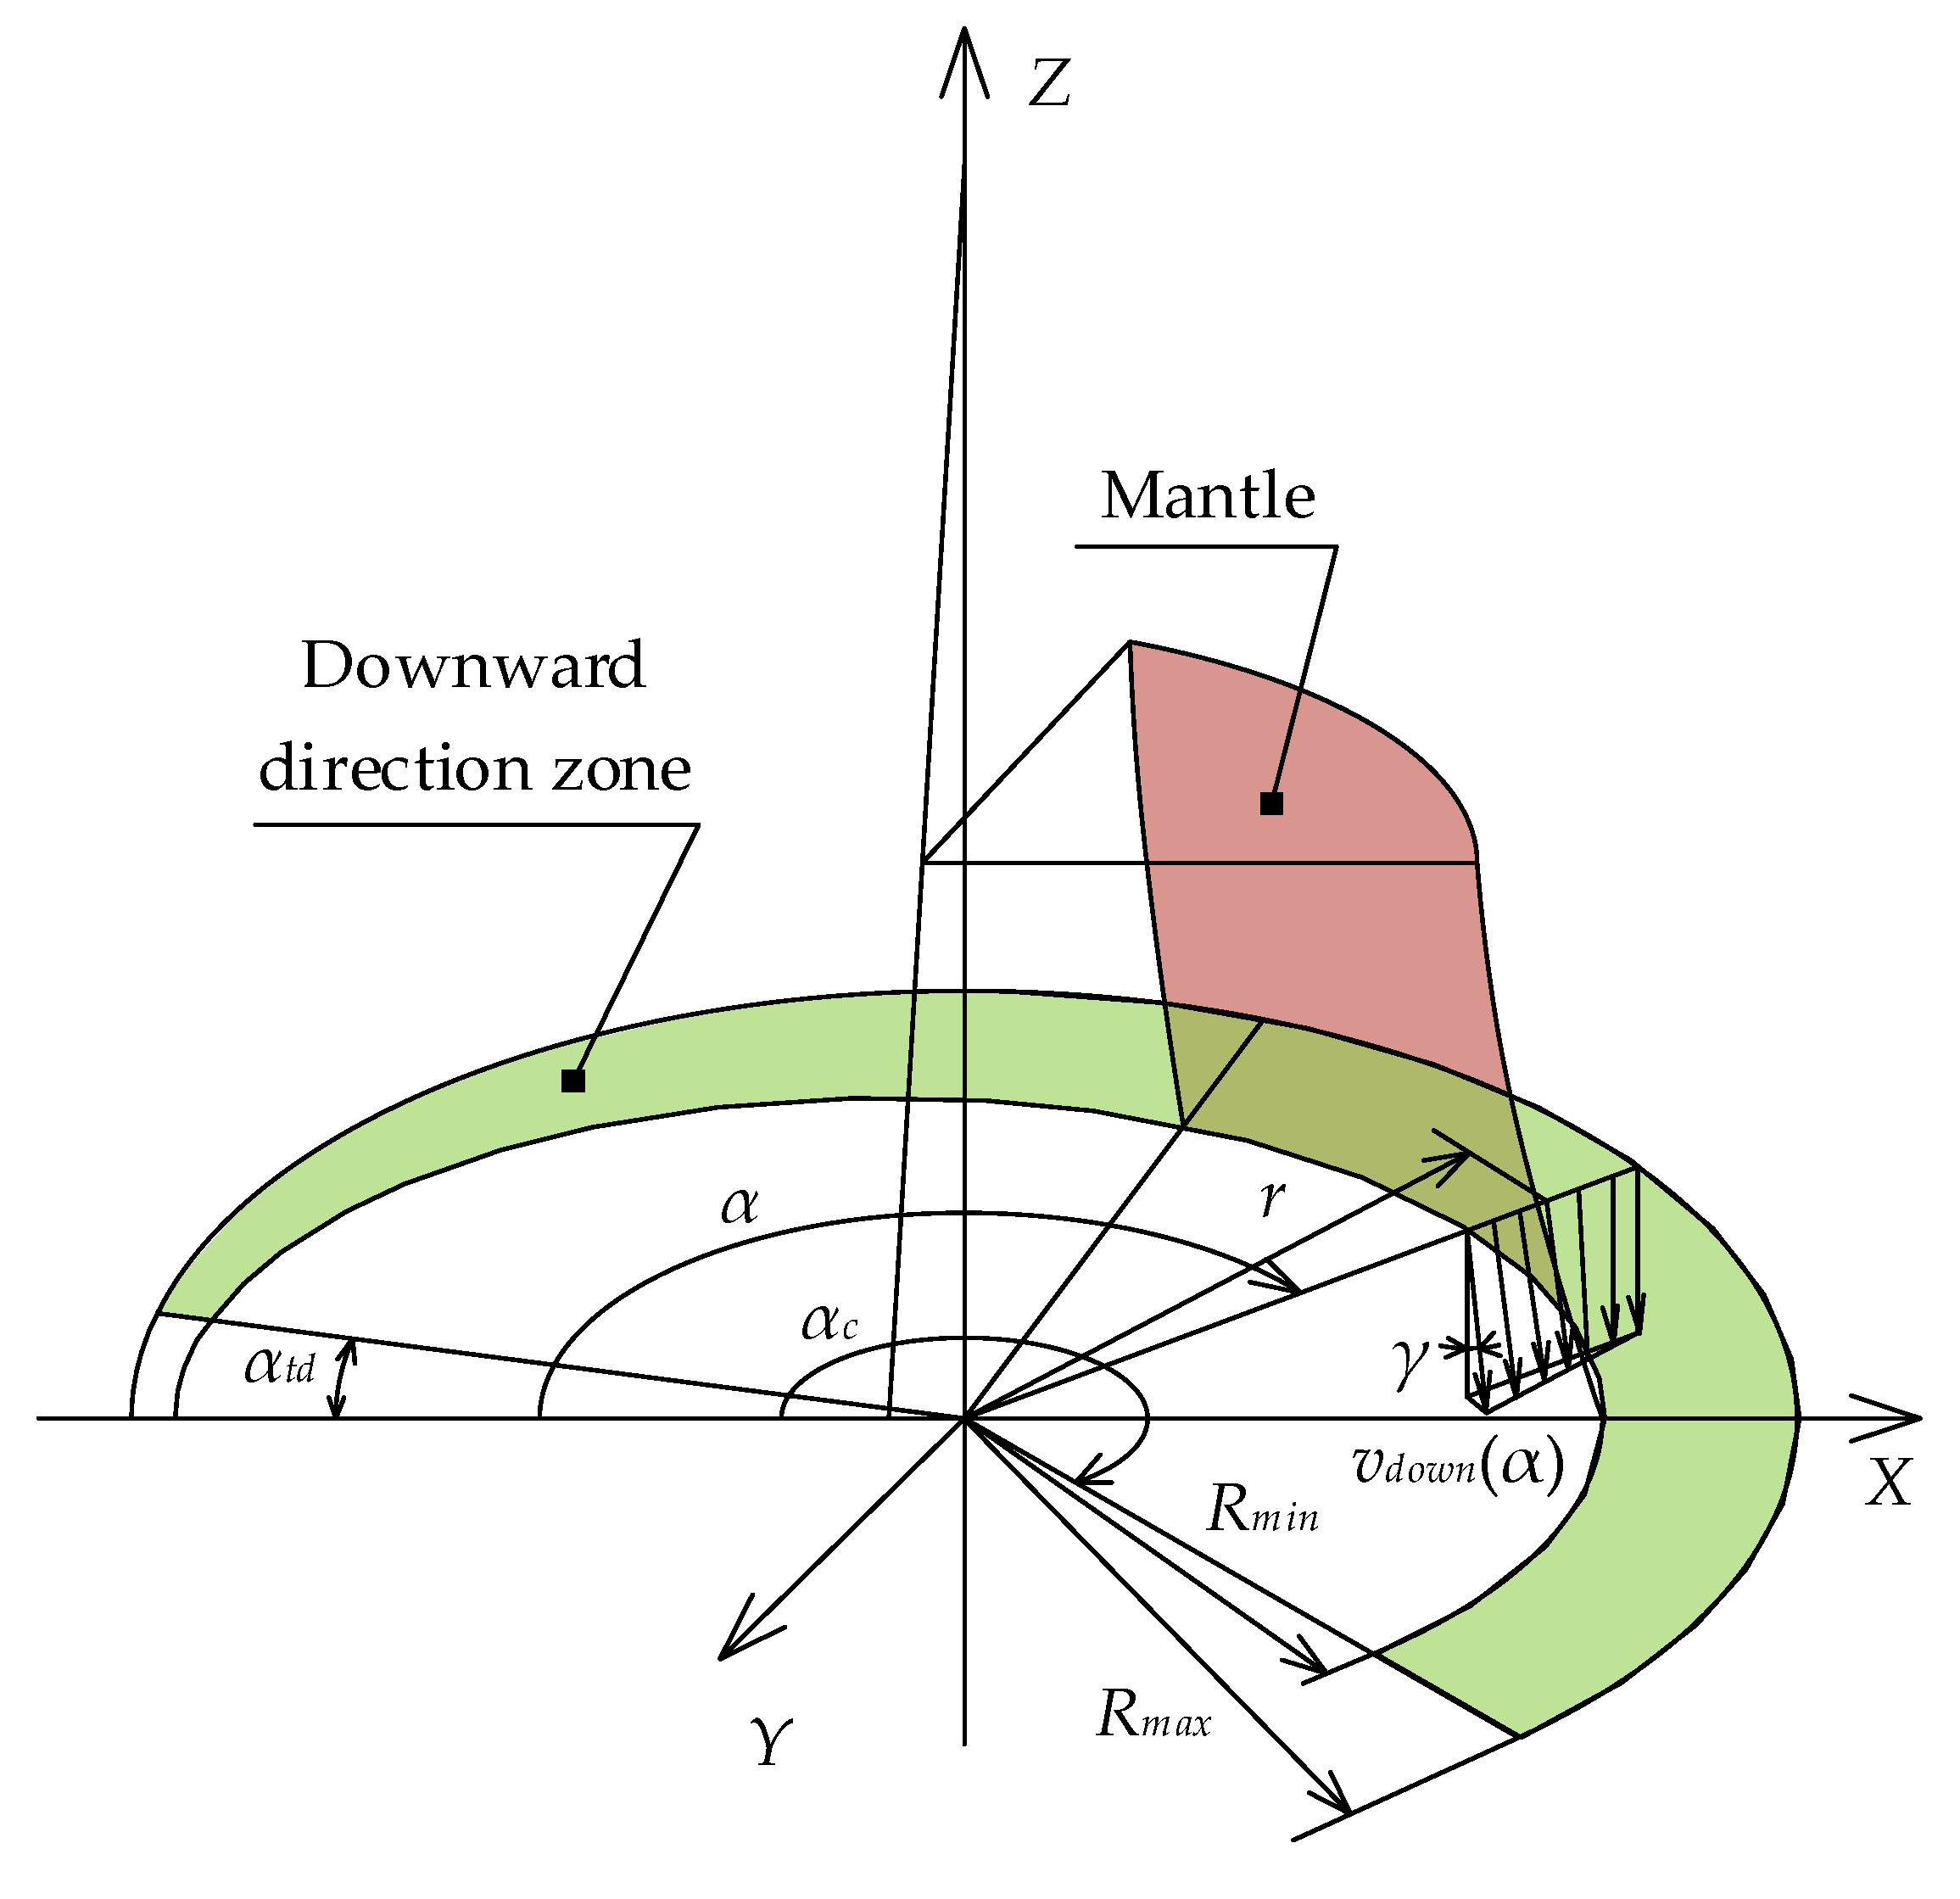
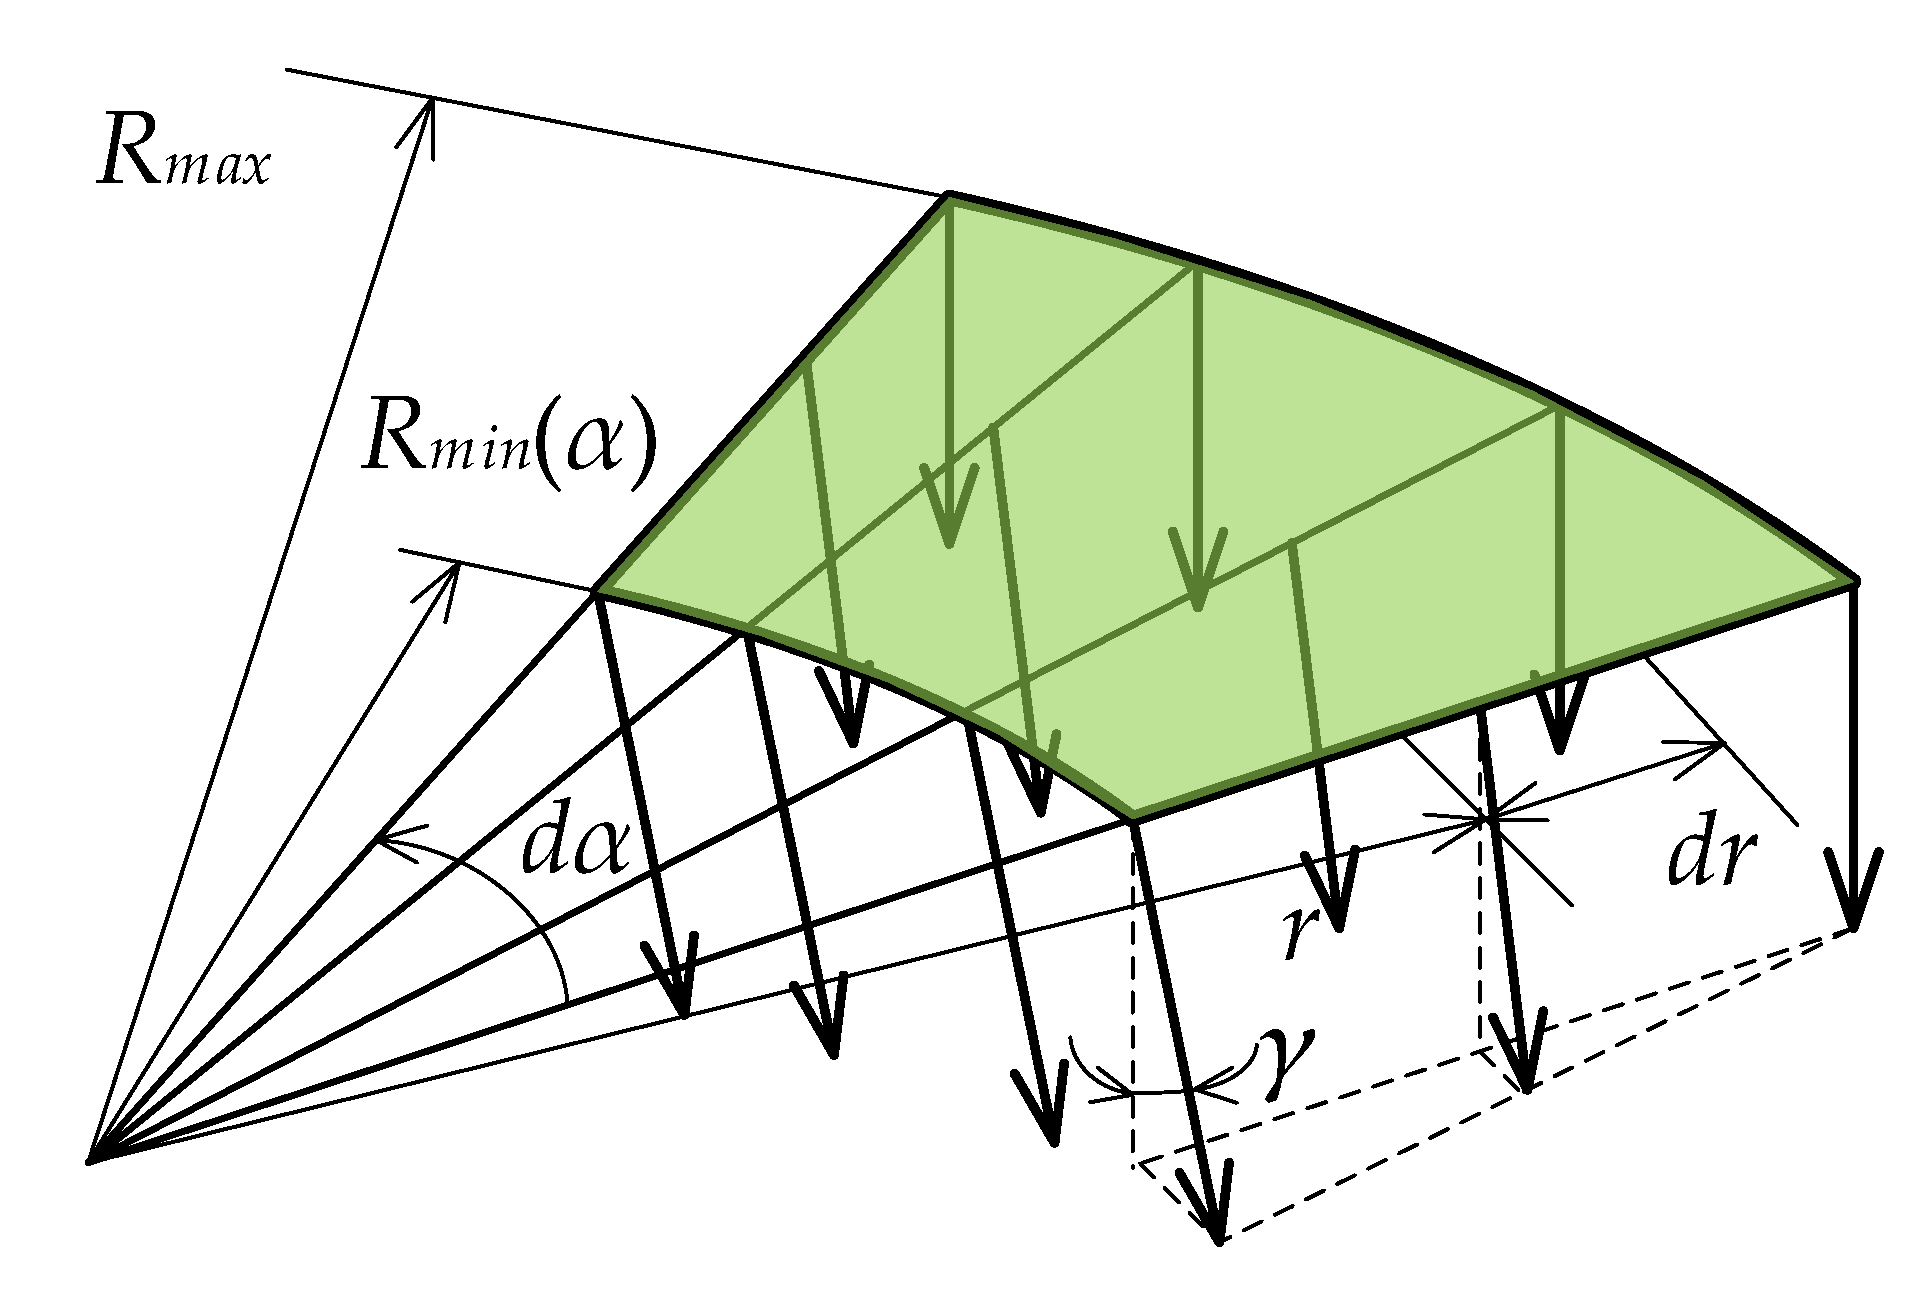
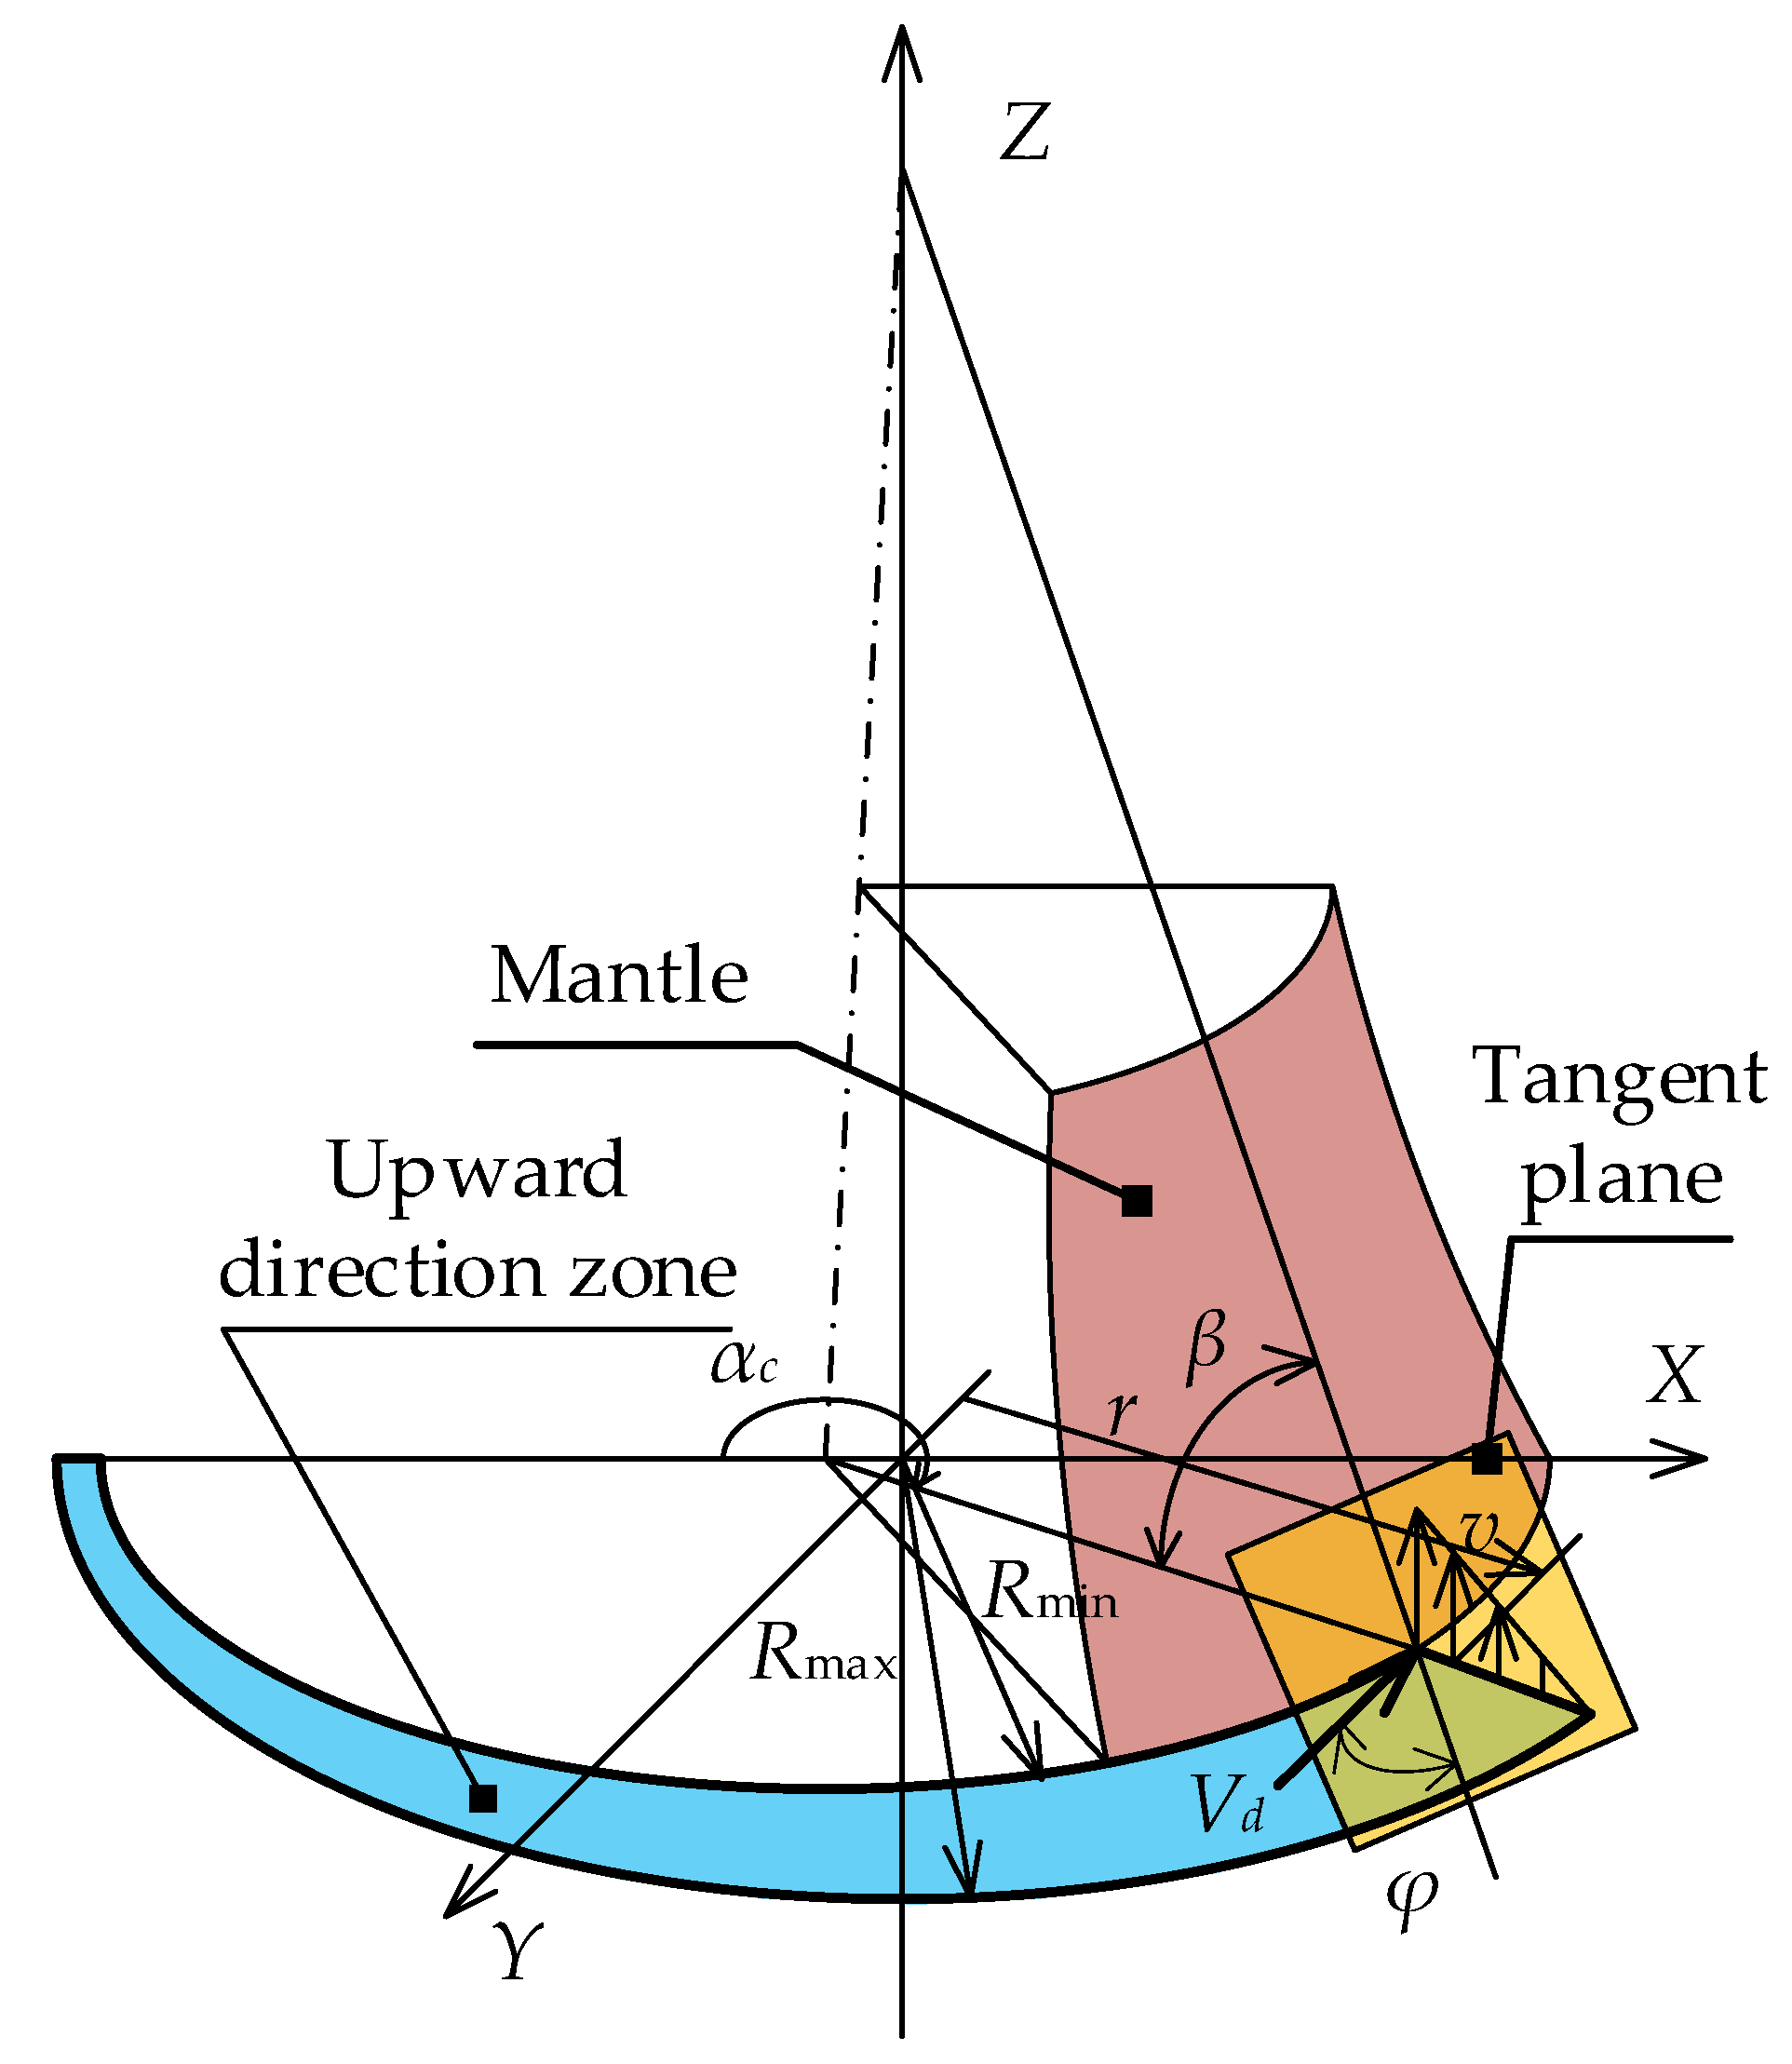
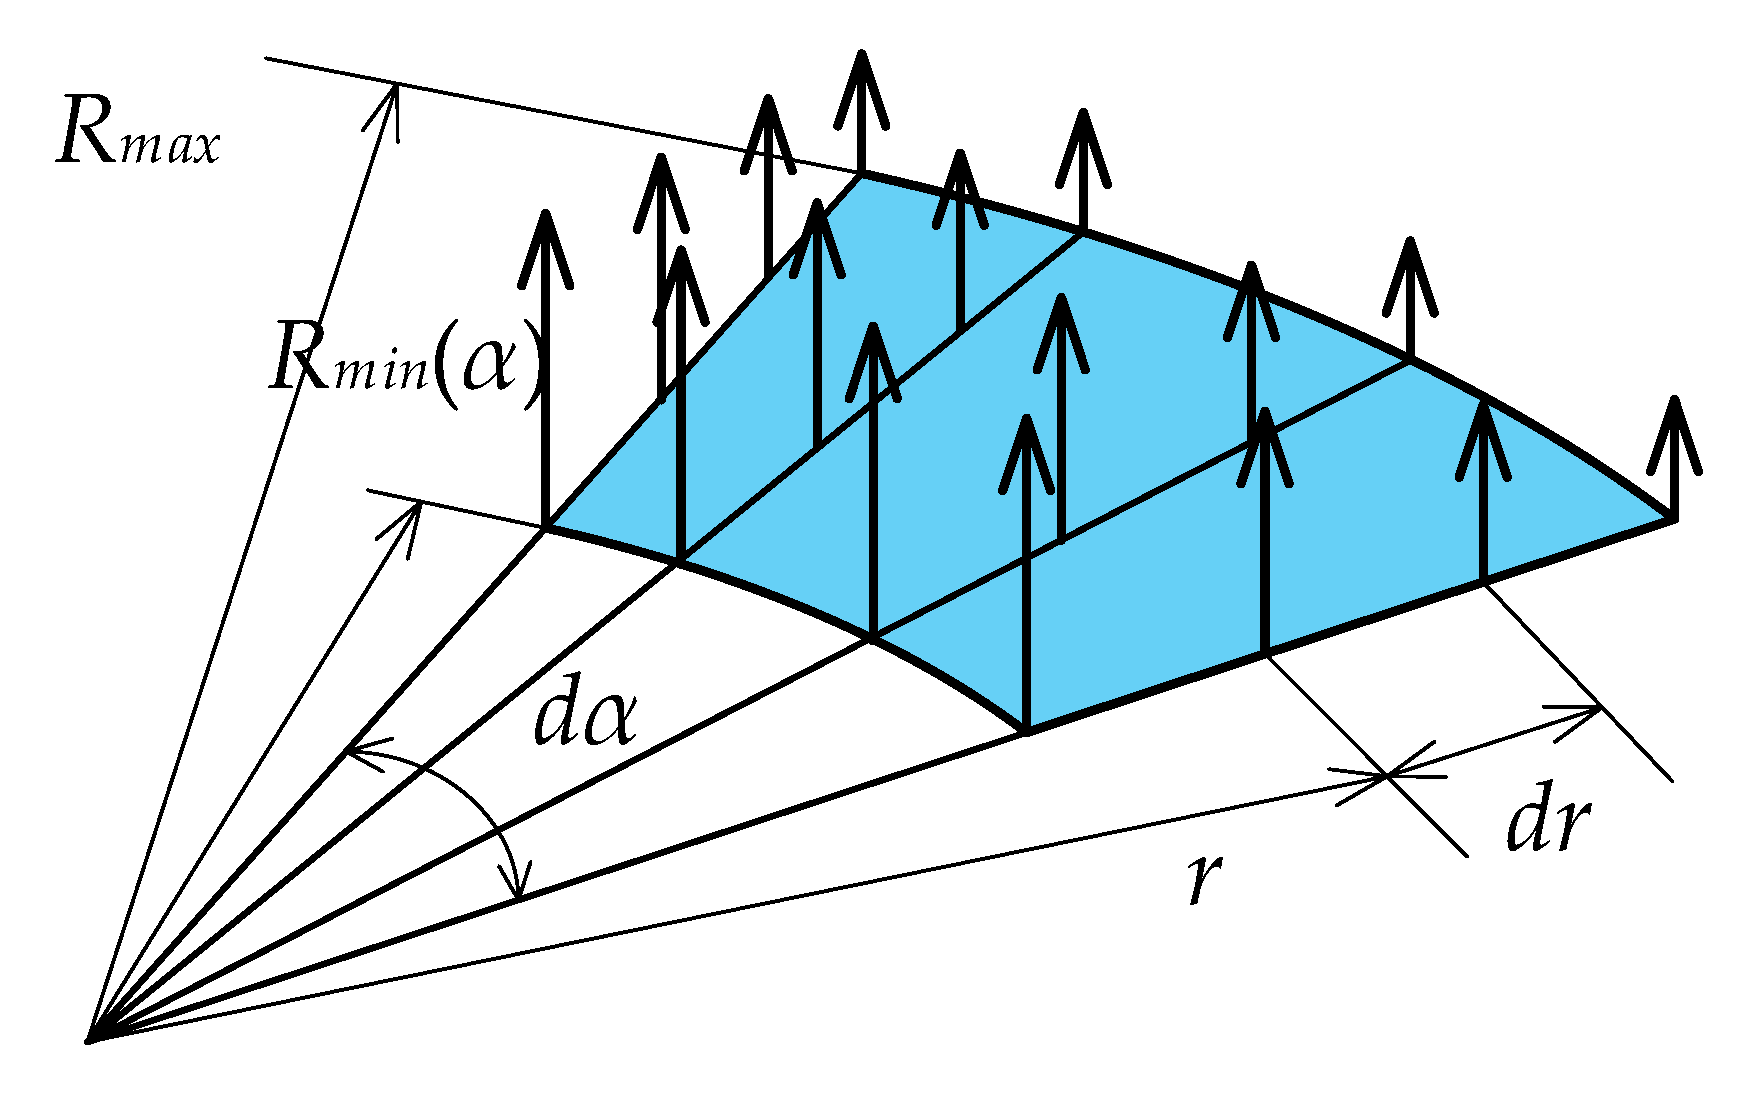
2.2.4. Velocity Distributions of Particles around the Mantle Surface

Based on the motion characteristic equations of particles, which were affected by the spatial compound motion of the mantle, the motion characteristics of particles in the crushing chamber can be solved according to the structural and operating parameters of the cone crusher, so that the velocity of particles with different motion characteristics can be obtained. Then the velocity distribution of the particles in a certain cross-section around the mantle surface in the crushing chamber can be determined, as shown in Figure 7, Figure 8 and Figure 9.
The velocity distribution of particles with free-falling around the mantle surface in a cross-section of the crushing chamber is shown in Figure 7. With the increase of the circumferential angle α around the central axis of the cone crusher, the velocity vdown of the particles around the mantle surface increased continuously. However, the velocity vup of the particles increased initially and then decreased. This was due to the fact that the velocity vdown of particles with free-falling was proportional to the falling time. With the increase of the circumferential angle α, the falling time of particles after the release of the mantle and concave increased, resulting in a continuous increase in the velocity vdown of the particles in the process of free-falling. At a certain moment, the free-falling particles contacted and moved upward with the mantle. The velocity of the mantle increased first and then decreased when it moved towards the concave, causing the velocity vup of the particles to increase initially and then decrease.
The velocity distribution of particles with spatial sliding around the mantle surface in a cross-section of the crushing chamber is shown in Figure 8. With the increase of the circumferential angle α around the central axis of the cone crusher, the velocity vdown of the particles increased and deflected circumferentially around the central axis of the cone crusher. However, the velocity vup of the particles increased initially and then decreased. This was due to the fact that the particles were in direct contact with the mantle during the spatial sliding. The particles were affected by the spatial compound motion of the mantle, resulting in a circumferential deflection of velocity vdown around the central axis of the cone crusher. Thus, the velocity distribution was also deflected circumferentially around the central axis of the cone crusher.
The velocity distribution of particles with spatial compound falling around the mantle surface in a cross-section of the crushing chamber is shown in Figure 9. As the particles were released by the mantle and concave, the motion characteristics of the particles were free-falling. The velocity vdown of the particles increased with the increase of the circumferential angle α around the central axis of the cone crusher and did not deflect around the central axis of the cone crusher. Since the motion characteristics of the particles changed from free-falling to spatial sliding after contact with the mantle, the velocity of particles changed significantly. During the process of spatial sliding, the velocity vdown of the particles increased continuously, while circumferential deflection occurred around the central axis of the cone crusher. The velocity vup of the particles moving upward with the mantle increased initially and then decreased.

3. Improved Capacity Model of Cone Crusher

Capacity is a core performance indicator of a cone crusher, which is determined by the motion characteristics of particles. When the particles pass through the crushing chamber, there is a cross-section with the smallest area in the crushing chamber, which limits the capacity of the cone crusher. By solving the motion characteristic equations considering the effect of the spatial compound motion of the mantle on the motion characteristics of the particles, the motion characteristics of particles passing through the choke-level are determined, and the velocity distribution of particles around the mantle surface is obtained. A more accurate capacity model for cone crushers with different motion characteristics of particles in the crushing chamber is established.
As shown in Figure 10, the choke-level was a virtual cross-section perpendicular to the central axis of the cone crusher in the crushing chamber. The crushed particles can be discharged from the crushing chamber only after passing through the choke-level. Due to the eccentric rotation of the mantle around the central axis of the cone crusher, as one side of the mantle moves toward the concave, the particles were clamped and pushed upward by the mantle. Simultaneously, the other side of the mantle moved away from the concave, the particles were released and fell downward. Due to the motion direction of the particles and the motion characteristics of the mantle, the choke-level in the crushing chamber was divided into two zones: the downward direction zone, where the particles go down through the choke-level and the upward direction zone, where the particles go up through the choke-level.
As shown in Figure 10, the choke-level, which consists of the mantle surface Rmin(α) and the concave surface Rmax, is divided into the downward and upward direction zones according to the circumferential angle αc. The circumferential angle αc denotes the angle of the mantle rotating around the central axis of the cone crusher when the particle contacts with the mantle, which is determined by calculating the motion characteristic equation of particles. With a variation of the circumferential angle αc, the particles in a certain zone of the choke-level at a distance r from the central axis of the cone crusher exhibited various motion characteristics. In the downward direction zone of the choke-level, the particles passed through the choke-level from top to bottom. In this process, the motion characteristics and the maximum velocity v d o w n m a x of the particle can be obtained by the motion characteristic equations of particles; in addition, the velocity distribution vdown(α) of particles around the mantle surface can be determined. In the upward direction zone of the choke-level, the particles pass through the choke-level from bottom to top. In this process, the maximum velocity v u p m a x of the particle moving with the mantle surface can be solved by the spatial compound motion characteristics of the mantle, so that the velocity distribution vup(α) of particles around the mantle surface can be achieved.
The downward direction zone of the choke-level in the crushing chamber is shown in Figure 11.
In the initial falling stage of the particles, after being released by the mantle and concave, the particles exhibited a short delayed time td. Due to the inside friction and moisture, the particles stick on the concave surface before falling. The circumferential angle αtd is the angle of the mantle rotating around the central axis of the cone crusher when the particles stick on the concave surface. Thus, there is a zone where the particles do not move in the downward direction zone. According to the relevant experimental research [7], if the value of td is 0.01s, then αtd can be solved by Equation (32).
α t d = π n t d 30
The maximum velocity v d o w n m a x of particles in the downward direction zone can be calculated by the motion characteristic equations of particles affected by the spatial compound motion of the mantle. However, the velocity distribution v d o w n α of particles around the mantle surface is linearly related to the circumferential angle α. Because the maximum velocity v d o w n m a x of the particles is located at circumferential angle αc, the velocity distribution v d o w n α of particles around the mantle surface in the choke-level can be expressed as Equation (33).
v d o w n α = α α t d α c α t d v d o w n m a x
According to the motion characteristic equations of particles affected by the spatial compound motion of the mantle, if the motion characteristics of the particles passing through the choke-level are spatial sliding or spatial compound falling, the velocity in the downward direction zone deflects circumferentially around the central axis of the cone crusher. Since the particles are affected by the friction from the inter-particles and the concave, the deflection angle γ of the velocity around the central axis of the cone crusher varies linearly in the radial direction, whereas the maximum deflection angle γmax of the particle velocity in the downward direction zone can be obtained by solving the motion characteristic equations of particles. Thus, the deflection angle of velocity passing through the choke-level in the downward direction zone can be expressed as Equation (34).
γ α , r = r R m i n α R m a x R m i n α γ m a x
The velocity distribution of particles in the downward direction zone can be expressed as Equation (35).
v d o w n α , r = v d o w n α c o s γ α , r = α α t 0 α c α t 0 v d o w n m a x c o s r R m i n α R m a x R m i n α γ m a x
As shown in Figure 12, a micro-element in the downward direction zone is selected. Based on the study of the particle velocity distribution, the number of particles passing through the downward direction zone of the choke-level can be determined.
By integrating the velocity of particles in the micro-element, the number of particles passing through the downward direction zone of the choke-level can be expressed as Equation (36).
Q d o w n = α t α c R α R ρ v d o w n α , r r d r d α
where ρ denotes the density of particles.
The upward direction zone of the choke-level in the crushing chamber is shown in Figure 13.
Since the mantle rotates eccentrically around the central axis of the cone crusher, when the mantle moves towards the concave, the particles move upward together with the mantle surface. The particles have the same velocity as the contact point between the particles and the mantle surface. Due to the velocity of the particles varies linearly in the radial direction, the velocity of the particles in the upward direction zone can be expressed as Equation (37).
v u p α , r = r R m i n α V d c o s φ + β 90 R m a x R m i n α
where vd represents the tangential velocity of the point on the mantle surface that coincides with the particle, φ denotes the angle between vd and the tangent plane at a point of the mantle surface, β is the base angle of the mantle.
As shown in Figure 14, a micro-element in the upward direction zone is selected.
By integrating the velocity of particles in the micro-element, the number of particles passing through the upward direction zone of the choke-level can be expressed as Equation (38)
Q u p = α c 2 π R m i n R m a x ρ v u p α , r r d r d α
According to the analysis of the particle velocity distribution in the choke-level, the particle velocity in the micro-element selected in the downward and upward direction zones is integrated to calculate the throughput of the downward and upward direction zones in the choke-level. The distinction between the two is crusher capacity, which can be expressed as Equation (39).
Q = η c Q d o w n Q u p
where ηc denotes the volumetric filling ratio of the choke-level.

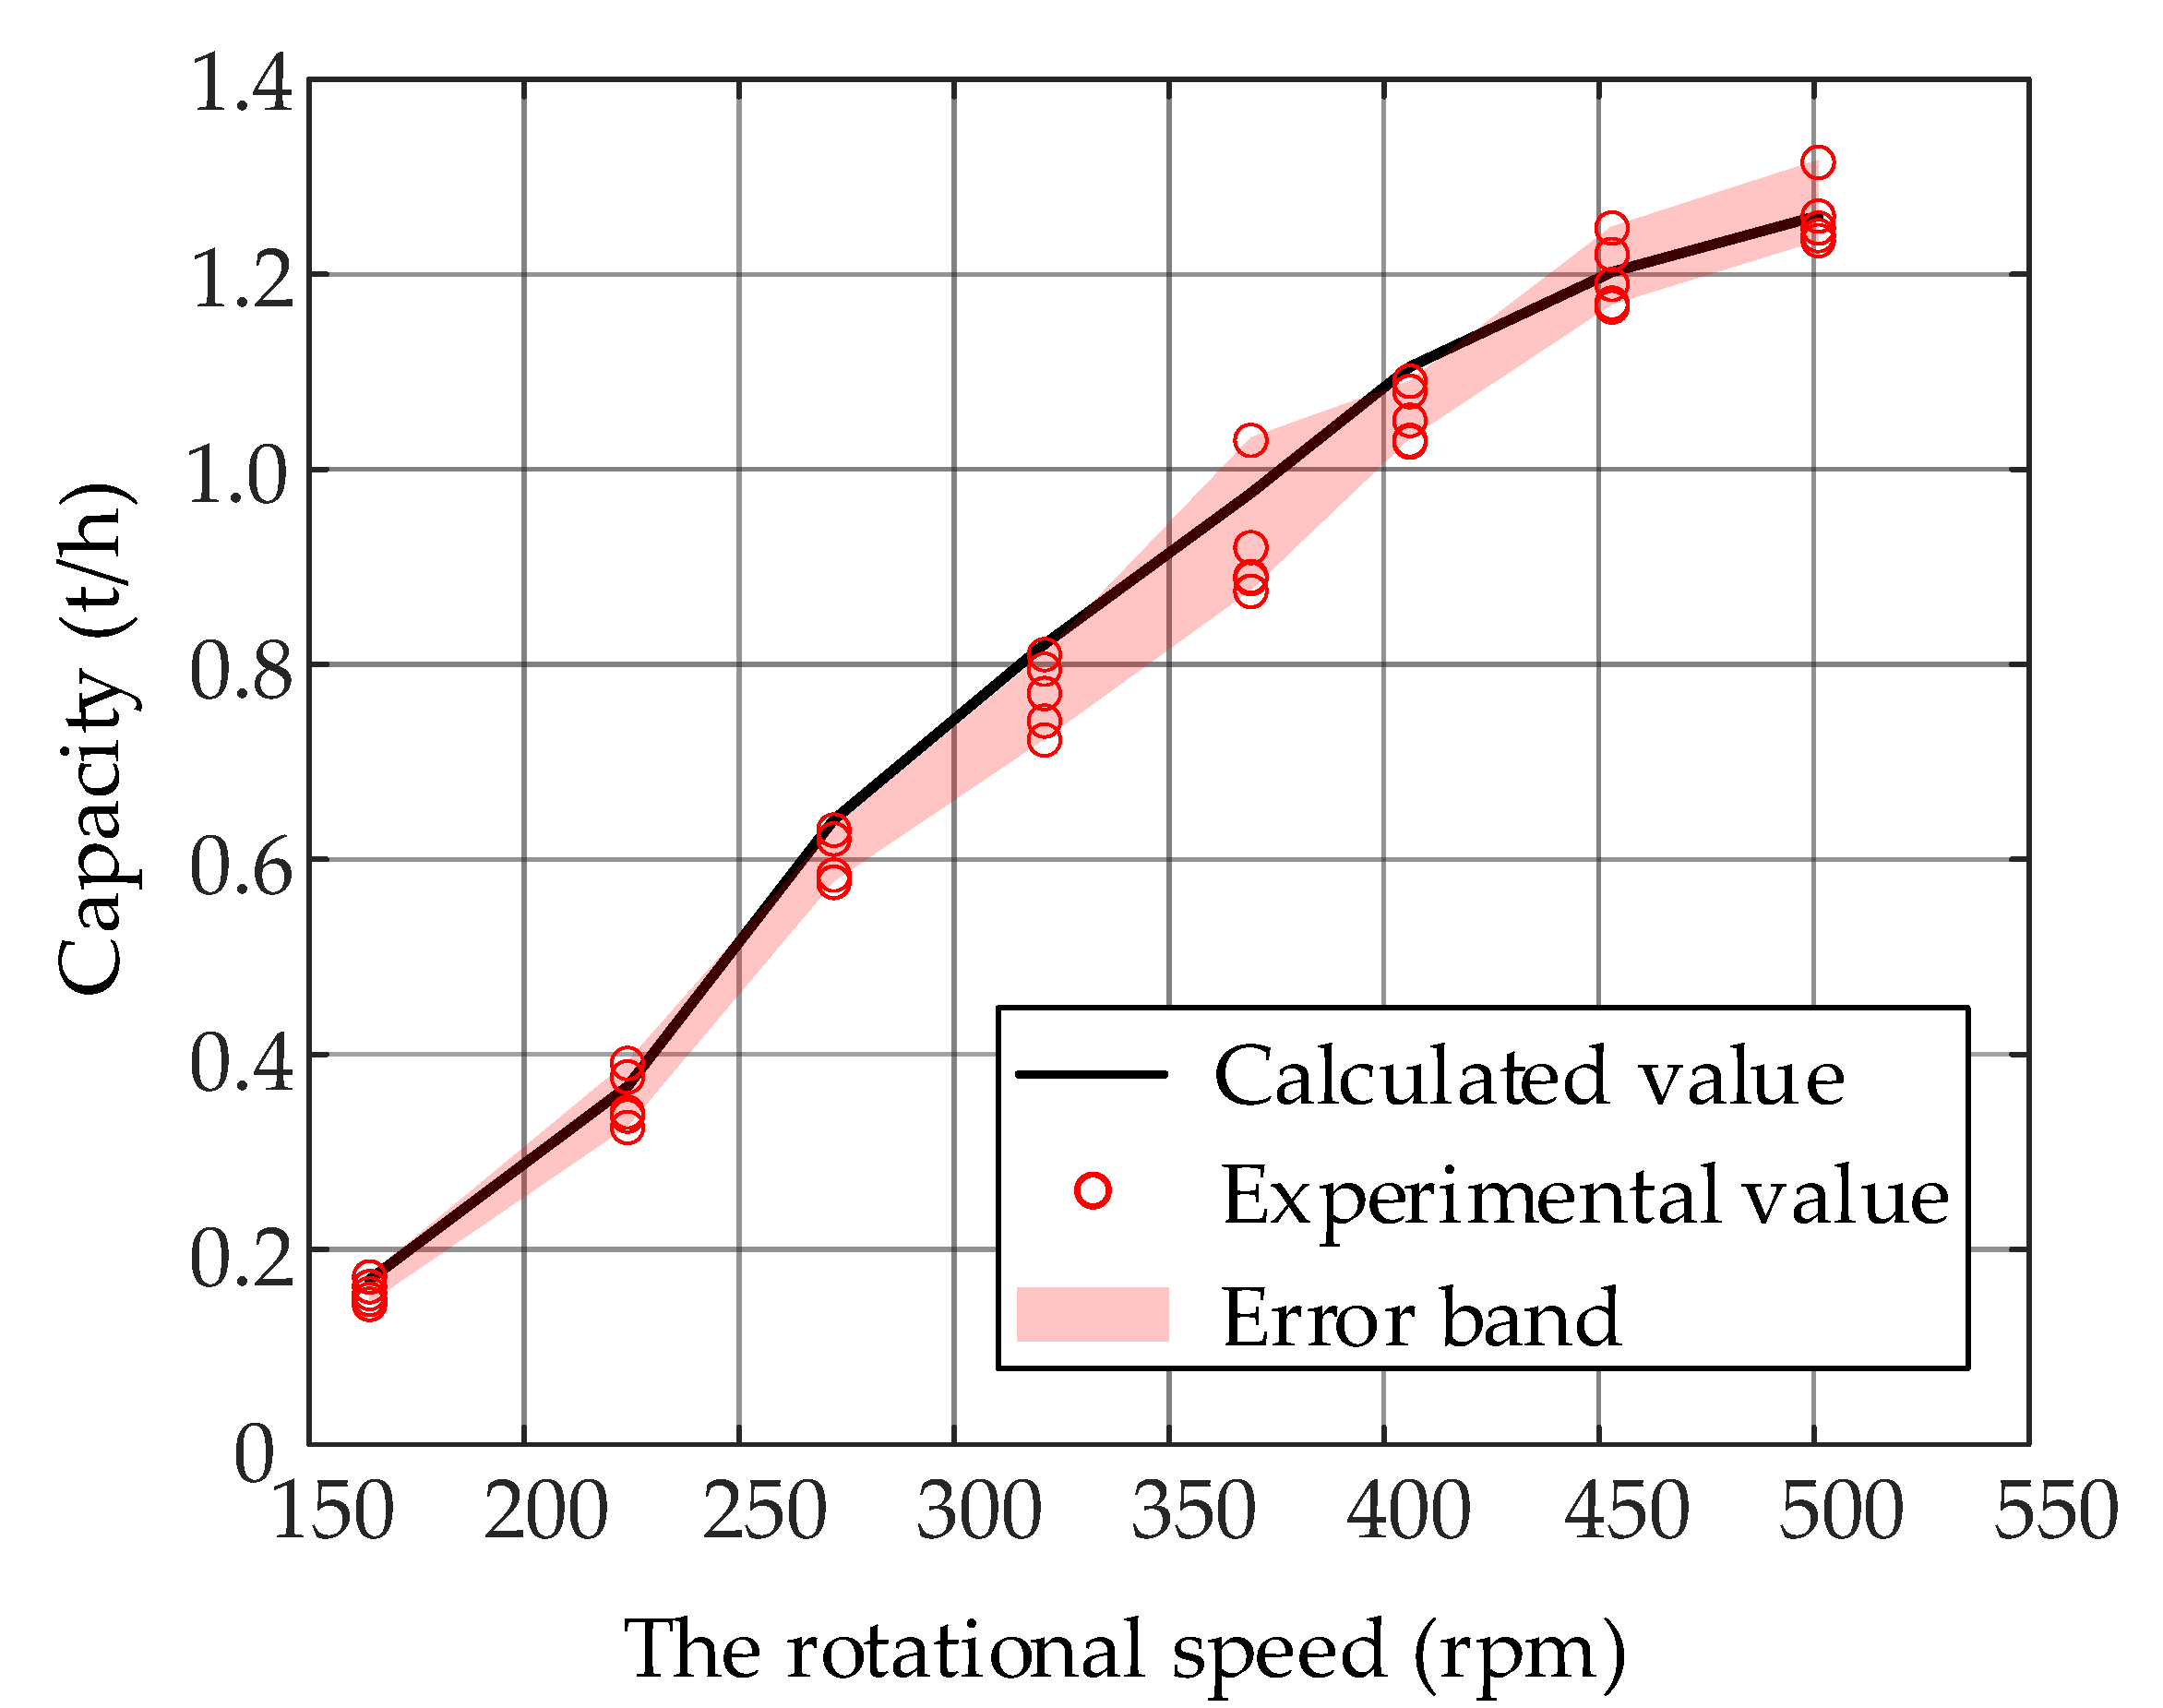
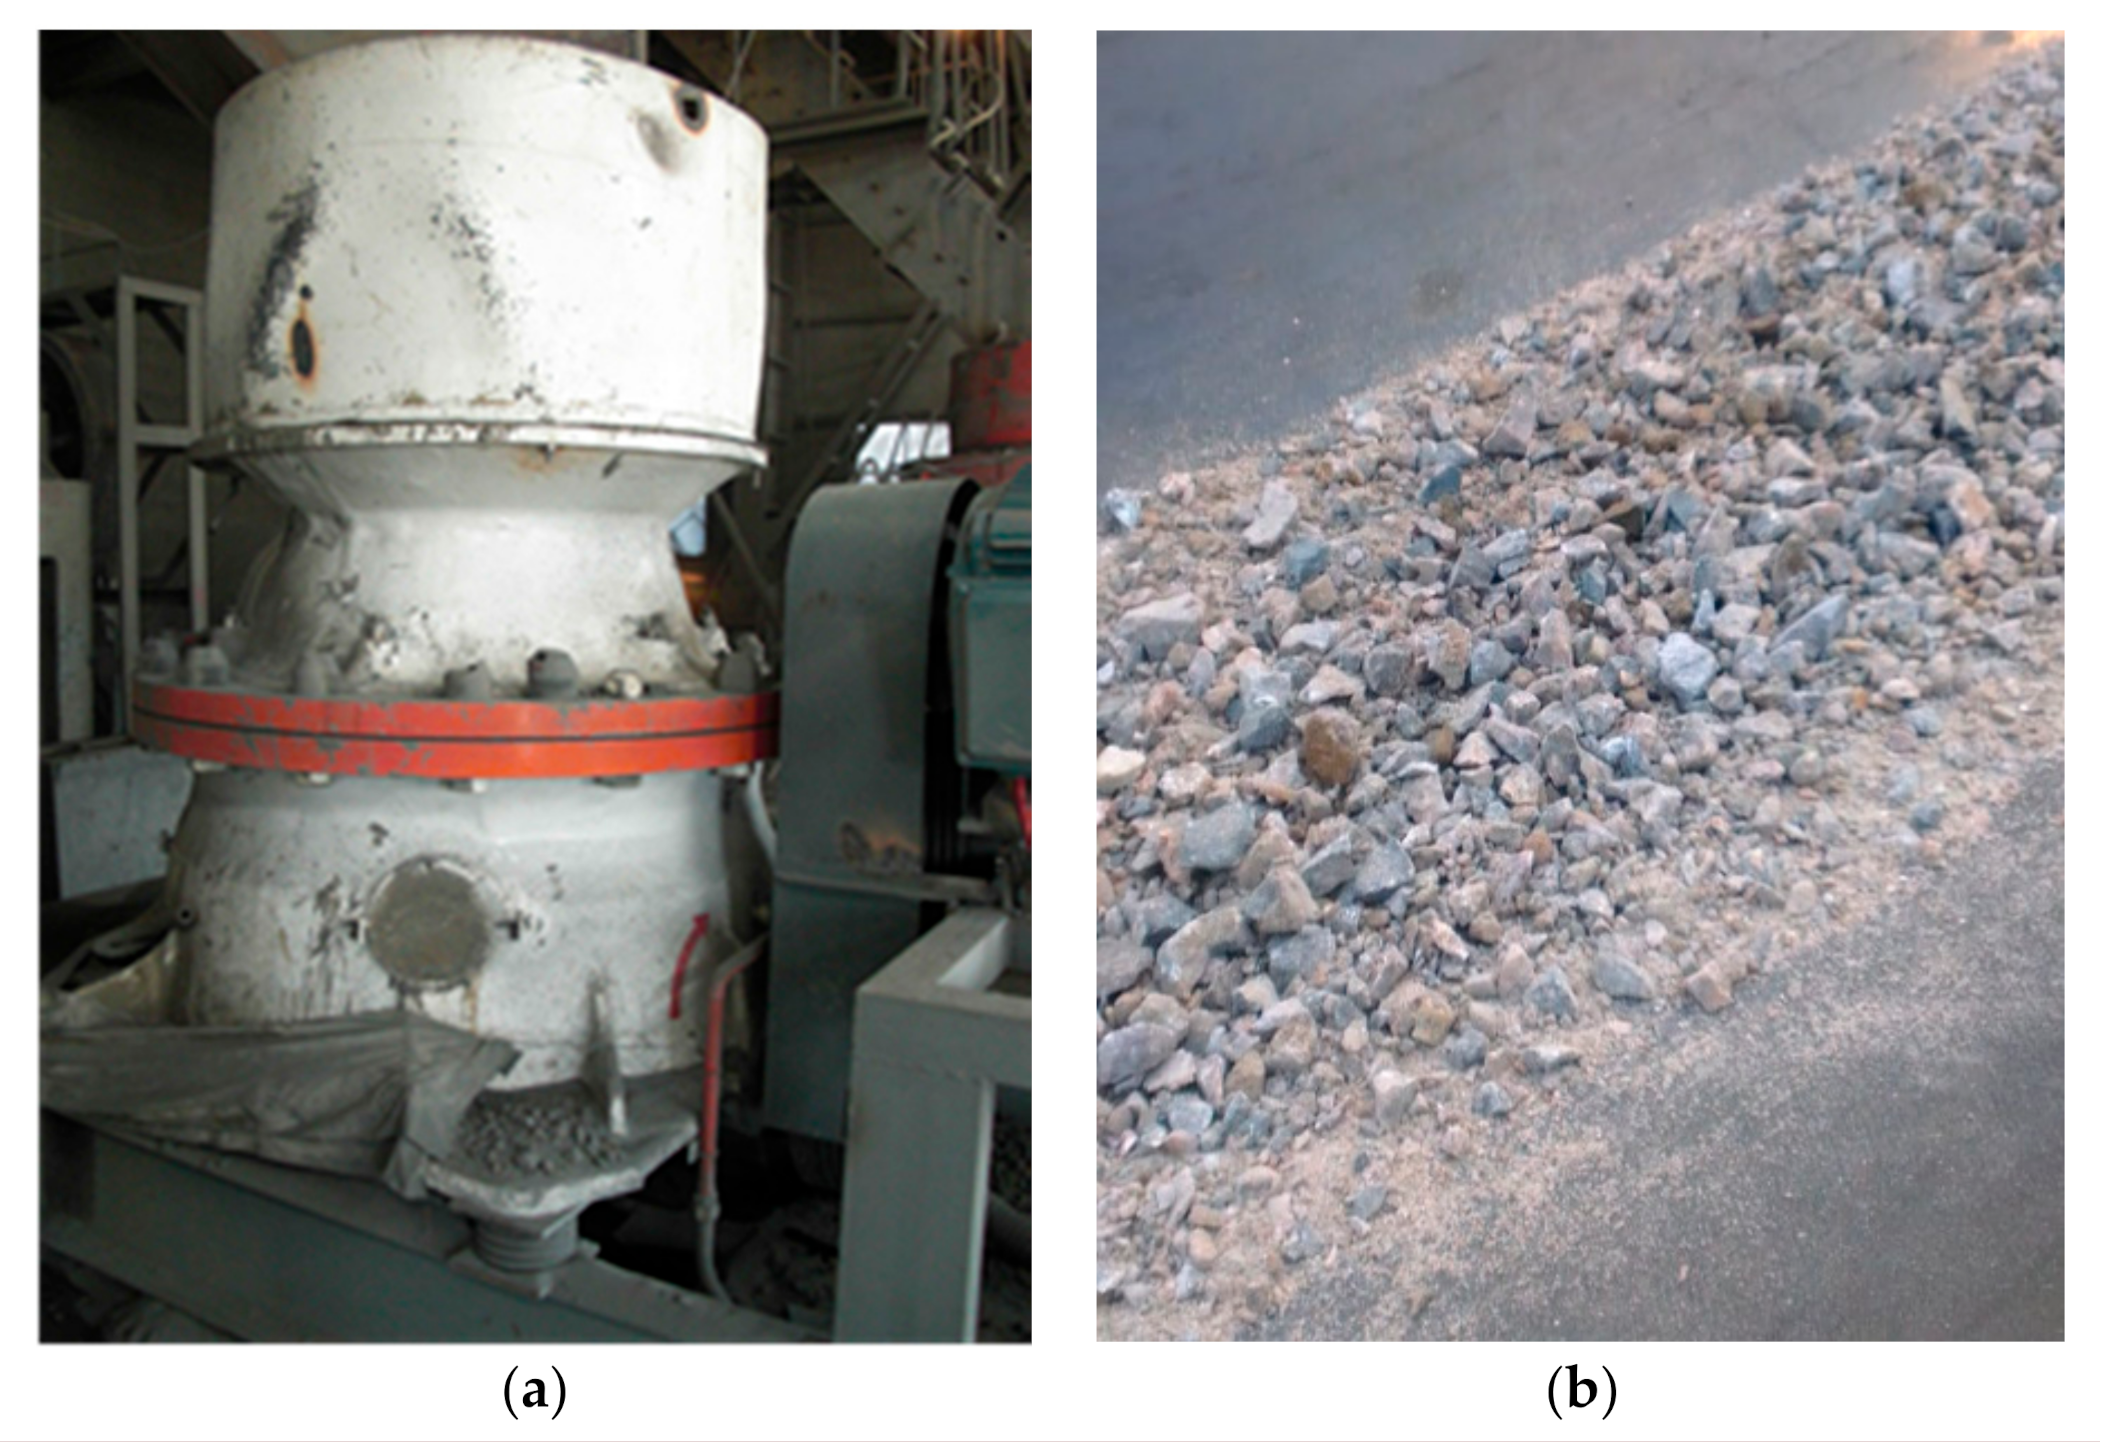
4. Capacity Experiment Using Reduced-Scale Cone Crusher

The effect of the spatial compound motion of the mantle on particle motion characteristics was investigated, and motion characteristic equations of particles with various motion characteristics were derived. The velocity distribution of particles passing through the choke-level around the mantle surface was determined by solving the motion characteristic equations of particles with spatial sliding, free-falling, and spatial compound falling. The velocity distribution of the particles in the downward and upward direction zones of the choke-level was analyzed. The influence of the circumferential deflection of the particles with spatial sliding and spatial compound falling through the choke-level on the radial velocity distribution in the downward direction zone was considered. An improved capacity model of the cone crushers based on the motion characteristics of particles considering the influence of the spatial compound motion of the mantle was established. By altering the rotational speed of the main shaft of the reduced-scale cone crusher, the capacity of cone crushers with various particle motion characteristics as they pass through the choke-level was investigated. The accuracy of the capacity calculation using the improved capacity model was verified by comparing the values determined using experimental data with the values calculated using the improved capacity model. The experimental equipment and results are shown in Figure 15. The structural and operating parameters of the reduced-scale cone crusher are shown in Table 1. The physical parameters of the experimental particles are shown in Table 2.
The power inverter was used to modulate the rotational speed of the main shaft of the reduced-scale cone crusher, resulting in particles passing through the choke-level in the crushing chamber having various motion characteristics. As a result, the capacity of the reduced-scale cone crusher with various rotational speeds of the main shaft was also different. The capacity of a reduced ratio cone crusher can be determined by the time required to crush a constant mass of particles. The steps of the experiment were as follows:
Step 1
The power is turned on for the reduced-scale cone crusher, and the rotational speed of the main shaft is adjusted to 164 rpm using the power inverter.
Step 2
Ensure that the reduced-scale cone crusher operates smoothly. The particles with mass of 5 kg and size of 10–15 mm are fed into the crushing chamber, and the time is initiated immediately.
Step 3
The crushing process of the particles in the crushing chamber is continuously observed through the observation holes of the reduced-scale cone crusher, and the residual number of particles in the crushing chamber is constantly monitored.
Step 4
The time is stopped as soon as the particles are found to be completely crushed and discharged from the crushing chamber through the observation hole.
Step 5
Turn off the power and record the required time for the particles to be crushed fully and discharged from the crushing chamber in Table 3.
Step 6
Repeat the experimental steps 1–5 and set the rotational speed of the main shaft to 224 rpm, 272 rpm, 321 rpm, 369 rpm, 406 rpm, 453 rpm, and 501 rpm respectively. The experimental data of the required time that the particles with different motion characteristics are crushed in the crushing chamber of the reduced-scale cone crusher is obtained.
The capacity of the reduced-scale cone crusher can be determined by the experimental data, as shown in Equation (40).
Q i = m t i × 3600 1000 = 5 t i × 3600 1000
where Qi denotes the capacity of reduced-scale cone crusher in the i-th experiment, m represents the mass of crushed particles, ti is the crushing time in the i-th experiment.
The comparison of the capacity of the reduced-scale cone crusher between the value determined using experimental data and the value calculated using the improved capacity model is shown in Figure 16.
According to Figure 16, the capacity of the reduced-scale cone crusher increased rapidly with the increase in rotational speed of the main shaft. When the rotational speed of the main shaft exceeded 272 rpm, capacity continued to increase; however, the trend of increase gradually slowed down. The reason for the trend of the capacity is that, as the rotational speed of the main shaft increased, the motion characteristics of the particles passing through the choke-level were affected by the spatial compound motion of the mantle changing from spatial sliding to spatial compound falling and, finally, to free-falling. In this process, the area of the downward direction zone gradually increased, whereas the area of the upward direction zone changed in the opposite direction. Meanwhile, the velocity of the particles through the downward direction zone increased and the deflection angle gradually decreased, resulting in an increment of the capacity of the cone crusher.
There was a certain error between the capacity determined using experimental data and the capacity calculated using the improved capacity model: the maximum error was 15.0% when the rotational speed of the main shaft was 164 rpm, the minimum error was 1.3% when the rotational speed of the main shaft was 321 rpm, the average error is 5.69%. With the increase of rotational speed of the main shaft, the error tended to decrease gradually. The reason for the error was that the capacity obtained using the improved capacity model was based on the assumption that the particles passed through the crushing chamber continuously. When calculating the capacity based on the experimental data, the time started when the particles entered the empty crushing chamber, which meant that it took some time for the particles to fill the crushing chamber, resulting in an error. The required time for particles to fill the empty crushing chamber decreased as the rotating speed of the main shaft increased and the error becomes smaller. By comparing the error and trend of capacity calculated based on experimental data and the improved capacity model, the accuracy of the capacity calculation using the improved capacity model was demonstrated.

5. Improved Capacity Model Applied to Capacity Calculation of ZS200MF Cone Crusher

The improved capacity model can be used to estimate the capacity of a cone crusher with different structural and operating parameters. In order to verify the applicability of the improved capacity model for industrial-scale cone crushers, the improved capacity model was utilized to solve the capacity of the ZS200MF cone crusher. As shown in Figure 17a, the ZS200MF cone crusher was a member of the ZS series cone crushers manufactured by Junyang Machinery Factory for fine and secondary crushing in small-scale mining, which was equipped with an MF (medium and fine)-type mantle. The crushed particles produced by the ZS200MF cone crusher are shown in Figure 17b.This type of cone crusher possessed a certain market share because of its simple structure, modular design, and low operating costs. The physical parameters of the crushed particles are shown in Table 4. The structural and operating parameters of the ZS200MF cone crusher are shown in Table 5.
According to the structural and operating parameters of the ZS200MF cone crusher, the variables in the capacity calculation of the ZS200MF cone crusher are obtained based on the motion characteristic equation of the particles Equations (15)–(30) and the improved capacity model Equations (31)–(37), as shown in Table 6
Based on the calculation of the improved capacity model, the capacity of the ZS200MF cone crusher was 87.9 t/h. The production records of the ZS200MF cone crusher were consulted at the production site. The average capacity of the ZS200MF cone crusher in one month was taken as the measured value of the capacity. It can be seen that the capacity of the ZS200MF cone crusher is 81.8 t/h. The error between the two is 7.4%. This is due to the complex production conditions of the ZS200MF cone crusher: inadequate feeding, dispersed feeding particle size distribution, and complex feed ore composition. However, the error between the capacity calculated by the improved model and the capacity obtained from the production records was small, which verified the applicability of the improved model to the capacity calculation of industrial-grade cone crushers.

6. Discussion

Through the analysis of the structure of the cone crusher, it was found that the spatial compound motion of the mantle was rotating around both the central axis of the cone crusher and its central axis. According to the structural and the operational parameters of the cone crusher, a coordinate system transformation matrix of the cone crusher was obtained to transform the coordinates and vectors from the dynamic coordinate system to the global coordinate system. The coordinate system transformation matrix was utilized to solve the equations describing the motion characteristics of particles affected by the spatial compound motion of the mantle; the velocity distribution of particles with various motion characteristics around the mantle surface was derived. An improved capacity model of the cone crushers was established by evaluating the velocity distributions of particles passing through the downward and upward direction zones of the choke-level. The crushing process of particles with various motion characteristics was simulated by changing the rotational speed of the main shaft of the reduced-scale cone crusher. By comparing and analyzing the error of the reduced-scale cone crusher capacity between the value determined using experimental data and the value calculated based on the improved capacity model, the accuracy of the cone crusher capacity calculated by the improved capacity model was confirmed. Taking the ZS200MF cone crusher as an example, the improved capacity model was used to calculate the capacity of the ZS200MF cone crusher. According to the investigation of the data from the ZS200MF cone crusher at the production site, the error between the measured and the calculated capacity value was 7.4%. Thus, the applicability of the improved capacity model applied to the industrial-grade cone crusher capacity calculation was verified.
Capacity is a core indicator of cone crusher performance. In order to explore the critical factors affecting the capacity of cone crushers, the ZS200MF cone crusher was selected as the research object; the structural and operating parameters that affect the capacity of cone crushers were investigated based on the improved capacity model of the cone crushers. The parameters of the cone crusher were usually interrelated; changing one of them would lead to the change of other parameters. As a result, four typical cone crusher parameters were chosen to investigate their influence on cone crusher capacity.

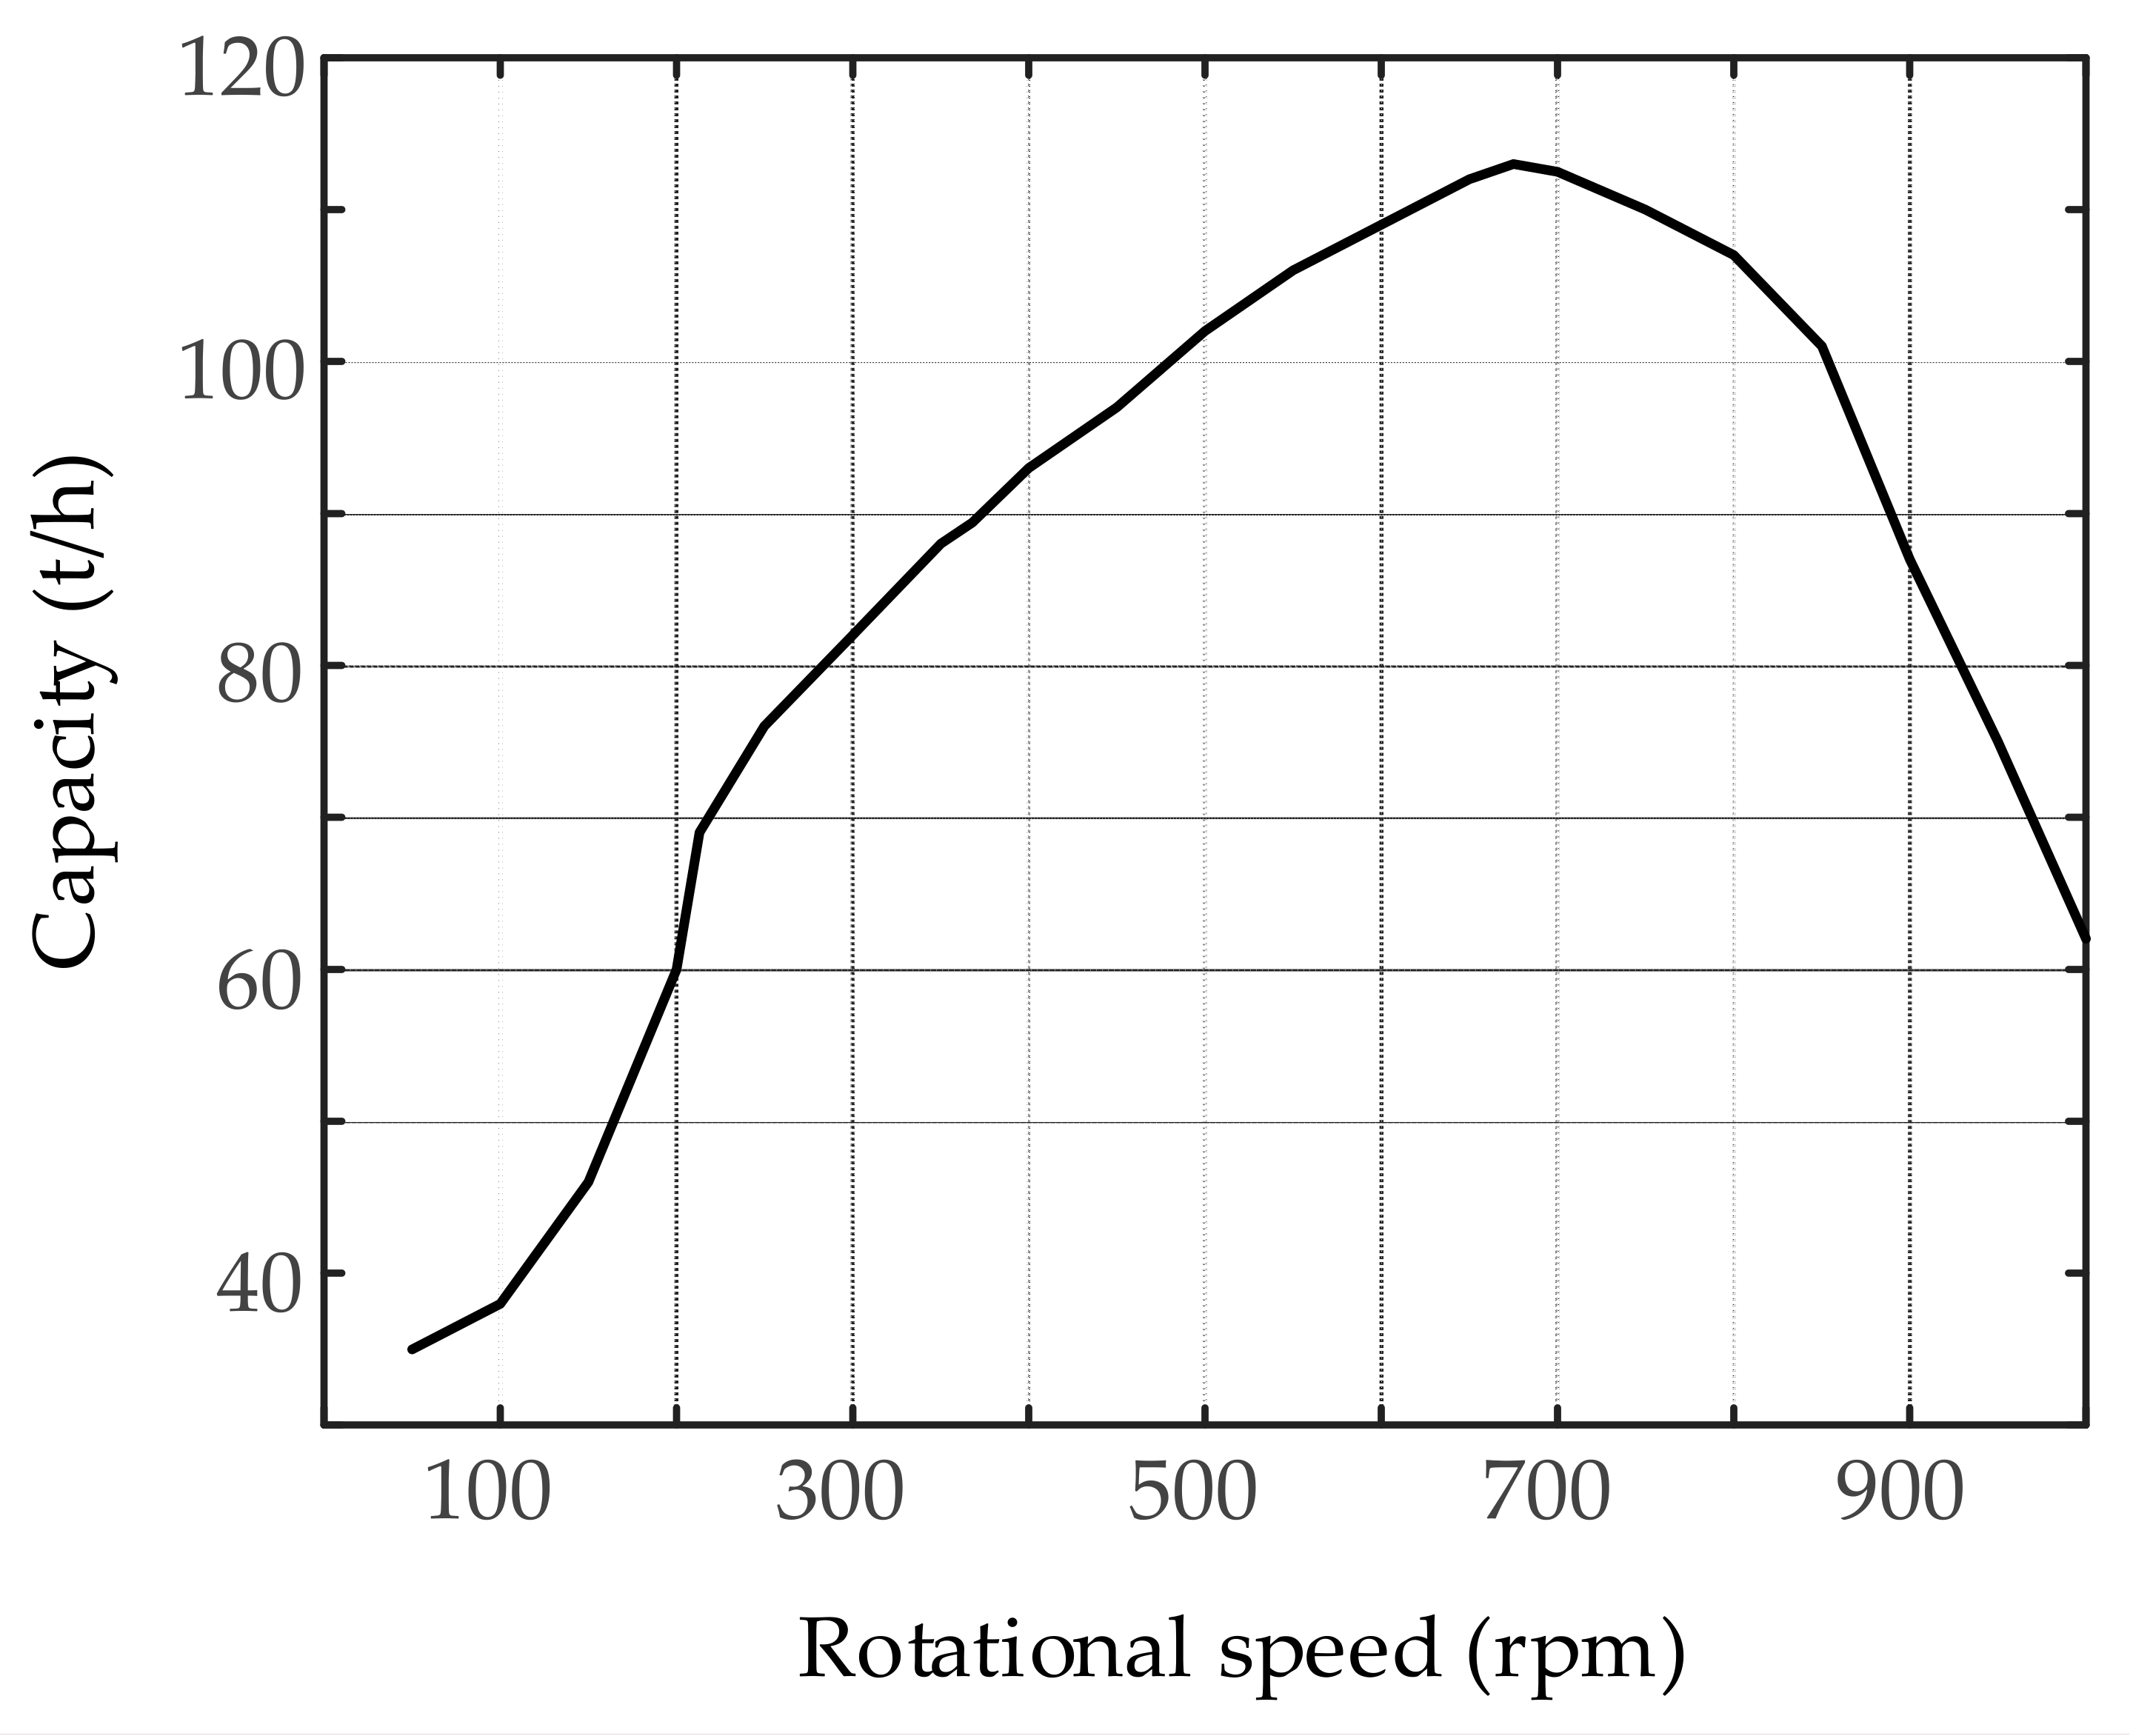
6.1. Rotational Speed of the Main Shaft

The rotational speed of the main shaft was one of the operating parameters of the cone crusher, which significantly impacted capacity. By adjusting the reduction ratio of the reducer, the diameter of the pulley, or replacing the motor with a higher speed, capacity could be changed quickly, effectively, and economically without modifying the structure of the cone crusher. By adjusting the rotational speed of the main shaft, the motion characteristics of particles passing through the choke-level in the crushing chamber were altered, as well as the velocity distribution around the mantle surface at the choke-level. Thus, the capacity of the cone crusher is changed. The relationship between the capacity and the rotational speed of the main shaft of the ZS200MF cone crusher is shown in Figure 18. With the increase of the rotational speed of the main shaft, the capacity of the ZS200MF cone crusher increased rapidly. When the rotational speed of the main shaft reached 200 rpm, the motion characteristics of particles passing through the choke-level change from spatial sliding to free-falling, which caused a mutation in the capacity curve. Then, as the rotational speed of the main shaft increased, the capacity continued to improve, but at a slower rate. Capacity declined steadily as the rotational speed of the main shaft exceeded 680 rpm because the effect of delayed time td on capacity grew.

6.2. Size of the Closed Side Setting

The size of the closed side setting is one of the structural parameters of the cone crusher, which exhibited a direct impact on the capacity of the cone crusher. Although the size of the closed side setting could be adjusted by replacing the mantle and concave with different geometric sizes, by adjusting the eccentric angle of the main shaft, or by changing the height of the mantle, this adjustment invariably affected the other structural parameters of the cone crusher. By adjusting the size of the closed side setting of the cone crusher, the radius of mantle Rmin(α) of the downward and upward direction zones was altered; the area of the choke-level was affected, thus, changing the cone crusher capacity. The relationship between capacity and the size of the closed side setting of the ZS200MF cone crusher is shown in Figure 19. With the increase in the size of the closed side setting, the radius of mantle Rmin(α) decreased gradually. Thus, the choke-level area increased, then the capacity of the cone crusher increased.

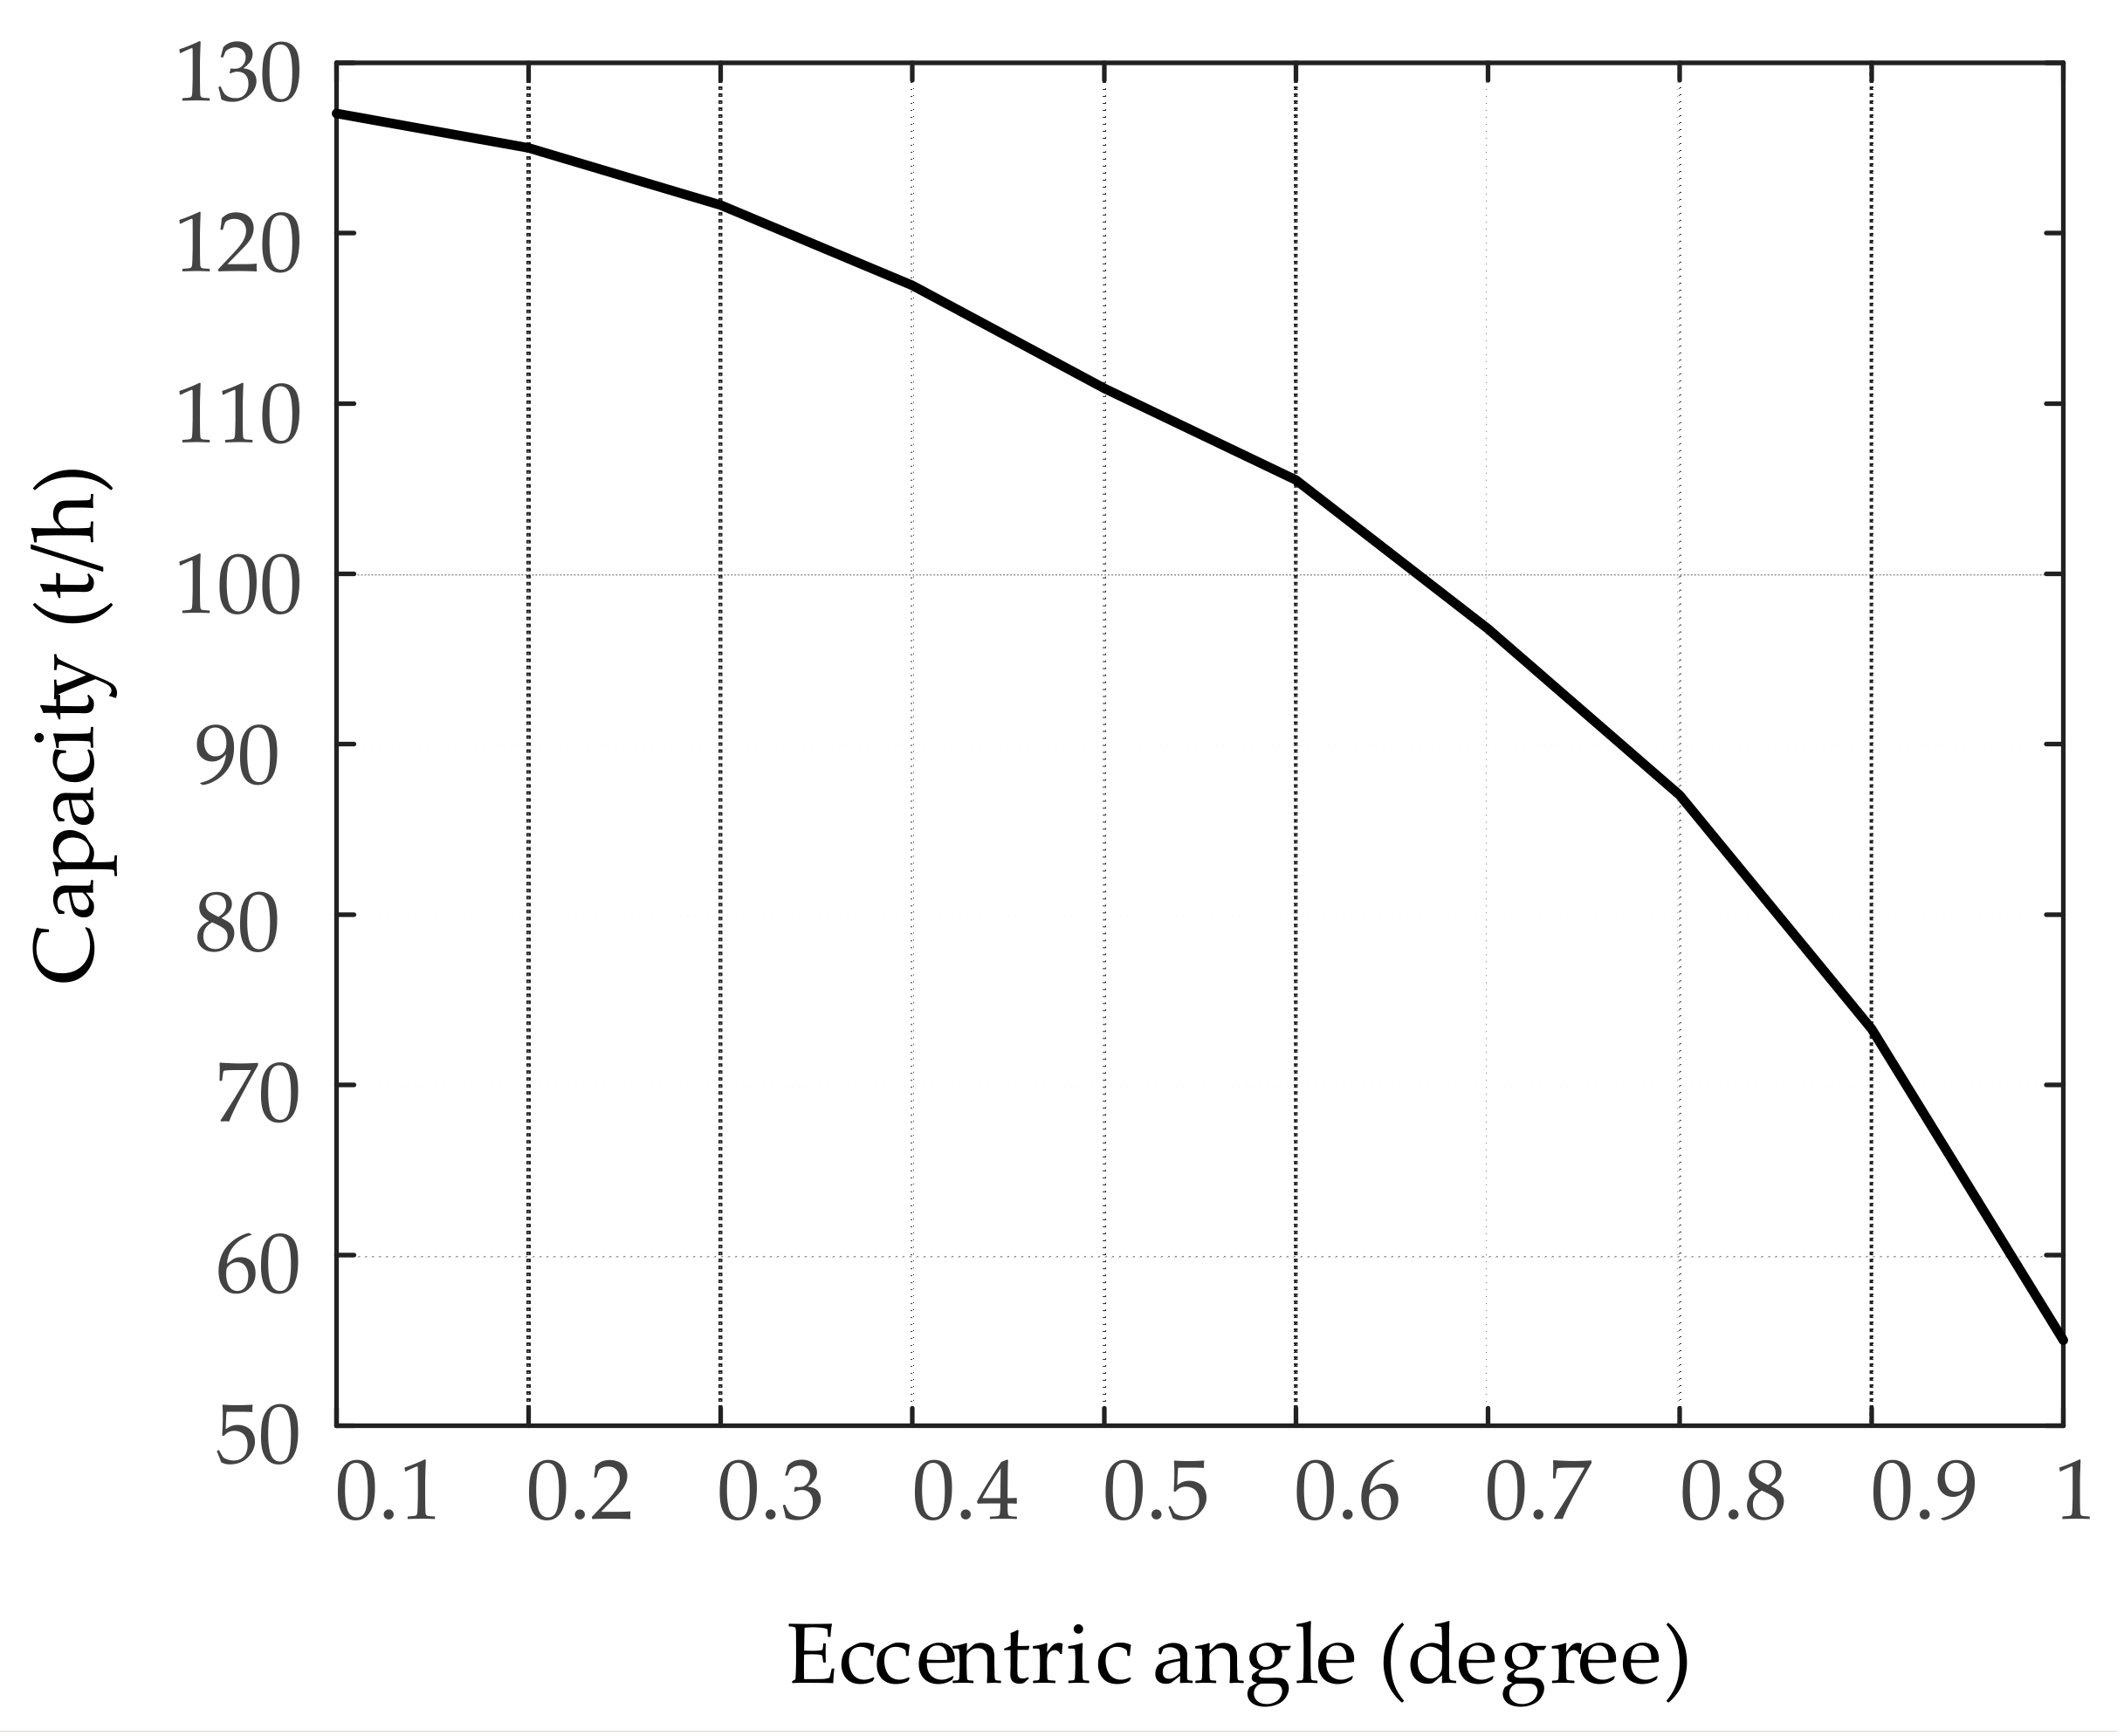
6.3. Eccentric Angle of the Main Shaft

The eccentric angle θ of the main shaft was one of the structural parameters of the cone crusher; it could be adjusted by replacing the eccentric sleeves with different eccentric angles. By adjusting the eccentric angle θ of the main shaft, the velocity vup of the particles moving with the mantle in the upward direction zone of the choke-level was changed, which affected the capacity of the cone crusher. The relationship between capacity and the eccentric angle of the main shaft of the ZS200MF cone crusher is shown in Figure 20. The capacity of the cone crusher decreased as the eccentric angle of the main shaft increased. This was due to the fact that, as the eccentric angle θ increased, the velocity vup of particles on the mantle increased. As a result, the number of particles that moved upward through the upward direction zone of the choke-level increased, resulting in a decrease in capacity.

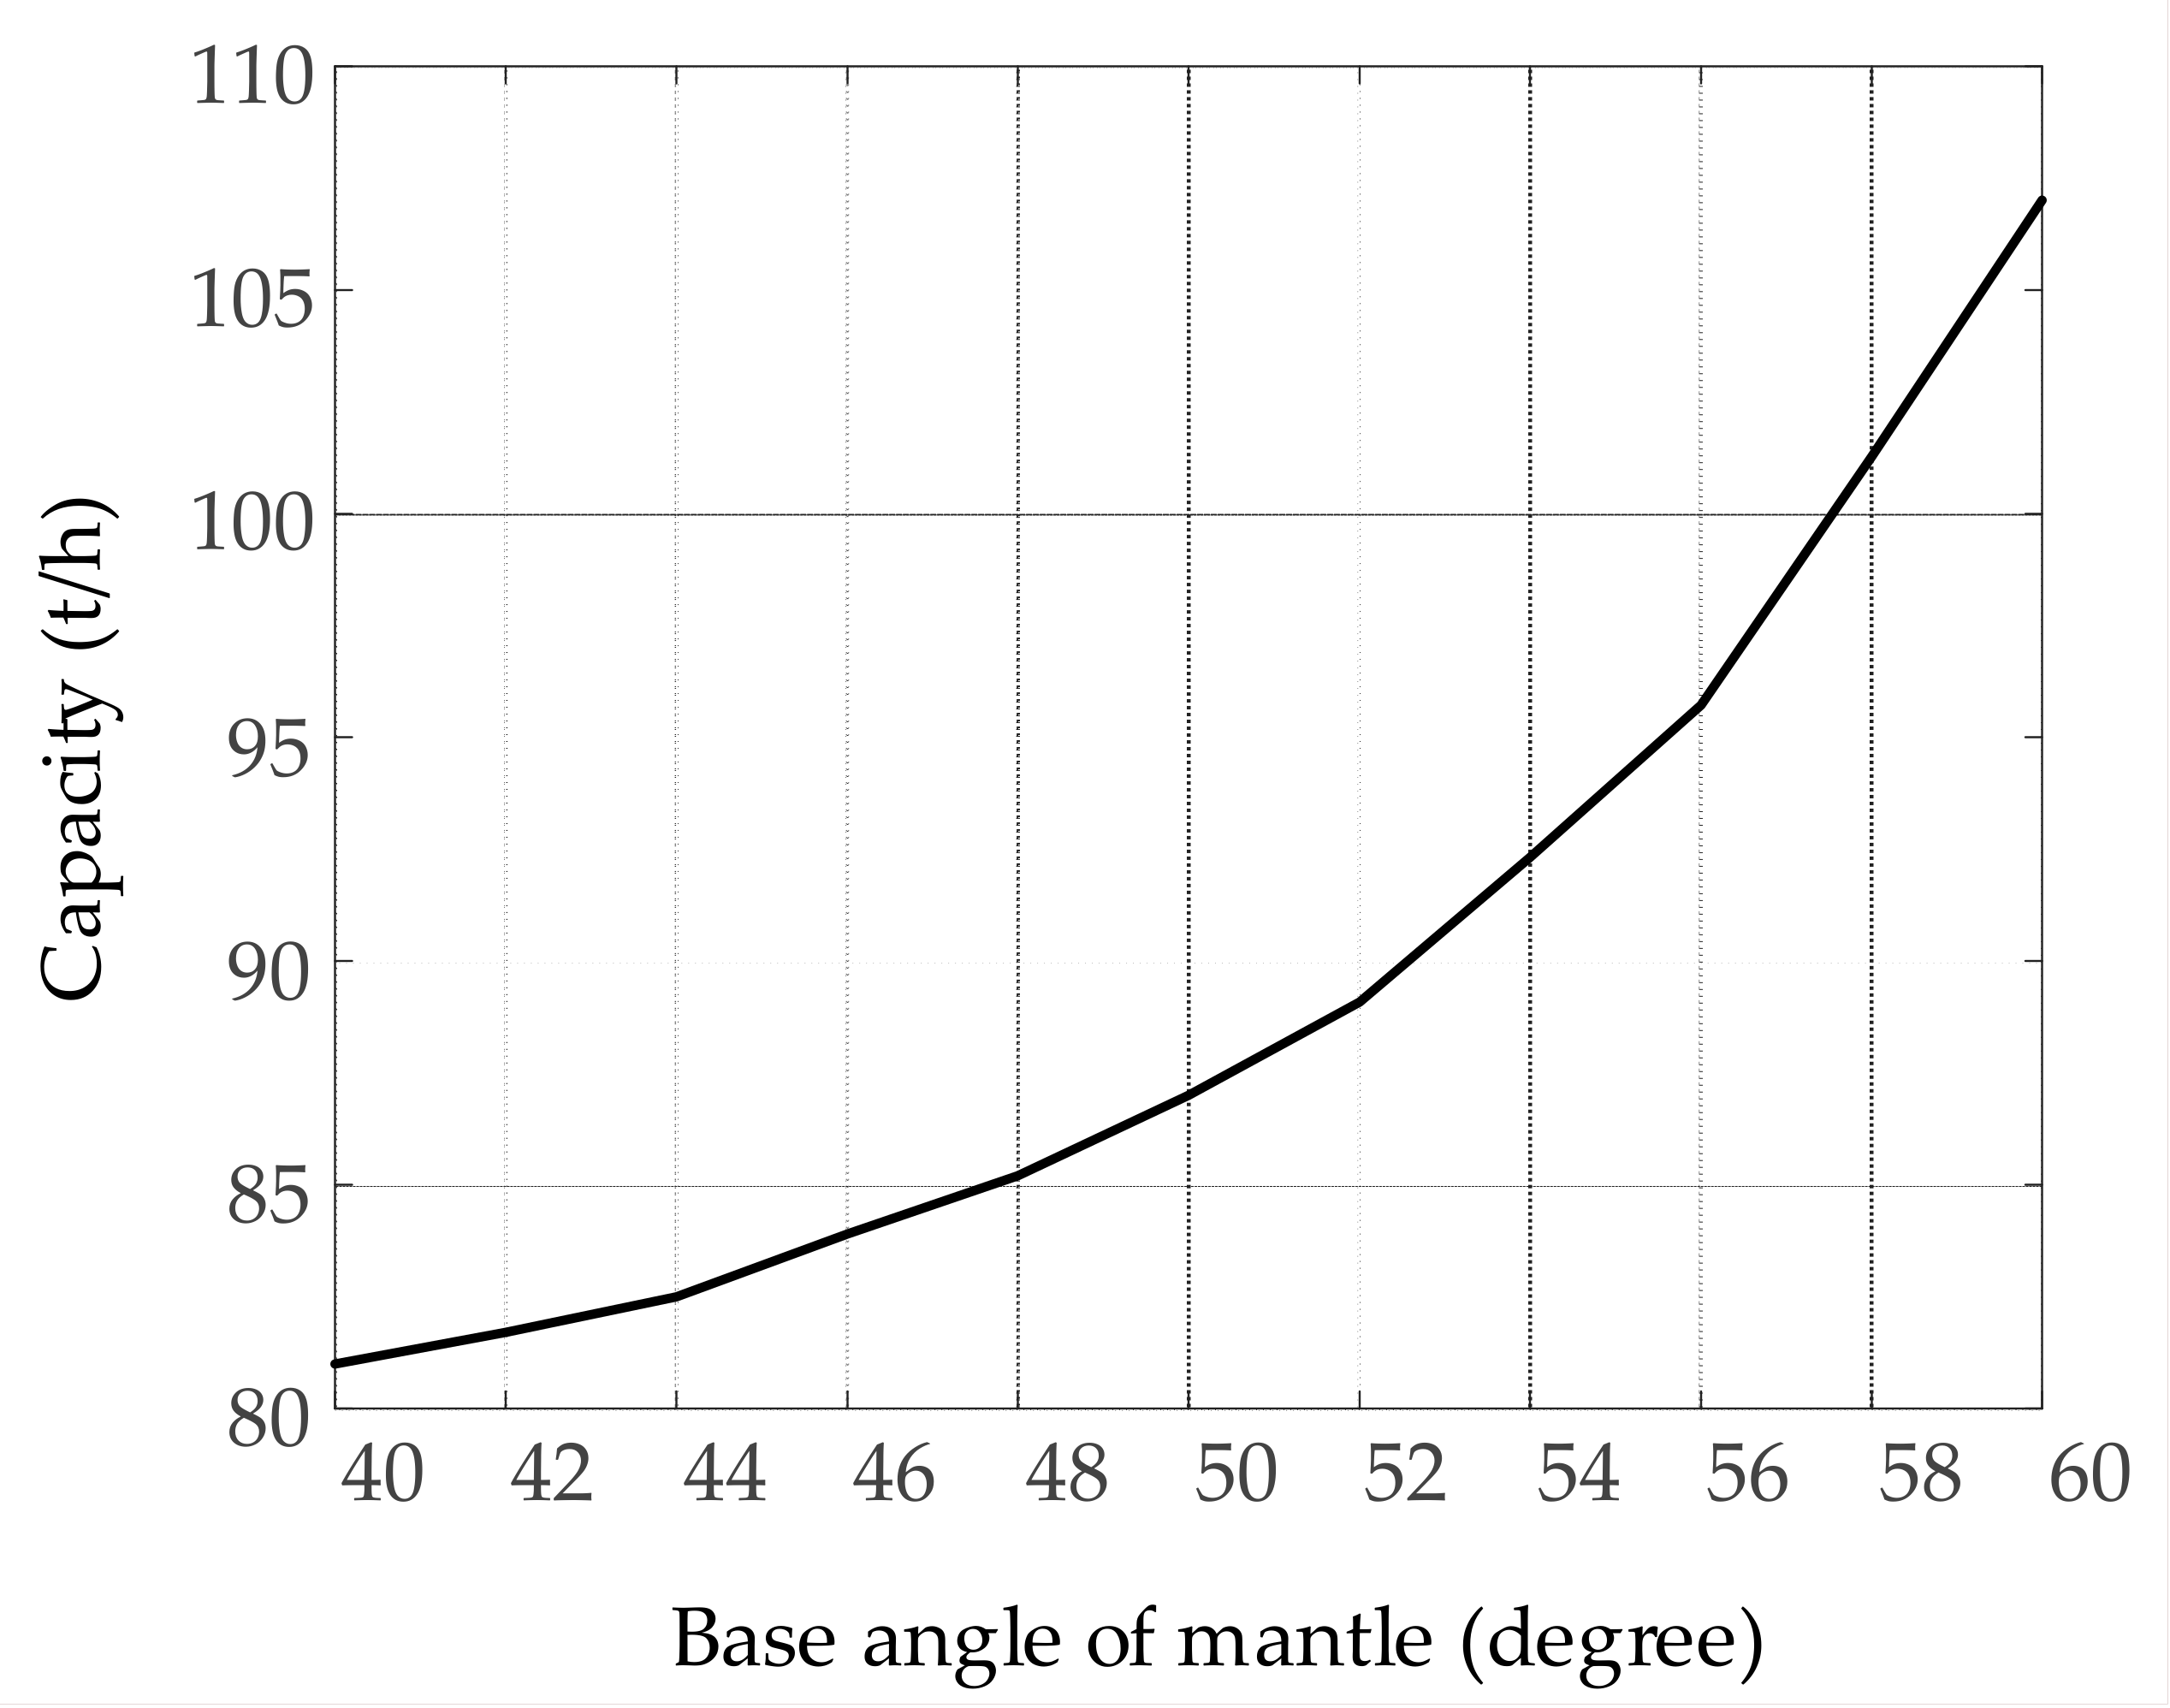
6.4. Base Angle of Mantle

The base angle of the mantle was one of the structural parameters of the cone crusher, which could be adjusted by replacing the mantle with different sizes. By adjusting the base angle of the mantle, the falling height of the particles in the choke-level was altered, the time of particle contact with the mantle was changed, and the circumferential angle αc was changed. Thus, the area of the downward and upward direction zones was changed, which impacted the capacity. The relationship between capacity and the base angle of the mantle of the ZS200MF cone crusher is shown in Figure 21. As the base angle β of the mantle increased, the particles contacted the mantle later in the falling process; thus, the circumferential angle αc increased, which increased the area of the downward direction zone and decreased the area of the upward direction zone; the particles passing through the choke-level increased, resulting in an increase of capacity.

7. Conclusions

By investigating the influence of the spatial compound motion of the mantle rotating around the central axis of the cone crusher and its central axis on the motion characteristics of particles, the motion characteristic equations of particles were developed. The equations were used to solve the velocity distribution of the particles at the choke-level in the crushing chamber; the features of the particle velocity deflecting around the central axis of the cone crusher were considered when the motion characteristics of the particles passing through the choke-level were spatial sliding or spatial compound falling. An improved capacity model of the cone crushers based on the motion characteristics of particles considering the influence of the spatial compound motion of the mantle was established.
The structural and operating parameters impacting the capacity of cone crushers, such as the rotational speed of the main shaft, the size of the closed side setting, the eccentric angle of the main shaft, and the base angle of the mantle, were analyzed in detail using the improved capacity model. The capacity of cone crushers increased monotonically with the size of the closed side setting and the base angle of the mantle but decreased monotonically with the eccentric angle of the main shaft. There was an optimal range of the rotational speed of the main shaft. When the rotational speed of the main shaft was less than or greater than this range, the capacity of the cone crusher decreased rapidly.
The improved capacity model was used to propose a method for theoretically calculating the capacity of the cone crushers based on structural and operating parameters, which is suitable for the various motion characteristics of particles in the choke-level. The theoretical research on the improved capacity model of cone crushers holds great significance for revealing the working performance of the crusher.

Author Contributions

Conceptualization, Z.Z. and T.R.; methodology, Z.Z.; validation, J.C.; formal analysis, Z.Z. and J.C.; investigation, Z.Z. and J.C.; data curation, Z.Z. and J.Z.; writing—original draft, Z.Z.; project administration, T.R. All authors have read and agreed to the published version of the manuscript.

Funding

This work is supported by the National Key Technology R&D Program of China (grant number 2011BAF15B01).

Acknowledgments

The authors wish to acknowledge the JUNYANG machinery company which helped to design and manufacture the reduced-scale cone rusher. The authors would especially thank all the people who help this subject, because of their aid, this topic can be successfully completed.

Conflicts of Interest

The authors declare no conflict of interest.

References

  1. Evertsson, C.M. Cone Crusher Performance. Ph.D. Thesis, Chalmers University of Technology, Gothenburg, Sweden, 2000. [Google Scholar]
  2. Gauldie, K. Performance of jaw crushers. Engineering 1953, 10, 456–458. [Google Scholar]
  3. Gauldie, K. The output of gyratory crushers. Engineering 1954, 4, 557–559. [Google Scholar]
  4. Briggs, C.A.; Bearman, R.A. An investigation of rock breakage and damage in comminution equipment. Miner. Eng. 1996, 9, 489–497. [Google Scholar] [CrossRef]
  5. Briggs, C.A. Fundamental Model of a Cone Crusher. Ph.D. Thesis, University of Queensland, Queensland, Australia, 1997. [Google Scholar]
  6. Bearman, R.A.; Briggs, C.A.; Kojovic, T. The application of rock mechanics parameters to the prediction of comminution behavior. Miner. Eng. 1997, 10, 255–264. [Google Scholar] [CrossRef]
  7. Evertsson, C.M. Output prediction of cone crushers. Miner. Eng. 1998, 11, 215–231. [Google Scholar] [CrossRef]
  8. Evertsson, C.M. Modelling of Flow in Cone Crushers. Miner. Eng. 1999, 12, 1479–1499. [Google Scholar] [CrossRef]
  9. Lindqvist, M.; Evertsson, C.M. Improved flow and pressure model for cone crushers. Miner. Eng. 2004, 17, 1217–1225. [Google Scholar] [CrossRef]
  10. Lindqvist, M. Energy considerations in compressive and impact crushing of rock. Miner. Eng. 2008, 21, 631–641. [Google Scholar] [CrossRef]
  11. Pierre, J.; Yoël, F.; Olivier, P. A constitutive law for dense granular flows. Nature 2006, 441, 727–730. [Google Scholar]
  12. Oliver, B.; John, B.; Paul, H.; Ian, L. Flows of granular material in two-dimensional channels. J. Eng. Math. 2016, 98, 49–70. [Google Scholar]
  13. Zhang, Z.; Ren, T.; Cheng, J. The improved motion model of particles in the cone crusher considering the spatial com-pound motion of the mantle. Minerals 2022, 12, 16. [Google Scholar] [CrossRef]
  14. Weerasekara, N.S.; Powell, M.S.; Cleary, P.W.; Tavares, L.M.; Evertsson, C.M.; Morrison, R.D.; Quist, J.; Carvalho, R.M. The contribution of DEM to the science of comminution. Powder Technol. 2013, 248, 3–24. [Google Scholar] [CrossRef]
  15. Cleary, P.W.; Sinnott, M.D. Simulation of particle flows and breakage in crushers using DEM: Part 1–Compression crushers. Miner. Eng. 2015, 74, 178–197. [Google Scholar] [CrossRef]
  16. Cleary, P.W.; Delaney, G.W.; Sinnott, M.D.; Cummins, S.J.; Morrison, R.D. Advanced comminution modelling: Part 1–crushers. Appl. Math. Model. 2020, 88, 238–265. [Google Scholar] [CrossRef]
  17. Herbst, J.A.; Potapov, A.V. Making a discrete grain breakage model practical for comminution equipment performance simulation. Powder Technol. 2004, 143, 144–150. [Google Scholar] [CrossRef]
  18. Lichter, J.; Lim, K.; Potapov, A.; Kaja, D. New developments in cone crusher performance optimization. Miner. Eng. 2009, 22, 613–617. [Google Scholar] [CrossRef]
  19. Li, H.; McDowell, G.R.; Lowndes, I.S. A laboratory investigation and discrete element modeling of rock flow in a chute. Powder Technol. 2012, 229, 199–205. [Google Scholar] [CrossRef]
  20. Johansson, M.; Quist, J.; Evertsson, C.M.; Hulthén, E. Cone crusher performance evaluation using DEM simulations and laboratory experiments for model validation. Miner. Eng. 2017, 103, 93–101. [Google Scholar] [CrossRef]
  21. Delaney, W.G.; Morrison, D.R.; Sinnott, D.M.; Cummins, S.; Cleary, W.P. DEM modelling of non-spherical particle breakage and flow in an industrial scale cone crusher. Miner. Eng. 2015, 74, 112–122. [Google Scholar] [CrossRef]
  22. Cleary, P.W.; Sinnott, M.D.; Morrison, R.D.; Cummins, S.; Delaney, W.G. Analysis of cone crusher performance with changes in material properties and operating conditions using DEM. Miner. Eng. 2017, 100, 49–70. [Google Scholar] [CrossRef]
  23. Flávio, P.A.; Luís, M.T. Simulating a laboratory-scale cone crusher in DEM using polyhedral particles. Powder Technol. 2020, 372, 362–371. [Google Scholar]
  24. Chen, Z.; Wang, G.; Xue, D.; Cui, D. Simulation and optimization of crushing chamber of gyratory crusher based on the DEM and GA. Powder Technol. 2021, 384, 36–50. [Google Scholar] [CrossRef]
  25. Cheng, J.; Ren, T.; Zhang, Z.; Liu, D.; Jin, X. A Dynamic Model of Inertia Cone Crusher Using the Discrete Element Method and Multi-Body Dynamics Coupling. Minerals 2020, 10, 862. [Google Scholar] [CrossRef]
  26. Meriam, J.L.; Kraige, L.G. Engineering Mechanics, Dynamics; John Wiley and Sons: New York, NY, USA, 1987; pp. 154–196. [Google Scholar]
Figure 1. The structural principle diagram of a certain model cone crusher.
Minerals 12 00235 g001
Figure 2. The motion characteristics of particles. (a) The spatial sliding; (b) The free-falling; (c) The spatial compound falling.
Minerals 12 00235 g002
Figure 3. The position of the dynamic coordinate system and the global coordinate system.
Minerals 12 00235 g003
Figure 4. The force and acceleration components of the particle with spatial falling. (a) The acceleration components of the particle; (b) The force components of the particle.
Minerals 12 00235 g004
Figure 5. The force and acceleration components of the particle with free-falling.
Minerals 12 00235 g005
Figure 6. Paths of the particles with various motion characteristics. (a) Path of the particle with free-falling; (b) Path of the particle with spatial compound falling; (c) Path of the particle with spatial sliding.
Minerals 12 00235 g006
Figure 7. The velocity distribution of the particles with free-falling.
Minerals 12 00235 g007
Figure 8. The velocity distribution of the particles with spatial sliding.
Minerals 12 00235 g008
Figure 9. The velocity distribution of the particles with spatial compound falling.
Minerals 12 00235 g009
Figure 10. The downward and upward direction zones of the choke-level.
Minerals 12 00235 g010
Figure 11. The downward direction zone of the choke-level.
Minerals 12 00235 g011
Figure 12. The micro-element of the downward direction zone.
Minerals 12 00235 g012
Figure 13. The upward direction zone of the choke-level.
Minerals 12 00235 g013
Figure 14. The micro-element of the upward direction zone.
Minerals 12 00235 g014
Figure 15. The equipment and results of the experiment. (a) The reduced-scale cone crusher; (b) The power inverter. (c) The electronic scale; (d) The uncrushed particles; (e) The crushed particles.
Minerals 12 00235 g015
Figure 16. The comparison of the capacity of the reduced-scale cone crusher.
Minerals 12 00235 g016
Figure 17. The ZS200MF cone crusher in the production site. (a) The ZS200MF cone crusher in operation. (b) The crushed particles produced by ZS200MF cone crusher on belt conveyor.
Minerals 12 00235 g017
Figure 18. The relationship between the capacity and the rotational speed.
Minerals 12 00235 g018
Figure 19. The relationship between capacity and the size of the closed side setting.
Minerals 12 00235 g019
Figure 20. The relationship between capacity and the eccentric angle.
Minerals 12 00235 g020
Figure 21. The relationship between capacity and the base angle of the mantle.
Minerals 12 00235 g021
Table 1. The structural and operating parameters of reduced-scale cone crusher.
ParameterValueUnit
Size of feed portdf52mm
Particles sized10–15mm
Size of output portdo11mm
Strokes9mm
Eccentric angleθ0.81deg
Rotational speedn30–500rpm
Table 2. The physical parameters of the experimental particles.
ParameterValueUnit
Particles material-Hematite-
Particles composition-Fe2O3-
Mohs hardnessHM5.6-
Compressive strengthσ115Mpa
Tap densityρT3.9t/m3
Pack densityρP2.6t/m3
Table 3. The crushing times of particles in the reduced-scale cone crusher with different rotational speed of main shaft.
Rotational SpeedCrushing Times
nt1t2t3t4t5
164 rpm104.65 s111.11 s116.13 s120.81 s125.16 s
224 rpm46.04 s47.74 s52.79 s53.41 s55.33 s
272 rpm28.57 s28.99 s30.82 s31.22 s31.21 s
321 rpm22.22 s22.64 s23.37 s24.26 s24.91 s
369 rpm17.48 s19.57 s20.57 s20.22 s20.27 s
406 rpm16.51 s16.67 s17.14 s17.48 s17.51 s
453 rpm14.43 s14.75 s15.13 s15.38 s15.43 s
501 rpm13.69 s14.29 s14.43 s14.52 s14.58 s
Table 4. The physical parameters of the crushed particles.
ParameterValueUnit
Particles material-Magnetite-
Particles composition-Fe3O4-
Mohs hardnessHM5.9-
Tap densityρT4.9t/m3
Pack densityρP2.8t/m3
Moisture contentw3.6%
Table 5. The structural and operating parameters of the ZS200MF cone crusher.
ParameterValueUnit
Rotational speedn368rpm
Top diameter of mantledT1035mm
Bottom diameter of mantledB404mm
Base angle of mantleβ52degree
Size of feed portdf120mm
Size of output portdo22mm
Nip angleαn31degree
Length of parallel striplp80mm
Strokes25mm
Eccentric distancee12mm
Eccentric angleθ0.8degree
Table 6. The variables in capacity calculation of ZS200MF cone crusher.
VariablesValueUnit
Motion characteristic-Free-falling-
Delayed timetd0.010s
Falling timetαc0.107s
Circumferential angleαc237.651degree
Radius of concaveRmax0.480m
Radius of mantleRmin0.528m
Velocity in downward direction zonevdown α α t 0 α c α t 0 v d o w n m a x c o s r R m i n α R m a x R m i n α γ m a x m/s
Velocity in upward direction zonevup r R m i n α V d c o s φ + β 90 R m a x R m i n α m/s
Filling rateηc0.375-
Densityρ2.67t/m3
CapacityQ87.9t/h
Publisher’s Note: MDPI stays neutral with regard to jurisdictional claims in published maps and institutional affiliations.

