Article

Characterization of the Crystallographic Preferred Orientation Relationships of the Magnetite-Hematite-Goethite Phase Transformation during Martitization

by
Victor Mota e Nogueira
1,*,
Paola Ferreira Barbosa
1,
Sathish Mayanna
2,3,
Adalene Moreira Silva
1,
Catarina Labouré Bemfica Toledo
1,
Leonardo Evangelista Lagoeiro
4 and
Luciano Mozer de Assis
5
1
Campus Darcy Ribeiro, Institute of Geoscience, University of Brasilia (UnB), Brasilia 70910900, DF, Brazil
2
German Research Center for Geosciences (GFZ), Telegradenberg, 14473 Potsdam, Germany
3
Carl Zeiss Microscopy GmbH, 73447 Oberkochen, Germany
4
Department of Geology, Federal University of Paraná, Curitiba 81531980, PR, Brazil
5
Vale S.A.—Exploração Mineral de Ferrosos, Fazenda Rio de Peixe, Nova Lima 34000000, MG, Brazil
*
Author to whom correspondence should be addressed.
Minerals 2022, 12(3), 326; https://doi.org/10.3390/min12030326
Submission received: 20 January 2022 / Accepted: 21 February 2022 / Published: 5 March 2022
(This article belongs to the Special Issue Computer-Assisted Microscopy for Characterization of Ores and Rocks)

Abstract

:
The most frequent crystallographic preferred orientations developed during the progressive phase transformation of magnetite-hematite-goethite are described and analyzed in two natural samples of banded iron formations from Carajás Mineral Province. Microtextures of martitized grains containing the three phases and the microplaty matrix were analyzed in a scanning electron microscope equipped with a detector for electron backscatter diffraction. For identifying the correlation between magnetite, hematite and goethite lattice and topotaxity during transformation, multiple orientation relationships between the three phases were tested and verified using three-dimensional misorientation analysis. The results show that basal planes of goethite coincide with basal planes of hematite, which coincide with octahedral planes of magnetite. This indicates that transformation between the three minerals happens topotactically, and the oxygen lattice framework is preserved in all members of the reaction as a form of crystallographic memory. As a result of progressive and cyclical changes in oxidation/reduction conditions, an assemblage of high-order orientation relationships is observed and assigned to a complex process of transformation twinning in-between phase transformation of magnetite, hematite and goethite. In the N4WS iron ore deposit, iron oxides/hydroxides from martitized grains work as susceptible markers of environmental changes still in solid state during the diagenetic process.

1. Introduction

Martitized grains composed of hematite (α-Fe2O3, R 3 ¯ c, ao = 5.038 Å, co = 13.772 Å), goethite (α-FeOOH, Pnma, ao = 9.945 Å, bo = 3.027 Å, co = 4.610 Å) and magnetite (Fe3O4, Fd 3 ¯ m, ao = 8.393 Å) are the most common constituents of the iron formations called jaspilite (JP) in the Serra Norte deposits of iron ore in the Carajás Mineral Province (CMP). These jaspilites are precursors of the massive layers of high-grade friable hematite ore. Topotactic phase transformation of the martitization process between magnetite and hematite in iron formations has been extensively described in the Quadrilátero Ferrífero (QF) region in Brazil by electron backscatter diffraction (EBSD) [1,2], but there is a lack of data of quantitative crystallographic preferred orientation, phase transformations and mineral characterization within the jaspilites of the Amazonian Craton.
During progressive oxidation and reduction of iron oxides/hydroxides, the cubic, trigonal and orthorhombic lattices of the three minerals are linked by specific topotactic relations related to the oxygen lattice framework, being the hematite, in most cases, the intermediate phase in natural systems. In CMP and in many high-grade iron ore deposits around the world, goethite plays a very important role as the final phase in the transformation process and being a substantial part of the bulk high-grade ore and should be considered in the topotactic transformation chain of natural iron oxides/hydroxides.
The natural transformation process between magnetite, hematite and goethite occurs due to different stabilities in oxidizing domains, whereas in aqueous systems, the stability Eh/pH diagram indicates magnetite in a very restricted alkaline and reducing field, and hematite is stable in a much wider pH range and fO2. Stability diagrams consistently show the pair magnetite-hematite, but depending on the data used, the goethite can replace hematite in the diagram and be part of the Fe–O2–H2O system, or metastable phases as maghemite or other FeOOH polymorphs [3]. The stability field of goethite broadens as PH2O increases [3], which is in conformity with the analyzed samples.
In the cases in which iron oxide’s topotactic phase transformations were analyzed in iron formations by EBSD [1], orientation relationships have been the most used parameter for describing the crystallographic preferred orientation and the relationship between the oxide/hydroxide phases. Those studies used a simple model of finding coincidental maxima in pole figures (PF) and analyzing inverted pole figures (IPF) in order to describe the parallelism between crystallographic orientations. However, to consider only orientation in the phase transformation analysis is now regarded as a significant loss of information regarding the crystallographic relationships between crystals [4], and with a complex phase in the system such as goethite, statistics through pole figures showing only orientation planes of low-index crystallographic planes are not enough to describe the transformation process and the necessary rotation angle of misorientation.
Orientation is defined as a passive rotation expressed in coordinates from a crystal reference into a specimen reference system [4], where orientation information of only one crystal specimen is analyzed. Misorientation can be defined as the difference of orientation between two crystallites, and it is also a passive rotation in 3D space, but in this case, between two crystal references frames, where both orientations are considered and an orientation relationship between two phases [4,5]. The grain boundaries can be expressed as a rotation about a common axis to both crystal frames, and this kind of misorientation data, called angle-axis pair description, can be better visualized into a three-dimensional space using Rodrigues–Frank (R-F) vectors [5] or axis–angle, and in this case, the domain used would be restricted to only the coincidental fundamental zone between the two phases selected [4]. This new technique for modeling and visualizing misorientaion for topotactic transformation of natural iron oxides and hydroxides samples could lead to a better understanding and characterization of crystallographic relationships between the phases, with the graphic visualization of rotational angles of misorientation necessary for the theoretical parallelism between the phases with low- and high-index crystallographic planes. Thus, this technique considers both rotational angles and axis being then applicable to the study of phase transformation of crystalline phases of different space groups.
This technique can also show how much the phase transformations contribute to the bulk texture of the analyzed grain/rock comparing the total analyzed points and the points belonging to a certain OR cluster, showing how those transformations between oxides and hydroxides are related to important textures in banded iron formations and iron ores in general. In this study, both orientation and misorientation data were considered and used for describing the main crystallographic preferred orientations and relationship between crystals.
For this study, we considered four magnetite–hematite orientation relationships. The most common topotactic orientation relationship for the magnetite–hematite is considered and described in [6,7] (OR A—Table 1). High-index orientation relationships have been also described for natural and synthetic samples of hematite when submitted to different and cyclical conditions of temperature and reduction experiments (OR B–D—Table 1). These OR are described in [7,8] and were considered in this study during 3D misorientation analysis.
Those secondary high-index relationships are not necessarily topotactic as they are a result of what is defined by [8] as magnetite and hematite transformation twinning followed by new generations of recrystallized magnetite and hematite, generating a complex and diverse system of orientation relationships as OR S (Table 1). For a better quantification of those OR, other equivalent OR in different directions were also considered and analyzed, followed by a briefly analysis of twinning within the samples for magnetite and hematite.
For orientation relationships regarding the transformation stage of hematite to goethite, the expected ORs can be seen in Table 2. According to [9], both goethite and hematite can be defined as a distorted hexagonal close packing, whereas goethite has half of its sites filled and hematite two thirds filled. In the goethite structure, the anions are stacked in layers perpendicular to the c-axis (ABA stacking). Similarly, the hematite structure has layers stacked along c-axis but with minor anions and cations changes. Those minor changes result in the elongation of hematite axis, but during the transformation, there are not many changes in the cubic packing structure of both minerals [9], which indicates that the most reasonable OR expected would be between the parallelism of basal planes (0001)Hem and (001)Ght, with OR α representing the [10–10]Hem|| [100]Ght direction and OR β the [11 2 ¯ 0]Hem|| [100]Ght.
The main objectives of this study are to describe the most frequent crystallographic preferred orientation developed during the progressive phase transformation of magnetite to hematite and hematite to goethite and to verify if it is possible to establish a genetic relationship between the phases and if transformation leaves a crystallographic memory up to its last member. This might be useful for evaluating the extent to which the crystallographic orientation of magnetite, hematite and goethite can be attributed to phase transitions and to contribute to the debate of the diagenetic process in jaspilite in Archean banded iron formations and how iron oxides and hydroxides can carry important information regarding environmental changes during geological time due to its easily reactivity and transitioning character.

2. Materials and Methods

2.1. Sampling for EBSD Analysis

Samples were collected from a 355 m deep drill core (F-1051) from the deposit N4WS provided by the company VALE S.A. This specific drill core was chosen because its low deformation; almost absent volcanic intrusions in iron formations and its complete sequence of jaspilites, high-grade friable ore and mineral canga. For EBSD analysis, only the jaspilite portion was chosen. Its two extremes were selected: Sample A (300 m to 302 m deep) containing euhedral magnetite crystals and early stage phase transition to hematite and Sample B (200 m to 202 m deep) containing grains with the three existing phases and a higher degree of phase transformation and mineral banding. Both samples represent the bottom and the top, respectively, of the preserved jaspilite sequence: Sample A is adjacent to the volcanic rocks that underlay the sequence, and Sample B is adjacent to the high-grade ore higher up in the sequence. The two thin sections for EBSD analysis were polished in colloidal silica for seven hours in a vibratory polisher.

2.2. BSE Imaging

Prior to the main analysis, backscattered electron (BSE) maps of the whole thin sections were carried out on a Zeiss Gemini Column Ultra Plus Field Emission-Scanning Electron Microscope of the Potsdam Imaging and Spectral Analysis (PISA) Facility at the German Research Centre for Geosciences (GFZ), and the appropriate grains were selected for EBSD analysis. Grains from Sample A containing magnetite and hematite indicating phase transformation were selected, and grains with the three target phases (magnetite, hematite and goethite) in Sample B were selected. The samples were carbon coated and analyzed with an accelerating voltage of 20 kV, working distance of 9 mm and an aperture size of 120 μm, and beam current of 4.0 nA.

2.3. EBSD

Thin sections were finally polished using 0.02 nm colloidal silica. EBSD measurements were carried out at a low vacuum of ~100 mbar on a FEI Quanta 3D Dual Beam FEG equipped with an EDAX electron backscatter diffraction system at PISA facility of the GFZ. Data acquisitions were made by the EDAX TEAM software, where Kikuchi patterns were well selected for each phase according to its crystal system. An accelerating voltage of 20 kV, beam current of 4.0 nA, working distance of ~15 mm and a step size of 100 nanometers between the measurements were used for the EBSD analysis. The samples were not carbon coated. The SEM stage was controlled manually to the selected areas in BSE mapping, and forescattering electron images were generated to each area. Phase maps and orientation maps (inverse pole figure maps) were generated using Tango software and pole figures generated with Mambo Software using contouring calculation of the clustering poles. Contour plot parameters for the analyzed data are half width of 15° and data clustering of 10°. Phase maps were colored in the following colors: blue for magnetite, red for hematite and yellow for goethite. Three-dimensional misorientation spaces were generated on MTEX software [4,10] combining fundamental zones of two selected analyzed phases. The experimental misorientation data were plotted and compared to the computer experimental misorientation clusters showing space-geometrical correlation between faces and crystallographic directions between two coincident crystals.

3. Results

3.1. BSE and EBSD Observations by IPF and PF

3.1.1. Sample A

In this first analyzed sample, the microstructural and crystallographic aspects of phase transition between magnetite and hematite show evidence of initial stage of transformation. This sample belongs to the interval between 300 m and 302 m depth of the drill core sampled for this study. The grains are mainly composed of magnetite with hematite along its border or cutting through its interior (hematite is darker gray contrast in BSE images—Figure 1). Grains are usually shrouded by micro-platy hematite and chert matrix or embedded into banded aggregates domains. In both domains, grains are squared and tabular, of larger sizes with well-developed shapes most times when compared to the small size of crystals in the matrix. One grain of each domain, displaying direct phase transformation along their octahedral planes, was chosen and is shown in Figure 2. Those straight swaddle bands are a strong indication of crystallographic control of transformation [11,12] and can be easily seen in both phase maps of Figure 2, in conventional BSE-SEM images or in optical microscopy.
Magnetite is displayed in blue and hematite in red in Figure 2. The first grain described, Grain I of Sample A, is a triangular shaped grain (ca. 200 μm wide) mostly composed of magnetite (74%) with straight layers of hematite (39%) along its border (ca. 15 μm of diameter) or crossing the interior of the crystal. This grain is embedded in the matrix and crosscuts the primary banding of the rock. Grain II of Sample A, differently, is surrounded by an aggregate of magnetite crystals following the banding of the rock. Grain II is euhedral with a dimension of 130 μm × 200 μm. It has hematite layers along its edges and a tabular hematite of 25 μm in its interior. This grain is composed of magnetite (61%) and hematite (39%).
Inverse pole figure maps of both grains are also shown in Figure 2 for a better visualization of spatial orientation of magnetite and hematite lattice. In both crystal systems of magnetite and hematite, the octahedral (111) and basal (0001) planes normal are fixed along the Z-direction. Magnetite crystals show an orientation of a single crystal single preferred orientation represented by a lime green color in Grain I and light green in Grain II. Hematite in Grain I is marked by straight stripes showing one single orientation.
Poles figures of the {100}, {110} and {111} planes were generated for magnetite and {0001}, {11 2 ¯ 0}, {0 1 ¯ 10} for hematite (Figure 2). In both grains, the poles of octahedral {111}, dodecahedral {110} and hexahedral {100} planes are of point maxima indicating crystallographic orientations of single crystals. The poles of octahedral {111} and dodecahedral {110} planes for Grain I show 4 and 6 maxima, respectively, which are coincident with the poles to the basal {0001} and second order prism {11 2 ¯ 0} planes in the pole figures of hematite (marked by black arrows). In pole figures of Grain II, 4 and 8 maxima can be seen in the poles figures relatively to octahedral {111} and dodecahedral (110) planes, respectively. They coincide with pole to {0001} and {11 2 ¯ 0} planes in hematite pole figures of grain II.

3.1.2. Sample B

In this second analyzed sample (Figure 3), the three iron minerals of this study are in contact. The microstructural and crystallographic aspects of magnetite, hematite and goethite show evidence of an advanced stage of transformation. The three phases are easily distinguishable in backscatter images. This sample belongs to the interval between 200 m to 202 m deep of the drill core sampled for this study. The grains are mainly composed of hematite displaying inner domains with smaller grains of magnetite and goethite. As in the previous sample, grains can be shrouded by micro-platy and chert matrix or embedded into banded aggregates domains. In both domains, martitized grains display hexagonal and rhombic euhedral shapes, and tabular hematite is parallel to the banding of the rock. Two areas of each domain (Figure 3), displaying direct phase transformation were chosen and are shown in Figure 4, for the single grain domains, and Figure 5, for aggregate domains.
Grain III from Sample B has a trigonal outlier (ca. 100 μm × 75 μm in size, along the longest and short direction) and are composed of 43% of hematite, 34% of magnetite and 23% of goethite (Figure 4a). This grain is shrouded by matrix and partially filled with smaller grains of magnetite and goethite. Near the grain edges, it is also possible to see layers of goethite, indicating either the direct transformation between hematite and goethite or the precipitation of goethite. In fact, it is in the inner domains of the crystal that magnetite and goethite occur in large proportions. Grain IV from Sample B (Figure 4b) shows features similar to those of grain III in terms of grain size (100 μm × 85 μm) and composition by (62% of hematite, 21% of magnetite and 17% of goethite).
Pole figures of the poles of {100}, {110} and {111} planes were generated for magnetite; {0001}, {11 2 ¯ 0}, {0 1 ¯ 10} for hematite and {100}, {010} and {001} for goethite (Figure 4). In both grains III and IV, the poles to {111}, {110} and {100} planes for magnetite are multiple point maxima indicating an orientation of single crystal. Pole figures of {111} and {110} planes for Grain III and IV show 4 and 6 maxima, respectively, which are coincident with the poles to basal {0001} and prismatic {10 1 ¯ 0}/{11 2 ¯ 0} planes of hematite and with the poles to basal {001} and prismatic {010} planes of goethite (marked by black arrows in Figure 4).
In Figure 5, we see Grain V and VI from Sample B. Grain V is in fact a section of tabular hematite (ca. 100 μm width) composed primarily of 54% of hematite, 22% of magnetite and 24% of goethite (Figure 5a). This grain is part of a bigger banding domain mostly composed of hematite and goethite along the banding. Magnetite is present as sparse smaller grains in both hematite and goethite domains. Grain VI from Sample B (Figure 5b) shows similar characteristics to grains from Figure 2 (ca. 120 μm in diameter), and it is composed of 54% of hematite, 22% of magnetite and 24% of goethite.
The pole figures of Grain V show a more scattered orientation for the three phases, when compared to grain pole figures presented before, whereas in Grain VI magnetite and hematite pole figures maxima are more concentrated. Pole figures for {111) and {110} planes’ form Grain V and VI show 4 and 6 maxima which are coincident with the l poles for {0001} and {10 1 ¯ 0}/{11 2 ¯ 0} planes in pole figures of hematite as well as with poles to {001} and ({010} planes in pole figures of goethite. Goethite in both samples exhibits quite scattered pole figures when compared to the previous grains from Sample B, even though the maxima are still easily recognizable in the pole figures.

3.1.3. Matrix A and B

Phase Maps, Inverted Pole Figures and Pole Figures were generated for domains containing only the matrix of both samples (Figure 6). The matrix is predominantly composed of microplaty hematite (Sample A: 94% of hematite, 6% of magnetite; Sample B: 64% of hematite, 1% of magnetite and 35% of goethite. Pole figures for the matrix of Sample A and Sample B show a preferred orientation of planes, seen mainly by the concentration of points in the Y-direction of the pole figure (0001)Hem and (001)Ght and also by a cluster of points along the X-axis of (11 2 ¯ 0)Hem and (0 1 ¯ 10)Hem pole figure.

3.2. EBSD Misorientation Analysis

3.2.1. Magnetite–Hematite Orientation Relationships

For a better understanding of the expected crystallographic relationships between magnetite and hematite and their rotation centers, a visual guide of clusters was simulated relatively to each OR from Table 1 and their equivalent directions in the appropriate fundamental zone (Figure 7). Here we call Type-A orientation relationships those with low-index crystallographic planes (111)Mag||(0001)Hem in all equivalent directions of <110>Mag || <10 1 ¯ 0>Hem, Type B–D those with high-index crystallographic planes (111)Mag||(0001)Hem with l > 2 and Type S those with (111)Mag || (10 1 ¯ 0)Hem or (111)Mag || (11–20)Hem. The rotation centers of each cluster in Figure 7 were used to color and highlight the ORs, which this study aims to do. The first domain refers to the ORs cited in Table 1 (clusters A to D, Figure 7). They share the same direction [110]Mag || [10 1 ¯ 0]Hem and have a rotation angle, respectively, of ~54.74°, ~35.26°, ~25.24° and ~15.79°. The clusters move towards the center of the fundamental zone as their crystallographic index l of the OR increases. The same angularity can be observed in the directions [110]Mag || [11 2 ¯ 0]Hem and [011]Mag || [11 2 ¯ 0]Hem as they are equivalent clusters of those previously mentioned here. The clusters found in the edges of the fundamental zone (Type-A) are assigned to the most expected topotactic orientation relationship between magnetite and hematite transition. The clusters S and S’ (Type-S) formed at the side of the fundamental zone and with a rotational angle of ~45° are an expected coincidence which is consequence of Type-B ORs [8] but not usually seen in previous studies or in pole figures. A table with all orientation relationships misorientation clusters of grains, their misorientation statistics and variations in a 5° radius is presented in Table 3.
Crystallographic relationships between grain boundary domains of magnetite-hematite inside martitized grains were assessed by plotting misorientation within the corresponding fundamental zone of the axis–angle space (Figure 8). Boundary misorientations are clustered near a ~54.74°, ~35.26°, ~25.24° and ~15.79° rotation about the [110]Mag || [10 1 ¯ 0]Hem axis and the perpendicular directions [110]Mag || [11 2 ¯ 0]Hem and [011]Mag || [11 2 ¯ 0]Hem and also near a ~45° rotation about the [11 1 ¯ ]Mag || [11 2 ¯ 0]Hem and [11–1]Mag || [10 1 ¯ 0]Hem. Grain I from the sample A (Figure 8a) shows pronounced clustering in ORs of Type A. Orientation relationships of Type-A show the highest density of points among all of them, especially in the direction [011]Mag || [11 2 ¯ 0]Hem.
Among high-index ORs clusters, Type B in the direction [011]Mag || [11 2 ¯ 0]Hem and Type-C have the highest density. Grain 2 from Sample A (Figure 8b) shows, as in the previous grain, strong clustering in the ORs Type-A with high density in the directions [110]Mag || [11 2 ¯ 0]Hem and [011]Mag || [11 2 ¯ 0]Hem. Between high-index ORs, Type-B and D clusters are those with the highest density in the three directions [110]Mag || [10 1 ¯ 0]Hem, [110]Mag || [11 2 ¯ 0]Hem and [011]Mag || [11 2 ¯ 0]Hem.
Differently from the previous grains of Sample A, this grain shows a much lower density of clusters of ORs Type-S. The highest density of points is located in clusters of Type-A in the directions [110]Mag || [10 1 ¯ 0]Hem and [011]Mag || [11 2 ¯ 0]Hem, colored in magenta and yellow, respectively (Figure 5b). High-index ORs are more pronounced in Type-B clusters in the directions [110]Mag || [11 2 ¯ 0]Hem and [011]Mag || [11 2 ¯ 0]Hem. Grain IV from Sample-B (Figure 8d) shows a higher density of clusters of Type-A, in all three directions, and of Type-S. This grain also shows a medium density cluster referred to Type-B, especially in the directions [110]Mag || [10 1 ¯ 0]Hem and [110]Mag || [11 2 ¯ 0]Hem, and weak clustering of Type-C and D in the main [110]Mag || [10 1 ¯ 0]Hem direction.
Grain V from Sample B (Figure 8e), which corresponds to a section of the banding, shows the conventional cluster of Type A and S, with the highest density in the directions [110]Mag || [11 2 ¯ 0]Hem and [011]Mag || [11 2 ¯ 0]Hem. Between high-index ORs, Type-B clusters show high density in all three directions, followed by medium to low density Type-C clusters in the directions [110]Mag || [11 2 ¯ 0]Hem and [011]Mag || [11 2 ¯ 0]Hem, and Type-D cluster with medium density in the directions [110]Mag || [10 1 ¯ 0]Hem, [110]Mag || [11 2 ¯ 0]Hem. Between the high-index ORs clusters, only Type B is pronounced, especially in the directions [110]Mag || [10 1 ¯ 0]Hem and [110]Mag || [11 2 ¯ 0] Hem.
Overall, the main texture of all analyzed grains is still related to Type-A orientation relationship, responsible for the direct transition between magnetite and hematite. On average, they represent 56.36% of total misorientation points plotted into the magnetite-hematite fundamental zone, in a 5° radius of their cluster center. Their texture contribution for the magnetite–hematite grain boundary analysis ranges from 38.31% to 80.89% of total plotted points. Type-S orientation relationships clusters are identified in every sample. These orientations are responsible for 9.61% and 11.04% of total points in a 5o radius from clusters centers. Grains from Sample B show a less pronounced clustering of Type-S, ranging from 1.52% to 2.88% of total plotted points in a 5° radius from clusters centers.

3.2.2. Hematite–Goethite Orientation Relationships

In Figure 9a a visual guide of the expected clusters for the ORs of Table 2 was generated within the appropriate misorientation space for the hematite–goethite crystallographic relationship analysis. The main expected ORs for the hematite–goethite phase transition were called here in this study as OR α and β, for the following crystallographic relationships: (0001)Hem || (001)Ght, [11 2 ¯ 0]Hem || [100]Ght and (0001)Hem || (001)Ght, [0 1 ¯ 10]Hem || [100]Ght, respectively. The OR α and β clusters represent a misorientation with a rotation of 0° and 30° around the c-axis, respectively. Two pairs of clusters with a rotation of 90° are found in the analyzed data, and it is also represented as ORs γ and δ. We called the ORs related to those clusters Type-γ and Type-δ ORs.
Crystallographic relationships between grain boundary domains of hematite–goethite inside martitized grains of Sample B were assessed by plotting misorientation data within the corresponding fundamental zone of the axis–angle space (Figure 9b–e). A table with all orientation relationship of misorientation clusters of grains, misorientation statistics and variations of 5° radius is presented in Table 4.
All analyzed grains present clustering in the orientation relationship α. They are the most evident and dense clusters. The orientation relationship β is also present in most samples, except in Grain IV in which it is absent (9c), although the clustering with a 30° rotation along the c-axis is less expressive than the previous OR α. For a better understanding of Type γ-δ ORs, a misorientation analysis of hematite–hematite grain boundaries was also carried out for possible x-twin identification in the hematite grains that could justify those relationships in the samples (Section 3.2.4).

3.2.3. Magnetite–Goethite Orientation Relationships

Although the direct transition between magnetite and goethite in natural systems has not been described until now, misorientations of grain boundaries between the two extreme points of transformation were analyzed and assessed by plotting them within the appropriate fundamental zone of axis–angle space. This was made for a better understanding of the crystallographic relationships between magnetite, hematite and goethite and to check if the crystallographic memory in fact propagates to new phases. Visual guides with simulated clusters were made and can be seen in Figure 10a. The chosen clusters were made by crossing data between those ORs related to topotactic transformation in Table 1 and Table 2. The resulting parallelism of both low- and high-index planes can be seen in the legend of Figure 10, and the data were assessed by plotting misorientation of grain boundaries of magnetite–goethite of Grain III in the appropriate fundamental zone (Figure 10b).
Five well-defined clusters can be seen from the given data: the cluster with the highest density among all of them is related to the orientation relationship (111)Mag || (001)Ght, [110]Mag || [100]Ght, which is a crossing statement between Type A in the magnetite–hematite transition and Type α-β in the hematite–goethite transition, followed by its opposite pair (110)Mag || (100)Ght, [111]Mag || [001]Ght colored in yellow in Figure 10. These two clusters share the same rotation angularity of Type A orientation relationship of Table 1, and they sum 7.10% of total plotted points in a 5° radius of the cluster center. High-index orientation relationships can be seen as three clusters in the [110]Mag || [100]Ght direction, related to the orientation relationship of Type B-D and Type α-β. The crystallographic relationship (112)Mag || (001)Ght cluster is the denser between the high-index planes ORs, although the other two relations can also be seen.

3.2.4. Matrix’s Magnetite–Hematite Orientation Relationships

As in Section 3.2.1, the matrix of magnetite–hematite misorientations was also analyzed in the appropriate fundamental zone for comparison purposes with the clustering of grains. Differently from the domains of single crystals analyzed before, matrix misorientations show a random distribution of points within the fundamental zone (Figure 11). The complete data of orientation relationships misorientation clusters of grains, their misorientation statistics and variations in a 5° radius are also presented in Table 3.
The high-index orientation relationships have a prevalent density when compared to Type-A or low-index ORs. The matrix of Sample A (Figure 11a) has a high-index representing 10.68% of the total misorientation points, when compared to only 3.61% of low-index clusters. Within high-index ORs, the highest density of points belongs to Type-B ORs (7.30%) and Type-D (2.46%) (Figure 11a). Type-C ORs is responsible for 0.93% of total misorientation points. Type-B and Type-D show consistence of density in all directions, with exception of Type-D clusters which have a denser cloud in the [110]Mag || [10 1 ¯ 0]Hem direction. Type-C clusters contributes for only 0.93% of total points, whilst Type-S clusters have 2.77%.
Sample B matrix (Figure 11b) shows less dense clusters when compared to the previous sample, but high-index orientation relationships still prevail over low-index ones (Figure 11b). The matrix of Sample B has a high-index representing 7.08% of the total misorientation points, in contrast to only 3.08% of low-index clusters. Within high-index ORs, the highest density of points belongs to Type-B ORs (4.15%). Type-C and Type-D clusters centers have a total of 1.14% and 1.79% of total plotted points. Within Type-A, the highest density cluster is located along the [011]Mag || [11 2 ¯ 0]Hem direction. Type-B clusters are denser in the [011]Mag || [11 2 ¯ 0]Hem and [110]Mag || [11 2 ¯ 0]Hem directions. Type-S ORs clusters have 1.67% of all plotted points in a 5° radius from their cluster centers. In general, matrix orientation relationships tend to have a greater contribution of Type-B relationships than topotactical ORs of Type-A, being Type-B 1.3 to 2 times higher in proportion of points. Both OR are the most important crystallographic textures in the matrix’s magnetite–hematite misorientation analysis. Sample A shows a higher density of Type-D and Type-S clusters when compared to Sample B, but they still share consistency with high-index OR overcoming Type-A in total points plotted, especially Type-B orientation relationships.

4. Discussion

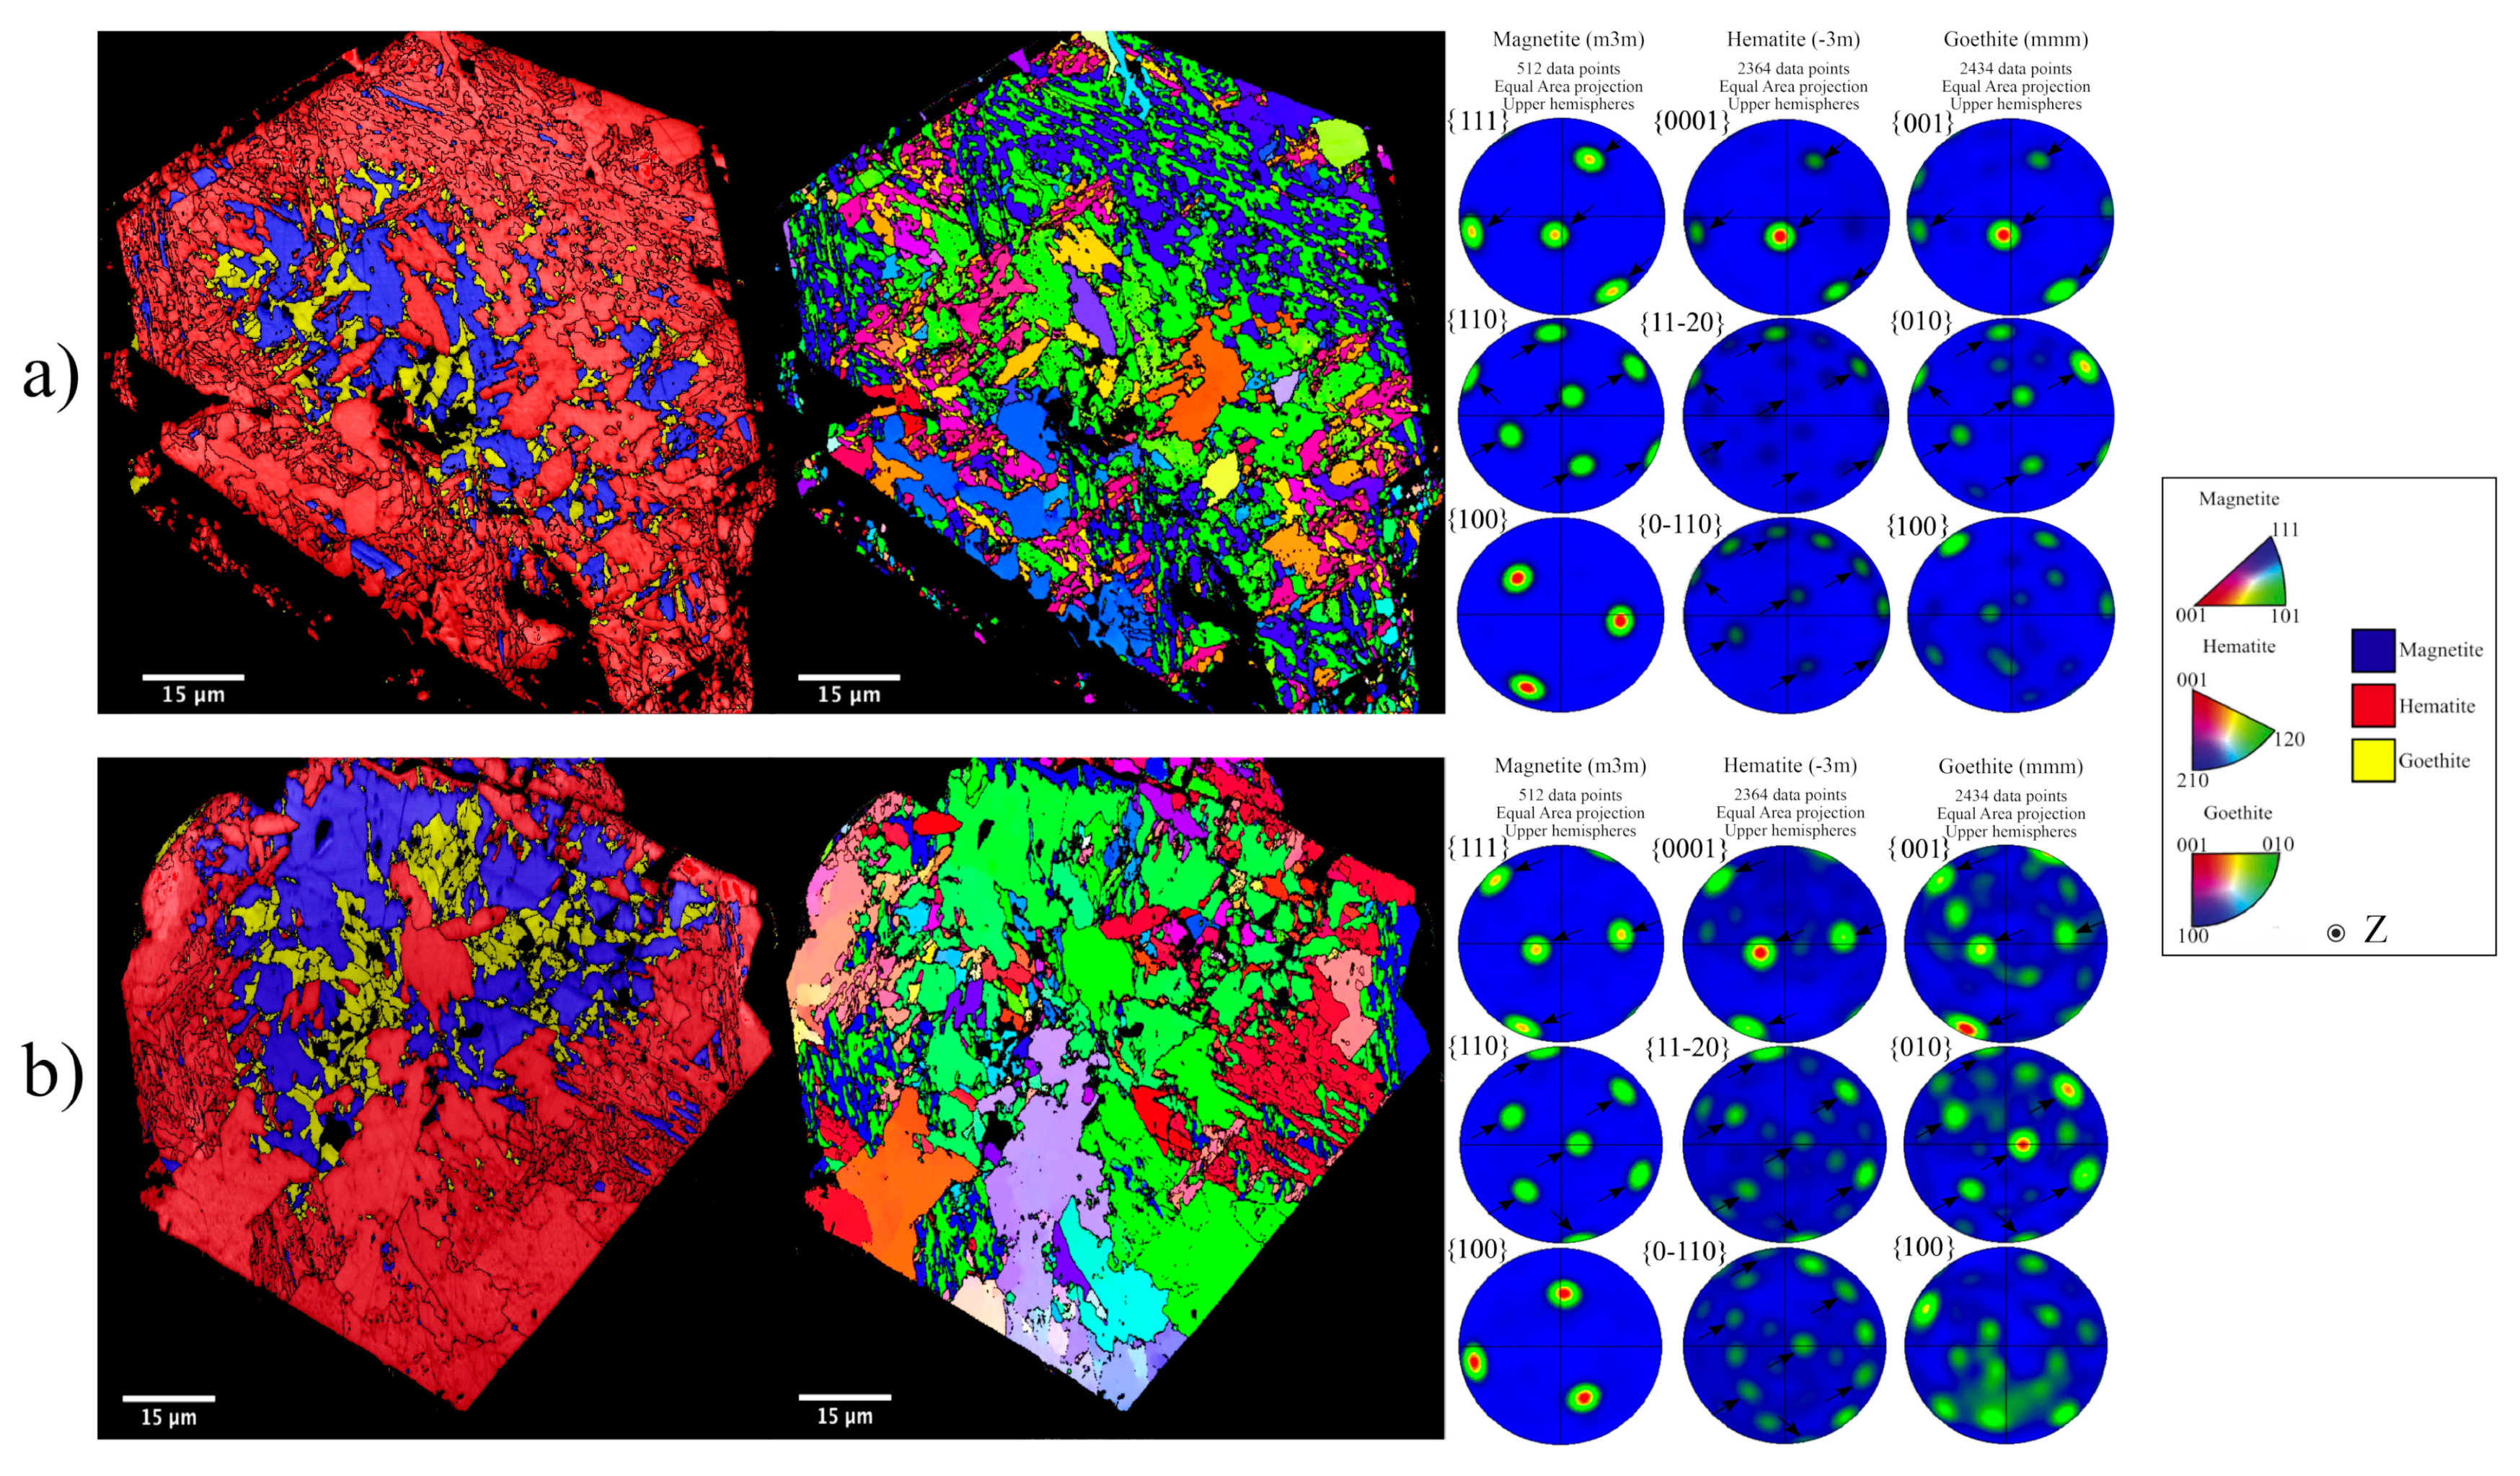
Orientation relationships between low-index planes can be easily recognized in pole plot figures of all grains analyzed from both samples by coincidental maxima. This preliminary analysis is already satisfactory to evidence an orientation relationship between the planes (111)Mag || (0001)Hem || (001)Ght; [110]Mag || [10 1 ¯ 0]Hem || [010]Ght which can be linked with the pairs of topotactic transformation of magnetite–hematite and hematite–goethite [1,9,11]. Those orientation relationships can also be recognized and quantified in misorientation analysis within their appropriate fundamental zone and in pairs. This is evidence that in the grains where the three phases coexist the basal planes of goethite coincides with basal planes of hematite, and the basal planes of hematite coincide with the octahedral planes of magnetite. No evidence of intermediate and metastable phase of maghemite was found in this study.
The first orientation relationship resulting from the transformation process is the OR (111)Mag || (0001)Hem, [110]Mag || [10 1 ¯ 0]Hem, here assigned as Type-A clusters. This is the only OR that shows the expected topotactic relationships according to [8]. Type-A OR is the most common texture in all analyzed grains, contributing from 38.31% to 80.89% to the total misorientations plotted points from the magnetite–hematite interface. The transition between these two minerals and their crystallographic memories are responsible for the main crystallographic texture of the iron formations of the N4WS deposit. Type-A OR is the most common texture among grains due to its abundance. This OR indicates topotaxity between grains of magnetite and hematite in the deposit, which are mainly located inside martitized grains.
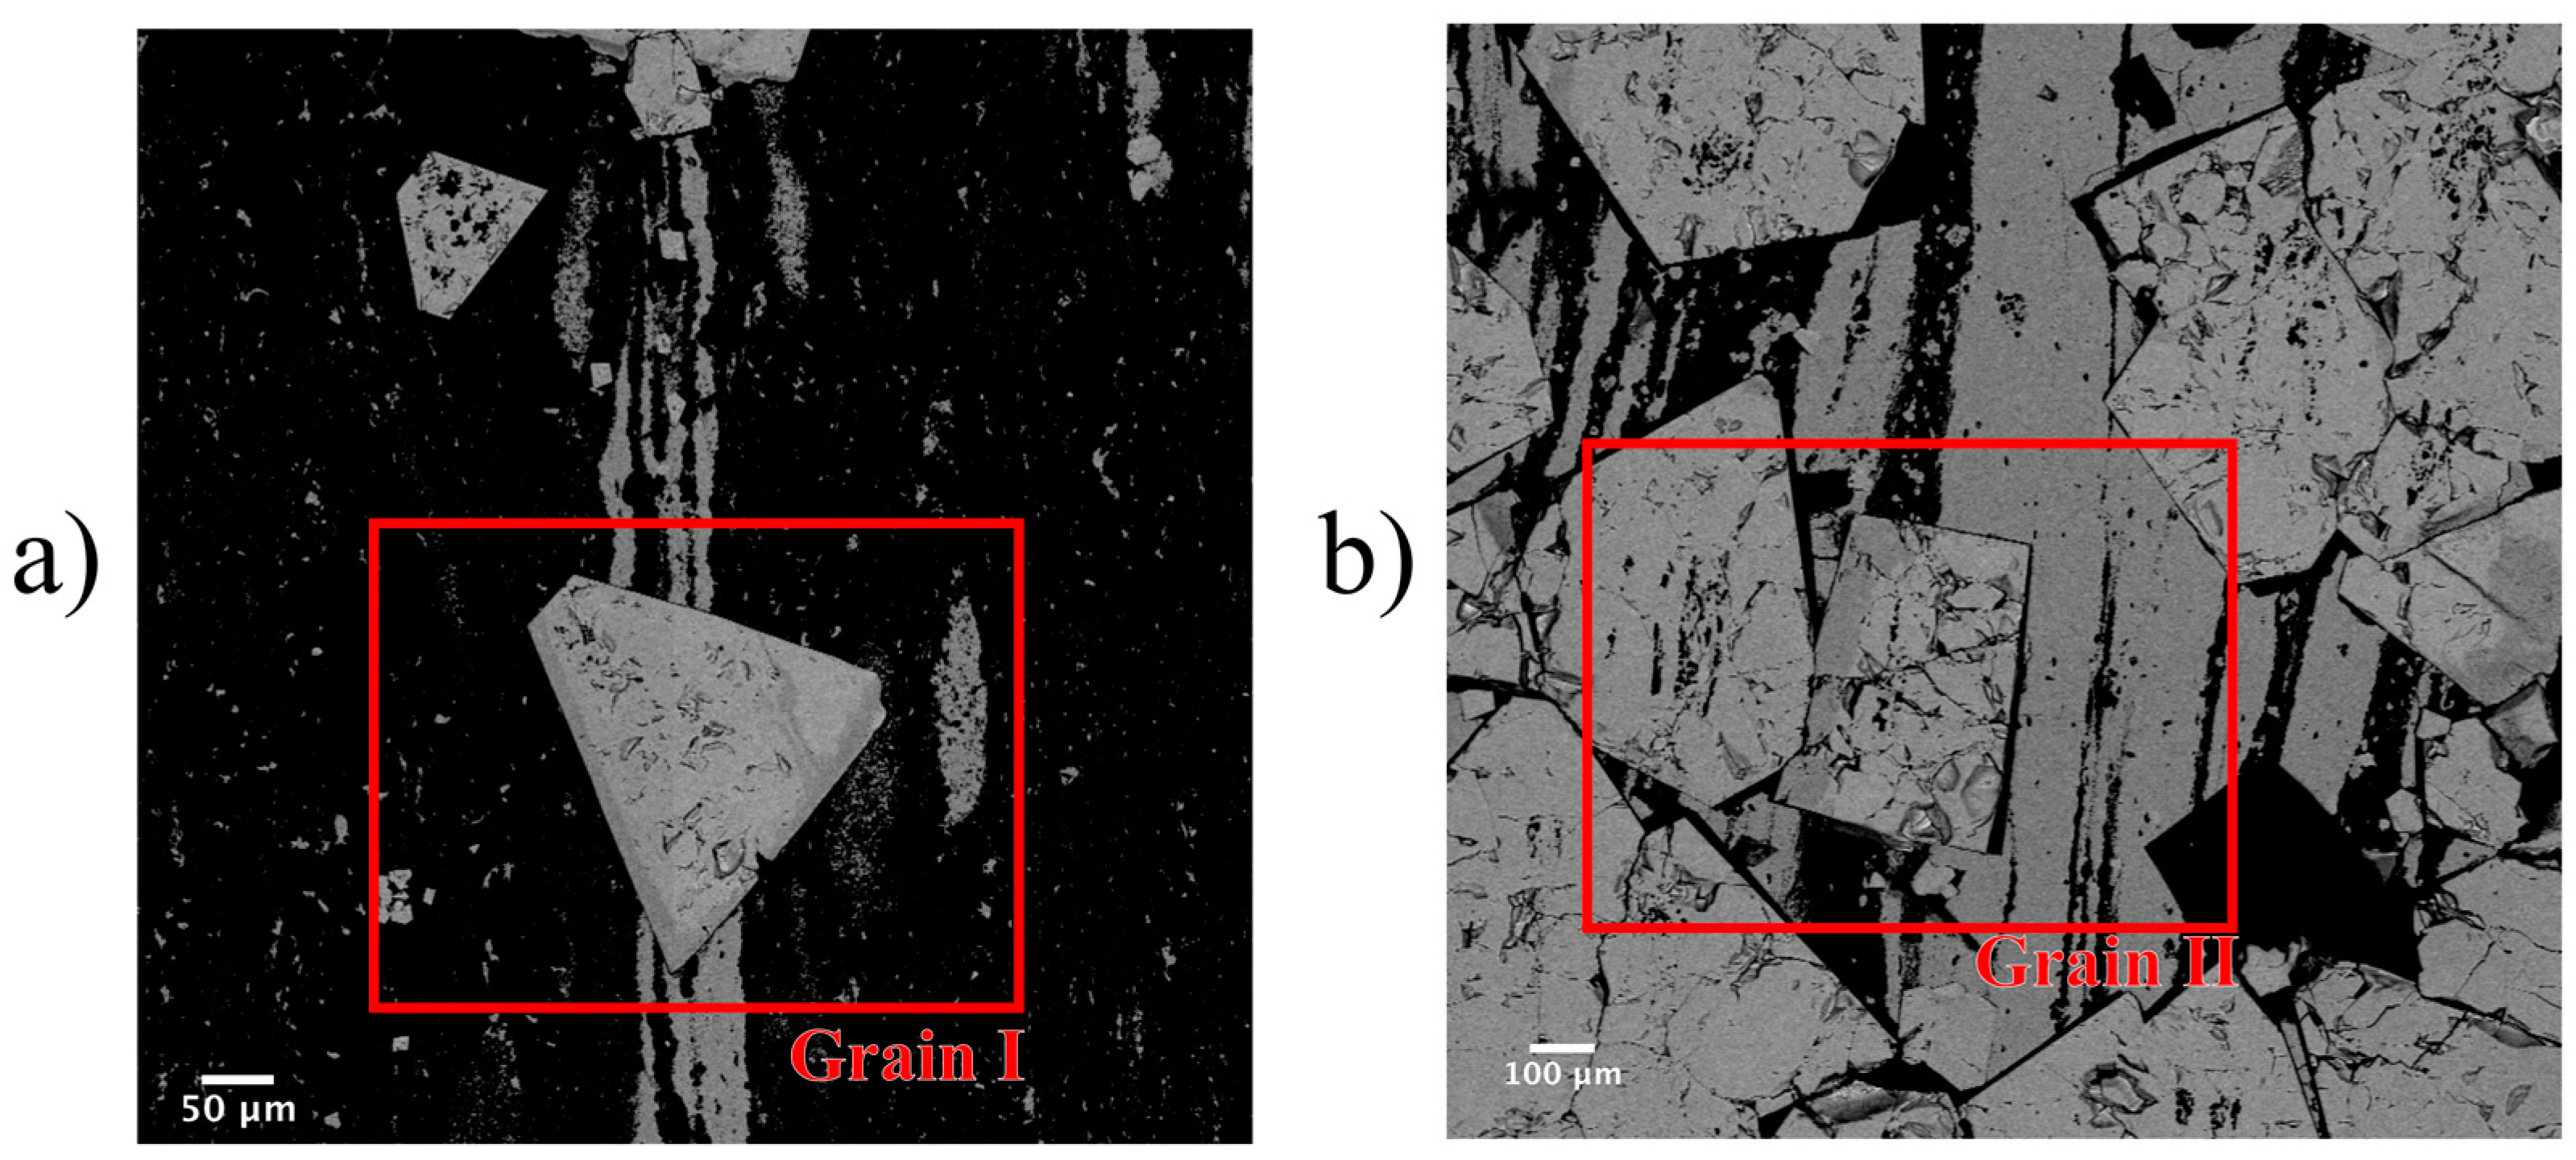
The multiple orientation relationships of high-order planes contribute in a minor way to the bulk texture of grains, ranging from 1.38% to 5.95% of total plotted points, although they are still distinguishable from random oriented misorientation points. Type-B orientations are more pronounced in grains belonging to banding domains, especially Grain V and VI which have a total percentage of 2.36% and 4.02% of total points related to clusters of high-order in B. Type-C clusters are not very well-developed in any samples, always ranging from 0.20% to 0.77% of total plotted points. Type-D cluster is more frequent than the previous ORs. The total percentage of Type-D cluster ranges from 0.26% to 3.25% of total plotted points and has an average value of 1.13%. The highest value for Type-D clustering belongs to Grain II from Sample A.
For a better understanding of the high-order orientation relationships, a further analysis of magnetite–magnetite and hematite–hematite grain boundaries is required for identification of twining near CSL boundaries in magnetite and recrystallization twins in hematite. These high-order ORs which are less expressive than Type-A do not indicate topotaxity in the samples but evidence the complex rebalance twinning system of magnetite and hematite crystals when exposed to different temperatures of reduction conditions in a successive phase transformation cycle [8,12].
Due to the large overlap of orientation relationships and transformation cycles, it is not possible to verify a genetic relationship between the phases, only that the remnants of such ORs are still preserved in grains of the N4WS deposit. The Serra Norte iron formations are known for their highly preserved jaspilites and for the low intensity of regional metamorphism, unlike iron formations of the QF in which metamorphism was responsible for intensifying the magnetite–hematite transformation [12].
The martitized grains under low-grade metamorphism provide favorable conditions to preserve their crystallographic memory in different moments of phase transformation and oxidation/reduction conditions. Often those textures are overprinted by the most common orientation relationship of topotactic transformation (Type-A) or other ORs caused by strain. The preservation of high-index orientation relationships in the grain boundary interfaces and in the matrix is evidence of progressive and dynamic cycles of oxidation–reduction and/or a nearby source of heat during the diagenesis.
Whiters and Bursill (1979) used a matrix transformation technique for a better understanding of high order orientation relationships such Type-B to Type-D and the possible models for orientation relationships between magnetite and hematite. Our analyses of natural samples are in consonance with experimental data modeled by their studies, in which transformation-induced orientation relationships were best fitted in a quaternary orientation Hem/MagA/MagT/Hem’/MagB. This most plausible quaternary orientation can be represented as misorientation clusters by the presence of Type-A, Type-B, Type-D and Type-S clusters and explained as follows: topotactic transformation of hematite into magnetite followed by twinning of magnetite (Hem/MagA/MagT) on (-111), represented by Type-A and D clusters, and finally phase transformation of hematite followed by a recrystallization of magnetite forming Type-B and consequentially Type-S clusters (Hem’/MagB). Whiters and Bursill (1979) confirm in their study that Type-D OR is a more reasonable orientation than Type-C, representing a consequence of the first one. Type-B, D and S high-order orientation are an indicative of a complex process of transformation twinning in between the process of topotactic transformation of magnetite and hematite. Type-B orientations are frequently observed in higher temperatures of reduction (773–1273 K) and Type-C and D orientations, in moderate temperatures (473–673 K), where CO/CO2 gas works as buffers for reduction [13,14].
The overlapping of different crystallographic preferred orientations in martitized grains, shows that these grains possibly grew close to a source of heat. The iron (hydro)oxides minerals are susceptible to environmental changes still in solid state during the diagenesis of the pile and also the presence of intrastate percolating fluid. Such oxide-hydroxide grains function as crystallographic markers of the Archean ocean physicochemical conditions and iron formations of the region. Indirectly, the presence of these minerals can be related to the conditions of atmosphere and circulating fluids in contact with iron formations [15,16,17,18]
The understanding of atmospheric changes in the Archean has changed, and it is already considered that the transition to an oxygenated atmosphere occurred in an oscillatory manner and not abruptly as previously considered [19]. Iron oxides and hydroxides are extremely susceptible to changes in terrestrial oxidation, and preserved rocks may contain remnants minerals that traces of different temperatures and oxidation/reduction conditions that occurred during the diagenesis process of iron formations.
These series of changes show that martitization is a complex process that involves (1) topotactic transformation of magnetite into hematite, and vice versa; (2) a complex twinning transformation system and (3) successive phase changes still in solid state during diagenesis. Such successive transformations are also responsible for a significant change in volume and in the habit of crystal due to the abrupt transformation from a crystal system of high symmetry (cubic) to symmetries of lower symmetry (trigonal and orthorhombic). Continuous and successive phase changes in elongated bands parallel to the banding show that the phase transformation continued even with the increase of the stacking pile during diagenesis.
The temperature of reduction required for generating the ORs of Type B, C and D compiled by [14] are not consistent with the low temperature metamorphism from the iron formation of the Serra Norte Deposits [20,21]. The most reasonable possibility to explain the larger amount of phase transformation in these rocks due to the differences in the temperature of reduction is a source of heat and fluids nearby the iron formations of N4WS during diagenesis.
The orientation relationships of greatest importance in the misorientation analysis of the hematite–goethite transformation interface is Type-α, regarding the orientation (0001)Hem || (001)Ght, [11 2 ¯ 0]Hem || [100]Ght, which implies in a rotation of zero degrees towards the c-axis. This is the most common and abundant texture between these two minerals, and they represent the expected OR and misorientation angle necessary for a topotactic transition between the two phases conserving the oxygen lattice stacking, as expected. A second case less common but also present in the martitized grains samples is Type-β OR regarding a similar orientation of Type-α but now with a 30° rotation towards the c-axis and using first order prism direction as reference. Type-β OR is also an indicative of topotaxity, and it is an expected cluster resultant from the previous and more abundant Type-α.
Type-α clusters contribute from 12.36% to 31.84% to the total of plotted points, thus being the predominant crystallographic texture between these two phases. It was verified that there is topotaxity in the phase transformation between hematite and goethite. Although the density of points is not as vast as in the previous transformation process (magnetite–hematite), Type-α clusters are the most abundant in martitized grains. The twinning process in hematite concomitant with the phase transformation to goethite is implied in other two ORs here called Type-γ and Type-δ, which contribute with 6.39% to 15.28% of the total misorientation points plotted. These ORs with a rotation of approximately 90o are possibly linked with twinning in hematite, creating these ORs between newly topotactic formed goethite and trapezohedron twins in hematite. A further analysis with higher density of points is necessary and recommended for mapping all possible ORs between transformed goethite and other possible hematite twins.
The iron oxides and hydroxides that make up the matrix of both samples show by their pole figures an expected crystallographic orientation where the crystal’s c-axis is perpendicular to the primary rock banding, and the crystals were allowed to grow along their a and b-axis. This is an expected orientation for the microplaty matrix of a non-deformed iron formation, and it shows that crystals have grown and spontaneously transformed during diagenesis.

5. Conclusions

The data demonstrate that in martitization, the transformation of magnetite–hematite–goethite occurs in a topotactic manner, and the crystallographic memory can be checked in any of the directions of the transformation reaction. The orientation relationships Type-A in the magnetite–hematite transformation and Type-α in the hematite-goethite transformation are the main ORs in the analyzed martitized grains and represent the main crystallographic texture of the banded iron formations called jaspilites of the N4WS deposit. It evidences that there is a strong crystallographic control of the phase transformation and that the oxygen lattice framework is preserved through the whole transformation of the three target phases of the Fe-O system.
Other high-index orientation relationships, such as Type-B, Type-C and Type-S, once identified by [6,7,8] in experimental studies, are here evidenced. They are not an indication of topotacticity but a marker of a complex twinning process occurred during diagenesis and different conditions of reduction-temperature in between phase transformation. There is a visible difference between the misorientation characterization of grains and the microplate matrix, which shows a higher prevalence of high-index ORs such as Type-B, demonstrating a different dynamic of crystallographic memory than the posterior formed grains.
The study of crystallographic preferred orientation by three-dimensional misorientation analysis of geological samples, especially iron formations, is still in its beginning, but it represents an excellent tool for characterization and quantification of orientation relationships related to phase transformation, twinning and deformation.

Author Contributions

Conceptualization, V.M.e.N. and P.F.B.; methodology, V.M.e.N. and P.F.B.; validation, V.M.e.N., P.F.B. and L.E.L.; formal analysis, V.M.e.N., P.F.B. and S.M.; investigation, V.M.e.N., P.F.B., S.M., A.M.S., C.L.B.T. and L.E.L.; writing—original draft preparation, V.M.e.N.; writing—review and editing, V.M.e.N., P.F.B., S.M., A.M.S., C.L.B.T. and L.E.L.; supervision, P.F.B.; project administration, P.F.B., A.M.S. and C.L.B.T.; funding acquisition, A.M.S., C.L.B.T. and L.M.d.A. All authors have read and agreed to the published version of the manuscript.

Funding

This research was funded by financial supports of the Helmholtz Recruiting Initiative (grant No. I-044-16-01), Coordenação de Aperfeiçoamento de Pessoal de Nível Superior, Brasil (CAPES)—(Finance Code 001), of Conselho Nacional de Desenvolvimento Científico e Tecnológico (CNPq) and Fundação de Apoio à Pesquisa do Distrito Federal (FAP-DF)—Project Number: 00193.00000072/2019-19.

Acknowledgments

The authors thank the Potsdam Imaging and Spectral Analysis (PISA) Facility of the German Research Centre for Geosciences (GFZ) for the scanning electron microscope facilities and EBSD analysis, The Center of Microscopy of the Federal University of Minas Gerais (UFMG) for the sample preparation and the colloidal silica polishing and The Center of Electron Microscopy (CME) of the Federal University of Paraná for the help in using the software for EBSD processing. This study was financed in part by the Coordenação de Aperfeiçoamento de Pessoal de Nível Superior—Brasil (CAPES)—Finance Code 001.

Conflicts of Interest

The authors declare no conflict of interest. The funders had no role in the design of the study; in the collection, analyses or interpretation of data; in the writing of the manuscript or in the decision to publish the results.

References

  1. Barbosa, P.F.; Lagoeiro, L. Crystallographic texture of the magnetite-hematite transformation: Evidence for topotactic relationships in natural samples from Quadrilátero Ferrífero, Brazil. Am. Mineral. 2010, 95, 118–125. [Google Scholar] [CrossRef]
  2. Ávila, C.F.; Lagoeiro, L.; Barbosa, P.F.; Graça, L. EBSD analysis of rhombohedral twinning in hematite crystals of naturally deformed iron formations. J. Appl. Crystallogr. 2015, 48, 212–219. [Google Scholar] [CrossRef]
  3. Cornell, R.M.; Schwetmann, U. The Iron Oxides: Structure, Properties, Reactions, Occurrences and Uses, 2nd ed.; Wiley: New York, NY, USA, 2006. [Google Scholar]
  4. Krakow, R.; Bennett, R.J.; Johnstone, D.N.; Vukmanovic, Z.; Solano-Alvarez, W.; Lainé, S.J.; Einsle, J.F.; Midgley, P.A.; Rae, C.M.F.; Hielscher, R. On three dimensional misorientations spaces. Proc. R. Soc. A Math. Phys. Eng. Sci. 2017, 473, 20170274. [Google Scholar] [CrossRef] [PubMed] [Green Version]
  5. He, Y.; Godet, S.; Jonas, J.J. Representation of misorientations in Rodrigues–Frank space: Application to the Bain, Kurdjumov–Sachs, Nishiyama–Wassermann and Pitsch orientation relationships in the Gibeon meteorite. Acta Mater. 2005, 53, 1179–1190. [Google Scholar] [CrossRef]
  6. Heizmann, J.J.; Becker, P.; Baro, R. The influence of crystallite orientation on the chemical reactivity of hematite α-Fe2O3 and magnetite Fe3O4. J. Appl. Crystallogr. 1981, 14, 270–273. [Google Scholar] [CrossRef]
  7. Becker, P.; Heizmann, J.J.; Baro, R. Relations Topotatiques entre des Cristaux Naturels D’Hématite et la Magnétite qui en est Isse par Réduction à Basse Température. J. Appl. Crystallogr. 1977, 10, 77–78. [Google Scholar] [CrossRef]
  8. Withers, R.L.; Bursill, L.A. High-Order Structural Relationships between Hematite and Magnetite. J. Appl. Crystallogr. 1980, 93, 346–353. [Google Scholar] [CrossRef] [Green Version]
  9. Cudennec, Y.; Lecerf, A. Topotactic transformations of goethite and lepidocrocite into hematite and maghemite. Solid State Sci. 2005, 7, 520–529. [Google Scholar] [CrossRef]
  10. Hielscher, R.; Schaeben, H. A novel pole figure inversion method: Specification of the MTEX algorithm. J. Appl. Crystallogr. 2008, 41, 1024–1037. [Google Scholar] [CrossRef]
  11. Davis, B.L. Fabric and structural characteristics of the martitization process. Am. J. Sci. 1968, 266, 482–496. [Google Scholar] [CrossRef]
  12. Lagoeiro, L.E. Transformation of magnetite to hematite and its influence on the dissolution of iron oxide minerals. J. Metamorph. Geol. 1998, 16, 415–423. [Google Scholar] [CrossRef]
  13. Modaressi, A.; El Abdouni, H.; Heizmann, J.J. Three new orientations of the magnetite observed during the reduction of hematite between 700-800oC and explanation of the multiplicity of the different orientation. React. Solids 1989, 7, 19–27. [Google Scholar] [CrossRef]
  14. Bursill, L.A.; Withers, R.L. On the Multiple Orientation Relationships between Hematite and Magnetite. J. Appl. Crystallogr. 1979, 12, 287–294. [Google Scholar] [CrossRef]
  15. Bekker, A.; Slack, J.; Planavsky, N.; Krapež, B.; Hofmann, A.; Konhauser, K.O.; Rouxel, O.J. Iron formation: The sedimentary product of a complex interplay among mantle, tectonic, oceanic, and biospheric processes. Econ. Geol. 2010, 105, 467–508. [Google Scholar] [CrossRef]
  16. Bekker, A.; Planavsky, N.; Krapež, B.; Rasmussen, B.; Hofmann, A.; Slack, J.F.; Rouxel, O.J.; Konhauser, K.O. Iron formations: Their origins and implications for ancient seawater chemistry. In Treatise of Geochemistry, 2nd ed.; Holland, H.D., Turekian, K.K., Eds.; Elsevier: Amsterdam, The Netherlands, 2014; Volume 9, pp. 561–628. [Google Scholar] [CrossRef]
  17. Konhauser, K.O.; Planavsky, N.J.; Hardity, D.S.; Robbins, L.J.; Warchola, T.J.; Haugaard, R.; Lalonde, S.V.; Partin, C.A.; OonK, P.B.H.; Tsiko, H.; et al. Iron formations: A global record of Neoarchaean to Palaeoproterozoic environmental history. Earth-Sci. Rev. 2017, 172, 140–177. [Google Scholar] [CrossRef] [Green Version]
  18. Planavsky, N.; Bekker, A.; Rouxel, O.J.; Kamber, B.; Hofmann, A.; Knudsen, A.; Lyons, T.W. Rare Earth Element and yttrium compositions of Archean and Paleoproterozoic Fe formations revisited: New perspectives on the significance and mechanisms of deposition. Geochim. Cosmochim. Acta 2010, 74, 6387–6405. [Google Scholar] [CrossRef]
  19. Lyons, T.W.; Reinhard, C.T.; Planavsky, N.J. The rise of oxygen in Earth’s early ocean and atmosphere. Nature 2014, 506, 307–315. [Google Scholar] [CrossRef] [PubMed]
  20. Dalstra, L.W.; Guedes, S. Giant hydrothermal hematite deposits with Mg-Fe metasomatism: A comparison of the Carajás, Hamersley, and other iron ores. Econ. Geol. 2004, 99, 1793–1800. [Google Scholar] [CrossRef]
  21. Macambira, J.B.; Schrank, A. Químio-estratigrafia e evolução dos jaspilitos da Formação Carajás (PA). Rev. Bras. Geociências 2002, 32, 567–578. [Google Scholar] [CrossRef] [Green Version]
Figure 1. BSE map sections of selected domains for EBSD analysis in Sample A: (a) Grain I—euhedral magnetite grain and hematite along its borders. (b) Grain II—euhedral magnetite grain embedded into magnetite aggregate along the banding, also showing hematite on its boundaries.
Minerals 12 00326 g001
Figure 2. Phase map, inverse pole-figure and pole plots of martitized grains composed of magnetite and hematite from Sample A: (a) Grain I and (b) Grain II.
Minerals 12 00326 g002
Figure 3. BSE map sections of selected domains for EBSD analysis in Sample B: (a) Grain III (euhedral hematite grain and magnetite and goethite in its interior) and Grain V (elongated banding domain containing the three target mineral phases). (b) Grain IV (hematite grain containing magnetite and goethite on its interior) next to Grain VI (angular grain of hematite embedded into the banding domain also containing magnetite and goethite in its interior).
Minerals 12 00326 g003
Figure 4. Phase map, inverse pole-figure and pole plots of martitized grains containing the three iron oxides/hydroxides phases (magnetite, hematite and goethite) from Sample B: (a) Grain III and (b) Grain IV.
Minerals 12 00326 g004
Figure 5. Phase map, inverse pole-figure and pole plots of martitized grains of banding domain containing the three iron phases (magnetite, hematite and goethite) from Sample B: (a) Grain V and (b) Grain VI.
Minerals 12 00326 g005
Figure 6. Phase map, inverse pole-figure and pole plots of matrix domains of Sample A (a) and Sample B (b).
Minerals 12 00326 g006
Figure 7. Guide of expected clusters in the misorientation space (cubic-m3m to trigonal-3) for the magnetite-hematite analyses in fundamental zone (axis–angle). Data are simulated using the orientation relationships from Table 1 and their equivalent ORs in the directions [110] || [11 2 ¯ 0], [011] || [11 2 ¯ 0] and [01 1 ¯ ] || [10 1 ¯ 0].
Minerals 12 00326 g007
Figure 8. Misorientation distribution of magnetite–hematite boundaries from Sample A and B plotted in the fundamental zone of the axis–angle space. The arrows pointing to clusters are related to the direct phase transformation OR-AA’ and their equivalents. Sample A: (a) Grain I and (b) Grain II. Sample B: (c) Grain III, (d) Grain IV), (e) Grain V and (f) Grain VI. The clusters are colored and highlighted by their ORs according to Figure 7.
Minerals 12 00326 g008
Figure 9. (a) Guide of expected clusters in the misorientation space (trigonal-3 to orthorhombic-222) for the hematite–goethite phase transition analysis using the ORs from Table 2; and their equivalent directions and misorientation distribution of hematite–goethite boundaries from Sample B plotted in the fundamental zone of the axis–angle space, for (b) grain III, (c) grain IV, (d) grain V and (e) grain VI. Arrows pointing to clusters related to the direct phase transformation ORs.
Minerals 12 00326 g009
Figure 10. (a) Guide of expected clusters in the misorientation space (cubic-m3m to orthorhombic-222 and (b) misorientation distribution of magnetite–goethite boundaries from Grain III—Sample B plotted in the fundamental zone of the axis–angle space.
Minerals 12 00326 g010
Figure 11. Matrix misorientation distribution of magnetite–hematite boundaries from Sample A (a) and Sample B (b) plotted in the fundamental zone of the axis–angle space. Arrows are colored to the assigned cluster and ORs from Figure 7.
Minerals 12 00326 g011
Table 1. Magnetite–hematite orientation relationships [7,8]; n denotes a unit vector that runs parallel to the axis of rotation.
ORParallelismAxis–Angle
(A)(111)Mag || (0001)Hem, [110]Mag || [11 1 ¯ 0]Hemn, 54.74°
(B)(112)Mag || (0001)Hem, [110]Mag || [11 1 ¯ 0]Hemn, 35.26°
(C)(113)Mag || (0001)Hem, [110]Mag || [11 1 ¯ 0]Hemn, 25.24°
(D)(115)Mag || (0001)Hem, [110]Mag || [11 1 ¯ 0]Hemn, 15.69°
(S)(111)Mag || (10 1 ¯ 0)Hem, [11 1 ¯ ]Mag || [11 2 ¯ 0]Hemn, 45.00°
Table 2. Hematite-goethite orientation relationships; n denotes a unit vector that runs parallel to the axis of rotation.
ORParallelismAxis–Angle
(α)(0001)Hem || (001)Ght, [11 2 ¯ 0]Hem || [100]Ghtn, 0.00°
(β)(0001)Hem || (001)Ght, [0 1 ¯ 10]Hem || [100]Ghtn, 30.00°
Table 3. Clustering quantification of the magnetite–hematite grain boundaries misorientation analyses.
Grain/ORType-AType-BType-CType-DType-SSum
Grain I64.66%0.71%0.42%0.26%9.61%75.66%
Grain II38.31%1.94%0.77%3.25%11.04%55.32%
Grain III80.89%1.92%0.20%0.58%1.39%84.98%
Grain IV56.67%1.75%0.65%0.89%2.70%62.66%
Grain V52.85%2.36%0.64%1.09%2.88%59.82%
Grain VI44.85%4.02%0.62%0.68%2.37%52.53%
Mean56.37%2.11%0.55%1.13%5.00%65.16%
Matrix 13.08%4.15%1.14%1.79%1.67%11.83%
Matrix 23.61%7.30%0.93%2.46%2.77%17.07%
Mean3.34%5.72%1.03%2.13%2.22%14.45%
Table 4. Clustering quantification of the hematite–goethite grain boundaries misorientation analysis.
Grain/ORType-αType-βType-γSum
Grain III31.84%2.91%15.28%50.04%
Grain IV18.17%1.54%6.39%26.11%
Grain V12.36%2.08%9.32%23.76%
Grain VI12.49%2.06%10.01%24.56%
Mean18.71%2.15%10.25%31.11%
Publisher’s Note: MDPI stays neutral with regard to jurisdictional claims in published maps and institutional affiliations.

