Article

Physiological Aspects of Absorption, Translocation, and Accumulation of Heavy Metals in Silphium perfoliatum L. Plants Grown in a Mining-Contaminated Soil

1
Faculty of Horticulture and Forestry, Banat’s University of Agricultural Sciences and Veterinary Medicine “King Michael I of Romania” from Timisoara, 119 Calea Aradului, 300645 Timisoara, Romania
2
Faculty of Industrial Chemistry and Environmental Engineering, Politehnica University Timisoara, 6 Bv. Vasile Parvan, 300223 Timisoara, Romania
*
Author to whom correspondence should be addressed.
Minerals 2022, 12(3), 334; https://doi.org/10.3390/min12030334
Submission received: 5 February 2022 / Revised: 2 March 2022 / Accepted: 4 March 2022 / Published: 8 March 2022
(This article belongs to the Special Issue Potentially Toxic Elements in Soils and Mining Residues)

Abstract

:
Soil pollution by heavy metals as a result of mining activities is increasingly taking place. Once accumulated in soil, the heavy metals can then be dispersed, with serious effects on the environment and human health. It is therefore necessary to minimize, or even remove, all heavy metals from polluted areas, and one of the environmentally friendly and sustainable methods to do so is phytoremediation. A greenhouse pots experiment was conducted to evaluate the phytoremediation capacity of Silphium perfoliatum L. plants, in the vegetative growth stages, on a soil polluted with Cu, Zn, Cr and Pb, taken from a former mining area compared to an unpolluted soil (Us). The initial heavy metal content of polluted soil (Ps) was 208.3 mg kg−1 Cu; 312.5 mg kg−1 Zn; 186.5 mg kg−1 Cr and 195.2 mg kg−1 Pb. This shows that for Cu and Pb, soil concentrations exceed the intervention threshold, and for Zn and Cr, they are above the alert threshold. The removal efficiency, bioaccumulation factor, translocation factor, metal uptake and contamination factor index of Cu, Zn, Cr and Pb by S. perfoliatum L. were quantified to determine the bioremediation success. The data show that plants grown in Ps accumulated a significantly higher amount of Cu by 189% and Zn by 37.95% compared to Us. The Cr and Pb content of the plants recorded a progressive and significant increase from one developmental stage to another, being more intense between three and five leaves.

Graphical Abstract

1. Introduction

More than 10 million soil pollution sites have been identified worldwide, more than half of which are contaminated with heavy metals and/or metalloids [1]. In the EU, soil contamination most commonly occurs with heavy metals and mineral oils [2], with a strong negative impact on the environment, human and animal health, mainly due to bioaccumulation in the food chain and long-term persistence in the environment [3,4,5,6,7]. Even though, for many areas of the world, the mining industry is an important factor of economic development, providing important resources of raw materials and energy, it is also an important factor in soil, air and water pollution [8,9,10,11,12].
In Romania, the mining industry experienced intense development in the twentieth century, especially in its second half, providing over one million jobs in 14 exploitation areas throughout the country. In the first few years after 1990, around 138 million tons of pollutants were emitted into the environment annually, including significant amounts of particles and compounds of non-ferrous metals with very harmful effects on the ecosystems. The causes of these pollution were primarily due to mismanagement, as well as outdated technologies and operating facilities. Unfortunately, these accelerated developments have intensified and caused new industrial pollution phenomena, one of the most important being the pollution of the soil by heavy metals [13]. With the identification of new, sustainable, and less polluting energy sources, after 2000, the exploitation activity was drastically reduced, generating depopulation, abandoned mines, tailings dams, unmanaged tailings dumps and implicitly widespread pollution with heavy metals of the related ecosystems [14]. Pollution manifests itself not only in the strict location of industrial areas, but also in pastoral, agricultural, forestry and rural/urban areas located at smaller or greater distances from the places of exploitation and processing.
There are several studies that highlight the unfavorable effects of heavy metal pollution in Romania, through their accumulation in industrial sites and mining areas and their impact on different ecosystems. These studies have shown high accumulations of heavy metals in soils [15], soils and various vegetables [16,17,18], in soils and pasture flora [19], soils and vines [20], soils and rapeseed [21], and in vegetables and fruits [22]. Heavy metal pollution is also evident in the surface waters near the mining areas [23], in the main rivers, such as the Danube [24,25] and Olt [26], in the salt lakes [27], and the Danube Delta [28]. The presence of heavy metals in the air has also been demonstrated by studies carried out in polluted and urban areas, and also at the regional and national level [29,30,31,32].
Removing the excess heavy metals from different ecosystems is essential for protecting the environment and the health of the population. The various in situ removal technologies, such as surface capping [33], soil flushing [34], electrokinetic extraction [35], vitrification [36], etc., for soils, or chemical precipitation [37], ion exchange [38], reverse osmosis [39] or adsorption and extraction by means of solvents [40] for aquatic ecosystems entail high operating and maintenance costs, low efficacy, limited environmental protection and long periods of implementation [41]. In addition, some of these methods can cause damage to the native microflora of the environment and irreversible negative changes in the ecosystem. Moreover, chemical technologies can generate secondary pollution problems.
However, there are also environmentally friendly and economically efficient technologies that reduce the risk of dispersion of heavy metals and protect the original ecotypes, and one of these is phytoremediation.
Phytoremediation is classified as an environmentally friendly method because it reduces the risk of the dispersion of contaminants and protects the original ecotype by avoiding the excavation of contaminated sites [42,43,44]
Phytoremediation is a relatively simple technology that does not require sophisticated equipment or highly qualified personnel and has the advantage that it allows the simultaneous remediation of large areas with relatively low costs [45]. The main processes underlying phytoremediation technologies consist of extraction, rhizofiltration, stabilization, biodegradation, and volatilization of heavy metals by means of plants [46,47].
Phytoremediation is based on the ability of some plant species, aquatic and terrestrial, to take on and accumulate heavy metals from the environment. Although intensely studied in recent decades, the physiological mechanisms of absorption, translocation, metabolization, accumulation and/or removal of heavy metals by plants are still scantly elucidated. Most information has been obtained for some species of families; Asteraceae, Brassicaceae, Caryophyllaceae, Euphorbiaceae, Fabaceae, Lamiaceae, Poaceae, Salicaceae and Violaceae [48,49,50,51,52,53,54,55].
Therefore, the management of Ps with heavy metals is a cost-effective and environmentally friendly technology. There are a wide range of plant species capable of taking over and accumulating heavy metals in the different vegetative and generative organs [56,57,58]. However, detailed research is needed on the various physico-chemical and physiological processes that govern the processes of absorption, translocation, metabolization, and accumulation of heavy metals in plants.
Hence, this research was designed to perform the phytoremediation capacity of the heavy metals Ps collected from a former mining area of a promising species belonging to the Asteraceae family—Silphium perfoliatum. The objectives of this research concerned (a) evaluating the tolerance of silphium plants to combined soil pollution with Cu, Zn, Cr and Pb, compared to unpolluted soil that has only Cu and Zn, (b) examining the dynamics of absorption, translocation and accumulation in different plant organs were monitored, as well as (c) analyzing the effects on some metabolic and growth processes.

2. Materials and Methods

2.1. Biological Material—Silphium perfoliatum L. Plants

Silphium perfoliatum belongs to the Asteraceae family, a species native to the North American prairies [59], which is used for decorative purposes [60], is cultivated as a fodder plant [61], and is used for the production of biofuels [62,63,64,65], but also for the phyto-remediation of heavy metals in Ps [14,66,67,68,69]. The growth rate is intense due to the deep root system, the aerial part formed by stems up to 3 m high [70], with large leaves of 85–120 cm2, which are numerous and oppositely arranged on the stems [71].
S. perfoliatum is not harvested usually in the first year of cultivation, since the growth is vegetative, focused on the leaf rosette formation. Starting from the second year, S. perfoliatum produces stems, flowers, and seeds [72]. It can produce rich aerial biomass for 15 years [73], with one or two harvests per year, with relatively low technological requirements [61]. Therefore, S. perfoliatum is cultivated both due to its economic advantages and positive impact on the environment through protection and phytoremediation.

2.2. The Description of the Studied Sites

For a comparative evaluation of the physiological mechanisms of the absorption, translocation, and accumulation of heavy metals in different organs of S. perfoliatum plants and for the highlighting of some metabolic effects, we used Ps and Us for the experiments.

2.2.1. Polluted Soil from Sasca Montana

Sasca Montana (44°53′49″ N 21°41′42″ E) is a village in Caras-Severin County, located in the south-western part of Romania, recognized for its copper mine, first opened in the time of the Roman Empire. This mine represents one of the most important mining exploitations in this part of the country, with the activity of the extraction and primary processing of copper ore until 1998, when it entered into conservation, and then closure and greening. Although some greening work has been conducted, the agricultural and forest area in the mine area is still polluted with heavy metals (especially Cu, Zn, Cr and Pb).
Samples from the soil profile (0–30 cm deep) were first taken from agricultural land near the mine (Supplementary Material, Figure S1) to determine the spatial distribution mode and the quantities of existing heavy metals. Preliminary laboratory analyses revealed a higher concentration of heavy metals in the surface layer of the soil on land near mining tailings dumps. Subsequently, 100 kg of soil was taken from the surface layer from 10 different points from an area of 30,000 square meters of pasture in the immediate vicinity of the former exploitation. Analyses showed a heavy metal content of 208.3 mg kg−1 Cu; 312.5 mg kg−1 Zn; 186.5 mg kg−1 Cr and 195.2 mg kg−1 Pb, and the pH value was 7.7.

2.2.2. Unpolluted Soil from Timisoara

Timisoara (45°45′35″ N, 21°13′48″ E) is the capital city of Timis County and is the main economic, social and cultural center in western Romania. It is also located in the Western Plain, an area of agricultural importance, especially due to fertile soils (chernozems) and the favorable climate for plants cultivation.
The soil was taken from the superficial layer on the experimental field of Banat’s University of Agricultural Sciences and Veterinary Medicine “King Michael I of Romania” from Timisoara, being a cambic chernozem type (Supplementary Materials Figure S1). After harvesting, the soil was cleaned of plant debris and homogenized to conduct the primary analyses. These analyses revealed a pH of 7.4 and a heavy metal content of 62.8 mg kg−1 Cu, 296.1 mg kg−1 Zn, with the other two elements analyzed, Cr and Pb, being present as traces.
Comparative analyses of the absorption, translocation and metabolization of heavy metals on polluted and unpolluted soils facilitate a better understanding of the physiological mechanisms of S. perfoliatum tolerance to their stress.

2.3. Soil Analysis

Sample preparation. For analysis, the soil samples were air-dried, repeatedly shredded, sieved through a 2 mm mesh screen and separated manually in representative quantities of 3 g for initial analyses of the heavy metal content. This working technique and the storage of soil samples were been performed in accordance with ISO 11464/2006 [74].
Heavy metal concentration. The homogenized soil samples were dried at 75 °C for 48 h and then were ground to obtain a fine powder. The dried and sifted soil samples were treated with hydrochloric acid (HCl) and nitric acid (HNO3) solutions in a ratio of 3:1 (v/v), and the resulting solution was then cooled, filtered, and diluted with 25 mL of distilled water. The digested liquid was filtered (Whatman No. 0.5 filter paper), and the total heavy metal content of the filtrate was analyzed by the Atomic Absorption Techique and Standards (Aas).
The metal ion content was determined by means of the atomic absorption spectrometry (AAS) method (Varian SpectrAA 280FS, Agilent Technologies Inc., Santa Clara County, CA, USA) according to ISO 11047/1998 [75]. A detailed description of the procedure used to treat plant and soil samples, from drying and calcination (plant samples) to obtaining the final sample, was provided by Sumalan et al. [14].

2.4. Plant Samples Analysis

The determination and expression of plant developmental stages was achieved using the BBCH decimal coding system [76].
The analysis of the plants growth rate was achieved by determining the fresh biomass of the root system and of the above-ground leaves of plants (petioles + laminas) separately by weighing with a precision balance and determining the dry weight by drying in an oven (Universal Oven UmUF 75 m plus, Memmert GmbH + Co. KG, Schwabach, Germany) at 105 °C for two hours and then continuously at 80 °C until a constant dry weight was obtained. The quantities of heavy metals and free proline were reported as a dry weight (dw).
Chlorophyll and Proline Measurements. The determination of the total chlorophyll content (μg cm−2) was performed by means of the Arnon method [77]. The leaf samples were homogenized in 80% acetone and the absorbance were spectrophotometrically determined at 645 and 663 nm against the solvent (acetone) blank.
Total chlorophyll (TC) was calculated using the following Equation (1) [77]:
TC = 20.2(A645) + 8.02(A663)
The determination of proline was performed for the roots, petioles, and laminas according to the method of Bates et al. [78]. The homogenates of the obtained samples were prepared in 3% sulfosalicylic acid, and pink staining was obtained by reacting with glacial acetic acid and ninhydrin. The color intensity was determined spectrophotometrically at 546 nm.
Vegetation samples were dried in an oven at a temperature not exceeding 40 °C [73]. The dried plants were separated into roots, stems and leaves and then calcined. The calcination of the plant products aimed to remove their organic parts, for the purpose of their subsequent analysis.
The weighed plant material, placed in the melting pot, was heated to carbonization, 550–600 °C, for 5–6 h, after which the melting pot was allowed to cool in the desiccator, and then the melting pot was weighed again with the resulting ash after carbonization of the plant. The difference between the initial mass of the plant and the mass remaining after calcination was the loss at calcination.
Ash samples obtained after vegetation samples calcination were extracted with an acid mixture (aqua regia) made by combining concentrated hydrochloric acid and nitric acid in a volumetric ratio of 3:1. We weighed and added approximately 3 g of ash to the nearest 0.001 g into a 250 mL reaction flask. Then we moistened it with approximately 0.5–1 mL of water and added, while stirring, 21 mL of concentrated hydrochloric acid, followed by 7 mL of concentrated nitric acid, drop by drop, when necessary, to the absorption flask and the refrigerant in the reaction flask and left the mixture for 16 h at room temperature to permit the slow oxidation of the organic matter in the soil.
We slowly raised the temperature of the reaction mixture until the reflux conditions were reached and maintained this temperature for 2 h, ensuring that the condensation area was less than 1/3 of the height of the refrigerant, and then allowed the mixture to cool. We then added the contents of the absorption bottle to the reaction flask through the refrigerant, rinsing both the absorption bottle and the refrigerant with a further 10 mL of nitric acid. We then allowed the insoluble residue in the reaction flask to settle. After this, we carefully passed the relatively free supernatant of the sediments obtained by decanting through filter paper, collecting the filtrate in a 100 mL volumetric flask. We passed all of the initial extract from the reaction flask through the filter paper, and then washed the insoluble residue on the filter paper with a minimum volume of nitric acid. We collected this filtrate with the first.
The metal ion content in the filtrate was analyzed by atomic absorption spectrometry using the Varian Spectra AA-280 FS Spectrometer (Agilent Technologies, Santa Clara, CA, USA) [75].

2.5. Experimental Procedures

To ensure germination, the seeds of S. perfoliatum were treated with low temperatures (3–4 °C for 4 weeks) to interrupt their dormancy. They were then sterilized (NaOCl 10% 20 min) and washed repeatedly with distilled water. The seeds were presoaked for 24 h in distilled water to initiate germination and were placed in 8/8 cm plastic alveolar trays on Bio Plantella Start substrate, (Unichem DOO, Vrhnika, Slovenia). Until the appearance of the first leaf, the trays were kept in the Wise Cube WTH E305 model growing room (Witeg Labortechnik GmbH, Germany) at a constant temperature of 20 °C, a relative air humidity of 80 ± 10%, with a 12/12 light/dark cycle, and soil moisture was maintained at optimal values by means of daily control and watering with distilled water at pH 6.2–6.3.
After the appearance of the second leaf, the seedlings were transferred to the greenhouse under controlled conditions (temp. 25 ± 5/18 ± 5 °C day/night; 65 ± 5% rh and 10 to 16 h of light). After 10 days of acclimatization, 120 plants were transplanted into vessels of 2 L capacity, 60 of them in heavy metals Ps, coming from the mining area Sasca Montana, and another 60 in Us. Collection trays were placed under each vessel to avoid losses through leaching, with the collected solution being reintroduced into the vessels.
The vessels were arranged in a completely randomized design.
After 10 days of moving plants to the soil vessels, once with the formation of the third leaf (13BBCH), samples were taken and determinations were made on the plants regarding fresh mass, dry weight, proline and total chlorophyll content, as well as analyses of the content of heavy metals in the soil and plants (roots, petioles and laminas). Determinations and analyses of the abovementioned parameters were performed in dynamics and in the five leaf (15BBCH) and eight leaf (18BBCH) phenophases. The plants received careful care throughout the experimentation period, eliminating other stressors and maintaining a uniform temperature, humidity and lighting conditions for all variants and replicates.
The assessment of the decontamination potential of Ps with heavy metals by S. perfoliatum plants was achieved by calculating some phytoremediation indices, such as the removal efficiency (RE), bioaccumulation factor (BAF), translocation factor (TF), metal uptake (MU) and contamination factor index (Cfi).
RE represents the ability of plants to take a certain amount of metal ions from the soil within a certain time interval.
  • RE (%) = 100 × (initial heavy metal concentration in soil − final heavy metal concentration in soil/initial concentration of heavy metal in soil) (%) [57].
BAF is the ratio of the content of heavy metals in plants and soils. It is an indicator of the ability of a plant to accumulate heavy metals.
2.
BAF = heavy metal concentration in the plant/heavy metal concentration in the soil [79].
TF is the ratio of the concentration of metal in the above-ground part of the plant to that in the roots, or the ability of the plant to move the metal from the roots to the stems and leaves.
3.
TF = heavy metal concentration in the leaves/heavy metal concentration in the roots [56].
MU can determine the plant’s ability to accumulate heavy metals relative to their dry biomass.
4.
MU = metal concentration in a shoot or root × dry weight of the shoot or root (mg kg−1 dw) [80].
For the determination of soil pollution with metals, the contamination factor index (Cfi) proposed by Hakanson [81] was used (2).
Cfi = C0–1i/Cni
where C0–1i is the concentration of metal in the sample; and Cni is the background level of different metals in the Earth’s upper crust suggested by Kabata-Pedias [82].
The background values of metals (Cni) in natural soils were considered as the following: 20 mg kg−1 for Cu; 40 mg kg−1 for Zn; 10 mg kg−1 for Cr and 30 mg kg−1 for Pb [81]. According to Hakanson [81], four classes of contamination were recognized: low contamination (if Cfi < 1); moderate contamination (if 1 ≤ Cfi < 3); considerable contamination (if 3 ≤ Cfi < 6); and very high contamination (if Cfi ≥ 6).
The experiments and physiological determinations were performed in the Plant Physiology Department, University of Agricultural Sciences and Veterinary Medicine of Banat “King Michael I of Romania” from Timisoara, and the analysis of heavy metals was performed in the Environmental Analysis Laboratory, Research Institute of Renewable Energies, Polytehnica University Timisoara, in the spring–summer of 2020.

2.6. Statistical Procedures

Data representing mean ± standard error (SE) were calculated based on three replicate samples. The data for all analyses and determination were statistically processed using ANOVA, and the means were compared using the least significant difference (LSD) test [83]. The significance of differences was marked with letters, being considered as significant (p < 0.05), and differences between means are marked with different letters.
The relationships between metal concentrations in plants and biomass, proline and chlorophyll content were analyzed using Pearson’s correlation coefficient. The significance of correlation coefficients was analyzed by means of the two-tailed test.

3. Results

3.1. The Heavy Metals Concentration in Soils and Plants

Initial analyses showed that in the case of Us, the concentrations of Cu and Zn were below the alert threshold, against the background of a higher Zn concentration (Table 1). In Ps samples, taken from the Sasca Montana mining area, the concentrations of Cu, Zn and Cr are above the alert threshold, while the Pb concentration even exceeds the intervention threshold. According to the values of the Cfi, much higher contamination with Cr, Cu, Zn and Pb was observed in Ps, and considerable contamination with Cu was observed in Us.
The analysis of the variance components (Table 2) shows that the three main sources of variation showed a significant influence on the variability of the Cu and Zn concentrations in the S. perfoliatum plants. The highest contribution to the variability of the Cu concentration was presented by the type of soil, followed by the organ and plant development stage. Significant differences were also observed for the different interactions between the three factors, with a higher contribution in the case of the interaction between the soil type and the plant organs. Regarding the Zn concentration, it was determined that the biggest differences were recorded between analyzed organs, compared to the soil type and the development stage. Additionally, the interactions between the factors had significant contributions to the total variability, with a higher value for the interactions between the soil type and the plant organs.
Analyzing the concentration of Cu in different stages of plant development, it increased significantly by 16.52% from three to five leaves (13 to 15BBCH) and by 49.59% from five to eight leaves (15 to BBCH), respectively (Table 2). Plants grown in Ps accumulated a significantly higher amount of Cu, by 189%, compared with plants in the Us, which showed small and insignificant variations of 3.16–4.28 mg/kg in the Cu concentration from one development stage to another. As such, only in the eight leaf stage was the amount of Cu in the plant significantly higher, by 7.44 mg kg−1, compared to the three leaf stage. In the case of plants grown in Ps, a small and insignificant variation in the concentration of Cu was observed between the first two stages, but at the last stage, the concentration of Cu was significantly higher by 12.06–15.51 mg kg−1. Regardless of the development stages, plants grown in Ps accumulated significantly higher Cu amounts, with differences from 20.88 mg kg−1 in the three leaf stage to 37.02 mg kg−1 in the eight leaf stage.
Generally, the Zn amount accumulated by plants grown in Ps was significantly higher by 27.95%. The plants’ Zn concentration increased significantly by 26.75% from three to five leaves, and then, until eight leaves, the variation was reduced and insignificant. In all three development stages, plants grown in Us accumulated a significantly higher Zn amount than those grown in Ps, with differences ranging from 17.29% for the five leaf stage to 41.76% for the three leaf stage. In the conditions of the Us, there was increase in the plants’ Zn concentration increase one stage to another, meaning that only in the last stage was the amount of Zn significantly higher, by 31.67%, compared to that from the first determination. The plants grown in Ps recorded a significantly higher accumulation of Zn by 41.02%–44.92% in the 15th and 18th BBCH stages compared to 13 BBCH.
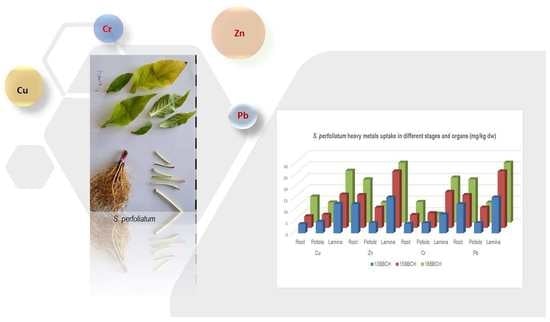
At the whole experience level, the S. perfoliatum plants accumulated various Cu amounts in different organs, so that in the lamina, the concentration was significantly higher than in the roots and petioles (Table 3). Plants grown in Us were recorded as having a higher concentration by 9.3–12.73 mg kg−1 in the lamina compared to the roots and petioles, which were statistically undifferentiated. The same trend was observed in Ps conditions where the Cu concentration varied from 26.12 mg kg−1 in the roots to 65.29 mg kg−1 in the lamina. Cu accumulation in various plant organs was significantly higher when grown in Ps, ranging from 14.1 mg kg−1 in roots to 43.97 mg kg−1 for leaf lamina.
The plants showed a significantly higher concentration of Zn in the lamina by 90%-109% compared to the petioles and roots. In the Us, there was a significant variation in the Zn amount determined in different analyzed plant parts, with values between 37.91 mg kg−1 in the roots and 119.25 mg kg−1 in the lamina. In pollution conditions, it was observed that the Zn amount accumulated in the roots was significantly higher by 27.06 mg kg−1 compared to the petioles, against the background of a significantly higher concentration of 86.76 mg kg−1 in the lamina. Plants grown in Ps accumulated in the roots a significantly higher amount of Zn by 60.24% compared to plants grown in Us, while the concentration in petioles and lamina was significantly lower by 27%–55%.
Concerning the Cu concentration in various plant organs during the three developmental stages, it was found that the plants accumulated in the lamina a significantly higher amount, with variations from 19.56 mg kg−1 for 15 BBCH to 33.31 mg kg−1 for 18 BBCH (Table 4). Additionally, the concentrations in the roots and petioles were similar and undifferentiated statistically. The degree of plant development had a similar effect on the Cu accumulation in different organs, observing a significant variation only between the values related to the 15 and 18 BBCH stages.
Analyzing the Zn amount in the plant organs, it was found that in all stages, lamina manifested a significantly superior accumulation capacity compared to the roots and petioles, which recorded similar concentrations of this metal. The plant’s stage of development manifested a small and insignificant influence on the Zn accumulation in the roots and petioles. The lamina showed a significant increase in Zn concentration from one stage to another, with variations from 76.64 mg kg−1 in 13 BBCH to 125.95 mg kg−1 in 18 BBCH.
By analyzing the cumulative effects of the three sources of variation (Table 5), it was observed that the development stage of the plants grown in Us did not significantly influence the Cu concentration in the roots and petioles, while in the lamina, the Cu accumulation in the last analyzed stage was significantly higher than in the previous stages. In the first phase, a reduced and insignificant variation of the Cu concentration of plant organs was observed, with values between 9.52 mg kg−1 for roots and 14.55 mg kg−1 for lamina. In the final phases (15 and 18 BBCH), a significantly higher amount of Cu was determined in the lamina.
For plants grown in Ps, it was found that their development was associated with a significant increase in Cu amount, so that in 18BBCH, there were significantly higher values in all plant organs. Regardless of the phenophase, the concentration of this element in the lamina was significantly higher than in the roots and petioles, which showed similar values.
The roots and petioles’ Zn concentration dynamics in plants grown in Us show an insignificant variation during the three phenophases, associated with amplitudes of 7.82–11.39 mg kg−1. The lamina Zn accumulation was influenced by the plant’s development stage, registering a progressive increase from one phase to another. In the first phase, the roots showed a significantly lower Zn content than the other organs, while in the 15 and 18 BBCH phenophases, the lamina accumulated a significantly higher amount than the other organs. Additionally, the petioles had a significantly higher concentration than the roots.
The Zn accumulation in the roots and petioles of plants grown in Ps was not influenced by the development stage but had amplitudes from 9.23 mg kg−1 for the roots to 18.63 mg kg−1 for the petioles. In the lamina, during plant development from 13 to 15 BBCH, a significant increase in Zn concentration to 33.68 mg kg−1 was observed, associated with a low variation between the last two phenophases. In the 13 BBCH stage, the petioles had a significantly higher Zn content than the other two organs. In the 15 and 18 BBCH stages was found a more obvious differentiation between plant organs, manifested by higher Zn concentrations (96.94–100.08 mg kg−1) in the lamina and significantly lower values (38.96–40.37 mg kg−1) in the petioles.
With regard to the whole experiment, the dynamics of Zn accumulation in the S. perfoliatum organs were on average 153% higher than the concentration of Cu.
Analysis of the data in Table S2 (Supplementary Material) indicates that there are significant variations in the Pb and Cr content in plants both between stages and between organs. Phenophase showed a lower contribution to the variability of Pb and Cr content compared to plant organs. A significant contribution was also for the interaction between phenophases and analyzed organs with regard to the quantity of these elements.
The Cr content of plant roots grown in Ps demonstrated positive but insignificant variations, between 18.03 and 24.19 mg kg−1 for the first two phenophases (Table 6). Thus, only in the last stage was the Cr concentration significantly higher, by 13.08 mg kg−1, than in the first one. The petioles’ Cr content demonstrated an insignificant variation during the plant development, associated with an amplitude between 21.55 and 30.21 mg kg−1. The developmental stage of the plants showed a significant influence on the Cr accumulation in the lamina, based on the background of significant differences from one stage to another, between 13.31 mg kg−1 in the last two and 28.45 mg kg−1 in the first two, respectively. Throughout the whole experiment, the lamina’s Cr accumulation was significantly higher than that of the roots or petioles, respectively.
Therefore, the plant development stage determined a gradual increase in the accumulated Cr amount in different organs, associated with a variation of 57.93% between the first two phenophases and 18.39% between the last two. Analyzing all stages, it was found that the Cr content of the lamina was significantly higher than that of the other two organs.
The Pb content analysis shows that the roots’ accumulation of this element was not significantly influenced by the developmental stage, based on the background of small variations of 4.16–4.98 mg kg−1 between phenophases. In the first stage, the amount of Pb in petioles was significantly lower by 12.7–21.72 mg kg−1 than in the other two stages, which were statistically undifferentiated. In the leaf lamina, there is a higher Pb accumulation in the 15 and 18BBCH stages, associated with deviations of 38.53–46.25 mg kg−1 compared to 13 BBCH. Lead analyses in the last two stages show that there is a significantly higher concentration at the level of the lamina, associated with similar values in other plant organs. In the first stage, based on the background of smaller variations between organs, it was observed that the lamina showed a significantly higher Pb concentration by 17.77 mg kg−1 compared to the petioles.
The Pb content showed a progressive and significant increase from one stage to another, being more intense (70%) between the first two, compared to 18.64% in the last two. The roots and the petioles showed similar accumulations of Pb, while in the lamina, the capacity for storing this element was considerably higher.
Against the background of significant effects of different sources of variation, the results (Table S3) indicate that heavy metal soil pollution had a greater influence on the accumulation of Zn in S. perfoliatum, while the concentration of Cu showed higher variations between the organs.

3.2. The Heavy Metals BAF in Different Organs of S. perfoliatum

According to the BAF values (Table 7), it was found that the lamina demonstrated a significantly higher accumulation of Cu, compared to the other organs, associated with variations of 5.376–5.845 in Us and 2.622–2.722 in Ps. Plants grown in Us showed a significantly higher BAF for Cu, with increases ranging from 35.70% for petioles to 83.23% for lamina.
In the case of Zn, it was found that the BAF of this element in the root was not influenced by soil pollution. In contrast, plants grown in the Us showed a significantly higher Zn accumulation at the level of the petioles and lamina, compared with plants grown in the Ps. The lamina recorded a higher Zn accumulation, associated with variations of 1.695–2.235 in Us and 0.432–0.754 in Ps. The BAF of Zn in S. perfoliatum was significantly lower than of Cu.
The S. perfoliatum plants showed a higher BAF of Pb compared to that of Cr, and the superiority of the BAF of Pb in the lamina was evident. The Cr had a significantly higher BAF in the lamina, while the roots and petioles showed similar values (Figure 1).

3.3. The Heavy Metal TF in Different Development Stages of S. perfoliatum

Given the information from the variance analysis (Table S4), it was observed that soil pollution had a significant influence on the TF of Cu and Zn from the roots to the aerial organs of plants of S. perfoliatum, with greater variations in Zn. The TF of the two elements was not significantly influenced by phenophase. The interaction between soil pollution and phenophase had a greater influence on Cu TF.
According to the TF for Cu (Table 8), it was observed that in the case of plants grown in Us, the migration of this element did not show significant variations in the first two stages, but in the last stage, TF recorded significantly higher values. For plants grown in Ps, the TF of Cu from the roots to the aerial parts was reduced as the plant developed, thus displaying in the 13 BBCH stage a significantly higher value than in 18 BBCH. It was also found that in plants grown in Ps, the TF of Cu in the first two stages was significantly higher than in plants grown in Us.
The Zn translocation from the roots to the aerial parts showed small and insignificant variations from one stage to another, regardless of the level of soil pollution, through amplitudes of 0.498 in Us and 0.709 in Ps. The translocation factor for Zn in Us was significantly higher compared to Ps ones. Thus, in the Us during the 13 BBCH stage in the roots, only 17.11% of the amount of Zn/plant was present, while in the Ps, the amount of untranslocated Zn from the roots was 39.37%. At the end of the study, the roots of plants grown in Us had an untranslocated Zn concentration of 15.95%, compared to 31.77% in plant roots grown in Ps.
The TF for Cr was not significantly influenced by the plant’s stage, against the background of an amplitude between 3.094 for 13BBCH and 3.783 for 15BBCH (Figure 2). Thus, a slight increase for the TF of Cr in the 15 BBCH stage associated with a roots’ accumulation of 20.91% of the total Cr amount in the plants was observed. For Pb, there was a significant increase in TF values in 15 and 18 BBCH, compared to 13 BBCH, by reducing the amount of this element in the roots from 31.10% to 21.45%–21.58% of the total amount in the plant. In the first stage, a higher TF of Cr was observed, while in the next two stages, the TF of the two elements showed similar values.

3.4. Heavy Metals RE in Different Development Stages of S. perfoliatum

The analysis of the variance components (Table S5) indicates that there are significant variations in the RE of Cu and Zn both between stages and depending on the level of soil pollution. The phenophase shows less contribution to the RE of Zn compared to soil pollution. Additionally, a significant contribution was found for the interaction between the plant development stage and the soil type to the RE of the two elements.
Plants grown in Us recorded an RE of Cu between 56.81% for the first and 94.34% for the last phenophase, respectively, against the background of significant variations between phenophases (Table 9). The plants grown in Ps were also recorded as displaying a significant increase in RE of Cu as the plant developed from 13 to 18 BBCH. As regards the phenophase, the RE was significantly superior in plants grown in the Us.
Compared to the initial Zn soil content, a significant reduction in the amount of this element from one stage to another was determined, associated with an RE ranging from 67.54% to 83.45% in Us, and from 49.02% to 74.05% in Ps, respectively. Plants grown in Us showed a significant higher RE of Zn than those grown in Ps, associated with increases ranging from 9.4% for 18 BBCH and 18.52% for 13 BBCH. The RE of Zn was considerably lower than that of Cu in the last stage.
The decrease in soil Cr concentration displayed values between 47.58% at 13 BBCH and 86.36% at 18 BBCH, with a significant increase in the absorption of this metal during the plant’s development (Figure 3). Relative to the initial amount of Pb in the soil, there is a significant decrease in this element from one stage to another, associated with an RE with values from 44.51% to 90.67%.

3.5. Heavy Metals Content in Different Plant Organs and Developmental Stages

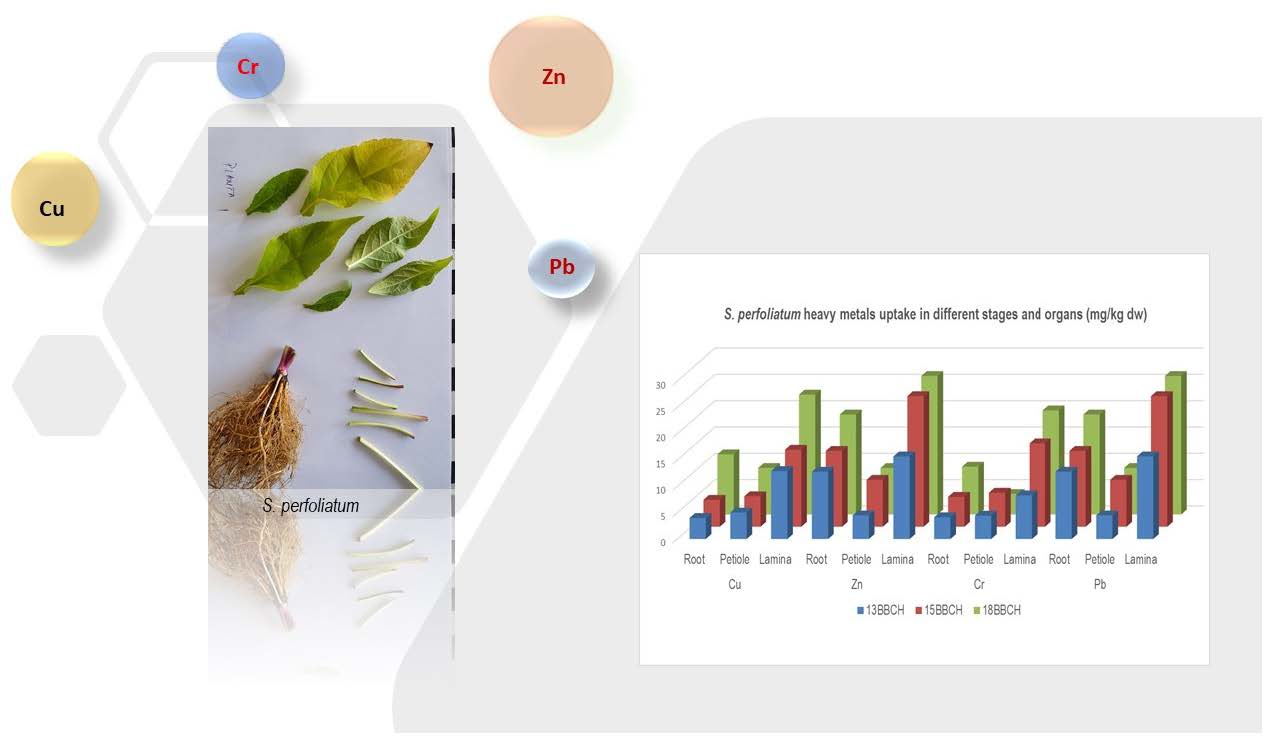
In the case of plants grown in Us, in the first stage, the lamina showed a significantly higher Cu content compared to the other two organs (Figure 4). Additionally, the roots had a significantly higher concentration than the petioles. In the 15 BBCH stage, a significantly higher content of Cu in the lamina was observed, associated with a significantly lower value in the petioles. In the last stage, against the background of a high content at the level of the lamina, a more intense Cu accumulation occurs in the petioles compared to the roots. Regarding the Cu content of the lamina, a significant increase in this element from 4.28 to 7.58 mg kg−1 was observed from 15 to 18 BBCH. For the other organs, the variations between different stages were smaller.
In plants grown in the soil with heavy metals, at the first determination, a significantly higher accumulation of Cu was found in the lamina, and a lower accumulation was observed in the roots (Figure 4). In the 15 BBCH stage, the accumulation of Cu at the root level was intensified, so that it reached values similar to those of the petioles, against the background of a significantly higher amount in the lamina. The intensification of copper accumulation in the root continued in the last stage, reaching a higher value than in the petioles, but both are significantly lower than the amount in the lamina. Plants grown in Ps accumulated significantly higher Cu amounts compared to those in Us.
In the plants that were grown in Us, at the first determination, the lamina Zn amount was significantly higher by over 7.03 mg kg−1 compared to the values of the root and petioles (Figure 5). In the 15 BBCH stage, significant variations, between 7.45 mg kg−1 in the roots and 27.24 mg kg−1 in the lamina, were observed. In the last stage, it was determined that the lamina Zn content was significantly higher by over 21.14 mg kg−1 than in the petioles and by 27.24 mg kg−1 than in the roots.
Plants grown in Ps accumulated, in the first stage, a significantly higher amount of Zn in the lamina compared to the roots and petioles. In the 15 BBCH stage, the same trend and variation level between the analyzed organs was maintained, but in the last stage, the Zn accumulation in the roots and lamina was intensified, with a variation between 8.84 mg kg−1 in the petioles and 26.32 mg kg−1 in the lamina. Thus, there was an increase in the Zn accumulation in the roots in parallel with its decrease in the petioles, compared to the plants grown in Us.
The analysis of Cr concentration (Figure 6) of the three organs shows a significant variation from one stage to another, with an amplitude between 10.32 mg kg−1 for the petioles and 13.78 mg kg−1 for the lamina. In the first and second stage, the lamina had a significantly higher Cr concentration compared to the other two organs, but for the last phenophase, the high Cr content of the lamina was also associated with a high concentration in the roots, significantly higher than in the petioles.
The Pb concentration in the lamina was significantly higher in the first phenophase, by 3.22–5.13 mg kg−1, than in the other two organs, which showed significantly different values and higher concentration in the roots, respectively. In the second stage, there was an obvious differentiation of the Pb concentration in the lamina compared to the roots and petioles, as in the last stage (Figure 7).

3.6. The Effects of Heavy Metals on Free Proline, Total Chlorophyll and Plant Biomass

Thus, it was noted that the three main sources of variation demonstrated a very significant influence on the variability of the free proline amount in the S. perfoliatum plants (Table S6). The highest contribution to this trait’s variability was manifested by the plant organs, followed by the type of soil and phenophase. Significant differences were also observed for different interactions between the three factors, with a higher contribution in the case of the interaction between soil type and phenophases.
The variation in the free proline amount in different stages resulted in a significant increase of 0.2 mg g−1 from 13 to 15 BBCH, set against the background of an insignificant difference from 15 to 18 BBCH (Table 10). Plants grown in Ps conditions synthesized a significantly higher amount of free proline, by 30.6%, compared to those grown in Us. The plant development stage showed an insignificant influence on the free proline content of plants grown in Us, but in the case of plants grown in Ps, there were significant variations in the proline content from one phenophase to another, with values from 1.41 mg g−1 in 13 BBCH to 1.98 mg g−1 for 18 BBCH. In the last two phenophases, plants grown in Ps synthesized significantly higher amounts of free proline, by 38.80%–51.14%.
During the whole experience, the S. perfoliatum plants synthesized different free proline amounts in different organs, so that in the lamina, the concentration was significantly higher than in the roots and petioles (Table 11). The plants grown in Us recorded displayed the lamina a higher concentration by 34.81%–111.62% compared to the roots and petioles, statistically differentiated in favor of the petioles. The same trend was observed in Ps, where the free proline content ranged from 1.39 mg g−1 in the roots to 2.14 mg g−1 in the lamina. The biosynthesis and accumulation of proline in various plant organs were significantly higher under pollution conditions, with variations ranging from 0.37 mg g−1 in the petioles to 0.53 mg g−1 in the roots.
The analysis of the cumulative effect of the three sources of variation (Table 12) showed that the developmental stage of the plants grown in the Us did not significantly influence the amount of free proline in the plant organs.
In the case of plants grown in Ps, it was found that the development from 13 BBCH to 15 BBCH was associated with an increase in the free proline amount, from 0.20 mg g−1 in the roots to 0.66 mg g−1 in the petioles. Regardless of phenophase, the proline amount in the lamina was significantly higher than in the roots and petioles, statistically differentiated for petioles.
The root biomass analysis in plants grown in Us shows a significant increase of 54.04% in the first two phenophases, while from 15 to 18 BBCH the increase is only 14.68% (Figure 8). The biomass of the petioles showed a variation from 9.02 g in 13 BBCH to 20.43 g in 18 BBCH, which means increases of 47.08%–53.99% from one phenophase to another. The lamina also demonstrated a significant increase of 43.08% between 13 and 15 BBCH and 25.90% from 15 to 18 BBCH, respectively.
The biomass dynamics for roots were significantly higher than in the other two organs, but the lamina had a significantly superior value to the petioles. In the last stage, the roots’ biomass achieved increases of 31.66% compared to the lamina and 106.41% compared to the petioles.
In the case of plants grown in Ps, the roots’ biomass recorded positive variation between 23.06 and 32.67 g from one stage to another (Figure 8). Thus, in the last phenophase, the roots’ biomass was significantly higher by 41.67% than in the first phenophase. Petiole biomass showed a gradual increase of 32.86%–54.15% from one stage to another, associated with a difference of 8.71 g between 13 and 15 BBCH. The biomass of the lamina recorded values between 17.23 and 22.14 g, against the background of a higher variation between the last phenophases. In 13 BBCH, the root biomass was significantly higher by 5.83–14.75 g compared to the other two organs. For 15BBCH, high root values of 51.31%–12.56% were determined, while in the last phenophase, compared to the biomass of the lamina and petioles, increases of 47.56%–91.95% were recorded.
Plants grown in Ps do not express, at the first determination, major differences between the biomass of different organs compared to those in Us. In the second determination, however, the biomass of plants grown in the Us was higher by 35.52% compared to those grown in Ps, especially due to higher values of the roots and lamina. In the last determination, the plants grown in Us accumulated a superior fresh biomass, with an increase of 31.76%, associated with increases in the roots and the lamina (29.07%–44.67%).
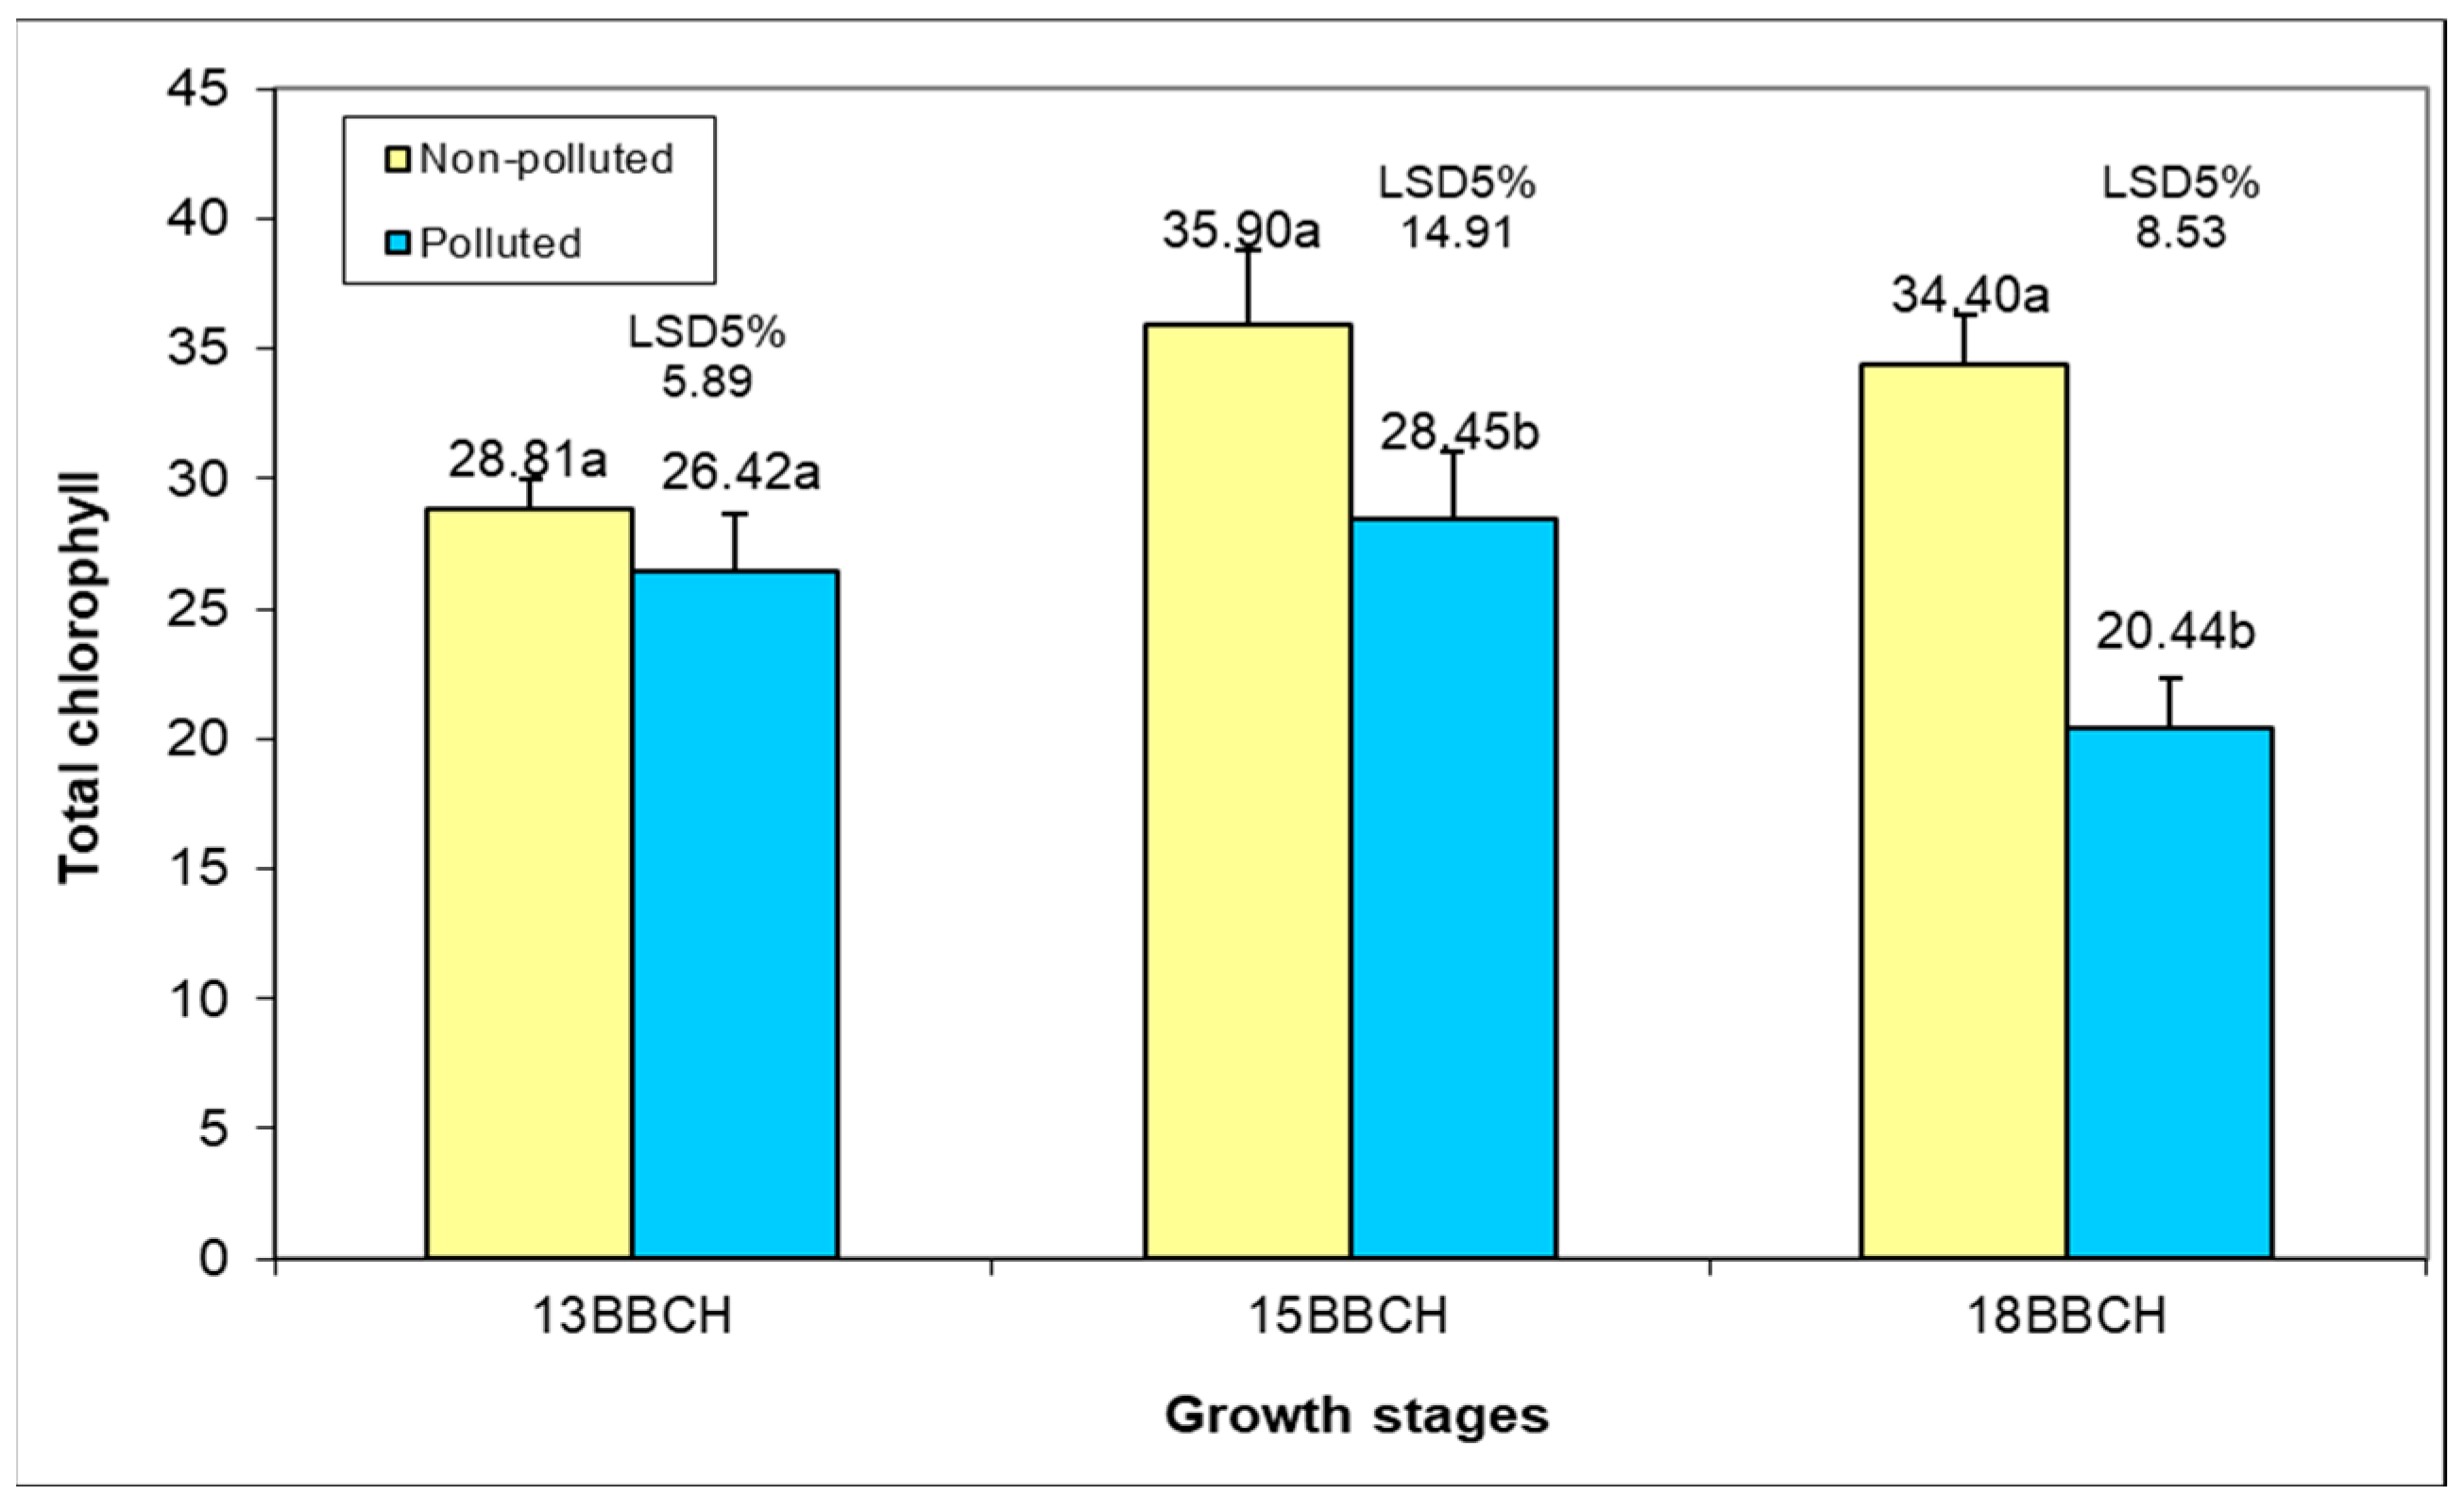
Soil pollution had a small and insignificant influence on the biosynthesis of total chlorophyll in the foliar apparatus in the 13 BBCH stage, with variation from 26.42 to 28.81 μg cm−2 (Figure 9). At the five leaf stage, the pollution effect was significant, with a reduction in the total chlorophyll by 20.75% in plants grown in Ps. The negative influence of Ps on the total chlorophyll was intensified in plants at the eight leaf stage, when there was a decrease in the chlorophyll content by 60.59%. In both soil conditions, an increase in the chlorophyll content was observed from 13 to 15 BBCH, which was more intense (24.61%) in the case of plants grown in Us compared to those grown in Ps (7.68%). Plant development from five to eight leaves has been associated with a reduction in chlorophyll content, ranging from 4.18% in Us to 28.16% in Ps conditions. These results are according to other studies that demonstrated that elevated levels of pollution with various heavy metals caused a reduction in the amount of chlorophyll pigments [84,85] associated with the inhibition of photosynthesis [86,87].
The existence of significant correlations between the plant biomass and the heavy metal content of the soil is evident (Table 13). The increase in the Cu and Zn concentration in Ps led to an increase in the free proline content of plant organs, while in Us, a negative correlation was observed between the free proline and these two elements. Additionally, the content of Cr and Pb showed a strong correlation with the free proline, indicating that under the Ps conditions, the plants synthesized a superior amount of free proline. The chlorophyll content showed low and insignificant correlations with all metals, against the background of positive relations with the Cu and Zn concentration in Us.
At the end of the research, there was a major significant reduction in the soil concentration of different heavy metals compared to the initial values, so that in all cases the soil metal concentration was within the normal allowable limits. According to the Cfi, a low contamination level of Cu and Pb was observed, while a moderate level of contamination was observed for the rest of the elements (Table 14).

4. Discussion

4.1. The Heavy Metals Concentration in Soils and Plants

The initial heavy metal content in Ps (Table 1) was: Cu—208.3 mg kg−1; Zn—312.5 mg kg−1; Cr—186.5 mg kg−1 and Pb—95.2 mg kg−1, while Us contained only Cu and Zn at normal values. In Ps, the concentrations of Cu and Pb exceed the intervention threshold, and for Zn and Cr, they are above the alert threshold according to the Romanian national regulations [88].
It appears that plants grown in heavy metal Ps tend to take on greater or lesser amounts of these metals depending on their concentration and availability. However, there is a certain predisposition of some plant families/species to preferentially absorb and accumulate certain heavy metals from the environment. The obtained results confirm the above, and the conclusions of previous studies in different plant species, including Tarraxacum sp. [89], Salix and Tarraxacum [90], Ocimum basilicum [91], and ornamental woody species [92]. S. perfoliatum plants tend to take on significant amounts of Cu, Zn, Pb and Cr, correlated with the level existing in soils, but also show a high affinity for Zn and Pb, and lower for Cu and Cr (Table 2, Table 3, Table 4 and Table 5). The study by Mayerová et al. [93] on several herbaceous plant species (including S. perfoliatum) grown in situ in heavy metals Ps showed a high variability in the absorption capacity of pollutants from one year to the other, under the influence of climatic conditions, so that the availability and absorption was higher for Zn compared to Cu. However, there are studies that demonstrate the reduced absorption and accumulation capacity of Zn in certain plant families, such as Asteracea (S. perfoliatum), Juncaceae, Callitrichaceae, and Hydrocaritaceae [94].
The data analysis on the absorption and accumulation dynamics of elements during the specific plant development stages of vegetative growth in S. perfoliatum shows quite large variations, depending on the soil (Ps/Us) and metal (Cu, Zn, Cr, Pb). In general, absorption and accumulation for Cu and Zn was higher in Ps, the rate being different from one development stage to another, at different moments of the determinations. For Cr and Pb, the rate of metal absorption was more intense in the first determination. The absorption from Ps of significantly larger quantities of Cu and Zn is due to the physiological importance of the two elements. Namely, Cu is an enzymatic cofactor in photosynthesis and respiration, and Zn is an essential trace element in development processes, a component of important classes of enzymes such as cytochrome oxidase, polyphenol oxidase, ascorbic acid oxidase [95]; both elements therefore play a key role in the plant’s growth and development [94]. Relative to the entire experiment, the dynamics of Zn accumulation were 153% above those of Cu, according to most research [96,97,98,99,100,101].

4.2. Bioaccumulation Factor, Translocation Factor and Removal Efficiency

Plant species with a high capacity for heavy metal accumulation and a fast rate of their translocation from the roots to the aerial organs are the main candidates in the phytoremediation of contaminated soils [102]. The root system is the main gateway for the penetration of trace elements into plants, the intensity of the process being directly dependent on the concentration and availability of elements in soils [103]. The bioaccumulation factor (BAF) is a valuable indicator of the plant’s ability to accumulate a certain type of metal from the environment [104], being directly correlated with the high capacity of plant species to produce biomass, being factors in the success of the phytoextraction process [105].
In general, BAF values are usually <1 for metal exclusion species, while BAF values are often >1 for metal accumulator species [106].
Our results attest to the high levels of BAF for all organs and heavy metals analyzed, with higher values for Cu and Zn in plants grown in Us and lower values for those grown in Ps. The bioaccumulation factor was higher in Cu compared to Zn and for Pb compared to Cr, and the main accumulation organ was the lamina (Table 7 and Figure 1).
There are a limited number of studies in the literature on the tolerance of the species S. perfoliatum to stress caused by excess heavy metals. Our previous studies [14] that determined the BAF of S. Perfoliatum on heavy metal-polluted soils revealed values ranging from 1.04 in the petioles to 5.17 in the roots; in the same context, the bioaccumulation variation of Zn was between 1.01 in the petioles and 2.53 in the lamina. Additionally, values of the ability to concentrate in plants between 119 and 1056 mg kg−1 have been determined for Zn, which are directly dependent on the amount of metal existing in the soil [61]. It has been shown that S. perfoliatum has the ability to store Cd in rhizomes without it spreading to the rest of the plant, showing a high tolerance to this heavy metal [72].
Research conducted on different species belonging to the Asteraceae family has revealed high BAF values compared to species from other families. Thus Kin, 2008 [107] showed that plant communities with dominant species of the Poaceae family accumulate smaller amounts of heavy metals than communities dominated by representatives of the Asteraceae family, especially the genus Artemisia, and research on BAF in T. diversifolia (Hemsl.) A. Gray and H. annuus (L.) grown in soils contaminated with Zn and Pb showed higher levels of the two metals in the aboveground parts (leaves and stem) compared to the roots. In addition, the root-to-shoot translocation of Zn was higher than for Pb. All this indicates a strong accumulative potential of T. diversifolia and H. annuus for Pb and Zn [108]. Additionally, research on the ability of the roots and above-ground parts of three plant species of the Asteraceae family (Matricaria inodora L., Achillea millefolium L., Crepis setosa Haller fill.) for the bioaccumulation of Cu, Zn, Pb, and Cr showed that the lowest values were for Cr (0.03–0.09 depending on the species), followed by Pb (0.06–0.14), Cu (0.25–0.44) and Zn (1.06–2.42) [109].
Therefore, plant species of the Asteraceae family have a high potential for phytoextraction of heavy metals, since they generate large amounts of biomass and show a rapid growth rate. However, there is a high variability of metals between the different species and their organs, depending on the environmental concentrations [110].
The translocation factor (TF) indicates the mobility and transport of heavy metals at different levels/organs from the bottom up, being essential in understanding the mechanism of the mobilization of heavy metals to the aerial organs. The TF values were different, depending on the soil type, the metal and the stage of development of the plants; as such, the TF values were high in the first determination stage in plants grown in the Ps and lower in the last stage in plants grown in the Us. Regarding Zn, TF values increased as plants with significantly higher values grown in Us developed. For Pb, the TF values were higher at the stage between five and eight leaves, with the reduction in the amount in the roots and the accumulation in the leaves being evident (Table 8 and Figure 2). The high values of the TF in S. perfoliatum are consistent with other studies conducted by Chaplygin et al. [111] on some herbaceous species of the Asteraceae family (Ambrosia artemisiifolia, Artemisia austriaca, Achillea nobilis, and Tanacetum vulgare). In fact, there are numerous studies that attest to the native tendency of some species of Asteraceae to occupy the areas with heavy metal Ps in mining areas and other environments affected by contaminants and in the process of regeneration.
Both the BAF and TF are designed to assess the potential of plants to accumulate heavy metals, and values >1 show that plants can eliminate pollutants [112,113]. Therefore, the high values recorded attest to the very good ability of S. perfoliatum plants to take on and translocate large quantities of heavy metals from Ps into the aerial organs, in a reduced real time interval. BAF and TF values are higher in periods of vegetative growth, when the intake of elements of mineral nutrition and water from the soil is high, and metabolic biosynthesis activity is intense.
The removal efficiency (RE) values (Table 9 and Figure 3) were also high over the entire experimental interval, reaching values of over 90% for Cu and Pb at the stage of eight leaves for S. perfoliatum, which attests to certain characteristics of hyperaccumulation of this species.
The high values recorded by BAF, TF and RE may also be determined by the experimental controlled conditions (temperature, humidity), the use of distilled water with corrected pH (6.2–6.3) and the reintroduction into the soil of the leached and collected solutions. All these aspects increased the heavy metal availability for plants and prevented their loss from the rhizosphere.
It is known that hyperaccumulation depends on three basic hallmarks separating hyperaccumulator species from related non-hyperaccumulator taxa. These common traits are represented by: a much higher capacity to take heavy metals from the soil; faster and more efficient translocation of these metals; and a much greater capacity to detoxify and sequester huge amounts of heavy metals in the foliar apparatus [114].

4.3. Free Proline, Total Chlorophyll, and Plant Biomass

The proline accumulation is an adaptation mechanism of different plant species subjected to abiotic stress factors in general, and so also to the stress caused by excess heavy metals. Proline is recognized to play a key role in detoxifying reactive oxygen species (ROS), generated by excess heavy metals in the environment [115,116,117]. The accumulation of significant amounts of free proline in plant tissues reduces the negative impact of excess heavy metals on plant growth, thus helping to maintain their normal functioning [118].
Photosynthetic activity is one of the highly sensitive responses of stress in plants. Several of the excess heavy metals are recognized as inhibiting this process at different levels. A lot of research has reported the negative effects of heavy metals on the light and dark phase-specific reactions of photosynthesis, as well as on the reduction in the photosynthetic pigments content, stomatal conductance, and transpiration rates [119,120,121]. The decline of the chlorophyll content in the foliar apparatus could also be a reason for the decrease in photosynthesis [118]. Reducing the chlorophyll content associated with increasing free proline in the plant’s leaves under stress conditions with heavy metals is an adaptation reaction based on the competitive biosynthesis of the two biomolecules known to be common precursors—glutamate, which intensifies proline synthesis under stress conditions and the chlorophyll synthesis in the absence of stress.
However, the biomass accumulation rate in plants subject to stress conditions remained at a reasonable level, being about 32% lower compared to those grown in unpolluted conditions, which proves the high tolerance of the species to the induced stress factor.

5. Conclusions

We investigated the phytoremediation capacity of heavy metal Ps (Cu, Zn, Cr and Pb) of the Silphium perfoliatum species and evaluated some physiological mechanisms of tolerance to these elements. For this we used samples of polluted soil from a former mining area and unpolluted agricultural soil in which the plants were grown. Pollution levels exceeded the intervention limits for Cu and Pb and were within the alert limits for Zn and Cr (according to national regulations). The accumulation of Zn in plants was greater than that of Cu, as we went through the stages of development; the main organ was the lamina, but the amount was dependent on the content in the soils.
Significant variations were determined in the Pb and Cr content in plants, both between stages and organs. Phenophase showed a lower contribution to the variability of Pb, and Cr content compared to plant organs. A significant contribution was also found for the interaction between phenophases and analyzed organs to the quantity of these elements. The accumulation of these metals occurred mainly in the lamina, and smaller amounts were identified in roots and petioles.
Regarding the BAF, the results show that the lamina accumulated more Cu compared to the other organs, with higher values being determined for those grown in the Us. In the case of Zn, it was found that the BAF of this element in the root was not influenced by soil pollution. In contrast, plants grown in the Us showed a significantly higher accumulation of Zn at the level of the petioles and lamina, compared to plants grown in Ps. The lamina recorded a higher accumulation of Zn. The S. perfoliatum plants showed a higher BAF of Pb compared to that of Cr, and the superiority of the BAF of Pb in the lamina was evident.
It was observed that soil pollution had a significant influence on the TF of Cu and Zn from the roots to the aerial organs, with greater variations in Zn. The TF of the two elements was not significantly influenced by phenophase. For Cr and Pb, a higher TF of Cr was observed at first determination, while in the next two, the TF of the two elements showed similar values.
Significant variations were determined in the RE of Cu and Zn, both between stages and depending on the level of soil pollution. The development stage showed less contribution of the RE of Zn compared to soil pollution.
The accumulation of heavy metals in plants was differentiated according to the concentration existing in the two soil types (polluted/unpolluted), the element (Cu, Zn, Cr, Pb), the organ (roots, petiole, leaves) and the plant development stage (13, 15 or 18BBCH). The highest values were recorded in polluted soil, in the order of Zn > Cu > Pb > Cr, in lamina and in the 18 BBCH stage.
High concentrations of heavy metals led to a slight reduction in the plants’ growth rate, associated with an increase in the free proline content in plant organs. The chlorophyll content showed low and insignificant correlations with all metals.
S. perfoliatum is one such species, with high ecological plasticity, being a hyperaccumulator of Cu, Zn, Cr and Pb, with demonstrated RE, which could be successfully used in phytoremediation programs of heavy metal-polluted areas.
However, further studies are needed under "in situ" controlled conditions which involve cultivation under natural conditions and the evaluation of bioremediation capacities in interaction with specific local factors.

Supplementary Materials

The following are available online at https://www.mdpi.com/article/10.3390/min12030334/s1, Figure S1: Map with the location of soil samples from the polluted mining area and from the unpolluted site; Table S1: ANOVA for Cu and Zn concentrations in different organs of S. perfoliatum for different stages grown in Ps and Us; Table S2. ANOVA for Cr and Pb concentrations in different organs of S. perfoliatum; Table S3: ANOVA for BAF of Cu and Zn in different organs of S. perfoliatum grown in Ps and Us; Table S4: ANOVA for TF of Cu and Zn in different stages of S. perfoliatum plants; Table S5: ANOVA for RE of Cu and Zn on different stages of S. perfoliatum plants; Table S6: ANOVA for free proline content in different organs of S. perfoliatum at different development stages.

Author Contributions

Conceptualization, R.L.S.; methodology, V.N.; validation, P.N.; investigation, V.N., A.B. and G.V.; resources, S.G.; data curation, S.C.; writing—original draft preparation, R.M.S.; writing—review and editing, R.L.S. and S.C.; visualization, V.N.; supervision, R.L.S.; funding acquisition, S.G. All authors have read and agreed to the published version of the manuscript.

Funding

This research was supported by Banat’s University of Agricultural Sciences and Veterinary Medicine “King Michael I of Romania” from Timisoara.

Acknowledgments

This research paper is supported by the project “Increasing the impact of excellence research on the capacity for innovation and technology transfer within USAMVB Timisoara” code 6PFE, submitted in the competition Program 1—Development of the national system of research—development, Subprogram 1.2—Institutional performance, Institutional development projects—Development projects of excellence in RDI.

Conflicts of Interest

The authors declare no conflict of interest.

References

  1. He, Z.; Shentu, J.; Yang, X.; Baligar, V.C.; Zhang, T.; Stofella, P.J. Heavy Metal Contamination of Soils: Sources, Indicators, and Assessment. J. Environ. Indic. 2015, 9, 17–18. [Google Scholar] [CrossRef] [Green Version]
  2. Tóth, G.; Hermann, T.; Szatmári, G.; Pásztor, L. Maps of heavy metals in the soils of the European Union and proposed priority areas for detailed assessment. Sci. Total Environ. 2016, 565, 1054–1062. [Google Scholar] [CrossRef] [PubMed]
  3. Azimi, A.; Azri, A.; Rezkazemi, M.; Ansarpour, M. Removal of heavy metals from industrial wastewaters: A review. ChemBioEng Rev. 2017, 4, 37–59. [Google Scholar] [CrossRef]
  4. Mishra, S.; Ram Naresh Bharagava, S.N.; More, N.; Ashutosh Yadav, A.; Zainith, S.; Mani, S.; Chowdhary, P. Heavy metal contamination: An alarming threat to environment and human health. In Environmental Biotechnology: For Sustainable Future; Sobti, R., Arora, N., Kothari, R., Eds.; Springer: Singapore, 2019; pp. 103–125. [Google Scholar] [CrossRef]
  5. Shen, X.; Chi, Y.; Xiong, K. The effect of heavy metal contamination on humans and animals in the vicinity of a zinc smelting facility. PLoS ONE 2019, 14, e0207423. [Google Scholar] [CrossRef]
  6. Sall, M.L.; Diaw, A.K.D.; Gningue-Sall, D.; Aaron, S.E.; Aaron, J.J. Toxic heavy metals: Impact on the environment and human health, and treatment with conducting organic polymers, a review. Envion. Sci. Pollut. Res. 2020, 27, 29927–29942. [Google Scholar] [CrossRef]
  7. Alengebawy, A.; Abdelkhalek, S.T.; Qureshi, S.R.; Wang, M.-Q. Heavy Metals and Pesticides Toxicity in Agricultural Soil and Plants: Ecological Risks and Human Health Implications. Toxics 2021, 9, 42. [Google Scholar] [CrossRef]
  8. Li, R.; Zhao, L.; Li, L.; Hou, Z.; Zhang, D.; Wan, L.; Wei, L.; Yang, Y.; Lv, J.; Ma, M.; et al. A Preliminary Study about the Potential Effects of Heavy Metals on the Human Male Reproductive Parameters in HIV-Infected Population in China. Biol. Trace Elem. Res. 2017, 180, 39–47. [Google Scholar] [CrossRef]
  9. Tepanosyan, G.; Sahakyan, L.; Belyaeva, O.; Asmaryan, S.; Saghatelyan, A. Continuous impact of mining activities on soil heavy metals levels and human health. Sci. Total Environ. 2018, 639, 900–909. [Google Scholar] [CrossRef]
  10. Algül, F.; Beyhan, M. Concentrations and sources of heavy metals in shallow sediments in Lake Bafa, Turkey. Sci. Rep. 2020, 10, 11782. [Google Scholar] [CrossRef]
  11. Renu, K.; Chakraborty, R.; Myakala, H.; Koti, R.; Famurewa, A.C.; Madhyastha, H.; Vellingiri, B.; George, A.; Valsala Gopalakrishnan, A. Molecular mechanism of heavy metals (Lead, Chromium, Arsenic, Mercury, Nickel and Cadmium)—Induced hepatotoxicity—A review. Chemosphere 2021, 271, 129735. [Google Scholar] [CrossRef]
  12. Guo, J.; Zhang, Y.; Liu, W.; Zhao, J.; Yu, S.; Jia, H.; Zhang, C.; Li, Y. Incorporating in vitro bioaccessibility into human health risk assessment of heavy metals and metalloid (As) in soil and pak choi (Brassica chinensis L.) from greenhouse vegetable production fields in a megacity in Northwest China. Food Chem. 2022, 373, 131488. [Google Scholar] [CrossRef]
  13. Rauta, C.; Lacatusu, R.; Carstea, S. Heavy metal pollution in Romania. In Heavy Metals: Problems and Solutions; Salomons, W., Forstner, U., Mader, P., Eds.; Springer: Berlin, Germany, 1995; pp. 359–372. [Google Scholar]
  14. Sumalan, R.L.; Muntean, C.; Kostov, A.; Krzanovic, D.; Jucsor, N.L.; Ciulca, S.I.; Sumalan, R.M.; Gheju, M.; Cernicova-Buca, M. The cup plant (Silphium perfoliatum L.)—A viable solution for bioremediating soils polluted with heavy metals. Not. Bot. Horti Agrobot. Cluj-Napoca 2020, 48, 2095–2113. [Google Scholar] [CrossRef]
  15. Ungureanu, T.; Iancu, G.O.; Pintilei, M.; Chicoș, M.M. Spatial distribution and geochemistry of heavy metals in soils: A case study from the NE area of Vaslui county, Romania. J. Geochem. Explor. 2017, 176, 20–32. [Google Scholar] [CrossRef]
  16. Harmanescu, M.; Alda, L.M.; Bordean, D.M.; Gogoasa, I.; Gergen, I. Heavy metals health risk assessment for population via consumption of vegetables grown in old mining area; a case study: Banat County, Romania. Chem. Cent. J. 2011, 5, 64. [Google Scholar] [CrossRef] [Green Version]
  17. Big, C.L.; Lacatusu, R.; Damian, F. Heavy metals in soil-plant system around Baia Mare city, Romania. Carpathian J. Earth Environ. Sci. 2012, 7, 219–230. [Google Scholar]
  18. Mihaileanu, R.G.; Neamtiu, I.A.; Fleming, M.; Pop, C.; Bloom, M.S.; Roba, C.; Surcel, M.; Stamatian, F.; Gurzau, E. Assessment of heavy metals (total chromium, lead, and manganese) contamination of residential soil and homegrown vegetables near a former chemical manufacturing facility in Tarnaveni, Romania. Environ. Monit. Assess. 2019, 191, 8. [Google Scholar] [CrossRef]
  19. Lacatusu, R. Contributions regarding heavy metals flow within soil-plant-animal system in polluted areas. Acta Met. 2014, 11, 73–88. [Google Scholar]
  20. Bora, F.D.; Bunea, C.I.; Chira, R.; Bunea, A. Assessment of the Quality of Polluted Areas in Northwest Romania Based on the Content of Elements in Different Organs of Grapevine (Vitis vinifera L.). Molecules 2020, 25, 750. [Google Scholar] [CrossRef] [Green Version]
  21. Rosca, M.; Cozma, P.; Minut, M.; Hlihor, R.-M.; Bețianu, C.; Diaconu, M.; Gavrilescu, M. New Evidence of Model Crop Brassica napus L. in Soil Clean-Up: Comparison of Tolerance and Accumulation of Lead and Cadmium. Plants 2021, 10, 2051. [Google Scholar] [CrossRef]
  22. Roba, C.; Roşu, C.; Piştea, I.; Ozunu, A.; Baciu, C. Heavy metal content in vegetables and fruits cultivated in Baia Mare mining area (Romania) and health risk assessment. Environ. Sci. Pollut. Res. 2016, 23, 6062–6073. [Google Scholar] [CrossRef]
  23. Resetar-Deac, A.M.; Diacu, E. Assessment of aquatic environment contamination with heavy metals from abandoned mines of Northwestern Romania. Rev. Chim. 2015, 66, 1535–1539. [Google Scholar]
  24. Matache, M.L.; Marin, C.; Rozylowicz, L.; Tudorache, A. Plants accumulating heavy metals in the Danube river wetlands. J. Environ. Health Sci. Eng. 2013, 11, 1–7. [Google Scholar] [CrossRef] [PubMed] [Green Version]
  25. Calmuc, V.A.; Calmuc, M.; Arseni, M.; Topa, C.M.; Timofti, M.; Burada, A.; Iticescu, C.; Georgescu, L.P. Assessment of Heavy Metal Pollution Levels in Sediments and of Ecological Risk by Quality Indices, Applying a Case Study: The Lower Danube River, Romania. Water 2021, 13, 1801. [Google Scholar] [CrossRef]
  26. Iordache, A.M.; Nechita, C.; Zgavarogea, R.; Voica, C.; Varlam, M.; Ionete, R.E. Accumulation and ecotoxicological risk assessment of heavy metals in surface sediments of the Olt River, Romania. Sci. Rep. 2022, 12, 880. [Google Scholar] [CrossRef]
  27. Radulescu, C.; Stihi, C.; Dulama, I.D.; Chelarescu, E.D.; Bretcan, P.; Tanislav, D. Assessment of Heavy Metals Content in Water and Mud of Several Salt Lakes from Romania by Atomic Absorption Spectrometry. Rom. J. Phys. 2015, 60, 246–256. [Google Scholar]
  28. Tudor, M.; Teodorof, L.; Burada, A.; Tudor, M.; Ibram, O.; Despina, C. Long-term nutrients and heavy metals concentration dynamics in aquatic ecosystems of Danube Delta. Sci. Ann. Danub. Delta Inst. 2016, 22, 149–156. [Google Scholar]
  29. Dunea, D.; Iordache, S.; Alexandrescu, D.C.; Dinca, N. Screening the weekdays/weekend patterns of air pollutant concentrations recorded in Southeastern Romania. Environ. Eng. Manag. J. 2014, 13, 3105–3114. [Google Scholar]
  30. Radulescu, C.; Iordache, S.; Dunea, D.; Stihi, C.; Dulama, I.D. Risks assessment of heavy metals on public health associated with atmospheric exposure to PM2.5 in urban area. Rom. J. Phys. 2015, 60, 1171–1182. [Google Scholar]
  31. Stihi, C.; Popescu, I.V.; Frontasyeva, M.; Radulescu, C.; Ene, A.; Culicov, O.; Zinicovscaia, I.; Dulama, I.D.; Cucu-Man, S.; Todoran, R.; et al. Characterization of Heavy Metal Air Pollution in Romania Using Moss Biomonitoring, Neutron Activation Analysis, and Atomic Absorption Spectrometry. Anal. Lett. 2017, 50, 2851–2858. [Google Scholar] [CrossRef]
  32. Stefanut, S.; Öllerer, K.; Manole, A. National environmental quality assessment and monitoring of atmospheric heavy metal pollution—A moss bag approach. J. Environ. Manag. 2019, 248, 109224. [Google Scholar] [CrossRef]
  33. Liu, L.; Li, W.; Song, W.; Guo, M. Remediation techniques for heavy metal-contaminated soils: Principles and applicability. Sci. Total Environ. 2018, 633, 206–219. [Google Scholar] [CrossRef] [PubMed]
  34. Seo, S.J.; Kim, J.H.; Shin, J.W.; Park, J.Y. Treatment of artificial and real co-contaminated soil by an enhanced electrokinetic-Fenton process with a soil flushing method. Water Air Soil Pollut. 2015, 226, 86. [Google Scholar] [CrossRef]
  35. Figueroa, A.; Cameselle, C.; Gouveia, S.; Hansen, H.K. Electrokinetic treatment of an agricultural soil contaminated with heavy metals. J. Environ. Sci. Health A Toxic Hazard. Subst. Environ. Eng. 2016, 51, 691–700. [Google Scholar] [CrossRef] [PubMed]
  36. Celary, P.; Sobik-Szołtysek, J. Vitrification as an alternative to landfilling of tannery sewage sludge. Waste Manag. 2014, 34, 2520–2527. [Google Scholar] [CrossRef] [PubMed]
  37. Chen, Q.; Yao, Y.; Li, X.; Lu, J.; Zhou, J.; Huang, Z. Comparison of heavy metal removals from aqueous solutions by chemical precipitation and characteristics of precipitates. J. Water Process Eng. 2018, 26, 289–300. [Google Scholar] [CrossRef]
  38. Bashir, A.; Malik, L.A.; Ahad, S.; Manzoor, T.; Bhat, M.A.; Dar, G.N.; Pandith, A.H. Removal of heavy metal ions from aqueous system by ion-exchange and biosorption methods. Environ. Chem. Lett. 2019, 17, 729–754. [Google Scholar] [CrossRef]
  39. Thaçi, B.S.; Gashi, S.T. Reverse Osmosis Removal of Heavy Metals from Wastewater Effluents Using Biowaste Materials Pretreatment. Pol. J. Environ. Stud. 2019, 28, 337–341. [Google Scholar] [CrossRef]
  40. Tang, J.; Su, M.; Wu, Q.; Wei, L.; Wang, N.; Xiao, E.; Zhang, H.; Wei, Y.; Liu, Y.; Ekberg, C.; et al. Highly efficient recovery and clean-up of four heavy metals from MSWI fly ash by integrating leaching, selective extraction and adsorption. J. Clean. Prod. 2019, 234, 139–149. [Google Scholar] [CrossRef]
  41. Ali, S.; Abbas, Z.; Rizwan, M.; Zaheer, I.E.; Yavaş, İ.; Ünay, A.; Abdel-Daim, M.M.; Bin-Jumah, M.; Hasanuzzaman, M.; Kalderis, D. Application of Floating Aquatic Plants in Phytoremediation of Heavy Metals Polluted Water: A Review. Sustainability 2020, 12, 1927. [Google Scholar] [CrossRef] [Green Version]
  42. Cristaldi, A.; Conti, G.O.; Jho, E.H.; Zuccarello, P.; Grasso, A.; Copat, C.; Ferrante, M. Phytoremediation of contaminated soils by heavy metals and PAHs. A brief review. Environ. Technol. Innov. 2017, 8, 309–326. [Google Scholar] [CrossRef]
  43. Derakhshan Nejad, Z.; Jung, M.C.; Kim, K.H. Remediation of soils contaminated with heavy metals with an emphasis on immobilization technology. Environ. Geochem. Health 2018, 40, 927–953. [Google Scholar] [CrossRef] [PubMed]
  44. Liu, S.; Yang, B.; Liang, Y.; Xiao, Y.; Fang, J. Prospect of phytoremediation combined with other approaches for remediation of heavy metal-polluted soils. Environ. Sci. Pollut. Res. 2020, 27, 16069–16085. [Google Scholar] [CrossRef] [PubMed]
  45. Leguizamo, M.A.O.; Gómez, W.D.F.; Sarmiento, M.C.G. Native herbaceous plant species with potential use in phytoremediation of heavy metals, spotlight on wetlands—A review. Chemosphere 2017, 168, 1230–1247. [Google Scholar] [CrossRef] [PubMed]
  46. Devi, P.; Kumar, P. Concept and Application of Phytoremediation in the Fight of Heavy Metal Toxicity. J. Pharm. Sci. Res. 2020, 12, 795–804. [Google Scholar]
  47. Amer, N.; Al Chami, Z.; Al Bitar, L.; Mondelli, D.; Dumontet, S. Evaluation of Atriplex halimus, Medicago lupulina and Portulaca oleracea For Phytoremediation of Ni, Pb, and Zn. Int. J. Phytoremediat. 2013, 15, 498–512. [Google Scholar] [CrossRef]
  48. Jianxu, W.; Xinbin, F.; Christopher, W.N.A.; Ying, X.; Lihai, S. Remediation of mercury contaminated sites—A review. J. Hazard. Mater. 2012, 221–222, 1–18. [Google Scholar] [CrossRef]
  49. Koptsik, G.N. Problems and prospects concerning the phytoremediation of heavy metal polluted soils: A review. Eurasian Soil Sci. 2014, 47, 923–939. [Google Scholar] [CrossRef]
  50. Bolan, N.; Kunhikrishnan, A.; Thangarajana, R.; Kumpiene, J.; Park, J.; Makino, T.; Kirkham, M.B.; Scheckel, K. Remediation of heavy metal (loid)s contaminated soils—To mobilize or to immobilize? J. Hazard. Mater. 2014, 26, 141–166. [Google Scholar] [CrossRef]
  51. Barbosa, B.; Boléo, S.; Sidella, S.; Costa, J.; Duarte, M.P.; Mendes, B.; Cosentino, S.L.; Fernando, A.L. Phytoremediation of heavy metal-contaminated soils using the perennial energy crops Miscanthus spp. and Arundo donax L. Bioenergy Res. 2015, 8, 1500–1511. [Google Scholar] [CrossRef]
  52. Mahar, A.; Wang, P.; Ali, A.; Awasthi, M.K.; Lahori, A.H.; Wang, Q.; Li, R.; Zhang, Z. Challenges and opportunities in the phytoremediation of heavy metals contaminated soils: A review. Ecotoxicol. Environ. Saf. 2016, 126, 111–121. [Google Scholar] [CrossRef]
  53. Pandey, V.C.; Bajpai, O.; Singh, N. Energy crops in sustainable phytoremediation. Renew. Sustain. Energy Rev. 2016, 54, 58–73. [Google Scholar] [CrossRef]
  54. Shah, V.; Daverey, A. Phytoremediation: A multidisciplinary approach to clean up heavy metal contaminated soil. Environ. Technol. Innov. 2020, 18, 100774. [Google Scholar] [CrossRef]
  55. Raza, A.; Habib, M.; Kakavand, S.N.; Zahid, Z.; Zahra, N.; Sharif, R.; Hasanuzzaman, M. Phytoremediation of Cadmium: Physiological, Biochemical, and Molecular Mechanisms. Biology 2020, 9, 177. [Google Scholar] [CrossRef]
  56. Anning, A.K.; Korsah, P.E.; Addo-Fordjour, P. Phytoremediation of wastewater with Limnocharis flava, Thalia Geniculata and Typha latifolia in constructed wetlands. Int. J. Phytoremediat. 2013, 15, 452–464. [Google Scholar] [CrossRef] [PubMed]
  57. Anning, A.K.; Akoto, R. Assisted phytoremediation of heavy metal contaminated soil from a mined site with Typha latifolia and Chrysopogon zizanioides. Ecotoxicol. Environ. Saf. 2018, 148, 97–104. [Google Scholar] [CrossRef] [PubMed]
  58. Awa, S.H.; Hadibarata, T. Removal of Heavy Metals in Contaminated Soil by Phytoremediation Mechanism: A Review. Water Air Soil Pollut. 2020, 231, 1–15. [Google Scholar] [CrossRef]
  59. Kowalski, R.; Kedzia, B. Antibacterial activity of Silphium perfoliatum. Extracts. Pharm. Biol. 2007, 45, 494–500. [Google Scholar] [CrossRef]
  60. Gansberger, M.; Montgomery, L.F.R.; Liebhard, P. Botanical Characteristics, Crop Management and Potential of Silphium perfoliatum L. as a Renewable Resource for Biogas Production: A Review. Ind. Crop. Prod. 2015, 63, 362–372. [Google Scholar] [CrossRef]
  61. Zhang, X.; Xia, H.; Li, Z.; Zhuang, P.; Gao, B. Potential of Four forage grasses in remediation of Cd and Zn contaminated soils. Bioresour. Technol. 2010, 101, 2063–2066. [Google Scholar] [CrossRef]
  62. Frączek, J.; Mudryk, K.; Wróbel, M. Cup plant Silphium perfoliatum L. Biomass Source for Biofuel Production. Inż. Rol. 2011, 131, 21–27. [Google Scholar]
  63. Brendieck-Worm, C. Is course correction in the biogas industry possible? The cup plant (Silphium perfoliatum): High-yielding energy plant as bee pasture. Z. Ganzheitl. Tiermed. 2017, 31, 50–53. [Google Scholar]
  64. Ustak, S.; Munoz, J. Cup-plant potential for biogas production compared to reference maize in relation to the balance needs of nutrients and some microelements for their cultivation. J. Environ. Manag. 2018, 228, 260–266. [Google Scholar] [CrossRef] [PubMed]
  65. Von Cossel, M.; Steberl, K.; Hartung, J.; Pereira, L.A.; Kiesel, A.; Lewandowski, I. Methane yield and species diversity dynamics of perennial wild plant mixtures established alone, under cover crop maize (Zea mays L.), and after spring barley (Hordeum vulgare L.). GCB Bioenergy 2019, 11, 1376–1391. [Google Scholar] [CrossRef] [Green Version]
  66. Zhang, X.; Wu, C.; Nie, X.; Gao, B. Identification of a New Potential Cd-Accumulator Pterocypsela indica (L.) Shih. Bull. Environ. Contam. Toxicol. 2021, 106, 859–865. [Google Scholar] [CrossRef]
  67. Antonkiewicz, J.; Jasiewicz, C. Effect of Soil Contamination with Heavy Metals on Element Contents in Silphium perfoliatum (Silphium perfoliatum L.). Chem. Ecol. Eng. 2003, 10, 205–210. [Google Scholar]
  68. Peni, D.; Stolarski, M.J.; Bordiean, A.; Krzyżaniak, M.; Dębowski, M. Silphium perfoliatum—A Herbaceous Crop with Increased Interest in Recent Years for Multi-Purpose Use. Agriculture 2020, 10, 640. [Google Scholar] [CrossRef]
  69. Kowalska, G.; Pankiewicz, U.; Kowalski, R. Evaluation of chemical composition of some Silphium L. species as alternative raw materials. Agriculture 2020, 10, 132. [Google Scholar] [CrossRef] [Green Version]
  70. Von Gehren, P.; Gansberger, M.; Mayr, J.; Liebhard, P. The effect of sowing date and seed pretreatments on establishment of the energy plant Silphium perfoliatum by sowing. Seed Sci. Technol. 2016, 44, 1–10. [Google Scholar] [CrossRef]
  71. Franzaring, J.; Holz, I.; Kauf, Z.; Fangmeier, A. Responses of the novel bioenergy plant species Sida hermaphrodita (L.) Rusby and Silphium perfoliatum L. to CO2 fertilization at different temperatures and water supply. Biomass Bioenergy 2015, 81, 574–583. [Google Scholar] [CrossRef]
  72. Cumplido-Marin, L.; Graves, A.R.; Burgess, P.J.; Morhart, C.; Paris, P.; Jablonowski, N.D.; Facciotto, G.; Bury, M.; Martens, R.; Nahm, M. Two Novel Energy Crops: Sida hermaphrodita (L.) Rusby and Silphium perfoliatum L.—State of Knowledge. Agronomy 2020, 10, 928. [Google Scholar] [CrossRef]
  73. Jucsor, N.; Sumalan, R. Researches concerning the potential of biomass accumulation in cup plant (Silphium perfoliatum L.). J. Hortic. For. Biotechnol. 2018, 22, 34–39. [Google Scholar]
  74. ISO 11464:2006; Soil Quality—Pretreatment of Samples for Physico-Chemical Analysis. International Organization for Standardization: Geneva, Switzerland, 2006. Available online: https://www.iso.org/standard/24010.html (accessed on 23 March 2020).
  75. ISO 11047:1998; Soil Quality—Determination of Cadmium, Chromium, Cobalt, Copper, Lead, Manganese, Nickel and Zinc—Flame and Electrothermal Atomic Absorption Spectrometric Methods. International Organization for Standardization: Geneva, Switzerland, 2006. Available online: https://www.iso.org/obp/ui/#iso:std:iso:11047:ed-1:v1:en (accessed on 23 March 2020).
  76. Meier, U.; Bleiholder, H.; Buhr, L.; Feller, C.; Hacks, H.; Hess, M.; Lancashire, P.D.; Schnock, U.; Staub, R.; van den Boom, T.V.D.; et al. The BBCH system to coding the phenological growth stages of plants-history and publications. J. Cultiv. Plants 2009, 2, 41–52. [Google Scholar]
  77. Arnon, D.I. Copper enzymes in isolated chloroplasts. Polyphenol oxidase in Beta vulgaris. Plant Physiol. 1994, 24, 1–15. [Google Scholar] [CrossRef] [PubMed] [Green Version]
  78. Bates, L.S.; Waldren, R.P.; Teare, I.D. Rapid determination of free proline for water-stress studies. Plant Soil 1973, 39, 205–207. [Google Scholar] [CrossRef]
  79. Gupta, S.; Nayek, S.; Saha, R.N.; Satpati, S. Assessment of heavy metal accumulation in macrophyte, agricultural soil, and crop plants adjacent to discharge zone of sponge iron factory. Environ. Geol. 2008, 55, 731–739. [Google Scholar] [CrossRef]
  80. Stanislawska-Glubiak, E.; Korzeniowska, J.; Kocon, A. Effect of peat on the accumulation and translocation of heavy metals by maize grown in contaminated soils. Environ. Sci. Pollut. Res. 2015, 22, 4706–4714. [Google Scholar] [CrossRef]
  81. Hakanson, L. An ecological risk index for aquatic pollution control. A sedimentological approach. Water Res. 1980, 14, 975–1001. [Google Scholar] [CrossRef]
  82. Kabata-Pendias, A.; Szteke, B. Trace Elements in Abiotic and Biotic Environments; CRC Press: Boca Raton, FL, USA, 2015; pp. 121–137. [Google Scholar] [CrossRef]
  83. Ciulca, S. Experimental Methodologies in Agriculture and Biology; Editura Agroprint: Timisoara, Romania, 2006; pp. 138–144. [Google Scholar]
  84. Ryser, P.; Emerson, P. Growth, root and leaf structure, and biomass allocation in Leucanthemum vulgare Lam. (Asteraceae) as influenced by heavy-metal-containing slag. Plant Soil 2007, 301, 315–324. [Google Scholar] [CrossRef]
  85. Bury, M.; Rusinowski, S.; Sitko, K.; Krzyżak, J.; Kitczak, T.; Możdżer, E.; Siwek, H.; Włodarczyk, M.; Zieleźnik-Rusinowska, P.; Szada-Borzyszkowska, A.; et al. Physiological Status and Biomass Yield of Sida hermaphrodita (L.) Rusby Cultivated on Two Distinct Marginal Lands in Southern and Northern Poland. Ind. Crop. Prod. 2021, 167, 113502. [Google Scholar] [CrossRef]
  86. Clijsters, H.; Van Assche, F. Inhibition of photosynthesis by heavy metals. Photosynth. Res. 1985, 7, 31–40. [Google Scholar] [CrossRef]
  87. Souri, Z.; Cardoso, A.A.; da-Silva, C.J.; de Oliveira, L.M.; Dari, B.; Sihi, D.; Karimi, N. Heavy metals and photosynthesis: Re-cent developments. In Photosynthesis, Productivity and Environmental Stress; John Wiley & Sons: Hoboken, NJ, USA, 2019; pp. 107–134. [Google Scholar] [CrossRef]
  88. Romanian Ministry of Environment, Water and Forests. Order 756/1997, Environmental Pollution Assessment Regulation (Ordinul Nr. 756/1997 Pentru Aprobarea Reglementării Privind Evaluarea Poluării Mediului); Ministerul Apelor, Pădurilor și Protecţiei Mediului: Bucharest, Romania, 1997; Available online: https://stratos.ro/wp-content/uploads/2020/03/ordinul-nr-756-1997.pdf (accessed on 29 April 2020).
  89. Królak, E. Accumulation of Zn, Cu, Pb and Cd by dandelion (Taraxacum officinale Web.) in environments with various degrees of metallic contamination. Pol. J. Environ. Stud. 2003, 12, 713–721. [Google Scholar]
  90. Wahsha, M.; Bini, C.; Fontana, S.; Wahsha, D.; Zilioli, D. Toxicity assessment of contaminated soils from a mining area in Northeast Italy by using lipid peroxidation assay. J. Geochem. Explor. 2012, 113, 112–117. [Google Scholar] [CrossRef]
  91. Georgiadou, E.C.; Kowalska, E.; Patla, K.; Kulbat, K.; Smolińska, B.; Leszczyńska, J.; Fotopoulos, V. Influence of heavy metals (Ni, Cu, and Zn) on nitro-oxidative stress responses, proteome regulation and allergen production in basil (Ocimum basilicum L.) plants. Front. Plant Sci. 2018, 9, 862. [Google Scholar] [CrossRef] [PubMed] [Green Version]
  92. Liang, J.; Fang, H.L.; Zhang, T.L.; Wang, X.X.; Liu, Y.D. Heavy metal in leaves of twelve plant species from seven different areas in Shanghai, China. Urban For. Urban Green. 2017, 27, 390–398. [Google Scholar] [CrossRef]
  93. Mayerová, M.; Petrová, Š.; Madaras, M.; Lipavský, J.; Šimon, T.; Vaněk, T. Non-enhanced phytoextraction of cadmium, zinc, and lead by high-yielding crops. Environ. Sci. Pollut. Res. 2017, 24, 14706–14716. [Google Scholar] [CrossRef]
  94. Li, J.; Yu, H.; Luan, Y. Meta-Analysis of the Copper, Zinc, and Cadmium Absorption Capacities of Aquatic Plants in Heavy Metal-Polluted Water. Int. J. Environ. Res. Public Health 2015, 12, 14958–14973. [Google Scholar] [CrossRef] [Green Version]
  95. Vymazal, J.; Vehla, J.; Kropfelová, L.; Chrastny, V. Trace Metals in Phragmites australis and Phalaris arundinacea Growing in Constructed and Natural Wetlands. Sci. Total Environ. 2007, 380, 154–162. [Google Scholar] [CrossRef]
  96. Gjorgieva, D.; Kadifkova-Panovska, T.; Bačeva, K.; Stafilov, T. Assesment of heavy metals pollution in Republic of Macedonia using a plant assay. Arch. Environ. Contam. Toxicol. 2011, 60, 233–240. [Google Scholar] [CrossRef]
  97. Boshoff, M.; De Jonge, M.; Scheifler, R.; Bervoets, L. Predicting As, Cd, Cu, Pb and Zn levels in grasses (Agrostis sp. and Poa sp.) and stinging nettle (Urtica dioica) applying soil–plant transfer models. Sci. Total Environ. 2014, 493, 862–871. [Google Scholar] [CrossRef]
  98. Collier, M.; Boughter, S.; Dameron, M.; Rogstad, S. Uptake and distribution of copper, lead, and zinc in dandelions (Taraxacum officinale; Asteraceae) sampled from polluted and nonpolluted soils. J. Torrey Bot. Soc. 2017, 144, 47–57. [Google Scholar] [CrossRef]
  99. Chaplygin, V.; Minkina, T.; Mandzhieva, S.; Burachevskaya, M.; Sushkova, S.; Antonenko, E.; Kumacheva, V.; Shipkova, G. The effect of technogenic emissions on the heavy metals accumulation by herbaceous plants. Environ. Monit. Assess. 2018, 190, 124–129. [Google Scholar] [CrossRef] [PubMed]
  100. Inelova, Z.; Nesterova, S.; Yerubayeva, G.; Zura, Y.; Seitkadyr, K.; Zaparina, Y. Heavy metal accumulation in plants of Atyrau region. Pak. J. Bot. 2018, 50, 2259–2263. [Google Scholar] [CrossRef]
  101. El Berkaoui, M.; El Adnani, M.; Hakkou, R.; Ouhammou, A.; Bendaou, N.; Smouni, A. Assessment of the Transfer of Trace Metals to Spontaneous Plants on Abandoned Pyrrhotite Mine: Potential Application for Phytostabilization of Phosphate Wastes. Plants 2022, 11, 179. [Google Scholar] [CrossRef] [PubMed]
  102. Porębska, G.; Ostrowska, A. Heavy metal accumulation in wild plants: Implications for phytoremediation. Pol. J. Environ. Stud. 1999, 8, 433–442. [Google Scholar]
  103. Jacob, J.M.; Karthik, C.; Saratale, R.G.; Kumar, S.S.; Prabakar, D.; Kadirvelu, K.; Pugazhendhi, A. Biological approaches to tackle heavy metal pollution: A survey of literature. J. Environ. Manag. 2018, 217, 56–70. [Google Scholar] [CrossRef]
  104. Ghosh, M.; Singh, S. A review on phytoremediation of heavy metals and utilization of it’s by products. Asian J. Energy Environ. 2005, 3, 214–231. [Google Scholar] [CrossRef]
  105. Hernández-Allica, J.; Becerril, J.M.; Garbisu, C. Assessment of the phytoextraction potential of high biomass crop plants. Environ. Pollut. 2008, 152, 32–40. [Google Scholar] [CrossRef]
  106. Cluis, C. Junk-greedy greens: Phytoremediation as a new option for soil decontamination. Biotechnol. J. 2004, 2, 60–67. [Google Scholar]
  107. Kin, N.O. Plant communities in the zone of gas field development and heavy metal accumulation by them. Russ. J. Ecol. 2008, 39, 254–260. [Google Scholar] [CrossRef]
  108. Nikolić, M.; Stevović, S. Family Asteraceae as a sustainable planning tool in phytoremediation and its relevance in urban areas. Urban For. Urban Green. 2015, 14, 782–789. [Google Scholar] [CrossRef]
  109. Glišić, R.M.; Simić, Z.B.; Grbović, F.J.; Rajičić, V.R.; Branković, S.R. Phytoaccumulation of metals in three plants species of the Asteraceae family sampled along a highway. Not. Bot. Horti Agrobot. Cluj-Napoca 2021, 49, 12180. [Google Scholar] [CrossRef]
  110. Bouhadi, M.; Elkouali, M.H.; Talbi, M.; Ainane, T. Phytoremediation Review: Bioavailability of heavy metals and the role of bioaccumulative plants in the remediation of contaminated soils. J. Anal. Sci. Appl. Biotechnol. 2021, 3, 40–47. [Google Scholar] [CrossRef]
  111. Chaplygin, V.A.; Rajput, V.D.; Mandzhieva, S.S.; Minkina, T.M.; Nevidomskaya, D.G.; Nazarenko, O.G.; Kalinitchenko, V.P.; Singh, R.; Maksimov, A.Y.; Popova, V.A. Comparison of Heavy Metal Content in Artemisia austriaca in Various Impact Zones. ACS Omega 2020, 5, 23393–23400. [Google Scholar] [CrossRef] [PubMed]
  112. Yoon, J.; Cao, X.; Zhou, Q.; Ma, M.Q. Accumulation of Pb, Cu, and Zn in native plants growing on a contaminated Florida site. Sci. Total Environ. 2006, 368, 456–464. [Google Scholar] [CrossRef] [PubMed]
  113. Gołda, S.; Korzeniowska, J. Comparison of phytoremediation potential of three grass species in soil contaminated with cadmium. Environ. Protect. Nat. Res. 2016, 27, 8–14. [Google Scholar] [CrossRef] [Green Version]
  114. Rascio, N.; Navari-Izzo, F. Heavy metal hyperaccumulating plants: How and why do they do it? Additionally, what makes them so interesting? Plant Sci. 2011, 180, 169–181. [Google Scholar] [CrossRef]
  115. Nagajyoti, P.C.; Lee, K.D.; Sreekanth, T.V.M. A review: Heavy metals, occurrence and toxicity for plants. Environ. Chem. Lett. 2010, 8, 199–216. [Google Scholar] [CrossRef]
  116. Aslam, M.; Saeed, M.S.; Sattar, S.; Sajad, S.; Sajjad, M.; Adnan, M.; Iqbal, M.; Sharif, M.T. Specific Role of Proline Against Heavy Metals Toxicity in Plants. Int. J. Pure Appl. Biosci. 2017, 5, 27–34. [Google Scholar] [CrossRef]
  117. Siddique, A.; Kandpal, G.; Kumar, P.J. Proline accumulation and its defensive role under diverse stress condition in plants: An overview. Pure Appl. Microbiol. 2018, 12, 1655–1659. [Google Scholar] [CrossRef]
  118. Sheetal, K.R.; Singh, S.D.; Anand, A.; Prasad, S. Heavy metal accumulation and effects on growth, biomass and physiological processes in mustard. Ind. J. Plant Physiol. 2016, 21, 219–223. [Google Scholar] [CrossRef]
  119. Zengin, F.K.; Munzuroglu, O. Effects of some heavy metals on content of chlorophyll, proline and some antioxidant chemicals in bean (Phaseolus vulgaris L.) seedlings. Acta Biol. Cracov. Bot. 2005, 47, 157–164. [Google Scholar]
  120. Zhang, H.; Xu, Z.; Guo, K.; Huo, Y.; He, G.; Sun, H.; Guan, Y.; Xu, N.; Yang, W.; Guangyu, S. Toxic effects of heavy metal Cd and Zn on chlorophyll, carotenoid metabolism and photosynthetic function in tobacco leaves revealed by physiological and proteomics analysis. Ecotoxicol. Environ. Saf. 2020, 202, 110856. [Google Scholar] [CrossRef] [PubMed]
  121. Petrovic, D.; Krivokapic, S. The Effect of Cu, Zn, Cd, and Pb Accumulation on Biochemical Parameters (Proline, Chlorophyll) in the Water Caltrop (Trapa natans L.), Lake Skadar, Montenegro. Plants 2020, 9, 1287. [Google Scholar] [CrossRef] [PubMed]
Figure 1. BAF of Cr and Pb in different organs of S. perfoliatum on heavy metal Ps. Error bars represent SE. Different letters (a, b) indicate significant differences (p < 0.05) between plant organs.
Minerals 12 00334 g001
Figure 2. TF of Cr and Pb in different development stages of S. perfoliatum plants grown in heavy metal Ps. Error bars represents SE. Different letters (a, b) indicate significant differences (p < 0.05) between stages.
Minerals 12 00334 g002
Figure 3. RE of Cr and Pb in different development stages of S. perfoliatum grown in heavy metal Ps. Error bars represents SE. Different letters (a, b, c) indicate significant differences (p < 0.05) between stages.
Minerals 12 00334 g003
Figure 4. Cu uptake in S. perfoliatum organs for different development stages when grown in heavy metal Ps and Us. Error bars represent SE. Different letters (a–c) indicate significant differences (p < 0.05) between plant organs.
Minerals 12 00334 g004
Figure 5. Zn uptake in S. perfoliatum organs for different development stages when grown in Us. Error bars represent SE. Different letters (a, b, c) indicate significant differences (p < 0.05) between plant organs.
Minerals 12 00334 g005
Figure 6. Cr uptake in S. perfoliatum organs for different development stages when grown in Ps. Error bars represent SE. Different letters (a–c) indicate significant differences (p < 0.05) between plant organs.
Minerals 12 00334 g006
Figure 7. Pb uptake in S. perfoliatum organs for different development stages when grown in Ps. Error bars represent SE. Different letters (a–c) indicate significant differences (p < 0.05) between plant organs.
Minerals 12 00334 g007
Figure 8. Fresh biomass of S. perfoliatum organs for different development stages when grown in heavy metal Ps and Us. Error bars represent SE. Different letters (a–c) indicate significant differences (p < 0.05) between plant organs.
Minerals 12 00334 g008
Figure 9. Total chlorophyll content (μg cm−2) of S. perfoliatum for different growth stages in Ps and Us. Error bars represents SE. Different letters (a–b) indicate significant differences (p < 0.05) between soils.
Minerals 12 00334 g009
Table 1. Initial mean concentration of heavy metals in soil and reference thresholds.
MetalSoil TypeInitial Concentration (mg kg−1)CfiReference Thresholds
NormalAlertIntervention
CuUs62.81 ± 0.403.1420100250
Ps208.34 ± 3.6510.42
ZnUs296.10 ± 1.107.40100300600
Ps312.47 ± 4.287.81
CrPs186.53 ± 3.4018.6530100300
PbPs195.21 ± 2.326.512050100
(According to the Order 756/1997, Environmental Pollution Assessment Regulation). Cfi —contamination factor index.
Table 2. Cu and Zn concentrations in different development stages of S. perfoliatum plants grown in heavy metal Ps and Us.
MetalSoilStageSoil
(mg kg−1) 13 BBCH15 BBCH18 BBCHMean
CuUs10.44 ± 1.12 b y13.60 ± 1.51 b xy17.88 ± 3.63 b x13.97 ± 1.44 B
Ps31.32 ± 5.32 a y35.05 ± 5.94 a y54.90 ± 8.25 a x40.42 ± 4.19 A
Stage means20.88 ± 3.65 Z24.33 ± 3.95 Y36.39 ± 6.26 X
ZnUs66.56 ± 8.44 a y77.65 ± 11.52 a xy87.64 ± 17.89 a x77.28 ± 7.52 A
Ps46.95 ± 6.51 b y66.21 ± 9.01 b x68.04 ± 9.23 b x60.40 ± 4.99 B
Stage means56.75 ± 5.69 Y71.93 ± 7.23 X77.84 ± 10.05 X
Cu: soil LSD5% = 2.70; growth stage LSD5% = 3.30; soil × growth stage LSD5% = 4.67. Zn: soil LSD5% = 6.72; growth stage LSD5% = 8.24; soil × growth stage LSD5% = 11.65. Data (mg kg−1) represent mean ± SE. Different letters (a, b) in the column indicate significant differences (p < 0.05) between soils. Different superscript letters (x, y) in the row indicate significant differences (p < 0.05) between growth stages. Capital letters were used for comparisons of growth stage means (X, Y, Z) and soil means (A, B).
Table 3. Cu and Zn concentrations in different organs of S. perfoliatum plants grown in heavy metal Ps and Us.
MetalSoilPlant Organ
(mg kg−1) RootPetioleLamina
CuUs12.02 ± 0.86 b y8.59 ± 0.53 b y21.32 ± 2.89 b x
Ps26.12 ± 3.43 a y29.86 ± 2.96 a y65.29 ± 5.87 a x
Plant organ mean19.07 ± 2.42 Z19.22 ± 2.96 Y43.30 ± 6.20 X
ZnUs37.91 ± 2.00 b z74.69 ± 2.43 a y119.25 ± 11.28 a x
Ps60.75 ± 2.26 a y33.69 ± 3.63 b z86.76 ± 6.96 b x
Plant organ mean49.33 ± 3.13 Y54.19 ± 5.40 Y103.00 ± 7.54 X
Cu: plant organ LSD5% = 3.30; soil × plant organ LSD5% = 4.67. Zn: plant organ LSD5% = 8.24; soil × plant organ LSD5% = 11.65. Data (mg kg−1) represent mean ± SE. Different letters (a, b) in the column indicate significant differences (p < 0.05) between soils. Different superscript letters (x, y, z) in the row indicate significant differences (p < 0.05) between plant organs. Capital letters were used for comparisons of plant organ means (X, Y, Z).
Table 4. Cu and Zn concentrations in different plant organs and development stages of S. perfoliatum.
MetalStagePlant Organ
RootPetioleLamina
Cu13 BBCH13.48 ± 1.89 b y15.84 ± 3.89 b y33.32 ± 8.40 b x
15 BBCH18.13 ± 1.67 b y17.16 ± 4.17 b y37.69 ± 9.24 b x
18 BBCH25.60 ± 6.20 a y24.67 ± 6.92 a y58.91 ± 12.72 a x
Zn13 BBCH45.18 ± 5.29 a y48.44 ± 12.11 a y76.64 ± 6.01 c x
15 BBCH49.09 ± 5.57 a y60.26 ± 9.10 a y106.43 ± 7.02 b x
18 BBCH53.71 ± 5.82 a y53.86 ± 7.39 a y125.95 ± 15.75 a x
Cu: stage × plant organ LSD5% = 5.72; Zn: stage × plant organ LSD5% = 14.26. Data (mg kg−1) represent mean ± SE. Different letters (a, b, c) in the column indicate significant differences (p < 0.05) between stages. Different superscript letters (x, y) in the row indicate significant differences (p < 0.05) between plant organs.
Table 5. Cu and Zn concentrations in different organs and development stages of S. perfoliatum plants grown in heavy metal Ps and Us.
MetalSoilUnpolluted
StagePlant Organ
RootPetioleLamina
Cu13 BBCH9.52 ± 0.93 a x7.25 ± 0.55 a x14.55 ± 0.10 b x
15 BBCH14.47 ± 0.64 a xy8.13 ± 0.32 a y18.21 ± 1.01 b x
18 BBCH12.06 ± 1.18 a y10.39 ± 0.56 a y31.20 ± 4.73 a x
SoilPolluted
StagePlant Organ
RootPetioleLamina
13 BBCH17.44 ± 1.15 b y24.42 ± 0.45 b y52.09 ± 2.75 b x
15 BBCH21.79 ± 1.22 b y26.20 ± 2.28 b y57.17 ± 5.95 b x
18 BBCH39.13 ± 0.81 a y38.96 ± 6.79 a y86.61 ± 4.32 a x
MetalSoilUnpolluted
StagePlant Organ
RootPetioleLamina
Zn13 BBCH34.52±3.33 a y75.13±4.35 a x90.02±0.46 c x
15 BBCH36.88±1.87 a z80.16±1.93 a y115.91±4.24 b x
18 BBCH42.34±4.18 a z68.77±3.96 a y151.81±23.38 a x
SoilPolluted
StagePlant Organ
RootPetioleLamina
13 BBCH55.85 ± 3.90 a x21.74 ± 1.06 a y63.26 ± 1.10 b x
15 BBCH61.31 ± 1.46 a y40.37 ± 3.79 a z96.94 ± 11.78 a x
18 BBCH65.08 ± 4.74 a y38.96 ± 5.95 a z100.08 ± 4.99 a x
Cu: soil × stage × plant organ LSD5% = 8.09. Zn: soil × stage × plant organ LSD5% = 20.17. Data (mg kg−1) represent mean ± SE. Different letters (a, b, c) in the column indicate significant differences (p < 0.05) between stages. Different superscript letters (x, y, z) in the row indicate significant differences (p < 0.05) between plant organs.
Table 6. Cr and Pb concentrations in different plant organs and development stages of S. perfoliatum.
MetalStagePlant OrganStage
RootPetioleLaminaMean
Cr13 BBCH18.03 ± 1.57 b y21.55 ± 0.34 a y33.44 ± 0.76 c x24.34 ± 2.39 C
15 BBCH24.19 ± 0.58 ab y29.24 ± 2.60 a y61.89 ± 7.46 b x38.44 ± 6.34 B
18 BBCH31.11 ± 2.26 a y30.21 ± 4.70 a y75.20 ± 3.73 a x45.51 ± 7.65 A
Plant
organ mean
24.44 ± 2.05 Y27.00 ± 2.08 Y56.84 ± 6.62 X
Pb13 BBCH23.74 ± 1.56 a xy17.15 ± 0.63 b y34.92 ± 0.55 b x25.27 ± 2.64 C
15 BBCH27.90 ± 0.59 a y29.85 ± 2.64 a y71.13 ± 8.64 a x42.96 ± 7.52 B
18 BBCH32.88 ± 2.20 a y38.87 ± 6.04 a y81.17 ± 3.88 a x50.97 ± 7.90 A
Plant
rgan
mean
28.17 ± 1.54 Y28.62 ± 3.68 Y62.41 ± 7.54 X
Cr: stage LSD5% = 5.92; plant organ LSD5% = 5.92; stage × plant organ LSD5% = 10.25; Pb: stage LSD5% = 6.80; plant organ LSD5% = 6.80; stage × plant organ LSD5% = 11.78; data (mg kg−1) represent mean ± SE. Different letters (a, b, c) in the column indicate significant differences (p < 0.05) between stages. Different superscript letters (x, y) in the row indicate significant differences (p < 0.05) between plant organs. Capital letters were used for comparison of plant organ means (X, Y) and stage means (A, B, C).
Table 7. BAF of Cu and Zn in different organs of S. perfoliatum plants grown in heavy metal Ps and Us.
MetalSoilPlant OrganSoil
RootPetioleLaminaMean
CuUs3.388 ± 0.105 a y2.919 ± 0.049 a y8.764 ± 0.420 a x5.023 ± 1.018 A
Ps2.161 ± 0.048 b y2.151 ± 0.104 b y4.783 ± 0.076 b x3.032 ± 0.455 B
Plant organ mean2.774 ± 0.319 Y2.535 ± 0.236 Y6.773 ± 1.075 X
ZnUs0.864 ± 0.027 a y1.404 ± 0.026 a y3.099 ± 0.151 a x1.789 ± 0.365 A
Ps0.802 ± 0.018 a y0.480 ± 0.023 b y1.234 ± 0.019 b x0.839 ± 0.114 B
Plant organ mean0.833 ± 0.048 Y0.942 ± 0.212 Y2.166 ± 0.469 X
Cu: soil LSD5% = 0.481; plant organ LSD5% = 0.590; soil × plant organ LSD5% = 0.834. Zn: soil LSD5% = 0.366; plant organ LSD5% = 0.448; soil × plant organ LSD5% = 0.634. Data (mg kg−1) represent mean ± SE. Different letters (a, b) in the column indicate significant differences (p < 0.05) between soils. Different superscript letters (x, y) in the row indicate significant differences (p < 0.05) between plant organs. Capital letters were used for comparisons of plant organ means (X, Y) and soil means (A, B).
Table 8. TF of Cu and Zn in different development stages of S. perfoliatum grown in heavy metal Ps and Us.
MetalSoilStageSoil
13 BBCH15 BBCH18 BBCHMean
CuUs2.318 ± 0.047 b y1.824 ± 0.029 b y3.490 ± 0.148 a x2.544 ± 0.286 B
Ps4.431 ± 0.107 a x3.839 ± 0.098 a xy3.222 ± 0.037 a y3.755 ± 0.222 A
Stage mean3.374 ± 0.500 X2.831 ± 0.473 X3.356 ± 0.224 X
ZnUs4.844 ± 0.098 a x5.342 ± 0.087 a x5.268 ± 0.204 a x5.151 ± 0.234 A
Ps1.540 ± 0.040 b x2.249 ± 0.063 b x2.148 ± 0.030 b x1.979 ± 0.133 B
Stage mean3.192 ± 0.754 X3.795 ± 0.708 X3.708 ± 0.756 X
Cu: soil LSD5% = 0.499; stage LSD5% = 0.612; soil × stage LSD5% = 0.865. Zn: soil LSD5% = 0.586; stage LSD5% = 0.718; soil × stage LSD5% = 1.015. Data (mg kg−1) represent mean ± SE. Different letters (a, b) in the column indicate significant differences (p < 0.05) between soils. Different superscript letters (x, y) in the row indicate significant differences (p < 0.05) between stages. Capital letters were used for comparisons of stage means (X) and soil means (A, B).
Table 9. RE of Cu and Zn in different development stages of S. perfoliatum grown in heavy metal Ps and Us.
MetalSoilStageSoil
13 BBCH15 BBCH18 BBCHMean
CuUs56.81 ± 0.26 a z72.04 ± 0.42 a y94.34 ± 0.18 a x74.39 ± 5.45 B
Ps49.65 ± 0.07 b z58.13 ± 0.14 b y91.31 ± 0.05 b x66.36 ± 6.35 A
Stage mean53.23 ± 1.60 Z65.08 ± 3.12 Y92.08 ± 0.68 X
ZnUs67.54 ± 0.04 a z79.47 ± 0.03 a y83.45 ± 0.09 a x76.82 ± 2.39 A
Ps49.02 ± 0.01 b z67.75 ± 0.04 b y74.05 ± 0.05 b x63.61 ± 3.76 B
Stage mean58.28 ± 4.14 Z73.61 ± 2.62 Y78.75 ± 2.10 X
Cu: soil LSD5% = 0.40; stage LSD5% = 0.49; soil × stage LSD5% = 0.69. Zn: soil LSD5% = 0.09; stage LSD5% = 0.10; soil × stage LSD5% = 0.15. Data (%) represent mean ± SE. Different letters in the column (a, b) indicate significant differences (p < 0.05) between soils. Different superscript letters (x, y, z) in the row indicate significant differences (p < 0.05) between stages. Capital letters were used for comparisons of stage means (X, Y, Z) and soil means (A, B).
Table 10. Free proline content in different development stages of S. perfoliatum plants grown in Ps and Us.
SoilStageSoil
13 BBCH15 BBCH18 BBCHMean
Us1.39 ± 0.14 a x1.34 ± 0.07 b x1.31 ± 0.15 b x1.34 ± 0.09 B
Ps1.41 ± 0.12 a z1.86 ± 0.14 a y1.98 ± 0.15 a x1.75 ± 0.08 A
Stage mean1.40 ± 0.08 Y1.60 ± 0.11 X1.64 ± 0.13 X
Soil LSD5% = 0.06; stage LSD5% = 0.07; soil × stage LSD5% = 0.10. Data (mg g−1) represent mean ± SE. Different letters in the column (a, b) indicate significant differences (p < 0.05) between soils. Different superscript letters (x, y, z) in the row indicate significant differences (p < 0.05) between stages. Capital letters were used for comparisons of stage means (X, Y) and soil means (A, B).
Table 11. Free proline content in different organs of S. perfoliatum plants grown in Ps and Us.
SoilPlant Organ
RootPetioleLamina
Us0.86±0.02 b z1.35±0.03 b y1.82±0.03 b x
Ps1.39±0.04 a z1.72±0.08 a y2.14±0.12 a x
Plant organ mean1.12±0.07 Z1.54±0.08 Y1.98±0.07 X
Plant organ LSD5% = 0.07; soil × plant organ LSD5% = 0.10. Data (mg g−1) represent mean ± SE. Different letters (a, b) in the column indicate significant differences (p < 0.05) between soils. Different superscript letters (x, y, z) in the row indicate significant differences (p < 0.05) between plant organs. Capital letters were used for comparisons of plant organ means (X, Y, Z) comparison.
Table 12. Free proline content in different organs and developmental stages of S. perfoliatum plants grown in Ps and Us.
SoilUnpolluted
StagePlant Organ
RootPetioleLamina
13 BBCH0.88 ± 0.01 a z1.41 ± 0.02 a y1.87 ± 0.02 a x
15 BBCH0.86 ± 0.04 a z1.29 ± 0.03 a y1.86 ± 0.04 a x
18 BBCH0.83 ± 0.04 a z1.36 ± 0.05 a y1.74 ± 0.07 a x
SoilPolluted
StagePlant Organ
RootPetioleLamina
13 BBCH1.25 ± 0.01 b z1.27 ± 0.02 b y1.71 ± 0.05 b x
15 BBCH1.45 ± 0.05 a z1.93 ± 0.04 a y2.20 ± 0.12 a x
18 BBCH1.47 ± 0.05 a z1.95 ± 0.04 a y2.51 ± 0.07 a x
Soil × stage × plant organ LSD5% = 0.17. Data (mg g−1) represent mean ± SE. Different letters (a, b) in the column indicate significant differences (p < 0.05) between stages. Different superscript letters (x, y, z) in the row indicate significant differences (p < 0.05) between plant organs.
Table 13. Pearson correlations between metal concentration and biomass, free proline and chlorophyll content in S. perfoliatum plants grown in Ps and Us.
MetalSoilPlant BiomassFree Proline
Content
Chlorophyll
Content
CuUnpolluted0.887 **−0.3620.392
Polluted0.971 ***0.659−0.518
ZnUnpolluted0.775 *−0.2310.352
Polluted0.790 *0.880 **0.003
CrPolluted0.915 ***0.893 **−0.194
PbPolluted0.902 ***0.887 **−0.197
* Significant at p < 0.05; ** significant at p < 0.01; *** significant at p < 0.001; n = 9.
Table 14. Final mean concentration of heavy metals in soil and reference thresholds (according to Order 756/1997, Environmental Pollution Assessment Regulation).
MetalSoil TypeConcentration
Final (mg kg−1)
CfiReference Thresholds
NormalAlertIntervention
CuUnpolluted3.56 ± 0.080.1820100250
Polluted18.11 ± 0.110.91
ZnUnpolluted48.99 ± 0.281.22100300600
Polluted81.11 ± 0.292.03
CrPolluted25.44 ± 0.182.5430100300
PbPolluted18.22 ± 0.130.612050100
Cfi—contamination factor index.
Publisher’s Note: MDPI stays neutral with regard to jurisdictional claims in published maps and institutional affiliations.

