1. Introduction
Ceramic artifacts are particularly common in archaeological sites as they are generally resistant to alteration and weathering. Therefore, archaeometric analysis on ancient ceramics can provide significant data for reconstructing the cultural and technological development of the context in which they were produced [
1,
2,
3].
Ancient ceramics had different functions: cult objects, decorations, vessels, refractory materials, and building materials [
4,
5].
Between the Archaic and the Late Republican period (7th–1st century BC) in Italy, terracotta (or fired clay) was the main material used for decorating the exterior surfaces of civic and sacred buildings. Painted revetment plaques in terracotta were nailed to facades in stone or wood, and the material was also used to cover ceiling beams or columns. On roofs, terracotta was used for tiles,
antepagmentum, antefixes, and
simas, which often carried lavish figural schemes too. In preparation for painting, but also as a protection against weathering, the upper surfaces of architectural terracottas were usually refined with a fine slip of diluted clay. After air-drying, clay-based colors (essentially colored slips) were applied to the visible surface with brushes. Some pieces also show a thin white slip of clay minerals as a primer for the color layers. After the final firing, the surfaces could be further refined with pigments, dyes, and gold leaf attached with an organic binder. The Italic tradition of using terracotta as a surface material was particularly strong, and it only decreased during the late 1st century BC, when
stucco and marble became predominant [
6].
In this perspective, the present work is the first archaeometric study aimed at reconstructing the technological knowledge reached by the ancient manufacturers of painted ceramic materials (3rd–2nd century BC) collected from the sanctuary of Hercules in the Latin colony of Alba Fucens (Abruzzo, Central Italy) [
7].
The terracottas belong to different phases of the architectural decoration of the sanctuary. The main interest behind this research is the absence of previous archaeometric studies on these ceramics characterized by extraordinary craftmanship. Moreover, such materials are not easily found in archaeological contexts and for this reason their characterization could significantly contribute to reconstruction of the skills and material knowledge of ancient artisans.
The goal of this study was achieved by means of a multi-analytical approach including X-ray Powder Diffraction (XRPD) analysis to investigate the mineralogical composition of terracotta samples and the combination of µ-Raman and portable X-ray fluorescence (pXRF) analysis for the identification of the pigments decorating the ceramics.
2. Archaeological Context
The archaeological area of Alba Fucens, located in the current municipality of Massa d’Albe (Abruzzo, Central Italy), a few kilometers north of the city of Avezzano, preserves the remains of the Latin colony founded by Romans at the end of the 4th century BC [
6].
The toponym Alba comes from the Indo-European root and means “high ground”, while the adjective Fucens is linked to the name of the ancient Fucino lake (in Latin Fūcinus), at that time the third largest lake in Italy. The first work of reclamation of the lake was carried out by the Emperor Claudius (41–52 AD) and the final drainage occurred in the second half of the 19th century [
6].
The central area of the city is occupied by a series of public buildings: the Basilica, the
macellum (market) with
tabernae, the baths, and the sanctuary of Hercules. Other preserved public buildings are the theater and the amphitheater, while the church of St. Peter was built on the temple of Apollo [
7]. The abandonment of the city was gradual and due to several causes. First of all, the violent earthquake that occurred between 484 and 508 AD [
8] followed by floods and colluviums of the plain, along with the decadence of the Roman Empire.
Since 2006, the Soprintendenza for Archaeological Heritage of Abruzzo carried out some excavations in the square of the Sanctuary of Hercules. The excavations brought to light hundreds of fragments of painted terracotta (3rd–2nd century BC), which had been used as filling material below the pavement slabs [
9]. In 2011, the excavations brought to light a large well (1st century BC) where numerous fragments of terracotta have been found [
9,
10]. Four different types of antefixes were identified: (a) with satyr’s head, (b) with head of
maenad, (c) with
potnia (Mediterranean goddess that feeds all beings that inhabit the Earth), and (d) with winged victory.
Besides the antefixes, different types of
antepagmentum and
sime have been brought to light. Although these terracottas are attributable to the presence of a building, no structures have been identified to date referable to it, traced back to the “Etruscan-Italic” model and suggested by the remains of the ceramics found [
9,
10].
3. Geological Context
Alba Fucens was founded on a hill of pre-Pliocene carbonate rocks, Plio-Pleistocene clayey-sandy deposits and carbonate breccias, overlooking the ancient Fucino lake [
7]. This is the largest intramontane basin (20 × 15 km) of the Apennines chain, a fold-and-thrust belt developed during the Alpine orogeny [
11]. The Fucino Basin is surrounded by mountains comprising Triassic-middle Miocene carbonate platform, slope, and ramp sequences. The Plio-Pleistocene and Holocene alluvial fan and lacustrine deposits of the ancient Fucino lake largely cover the carbonate sequences [
11].
The sanctuary of Hercules is located on Pliocene colluvial sediments, above which a thick soil evolved during the Holocene. Peaty levels were found beneath the lake sediments, evidence of stagnant water and the presence of a marshy environment. On the top of the marsh sediments a thin pedogenetic layer is identified, connected to the reclamation of the area before the urbanization. To obtain the floor of the Roman city, it was necessary to fill the lake depression with a considerable thickness of yellow silt-clay and large limestone blocks. The origin of these limestone blocks could be linked to the works at the base of the western flank of the eastern hill (Pettorino) for the building of the theater.
4. Materials and Methods
Thirteen samples (A, 2, C, 4, E, F, G, H, I, L, M, N, O) were selected from different types of architectural elements (slabs, antefixes, and frames), based on macroscopic analysis of the color of the matrix, the abundance and nature of inclusions of terracotta, and decorative pigments.
All these samples were recovered from the large well, except the sample M (
Figure 1) that comes from the square of the Sanctuary.
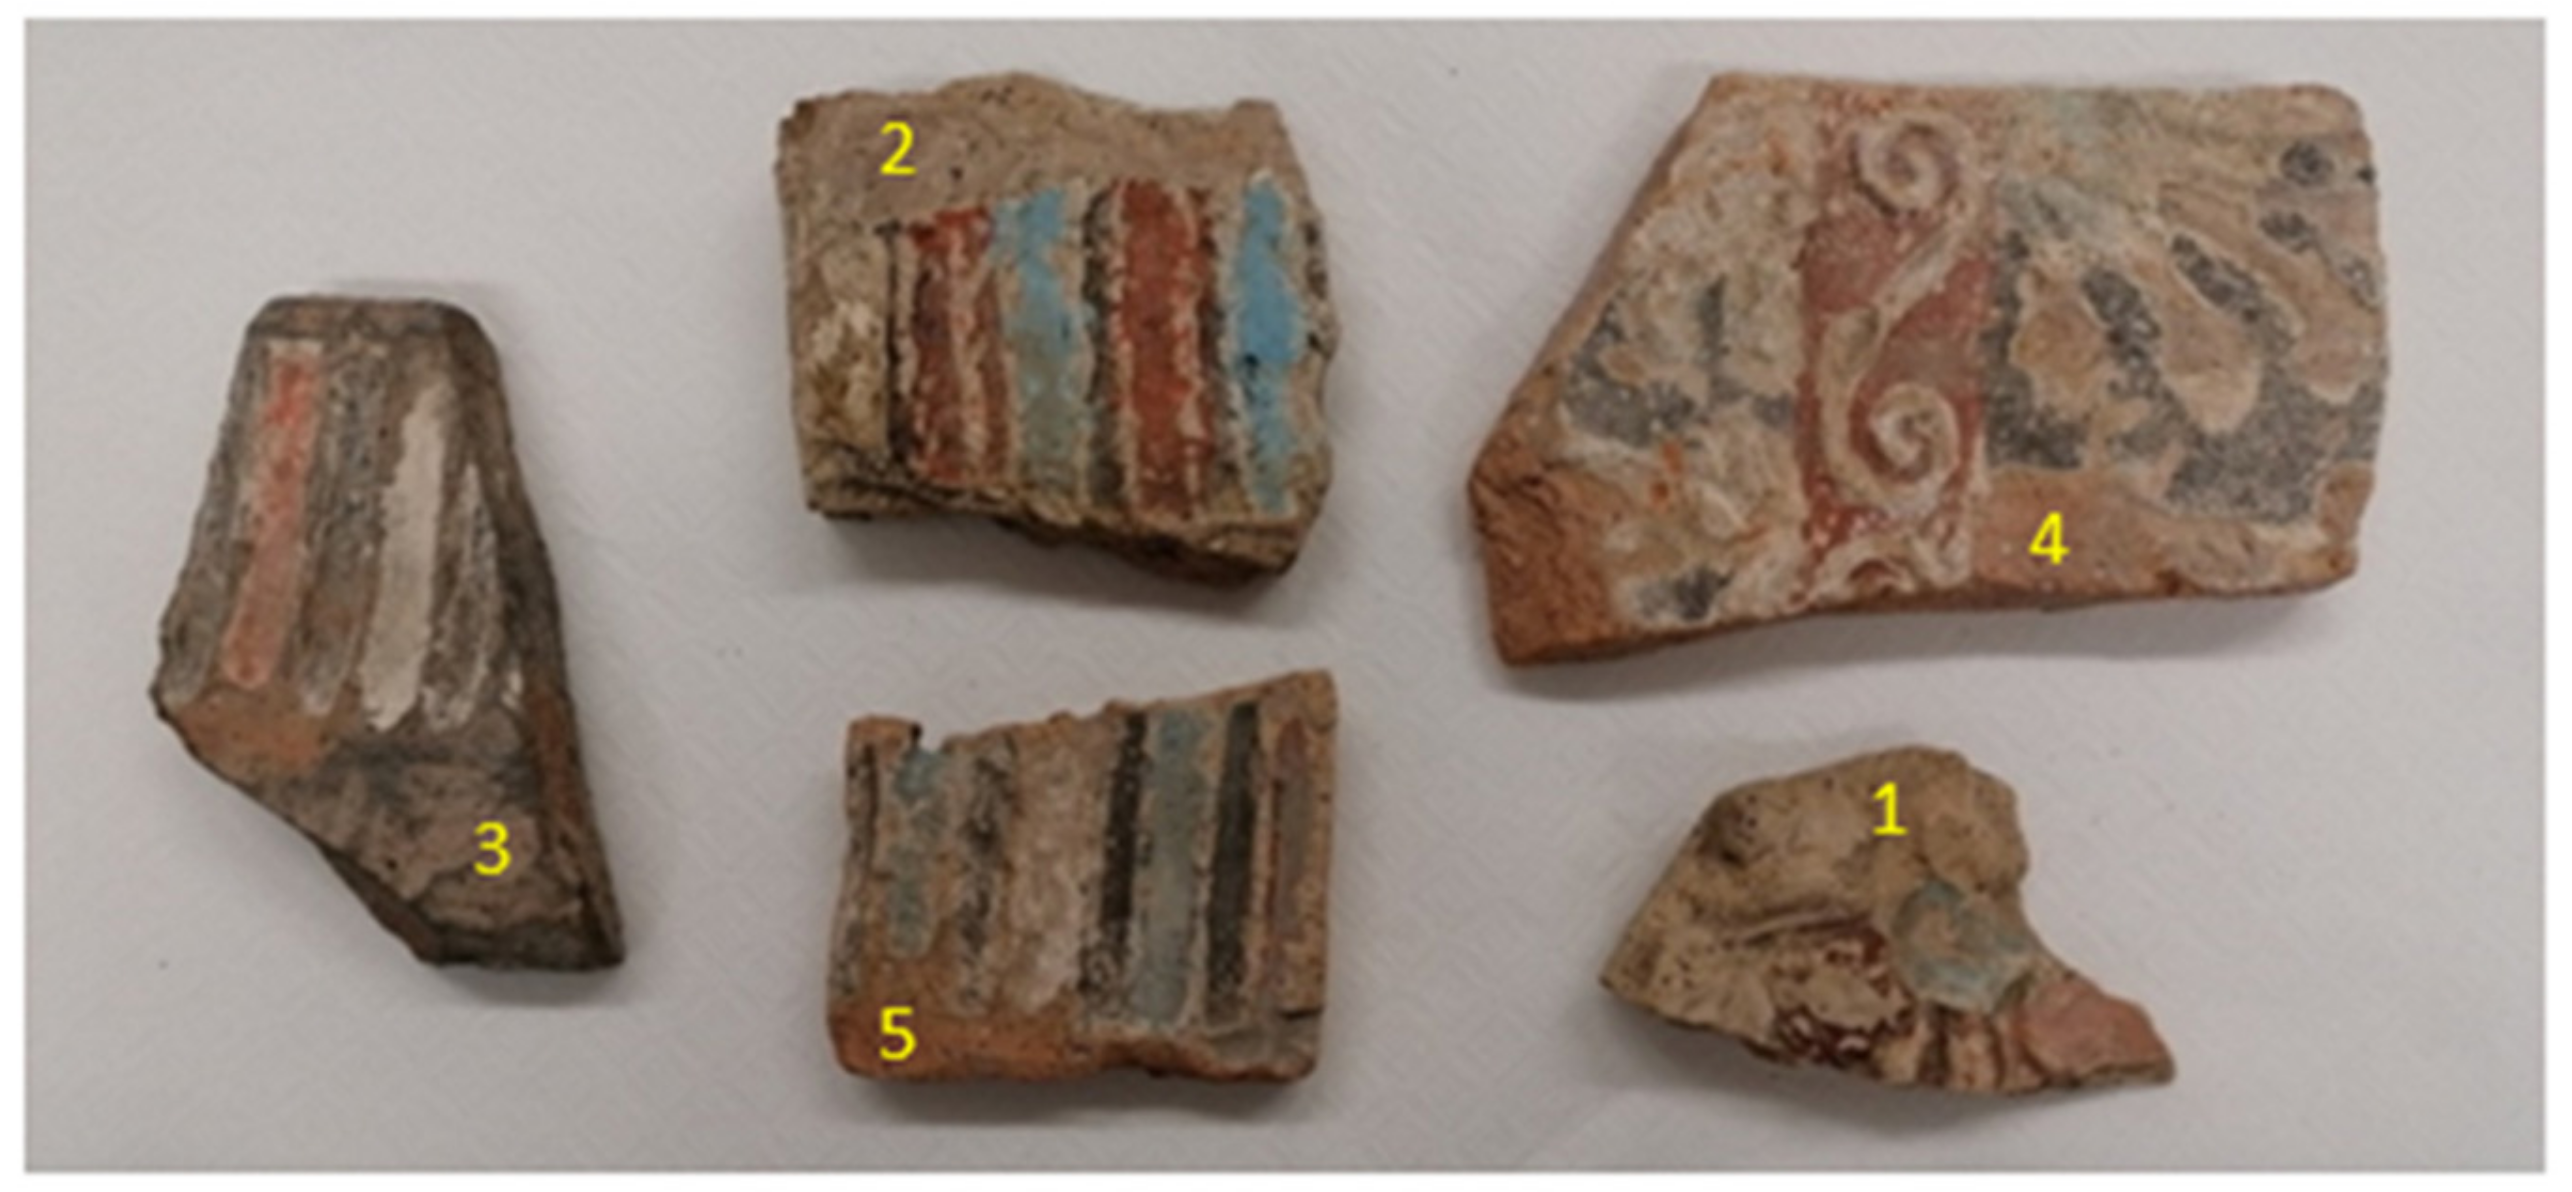
The pigments decorating the terracotta of five selected samples (1, 2, 3, 4, 5) were analyzed by pXRF and μ-Raman (
Figure 2).
The sample 1 comes from the square of the Sanctuary while the remaining ones from the well.
The samples were analyzed by a multi-analytical approach, including portable X-ray fluorescence (pXRF), X-ray powder diffraction (XRPD), and μ-Raman spectroscopy.
For pXRF analysis, a portable X123 Amptek Inc. tool was used to analyze the back and the painted side of the samples. It consists of a cooled thermoelectric detector with an area of 6–25 mm2, resolution between 139 and 260 eV, and FWHM at 5.9 keV, a PC for signal processing, a pulse generator, and an X-ray source Moxtek 10–50 kV Bullet. The spectra were processed with the Winaxil 4.0.1 software. Spectra were normalized, making the ratio of the relative counts of each peak compared to the total counts. pXRF has a small stage, that can scan areas up to 20 × 20 cm2 with a lateral resolution of 1 mm. The focus between the scanning head and sample was set manually with the aid of a laser triangulation system. Spot size was dictated by the X-ray focusing optics chosen (collimator). At about 1 cm from the sample’s surface, it was roughly 2 mm diameter for both tubes.
μ-Raman measurements were performed with a RenishawInVia Raman spectrometer equipped with a 532 nm laser (used for all pigments except pink) and one UV at 355 nm (used for pink pigment) (ICT Laboratory, LFoundry, Avezzano). The instrument uses two gratings, one at 1800 rows/mm (green) and one at 2400 rows/mm (UV). Wtics used were 50× for green and a special NUV 40× lens for UV. The baseline and the background noise were subtracted by the WirETM Software available in Ranishaw Raman instrument [
12].
pXRF data (
Tables S1 and S2) were easily visualized through principal component analysis (PCA), a multivariate technique that summarizes the information of a dataset by means of a smaller set of “summary indices” emphasizing the differences among data [
13]. The intensity of pXRF peaks (X) and the number of samples (N) were arranged in a matrix (N, X). The PCA aims to compress the original hyperspace into a new principal component (PC) space of reduced dimensionality, while retaining as much of the data variation as possible. In general, the PC space contains a total of 2 or 3 principal axes (called score plot) to be easily visualized. A second plot called loadings plot is reported too. The loadings express the magnitude (large or small correlation) and manner (positive or negative correlation) in which the original variables contribute to the scores or PC. In such a plot, high positive correlations are indicated by small angles between vectors, no correlation is indicated by right angles and inverse correlations are indicated by angles close to 180. PCA, ternary diagram, and scatter plot were carried out using algorithms in the JMP Pro software package from SAS Institute [
14].
Finally, a fragment of terracotta from the back of each sample was collected and analyzed by XRPD to determine the mineralogical composition, to estimate firing temperatures, and to infer the provenance of the raw materials. A small part of the sample (about 5–10 mg) was ground with agate mortar and pestle. The ceramic powder was then analyzed using a Bruker D8 focus diffractometer (Department of Earth Sciences, Sapienza University of Rome, Italy) with Cu Kα radiation, operating at 40 kV and 30 mA. The following instrumental set-up was chosen: 3–60° 2θ range, scan step of 0.02° 2θ/2s. Semiquantitative analysis based on the “Reference Intensity Ration Method” was performed using XPowderX© software. The International Centre for Diffraction Data Powder Diffraction Files (ICDD-PDF) were used for the identification of the mineral phases by XRPD.
5. Results
5.1. Ceramic Body
For the ceramic body analysis, XRPD, μ-Raman, and XRF were applied. The last two, the main purpose of which was the pigment analysis, were applied on the ceramic body to better identify the pigment’s spectra peaks.
5.1.1. XRPD Analysis
The XRPD analysis allowed the identification of the minerals that compose the ceramic body. All samples reported in the
Table 1 showed a high content of quartz and the common presence of plagioclase. Only some samples showed the presence of calcite, augitic clinopyroxene, and illitic clay, while muscovite is present only in sample A.
5.1.2. μ-Raman Analysis
The ceramic body of sample 5 was analyzed to investigate the composition of architectural terracottas on which the pigments were applied. The spectrum (
Figure 3g) shows the peaks of quartz (SiO
2) and calcite (CaCO
3). Specifically, quartz was identified thanks to the peak around 470 cm
−1 due to the symmetric bending vibration of Si-O-Si [
15], and calcite because of the peaks at 290 and 1100 cm
−1 connected to the symmetric stretching of the carbonate group [
16].
5.1.3. pXRF Analysis
The pXRF analyses of the matrices of the samples 1, 2, 3, 4, and 5 show high intensity lines, related to Fe (E = 6.40 keV and E = 7.06 keV) and Ca (E = 3.69 keV and E = 4.01 keV) [
17], while Mn, Ti, and Sr are only present in traces (
Table S1).
5.2. Pigments
5.2.1. μ-Raman Analysis
The µ-Raman spectroscopy was used to identify the nature of the different pigments on the surfaces of terracottas (samples 1, 2, 3, 4, and 5). All the pigment spectra were compared to the ceramic body to better identify the characteristic peaks of each pigment.
Sample 1 was used to analyze the pink layer. The first granule analyzed appeared whitish (
Figure 3b) and the relative μ-Raman peaks are characteristic of calcite. The band at about 1086 cm
−1 is associated with the symmetrical stretching of the (CO
3)
2− group, while the band at about 710 cm
−1 is due to the bending vibration of the same group. There is another weaker band, at about 275 cm
−1, linked to the vibration of the lattice [
18]. A second granule analyzed appeared red under the microscope (
Figure 3a), with peaks characteristic of hematite (Fe
2O
3). Specifically, the band at 222 cm
−1 is due to the symmetrical stretching of Fe-O, the band at 410 cm
−1 to the bending vibration of O-Fe-O, while the band at 612 cm
−1 is due to the symmetric bending [
15].
Sample 2 was used to analyze the red pigment. The spectrum (
Figure 3c) shows bands around 275 and 1100 cm
−1, attributed to calcite, whereas those at 222 and 290 cm
−1 were attributed to hematite. The 222 cm
−1 band is due to symmetric Fe-O stretching, while the 290 cm
−1 band is due to symmetric Fe-O bending [
15].
Sample 2 was used also to analyze the light blue layer. The Raman spectrum allowed the identification of Egyptian blue, CaOCuO(SiO
2)
4 [
19,
20] (
Figure 3d). In particular, the peak at 430 cm
−1 is due to the bridging O breathing [
21], that at 475 cm
−1 is related to the stretching and rocking bending of Si-O, whereas the peak at 570 cm
−1 is due to scissoring bending of O-Si-O. Finally, the peaks at 780 and 1084 cm
−1 are connected to the stretching of Si-O [
22].
Sample 3 was used to investigate the white pigment identified on several of the architectural terracottas analyzed. The peaks in the spectrum (
Figure 3e) at about 290, 720, and 1100 cm
−1 are all attributed to calcite [
16].
Sample 4 was analyzed to investigate the black pigment. The spectrum (
Figure 3f) shows the characteristic peaks of amorphous carbon at 1370 and at 1600 cm
−1 [
23].
5.2.2. pXRF Analysis
The chemical composition of the pigments was determined using pXRF analysis.
Pink pigment is only present in sample 1 and it is mainly composed of Ca and Fe. In addition, Sr occurs in traces (
Table S1).
Red pigment occurs in samples 1, 2, 3, 4, and 5. The main chemical components are Fe and Ca, except for sample 5 which also shows the presence of Cu. In addition, in some of these samples Mn, Ti, Cu, and Pb were identified in traces (
Table S1).
The light blue pigment is present in samples 1, 2, 4, and 5. It contains mainly Cu and Ca. In addition, Fe, Pb, Sr, and Mn are identified in traces (
Table S1).
White pigment is present in samples 2, 3, 4, and 5. The main constituent present in all samples is Ca. Fe is present as the main component in sample 5, while in the other samples it is present only in traces. Sample 2 only shows traces of As (
Table S1). The As could be related to the proximity of the sample to a wooden object restored and protected with compounds containing As or from the presence of burying soil traces on the surface of the analyzed pigment.
The black pigment is present in samples 2, 3, and 4. The main constituents of this pigment are Ca and Fe. In addition, in some samples, traces of Mn, Pb, and Cu were also identified (
Table S1).
6. Discussion
6.1. The Terracotta: Production Technology and Provenance
For the first time a detailed mineralogical characterization of the architectural ceramic materials from the Sanctuary of Hercules in Alba Fucens has been carried out.
Two terracotta samples (F and O) showed a greyish color of the matrix whereas the others were mainly reddish. Red and brown colors are usually associated to an oxidizing atmosphere of firing, whereas firing in reducing conditions generally results in the grey color of the ceramics [
24].
The XRPD analysis allowed the identification of the minerals constituting the ceramic body and then to estimate the firing temperature. All studied samples contain quartz and plagioclase, while only some of them show the presence of calcite, augite, and illite. Muscovite is only present in sample A (
Table 1). The presence of illite and calcite suggests a firing temperature of the clays below about 800 °C [
25]. Among the clayey minerals, in fact, kaolinite is the first to destabilize due to dehydration, below 550 °C, followed by illite, chlorite, and smectite that are dehydrated at a temperature between 459 and 900 °C [
26]. At higher temperature, around 850–950 °C [
27,
28], carbonate-free CaO reacts with silica and alumina from the degradation of clayey minerals, resulting in the formation of calcium silicates or aluminum and calcium silicates, such as gehlenite, diopside, and wollastonite [
29,
30,
31].
A further confirmation of the low firing temperature is the absence of neo-formation phases such as gehlenite and diopside in the terracotta matrix [
26]. Indeed, gehlenite is formed from about 850 °C and remains stable up to 1100 °C [
26]. The diopside, on the other hand, begins to enucleate at about 900 °C and it remains stable up to 1100 °C [
26]. The absence of these mineral phases in the analyzed samples allows to suppose a firing temperature lower than about 800 °C. The presence of illite-muscovite and the scarce presence of plagioclase further supports this hypothesis.
The presence of augite can be related to the numerous volcanoclastic levels intercalated in the lake and alluvial deposits of the Fucino Basin. The archaeometric analyses carried out in this work support the hypothesis of a local origin of the raw materials as in the Fucino area, alluvial and lake deposits (rich in clay) are the main outcropping lithologies [
11].
The pXRF spectra of the ceramic body show similar chemical composition for all the analyzed samples (1, 2, 3, 4, and 5), with high Fe and Ca contents. A similar pXRF pattern seems to suggest similar starting raw materials used for the realization of the architectural elements. The homogeneity of the analyzed matrices is further reinforced by the PCA elaboration of pXRF data [
13] that shows all the samples within the “ellipse score” at 95% confidence limit (CL at 2σ) (
Figure 4). For this reason, the mean value of the elements of all the analyzed samples (Average Matrix) was used for comparison between the peaks of the colored pigments and those of the matrices (
Table S2).
The ceramic body µ-Raman spectroscopy analysis showed the presence of quartz and calcite (
Figure 3g), confirming the results of XRPD (
Table 1). The Fe component (presumably its oxide), highlighted by the pXRF analysis, was not identified by the XRPD, most likely due to a low concentration below the instrument detection limit, nor by µ-Raman analysis, most likely because of the difficulty in locating granules within the matrix.
6.2. The Pigments: Identification of Pigments’ Palette
The red pigments analyzed on all the surfaces of architectural terracotta by pXRF show similar chemical composition, with the exception of sample 3. The majority of samples, located in the 2nd square of PCA plot (
Figure 5A) (explaining more than 60% of data variability), are characterized by a consistent component of Fe (
Figure 5A,B). On the contrary, sample 3 is closer to the pink of sample 1, influenced by a high content of Ca and a low content of Fe. The ternary diagram Ca-Fe-Cu (
Figure 5C) further confirms that the red pigment of sample 3 has a chemical composition much closer to pink, black, and white, than to the other reds. This pigment, in fact, shows a higher amount of Ca than the others and a minor component of Fe.
The µ-Raman analysis confirmed the presence of calcite and hematite in the red analyzed samples. Unfortunately, in the absence of a stratigraphic analysis of the pigment, it is impossible to determine whether calcite was mixed with hematite, or it was related to a preparation layer. However, it should be noted that the architectural terracottas were sometimes coated with a relatively thick white layer that was used as a background to obtain a brighter and more nuanced polychromy [
32]. The presence of Pb in traces in almost all pigments analyzed with pXRF technique could reinforce the hypothesis of a coat with an additional white pigment based on Pb.
All pigments analyzed in this study, except for light blue, are placed along a straight line in the Fe-Ca plane (
Figure 6). Red pigments tend to have an excess of Fe compared to Ca, while in the white and black pigments the Ca becomes predominant at the expense of Fe as expected. Light blue pigment forms a cluster outside the line because of its Cu nature.
The Fe/Mn ratio gives an idea of the mixture of iron oxides and manganese oxides used to obtain different shading of the color by the artist. The red pigments, in fact, show the presence of Mn with different ratios, most likely due to the artist’s desire to darken the shade of red, given by the mixture of calcite and hematite. An example is the red pigment of sample 5, which has a Fe/Mn = 31 [
33] (
Table S3).
The white pigments result very similar to each other and to the black and pink pigments (
Figure 5A,B), as confirmed by the ternary diagram Ca-Fe-Cu (
Figure 5C). The main constituent of the white pigment is Ca, linked to calcite, whose presence has also been confirmed by μ-Raman spectra (
Figure 3e). The presence of Fe most likely is due to the clay matrix. In addition, Pb is present, although at limited concentrations, which would allow hypothesizing the use of a mixture of white lime and white lead. Only the white pigment of sample 3 showed traces of Cu, which may suggest the artist’s possible intention to obtain different color tones [
34].
The black pigments show a homogeneous nature (
Figure 5A), mainly composed of Ca (
Table S1) and amorphous carbon (
Figure 3f). The presence of Ca contents higher than in red pigments and in the ceramic matrix seems to indicate that the black pigment is of animal origin. However, the presence of Ca could also derive from the underlying matrix, and therefore it cannot be excluded at all that the black is of vegetable origin. Comparing the Fe/Mn ratio of the three samples, a low Mn content in the pigment of sample 4 was found, compared to those of samples 2 and 3. Again, the lower Mn content of sample 4 could indicate a different shading of black voluntarily obtained by the artist [
33] (
Table S1). Traces of Cu (samples 2 and 3) could suggest the use of Egyptian blue pigment, probably to give different shades to the black. The presence of Pb may be linked to the presence of a layer of white lead below the pigment, as discussed above.
The difference in the sample 2 pigment is clearly visible in
Table S1 because of a higher percentage of Cu with respect to Ca and the higher Fe contents with respect to the Mn (~50 vs. ~15). It is worth noting the presence of small amounts of Zn in the pigments of samples 1 and 4. Deviations from the ideal compositions of the Egyptian blue, in general, may be due to inclusions present in the source material or from the matrix in which the pigment was incorporated. This often results in additional elements in the compositional analysis such as Na, K, Mg, Al, Fe, Ti, and Zn [
35].
The analyzed pink pigment is only present in sample 1. The µ-Raman analysis showed the presence of calcite and hematite (
Figure 3a) confirmed by the identification of Ca and Fe in the pXRF spectrum (
Table S1). The ratio Ca/Fe = 1.3 of the pink pigment, when compared to the matrix equal to Ca/Fe = 0.17, allows to hypothesize that it may be a color of earth (clay) with a higher content of Ca than that of terracotta. As there is the possibility of the use by ancient manufacturers of a white layer of calcite to cover the terracotta before painting, it is not excluded that the pink pigment was obtained from the combination of calcite and hematite, laid on the layer of calcite. Unfortunately, since a stratigraphic analysis of the sample is not available, it is impossible to determine the presence of calcite below the pink pigment. The elemental composition of the pink color is very similar to that of the red pigment of sample 3 (
Figure 5A). Both colors have a Ca/Fe ratio greater than 1, while the red pigments have a value well below 1. This leads to the conclusion that the red of sample 3 attributed on the basis of a visual analysis, is to be considered a lighter red pigment, tending to pink, compared to other red pigments.
7. Conclusions
This first archaeometric study of painted architectural terracotta, dating back to the 3rd–2nd century BC, from the archaeological site of Alba Fucens (Italy, L’Aquila), allowed the identification of the production technologies, the provenance, and the nature of pigments used.
The studied materials are characterized by a good manufacture, probably coming from an Etruscan-Italic temple, built immediately after the establishment of the colony. The analytical results of this study highlighted the use of valuable pigments such as Egyptian blue. The other analyzed pigments confirmed the use of a palette typical of the Roman period from the 3rd century BC to the 1st century BC. The red pigment was obtained by using hematite, the hue of which was modified using lime white and perhaps also white lead. Regarding the black pigment, the analytical results did not allow to determine its origin (animal or vegetable). Despite the few colors used, it was noted that for the same color different shading was used. In the case of Egyptian blue, for example, we can see how the artist went from a bright shade to an opaquer one, by modulating the Egyptian blue with white (white lead or calcite) or black (manganese oxide).
The analysis of terracotta showed a firing temperature lower than 800 °C, due to the presence of illite-calcite and the absence of neoformation phases such as gehlenite and diopside. The presence of augite is related to the numerous volcanoclastic levels intercalated in the lacustrine and alluvial deposits of the Fucino Basin. The archaeometric analyses, conducted in this study, allow the suggestion of a local origin of the raw materials, since alluvial and lake deposits (rich in clay) are the main lithologies emerging in the Fucino area. However, more in-depth analyses are needed to establish the source.
Finally, μ-Raman and pXRF analyses seem to indicate the presence of a white layer of calcite and lead as primers before applying the pigments, even though a stratigraphic analysis of the pictorial layer of terracotta is essential to confirm it.
The preliminary results of this study are part of a larger project and will be validated hereafter.
Supplementary Materials
The following are available online at
https://www.mdpi.com/article/10.3390/min12030346/s1, Table S1: pXRF counts (%) for all pigments of samples 1–5, Table S2: pXRF counts (%) for all ceramic bodies of samples 1–5, Table S3: pXRF counts (%) of Mn and Fe for red pigments.
Author Contributions
Conceptualization, G.R., E.C., L.M. and S.M.; formal analysis, G.R.; investigation, E.C., L.M. and S.M.; data curation, G.R., A.M.C., C.D.V., L.M. and S.M.; writing—original draft preparation, G.R. and E.C.; writing—review and editing, A.M.C., C.D.V., L.M. and S.M.; visualization, G.R.; supervision, L.M. and S.M. All authors have read and agreed to the published version of the manuscript.
Funding
This research was funded by Sapienza University of Rome, grant number 000047_18.
Data Availability Statement
Acknowledgments
The authors would like to thank the anonymous reviewers for their constructive comments and suggestions. The authors thank the “MUSÉ-Nuovo Museo Paludi di Celano-Centro di restauro” for having made available the terracottas analyzed in this work, Stefania Montanaro for the sampling of materials analyzed with XRPD, and the company LFoundry of Avezzano for their cooperation in μ-Raman analysis. Finally, we are grateful to Stefano Ridolfi for having made available the portable instrumentation XRF of Ars Mensurae laboratory.
Conflicts of Interest
The authors declare no conflict of interest.
References
- Padeletti, G.; Fermo, P. A scientific approach to the attribution problem of renaissance ceramic productions based on chemical and mineralogical markers. Appl. Phys. A 2010, 100, 771–784. [Google Scholar] [CrossRef]
- Medeghini, L.; Mignardi, S.; De Vito, C.; Macro, N.; D’Andrea, M.; Richard, S. New insights on Early Bronze Age IV pottery production and consumption in the southern Levant: The case of Khirbat Iskandar, Jordan. Ceram. Int. 2016, 42, 18991–19005. [Google Scholar] [CrossRef]
- Giannossa, L.C.; Acquaviva, M.; De Benedetto, G.E.; Acquafredda, P.; Laviano, R.; Mangone, A. Methodology of a combined approach: Analytical techniques to identify the technology and raw materials used in thin-walled pottery from Herculaneum and Pompeii. Anal. Methods 2014, 6, 3490–3499. [Google Scholar] [CrossRef]
- Tite, M.S. Ceramic production, provenance and use—A review. Archaeometry 2008, 50, 216–231. [Google Scholar] [CrossRef]
- De Vito, C.; Medeghini, L.; Mignardi, S.; Ballirano, P.; Peyronel, L. Technological fingerprints of the early Bronze Age clay figurines from tell Mardikh-Ebla (Syria). J. Eur. Ceram. Soc. 2015, 35, 3743–3754. [Google Scholar] [CrossRef]
- Zink, S. Polychromy, architectural, Greek and Roman. In Oxford Classical Dictionary; Goldberg, S., Ed.; Oxford University Press: New York, NY, USA, 2019; Available online: http://oxfordre.com/classics (accessed on 4 January 2022).
- Ceccaroni, E. La colonia latina. In Poco Grano, Molti Frutti. Cinquant’Anni di Archeologia ad Alba Fucens; Campanelli, A., Strazzulla, M.J., Galadini, F., Eds.; Synapsi: Sulmona, Italy, 2006; pp. 57–65. [Google Scholar]
- Galadini, F.; Ceccaroni, E.; Falcucci, E. Archaeoseismological evidence of a disruptive Late Antique earthquakeat Alba Fucens (central Italy). Boll. Geofis. Teor. Appl. 2010, 51, 143–161. [Google Scholar]
- Liberatore, D. Alba Fucens. Il santuario di Ercole (scavi 2006–2009). Quad. Archeol. D’Abruzzo 2009, 1, 214–220. [Google Scholar]
- Ceccaroni, E. Alba Fucens: Gli interventi della Soprintendenza per i Beni Archeologici dell’Abruzzo nell’isolato di via del Miliario e nel piazzale del Santuario di Ercole. Atti Pontif. Accad. Romana Archeol. III Rend. 2014, 85, 245–277. [Google Scholar]
- Cavinato, G.P.; Carusi, C.; Dall’Asta, M.; Miccadei, E.; Piacentini, T. Sedimentary and tectonic evolution of Plio-Pleistocene alluvial and lacustrine deposits of Fucino Basin (central Italy). Sedim. Geol. 2002, 148, 29–59. [Google Scholar] [CrossRef]
- Ranishaw Applay Innovation™. Available online: https://www.renishaw.com/en/automatic-intelligent-background-removal--25934 (accessed on 25 February 2022).
- Holakhooei, P.; Tessari, U.; Verde, M.; Vaccaro, C. A new look at XRD patterns of archaeological ceramic bodies. J. Therm. Anal. Calorim. 2014, 118, 165–176. [Google Scholar] [CrossRef]
- JMP Statistical Discovery. Available online: https://www.jmp.com/it_it/home.html (accessed on 22 January 2022).
- Olivares, M.; Zuluaga, M.C.; Ortega, L.A.; Murelaga, X.; Alonso-Olazabal, A.; Urteaga, M.; Amundaray, L.; Alonso-Martina, I.; Etxebarriaa, N. Characterisation of fine wall and eggshell Roman pottery by Raman spectroscopy. J. Raman Spectrosc. 2010, 41, 1543–1549. [Google Scholar] [CrossRef]
- Sánchez-Pastor, N.; Oehlerich, M.; Astilleros, J.M.; Kaliwoda, M.; Mayr, C.C.; Fernández-Díaz, L.; Schmahl, W.W. Crystallization of ikaite and its pseudomorphic transformation into calcite: Raman spectroscopy evidence. Geochim. Cosmochim. Acta 2016, 175, 271–281. [Google Scholar] [CrossRef] [Green Version]
- Zava, A. Analisi Elementale Non Distruttiva di Campioni di Interesse Storico con Tecniche di Spettroscopia XRF. Bachelor’s Thesis, Università degli Studi di Padova, Padova, Italy, 2016/2017. [Google Scholar]
- De Carlo, T.M. Characterizing coral skeleton mineralogy with Raman spectroscopy. Nat. Commun. 2018, 9, 5325. [Google Scholar] [CrossRef] [PubMed]
- Baraldi, P.; Bondioli, F.; Fagnano, C.; Ferrari, A.; Tinti, A.; Vinella, M. Study of the vibrational spectrum of cuprorivaite. Ann. Chim. 2001, 91, 679–692. [Google Scholar] [PubMed]
- Pagès-Camagna, S.; Colinart, S.; Coupry, C. Fabrication processes of archaeological Egyptian blue and green pigments enlightened by Raman microscopy and scanning electron microscopy. J. Raman Spectrosc. 1999, 30, 313–317. [Google Scholar] [CrossRef]
- Gagliano Candela, R.; Lombardi, L.; Ciccola, A.; Serafini, I.; Bianco, A.; Postorino, P.; Pellegrino, L.; Bruno, M. Deepening inside the pictorial layers of Etruscan sarcophagus of Hasti Afunei: An innovative micro-sampling technique for Raman/SERS analyses. Molecules 2019, 24, 3403. [Google Scholar] [CrossRef] [PubMed] [Green Version]
- Bordignon, F.; Postorino, P.; Dore, P.; Trojsi, G. Raman identification of green and blue pigments in Etruscan polychromes on architectural terracotta panels. J. Raman Spectrosc. 2007, 38, 255–259. [Google Scholar] [CrossRef]
- Tomasini, E.P.; Halac, E.B.; Reinoso, M.; Di Liscia, E.J.; Maier, M.S. Micro-Raman spectroscopy of carbon-based black pigments. J. Raman Spectrosc. 2012, 43, 1671–1675. [Google Scholar] [CrossRef]
- Rathossi, C.; Pontikes, Y. Effect of firing temperature and atmosphere on ceramics made of NW Peloponnese clay sediments. Part I: Reaction paths, crystalline phases, microstructure and colour. J. Eur. Ceram. Soc. 2010, 30, 1841–1851. [Google Scholar] [CrossRef]
- Jordan, M.M.; Sanfeliu, T.; de la Fuente, C. Firing transformations of Tertiary clays used in the manufacturing of ceramic tile bodies. Appl. Clay Sci. 2001, 20, 87–95. [Google Scholar] [CrossRef]
- Guarino, V.; De Bonis, A.; Faga, I.; Giampaola, D.; Grifa, C.; Langella, A.; Liuzza, V.; Pierbon Benoit, R.; Romano, P.; Morra, V. Production and circulation of thin walled pottery from the Roman port of Neapolis, Campania (Italy). Period. Mineral. 2016, 85, 95–114. [Google Scholar]
- Riccardi, M.P.; Messiga, B.; Duminuco, P. An approach to the dynamics of clay firing. Appl. Clay Sci. 1999, 15, 393–409. [Google Scholar] [CrossRef]
- Trindade, M.J.; Dias, M.I.; Coroado, J.; Rocha, F. Mineralogical transformations of calcareous rich clays with firing: A comparative study between calcite and dolomite rich clays from Algarve, Portugal. Appl. Clay Sci. 2009, 42, 345–355. [Google Scholar] [CrossRef]
- Aras, A. The change of phase composition in kaolinite and illite-rich clay-based ceramic bodies. Appl. Clay Sci. 2004, 24, 257–269. [Google Scholar] [CrossRef]
- Barone, G.; Crupi, V.; Longo, F.; Majolino, D.; Mazzoleni, P.; Tanasi, D.; Venuti, V. FT-IR spectroscopic analysis to study the firing processes of prehistoric ceramics. J. Mol. Struct. 2011, 993, 147–150. [Google Scholar] [CrossRef]
- Raneri, S.; Barone, G.; Mazzoleni, P.; Tanasi, D.; Costa, E. Mobility of men versus mobility of goods: Archaeometric characterization of Middle Bronze Age pottery in Malta and Sicily (15th–13th century BC). Period. Mineral. 2015, 84, 23–44. [Google Scholar]
- Baccheschi, E.; Dufour Bozzo, C.; Franchini Guelfi, F.; Gallo Colonni, G.; Gavazza, E.; Giubbini, G.; Leva Pistoi, M.; Parma Armani, E.; Pesenti, F.R.; Sborgi, F. La lavorazione delle terre. In Le Tecniche Artistiche; Maltese, C., Ed.; Mursia: Milano, Italy, 2016; pp. 101–102. [Google Scholar]
- Marchiafava, V.; Luzzatto, L. Colore e Colorimetria. Contributi Multidisciplinari; Gruppo del Colore—Associazione Italiana Colore: Milano, Italy, 2019. [Google Scholar]
- Aliatis, I.; Bersani, D.; Campani, E.; Casoli, A.; Lottici, P.P.; Mantovan, S.; Marino, I.G. Pigments used in Roman wall paintings in the Vesuvian area. J. Raman Spectrosc. 2010, 41, 1537–1542. [Google Scholar] [CrossRef]
- Wiedemann, H.G.; Berke, H. Chemical and physical investigations of Egyptian and Chinese blue and purple. In The Polychromy of Antique Sculptures and the Terracotta Army of the First Chinese Emperor. Studies of Materials, Techniques and Conservation, Proceedings of the International Conference in Xi’an, China, 22–28 March 1999; Yonggi, W., Tinghao, Z., Petzet, M., Emmerling, E., Blansdorf, C., Eds.; UNESCO International Council on Monuments and Sites: Paris, France, 2001; pp. 154–171. [Google Scholar]
| Publisher’s Note: MDPI stays neutral with regard to jurisdictional claims in published maps and institutional affiliations. |
© 2022 by the authors. Licensee MDPI, Basel, Switzerland. This article is an open access article distributed under the terms and conditions of the Creative Commons Attribution (CC BY) license (https://creativecommons.org/licenses/by/4.0/).


 ,
, 


