Article

The Distribution of Gas Components within a Shale System and Its Implication for Migration

1
State Key Laboratory of Shale Oil and Gas Enrichment Mechanisms and Effective Development, Beijing 102206, China
2
Sinopec Key Laboratory of Shale Oil/Gas Exploration and Production Technology, Beijing 102206, China
3
School of Petroleum Engineering and Environmental Engineering, Yan An University, Yan’an 716000, China
*
Author to whom correspondence should be addressed.
Minerals 2022, 12(4), 397; https://doi.org/10.3390/min12040397
Submission received: 15 February 2022 / Revised: 20 March 2022 / Accepted: 22 March 2022 / Published: 24 March 2022

Abstract

:
Experimental studies on the desorption and adsorption of shale are conducted extensively and used for in-depth research on shale gas components and isotopic components. However, there is little systematic research aimed at a given shale stratum. This study takes the Chang-7 shale of the YC23 Well in the Ordos Basin as the research object, and attempts to obtain a full understanding of the distribution characteristics of different gas components, and to explore the migration ability of different gas components. In this study, Chang-7 shale gas in Well YC23 can be sorted into three categories: generated gas, retained gas and accumulated gas. Geochemical parameters including TOC, S1 and S2 are used to evaluate the generated gas, and the fractionation of hydrocarbon components is used to distinguish retained gas and migrated gas. The fractionation of non-hydrocarbon components as well as carbon isotopes is also analyzed and discussed. This study confirms that shale gas in different locations has unique gas components due to gas migration.

1. Introduction

The successful development of shale gas has led to a better understanding of the adsorption of gas in shale by geologists. In some shale gas-producing areas, the high content of adsorbed gas has ensured the stable production of shale gas; indeed, some wells have been producing shale gas for more than 30 years. Thus, desorption experiments and adsorption experiments on shale are used extensively for in-depth research on shale gas components and isotopic components. Progress in the research on shale gas has been achieved by using the gas composition and isotopic composition as follows: (1) to evaluate the shale gas content—the methods for calculating lost gas are established, including calculating lost gas by combining the test results and gas diffusion theory, the United States Bureau of Mines (USBM) method and the polygonal curve fitting method [1,2,3,4]; (2) to explore the origins of shale gas—the origins of shale gas include biogenesis, thermogenesis, high-temperature pyrolysis, and mixed origins [4,5]; (3) to explore the migration ability of different gas components—due to the differences in the adsorption of mineral particles and kerogen and the dissolving of oil and water, hydrocarbon gases and non-hydrocarbon gases in the shale system show wide variations in migration ability [6,7,8,9,10]; (4) to explore the state of shale gas—the three gas states including the adsorbed state, free state and dissolved state have been studied and the corresponding calculation models are established [6,7,11,12]; and (5) to explore the evolutionary characteristics of shale gas in the geological periods—based on the geological conditions such as temperature and pressure, a dynamic simulation is carried out to assess the gas content and gas state [7,8,13].
Although studies focused on the migration ability of gas components have been done in recent years, there are few systematic studies aimed at a given shale stratum. In fact, the lacustrine shale system has strong heterogeneity, and it is easy to differentiate the shale gas components. A large number of studies have confirmed that sandy laminae and thin sandstone are highly developed within shale systems, and there is extensive organic heterogeneity (organic abundance, organic type, etc.) and reservoir heterogeneity (organic pore, inorganic pore, pore size, porosity and permeability) [14,15,16,17,18,19,20]. Taking the Chang-7 shale (Chang-7 Member of Triassic Yanchang Formation) of the YC23 Well in the Ordos Basin as the research object, this study attempts to obtain a full understanding of the distribution characteristics of different gas components, to explore the migration ability of different gas components, and to explain the accumulation characteristics of shale gas.
In 2011, the first vertical shale gas well in the Ordos Basin, the Liuping 177 well, penetrated Chang-7 shale and produced shale gas with a daily production rate of 700–1500 m3/day. Since then, dozens of horizontal wells have been drilled and evaluated. However, the shale gas production was far less than expected and new drilling has essentially stopped. Most of the geologists believe that the low thermal maturity of Chang-7 shale, which is only in the oil generation window, is the primary reason for the poor shale gas resources. However, the high organic abundance of Chang-7 shale is suitable for carrying out the gas desorption and related experiments. Thus, the exploration and development of shale gas in the Ordos Basin has promoted the scientific research on shale gas.

2. Geological Background

The Ordos Basin is the second largest basin in China and covers an area of 37 × 104 km2 [11]. The basin is located west of the North China Platform and is bounded by the Qilian–Qinling collision zone in the southwest, the Liupanshan Basin in the west, the Alashan Platform in the northwest, the Hetao Graben in the north, the Luliang Uplift in the east, and the Fenwei Graben in the south (Figure 1) [20,21]. In the central-southern part of the Ordos Basin, the Triassic Yanchang Formation, which contains 10 members (i.e., Chang-1, Chang-2, ····, Chang-9, Chang-10), was deposited in a lacustrine environment. The organic-rich shale is developed within the Chang-7 and Chang-9 members. The Chang-7 Member, with the Chang-71, Chang-72, and Chang-73 sub-layers, contains 20-200 m (65-650 ft) thick shale. As most of the shale deposits are within Chang-72 and Chang-73 sub-layers, the commonly named Chang-7 shale represents Chang-72 shale and Chang-73 shale. The Chang-7 shale has a shallow burial depth of 700–2400 m (2300–7800 ft), and high organic abundance, with an average TOC of more than 3.8% [22,23].

3. Sampling and Experiments

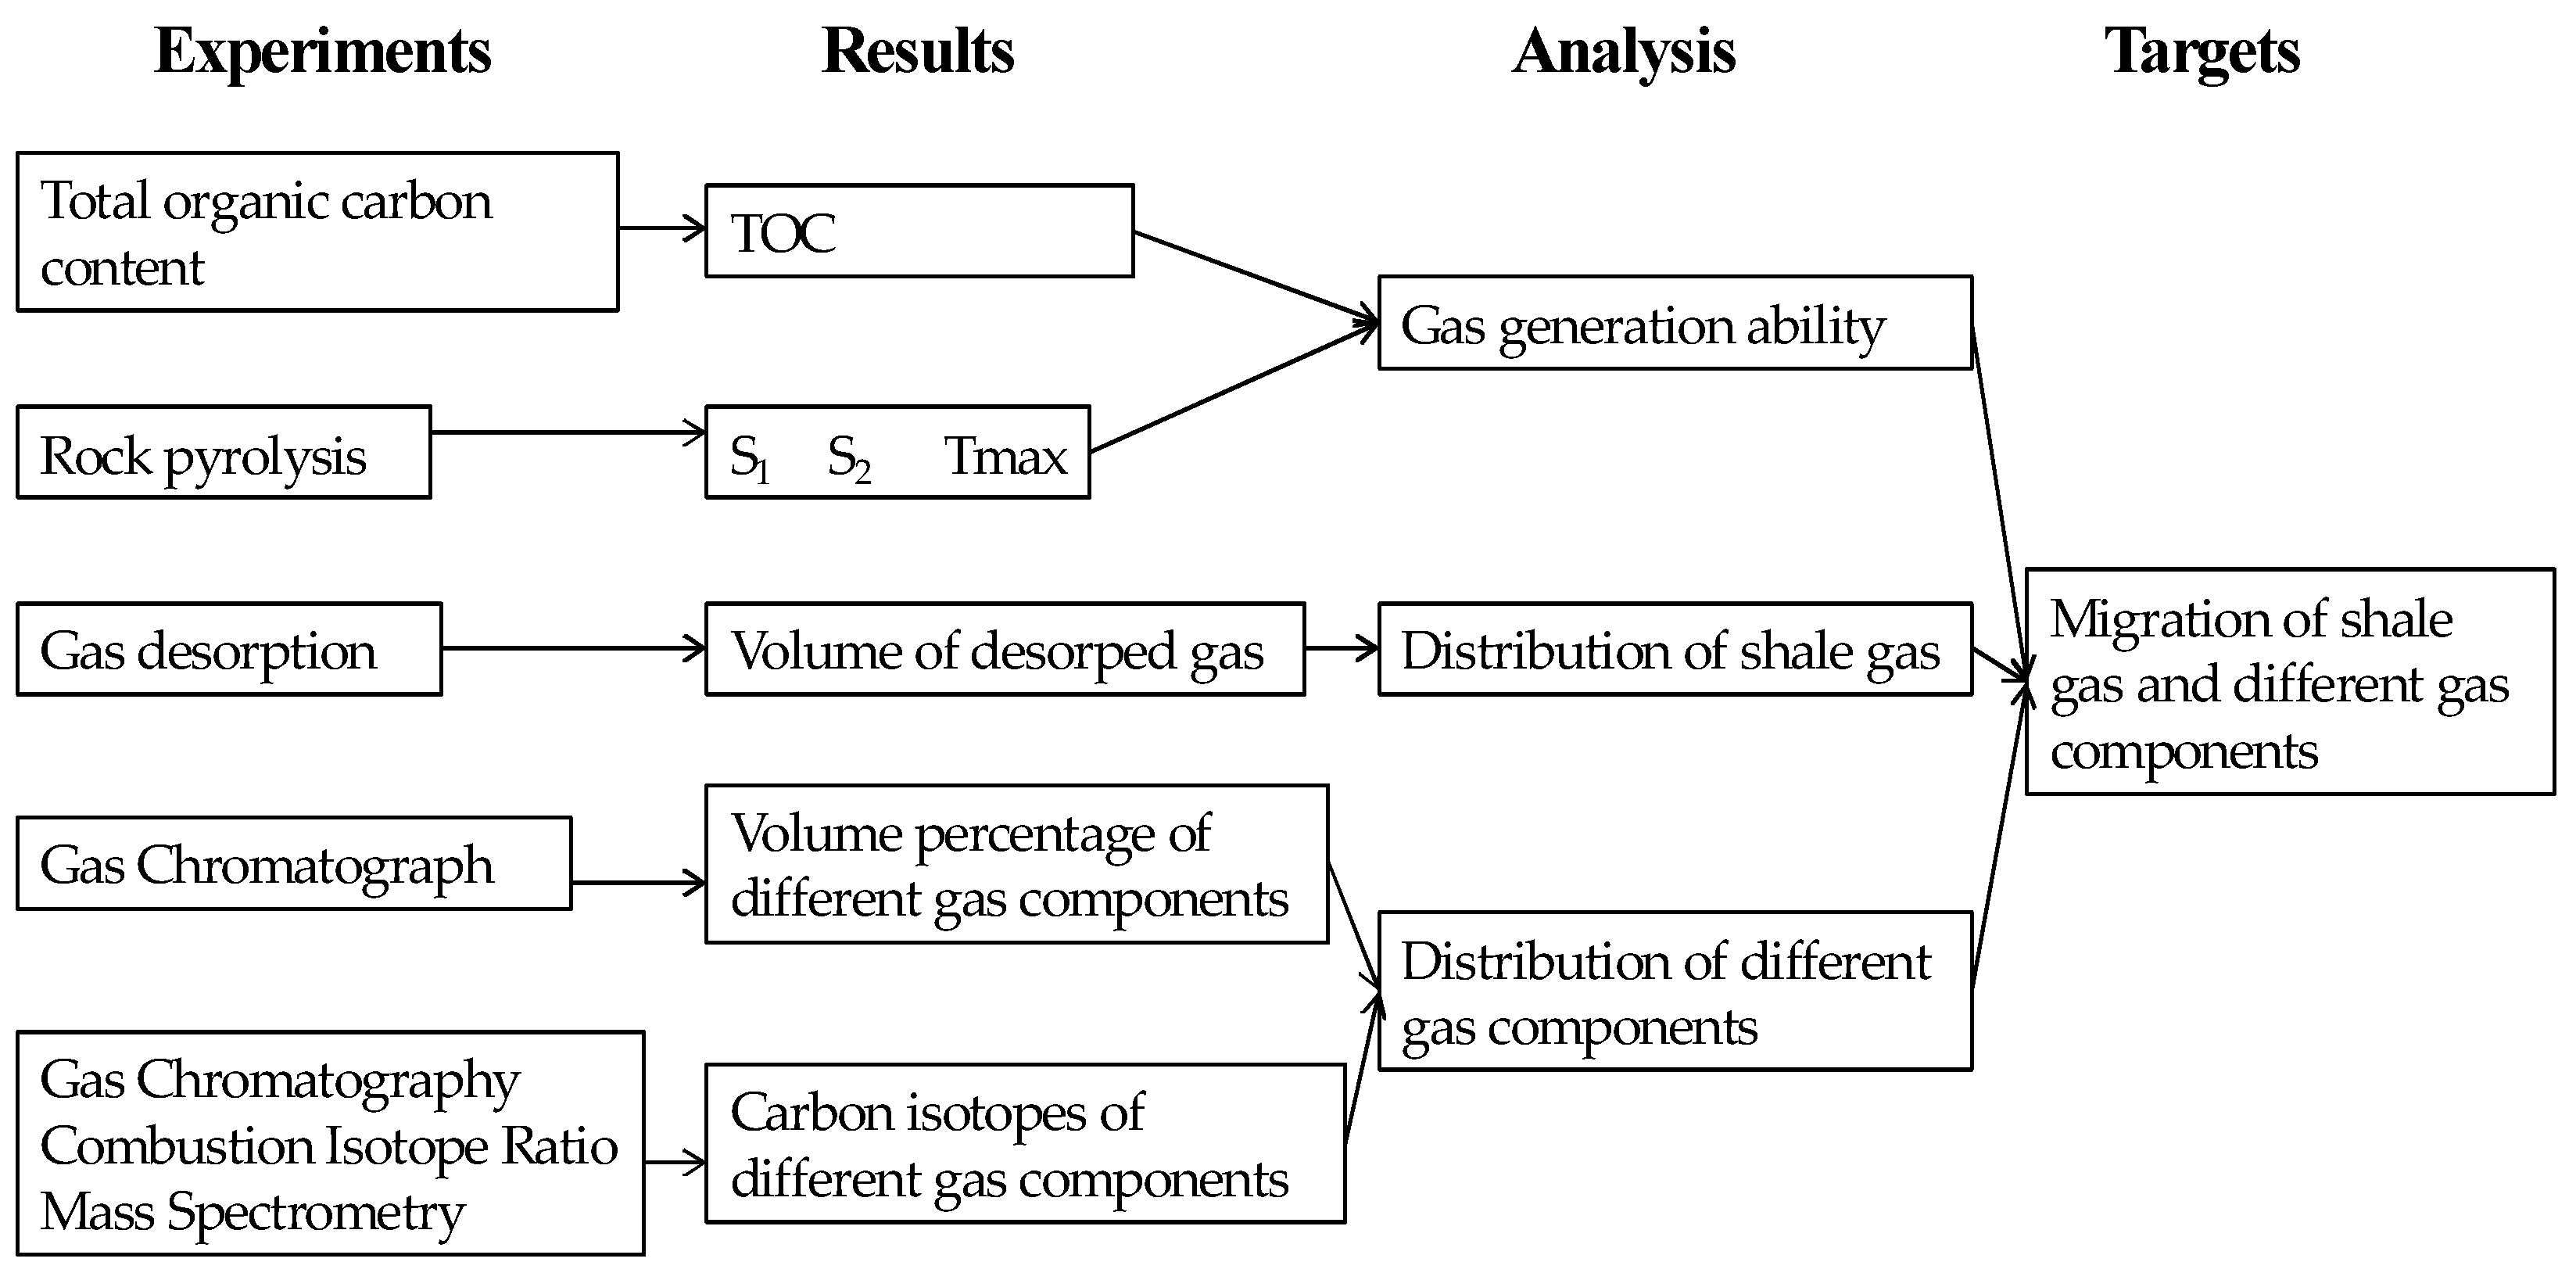
Nineteen Chang-7 shale (Chang-73) samples were collected from the YC23 Well (Figure 2). Total organic carbon content and gas desorption experiments were carried out for 19 samples, and rock pyrolysis were carried out for 13 samples. For the desorbed gas, gas chromatography was conducted to obtain the contents of different gas components. In addition, carbon isotope testing was carried out for the desorbed gas collected from 14 samples. The workflow and purpose of the experiments are shown in Figure 2.
Conventional coring was used in the YC23 Well. It took 30–45 min for the cores to be pulled to the surface. It should be noted that a certain amount of gas was lost during the drilling and sampling processes. Firstly, the temperature–pressure balance of the oil–gas–water system is damaged when the drilling bit penetrates the shale, leading to loss of gas even though the borehole is filled with drilling fluid. Secondly, a decrease in temperature and pressure when the core is pulled up to the surface could also result in gas loss. Several methods for calculating lost gas have been proposed as discussed in the introduction. However, it is very difficult to obtain the accurate quantity of lost gas. Moreover, the lost volumes of different gas components’ carbon isotopes are still not fully understood. In order to avoid gas losses, all the desorption experiments in this study were carried out in the Coring well site. The sample must be cleaned and broken before the desorption experiments; thus, it took 5–10 min for the cores to be placed in the desorption canisters at the site. In addition, the main focus of this study is the differences in the content of the gas components, thus the lost gas has not been considered.
The total organic carbon content was measured using Vario TOC. The experimental procedures were as follows: (1) the solid rock was milled into powder of less than 100 mesh; (2) hydrochloric acid solution (5% dilute) and powder samples were placed in the fume hood for ventilation (three days) to remove carbonate; (3) the samples were placed in the incubator (50 °C) to dry (three days); (4) the samples were packed in tin foil after being weighed; and (5) the samples were placed and the instrument was started. The Vario TOC automatically compares the sample with a standard sample based on the detected peak area and determines the organic carbon content.
Rock-eval was used for rock pyrolysis. The experimental procedures were as follows: (1) the rock samples were broken and each weighed about 100 mg for the experiment; (2) the sample was heated at a temperature of 300 °C for 3 min, and then heated to 650 °C at a heating rate of 25 °C/min. The measured parameters included free hydrocarbon (S1), pyrolysis hydrocarbon (S2) and maximum pyrolysis temperature (Tmax).
The SH-C01 desorption system was used for the shale gas desorption experiment. The experimental procedures were as follows: (1) the fresh shale samples were placed in the sealed tank and fill it with helium; (2) the sealed tank was placed on the centrifugal table to centrifuge the shale into powder; (3) the sealed tank was placed into the desorption system and heated for 3 h (120 °C, as nearly all the adsorbed gases can be desorbed near 120 °C) [4]. The procedure for gas collection was as follows: (1) the measuring cylinder (with a semi-closed end controlled by a valve and an open end) was put in a water pot and filled with water; (2) the measuring cylinder was kept below the water surface; (3) the valve of the upper end was closed; (4) the hose (which connects the SH-C01 desorption system) was put near the lower open end of the measuring cylinder; (5) this made the desorbed gas flowing into the measuring cylinder; and (6) the desorbed gas was collected from the upper end through the valve.
The gas components were measured using a gas chromatograph (Agilent 6890N). The experimental conditions were as follows: GDX-502 chromatographic column (3 mm × 4 m), mesoporous molecular sieve (3 mm × 2.4 m), and capillary chromatogram column (50 m × 0.53 mm). The temperature of the chromatographic column ranged from 30 °C to 160 °C (with a heating rate of 70 °C/min). The pressure of the chromatographic column was 200 KP. The carrier gas was helium. The injection temperature of the chromatographic column was 120 °C. The quantity of injected sample gas was 1 mL. The detection limit ranged from 0.1 ppm to 10 ppm. The measuring accuracy was about ±5%.
The carbon isotopic composition was measured using gas chromatography combustion isotope ratio mass spectrometry (GC-C-IRMS). In the GC-C-IRMS system, the gas chromatography instrument is HP6890I (Agilent Technologie, Santa Clara, CA, USA), and isotopic mass spectrometer instrument is Finigan Delta plus XP (Thermo Finigan, San Jose, CA, USA). During the testing, the separated compound was burned and converted into carbon dioxide in a combustion furnace for carbon isotopic composition analysis. The chromatographic column used was CP-CarboBOND (25 m × 0.53 mm × 10 μm). Chromatography heating was performed by keeping the initial temperature at 30 °C for 5 min, increasing the temperature to 240 °C with a heating rate of 15 °C/min, and keeping the temperature at 240 °C for 10 min. The flow rate of the carrier gas (helium gas) was kept at 6.2 mL/min. The accuracy of the measured carbon isotopes was about ±0.3‰.

4. Experimental Results

The desorption tests and TOC tests were conducted for 19 shale samples from the study area. The TOC in the Chang-7 shale ranges from 0.68% to 8.52%, with an average value of 4.06%, indicating that the organic matter abundance in Chang-7 shale is high. Among the measured shale samples, 31.5% of the samples (6 samples) have TOC < 2%; 42.1% of the samples (8 samples) have 2% < TOC < 6% and 26.4% (5 samples) of the samples have TOC > 6%. The S1 ranges from 0.88 to 8.72 mg/g, with an average value of 3.66 mg/g; the S2 ranges from 0.66 to 24.48 mg/g, with an average value of 8.05 mg/g; the Tmax ranges from 446 to 459 mg/g, with an average value of 454 mg/g. The volume of desorbed gas ranges from 0.6 to 2.32 m3/t, with an average value of 1.26% (Table 1). Compared with most marine shale systems, the shale gas content of Chang-7 shale is generally at a medium or low level [3].
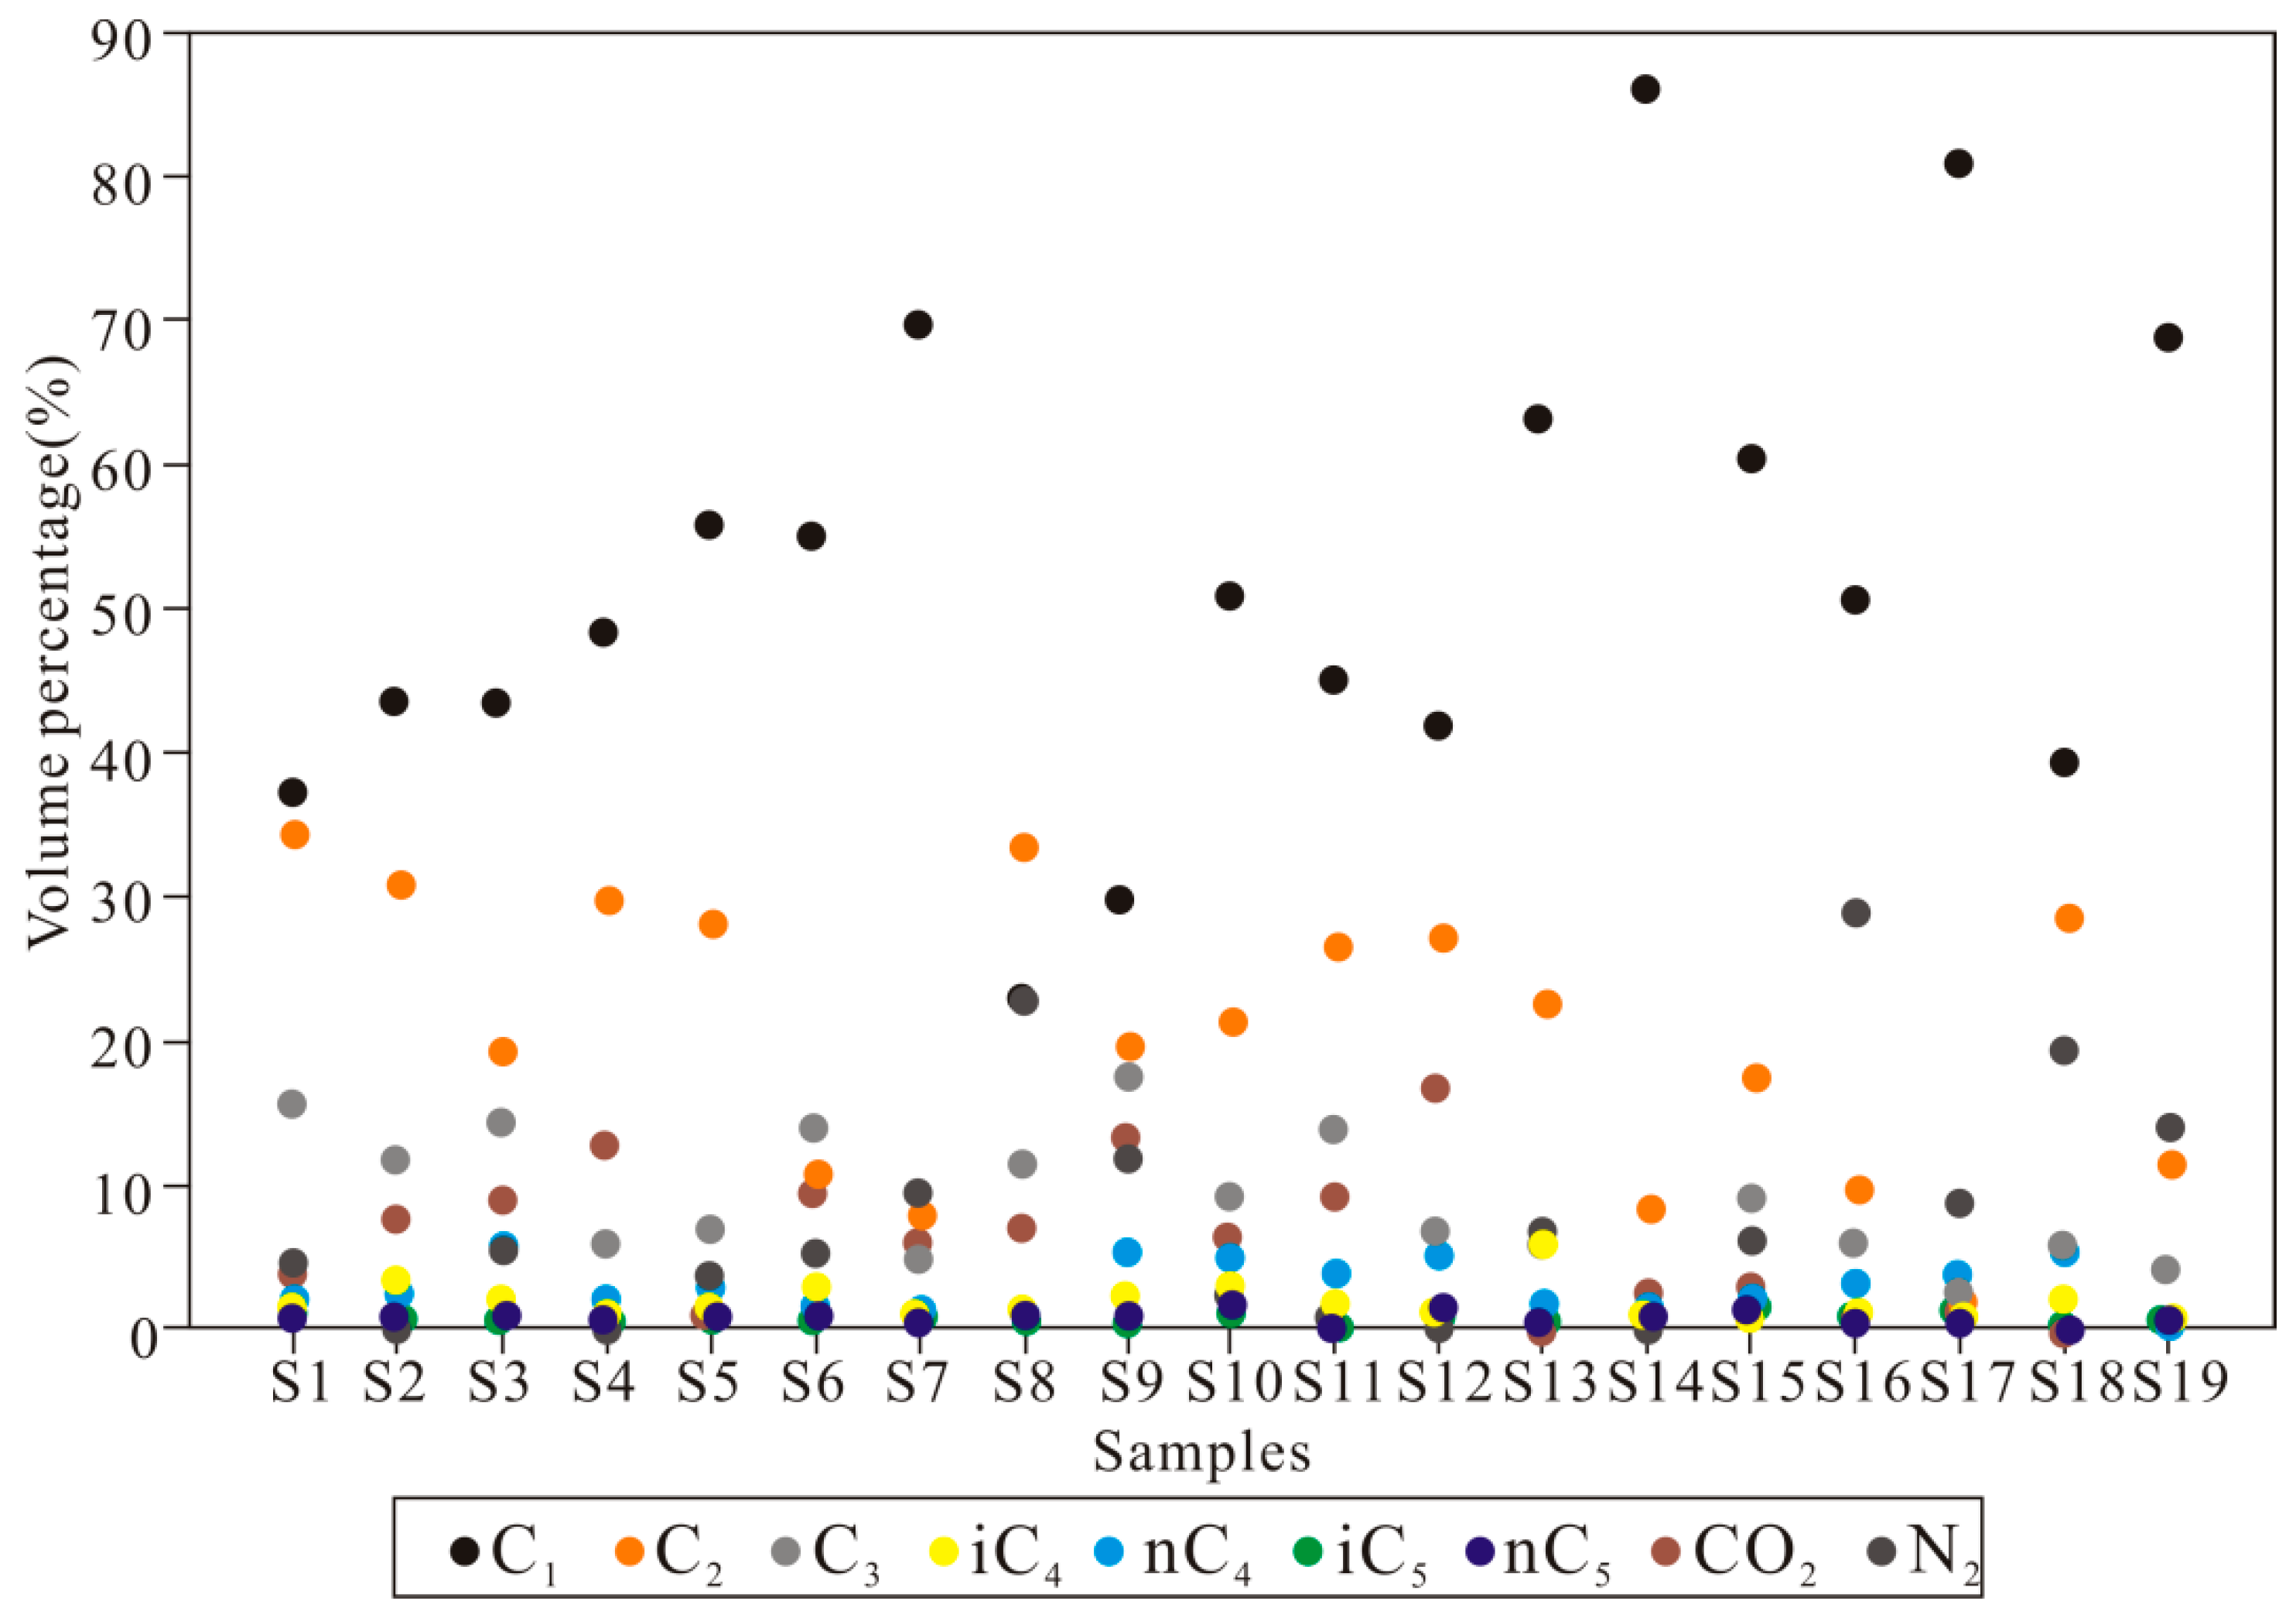
The desorbed gas from the Chang-7 shale samples mainly contains four types of gas components, including methane (C1), heavy gases (C2—ethane; C3—propane; iC4—iso-butane; nC4—n-butane; iC5—iso-pentane; nC5—n-pentane), carbon dioxide (CO2) and nitrogen (N2) (Figure 3). Among the measured shale samples, the volume percentage of CH4 ranges from 22.89% to 85.95%, with an average value of 52.16%; the volume percentage of C2H6 ranges from 1.95% to 34.37%, with an average value of 20.45%; the volume percentage of propane ranges from 0.7% to 17.47%, with an average value of 8.71%; the volume percentage of C3H8 (n-butane and iso-butane) ranges from 0.6% to 7.58%, with an average value of 4.01%; the volume percentage of pentane (n-pentane and iso-pentane) ranges from 0.0% to 2.53%, with an average value of 1.13%; the volume percentage of carbon dioxide ranges from 0.0% to 16.66%, with an average value of 5.69%; and the volume percentage of nitrogen ranges from 0.0% to 28.8%, with an average value of 7.85%. Among the four types of gas components, the CH4 content is relatively high, followed by heavy gases, while the content of carbon dioxide and nitrogen are relatively low.
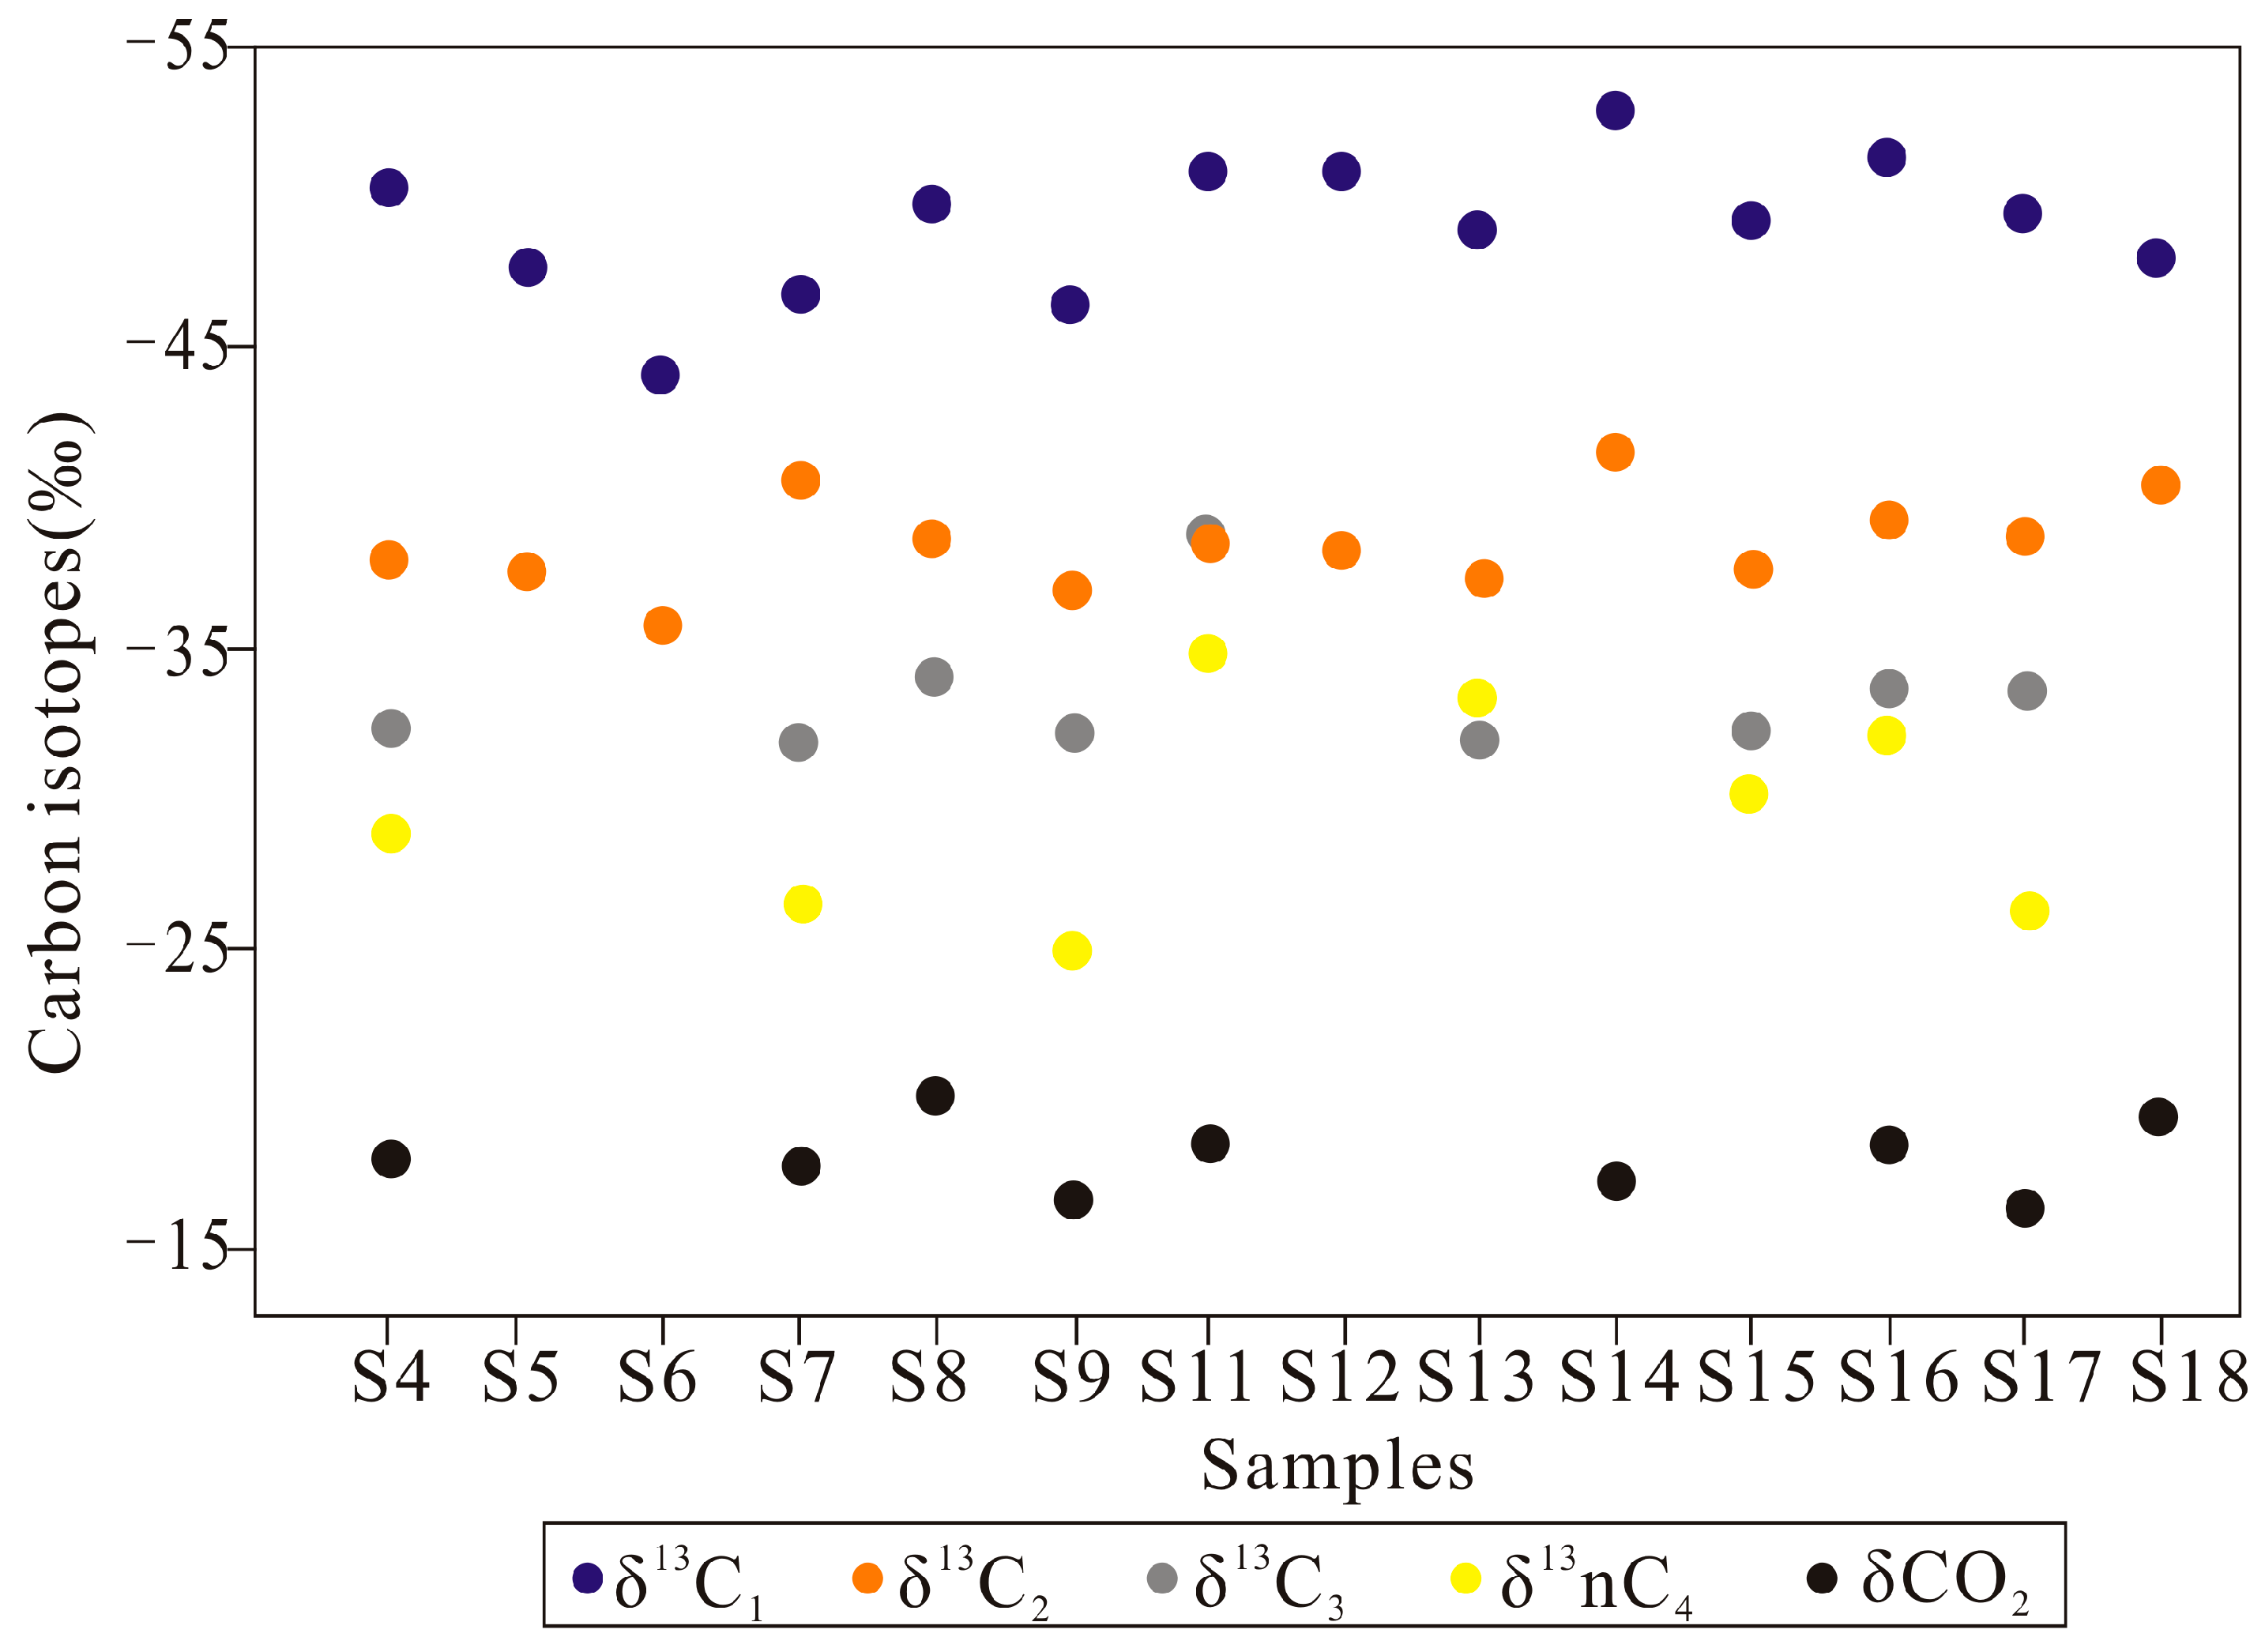
Carbon isotopes tests were conducted for 14 shale samples in the study area (Figure 4). The test results showed that the methane carbon isotopes (δ13C1) range from −52.8‰ to −44.1‰, with an average value of −48.97‰; the ethane carbon isotopes (δ13C2) range from 41.3‰ to −35.6‰, with an average value of −38.37‰; the propane carbon isotopes (δ13C3) range from −38.6‰ to −31.8‰, with an average value of −33.32‰; the butane carbon isotopes range from −34.8‰ to −24.8‰, with an average value of −29.56‰; the dioxide carbon isotopes range from −20.1‰ to −16.2‰, with an average value of −17.94‰. However, it should be noted that some samples do not contain carbon isotopes for C3H8, iC4 and CO2.

5. Origins of Shale Gas Sampling

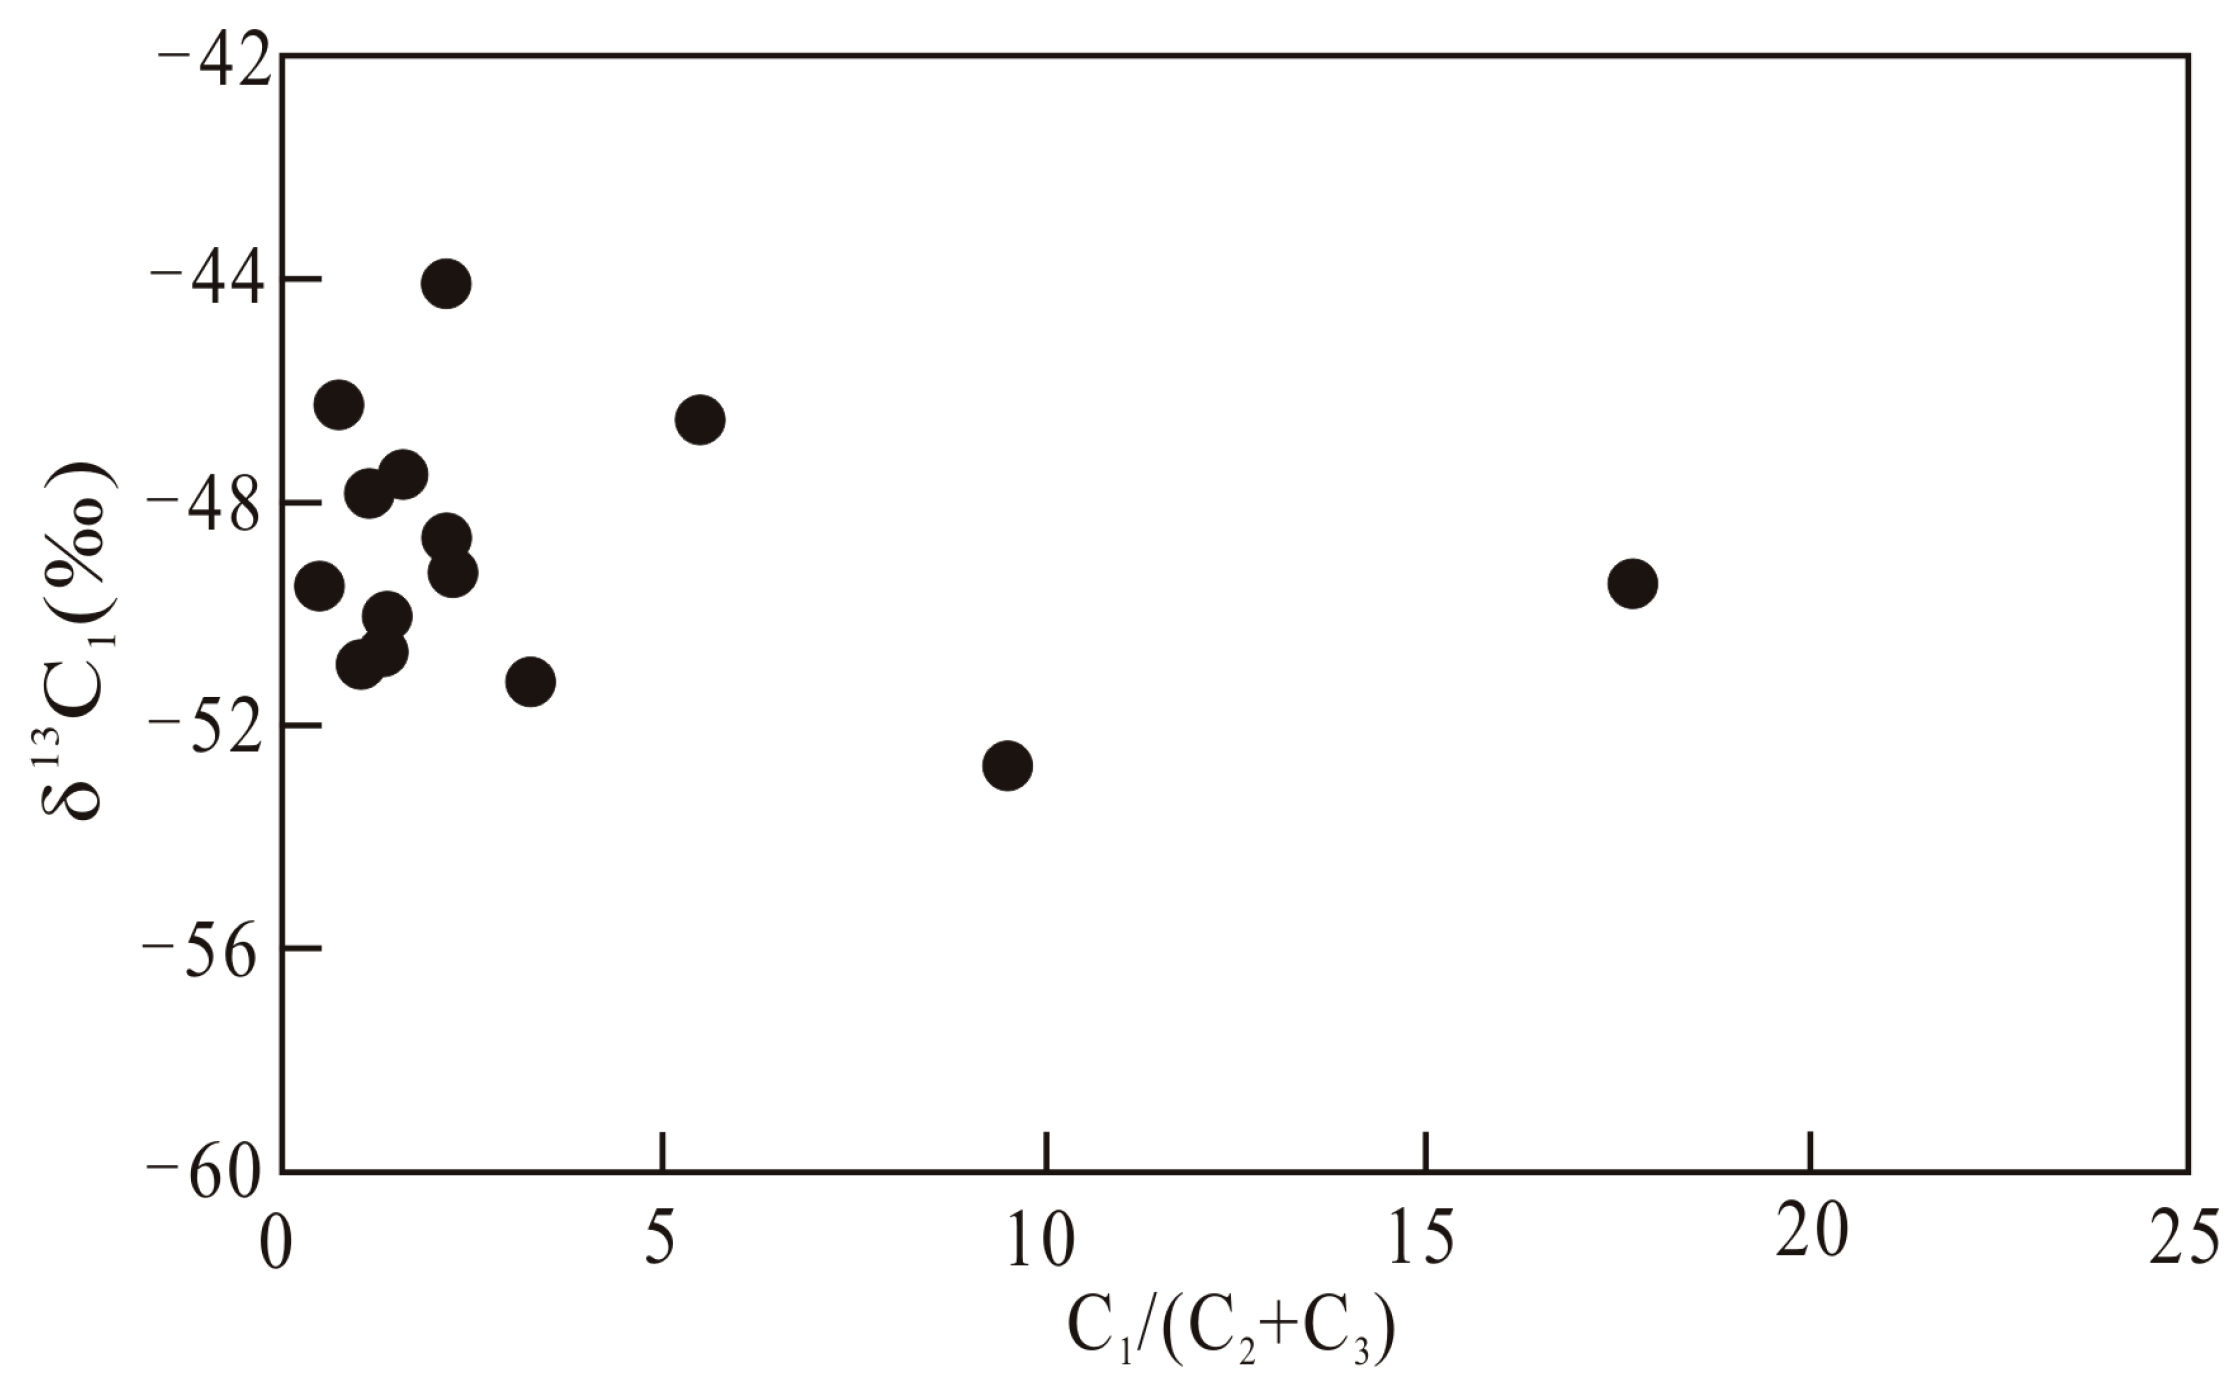
Gaseous hydrocarbon components such as R, R = C1/(C2 + C3), and δ13C1 are important parameters for assessing the gas origins. The R value for gas of thermal origin is normally less than 100, and the δ13C1 is normally larger than −55 ‰ [24]. In this study, the R values range from 0.51 to 17.69, with an average value of 3.14; the δ13C1 are larger than −55 ‰ (Figure 5). Thus, it can be inferred that the Chang-7 shale gas is of thermal origin. The above viewpoint is also proved by the thermal maturity of the study area. The thermal maturity of Chang-7 shale in the study area is generally in the oil generation window (vitrinite reflectance ranges from 0.8% to 1.1%) [25,26]. Thus, the Chang-7 shale gas collected from the YC23 Well is of thermal origin, though some Chang-7 shale gas in the Ordos Basin is biogas [4,5].
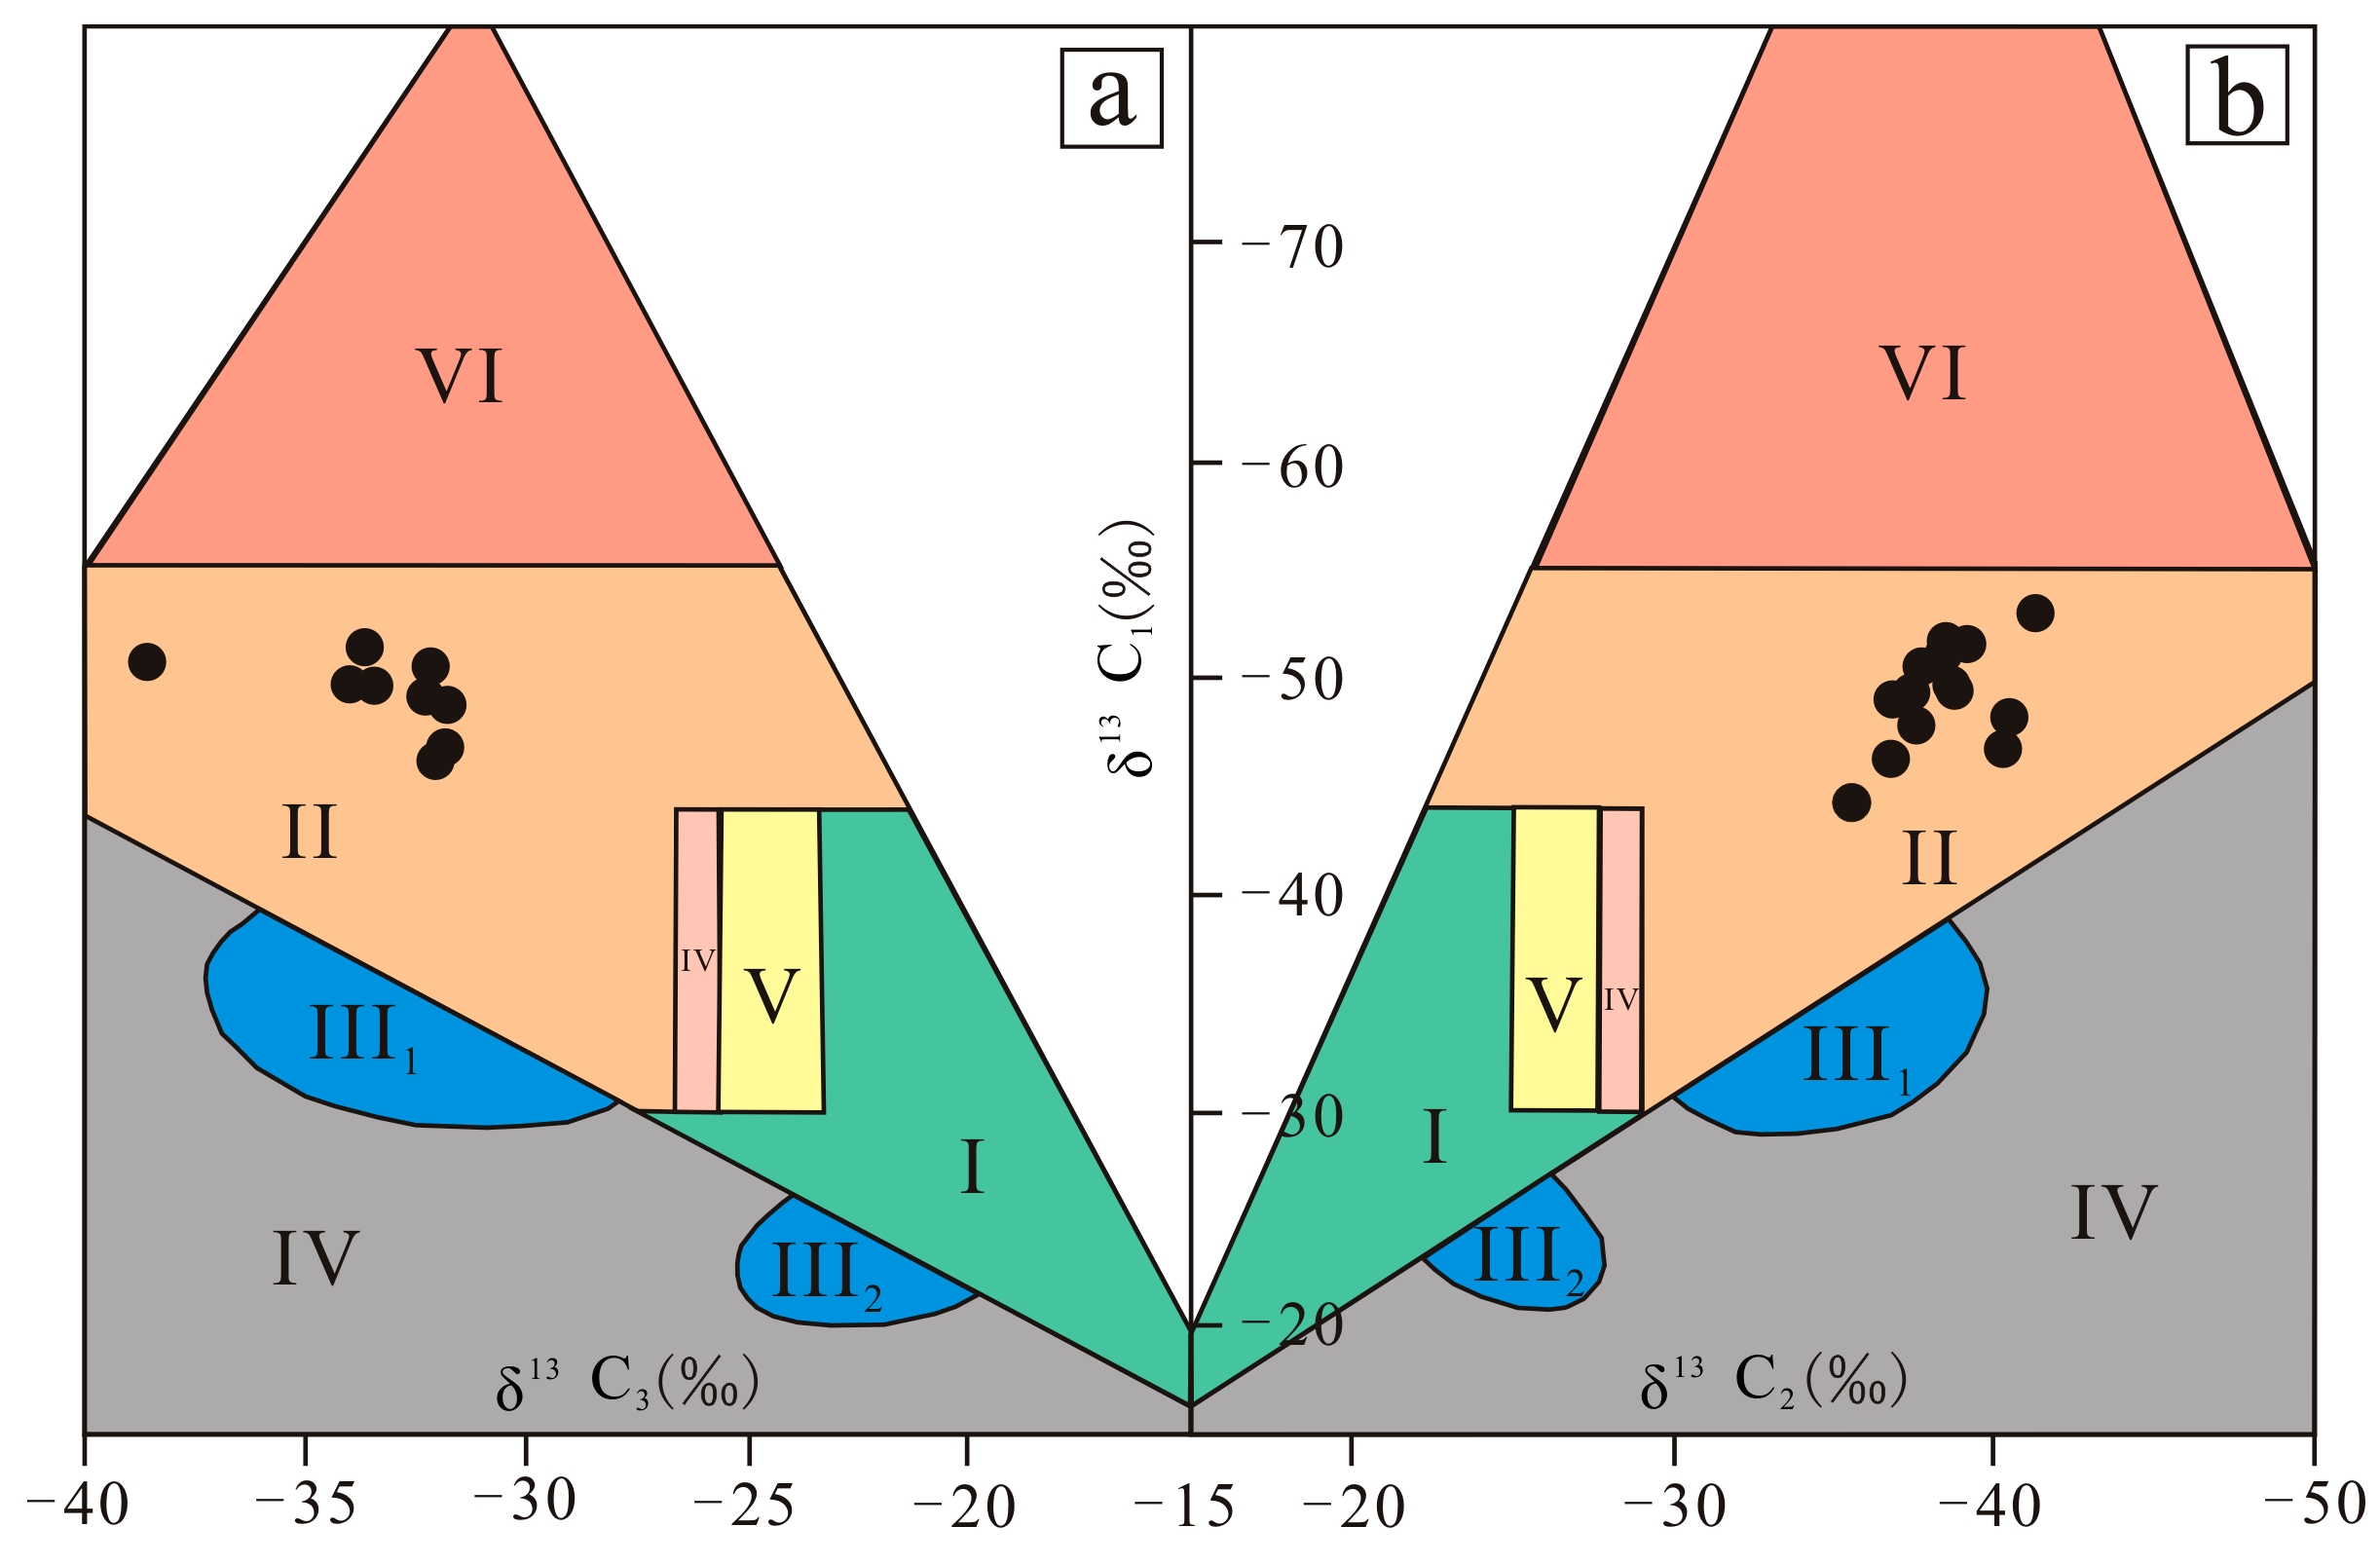
Normally, δ13C1 becomes heavier with increasing thermal maturity, and it is always characterized by the distinctive fractionation phenomenon. Thus, δ13C1 is a reliable index for judging the maturity of natural gas [13,27,28]. The heavy gases usually evolved from kerogen or crude oil during thermal evolution, and it is always characterized by the minor fractionation phenomenon. For example, the carbon isotopes of some heavy gases, including δ13C2 and δ13C3 have a narrow fractionation range, and their values are close to the carbon isotopes of the parent material. Thus, the carbon isotopes of heavy gases are an effective index for inferring the genesis of the shale gas. The typical oil-type gas that is distributed across the world has the following characteristics: −55‰ < δ13C1 < −30‰; δ13C2 < −28.8‰; δ13C3 < −25.5‰; and δ13CCO2 < −10‰ [29,30]. The desorbed gas from Chang-7 shale has the following characteristics: −52.8‰ < δ13C1 < −44.1‰; δ13C2 < −33.6‰; δ13C3 < −31.8‰; and δ13CCO2 < −16.2‰. The features mentioned above proved that the Chang-7 shale gas in this area is an oil-type gas (Figure 6).

6. Discussion

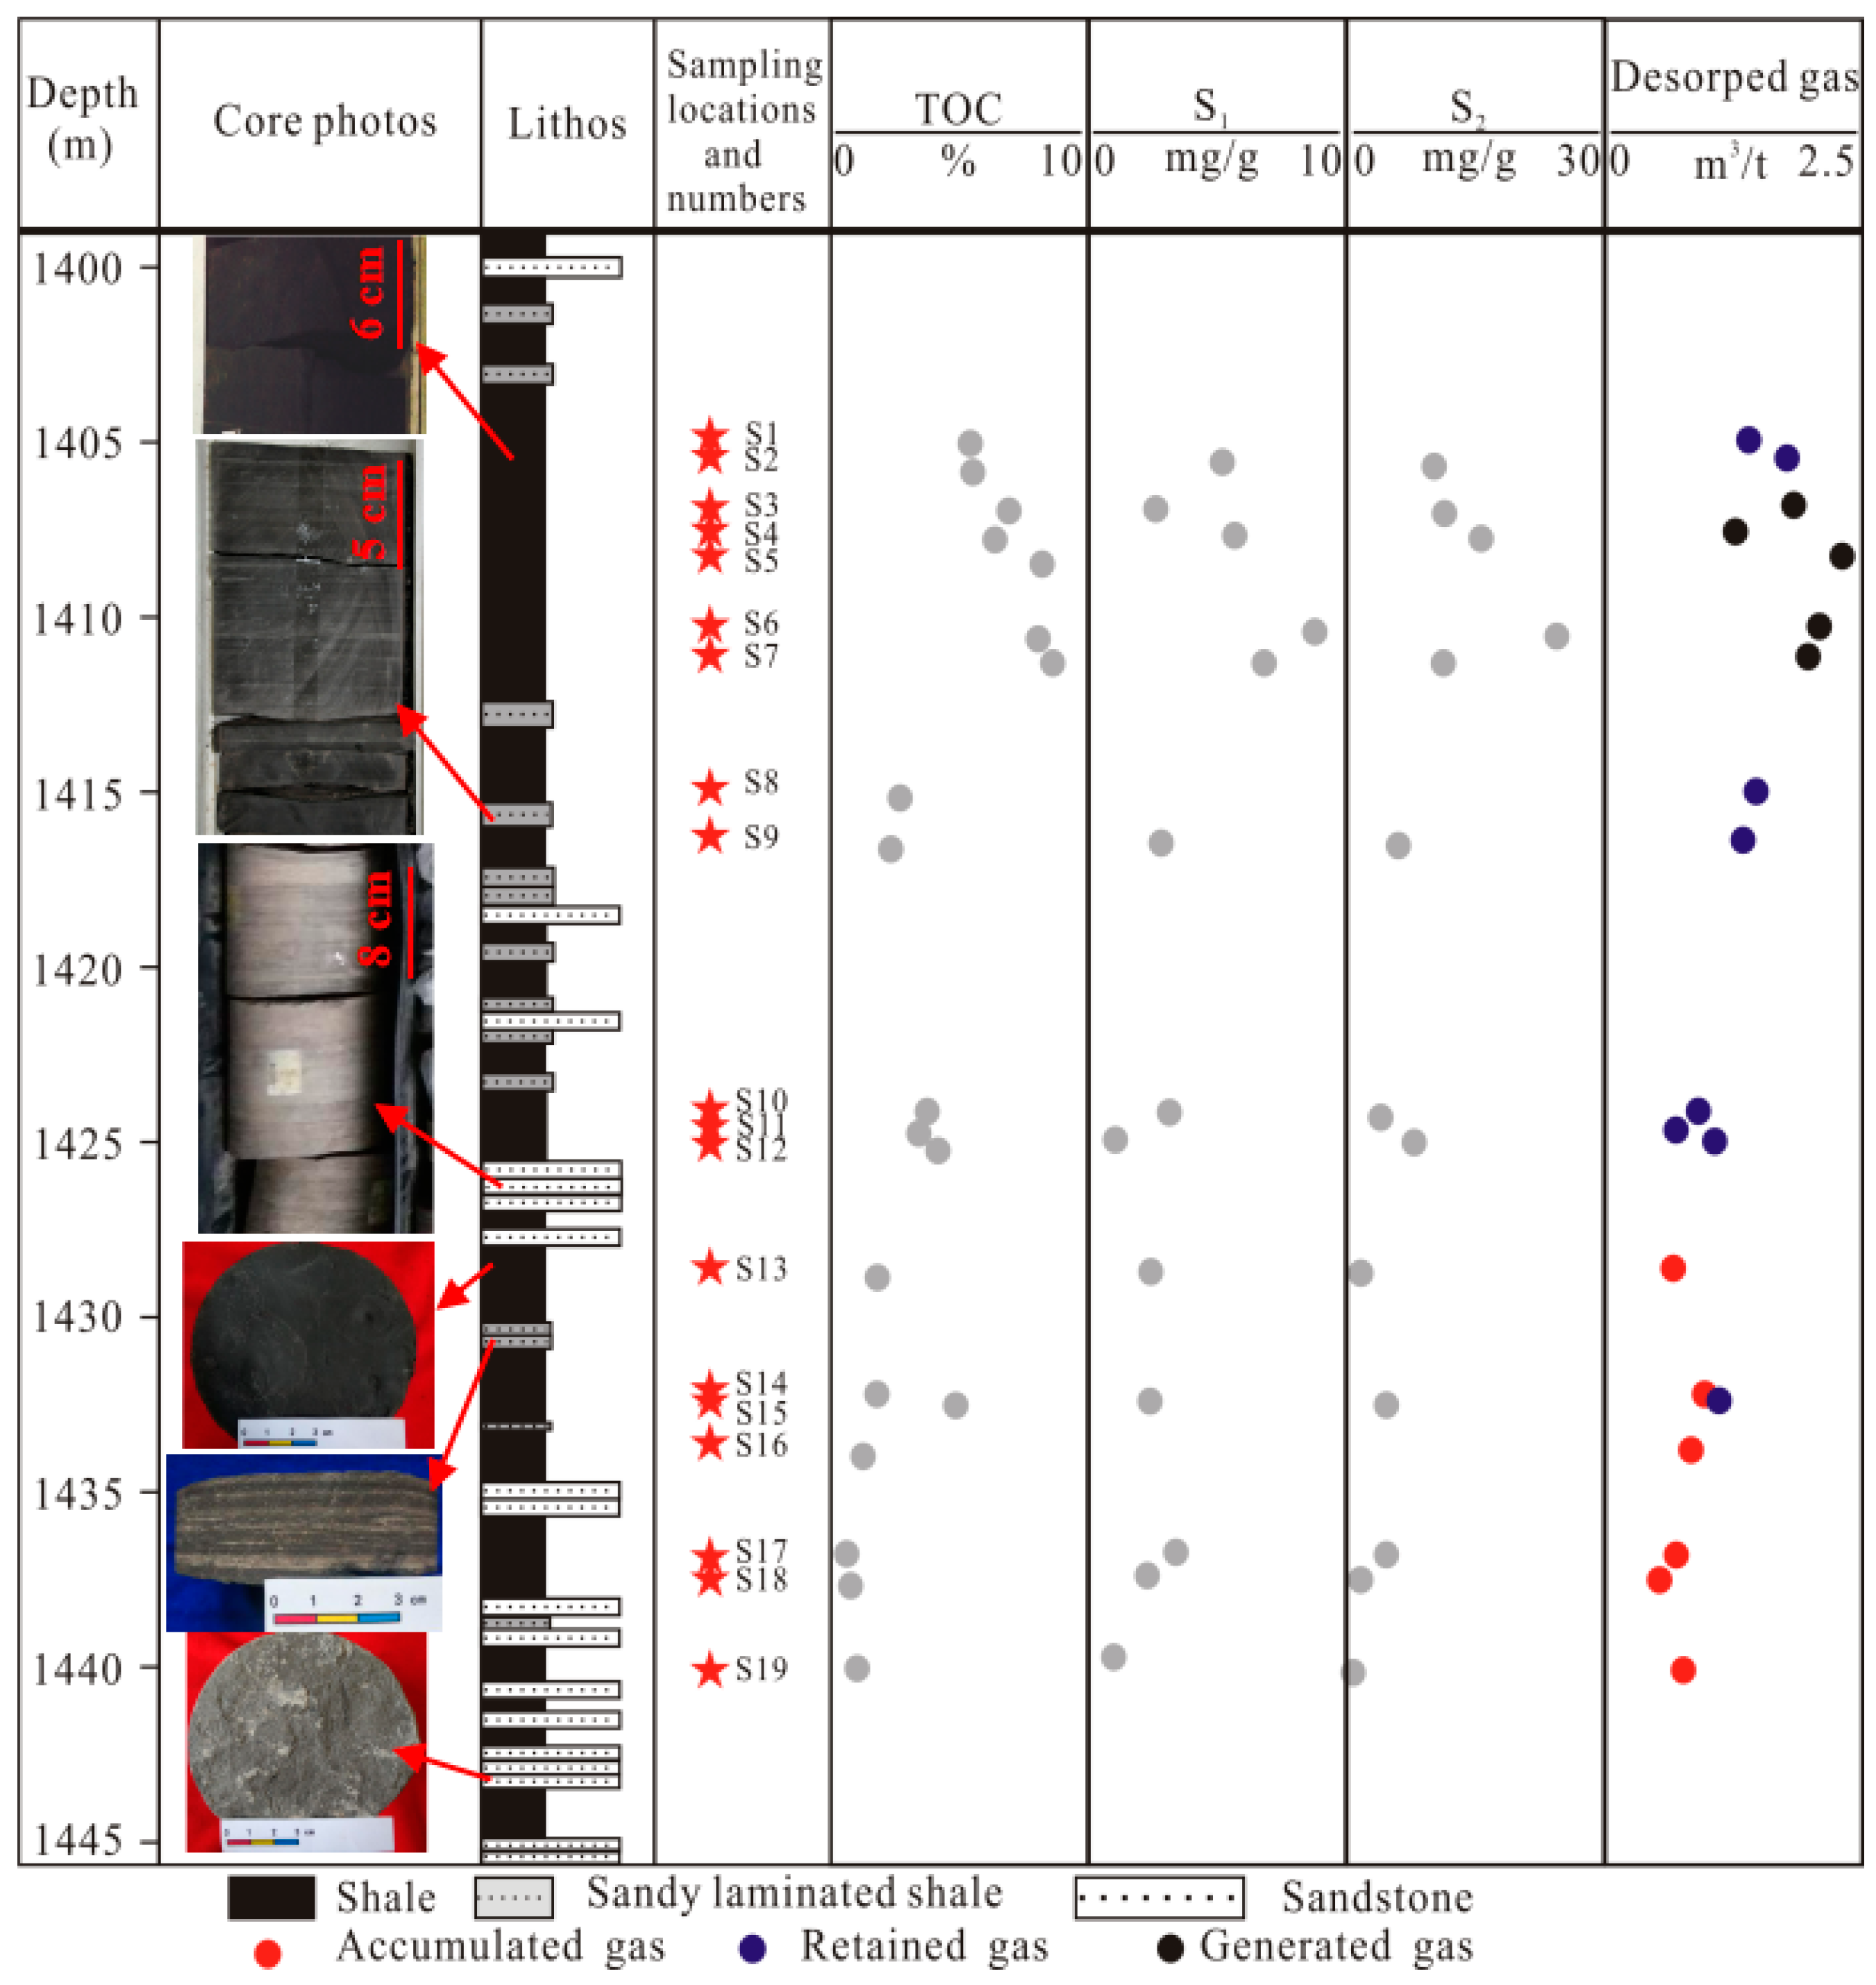
The Chang-7 shale system has very strong lithologic heterogeneity, and it contains a large number of sandy laminae and thin sandstone layers. The YC23 Well is a representative well that reflects lithologic heterogeneity (Figure 7). In the depth range of 1400–1418 m (4592–4651 ft), the lithology is dark shale with limited sandy laminae. In the depth range of 1418–1445 m (4651–4739 ft), the lithology is a good combination of dark shale, sandy laminae, and thin sandstone layers. Some former studies have proved that the existence of lithologic heterogeneity could cause serious heterogeneity in both the organic geochemistry and the reservoir characteristics, which could affect the generation, migration and distribution of shale gas [21]. The YC23 Well completely substantiates the above viewpoint. In regard to the YC23 Well, the volumes of desorbed shale gas, S2, and TOC are extremely high in the depth range of 1400-1418 m (4592–4651 ft) (the section of thick, dark shale), and the volumes of desorbed shale gas, S2, and TOC are low in the depth range of 1418–1445 m (4651–4739 ft) (the combined shale, sandy laminae, and thin sandstone layers) (Figure 7).

6.1. Classification of Generated Gas, Retained Gas and Migrated Gas

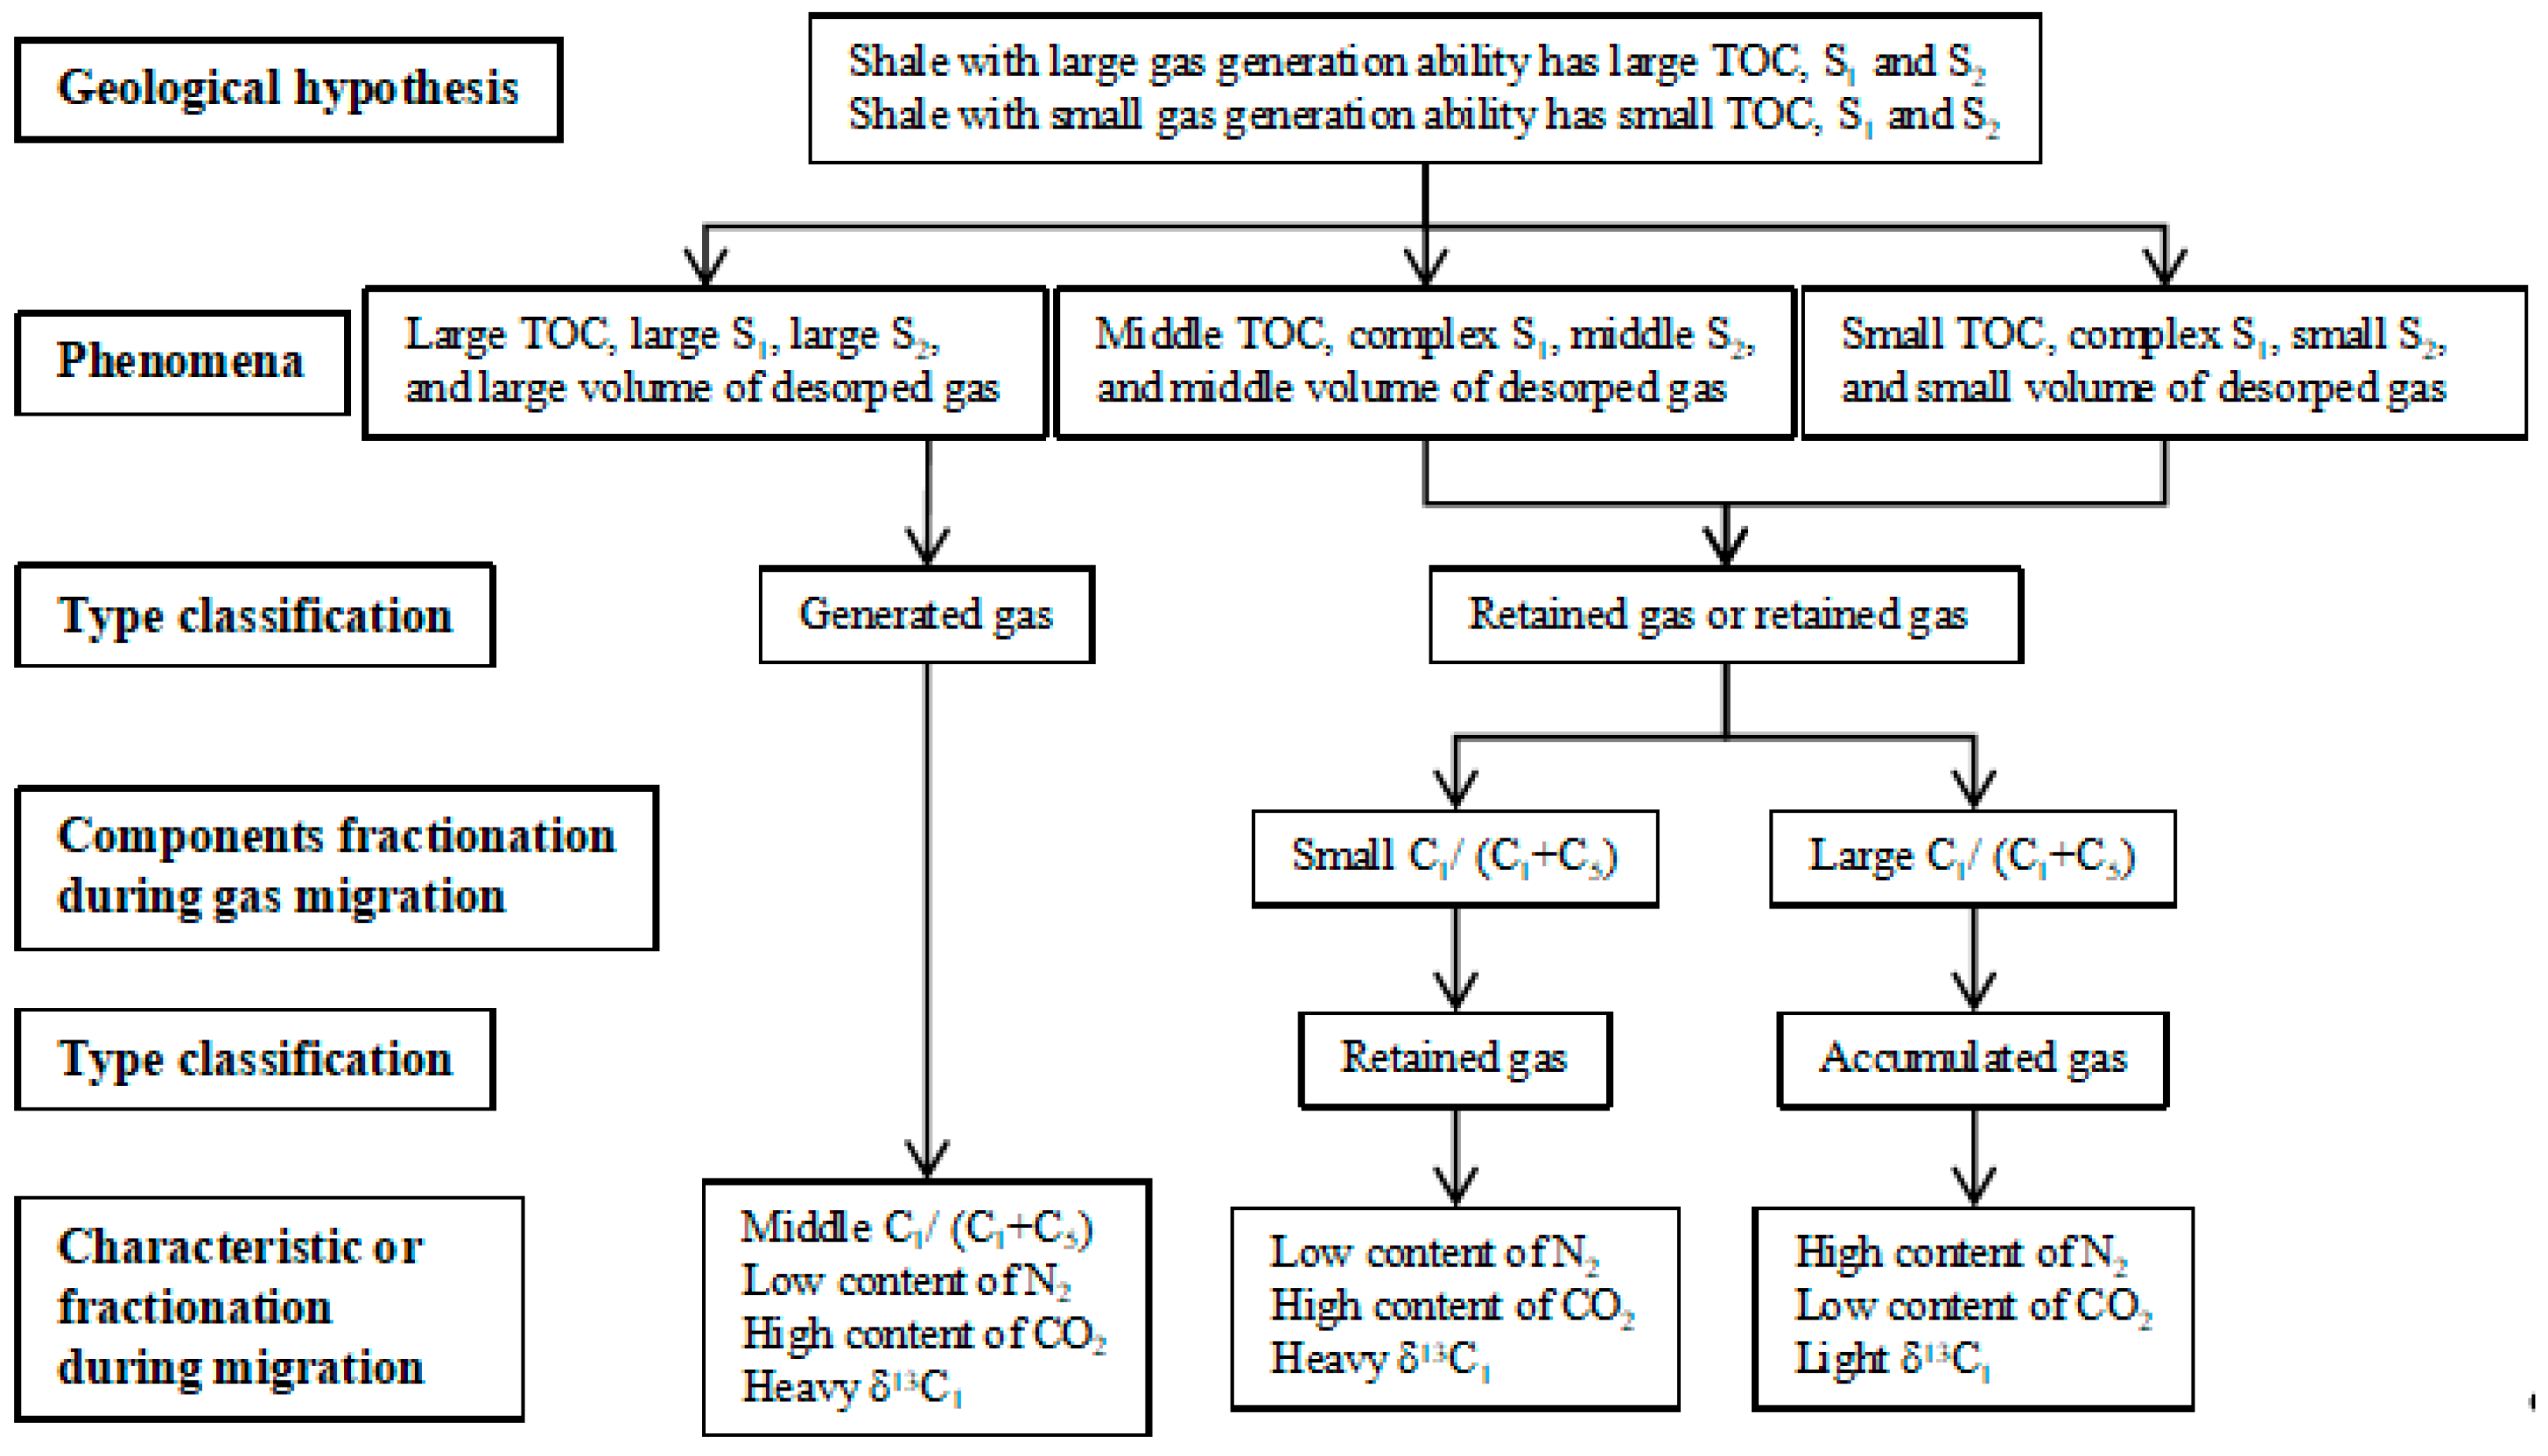
As shale with the ability to generate large amounts of gas usually has a larger TOC, S1 and S2, this study used TOC, S1 and S2 to assess the generated gas. As shale gas can migrate, this may cause component fractionation; thus, this study used component fractionation to distinguish the retained gas and migrated gas (Figure 8).
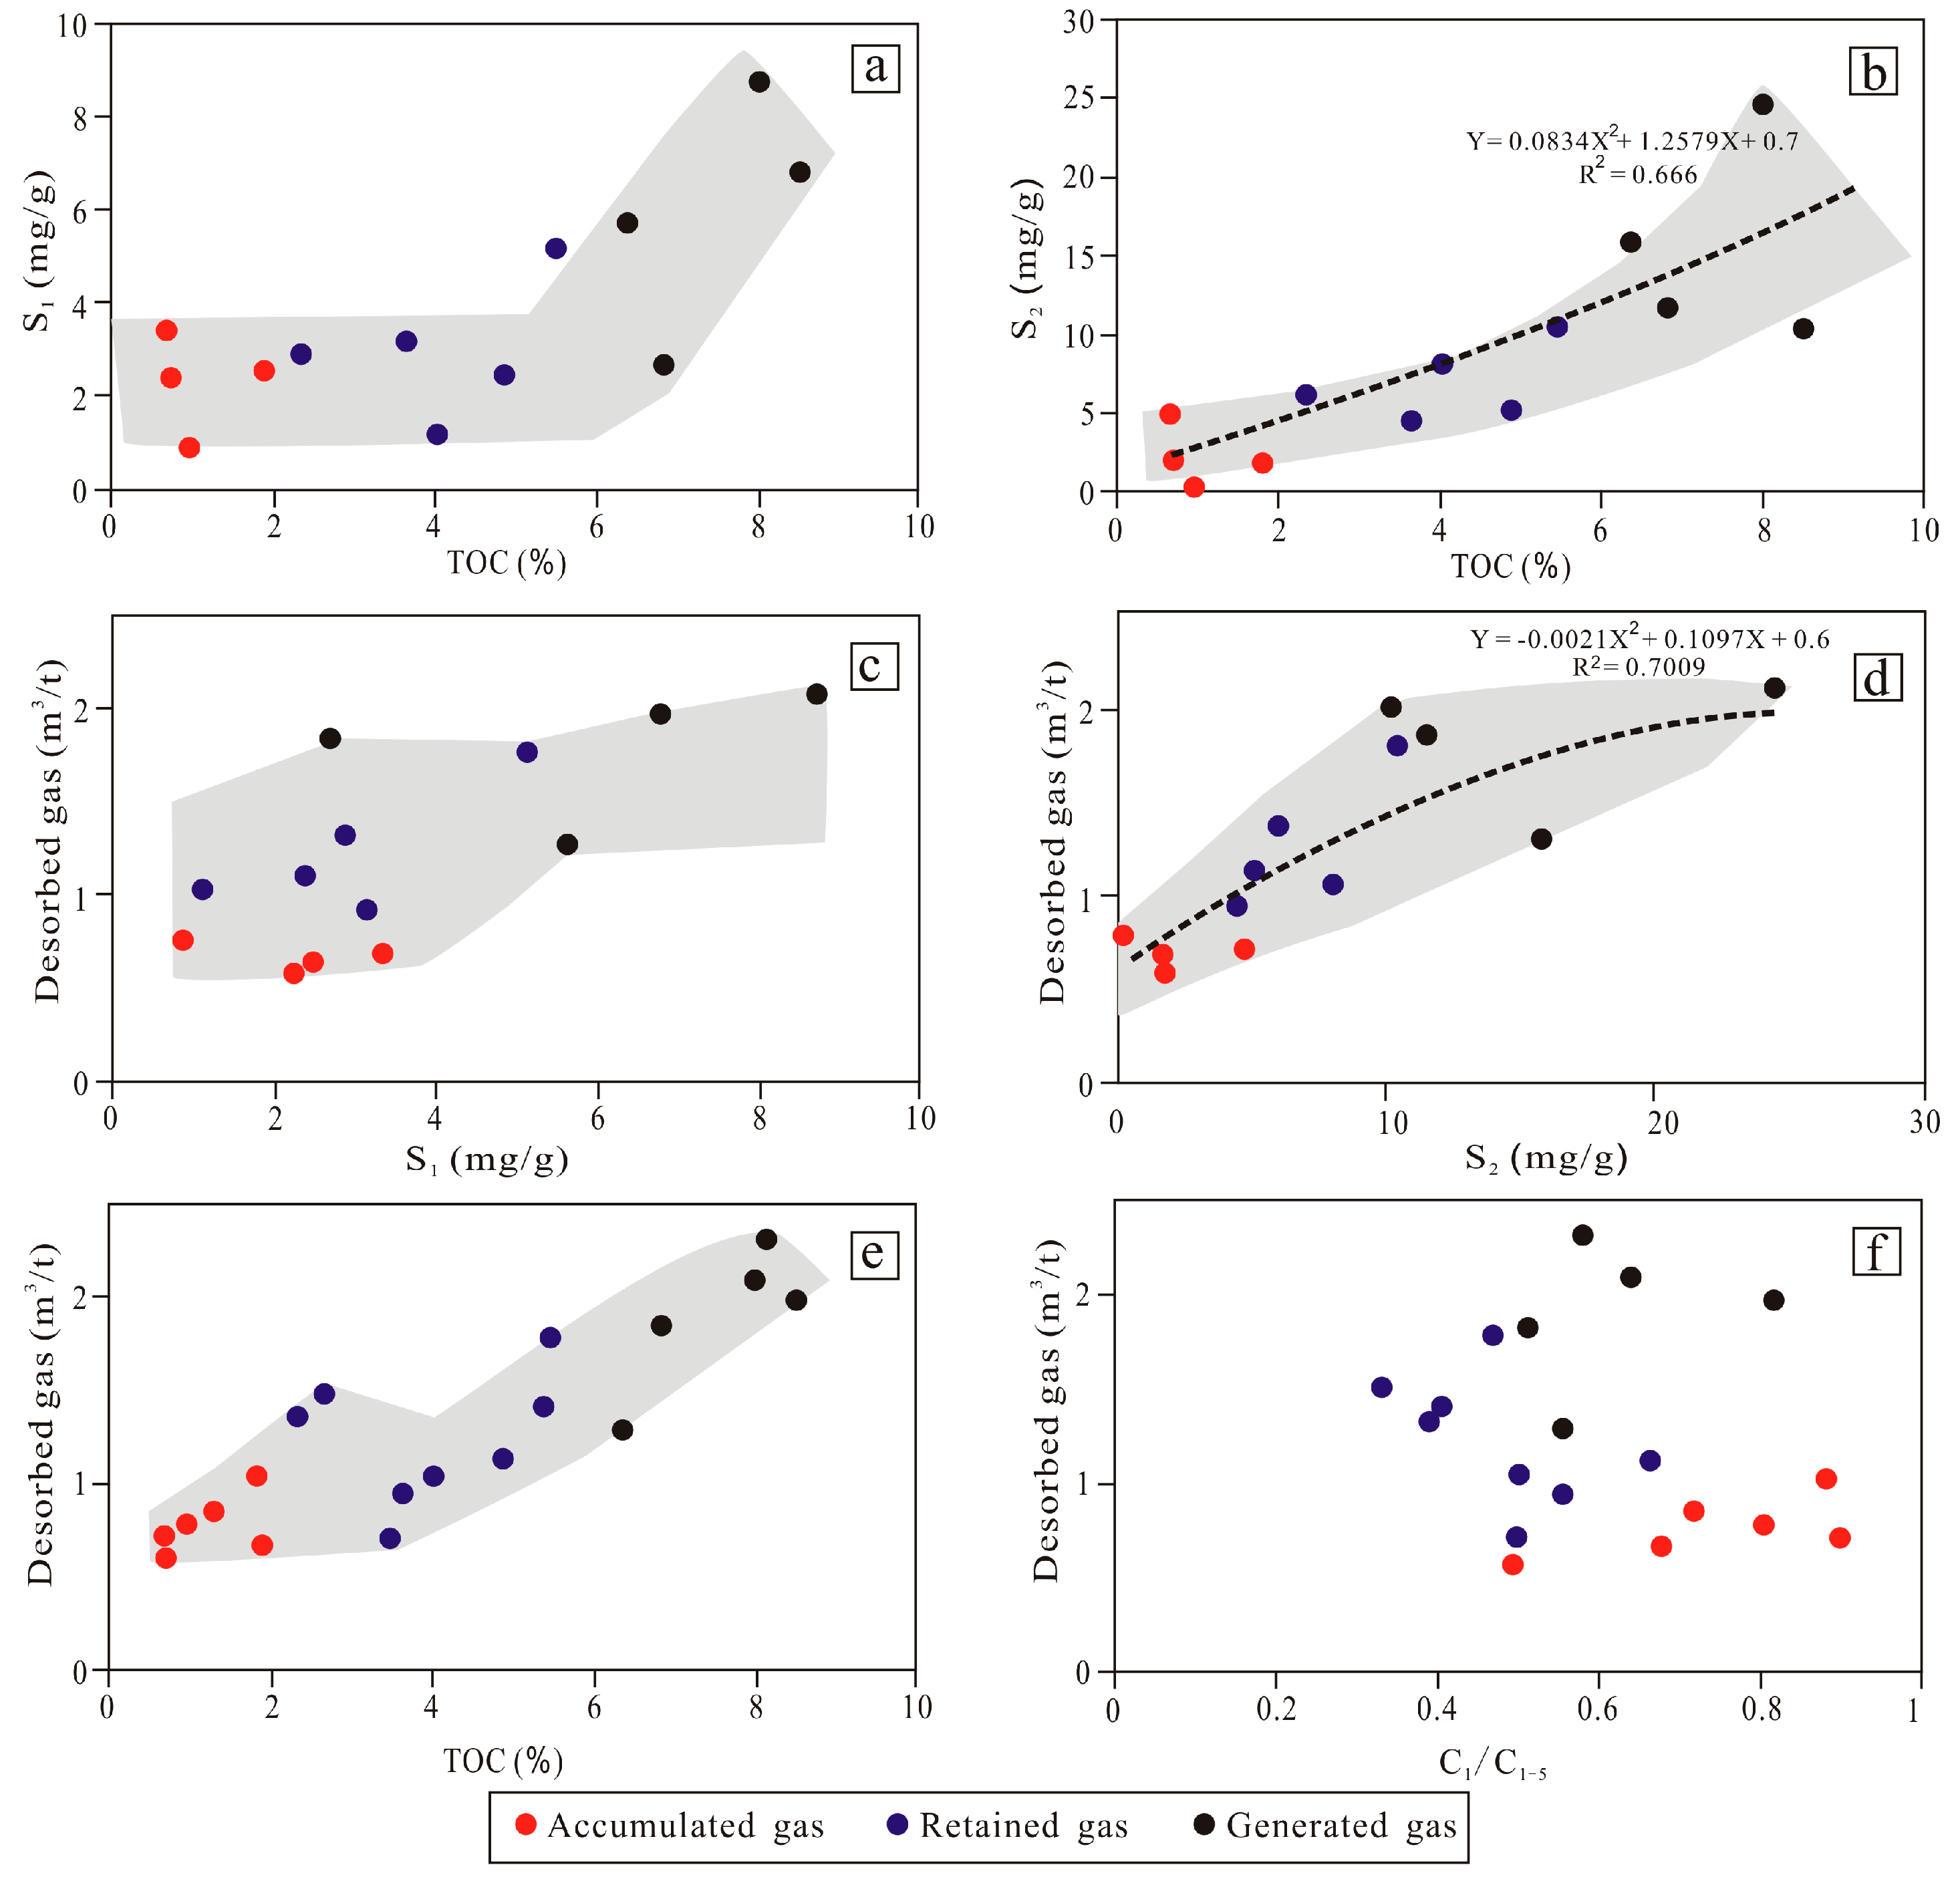
The test results from 19 shale samples from the YC23 Well show that the TOC is closely related to the generation, migration and occurrence of shale hydrocarbon. S1 is the liquid-free hydrocarbon in shale, which roughly represents the shale oil generated and stored in the shale system. However, hydrocarbons can easily migrate along pores and micro-fractures; thus, S1 often does not represent in situ-generated shale oil, but retained or stored oil after migration. For shale samples with a TOC less than 6% in the YC23 Well, there is no positive correlation between TOC and S1, indicating that shale oil in such samples has undergone large-scale migration (Figure 9a). S2 roughly represents the hydrocarbon generation ability of the low–medium maturity source rock, and the volume of desorbed gas roughly represents the ability to generate shale gas. In the YC23 Well, the TOC shows a good positive correlation with S2 and the volume of desorbed gas (Figure 9b,d). Thus, it can be inferred that shale with higher TOC in the YC23 Well has a stronger gas generation ability. For shale samples with TOC less than 6% in the YC23 Well, there is a weak positive correlation between desorbed gas and TOC, and there is no correlation between desorbed gas and S1. The abovementioned phenomena indicate that shale gas in the shale samples with TOC less than 6% has also experienced gas migration (Figure 9c,e).
For shale samples with TOC less than 2%, however, the volume of desorbed gas is low (between 0.6 and 1.03 m3/t, the average content is 0.77 m3/t), and the gas dryness is high (between 0.49 and 0.89, the average value is 0.74); For shale samples with TOC between 2% and 6%, the volume of desorbed gas is medium (between 0.71 and 1.78 m3/t, the average content is 1.23 m3/t), and the gas dryness is low (between 0.33 and 0.66, the average value is 0.48); For shale samples with TOC larger than 6%, the volume of desorbed gas is high (between 1.28 and 2.31 m3/t, the average content is 1.90 m3/t), and the gas dryness is high (between 0.50 and 0.82, the average value is 0.62) (Figure 9e,f). As shale with low TOC usually has low hydrocarbon generation ability, the shale samples with TOC less than 2% may generate a small amount of shale gas, resulting in the low volume of desorbed gas. However, the low volume of desorbed gas does not indicate that the shale gas is in situ-generated gas, because a part of the gas generated by shale with higher TOC may migrate and be store within the samples with TOC less than 2%. In order to assess the in situ-generated gas or migrated gas, the gas dryness can be used as a reference. Generally, there is no correlation between the gas volume and the gas dryness, or there is no significant difference in the gas dryness. However, samples with different TOC ranges in the study area have significant differences in gas dryness. Shale samples with TOC between 2% and 6% have the minimum value of gas dryness; shale samples with TOC less than 2% have the maximum value of gas dryness; shale samples with TOC larger than 6% have a medium value of gas dryness. Since the migration ability of CH4 is stronger than that of heavy hydrocarbon gases, the fractionation is likely caused by gas migration.
Based on the geological characteristics of shale and shale gas, the shale gas desorbed from different shale samples in the YC23 Well can be defined as three types, namely, generated gas, retained gas and accumulated gas (Figure 7 and Figure 9) (Table 2). By comparing the difference in the components of the generated gas, retained gas and accumulated gas, the shale gas migration and occurrence characteristics can be fully analyzed.
The generated gas has the following characteristics: (1) shale gas is located in the middle part of thick high-quality shale (about 18 m or 59 ft thick, TOC larger than 6%); (2) shale samples that host generated gas are able to generate large amounts of gas and the volume of desorbed gas is large; (3) the generated gas has no migration or weak migration; and (4) the shale gas is mainly in situ-generated gas.
The retained gas has the following characteristics: (1) shale gas is located in the thin shale and marginal parts of thick shale (TOC is between 2% and 6%); (2) shale samples that host retained gas have medium gas generation ability and the volume of desorbed gas is medium; (3) part of the generated gas migrates out of shale; and (4) the shale gas is only partly in situ generated gas.
The accumulated gas has the following characteristics: (1) shale gas is located in thin shale (TOC less than 2%); (2) shale samples that host accumulated gas have a small gas generation ability and the volume of desorbed gas is small; (3) the generated gas has no migration or weak migration; and (4) the shale gas is a mixture of in situ-generated gas and migrated gas.

6.2. Migration of Different Gas Components

In the burial depth range of 1400–1418 m (4592–4651 ft) of the YC23 Well, the heterogeneity of the shale system is very weak (only a small amount of sandy lamina is contained therein), and the TOC values are extremely high. In the shale section of 1400–1418 m (4592–4651 ft), the volume of desorbed gas is relatively high compared with other sections with highly developed sandy lamina or sandstone (Figure 5). Thus, it can be inferred that the volume of desorbed gas in thick shale is large and that in thin shale is small. The abovementioned characteristics are likely to indicate that the shale gas in the thick shale has difficultly migrating, while the shale gas in the thin shale migrates easily. In fact, whether it is a marine sedimentary system or lacustrine sedimentary system, oil and gas migrate easily due to the improved seepage conditions (the effective contact between thin shale and sandstone can improve the seepage conditions); however, oil and gas have difficultly migrating within thick shale due to poor seepage conditions [10,31,32].
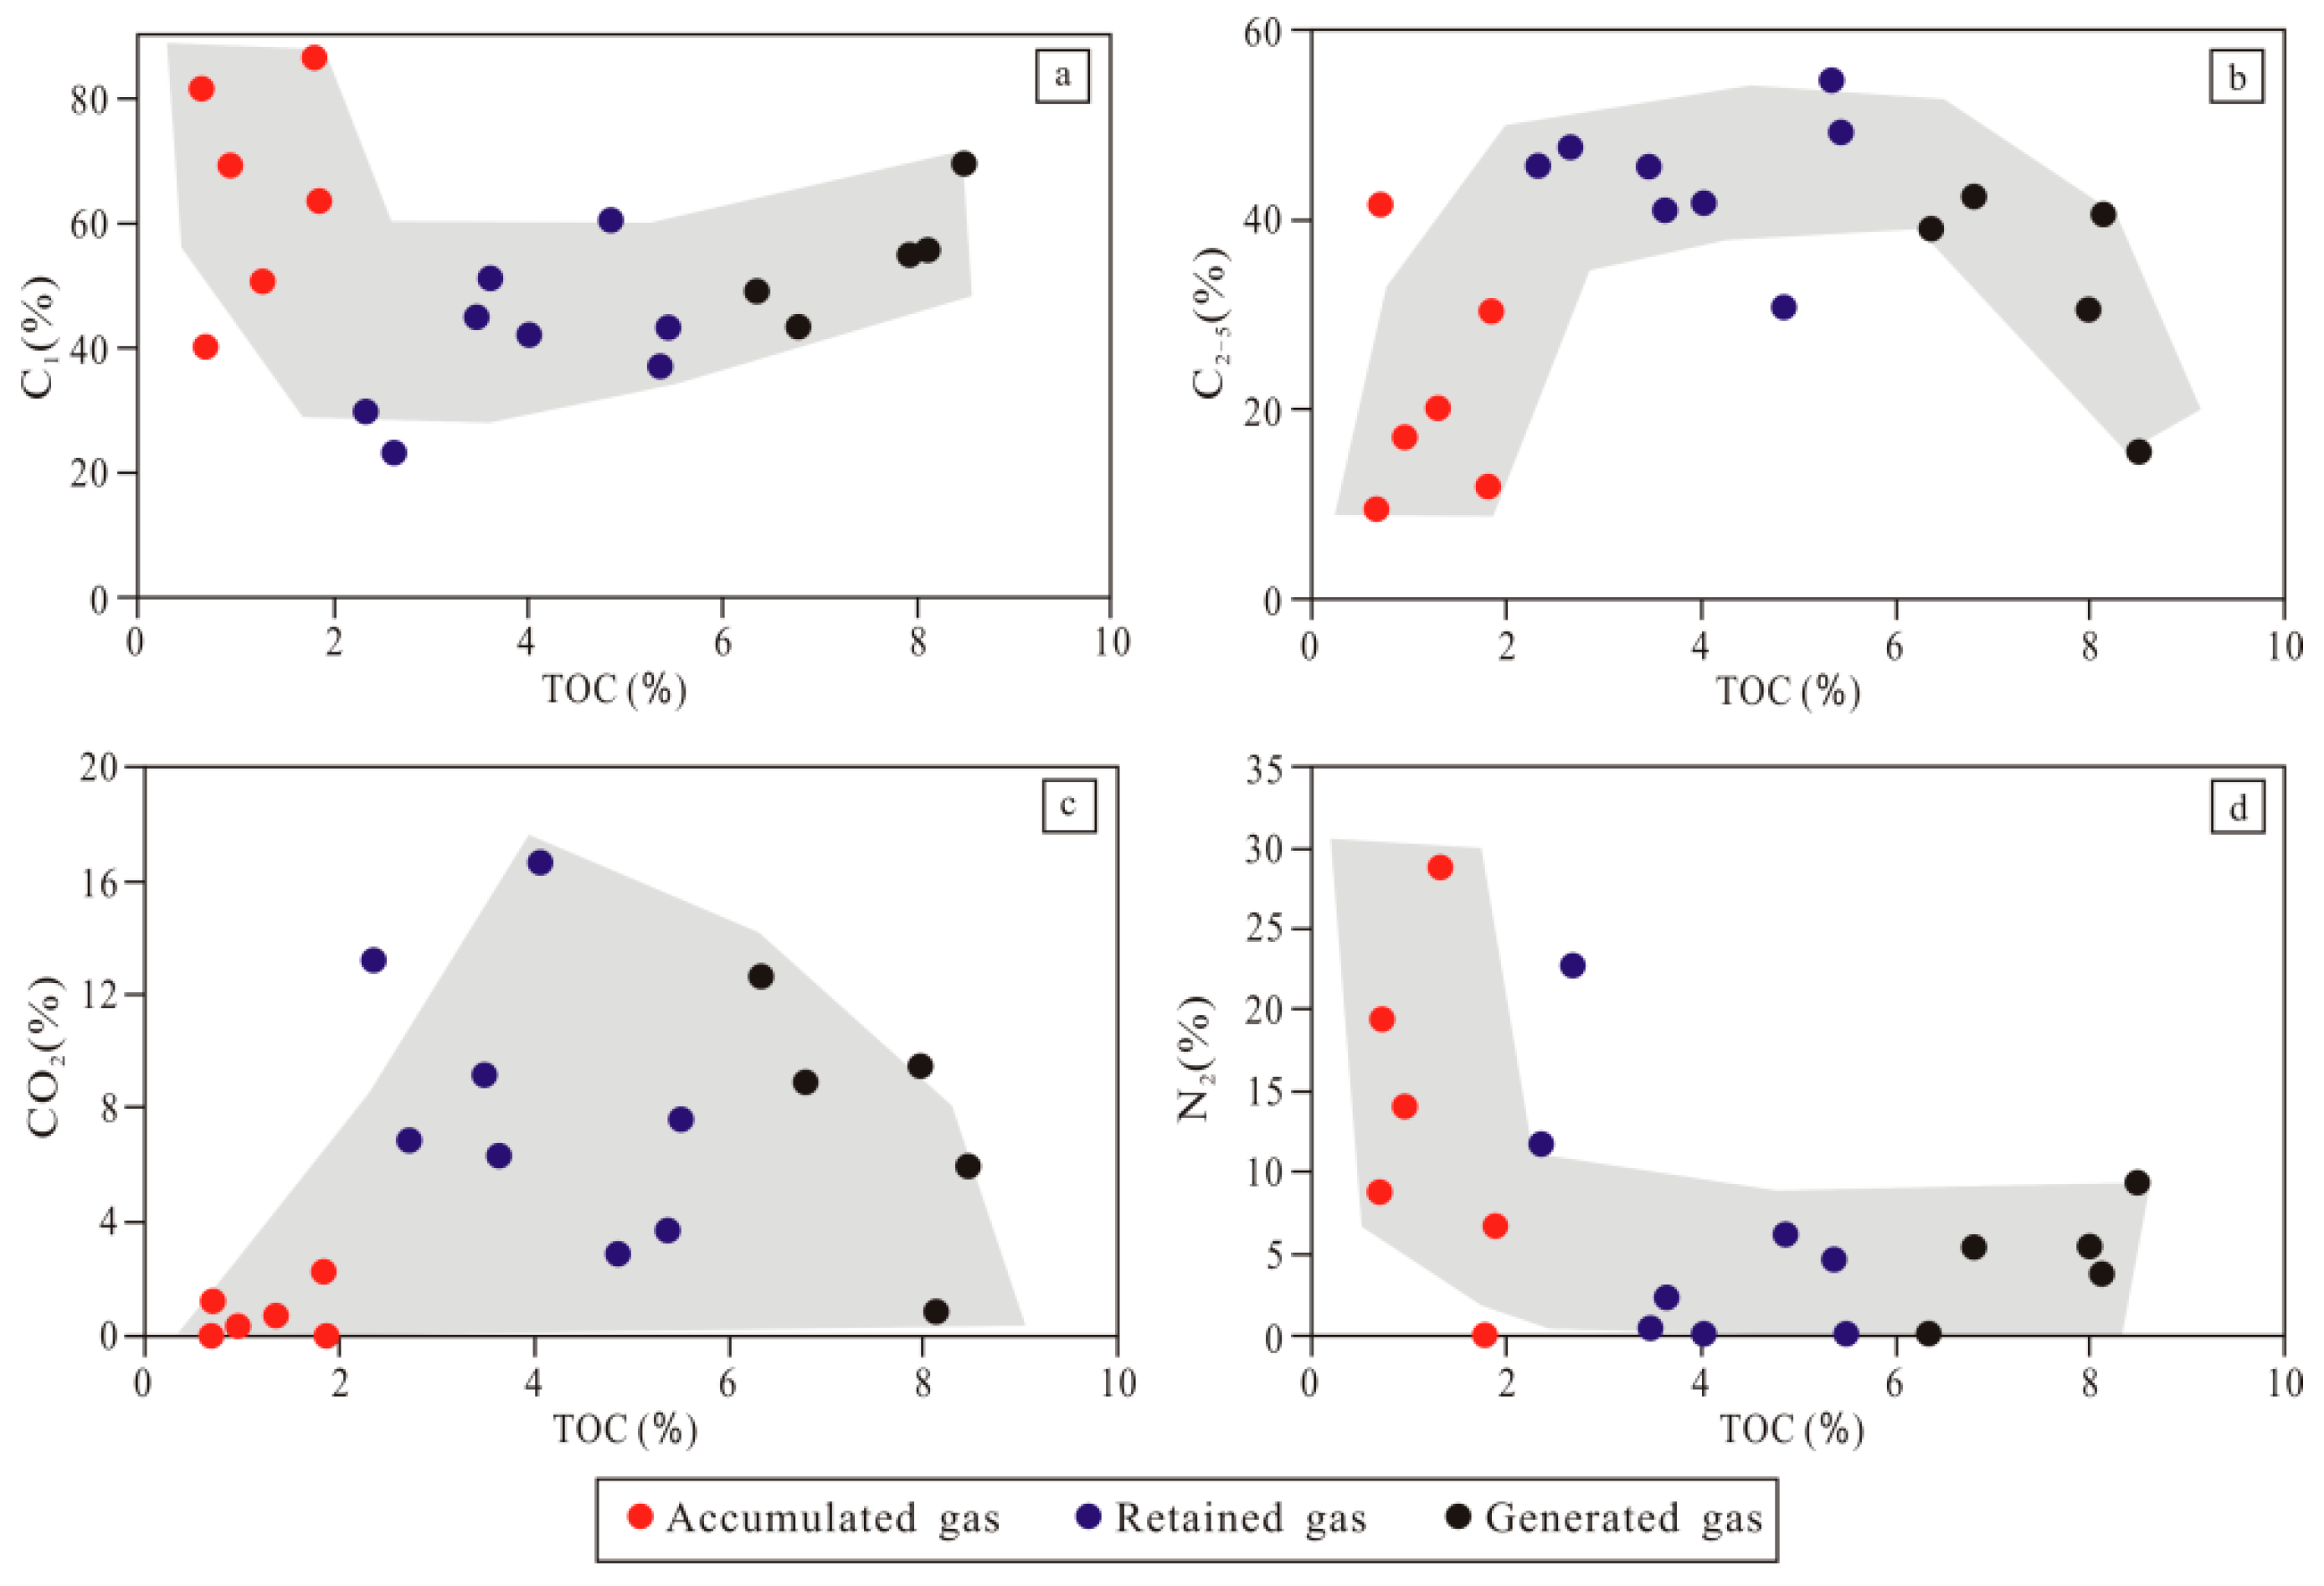
The CH4 content of the accumulated gas in the YC23 Well ranges from 39.31% to 85.95% (average content of 64.73%). The CH4 content of the retained gas ranges from 22.89% to 60.36% (average content is 41.35%). The CH4 content of the generated gas ranges from 43.30% to 69.59% (average content of 54.39%). The content of heavy gases in the accumulated gas of the YC23 Well ranges from 9.28% to 41.29% (an average content of 21.58%). The content of heavy gases in the retained gas ranges from 30.66% to 54.67% (average content is 44.38%). The content of heavy gases in the generated gas ranges from 15.07% to 42.45% (average content is 33.41%) (Figure 10a,b). It can be inferred that the accumulated gas has the highest content of CH4 and the lowest content of heavy gases; the generated gas has the medium content of CH4 and the medium content of heavy gases; the retained gas has the lowest content of CH4 and the highest content of heavy gases.
Since the migration ability of CH4 is stronger than that of heavy hydrocarbon gases under the same geological conditions, the difference in the content of CH4 and heavy gases can be used to confirm the migration status [33,34]. For accumulated gas, the shale gas desorbed from low organic shale (TOC < 2%). The most likely reason for the high content of CH4 and low content of heavy gases is that some CH4 underwent gas migration and was then stored with the in situ-generated gas. For the retained gas, the shale gas desorbed from medium organic shale (2% < TOC < 6%). The most likely reason for the low content of CH4 and high content of heavy gases is that some CH4 underwent gas migration and then parts of the in situ-generated gas were stored. For the generated gas, the shale gas desorbed from high organic shale (TOC > 6%). The content of CH4 and heavy gases are at a medium level due to minor gas migration or no migration.
The CO2 content of the accumulated gas in the YC23 Well ranges from 0.00% to 2.30% (average content of 0.75%). The CO2 content of the retained gas ranges from 2.82% to 16.66% (average content of 8.30%); and the CO2 content of the generated gas ranges from 0.62% to 12.53% (average content of 7.46%). The N2 content of the accumulated gas ranges from 0.00% to 28.80% (average content of 12.95%); the N2 content of retained gas ranges from 0.00% to 22.71% (average content of 5.97%); and the N2 content of the generated gas ranges from 0.00% to 9.43% (average content of 4.75%) (Figure 10c,d). It can be inferred that the CO2 content of accumulated gas is very low, and the CO2 content of generated gas and retained gas is very high; the N2 content of accumulated gas is very high; and the N2 content of generated gas and retained gas is very low.
Both the mineral particles and the kerogen have stronger adsorption ability for CO2 compared with N2; therefore, N2 migrates easily and the migration of CO2 is very difficult in the shale system [6,7,9,35,36]. Thus, the difference in the content of CO2 and N2 can be used to confirm the shale gas migration. For the accumulated gas, the high content of N2 is probably caused by gas migration as the N2 has a strong migration ability whereas CO2 has a weak migration ability. Similarly, a large amount of N2 underwent migration; thus, the retained gas has a lower content of N2 and a higher content of CO2.
For the accumulated gas in the YC23 Well, the content of N2 and CH4 ranges from 58.71% to 89.51% (average content of 77.67%); the content of heavy gases ranges from 9.28% to 41.29% (average content of 21.58%); and the content of CO2 ranges from 0.00% to 2.30% (average content of 0.75%). For the retained gas in the YC23 Well, the content of N2 and CH4 ranges from 41.23% to 66.51% (average content of 47.32%); the content of heavy gases ranges from 30.66% to 54.67% (average content of 44.38%); and the content of CO2 ranges from 2.82% to 16.66% (an average content of 8.30%). For the generated gas in the YC23 Well, the content of N2 and CH4 ranges from 48.58% to 79.02% (average content of 59.13%); the content of heavy gases ranges from 15.07% to 42.45% (average content of 33.41%); and the content of CO2 ranges from 0.62% to 12.53% (average content of 7.46%). On the ternary plots of the gas components, the accumulated gas samples are mainly distributed in the upper left corner of the chart, the retained gas samples are mainly distributed in the lower left corner of the chart, and the generated gas samples are mainly distributed in the middle of the chart (Figure 11). Thus, it can be inferred that each different gas component has a unique migration ability, and as a result, the accumulated gas, retained gas and generated gas have different component contents.
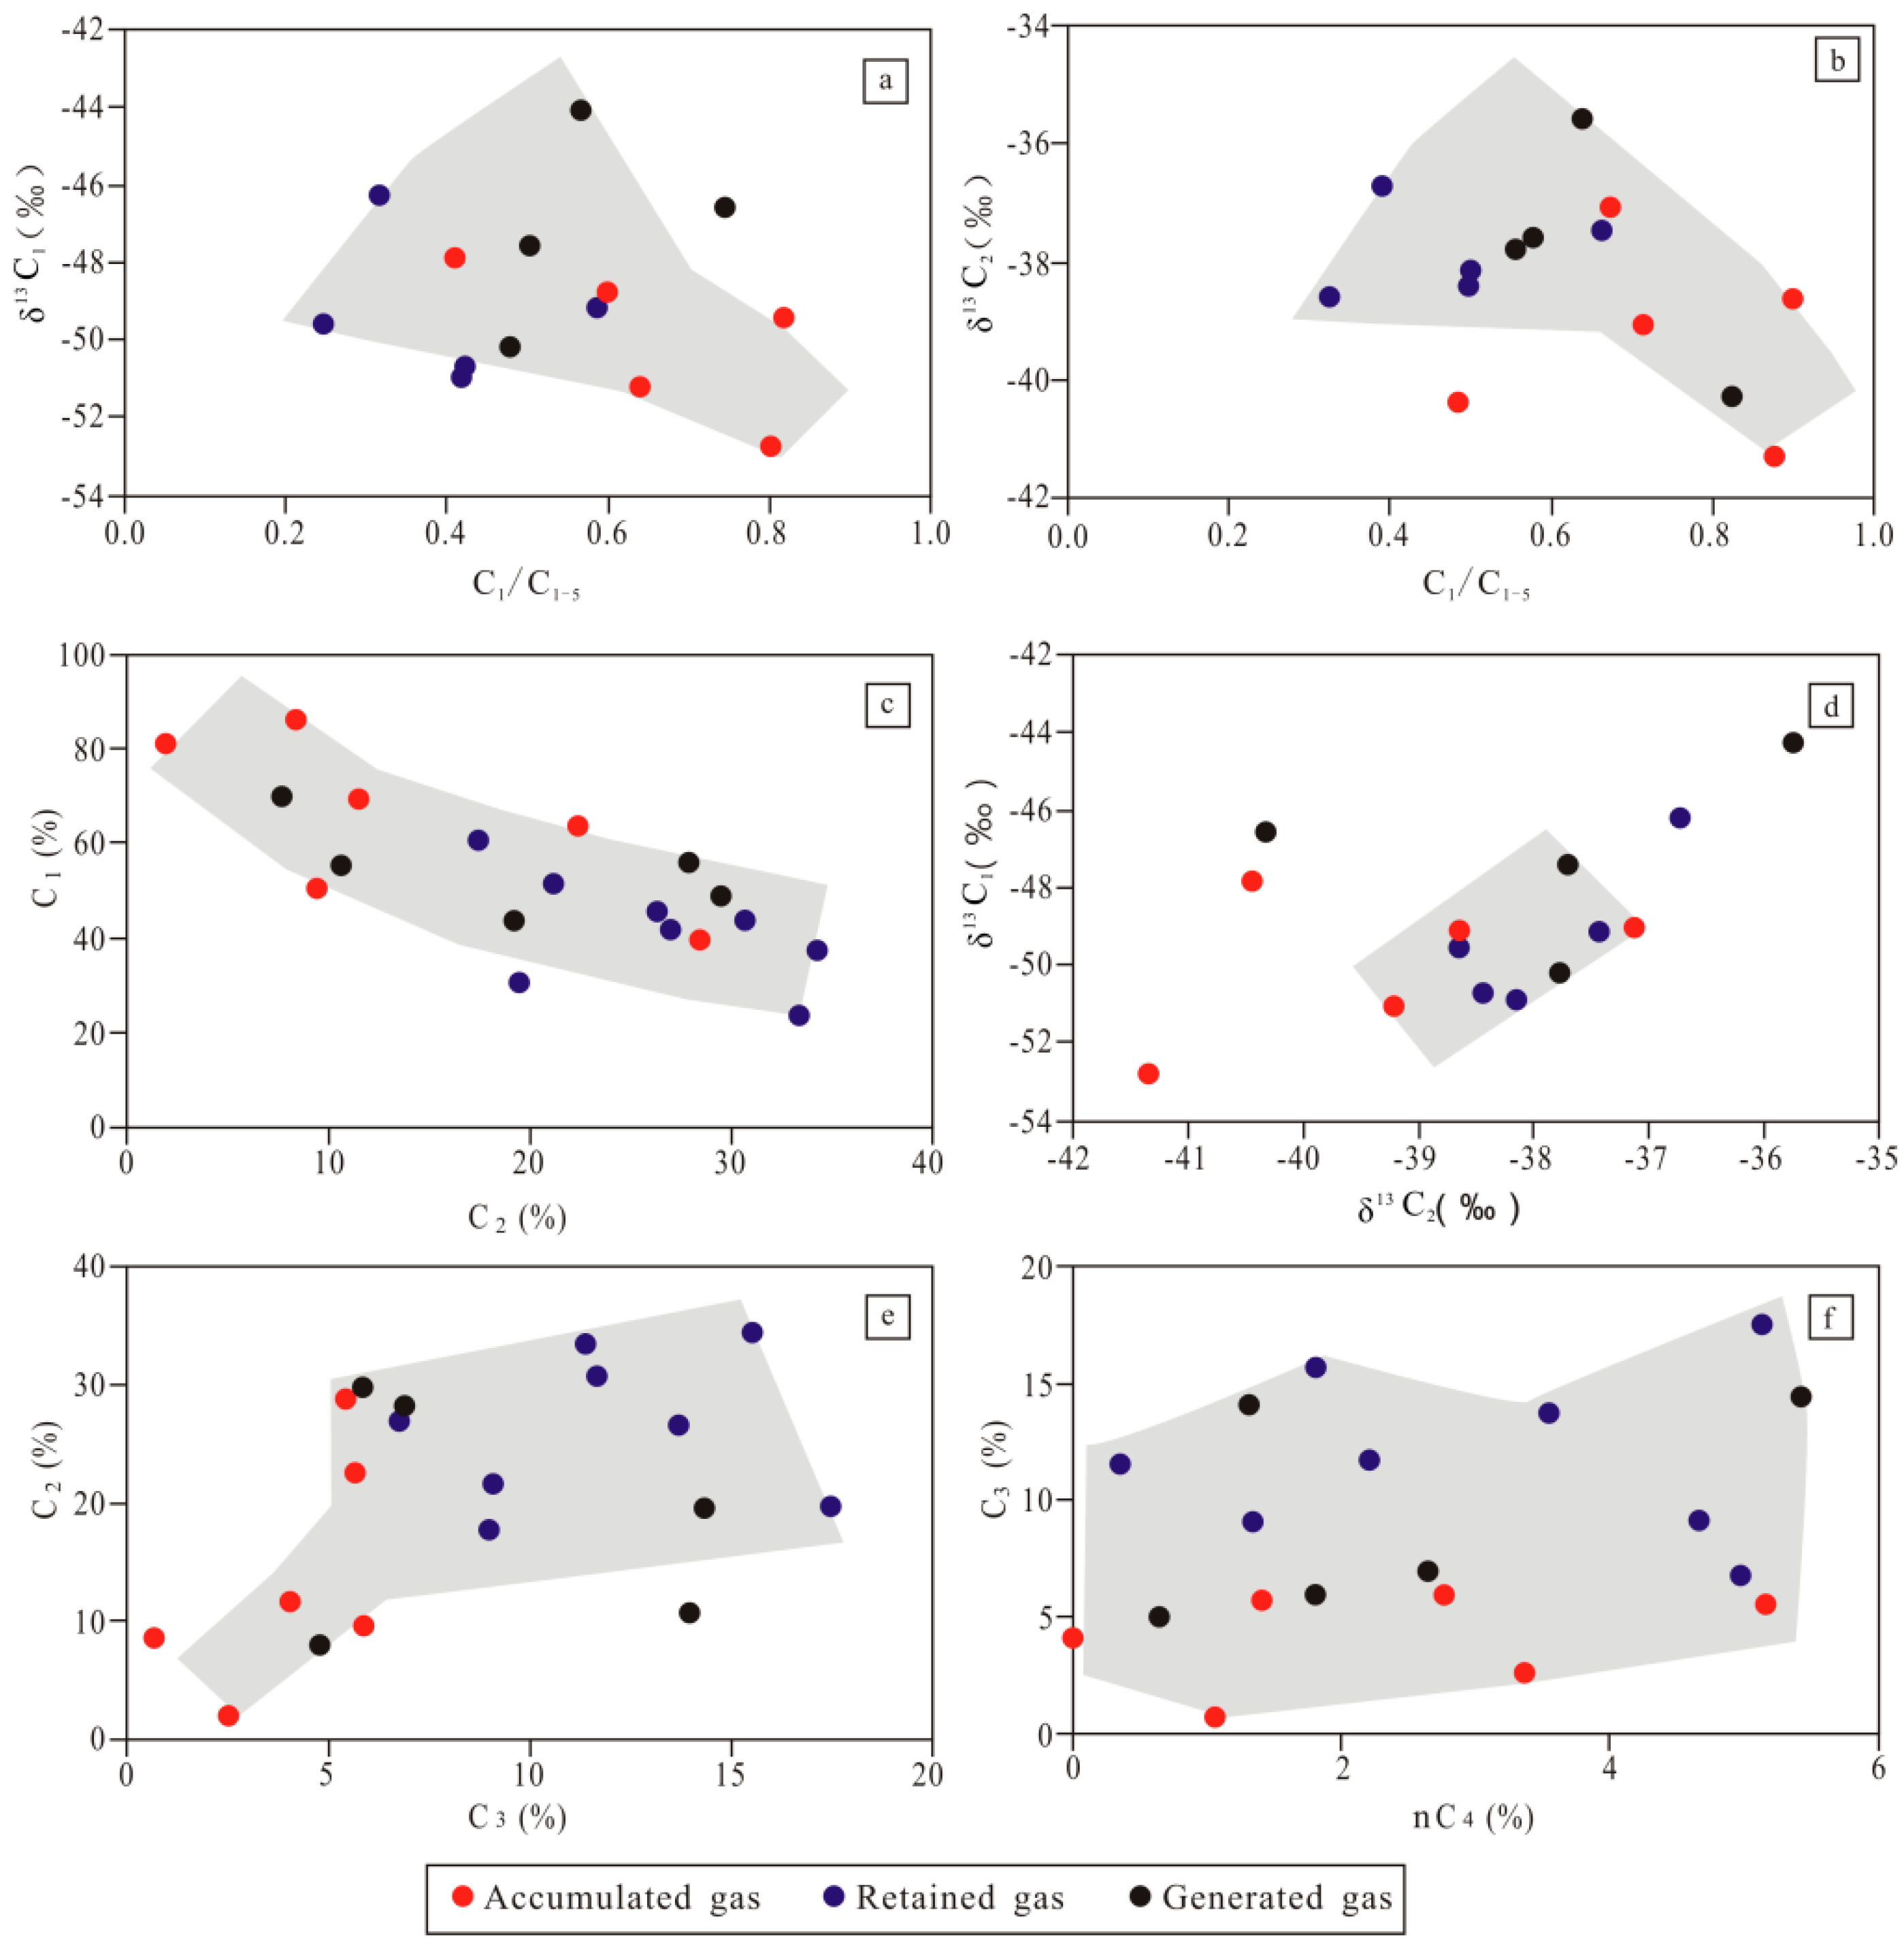
For the accumulated gas in the YC23 Well, the value of δ13C1 ranges from −50.06‰ to −47.9‰ (average value of −52.8‰), and the value of δ13C2 ranges from −39.3‰ to -37.1‰ (average value of −41.3‰). For the retained gas in the YC23 Well, the value of δ13C1 ranges from −49.36‰ to −46.3‰ (average value of −50.9‰), and the value of δ13C2 ranges from −37.88‰ to −36.7‰ (average value of −38.6‰). For the generated gas in the YC23 Well, the value of δ13C1 ranges from −47.13‰ to -44.1‰ (average value of −50.2‰), and the value of δ13C2 ranges from −37.83‰ to −35.6‰ (average value of −40.3‰) (Figure 12a,b). It can be inferred that the accumulated gas has relatively light δ13C1 values and δ13C2 values, and the retained gas and the generated gas have relatively heavy δ13C1 values and δ13C2 values. During the gas migration process, δ13C1 is one of the easiest components to migrate compared with other carbon isotopes including δ13C2, δ13C3, δCO2. Thus, it is easy to show a migration fractionation for δ13C1 during gas migration [37,38,39]. Therefore, the δ13C1 values can be used as indicators to assess gas migration. For the accumulated gas, there must be more gas with relatively light δ13C1, as δ13C1 migrates more easily compared with other carbon isotopes. In addition, there is little difference in δ13C2 in the retained gas and the generated gas, although the accumulated gas has a relatively light weight δ13C2 value (Figure 12b). Thus, it can be inferred that the difference in the δ13C2 value is probably not caused by gas migration, but by the gas generation, because different shale samples have difference gas generation abilities.
The amount of gas components is controlled not only by gas migration, but also by the gas generation ability within the shale system. Generally, gas components with major differences in migration ability show strong gas fractionation, whereas gas components with minor differences in migration ability show poor gas fractionation [13,15,27]. For the accumulated gas, the retained gas and the generated gas in the YC23 Well, the gas fractionation of CH4 and C2H6 was very significant (Figure 12c). However, the carbon isotopes of CH4 and C2H6 showed a concentrated distribution, indicating poor gas fractionation (Figure 12d). For the heavy gases including propane, and n-butane, there was no gas fractionation (Figure 12e,f). This further proves that the difference in the values of δ13C2 is not caused by gas migration, but is likely to be caused by the gas generation. Similarly, the differences in the content of heavy gases is not caused by gas migration, but by the gas generation.
Thus, it can be inferred that there are content differences among the gas compositions stored in different locations due to gas migration. For the gas components, CH4 is easier to migrate than heavy hydrocarbon gases; N2 is easier to migrate than CO2; δ13C1 is easier to migrate than other carbon isotopes; and lighter δ13C1 is easier to migrate than heavier δ13C1.

7. Conclusions

The average volume of desorbed gas in Chang-7 shale is 1.25 m3/t. The Chang-7 shale gas is an oil-type gas of thermogenic origin, and the parent material of Chang-7 shale gas is mainly sapropel organic matter.
The Chang-7 shale gas in the YC23 Well can be sorted into three categories including generated gas, retained gas and accumulated gas.
For the YC23 Well, shale gas in different locations has unique components due to migration differences. The distribution of the gas components within the shale system is an effective indicator of gas migration.

Author Contributions

B.F. designed the project; B.F. wrote this paper and L.S. corrected it; B.F. performed the experiments; X.W., C.W., Y.L. and F.H. analyzed the data and drew the figures. All authors have read and agreed to the published version of the manuscript.

Funding

This study is supported by the Natural Science Foundation of Sinopec Key Laboratory of Shale Oil/Gas Exploration and Production Technology (33550000-21-ZC06130322).

Acknowledgments

We thank the Sinopec Key Laboratory of Shale Oil/Gas Exploration and Production Technology for providing funding for this project. We are grateful to the editors and reviewers for their constructive comments and suggestions.

Conflicts of Interest

The authors declare no conflict of interest.

References

  1. Bertard, C.; Bruyet, B.; Gunther, J. Determination of desorbable gas concentration of coal (direct method). Int. J. Rock Mech. Min. Sci. Geomech. Abstr. 1970, 7, 43–65. [Google Scholar] [CrossRef]
  2. Yee, D.; Seidle, J.P.; Hanson, W.B. Gas Sorption on Coal and Measurement of Gas Content. In Hydrocarbons from Coal; American Association of Petroleum Geologists: Tulsa, OK, USA, 1993; pp. 203–218. ISBN 978-1-6298-1104-8. [Google Scholar]
  3. Han, H.; Li, D.; Ma, Y.; Cheng, L.; Zhong, N. The origin of marine shale gas in the northeastern Sichuan Basin, China: Implications from chemical composition and stable carbon isotope of desorbed gas. Shiyou Xuebao/Acta Pet. Sin. 2013, 34, 453–459. [Google Scholar]
  4. Fan, B.J.; Wang, X.Z.; Shi, L. Gas desorption of low-maturity lacustrine shales, trassic yanchang formation, Ordos Basin, China. Open Geosci. 2018, 10, 688–698. [Google Scholar] [CrossRef]
  5. Sun, Z.P.; Wang, Y.L.; Wei, Z.F.; Zhang, M.F.; Wang, G.; Wang, Z.X. Characteristics and origin of desorption gas of the Permian Shanxi Formation shale in the Ordos Basin, China. Energy Explor. Exploit. 2017, 35, 792–806. [Google Scholar] [CrossRef] [Green Version]
  6. Stainforth, J.G. Practical kinetic modeling of petroleum generation and expulsion. Mar. Pet. Geol. 2009, 26, 552–572. [Google Scholar] [CrossRef]
  7. Stewart, B.W.; Capo, R.C.; Kirby, C.S. Geochemistry of unconventional shale gas from formation to extraction: Petrogenesis, hydraulic fracturing, and environmental impacts. Appl. Geochem. 2015, 60, 1–2. [Google Scholar] [CrossRef]
  8. Bruns, B.; Littke, R.; Gasparik, M.; van Wees, J.D.; Nelskamp, S. Thermal evolution and shale gas potential estimation of the Wealden and Posidonia Shale in NW-Germany and the Netherlands: A 3D basin modelling study. Basin Res. 2016, 28, 2–33. [Google Scholar] [CrossRef] [Green Version]
  9. Charoensuppanimit, P.; Mohammad, S.A.; Gasem, K.A. Measurements and modeling of gas adsorption on shales. Energy Fuels 2016, 30, 2309–2319. [Google Scholar] [CrossRef]
  10. Hu, Z.Q.; Du, W.; Sun, C.X.; Wu, J.; Zhu, T.; Zhao, J.H.; Yan, C.N. Evolution and migration of shale facies and their control on shale gas: A case study from the Wufeng-Longmaxi Formations in the Sichuan Basin and its surroundings. Interpretation 2018, 6, 57–70. [Google Scholar] [CrossRef]
  11. Wang, X.Z. Characteristics of Chang 7 shale gas in the triassic Yanchang formation, Ordos basin, China. Interpretation 2017, 5, 31–39. [Google Scholar] [CrossRef]
  12. Cui, J.W.; Zhu, R.K.; Luo, Z.; Li, S. Sedimentary and geochemical characteristics of the Triassic Chang 7 member shale in the southeastern Ordos Basin, Central China. Pet. Sci. 2019, 16, 285–297. [Google Scholar] [CrossRef] [Green Version]
  13. Zhang, T.W.; Sun, X.; Ruppel, S.C. Hydrocarbon geochemistry and pore characterization of the Bakken Formation and implications for oil migration and oil saturation. In Proceedings of the 2013 Meeting of Mudrock Systems Research Laboratory, Pittsburgh, PA, USA, 19–22 May 2013; pp. 166–178. [Google Scholar]
  14. Neal, R.O. Shale lamination and sedimentary processes. Geol. Soc. Lond. Spec. Publ. 1996, 116, 23–36. [Google Scholar] [CrossRef]
  15. Fathi, E.; Akkutlu, I.Y. Matrix heterogeneity effects on gas transport and adsorption in coalbed and shale gas reservoirs. Transp. Porous Media 2009, 80, 281–304. [Google Scholar] [CrossRef]
  16. McCarthy, J.F. Analytical models of the effective permeability of sand-shale reservoirs. Geophys. J. Int. 1991, 105, 513–527. [Google Scholar] [CrossRef] [Green Version]
  17. Tao, H.; Pang, X.Q.; Shu, J.; Wang, Q.F.; Zheng, X.W.; Ding, X.G.; Zhao, Y.; Zhu, C.X.; Hui, L. Oil content evaluation of lacustrine organic-rich shale with strong heterogeneity: A case study of the middle permian lucaogou formation in jimusaer sag, junggar basin, NW China. Fuel 2018, 221, 196–205. [Google Scholar]
  18. Fan, B.J.; Shi, L.; Li, Y.T.; Zhang, T.J.; Lv, L.; Tong, S.K. Lithologic heterogeneity of lacustrine shale and its geological significance for shale hydrocarbon-a case study of Zhangjiatan shale. Open Geosci. 2019, 11, 101–112. [Google Scholar] [CrossRef]
  19. Li, H.; Tang, H.M.; Zheng, M.J. Micropore structural heterogeneity of siliceous shale reservoir of the Longmaxi formation in the southern Sichuan Basin, China. Minerals 2019, 9, 548. [Google Scholar] [CrossRef] [Green Version]
  20. Fan, B.J. Effect of lithological heterogeneity on shale oil occurrence—A case study in Ansai oil field. Arab. J. Geosci. 2022, 15, 107. [Google Scholar]
  21. Fan, B.J.; Shi, L. Deep-lacustrine shale heterogeneity and its impact on hydrocarbon generation, expulsion, and retention: A case study from the upper triassic Yanchang Formation, Ordos Basin, China. Nat. Resour. Res. 2019, 28, 241–257. [Google Scholar] [CrossRef]
  22. Wang, Z.W.; Wang, J.; Fu, X.G.; Zhan, W.Z.; Armstrong-Altrin, J.S.; Yu, F.; Feng, X.L.; Song, C.Y.; Zeng, S.Q. Geochemistry of the Upper Triassic black mudstones in the Qiangtang Basin, Tibet: Implications for paleoenvironment, provenance, and tectonic setting. J. Asian Earth Sci. 2018, 160, 118–135. [Google Scholar] [CrossRef]
  23. Fan, B.J. Characteristics and Origin of Organic Matter in Triassic Lacustrine Shale from Fuxian Oilfield. Front. Earth Sci. 2021, 9, 752954. [Google Scholar]
  24. Bernard, B.; Brooks, J.M.; Sackett, W.M. A geochemical model for characterization of hydrocarbon gas sources in marine sediments. In Proceedings of the Offshore Technology Conference, Houston, TX, USA, 2 May 1977; pp. 435–438. [Google Scholar] [CrossRef]
  25. Huang, Z.L.; Liu, G.H.; Li, T.J.; Li, Y.T.; Yin, Y.; Wang, L. Characterization and control of mesopore structural heterogeneity for low thermal maturity shale: A case study of Yanchang Formation Shale, Ordos Basin. Energy Fuels 2017, 31, 11569–11586. [Google Scholar] [CrossRef]
  26. Zou, C.N.; Pan, S.Q.; Horsfield, B.; Yang, Z.; Hao, S.Y.; Liu, E.T.; Zhang, L.F. Oil retention and intrasource migration in the organic-rich lacustrine chang 7 shale of the upper triassic yanchang formation, ordos basin, central china. AAPG Bull. 2019, 103, 2627–2663. [Google Scholar] [CrossRef]
  27. Wang, X.F.; Li, X.F.; Wang, X.Z.; Shi, B.G.; Luo, X.R.; Zhang, L.X.; Lei, Y.H.; Jiang, C.F.; Meng, Q. Carbon isotopic fractionation by desorption of shale gases. Mar. Pet. Geol. 2015, 60, 79–86. [Google Scholar] [CrossRef]
  28. Wang, Q.; Fu, X.; Xu, Z. Development and application of stable carbon isotopes in natural gas and oil geochemistry. Nat. Gas Geosci. 2005, 16, 233–237, (In Chinese with English Abstract). [Google Scholar]
  29. Song, Y.; Xu, Y.C. Origin and identification of natural gas. Pet. Explor. Dev. 2005, 32, 24–29. [Google Scholar]
  30. Dai, J.X.; Gong, D.Y.; Ni, Y.Y.; Yu, C.; Wu, W. Genetic types of the alkane gases in giant gas fields with proven reserves over 1000 × 108 m3 in China. Energy Explor. Exploit. 2014, 32, 1–18. [Google Scholar] [CrossRef] [Green Version]
  31. Jarvie, D.M.; Hill, R.J.; Ruble, T.E.; Pollastro, R.M. Unconventional shale-gas systems: The Mississippian Barnett Shale of north-central Texas as one model for thermogenic shale-gas assessment. AAPG Bull. 2007, 91, 475–499. [Google Scholar] [CrossRef]
  32. Akihiko, O. Current understanding of hydrocarbon generation and migration in shale rocks. J. Jpn. Assoc. Pet. Technol. 2013, 78, 5–15. [Google Scholar]
  33. Hammond, P.A. The relationship between methane migration and shale-gas well operations near Dimock, Pennsylvania, USA. Hydrogeol. J. 2015, 24, 503–519. [Google Scholar] [CrossRef] [Green Version]
  34. Lin, S.H.; Zhi, Y.; Hou, L.H.; Xia, L.; Qun, L. Geostatistic recognition of genetically distinct shale facies in upper Triassic chang 7 section, the Ordos Basin, North China. Mar. Pet. Geol. 2019, 102, 176–186. [Google Scholar]
  35. Clarkson, C.R.; Solano, N.; Bustin, R.M.; Bustin, A.M.M.; Chalmers, G.R.; He, L.; Melnichenko, Y.B.; Radliński, A.P.; Blach, T.P. Pore structure characterization of North American shale gas reservoirs using USANS/SANS, gas adsorption, and mercury intrusion. Fuel 2013, 103, 606–616. [Google Scholar] [CrossRef]
  36. Du, X.D.; Gu, M.; Liu, Z.J.; Zhao, Y.; Sun, F.L.; Wu, T.F. Enhanced shale gas recovery by the injections of CO2, N2, and CO2/N2 mixture gases. Energy Fuels 2019, 33, 5091–5101. [Google Scholar] [CrossRef]
  37. Dai, J.X.; Ni, Y.Y.; Gong, D.Y.; Feng, Z.Q.; Liu, D.; Peng, W.L.; Han, W.X. Geochemical characteristics of gases from the largest tight sand gas field (Sulige) and shale gas field (Fuling) in China. Mar. Pet. Geol. 2016, 79, 426–438. [Google Scholar] [CrossRef]
  38. Li, W.B.; Lu, S.F.; Li, J.Q.; Zhang, P.F.; Wang, S.Y.; Feng, W.J.; Wei, Y.B. Carbon isotope fractionation during shale gas transport: Mechanism, characterization and significance. Sci. China Earth Sci. 2020, 63, 674–689. [Google Scholar] [CrossRef]
  39. Li, J.L.; Zhang, T.S.; Li, Y.J.; Liang, X.; Wang, X.; Zhang, J.H.; Zhang, Z.; Shu, H.L.; Rao, D.Q. Geochemical characteristics and genetic mechanism of the high-N2 shale gas reservoir in the Longmaxi Formation, Dianqianbei Area, China. Pet. Sci. 2020, 17, 939–953. [Google Scholar] [CrossRef]
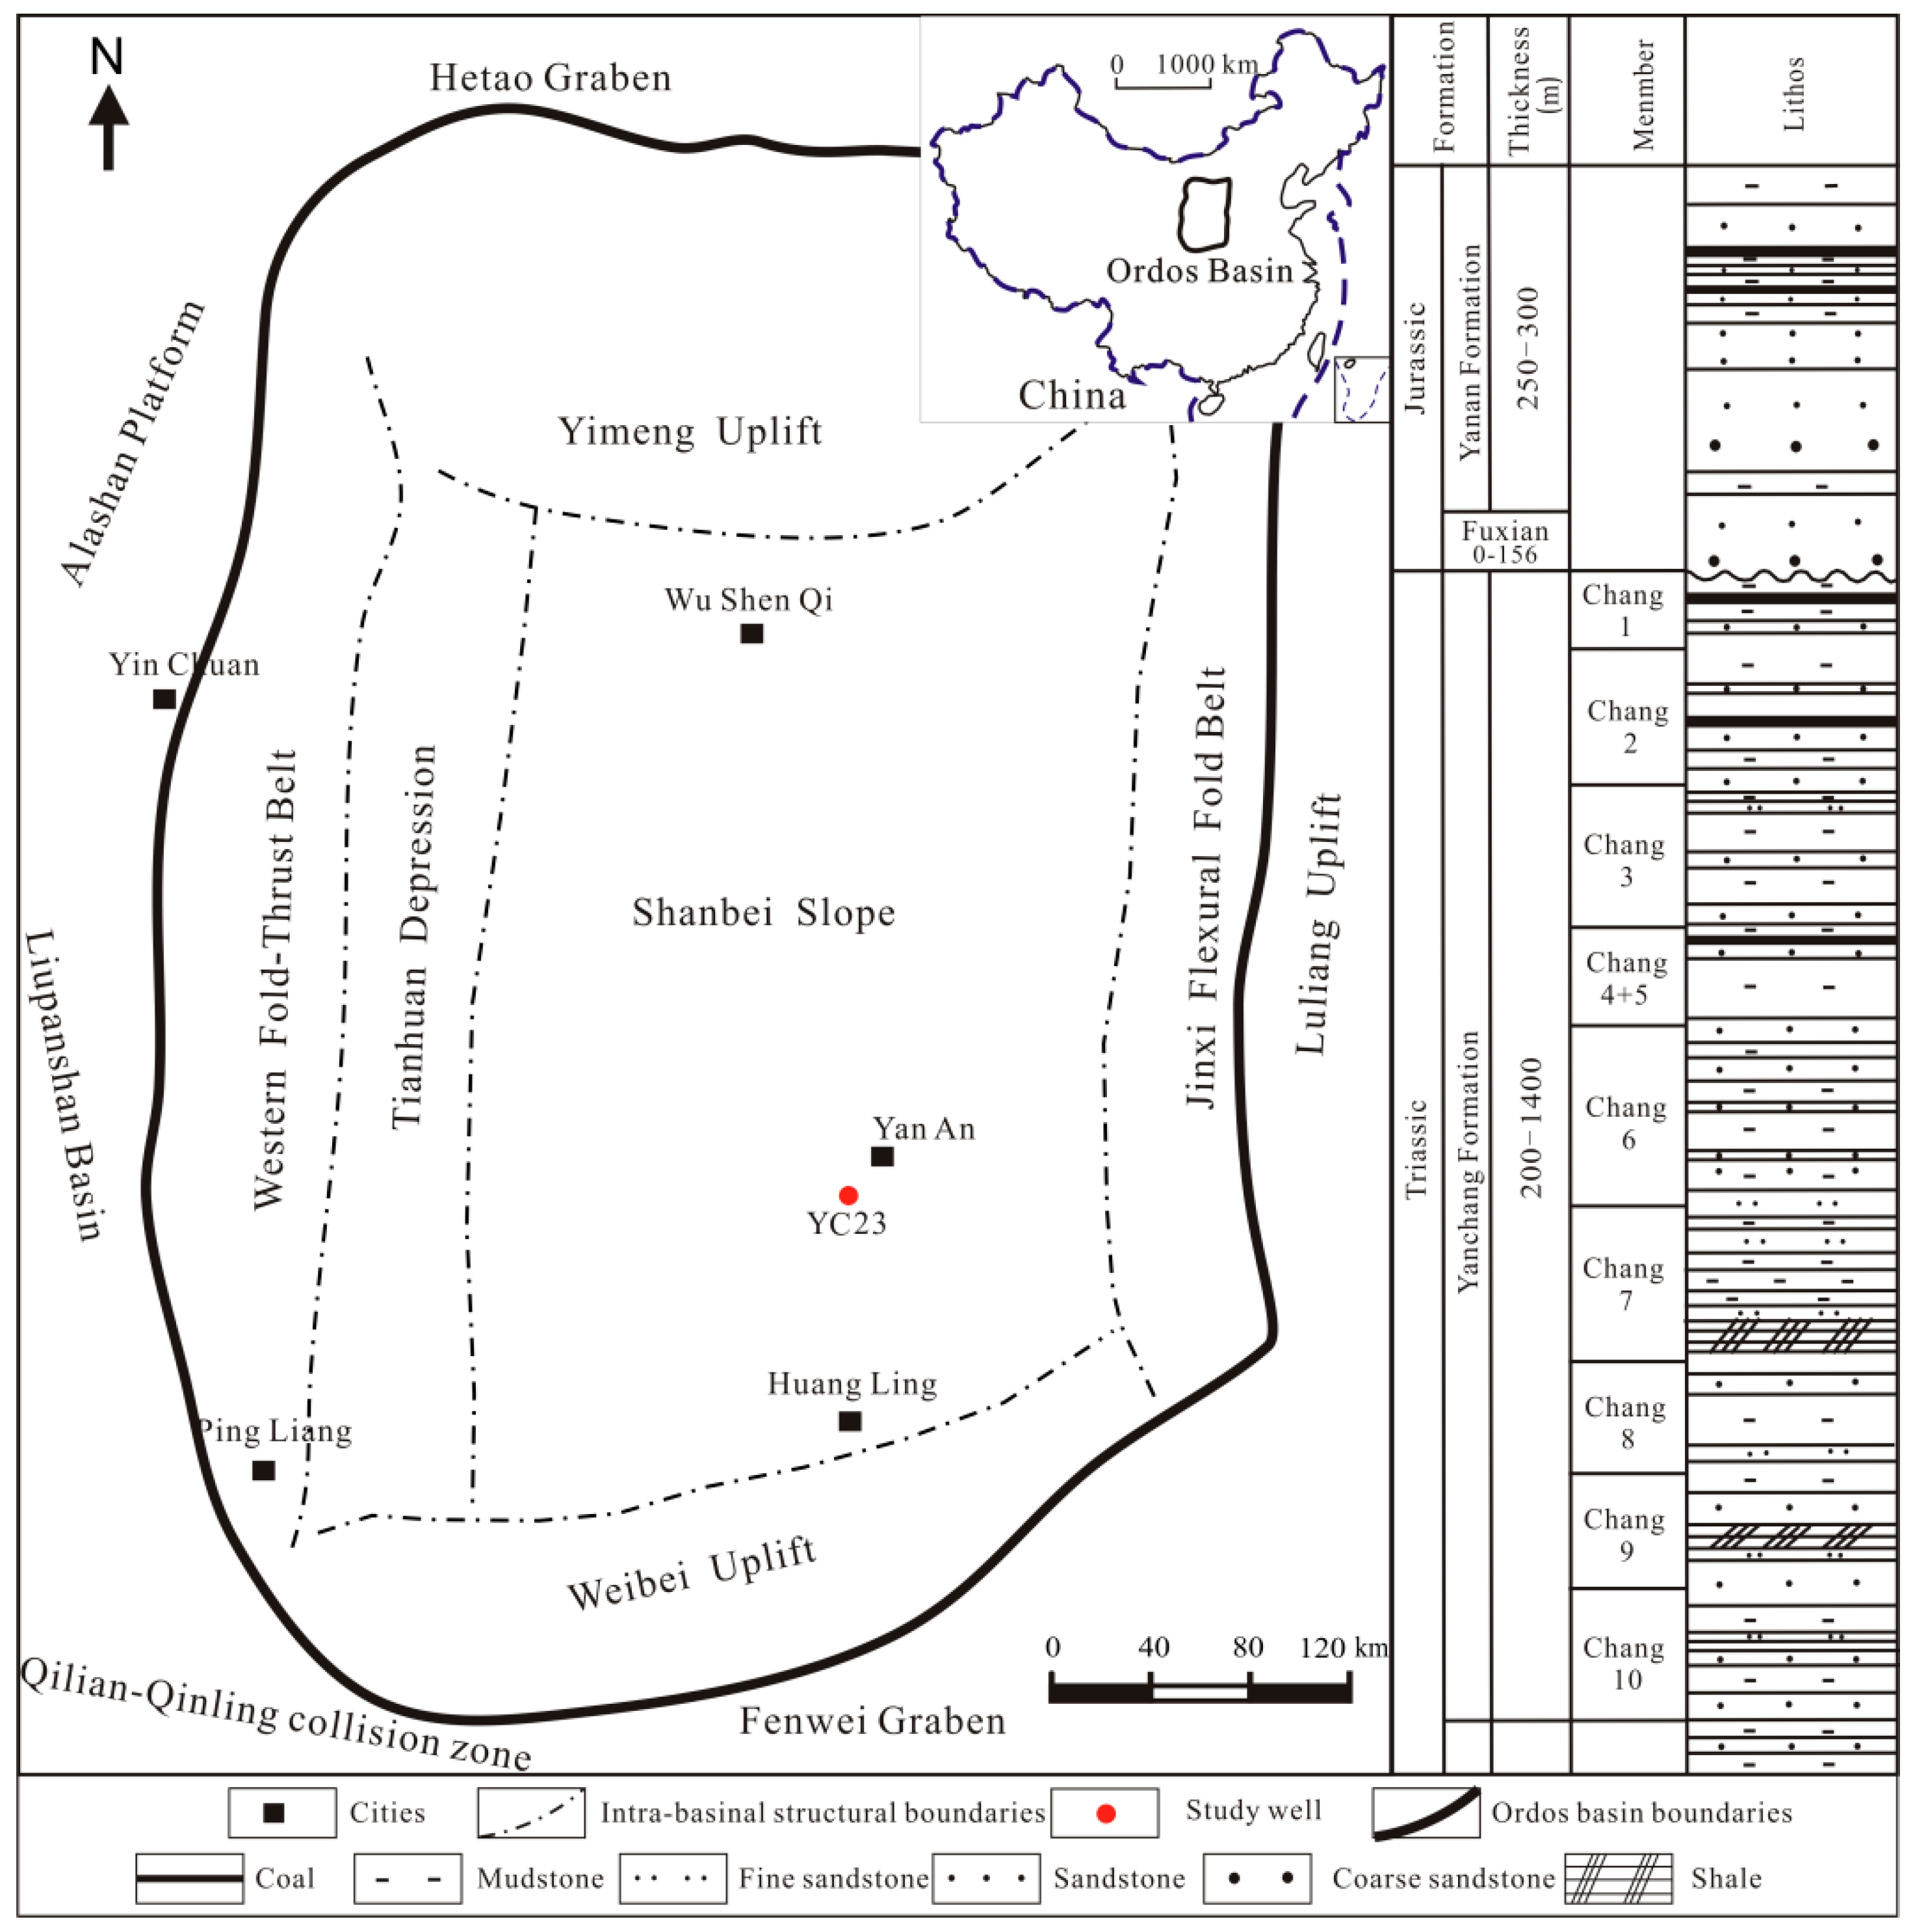
Figure 1. Map showing the stratigraphic succession of Ordos Basin and the location of the study well.
Minerals 12 00397 g001
Figure 2. Chart showing the workflow and purpose of experiments.
Minerals 12 00397 g002
Figure 3. The volume percentage of different gas components. C1: methane; C2: ethane; C3: propane; iC4: iso-butane; nC4: n-butane; iC5: iso-pentane; nC5: n-pentane; CO2: carbon dioxide; N2: nitrogen.
Minerals 12 00397 g003
Figure 4. The carbon isotopes of different gas components. δ13C1: methane carbon isotopes; δ13C2: ethane carbon isotopes; δ13C3: propane carbon isotopes; δ13nC4: n-butane carbon isotopes; δCO2: carbon dioxide carbon isotopes.
Minerals 12 00397 g004
Figure 5. Cross plots of C1/(C2 + C3) vs δ 13C1.
Minerals 12 00397 g005
Figure 6. Cross plots of carbon isotope (a) CH4 versus C2H6; (b) CH4 versus C3H8. I-coal-type gas; II oil-type gas; III—carbon isotope inversion gas; IV—humic and sapropelic gas; V—mixure of coal-type and oil-type gas; VI—biogas and sub biogas.
Minerals 12 00397 g006
Figure 7. Histogram showing the cores, geological parameters and gas-type classifications.
Minerals 12 00397 g007
Figure 8. Chart showing classification of gas types.
Minerals 12 00397 g008
Figure 9. Parameter characteristics for classifying shale gas. (a) Relationship between TOC and S1; (b) Relationship between TOC and S2; (c) Relationship between desorbed gas and S1; (d) Relationship between desorbed gas and S2; (e) Relationship between desorbed gas and TOC; (f) Relationship between desorbed gas and C1/C1–5.
Minerals 12 00397 g009
Figure 10. Relationship between TOC and different gases. (a) Relationship between CH4 and TOC; (b) Relationship between heavy gases and TOC; (c) Relationship between CO2 and TOC; (d) Relationship between N2 and TOC.
Minerals 12 00397 g010
Figure 11. Ternary plots of N2 + CH4, CO2 and heavy gases.
Minerals 12 00397 g011
Figure 12. The fractionation of different gas components. (a) Relationship between δ13C1 and C1/C1-5; (b) Relationship between δ13C2 and C1/C1-5; (c) Relationship between C1 and C2; (d) Relationship between δ13C1 and δ13C2; (e) Relationship between C2 and C3; (f) Relationship between C3 and nC4.
Minerals 12 00397 g012
Table 1. Basic parameters of shale samples.
SamplesBurial Depth
(m)
S1S2TOC
(%)
Tmax
(°C)
HIDesorbed Gas
m3/t
S11405.13--5.37-198.511.41
S21405.645.1410.35.48446187.961.78
S31406.972.6411.566.83455169.251.84
S41407.755.6715.836.37448248.511.29
S51408.44--8.15-219.022.32
S61410.568.7224.488.01454305.622.09
S71411.276.7810.238.52455202.231.98
S81415.22--2.69-105.951.48
S91417.162.856.042.35452257.021.36
S101424.273.144.493.66456122.680.94
S111424.78--3.48-180.170.71
S121425.131.138.064.03458200.001.05
S131429.462.481.81.8944795.240.66
S141432.34--1.84-96.201.04
S151432.542.45.174.88455105.941.12
S161434.73--1.32-13.640.85
S171436.853.364.790.68459704.410.71
S181437.562.331.840.72457255.560.60
S191440.230.880.060.964556.250.78
S1: free hydrocarbons; S2: pyrolysis hydrocarbons; Tmax: maximum pyrolysis temperature; HI: hydrogen index.
Table 2. Shale gas classification based on gas generation, migration and distribution.
TypesShale and Shale Gas Characteristics
Shale ThicknessLocationsTOCDesorbed Gas
(Average Value)
Volume of Generated GasVolume of Migrated GasGenerated Gas or Migrated Gas
Generated gas18 mMiddle part of thick shale>6%Large
(3.80 m3/t)
LargeNo or smallIn situ-generated gas
Retained gas-Margin parts of thick shale or thin shale2%~6%Middle
(2.45 m3/t)
LargeLargePart of in situ generated gas
Accumulated gas<5 mThin shale<2%Small
(1.54 m3/t)
SmallNo or smallIn situ-generated gas and migrated gas
Publisher’s Note: MDPI stays neutral with regard to jurisdictional claims in published maps and institutional affiliations.