Article

Study on the Stress Variation Law of Inclined Surrounding Rock Roadway under the Influence of Mining

1
School of Resources, Environment and Safety Engineering, Hunan University of Science and Technology, Xiangtan 411201, China
2
Work Safety Key Lab on Prevention and Control of Gas and Roof Disasters for Southern Goal Mines, Hunan University of Science and Technology, Xiangtan 411201, China
3
Railway No. 5 Bureau Group First Engineering Co., Ltd., Changsha 411104, China
4
China Occupational Safety and Health Association, Beijing 100013, China
*
Authors to whom correspondence should be addressed.
Minerals 2022, 12(5), 499; https://doi.org/10.3390/min12050499
Submission received: 7 March 2022 / Revised: 6 April 2022 / Accepted: 14 April 2022 / Published: 19 April 2022
(This article belongs to the Special Issue Failure Characteristics of Deep Rocks)

Abstract

:
This study takes three roadways with similar burial depths in different strata in Xieqiao Mine of Huainan as its research object. This study involves the observation and analysis of borehole stress gauge data under the influence of mining pressure. The observation data show that: (1) under the influence of mining, the high-wall vertical stress increases as the distance from the roadway surface increases, and the peak point is at 6 m. The increment value of vertical stress at the low side has a maximum value at 8 m and a peak value at 14 m. The increase value of horizontal stress of the high side has two peaks, which are 4 m and 6 m, respectively. The increment of horizontal stress in low walls is also about 8 m. (2) The mining influence range of working face mining is about 150 m. Mining influence distance can be divided into three stages: 0–25 m, 25–60 m, and beyond 60 m. The increase of vertical and horizontal stress caused by mining increases sharply within 25 m from the working face. (3) The buried depth of the roadway has an influence on the range of mining influence and the increase of mining stress caused by working face mining. The more the buried depth of the roadway increases, the greater the range of mining influence and the increased value of mining stress. (4) After roadway excavation, the surface deformation of roadway surrounding rock reduces the increase of mining stress near the roadway surface. The mutual verification between the analysis results and theoretical calculation results is helpful to roadway support design and advanced support design of the working face.

1. Introduction

In recent years, as the mining of mineral resources has continued to extend to the deep, geological conditions have become increasingly complex, mining has become more difficult, and rock strata where the roadway is located have become more stressed. The surrounding rock of the inclined roadway is prone to heterogeneous deformation. As the buried depth of the roadway increases, so too does the deformation of the surrounding rock of the inclined rock roadway. Therefore, it is more and more important to study the deformation law of the surrounding rock of deeply inclined rock roadways.
Scholars at home and abroad have conducted extensive research on the deformation law of inclined roadways. Zhao et al. [1] found that the stress distribution characteristics of roadway surrounding rock in inclined coal seam are complex and diverse. Chang et al. [2] revealed the stability control mechanism of surrounding rock in deep rock roadway by analyzing the stress evolution characteristics and deformation and failure laws of surrounding rock after deep rock roadway excavation. Chen et al. [3] analyzed the stress field and displacement field of surrounding rock in two stages of the gob-side excavation and mining of deep inclined coal seam. Chen et al. revealed the deformation and failure characteristics of the surrounding rock of this kind of roadway, and proposed stability control technology. Wang et al. [4] established the mechanical model of the overlying structure in the gob-side excavation of deep inclined coal seam by a theoretical analysis method. In terms of numerical simulation, Wei et al. [5] established numerical calculation models of different rock strata dip angles, and calculated and analyzed the stress change process of surrounding rock of inclined coal seam under dynamic pressure. Wu et al. [6] used UDEC discrete finite element simulation software to establish the stress model of roadways in deep inclined strata. Gao et al. [7] adopted the FLAC3D numerical analysis method to obtain the asymmetric deformation law of the surrounding rock of soft rock roadways in the inclined coal seam. Regarding the combination of numerical simulation and field measurement, Sun et al. [8] concluded that the obtuse angle of deep inclined strata roadway sections and the inclined direction of strata are key components of asymmetric deformation and failure. Zhang et al. [9] analyzed the stress distribution law, displacement change, and deformation failure characteristics of surrounding rock in the process of extremely close coal seam mining with upper and lower mining goaf. Fu et al. [10] studied and concluded that, under the influence of the double mining stress of the adjacent working face and the own working face, the mine pressure appeared sharply and the roadway maintenance was difficult. Chen et al. [11] revealed the mechanism of asymmetric deformation and failure after roadway excavation in the steeply inclined coal seam and analyzed the distribution characteristics of the stress field and plastic zone after roadway excavation. Through the numerical simulation and monitoring of roadway surrounding rock deformation and surrounding rock stress during mining, Wang et al. [12] judged the deformation law of roadway surrounding rock under the influence of working face mining and the influence range of advanced dynamic pressure. Using a combination of numerical simulation, theoretical analysis, and field measurement, Li et al. [13] determined the loosening range and plastic zone range of a coal roadway, and comprehensively analyzed the asymmetric deformation characteristics of coal and rock under the environment of the broken surrounding rock. Yang et al. [14] studied the deformation and failure mechanism of surrounding rock in the steeply inclined roadway, and found that the deformation and failure of steeply inclined soft and hard interlayer roadways are asymmetrical, with obvious bias effect, characterized by the mutual staggered deformation characteristics of roof siding and floor heave, with serious floor heave and easy roof collapse. Luo et al. [15] studied the roof stress and deformation characteristics of steeply inclined thin coal seam working faces. Wang et al. [16,17] studied the mechanical characteristics of roadway surrounding rock and the influence of surrounding rock deformation and the plastic zone, revealing the intrinsic mechanical nature of the influence of maximum horizontal principal stress direction on the stability of roadway surrounding rock. Zhao et al. [18] analyzed the mechanical characteristics and size effect of narrow coal pillars in the gob-side excavation of inclined coal seams. As the pillar width increases, the peak values of vertical stress and horizontal stress gradually increase. Sun et al. [19] concluded that the stress concentration of a roadway through inclined coal seam is distributed along the layer. At the same time, the research on the stress distribution of the roadway surrounding rock of inclined coal seam is also focused on the combination of theoretical analysis, field measurement, numerical simulation, and field investigation. Wang et al. [20] integrated field investigation, theoretical analysis, numerical calculation, downhole test and measurement, etc. The distribution and propagation of floor stress under mining conditions and its relationship with surrounding rock stress, dynamic deformation and failure characteristics of floor dark inclined shaft disturbed by mining process, and the instability mechanism and control method of floor roadway are systematically studied.In this way, Wang et al. [21,22,23,24] systematically studied the deformation and stress evolution of the surrounding rock of roadways in inclined coal seam by combining multiple means. In terms of field measurement, Shi et al. [25] analyzed the law of mining pressure in the fully mechanized caving roadways along goaf through field measurement, providing an analytical basis for determining roadway support mode. Han et al. [26] used the field observation method to analyze the change of internal stress of small coal pillars and the coal body at the working face, the influence range of leading abutment pressure, and the deformation and failure law of small coal pillar and coal roadway. Song et al. [27] analyzed the distribution rule of advance abutment pressure on the working face by using the field measurement method, and obtained the influence range of advance abutment pressure. According to the monitoring data, Zhang et al. [28] analyzed how the stress change of surrounding rock can be divided into four change modes: gradual change, sudden jump, oscillation, and compound change. However, these studies are not comprehensive enough in data analysis.
In this paper, the field measurement method is adopted to analyze the data of borehole stress gauge under the action of mining pressure for three tunnels with similar burial depth in different layers. This is undertaken in order to reveal the secondary distribution of roadway surrounding rock stress under the influence of mining pressure, and to provide a basis for roadway support design and advanced support at the end of working face.

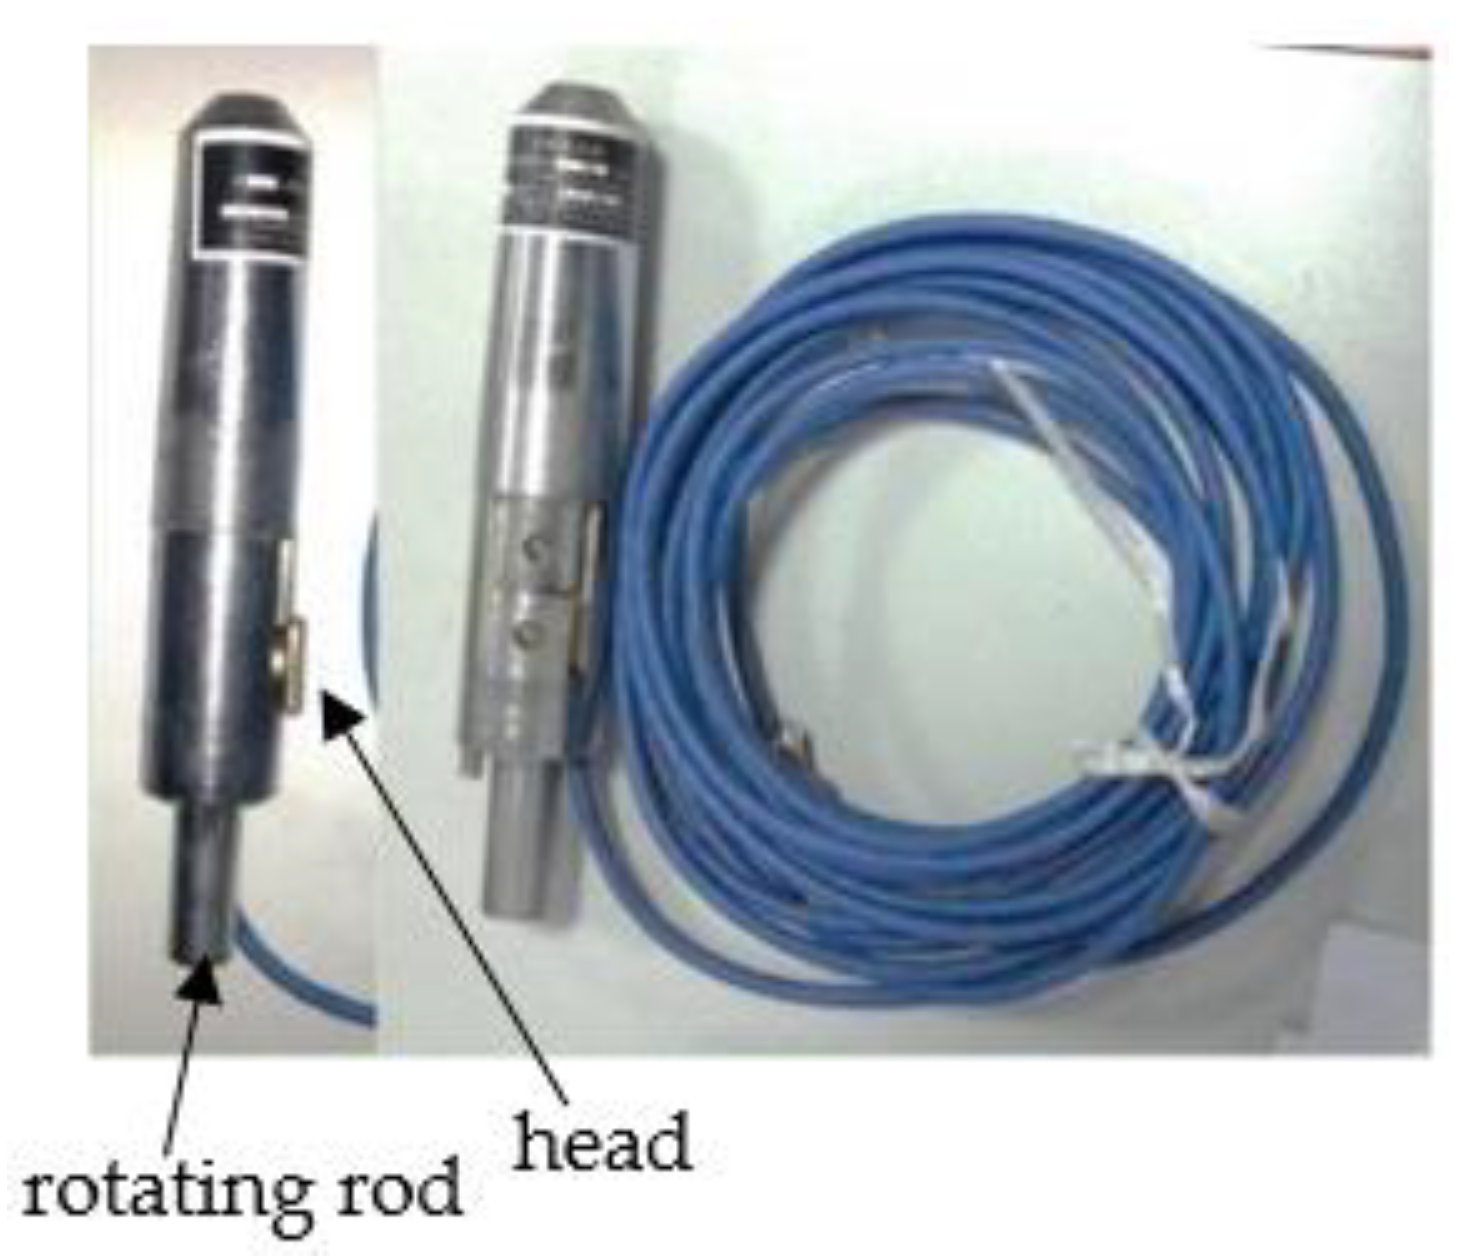
2. Geological Survey of Roadway and Station Layout

Three roadways with similar burial depths in different strata of Xieqiao Mine of the Huainan Mining Group are taken as research objects. A lot of original data were obtained by one-month observation of mine pressure on the working face of 11318 (Section 2.1), 11613 (Section 2.2), and 12521 (Section 2.3) roadways in Xieqiao Mine.

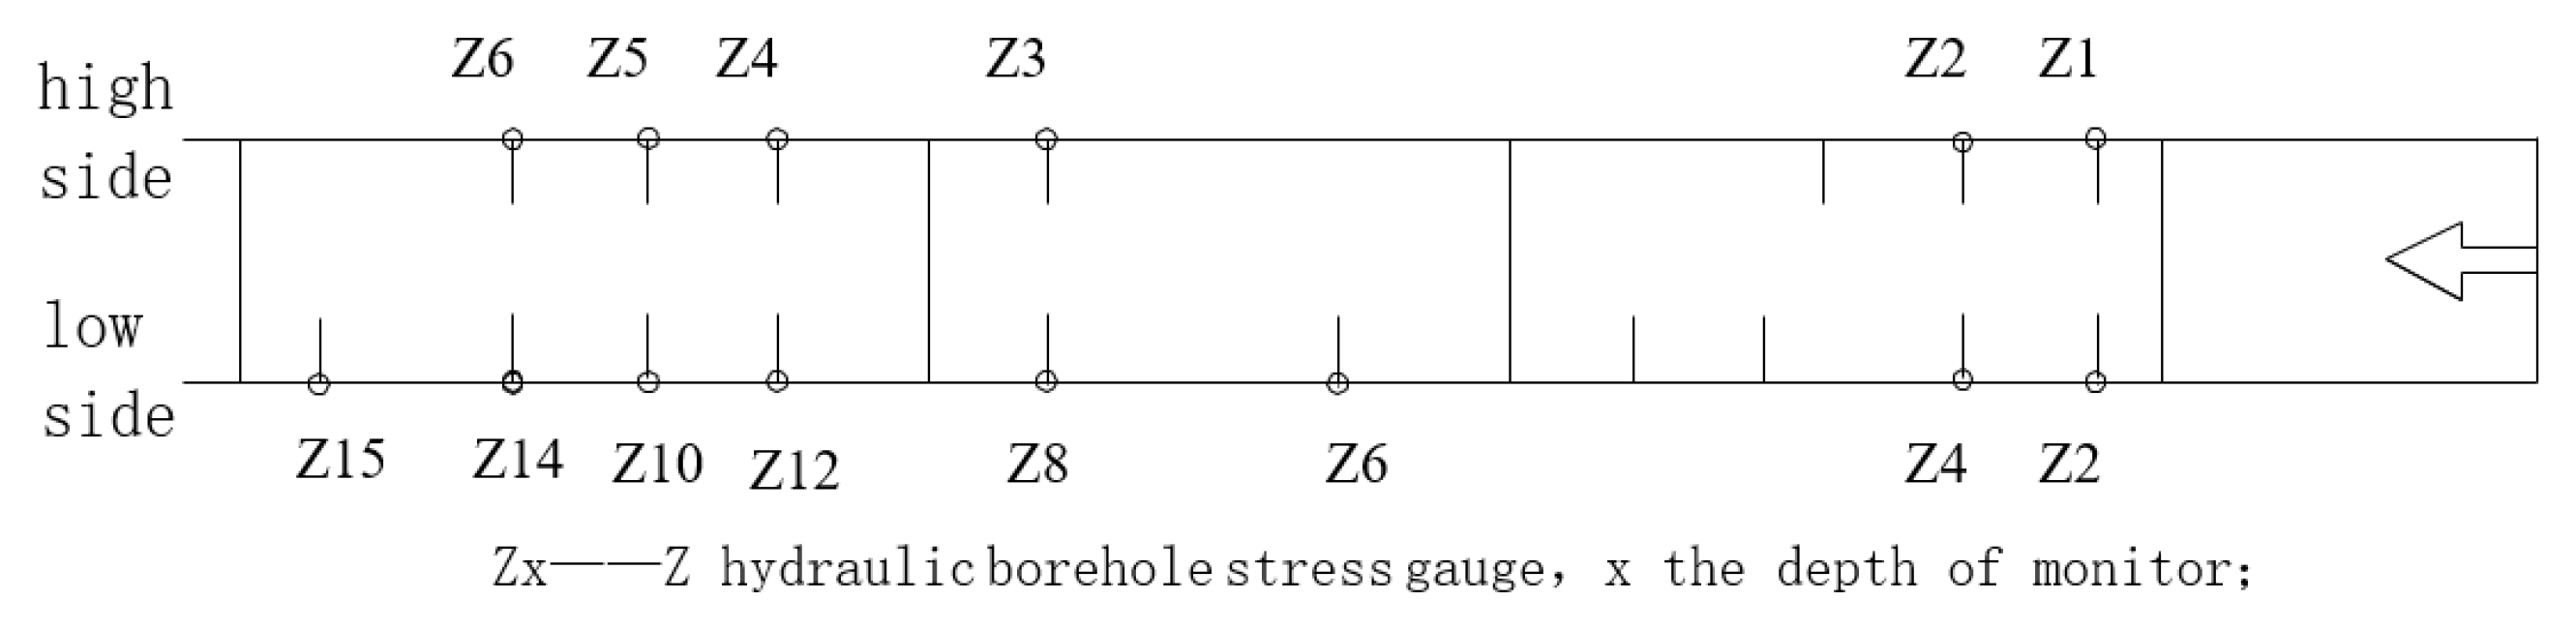
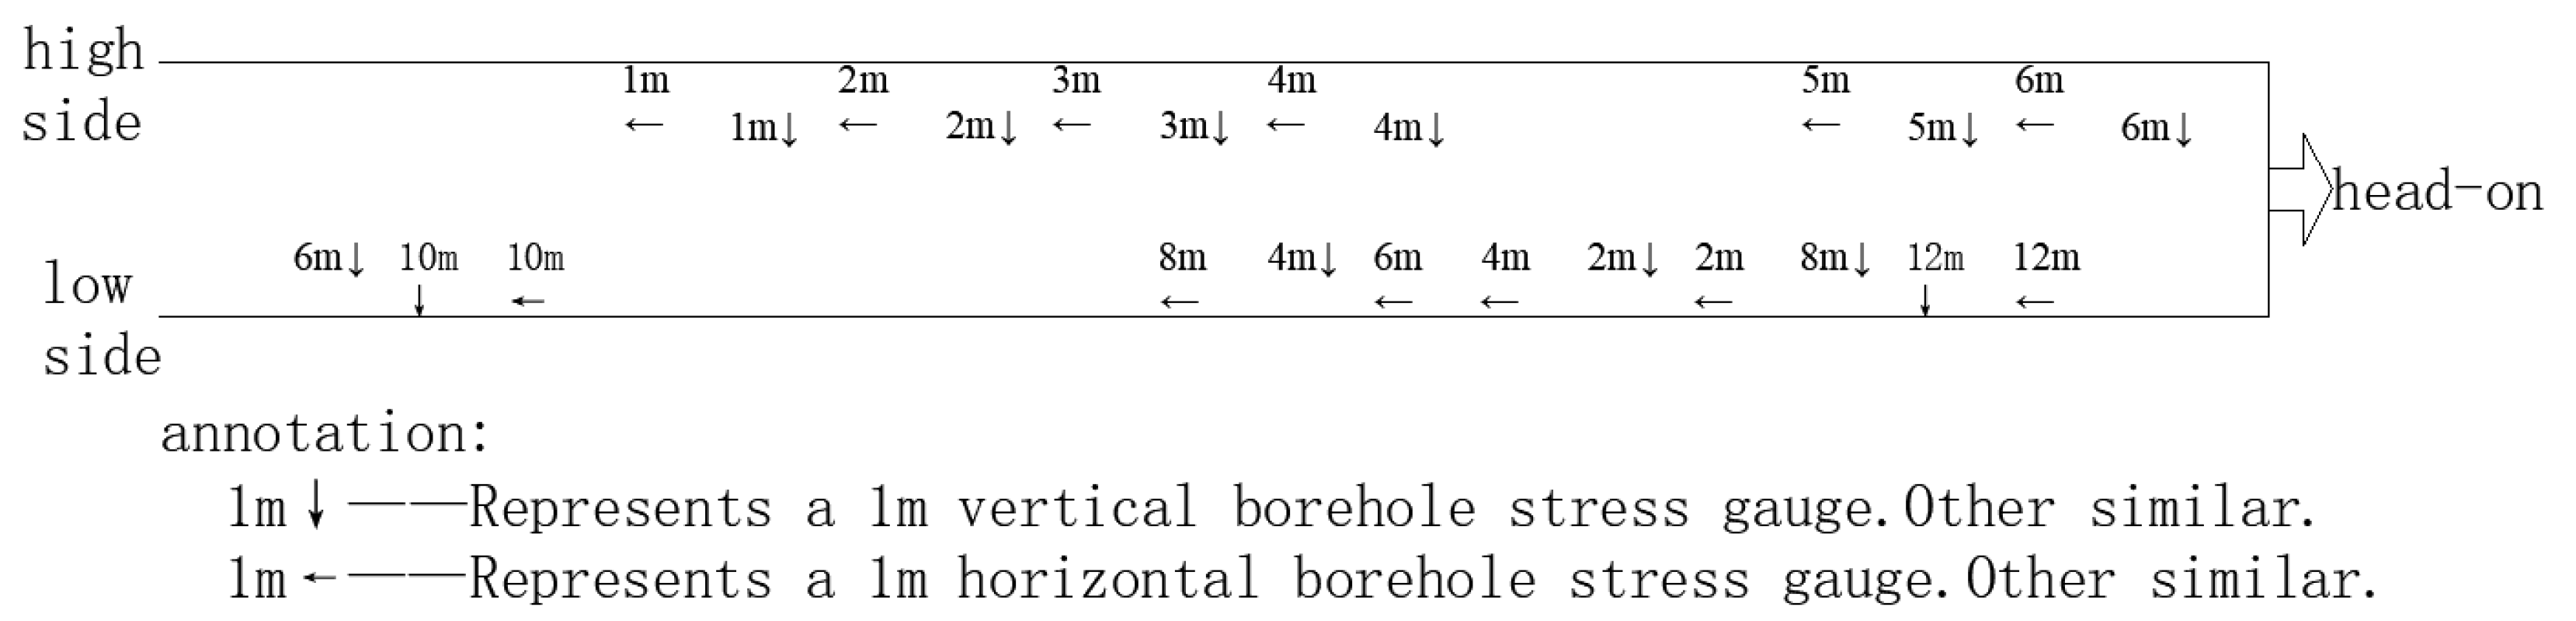
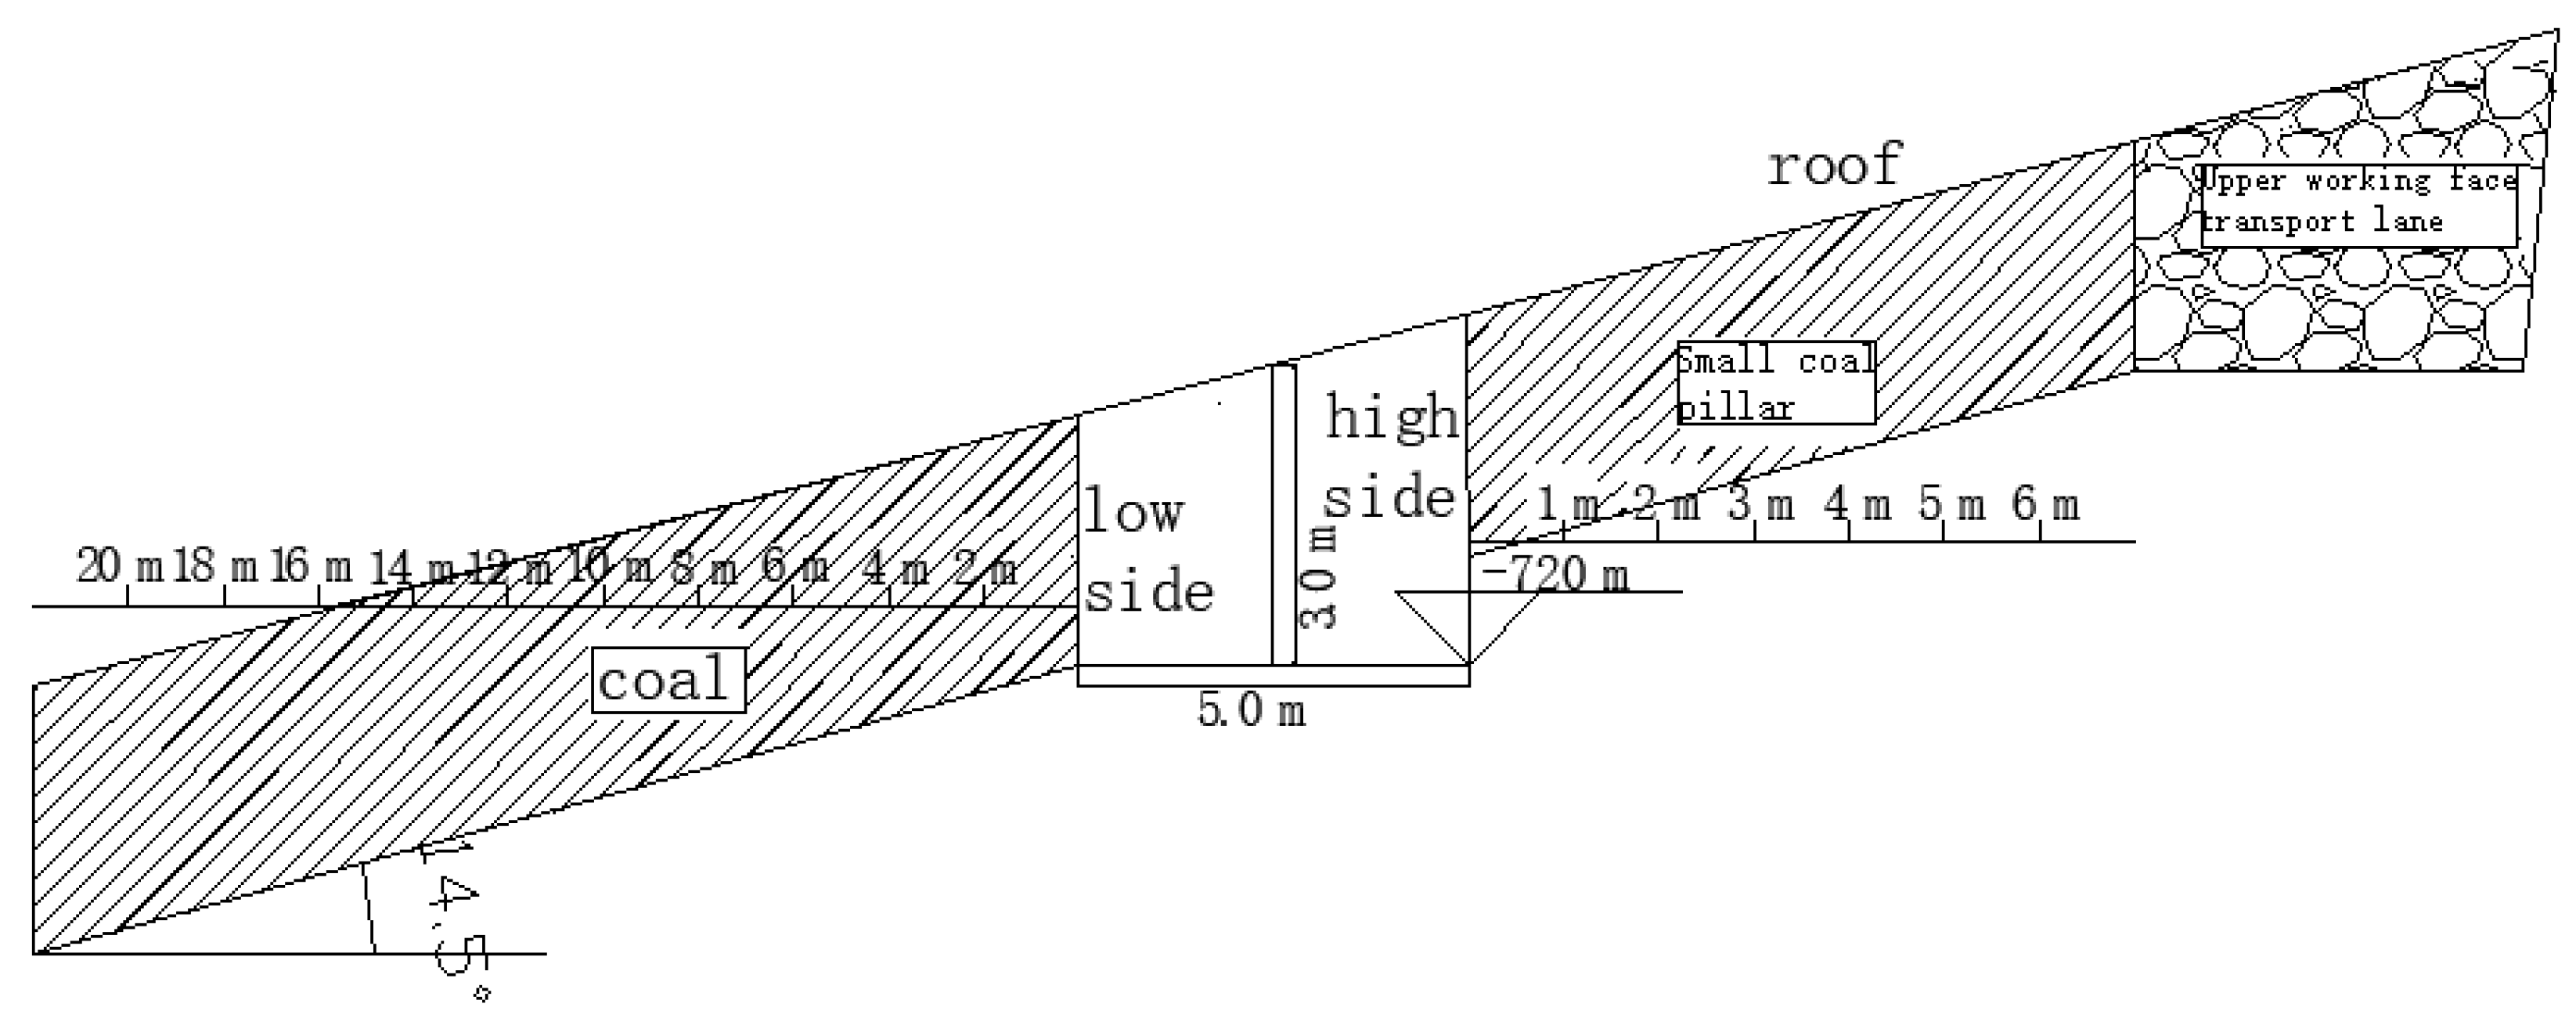
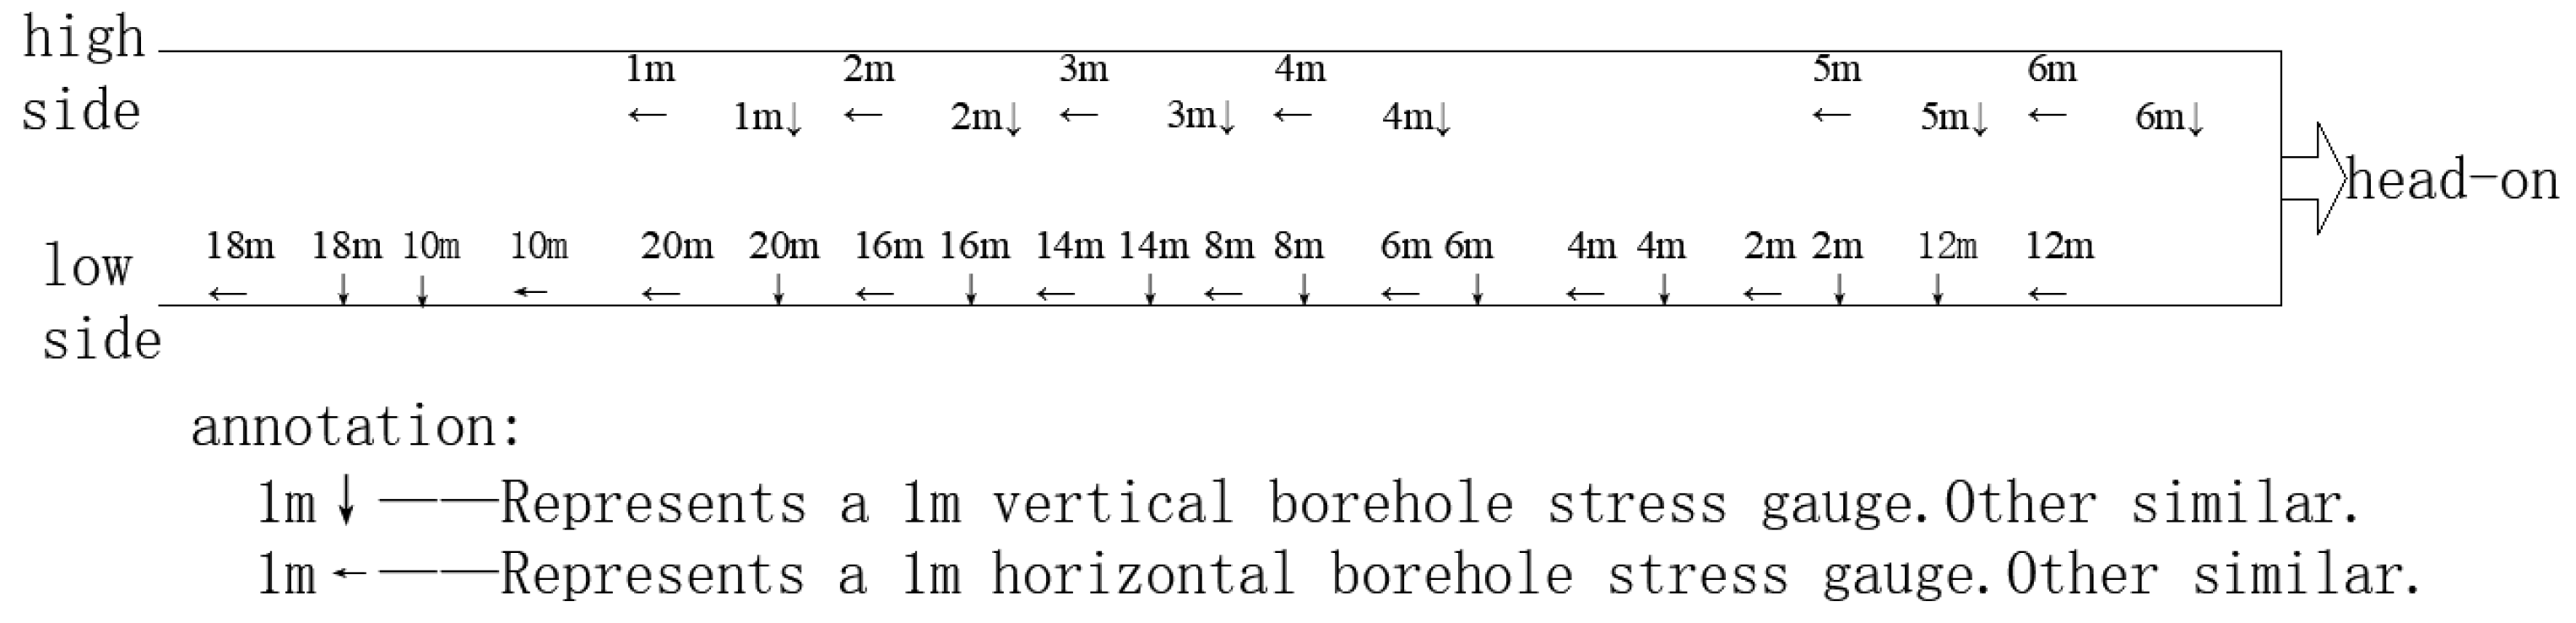
2.1. Geological Survey and Station Layout of 11318 Roadway

The section of the 11318 roadway is a straight wall with a rectangular width of 4.3 m and a height of 2.8 m, with a dip angle of 10~15°. The coal thickness is 1.5~3.6 m and the average coal thickness is 2.75 m. The old roof of the coal seam is sandstone, partial sections have mudstone false roof (or phase turns into gangue), and the direct bottom is mudstone. Ground elevation is +20.8~+27.6 m and working face elevation is −511~−620 m. The measuring instrument is a vibrating string-type borehole stress gauge, the diameter of which is 62 mm. A total of 14 borehole stress gauges were installed to monitor the increase of vertical stress on both sides of the roadway under the influence of distance from the working face. Six small high side coal pillars are installed in the roadway, and the monitoring positions are 1 m, 2 m, 3 m, 4 m, 5 m, and 6 m, respectively. Eight are installed in the low side solid coal side of the roadway, and the monitoring positions are 2 m, 4 m, 6 m, 8 m, 10 m, 12 m, 14 m, and 15 m, respectively, as show in Figure 1 and Figure 2.

2.2. Geological Survey and Station Layout of 11613 Roadway

The working face where the roadway is located has an elevation of −608 m~−723 m, a strike length of 1932 m, and an inclination length of 205 m. The roadway section is 5.2 m × 2.8 m, with an inclination angle of 10~15° and an average inclination angle of 12°. The old roof of the coal seam is medium sandstone, the local phase is sandy mudstone, and the direct roof is mudstone and coal. A total of 24 vibrating string-typeborehole stress gauges are installed within the observation range. Twelve high side small coal pillars are installed in the roadway to monitor the high side vertical and horizontal stress, respectively, and the monitoring depth is 1 m, 2 m, 3 m, 4 m, 5 m, and 6 m. Twelve of them are installed in the solid coal side of low side to monitor the vertical and horizontal stress of low side, respectively, and the monitoring depth is 2 m, 4 m, 6 m, 8 m, 10 m, and 12 m, as show in Figure 3 and Figure 4.

2.3. The Basic Condition of 12521 Roadway and Layout of Measuring Station

The working face where the roadway is located has a large fluctuation from east to west from the roof and floor of the coal seam. Generally, it is high at both ends and low in the middle. The occurrence of coal strata is 180~200° < 10~18°, the roadway section is 5.0 m × 3.0 m, and the average dip angle is 14.5°. The coal is black, powdery, and massive. A layer of gangue is commonly developed in the coal seam, and the partial gangue phase turns into a false top. The thickness is 0~0.4 m, with an average of 0.2 m. The thickness of the coal seam is 1.5~3.0 m, with an average of 2.4 m. Ground elevation +22.3~+24.9 m, working face elevation −642~−720 m. A total of 32 vibrating string drill stress gauges are installed within the observation range. Twelve high side small coal pillars are installed in the roadway to monitor the vertical and horizontal stress, respectively, and the monitoring depth is 1 m, 2 m, 3 m, 4 m, 5 m, and 6 m. Twenty of them are installed in the solid coal side of the low side to monitor the vertical and horizontal stress of the low side, respectively, and the monitoring depth is 2 m, 4 m, 6 m, 8 m, 10 m, 12 m, 14 m, 16 m, 18 m, and 20 m, as show in Figure 5 and Figure 6.
All the borehole stress gauges mentioned above are zlGH-40 and produced by the Shandong Rosel Company, as shown in Figure 7. The instrument works through a vibrating string sensor inside the sensor. When measuring, the stress gauge is loaded into the drilling hole, and the pressure head is pressed close to the rock wall by twisting the rotating rod. When the borehole is under pressure, the pressure head will measure the frequency change of the vibration string sensor caused by the pressure. According to the calibration value in advance, the stress change value can be converted.

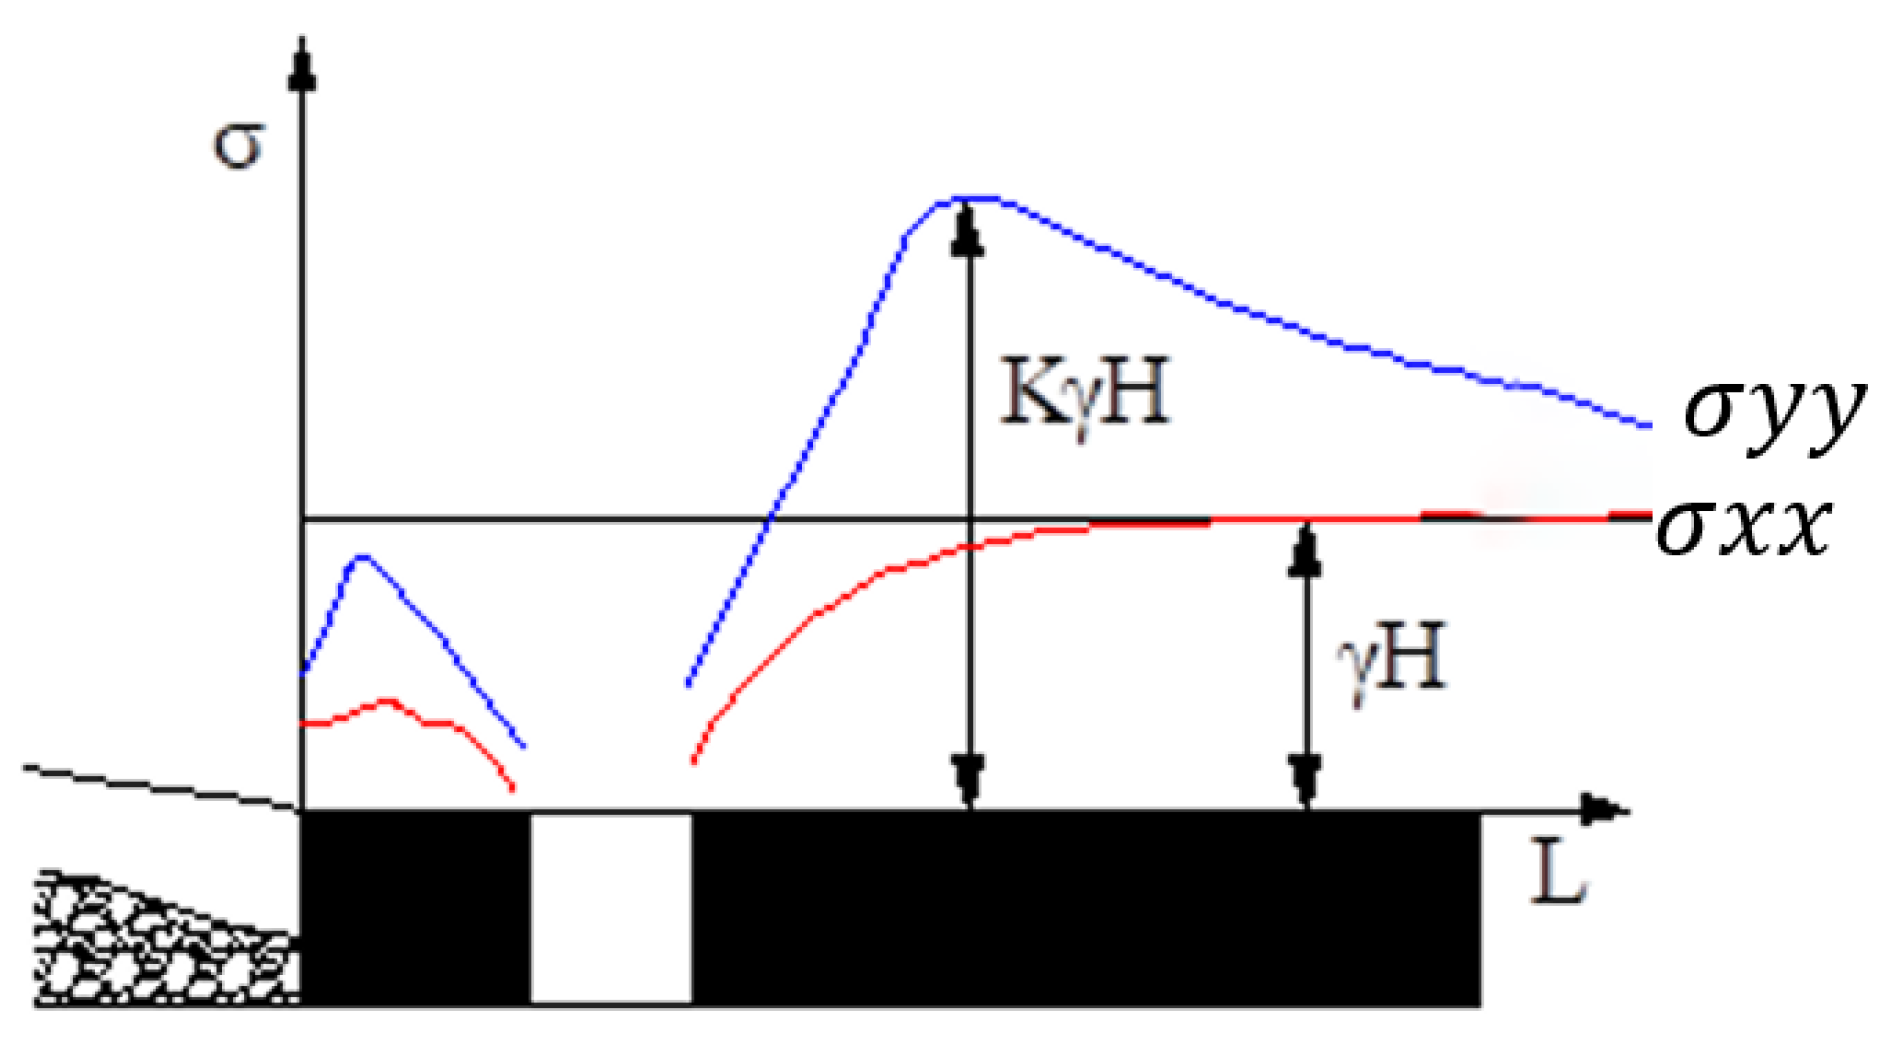
3. Stress Secondary Distribution Theory of Mining Roadway Surrounding Rock

After the roadway is excavated in the rock mass, the surrounding rock of the roadway will inevitably redistribute its stress. Generally, the increased tangential stress after the change of both sides of the roadway is called the support pressure. Support pressure is an important component of mine pressure. In the development from the outer side of the roadway to the deep, the bearing capacity of coal and rock mass increases obviously as it is away from the roadway surface. Within a certain width from the edge of the coal body, the bearing capacity of the coal body and support pressure is in the limit equilibrium state. The stress distribution diagram is shown in Figure 8.

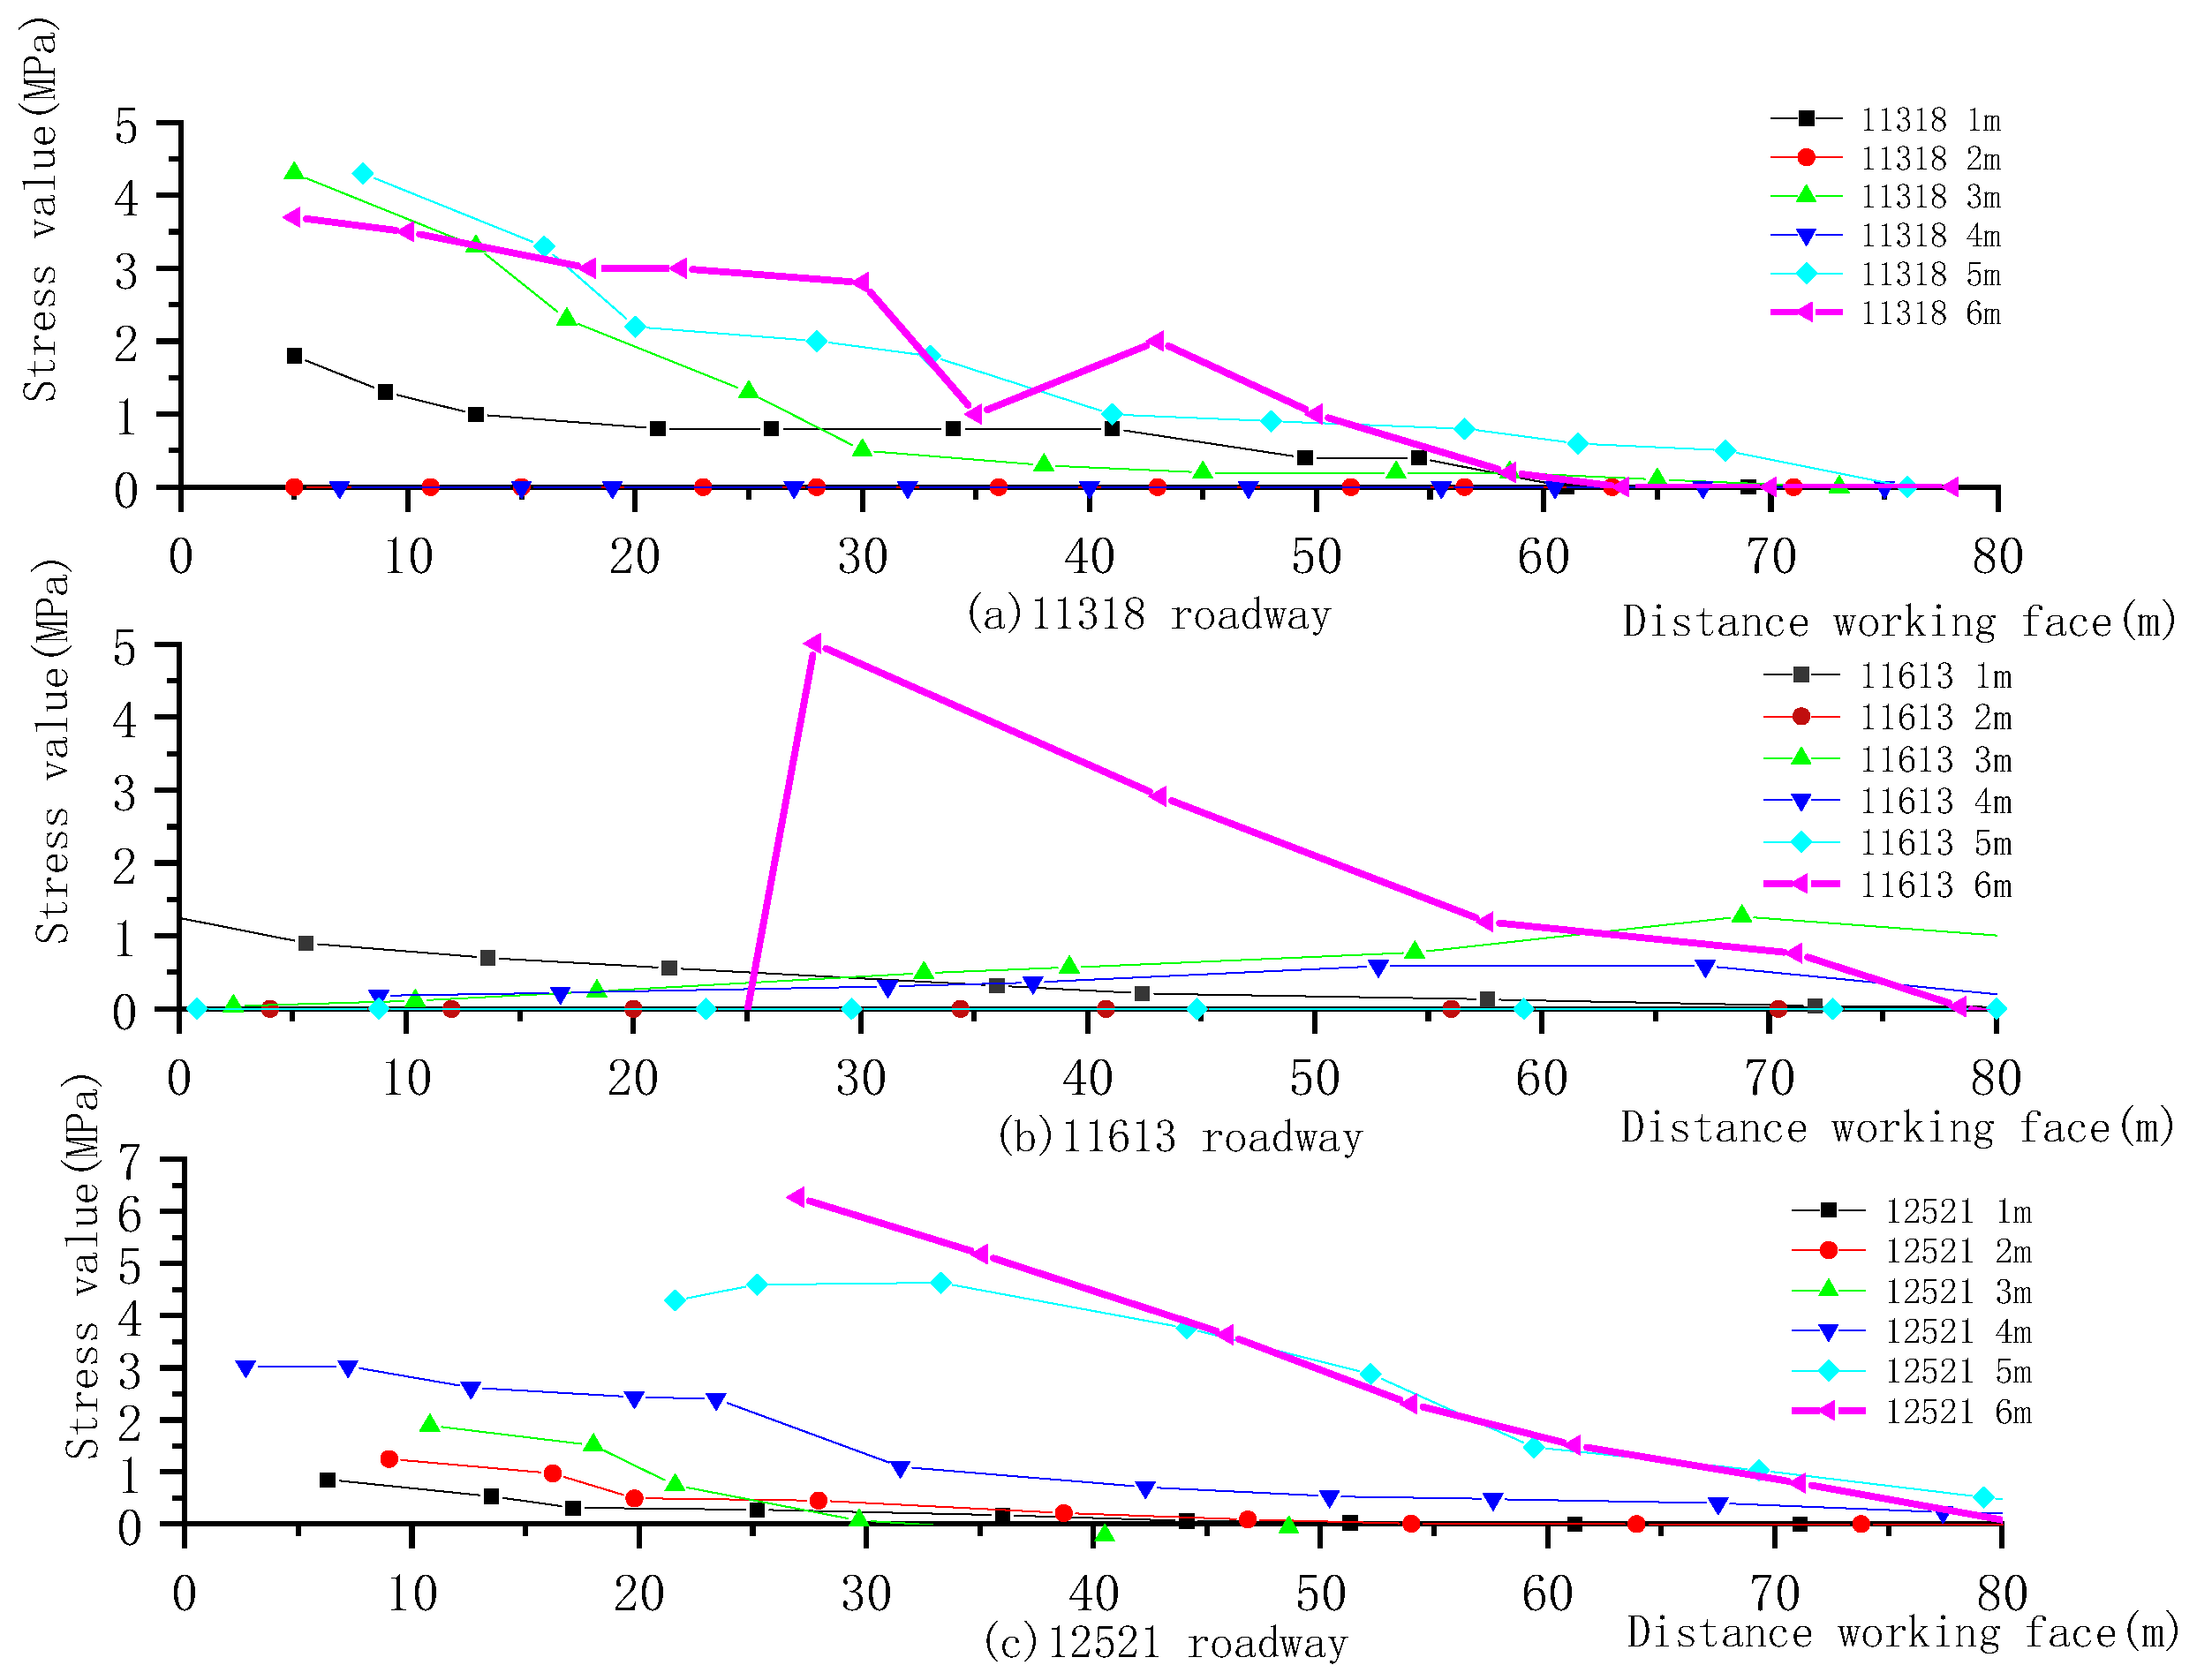
4. Analysis of Distribution Law of Stress Increment of Roadway Surrounding Rock under the Influence of Mining

ORIGIN data processing software was used to analyze the stress increase measured value of the monitoring points on the two sides of the three roadways. The comparative analysis charts of horizontal and vertical stress increment of monitoring points in two sides of roadway under the influence of mining were obtained, as shown in Figure 9, Figure 10, Figure 11 and Figure 12.

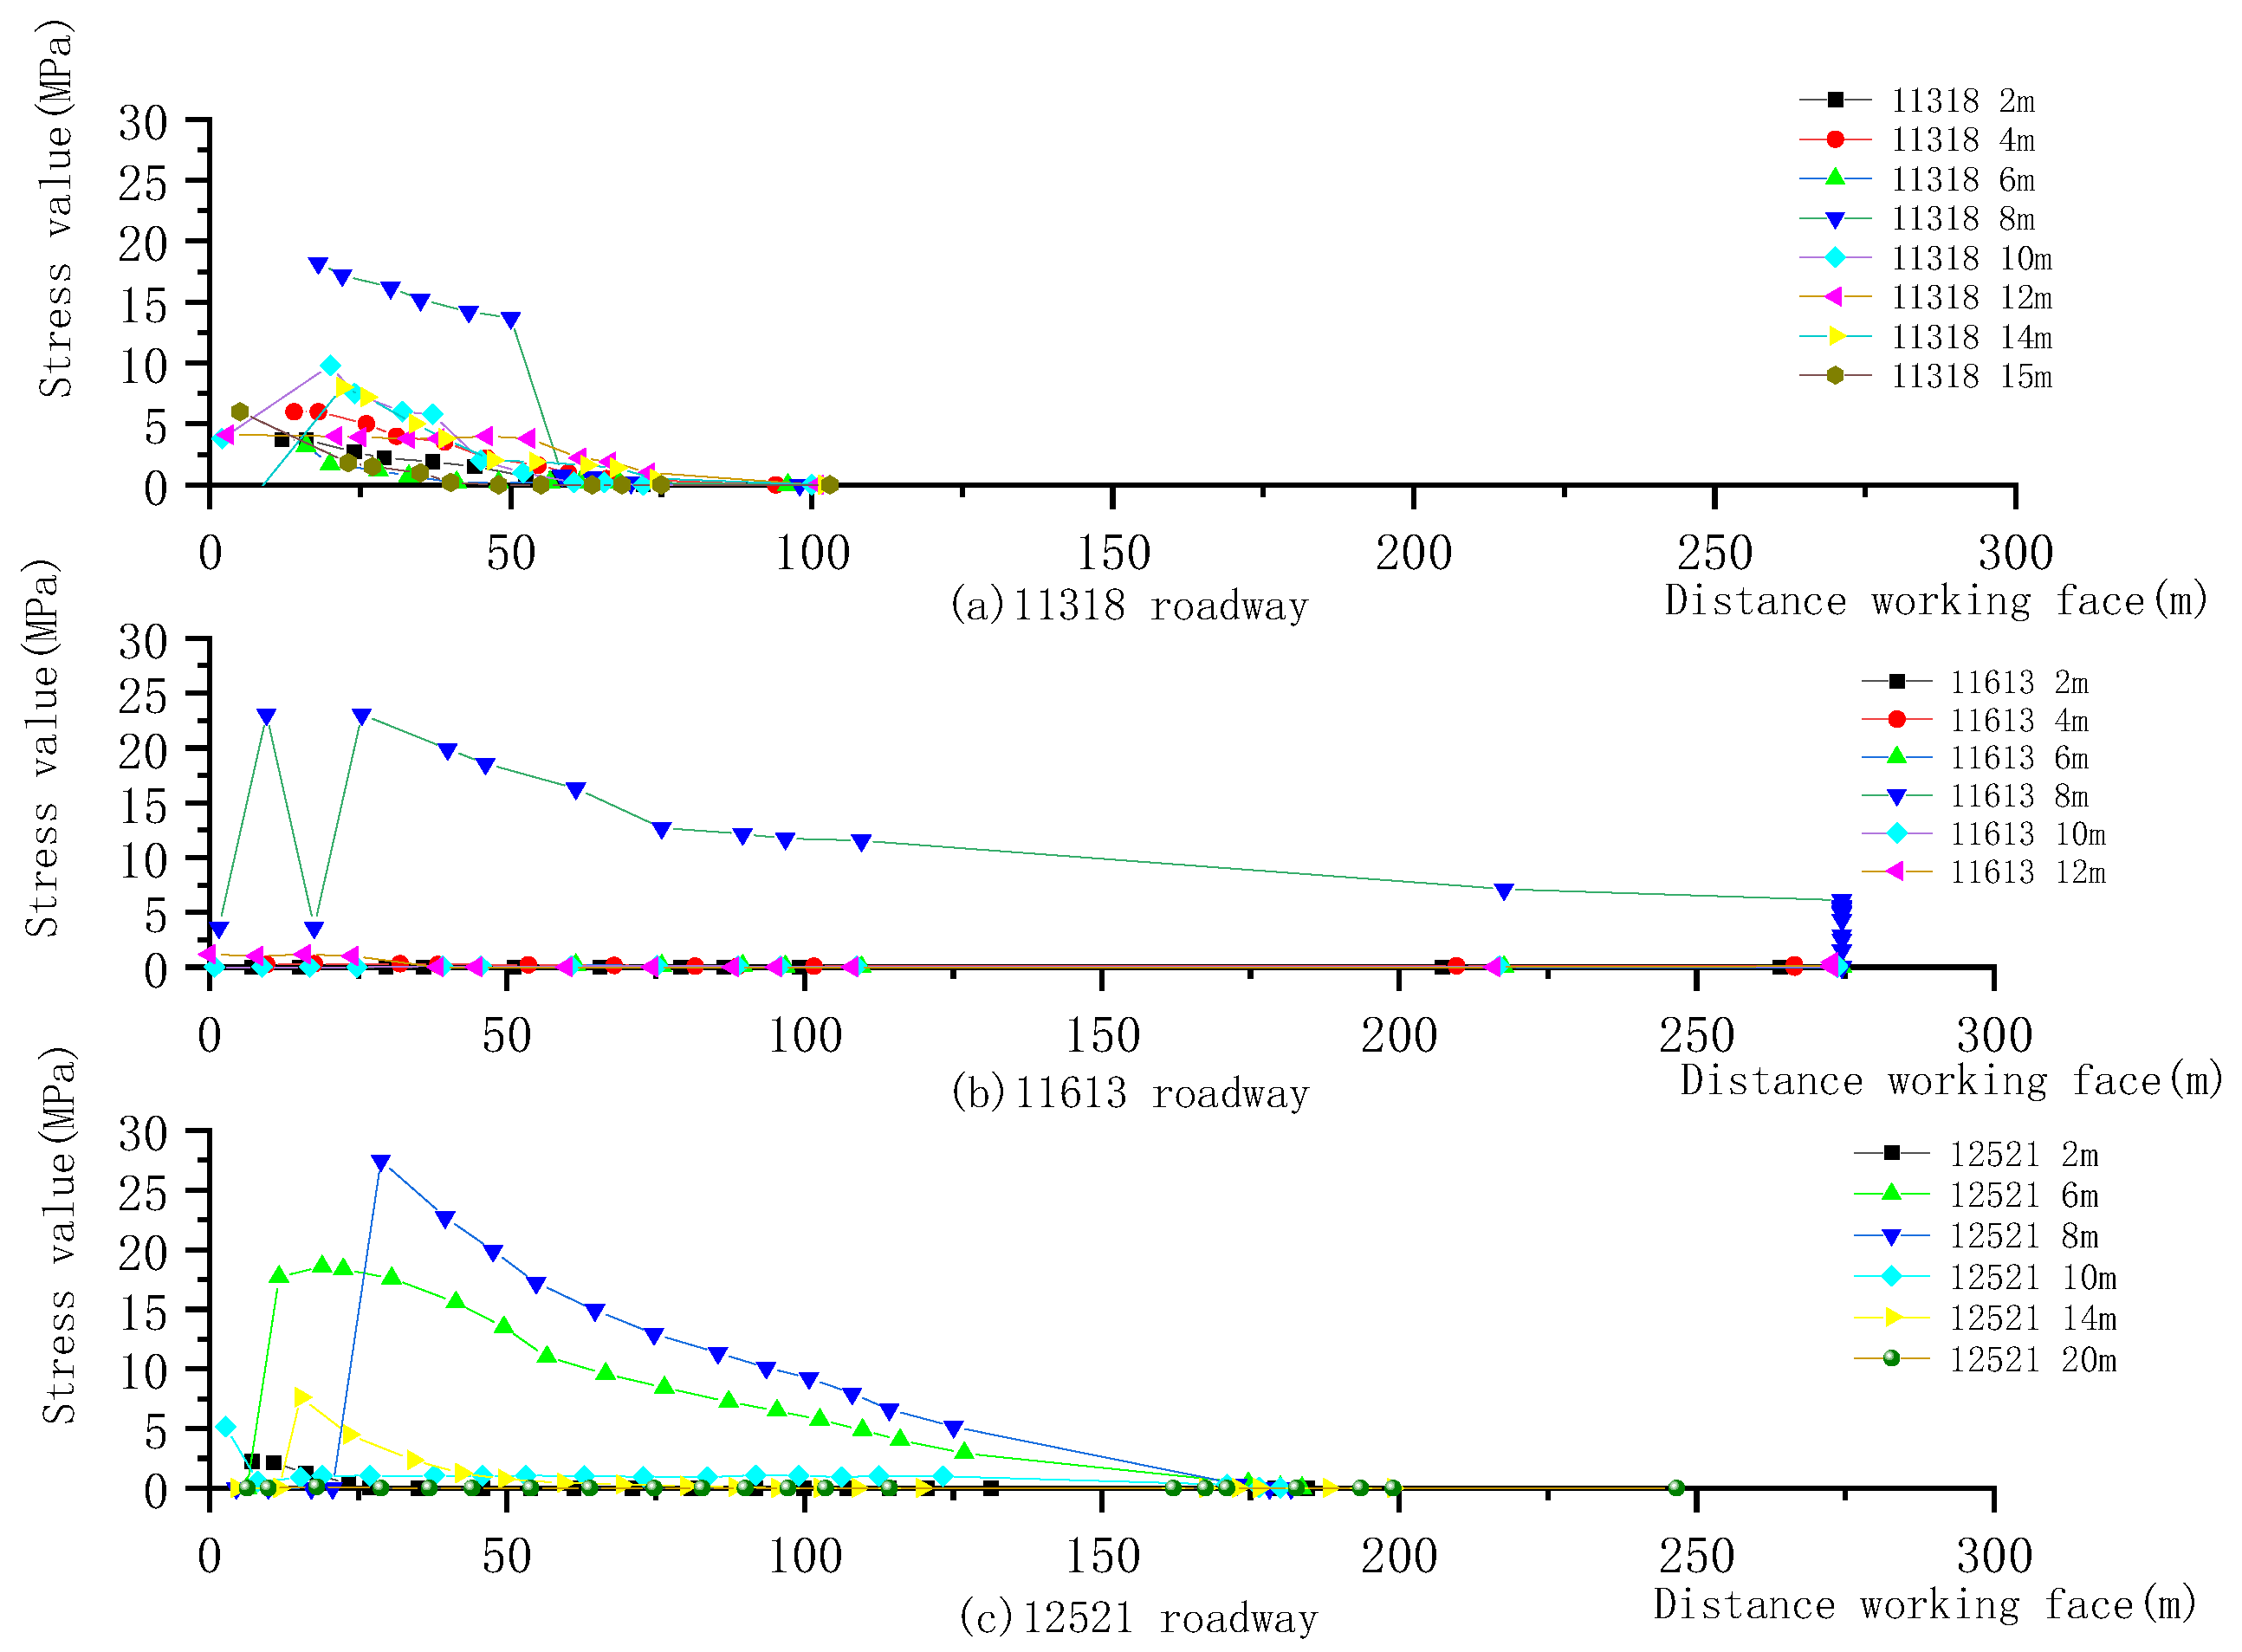
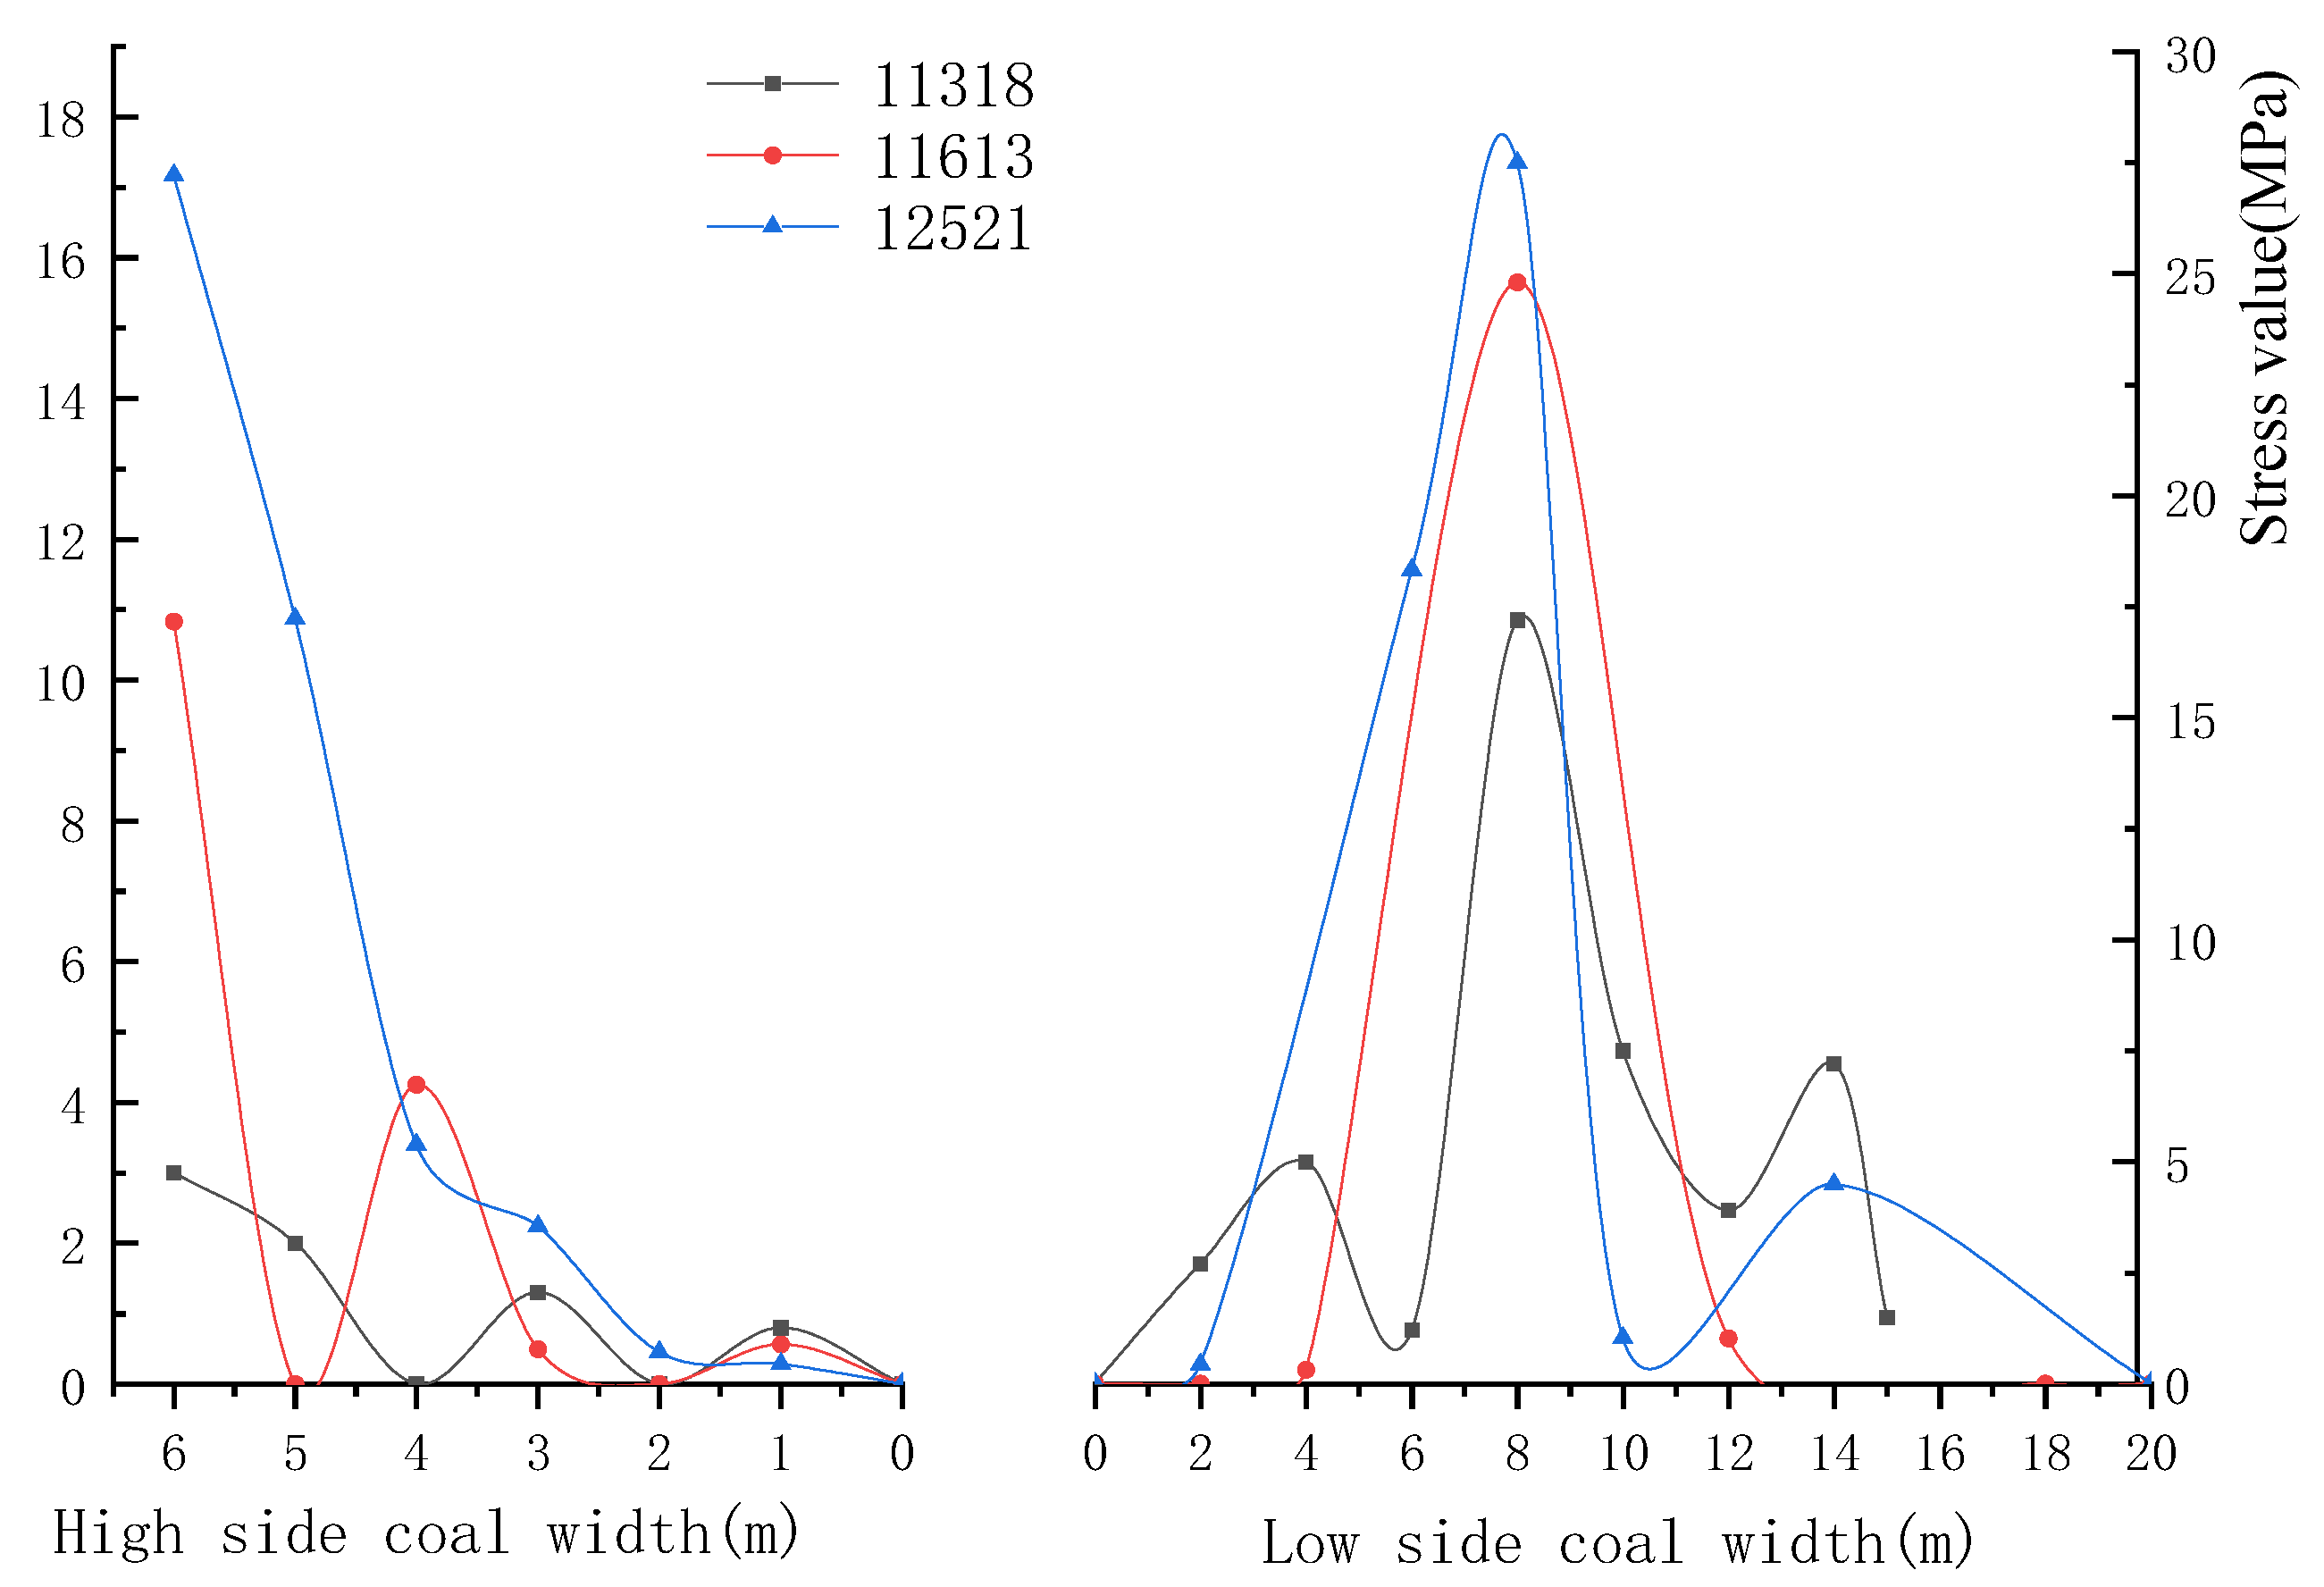
4.1. Contrastive Analysis of Distribution Law of Increased Value of Roadway High Side Internal Stress during the Monitoring Period

Figure 9 shows that the increase of vertical stress at all measuring points in the high wall of the monitoring roadway shows a trend of increasing gradually with the decrease of mining distance. However, in Figure 9a, the stress at 6 m away from the roadway surface drops and rises again at 35 m away from the working face, but it still shows a trend of increasing gradually with the decrease of the mining distance. On the whole, the increase value of vertical stress at most monitoring points within 3 m from the roadway surface is small, and the maximum value is about 4 MPa. Figure 9b,c are consistent with such an overall trend. In Figure 9a, the increase value of vertical stress at 1 m away from the roadway surface is larger than that at 2 m, but it is still small compared with the whole. In Figure 9a, the increase of vertical stress at a distance of 3 m from the roadway surface is small when the distance is greater than 30 m from the working face, and increases rapidly when the distance is less than 30 m. Except for the point 3 m away from the roadway surface in Figure 9a, the other points all conform to the conclusion that the increment of vertical stress of most monitoring points within 3 m away from the roadway surface is small. However, the increase values of vertical stress at the monitoring point 4 m away from the roadway surface in Figure 9a and 5 m away from the roadway surface in Figure 9b are almost 0. Nevertheless, on the whole, the increase value of vertical stress at monitoring points 4 m, 5 m, and 6 m away from the roadway surface is larger than that within 3 m away from the roadway surface. Additionally, the added value at 6 m is almost greater than that at other parts. Among them, the added value of vertical stress at 6 m monitoring points in 12521 roadway reaches the maximum value of 17 MPa. In terms of the increased rate of monitoring data, mining influence distance can be divided into three stages: 0~25 m, 25~60 m, and beyond 60 m.
Although some curves in Figure 10 show a certain degree of decline or fluctuation when the mining distance is small, on the whole, the increased value of horizontal stress in the high wall of the roadway increases with the decrease of the mining distance. In the range of 1 m, 2 m, and 3 m away from the roadway surface, the increment of horizontal stress is small on the whole. Except for the small increment of horizontal stress at the measuring point at 5 m in Figure 10b, the increment of horizontal stress at 4 m, 5 m, and 6 m is large. In Figure 10a, the stress increase at 6 m is generally greater than that at other monitoring points. In Figure 10b, the stress increase at the 6 m measuring point is greater than that at other measuring points when the mining distance is greater than 70 m; when the mining distance is less than 70 m, it is only less than that at the 4 m measuring point, and the stress increase still remains at a large level. In general, the stress increase at the 6 m measuring point is at a large level throughout the whole process. In terms of the increased rate of monitoring data, mining influence distance can be divided into three stages: 0~25 m, 25~60 m, and beyond 60 m.

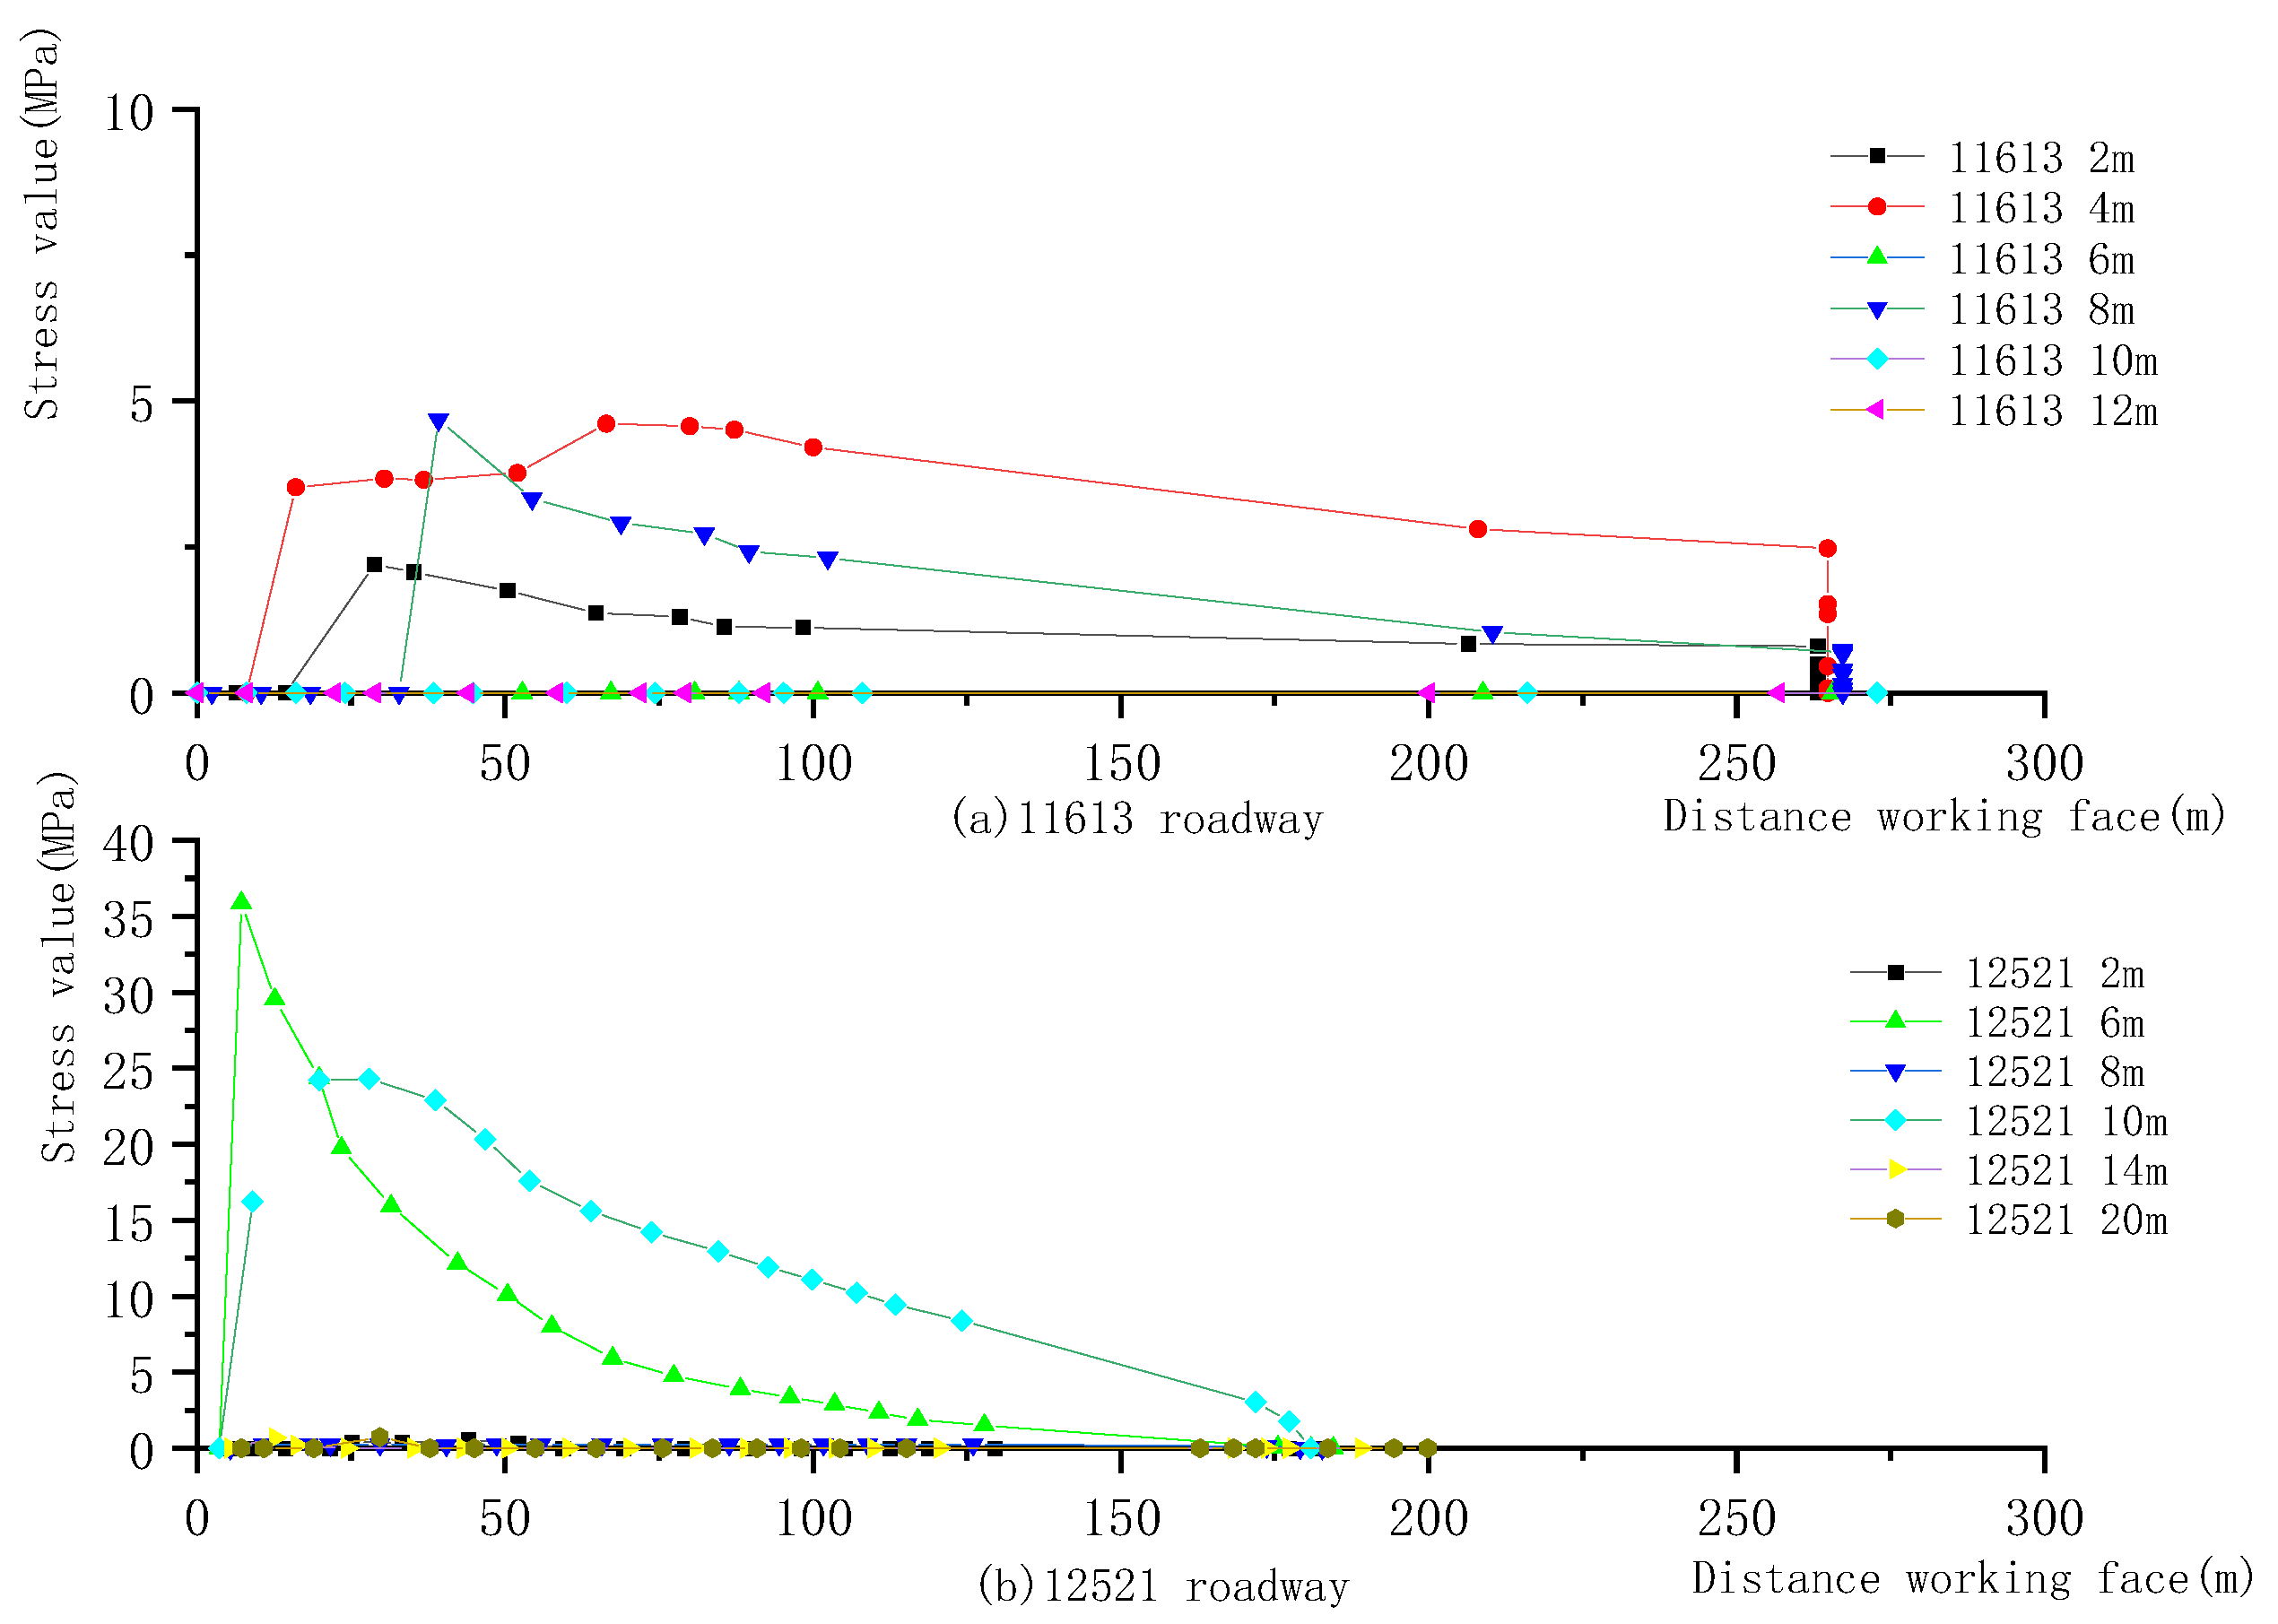
4.2. Contrastive Analysis of Distribution Law of Increased Value of Roadway Low Side Internal Stress during the Monitoring Period

Figure 11 shows that the stress added value of measuring points in the middle part of the low side of the three roadways does not change much (some of them fail). From the monitoring results, the stress added value of 8 m monitoring points in the low side of the three roadways is larger than that of other monitoring points, among which the stress added value of 12521 roadway is the largest (27.5 MPa), followed by 11613 (22.5 MPa), then 11318 (18 MPa). In terms of the increased rate of monitoring data, mining influence distance can be divided into three stages: 0~25 m, 25~60 m, and beyond 60 m.
Figure 12 shows that the increment of most of the horizontal stress monitoring points in the low side of the two roadways is relatively small (basic failure). The increase of horizontal stress at 2 m, 4 m, and 8 m monitoring points in 11613 roadway is small, while that at 6 m and 10 m monitoring points in 12521 roadway is large, reaching 25 MPa and 35 MPa, respectively.

4.3. Change Law of Stress Increment of Two Sides of the Roadway under the Same Mining Distance

The stress meter measures the actual value of stress, so it cannot directly measure the added value of stress. In order to obtain the change rule of the added value of stress in both sides of roadway under the influence of the same mining distance, the measured stress value should be modified. The correction method is as follows: select the minimum distance between the roadway monitoring station and the working face when the layout is completed as the reference distance, and the measured stress at the reference distance is the reference stress; subtract the reference stress from the measured stress at the other distances to obtain the stress increment, and the stress increment at the reference distance is 0. The minimum distance is selected as the distance (80 m) between 11318 roadway survey station layout and the working face. The three roadways were all taken as the reference distance of 80 m from the working face, the stress at their respective reference distance was measured, and then the stress at the remaining distance was modified accordingly. After modification, the variation of the added value of internal stress in both sides of the roadway under the influence of the same mining distance is obtained, as shown in Figure 13, Figure 14, Figure 15 and Figure 16.
Figure 13 shows that under the influence of the same mining distance, the increase of vertical stress at the monitoring points in the high side of the three roadways shows the following characteristics: (1) the increasing value of vertical stress appears in the distance from the roadway surface, and shows a trend of increasing with the increase of the distance from the roadway surface; (2) the added value of 6 m monitoring points within the monitoring range of different roadways is the largest; (3) the maximum value of stress added value 12521 > 11613 > 11318; and (4) the increment of vertical stress in the inner shallow part of the high wall is relatively small. When the distance from the working face is less than 25 m, the increment of vertical stress begins to increase slightly.
Figure 14 shows that, under the influence of the same mining distance, the horizontal stress increment of monitoring points on the high side of the roadway shows the following characteristics: (1) the stress increment of 11613 roadway is mainly concentrated at 4 m and 6 m measuring points, and that of 12521 roadway is mainly concentrated at 4 m. On the whole, the stress increment is mainly concentrated at a large distance from the roadway surface. (2) The stress increase of other horizontal stress increment monitoring points is relatively small.
Figure 15 shows that under the influence of the same mining distance, the increase of horizontal stress at measuring points of the lower wall of 11613 roadway is mainly concentrated at measuring points of 2 m and 8 m. The increase of horizontal stress of 12521 roadway’s low side measuring point is mainly concentrated at 6 m and 10 m measuring point, and the increase value is greater than that of 11613 roadway. The whole is concentrated at measuring points 6–10 m away from the roadway surface. Figure 16 shows that, under the influence of the same mining distance, the added vertical stress value of the monitoring points in the low side of the roadway shows the following characteristics: (1) the increase value of vertical stress at 8 m monitoring points within the monitoring range is the largest. Combined with the increasing trend, the maximum value is 12521 > 11318 > 11613. (2) The increase value of vertical stress decreases from 8 m to the adjacent measurement point, but it is larger than other monitoring points.

4.4. Comparison of Mining Stress Increment of Two Sides of Different Roadways under 25 m Lead Distance

The increase of stress in the two sides when the monitoring points of the three roadways are 25 m away from the working face is calculated, and the distribution diagram of vertical stress increases in the two sides when the distance is 25 m away from the working face is obtained, as shown in Figure 17.
Figure 17 shows that, at a distance of 25 m from the working face, as the distance from the roadway surface increases—although the added value of vertical stress in the three roadways fluctuates—it shows an overall trend of increasing first and then decreasing. The peak value is reached at 8 m, and then the vertical stress increment begins to fluctuate and decline, and the second peak value appears at 14 m. Although the increase value of high side vertical stress fluctuates partly, on the whole it increases with the increase of the depth of the monitoring point, and reaches its maximum value at 6 m.

5. Discussion

(1) The influence of buried depth on the added value of mining stress. The increased ranges of the stress added value of the monitoring points in the two sides of the three roadways are different under the influence of mining. It can be seen from Figure 15 that the increase order of stress added value is 12521 > 11613 > 11318. Additionally, the buried depth of the three roadways is 12521 approximately 660 m, 11613 approximately 630 m, and 11318 approximately 530 m. This shows that buried depth plays a decisive role in the increase of mining-induced stress: the greater the buried depth, the greater the increase of mining-induced stress.
(2) The influence of the setting time of monitoring points on the added value of mining stress. The setting and observation times of the monitoring points on the two sides of the three roadways are different. The observation time of 11613 is the longest, followed by 12521, and then 11318 is the shortest. The distance between observation point 11613 and the working face has not changed for a long time after the installation, but the stress increase in both sides has increased significantly after the installation. However, the final total stress increase is not greater than that of other tunnels. This shows that the installation time does not affect the later stress increment.
(3) Influence of working face distance on the increase of mining stress. According to the observation results, the influence range of mining caused by working face mining is about 150 m. When the distance affected by mining is less than 75 m, the increase rate of stress added in roadway is accelerated. When the mining distance is less than 25 m, the stress increase increases sharply. The stress increment of different roadways is basically the same, but the increment increment increases with the increase of buried depth.
(4) When the distance from the working face is less than 10 m, many sensors are damaged due to the influence of mining, which is an important reason for the disappearance of many sensor data. Some damage is due to the influence of mining stress, and the stress meter cannot measure the stress after the surrounding rock is broken.
(5) Influence of roadway deformation on the added value of mining stress. From the increase range of stress increment at monitoring points and distance of roadway surface. After high side deformation, the increase value of stress is smaller than that of coal pillar 3 m away, and the deformation of roadway surface releases the deformation energy of surrounding rock.The deformation of a roadway’s low wall causes the peak value of stress increase to move to the depth of the surrounding rock, and the peak value of vertical stress increase is about 8 m away from the roadway surface.

6. Conclusions

Under the influence of working face mining, the stress increment in the two sides of the roadway shows the following characteristics.
(1) In terms of the increased range of stress added value, the high side vertical stress increases with the increase of distance from the roadway surface, and the peak point is at 6 m. Meanwhile, the low side vertical stress added value has a maximum value at 8 m and a peak value at 14 m. The increased value of horizontal stress of the high side has two peaks, which are 4 m and 6 m, respectively. The increment of horizontal stress in the low side is also around 8 m.
(2) The mining influence range of working face mining is about 150 m, and the mining influence distance can be divided into three stages: 0–25 m, 25–60 m, and 60 m. The increase of vertical and horizontal stress caused by mining influence increases sharply within 25 m away from the working face.
(3) The buried depth of the roadway influences the range of mining influence and the increase of mining stress caused by working face mining. The greater the extent to which the buried depth of the roadway increases, the greater the range of mining influence and the increase of mining stress.
(4) After roadway excavation, the surface deformation of roadway surrounding rock reduces the increase of mining stress near the roadway surface.

Author Contributions

Data curation, Q.J. and H.W.; Investigation, T.L. and K.L.; Project administration, W.P. and X.G.; Resources, Y.Z. All authors have read and agreed to the published version of the manuscript.

Funding

Funded by the National Natural Science Foundation of China (No. 52074117, No. 51774133).

Data Availability Statement

Data available on request due to privacy restrictions.

Conflicts of Interest

The authors declare no conflict of interest.

References

  1. Zhao, K.; Li, L. Analysis and development of coal resource security in China. Coal Eng. 2018, 50, 185–189. [Google Scholar]
  2. Chang, J.; Xie, G. Mechanical characteristics and stability control of deep roadway surrounding rock. J. China Coal Soc. 2009, 34, 881–886. [Google Scholar]
  3. Chen, X.; Wang, M. Study on deformation characteristics and control technology of surrounding rock in deep inclined coal seam along with goaf excavation. J. Min. Saf. Eng. 2015, 32, 485–490. [Google Scholar] [CrossRef]
  4. Wang, M.; Bai, J.; Wang, X.; Chen, B.; Han, Z. Study on stability and control of the overlying structure of deep inclined coal seam along goaf. J. Min. Saf. Eng. 2015, 32, 426–432. [Google Scholar] [CrossRef]
  5. Wei, S.; Song, J.; Jing, H. Numerical analysis of surrounding rock stress distribution in dynamic pressure roadway of inclined coal seam. Met. Mine 2012, 37–41. [Google Scholar]
  6. Wu, H.; Zhang, N.; Wang, W.; Peng, G. Simulation and control technology of roadway deformation characteristics in deep inclined strata. J. Hunan Univ. Sci. Technol. (Nat. Sci. Ed.) 2013, 28, 6–12. [Google Scholar]
  7. Gao, Y. Study on defamation law and surrounding rock control of soft rock roadway in gently inclined Coal seam. Min. Saf. Environ. Prot. 2017, 44, 53–56, 59. [Google Scholar]
  8. Sun, X.; Zhang, G.; Cai, F.; Yu, S. Mechanism and control countermeasures of asymmetric deformation of roadway in deep inclined strata. Chin. J. Rock Mech. Eng. 2009, 28, 1137–1143. [Google Scholar]
  9. Zhang, X.; Chang, J. Study on stress and failure characteristics of surrounding rock in extremely close seam mining with upper and lower goaf. J. Min. Saf. Eng. 2014, 31, 506–511. [Google Scholar]
  10. Fu, Y. Deformation and failure mechanism of roadway surrounding rock undermining stress and grouting reinforcement technology. Coal Min. 2017, 22, 34–39. [Google Scholar] [CrossRef]
  11. Chen, J.; Yan, R.; Liu, K. Asymmetric deformation mechanism of roadway in steeply inclined extra-thick coal seam. J. Coal 2018, 43, 3007–3015. [Google Scholar] [CrossRef]
  12. Wang, H.; Yang, C.; Tian, X. Study on surrounding rock deformation law and support technology of mining-influenced roadway with small coal pillar in goaf. Coal Eng. 2020, 52, 53–57. [Google Scholar]
  13. Li, L.; Lai, X.; Li, Y.; Lin, H. Monitoring of roadway stress and deformation under a broken surrounding rock. J. Xi’an Univ. Sci. Technol. 2010, 30, 24–28. [Google Scholar] [CrossRef]
  14. Yang, F.; Chen, W.; Zheng, P.; Wu, G.; Yuan, J.; Yu, J. Study on deformation and failure mechanism and support technology of steeply inclined soft and hard interbedded roadway. Rock Soil Mech. 2014, 35, 2367–2374, 2425. [Google Scholar] [CrossRef]
  15. Lu, D. Study on roof stress distribution and deformation characteristics of steeply inclined thin coal seam mining. Coal Eng. 2015, 47, 84–87. [Google Scholar]
  16. Wang, W.; Yuan, C.; Yu, W.; Zhao, Y.; Peng, W.; Wu, H.; Peng, G.; Qu, Y. Control technology of surrounding rock reserved deformation in deep high-stress roadway. J. China Coal Soc. 2016, 41, 2156–2164. [Google Scholar]
  17. Xie, G.; Li, C.; Wang, L. Mechanical characteristics and engineering practice of roadway surrounding rock stress shell. J. China Coal Soc. 2016, 41, 2986–2992. [Google Scholar]
  18. Zhao, P.; Li, G.; Li, S.; Liu, L.; Wang, X.; Jia, Y.; Wang, H. Dimensional effect analysis of mechanical characteristics of coal pillar in inclined thick coal seam along goaf. J. Min. Saf. Eng. 2019, 36, 1120–1127. [Google Scholar] [CrossRef]
  19. Sun, Z.; Gao, K.; Cui, G.; Sun, Y. Stress distribution and asymmetric deformation law of deep inclined coal seam crossing roadway. Coal Mine Saf. 2017, 48, 61–64. [Google Scholar] [CrossRef]
  20. Wang, W.; Yuan, Y.; Yu, W.; Chen, X. Failure mechanism and control of floor dark deviated well-undermining influence. J. China Coal Soc. 2014, 39, 1463–1472. [Google Scholar]
  21. Wang, P.; Zhou, G.; Zou, C.; Wang, H.; Wang, C. Asymmetrical support technology of gob-side roadway in inclined coal seam. Met. Mine 2014, 70–73. [Google Scholar]
  22. Wang, X.; Bai, J.; Wang, M. Uneven instability mechanism and control technology of deeply inclined rock roadway under the influence of weak surface. J. Min. Saf. Eng. 2015, 32, 544–551. [Google Scholar] [CrossRef]
  23. Qi, F. Deformation Mechanism and Control Technology of Surrounding Rock Along Gob Roadway in Fully Mechanized Caving; China University of Mining and Technology: Xuzhou, China, 2016. [Google Scholar]
  24. Chen, S.; Song, C.; Guo, Z.; Wang, J.; Wang, Y. Mechanical mechanism and control countermeasures of asymmetric deformation of deep dynamic pressure roadway. Coal J. 2016, 41, 246–254. [Google Scholar] [CrossRef]
  25. Shi, P.; Xu, S.; Chen, Z. Study on the law of mining pressure in goaf excavation with fully mechanized caving. Mine Press. Roof Manag. 2004, 32–33, 31–118. [Google Scholar]
  26. Han, C.; Zhang, K.; Xu, X.; Li, D.; Xie, P. Study on the failure law and reasonable size of section small coal pillar. J. Min. Saf. Eng. 2007, 370–373. [Google Scholar]
  27. Song, G.; Zhang, K. Study on the law of mining pressure in mining roadway of inclined coal seam. Min. Saf. Environ. Prot. 2010, 37, 14–16, 19, 91. [Google Scholar]
  28. Zhang, L.; Kou, J.; Dou, M.; Huang, Z. Monitoring and research of surrounding rock stress under the influence of goaf. China Saf. Sci. Technol. 2015, 11, 33–39. [Google Scholar]
Figure 1. 11318 Schematic diagram of section layout of measuring station.
Minerals 12 00499 g001
Figure 2. 11318 Graphic layout of measuring station.
Minerals 12 00499 g002
Figure 3. 11613 Schematic diagram of section layout of measuring station.
Minerals 12 00499 g003
Figure 4. 11613 Graphic layout of measuring station.
Minerals 12 00499 g004
Figure 5. 12521 Schematic diagram of section layout of measuring station.
Minerals 12 00499 g005
Figure 6. 12521 Graphic layout of measuring station.
Minerals 12 00499 g006
Figure 7. Drill hole stress gauge.
Minerals 12 00499 g007
Figure 8. Stress distribution diagram of mining roadway surrounding rock.
Minerals 12 00499 g008
Figure 9. Comparison analysis diagram of vertical stress increment at different depth measuring points in high wall. (a) 11318 roadway; (b) 11613 roadway;(c) 12521 roadway.
Minerals 12 00499 g009
Figure 10. Comparison analysis diagram of horizontal force increment at different depth measuring points in high wall. (a) 11613 roadway; (b) 12521 roadway.
Minerals 12 00499 g010
Figure 11. Comparison analysis diagram of vertical stress increment at different depth measuring points in low wall. (a) 11318 roadway; (b) 11613 roadway; (c) 12521 roadway.
Minerals 12 00499 g011
Figure 12. Comparison diagram of horizontal stress at different depth measuring points at low side. (a) 11613 roadway; (b) 12521 roadway.
Minerals 12 00499 g012
Figure 13. Contrast analysis diagram of high side vertical stress. (a) 11318 roadway; (b) 11613 roadway; (c) 12521 roadway.
Minerals 12 00499 g013
Figure 14. Comparison analysis diagram of high lateral stress. (a) 11613 roadway; (b) 12521 roadway.
Minerals 12 00499 g014
Figure 15. Comparison analysis diagram of horizontal stress increment of low side within 75 m. (a) 11613 roadway; (b) 12521 roadway.
Minerals 12 00499 g015
Figure 16. Comparison analysis diagram of vertical stress increment of low side within 75 m. (a) 11318 roadway; (b) 11613 roadway; (c) 12521 roadway.
Minerals 12 00499 g016
Figure 17. Comparison diagram of vertical stress increment of high and low sides at 25 m lead distance.
Minerals 12 00499 g017
Publisher’s Note: MDPI stays neutral with regard to jurisdictional claims in published maps and institutional affiliations.

