
Prognostic Exploration of U-F-Au-Mo-W Younger Granites for Geochemical Pathfinders, Genetic Affiliations, and Tectonic Setting in El-Erediya-El-Missikat Province, Eastern Desert, Egypt

 ,
,  and
and
Abstract
:1. Introduction
2. Materials and Methods
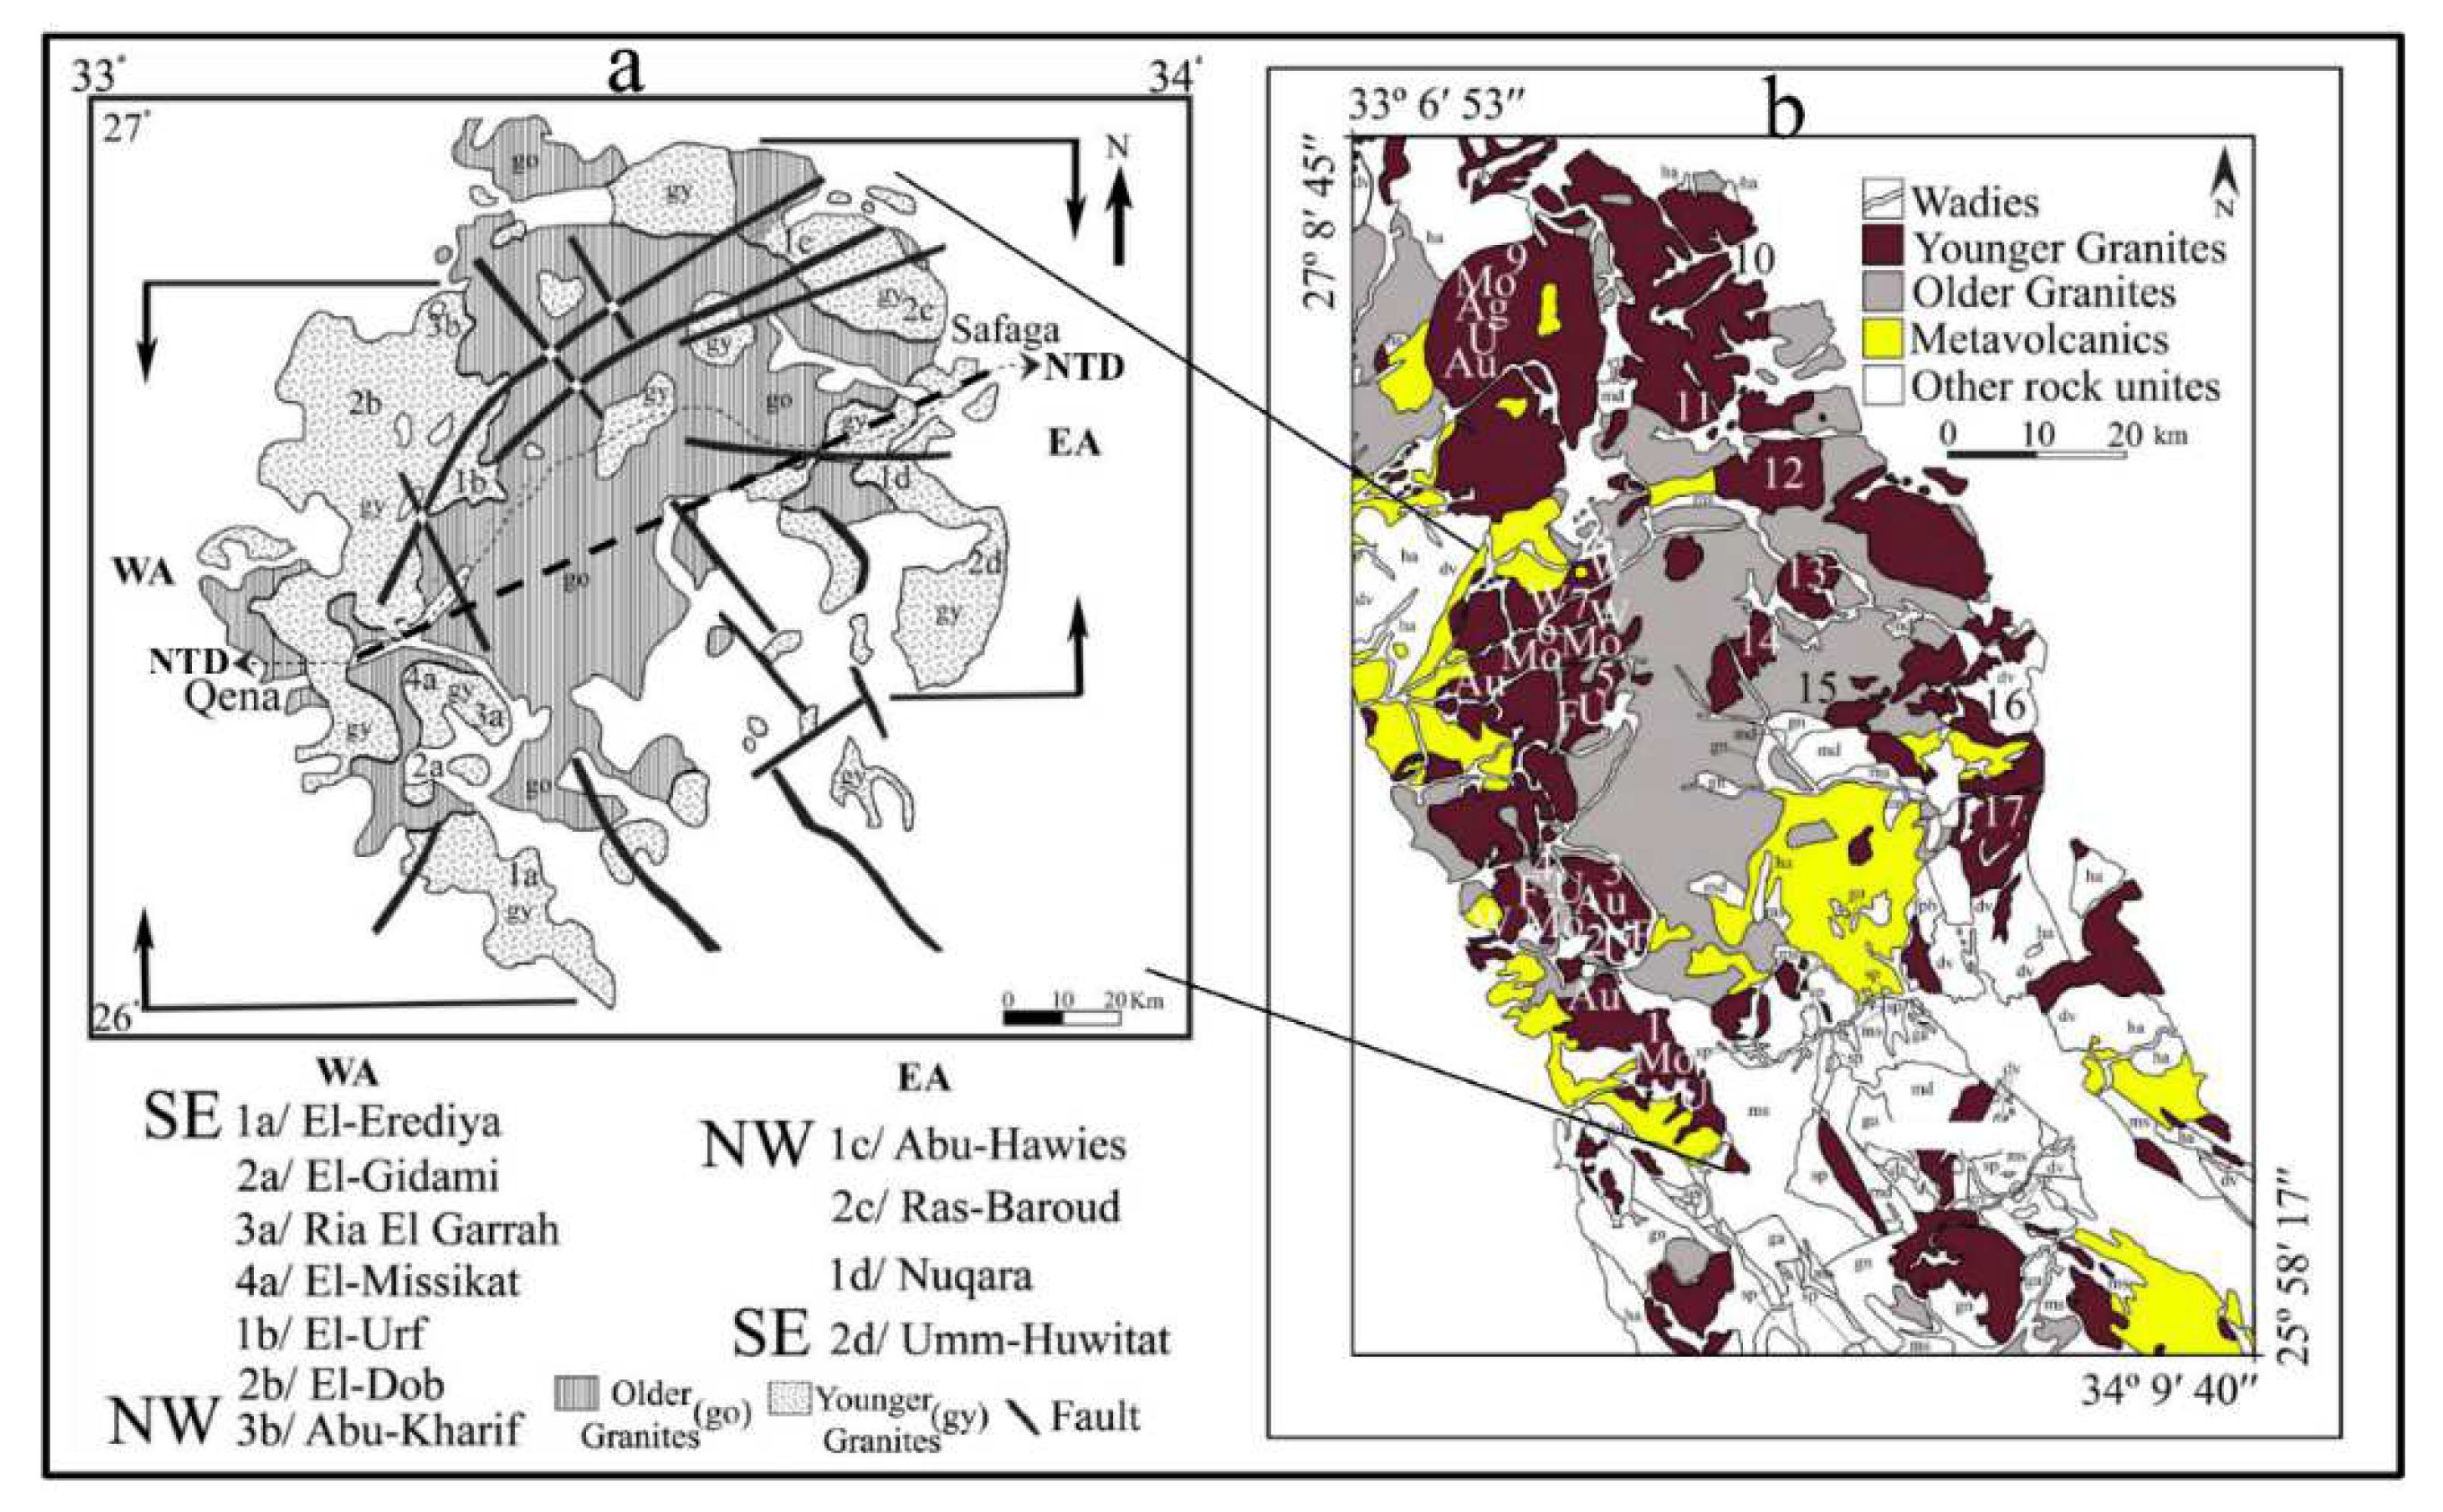
Geological Setting

3. Results and Discussion
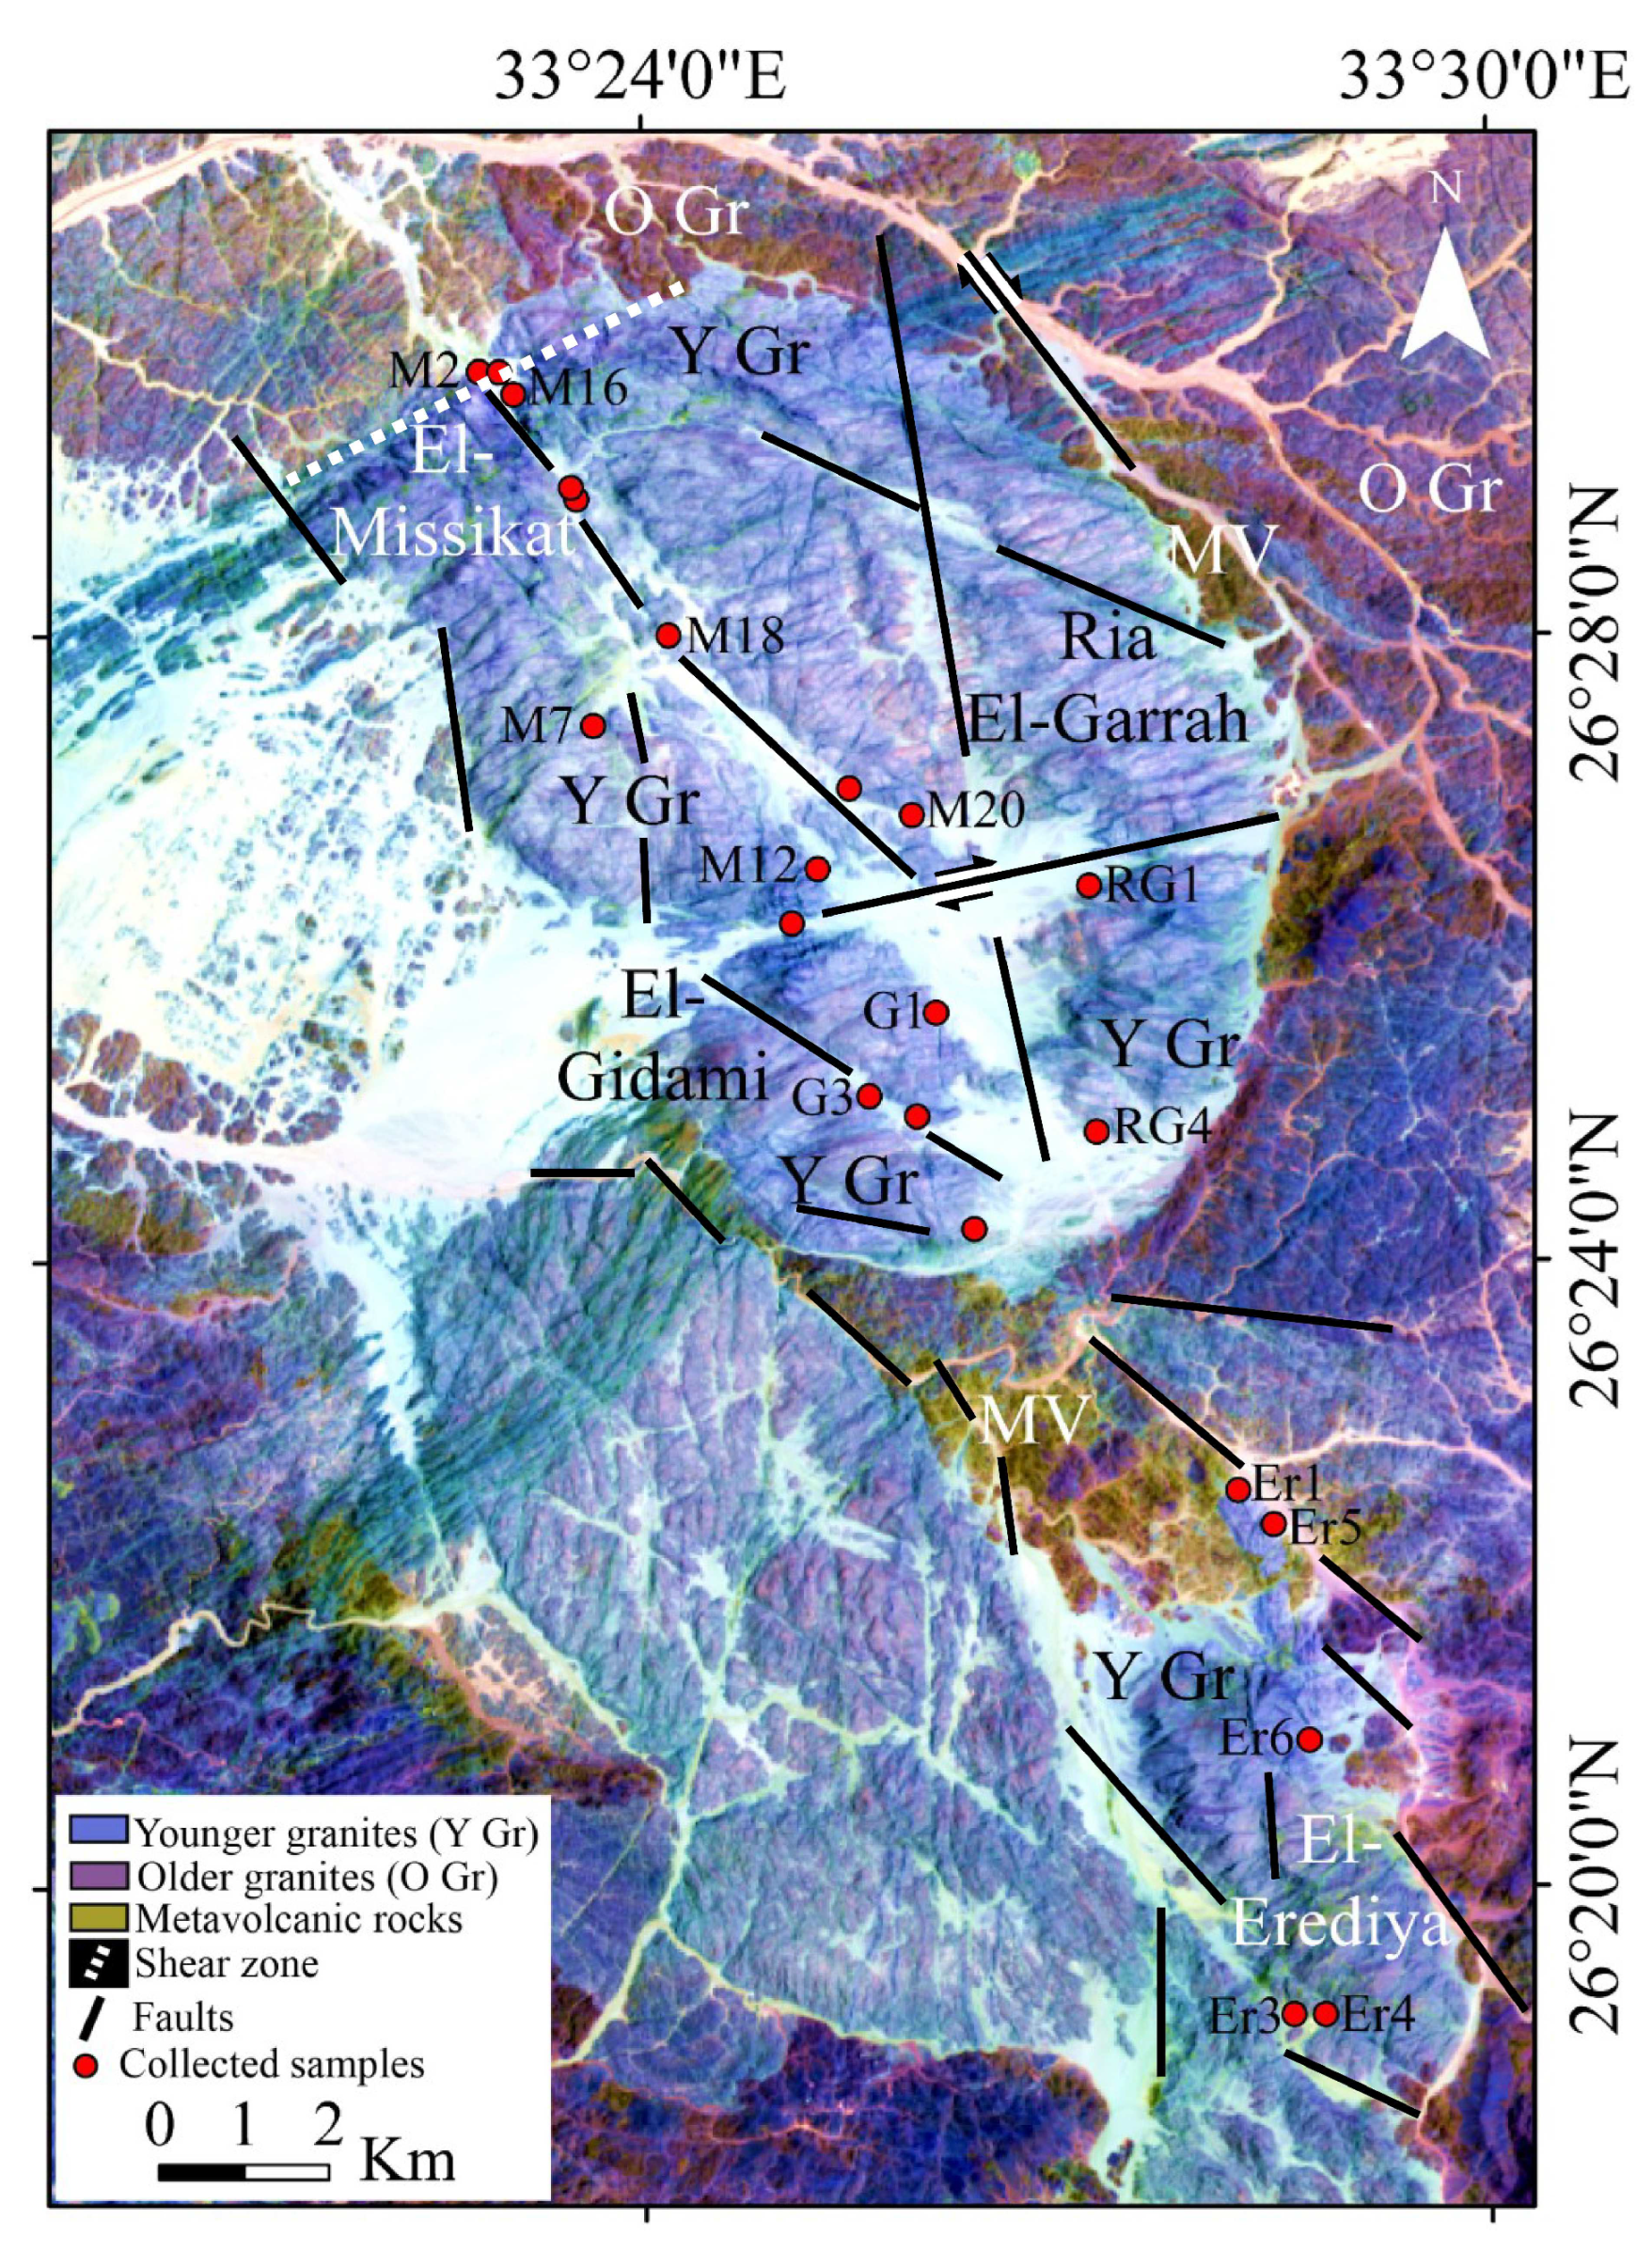
3.1. Remote Sensing Data Analysis
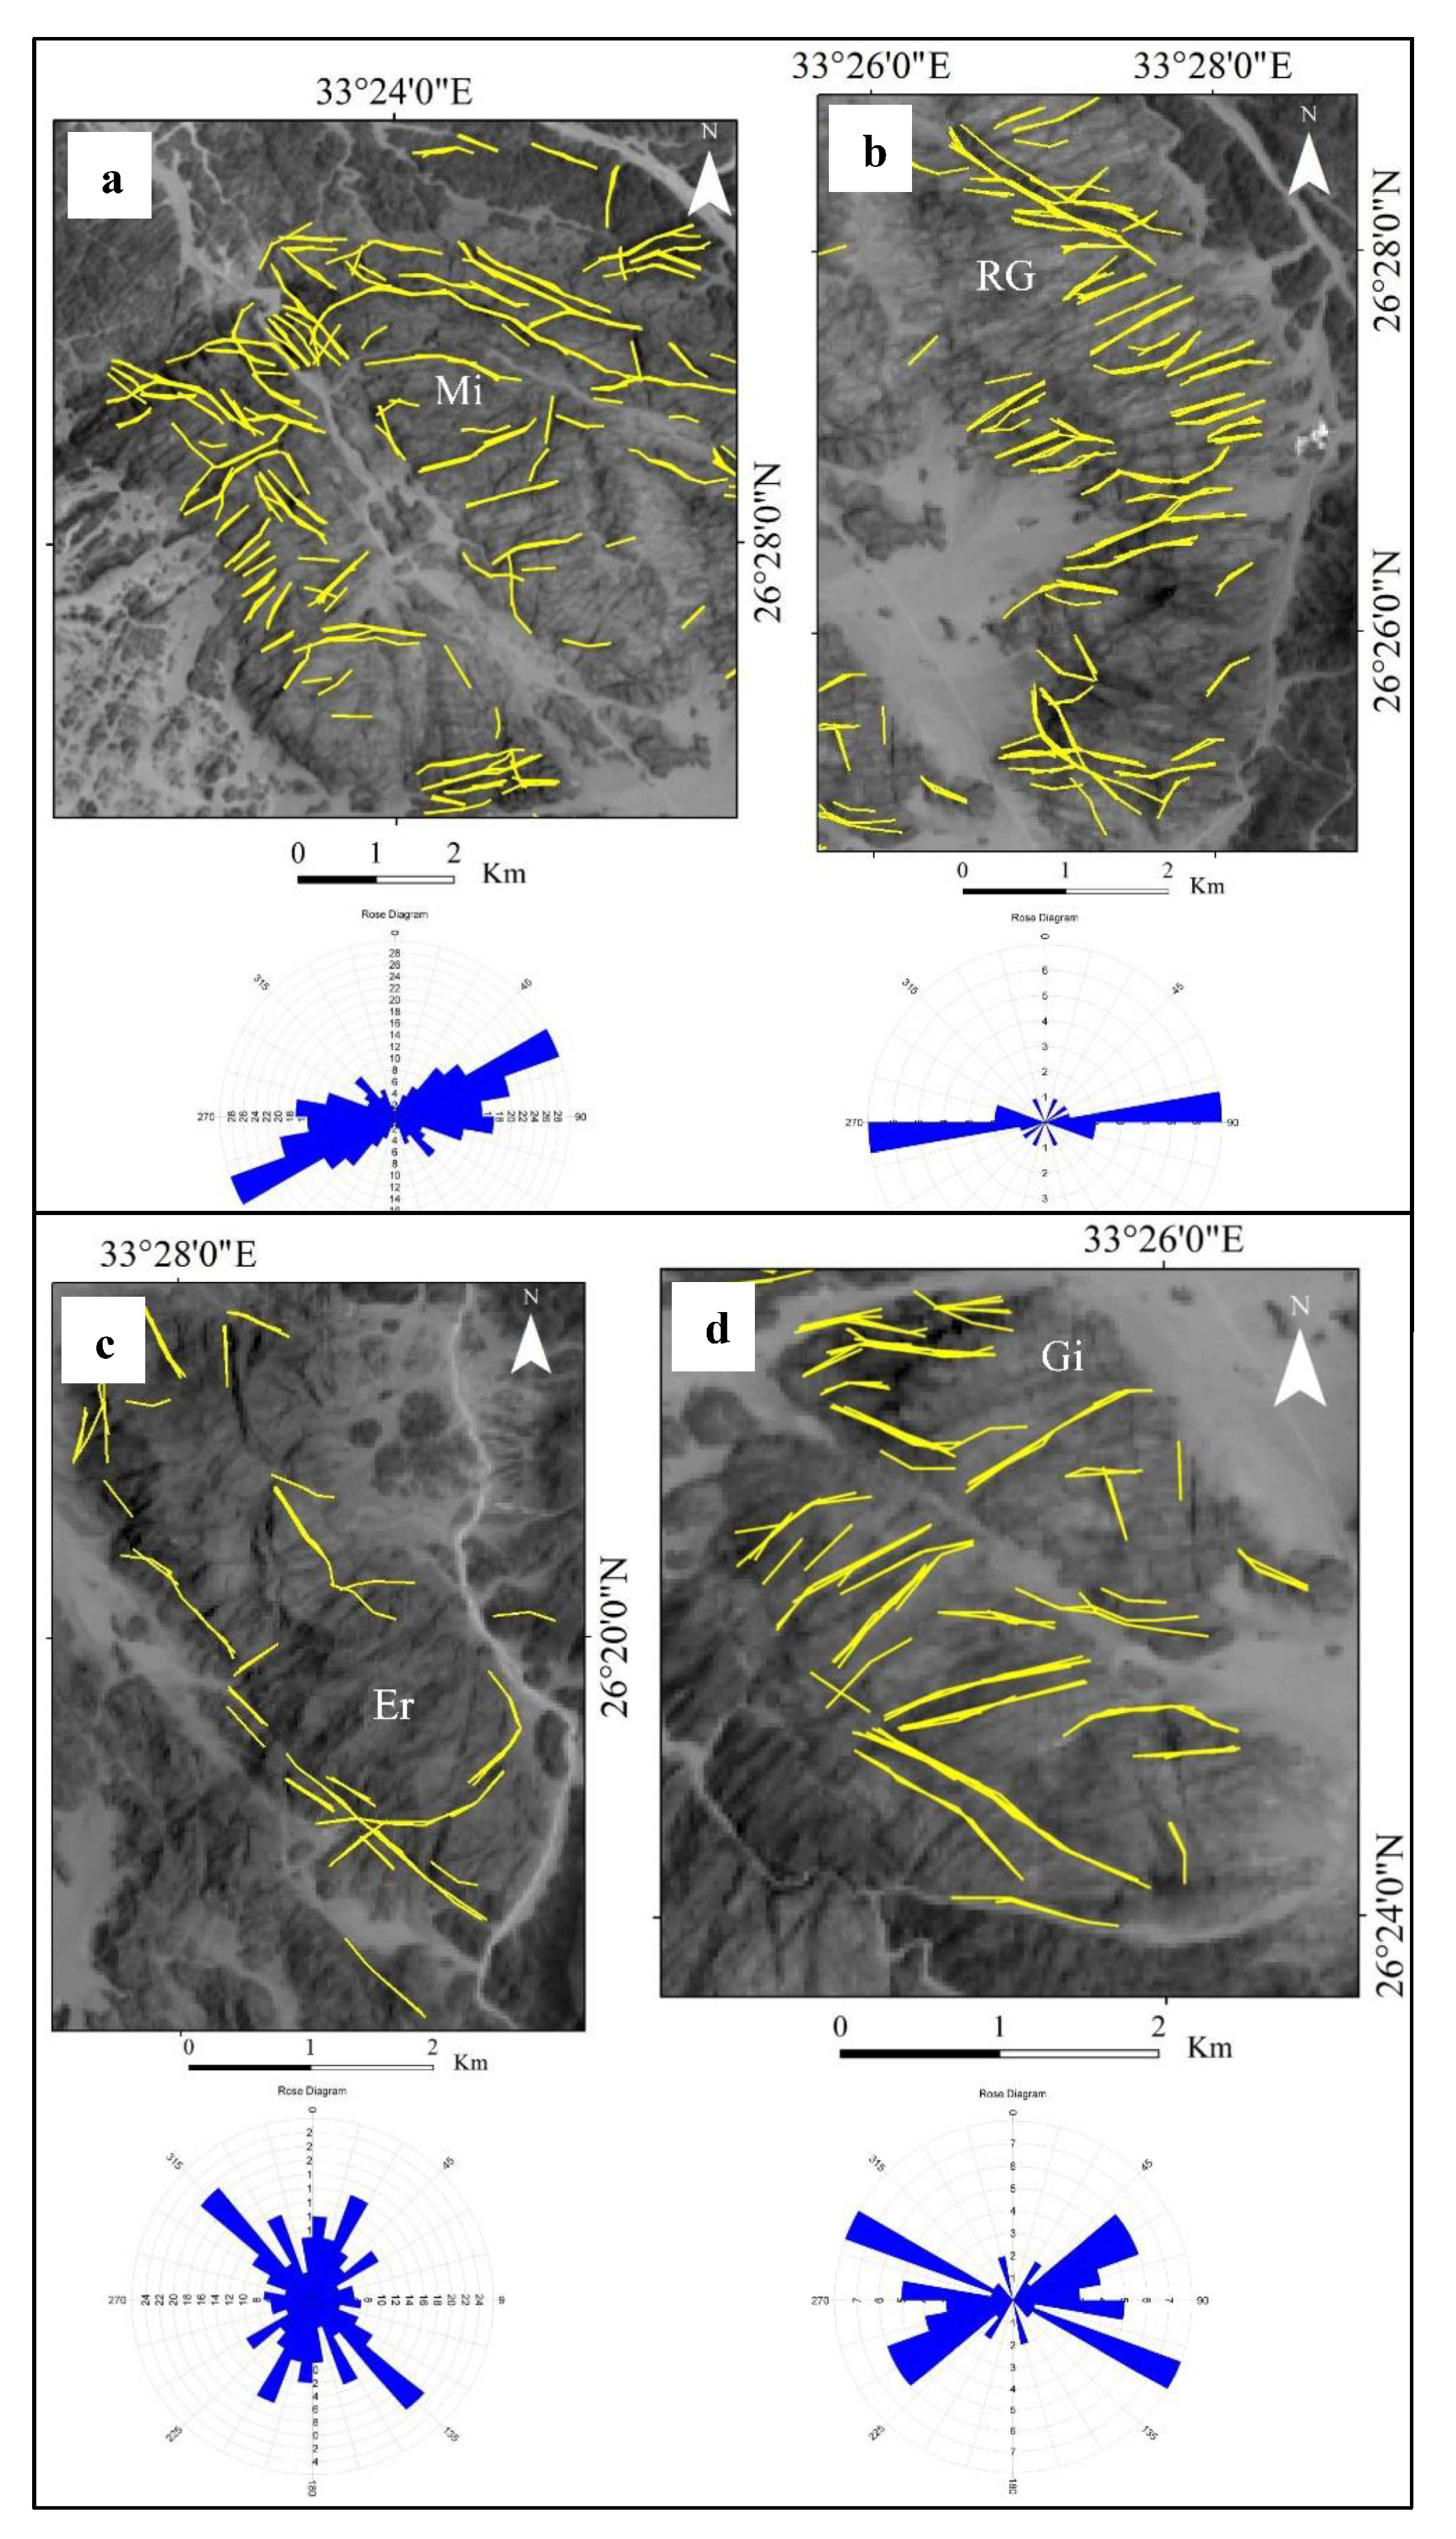
3.1.1. Structures
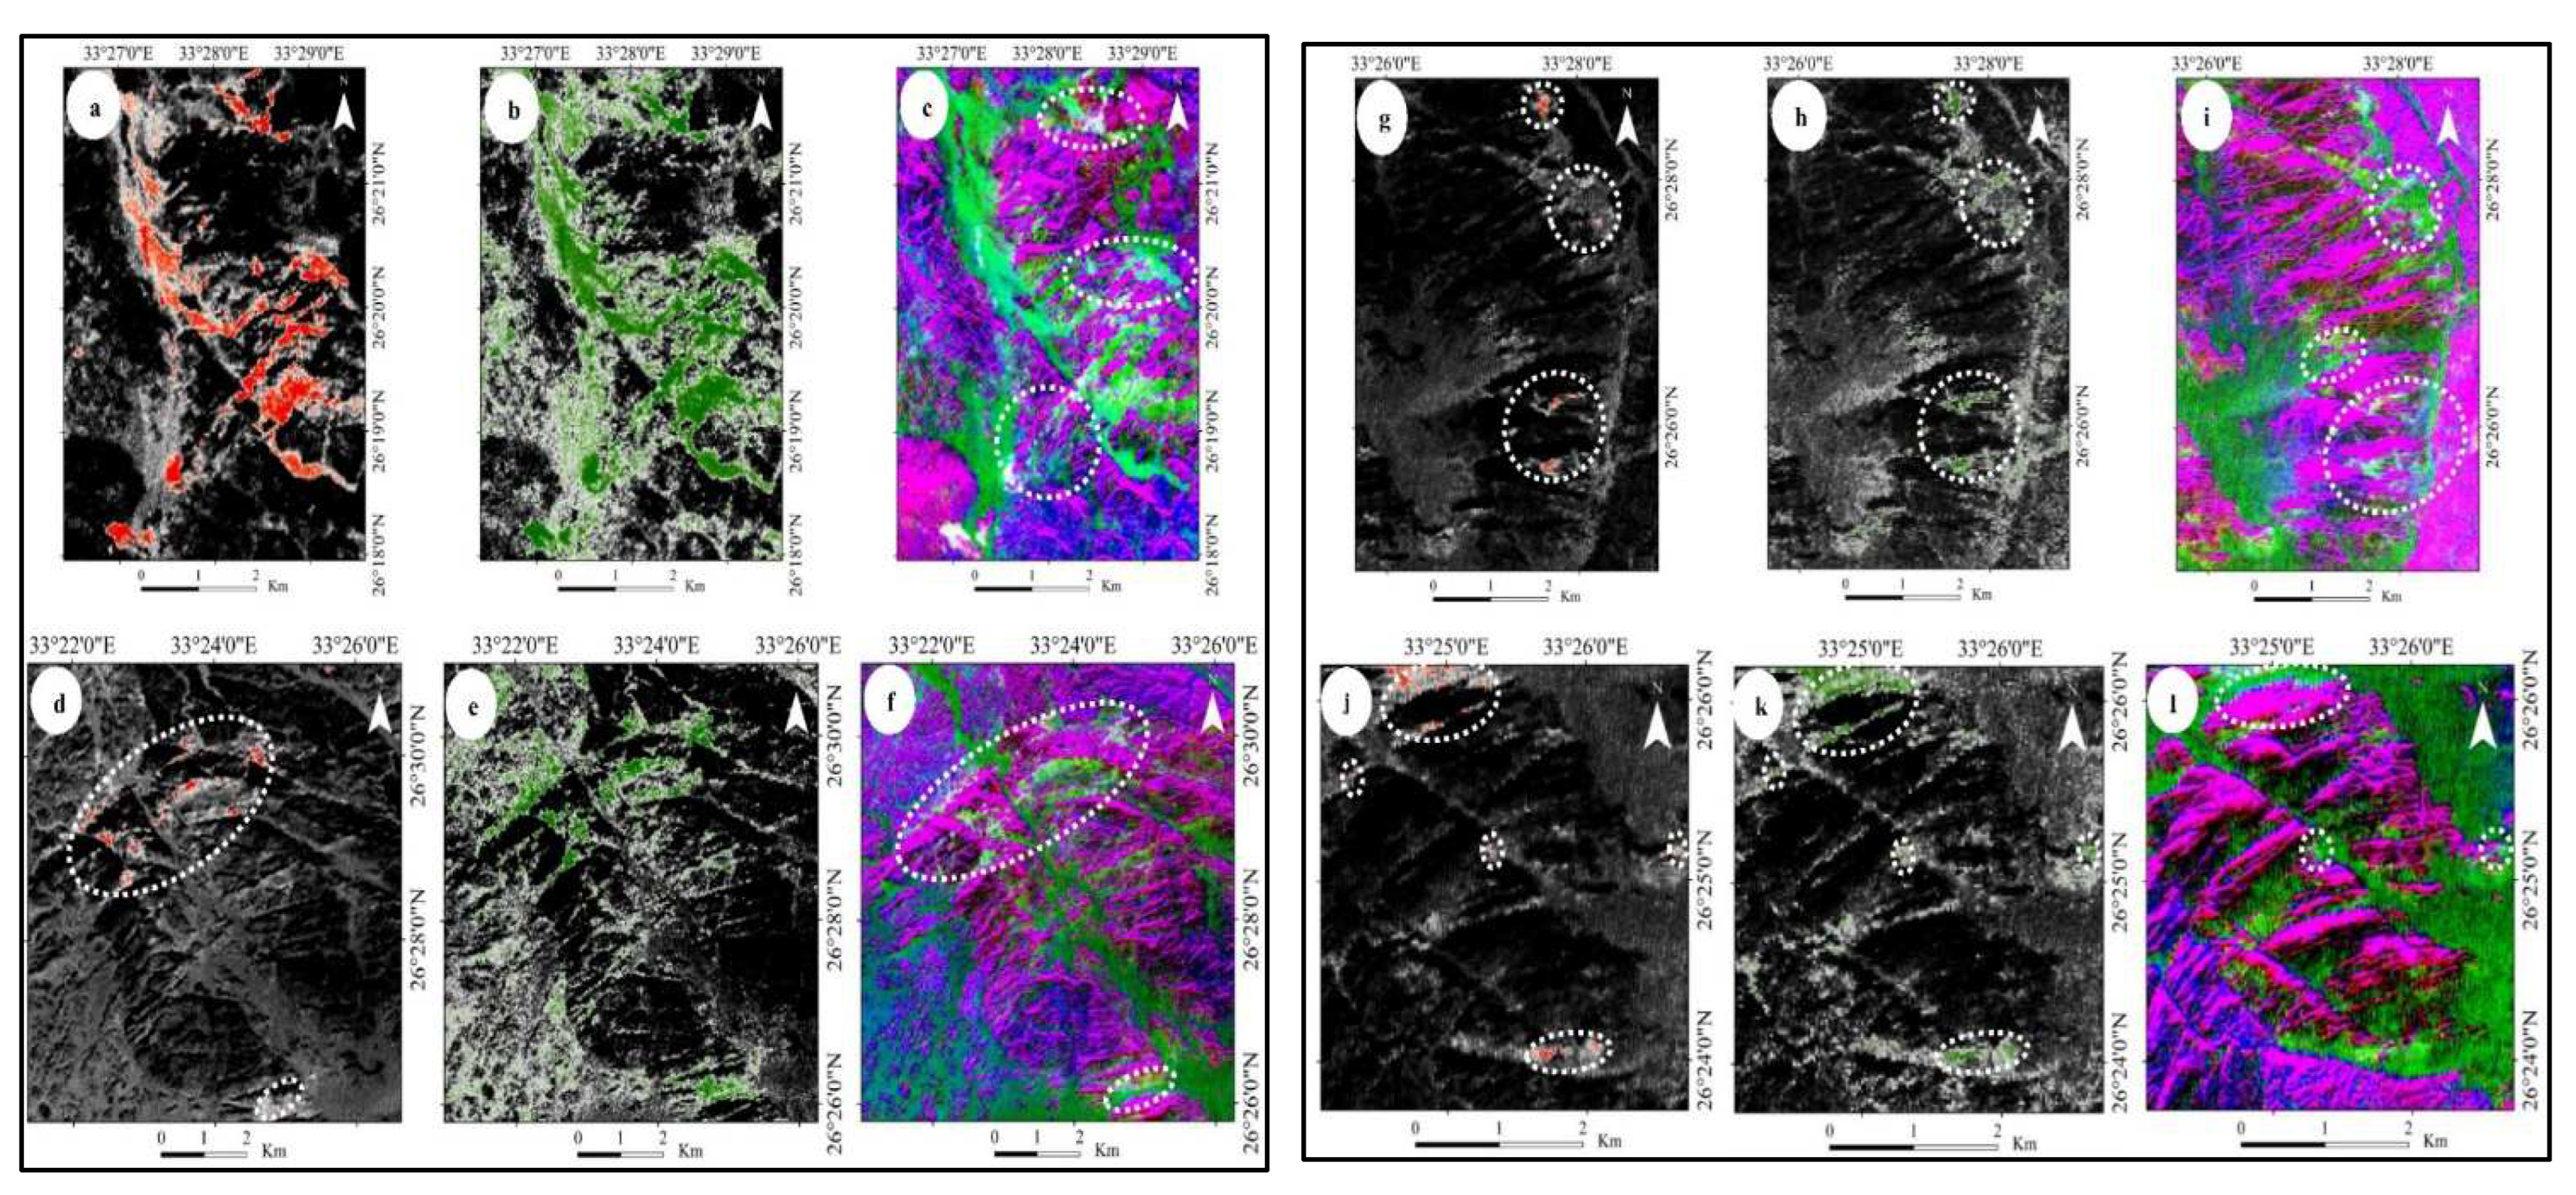
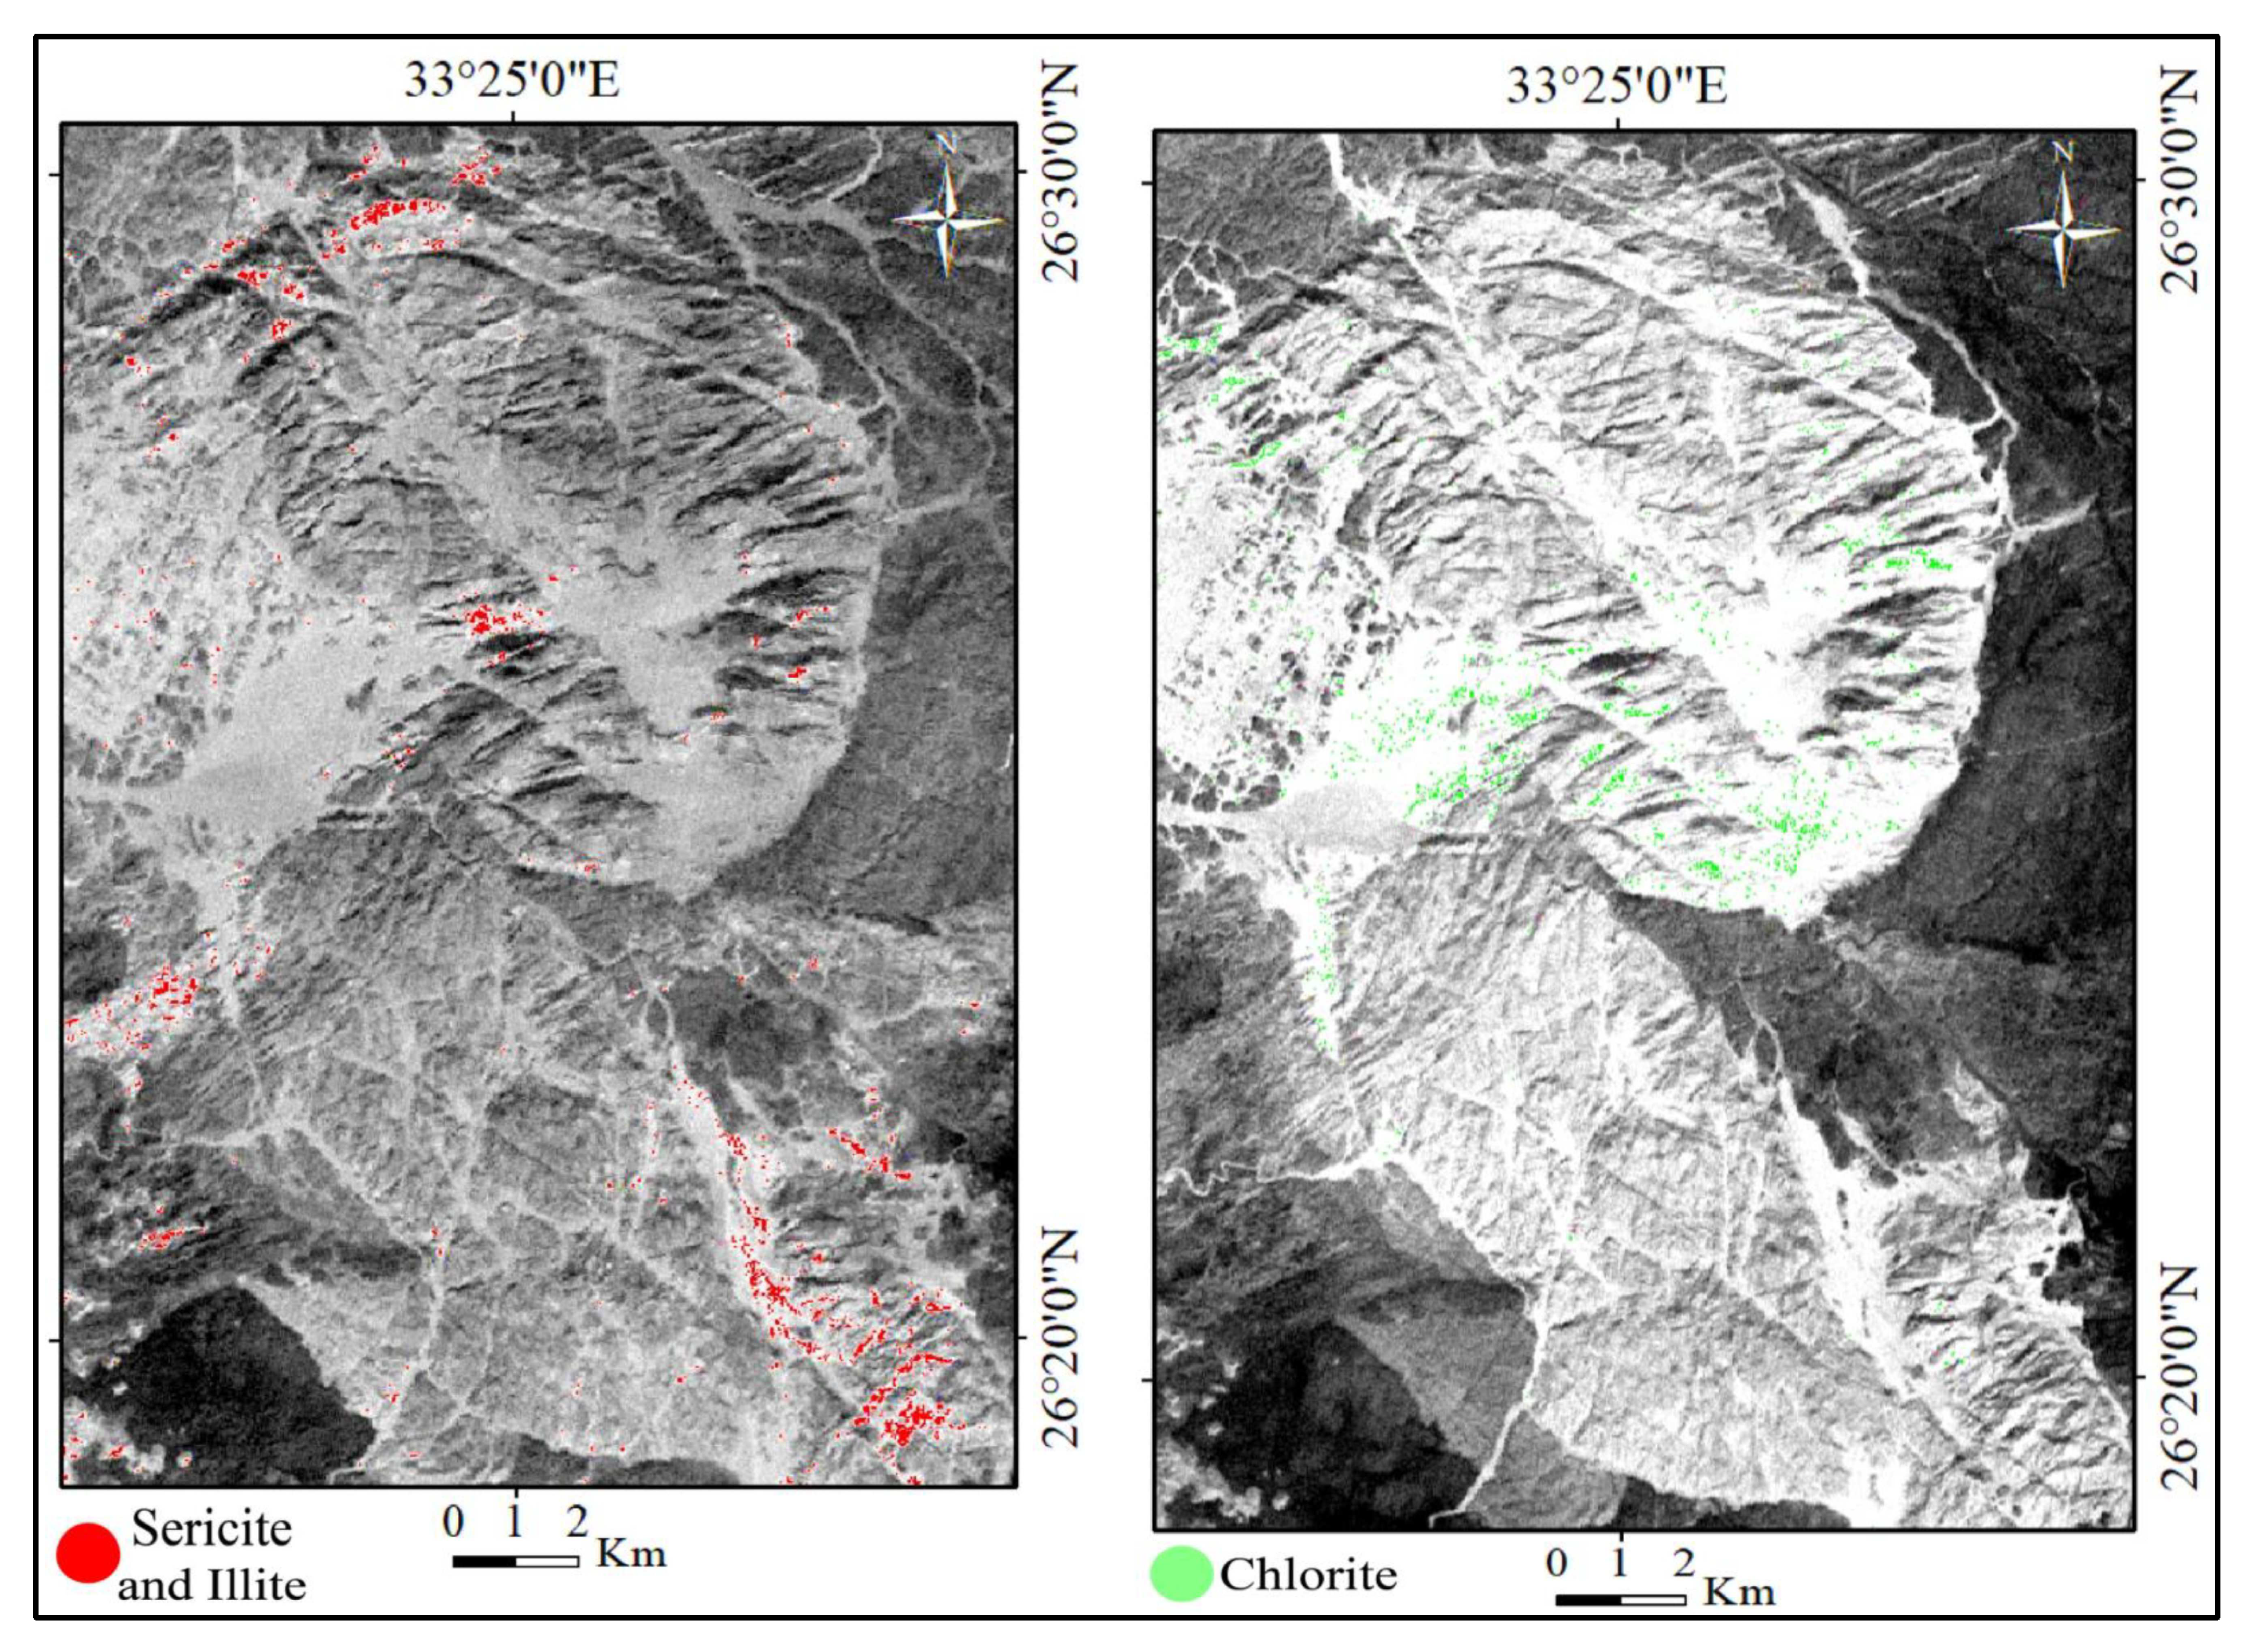
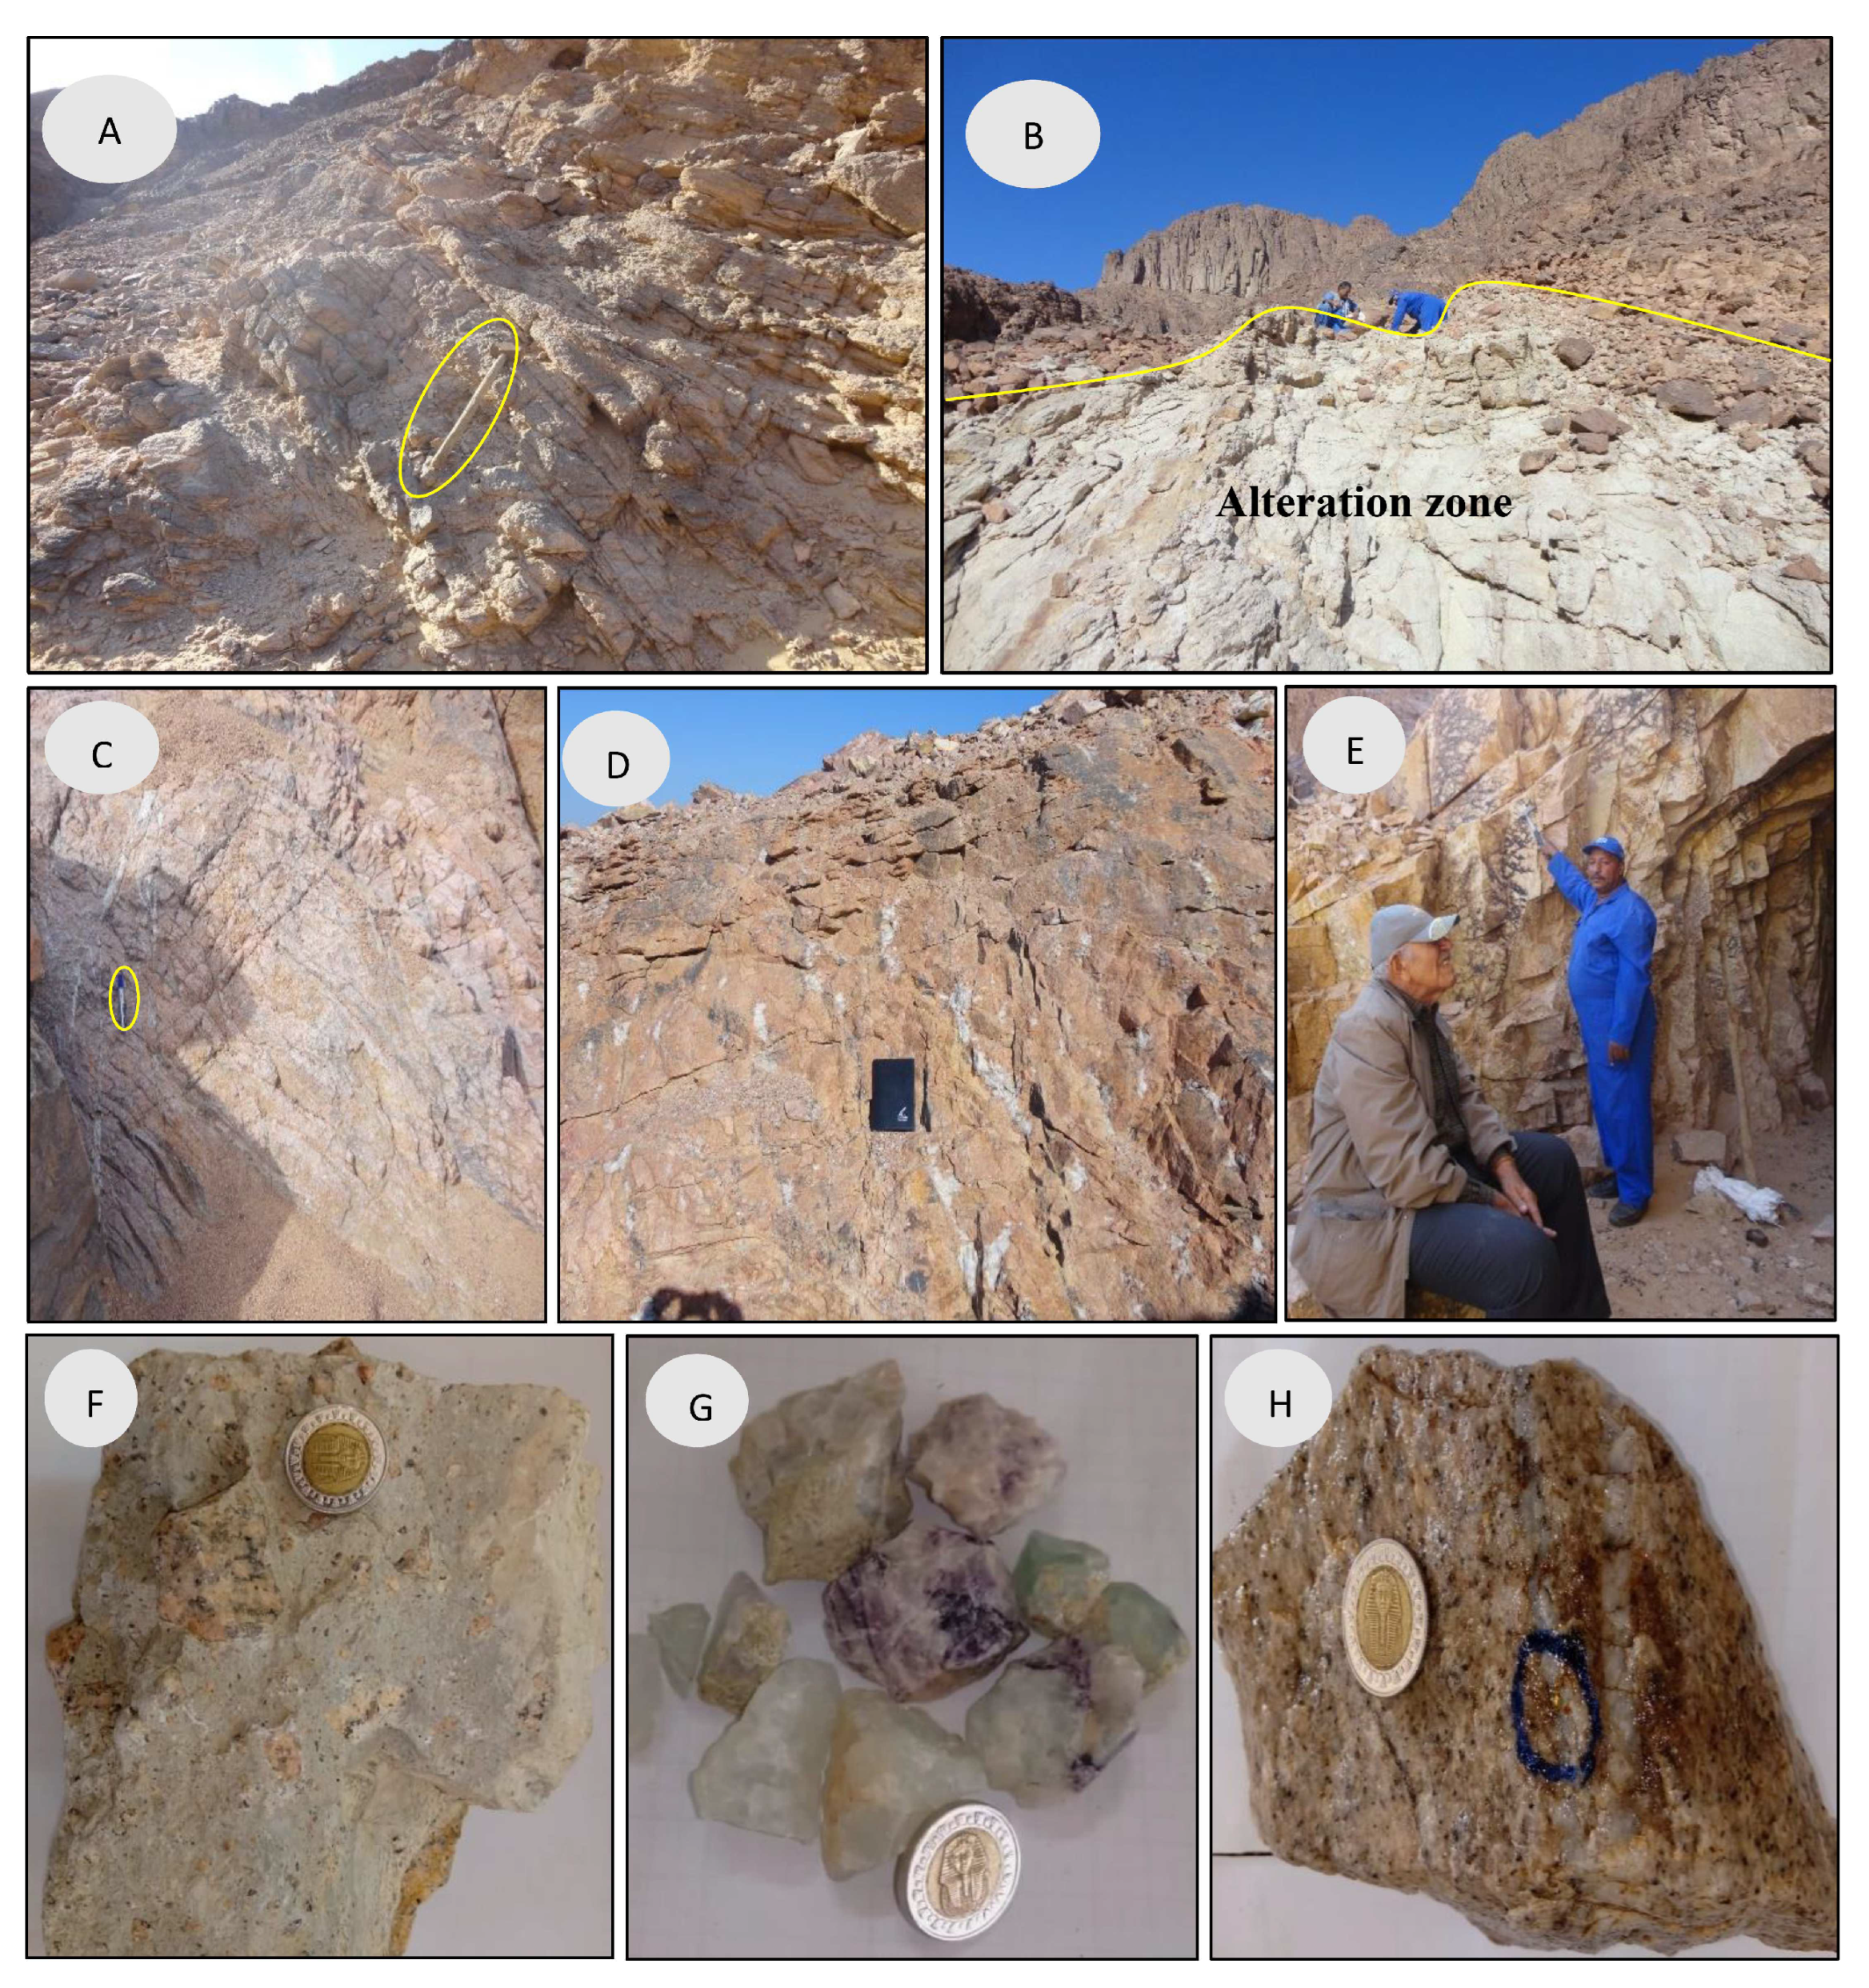
3.1.2. Alteration Types
3.2. Geochemical Characterization
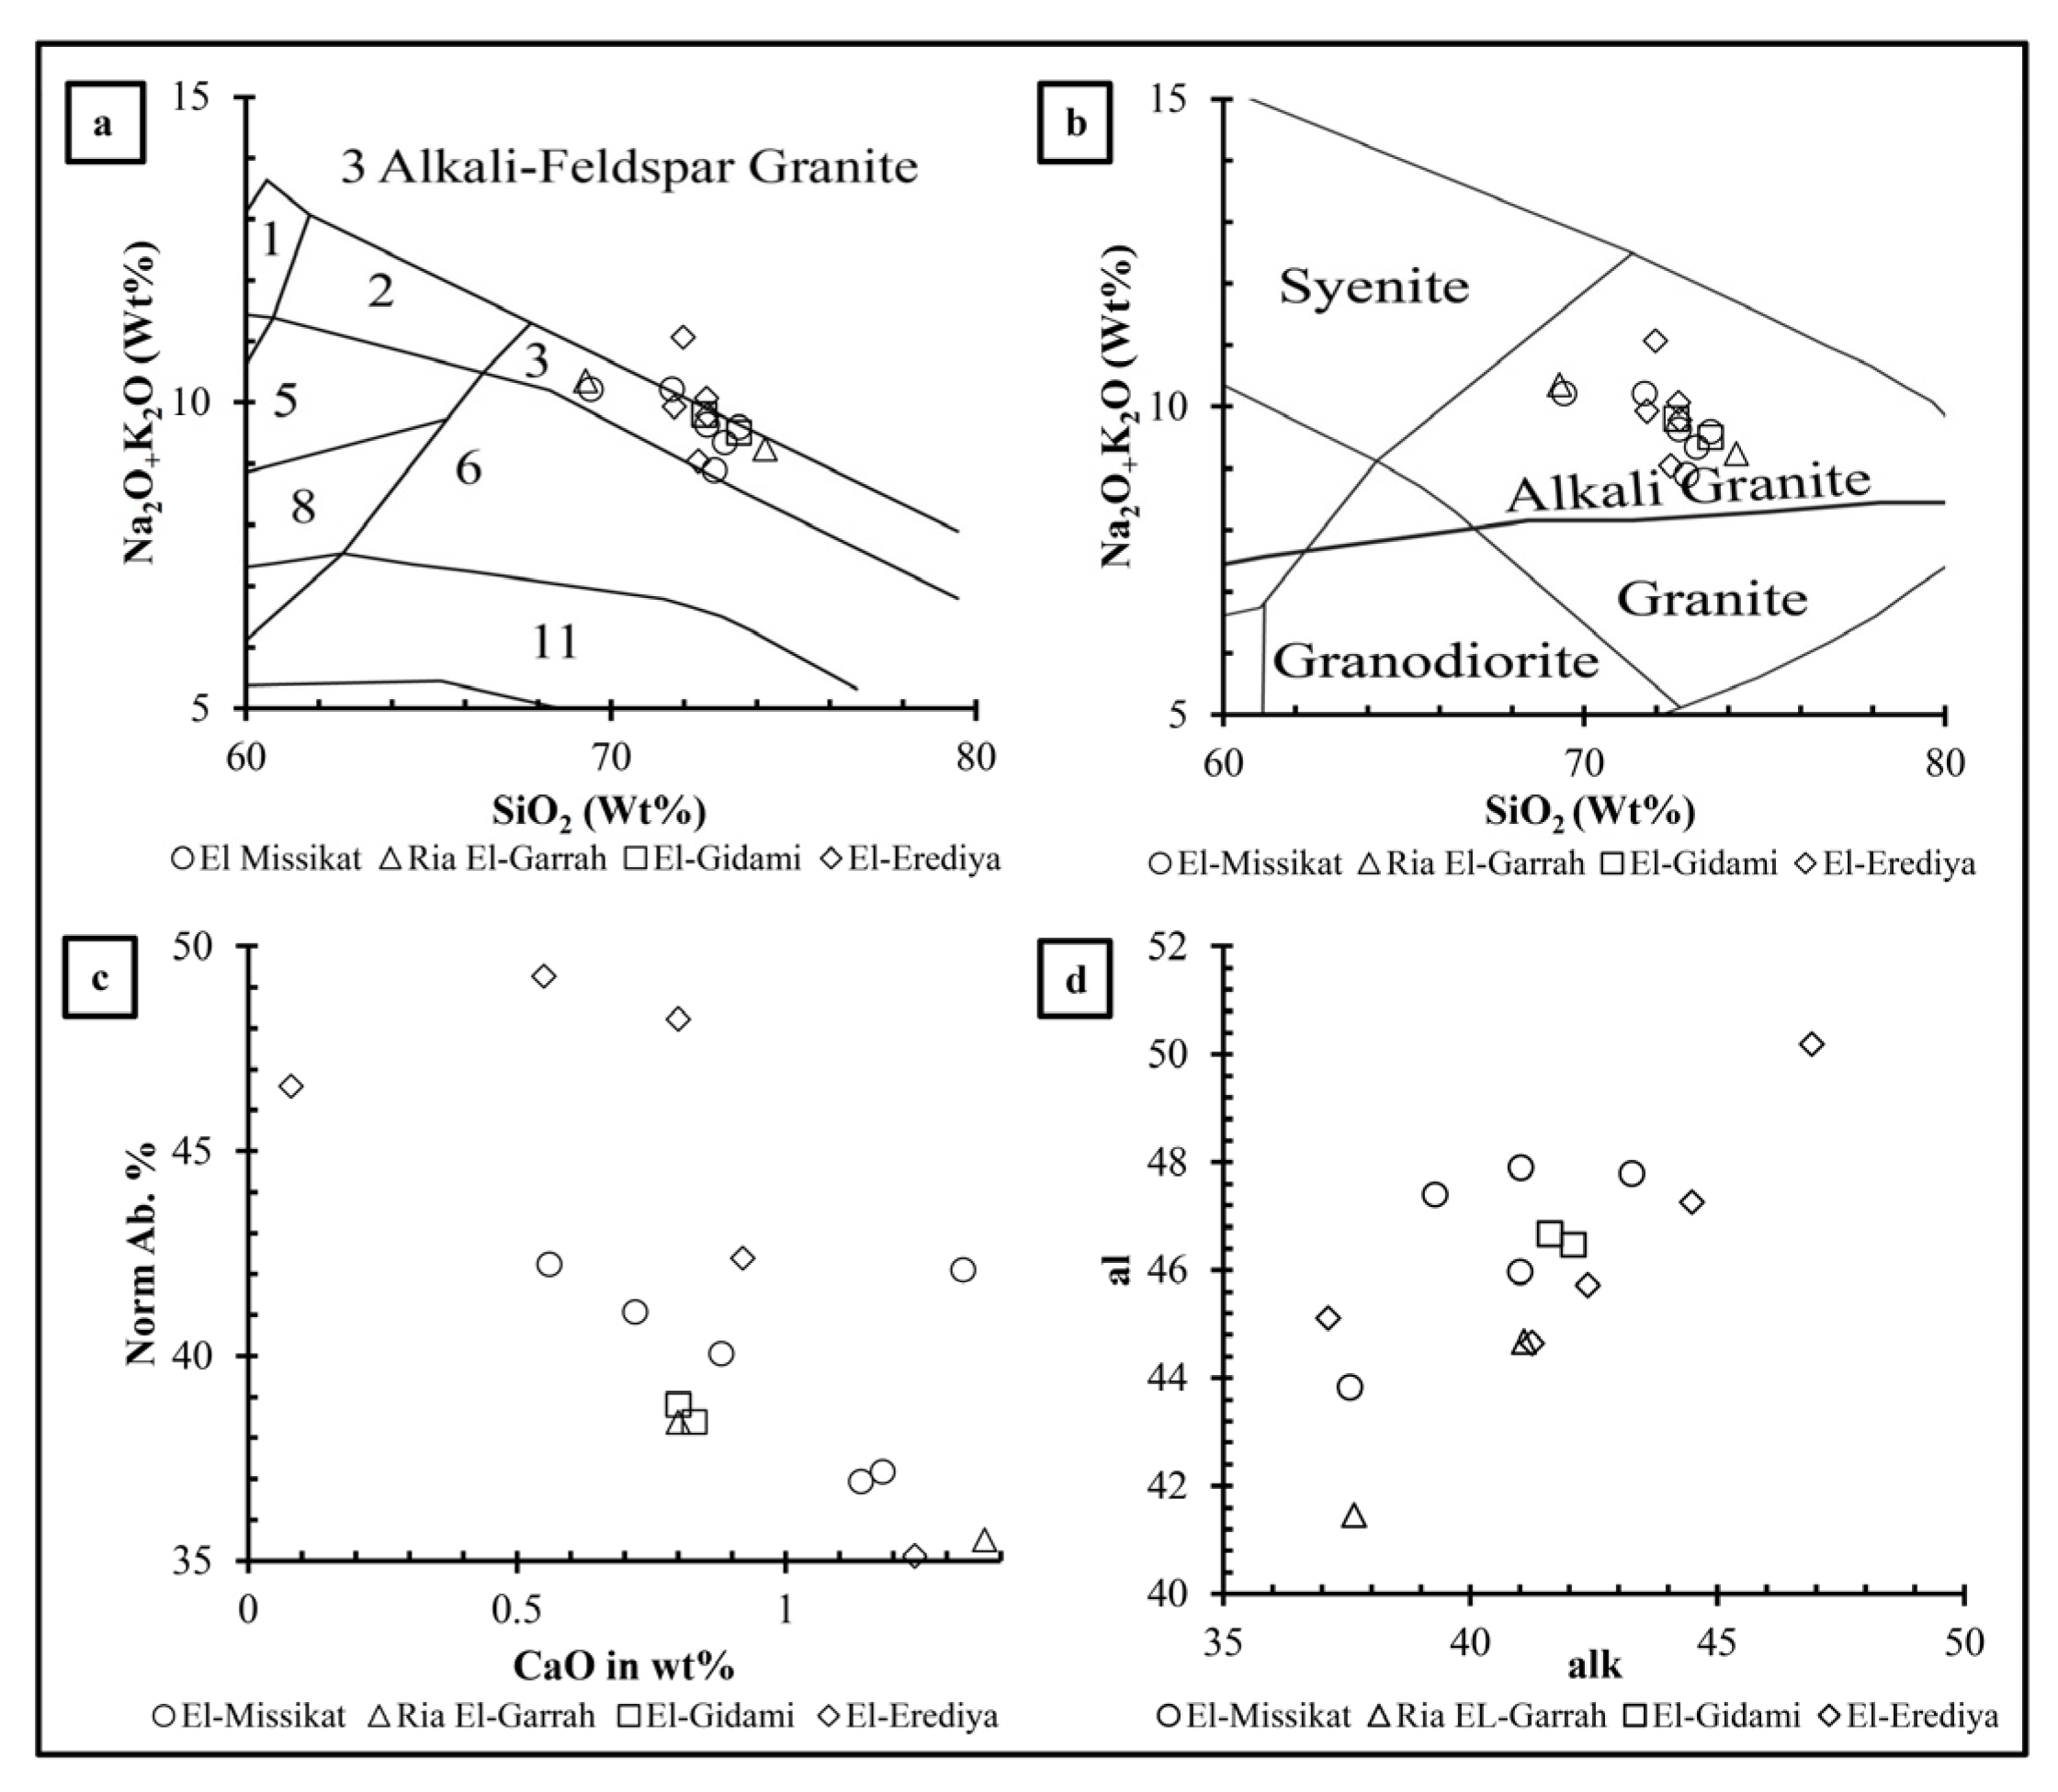
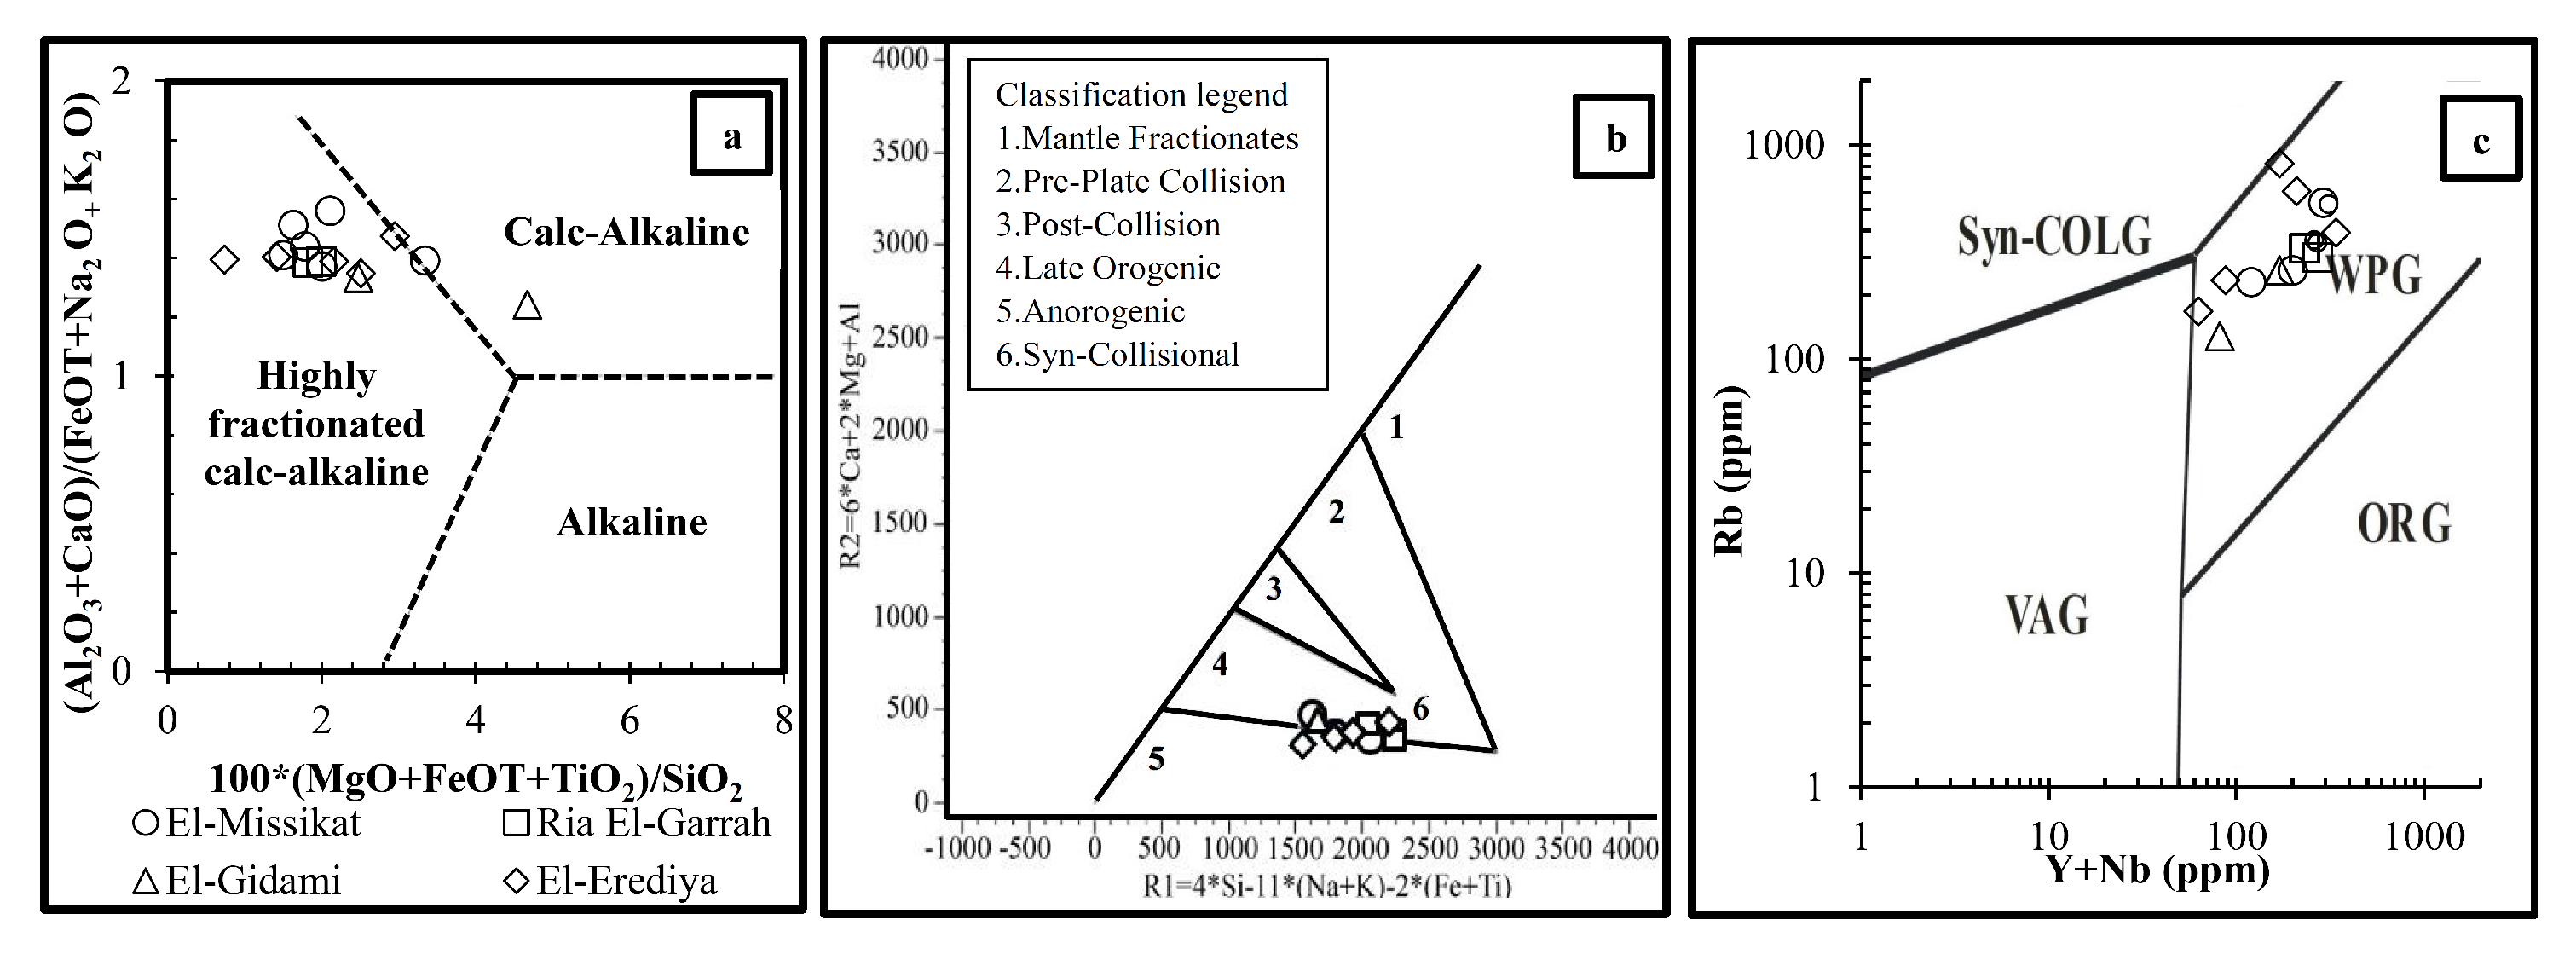
3.2.1. Petrochemical Features


| Central Eastern Desert Samples | The Studied Samples | ||||
|---|---|---|---|---|---|
| Serial No. | Area, No. of Samples | K/Na | |||
| Monzo-Granite | Monzo-Granite | ||||
| 27 | Atalla (3) | 0.616 | Sample No. | Area | K/Na |
| 14 | Abu Dabbab (2) | 0.764 | Er5 | El-Erediya | 0.93 |
| 28 | Kib Absi (15) | 0.769 | Er6 | 0.95 | |
| 10 | Igla (2) | 0.827 | |||
| 22 | Homr akarem (3) | 0.849 | |||
| 4 | El-Yatima (3) | 0.953 | |||
| 5 | El-Daghbag (5) | 0.967 | |||
| 20 | Gabal Ineigi (4) | 0.969 | |||
| 9 | Gabal El-Ineigi (8) | 0.995 | |||
| Syeno-granite | Syeno-granite | ||||
| 15 | El Dob-Abu Kharif (5) | 1.049 | Sample No. | Area | K/Na |
| 3 | Homrit Waggat (4) | 1.061 | M2 | El-Missikat | 1.176 |
| 8 | Um Gheig (2) | 1.072 | M7 | 1.31 | |
| 26 | Fawakhir (6) | 1.090 | M12 | 1.238 | |
| 13 | Umm Had (2) | 1.101 | M16 | 1.389 | |
| 6 | Um Gheig (5) | 1.152 | M18 | 1.319 | |
| 7 | Um Gheig (4) | 1.204 | M20 | 1.525 | |
| 12 | Umm Had (14) | 1.254 | RG1 | Ria El-Garrah | 1.314 |
| 24 | Um Naggat (15) | 1.267 | G1 | El-Gidami | 1.464 |
| 25 | El Deleihimi (5) | 1.277 | G3 | 1.362 | |
| 18 | Gabal El Sibai- Abu Nagga’a (4) | 1.291 | Er1 | El-Erediya | 1.245 |
| 21 | Homrit waggat (14) | 1.323 | Er3 | 1.488 | |
| 11 | Umm Had (2) | 1.344 | Er4 | 1.202 | |
| 1 | Um Tagher (5) | 1.418 | |||
| 16 | Gabal El Sibai- Um Lasseifa (6) | 1.418 | |||
| 2 | Igla Ahmar (8) | 1.442 | |||
| 17 | Gabal El Sibai- El-Mirifiya (4) | 1.458 | |||
| 29 | Kadabbora (10) | 1.530 | |||
| Alkali feldspar granite | Alkali feldspar granite | ||||
| 19 | Gabal El Sibai- Um Shaddad (4) | 1.638 | S. No. | Area | K/Na |
| 23 | Um Naggat (6) | 2.564 | RG4 | RiaEl-Garrah | 1.838 |
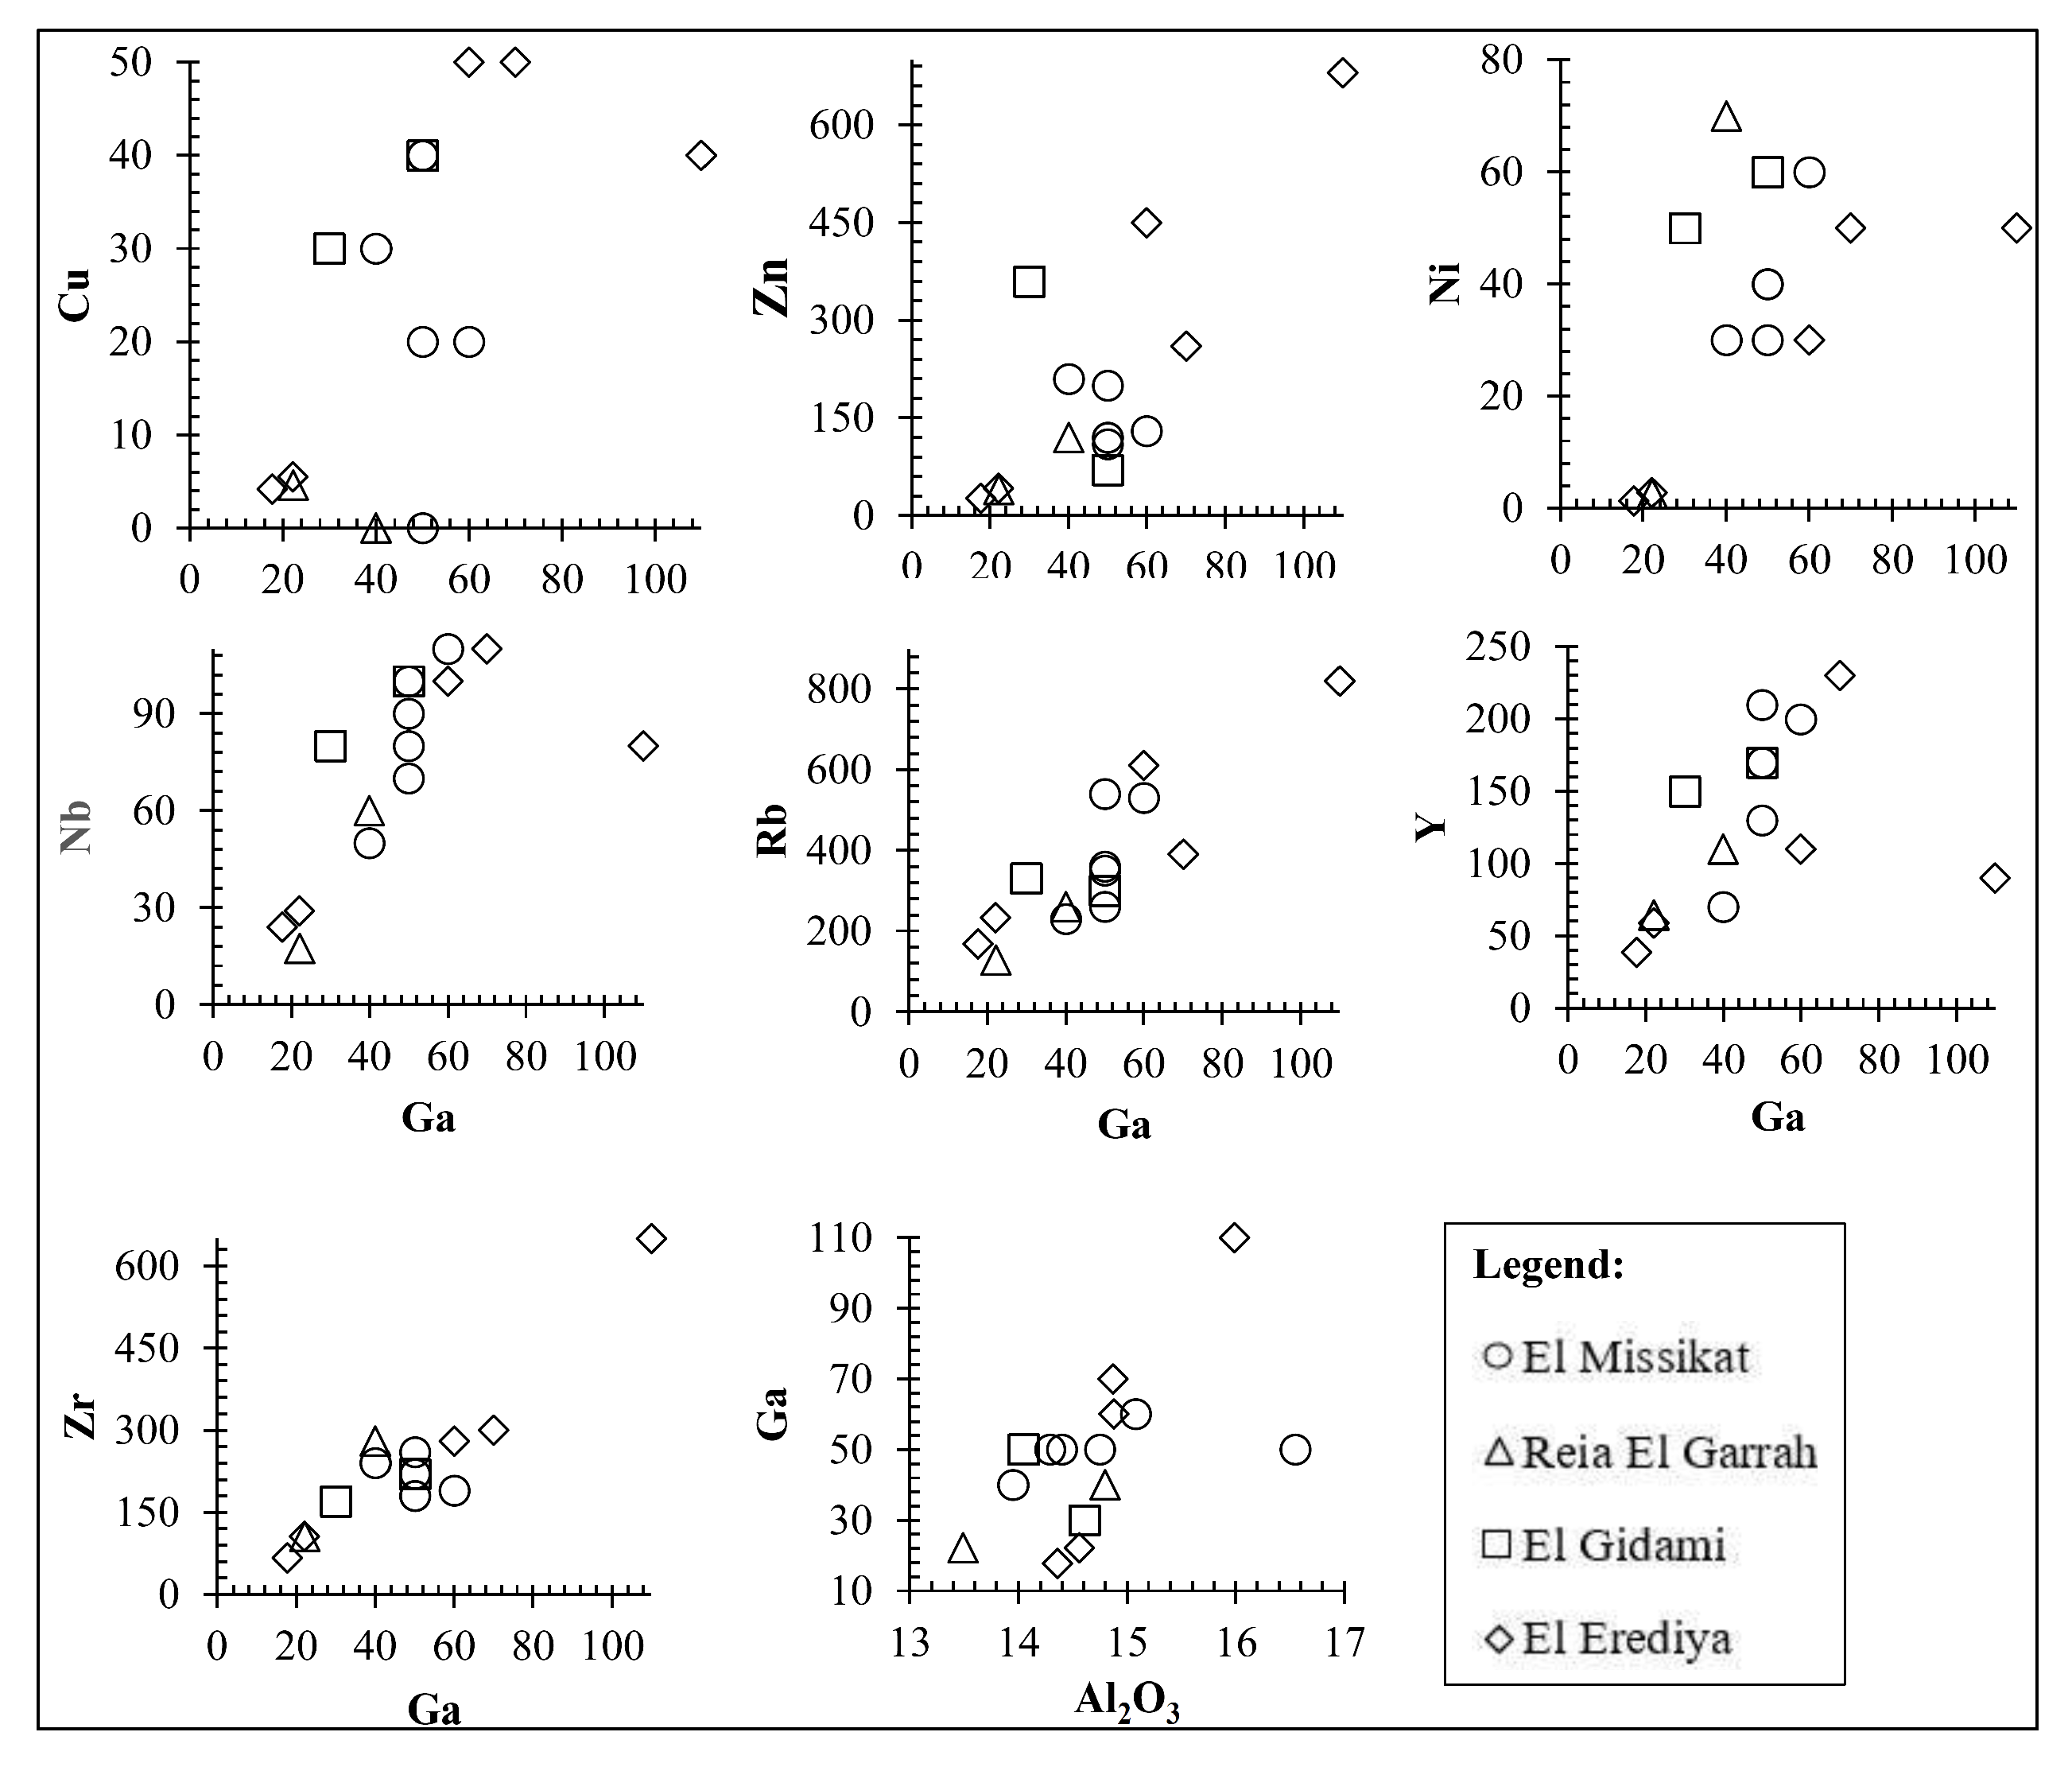
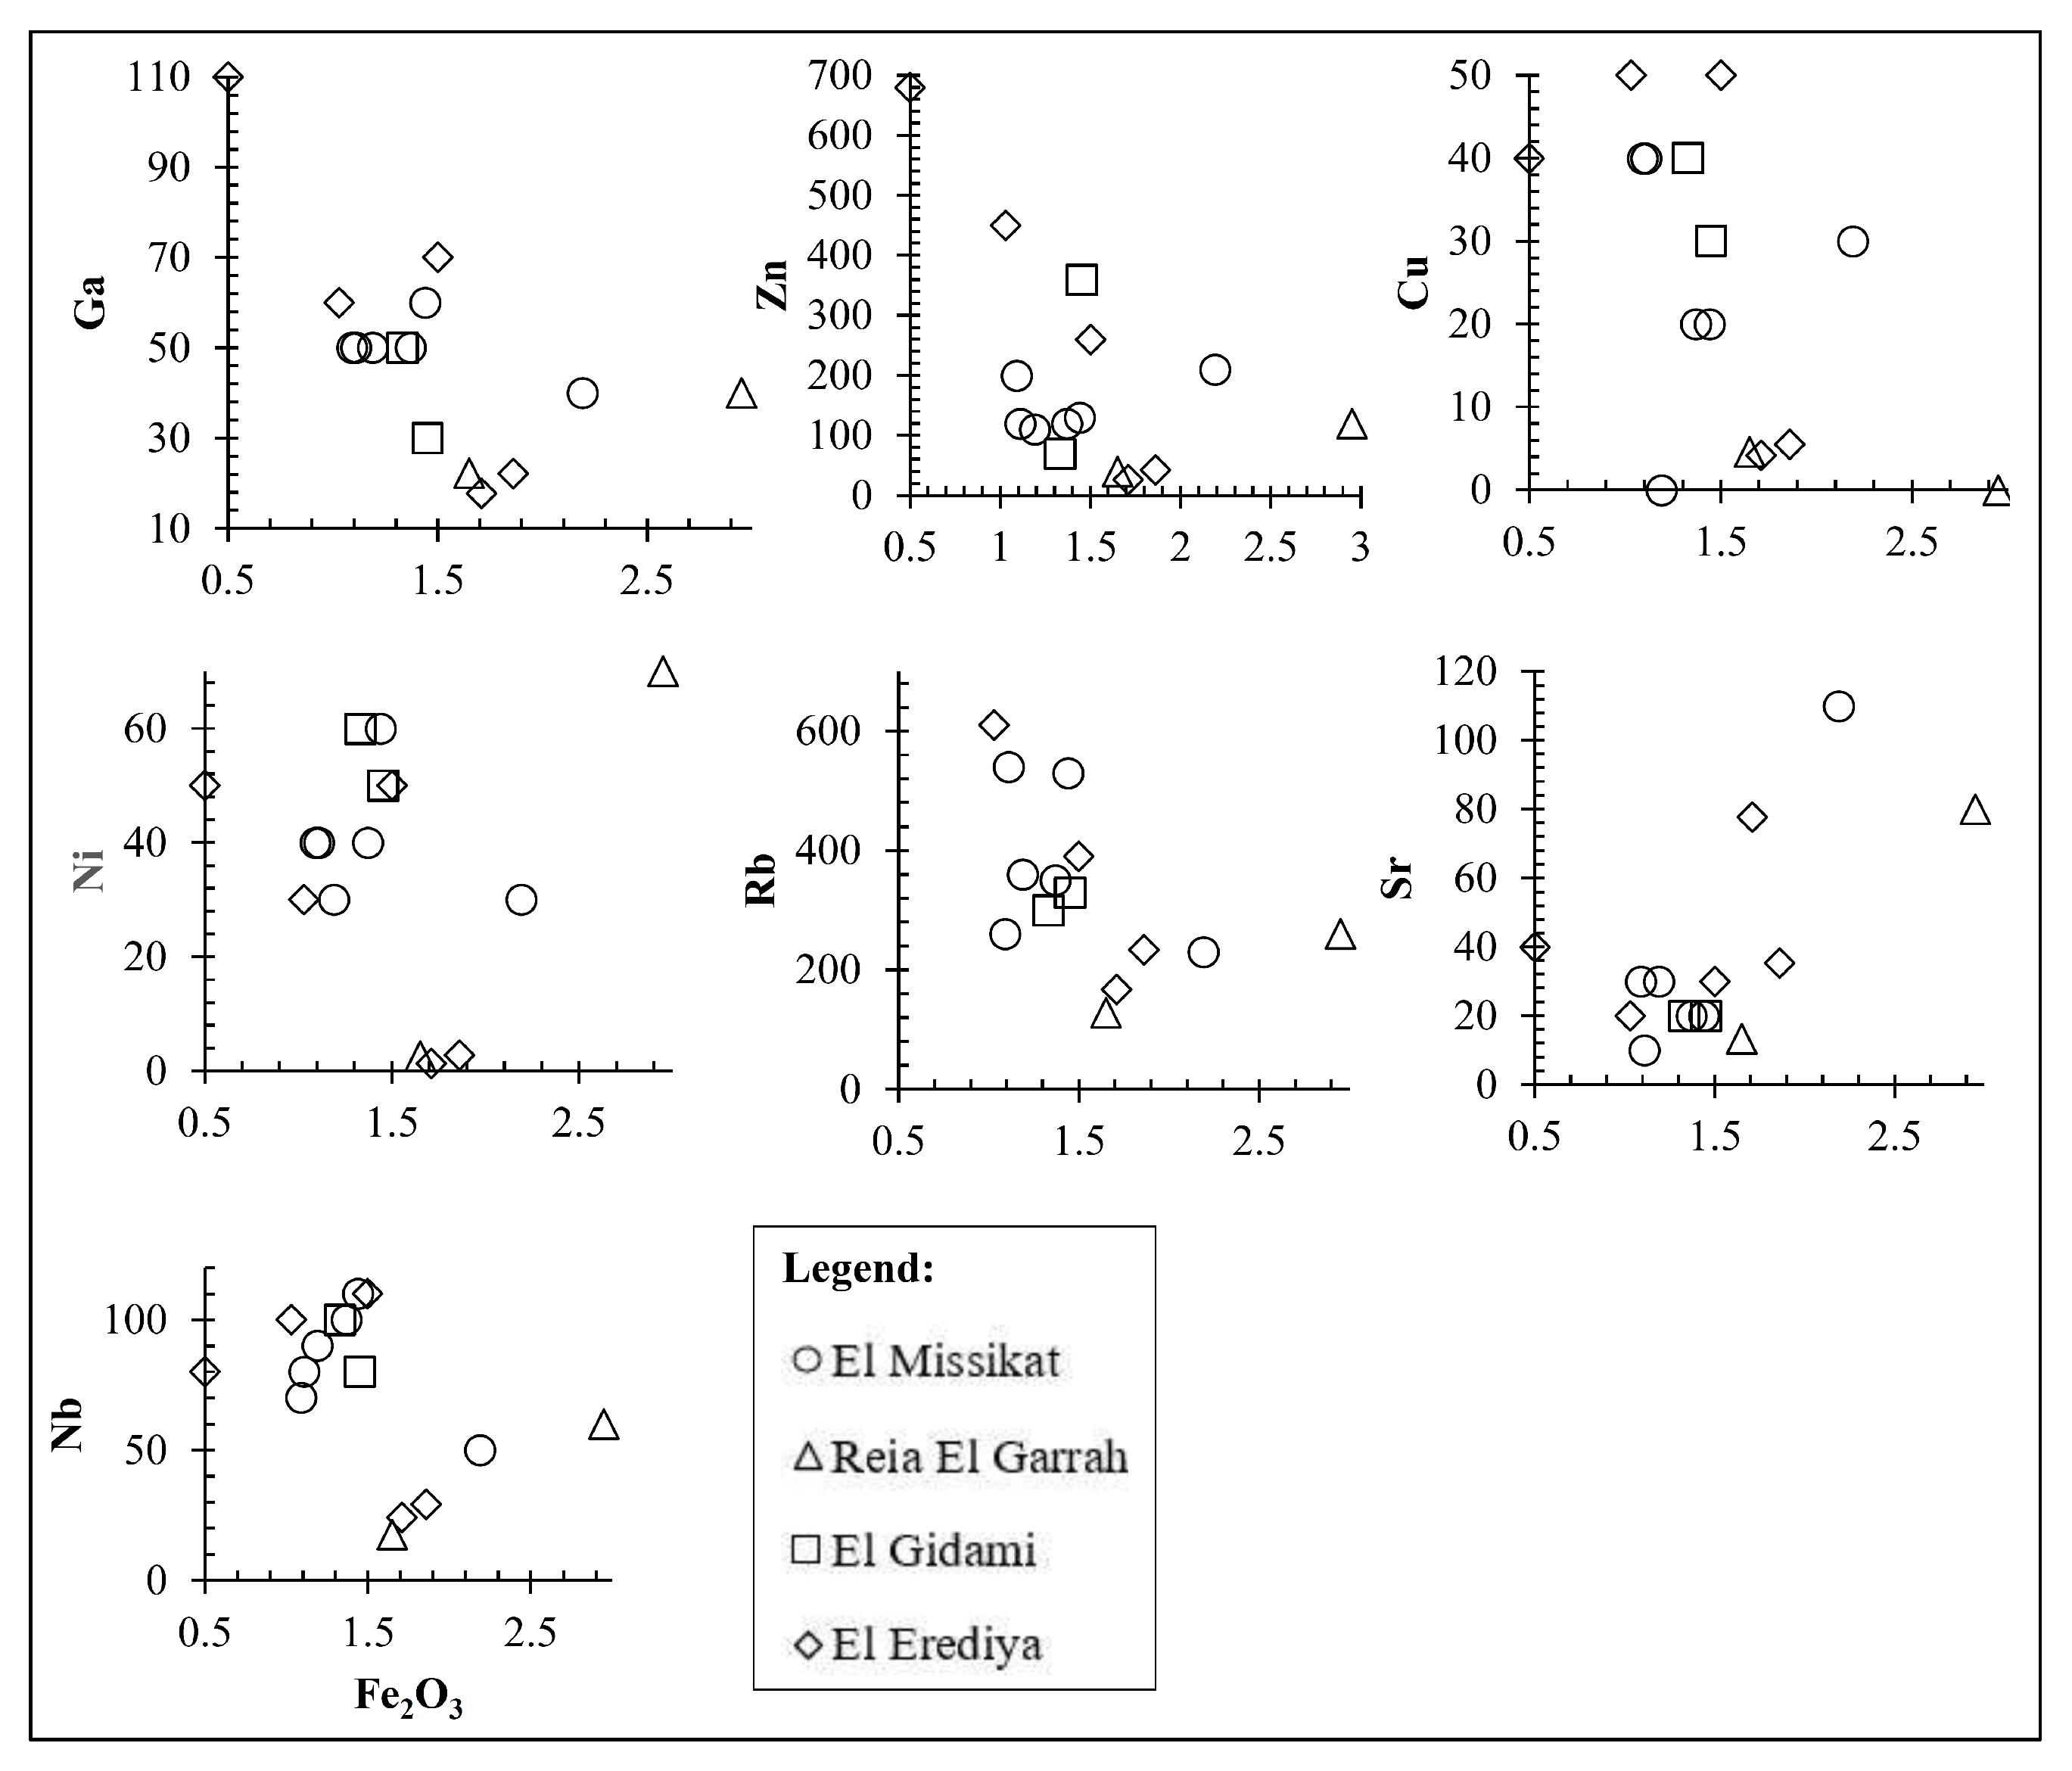
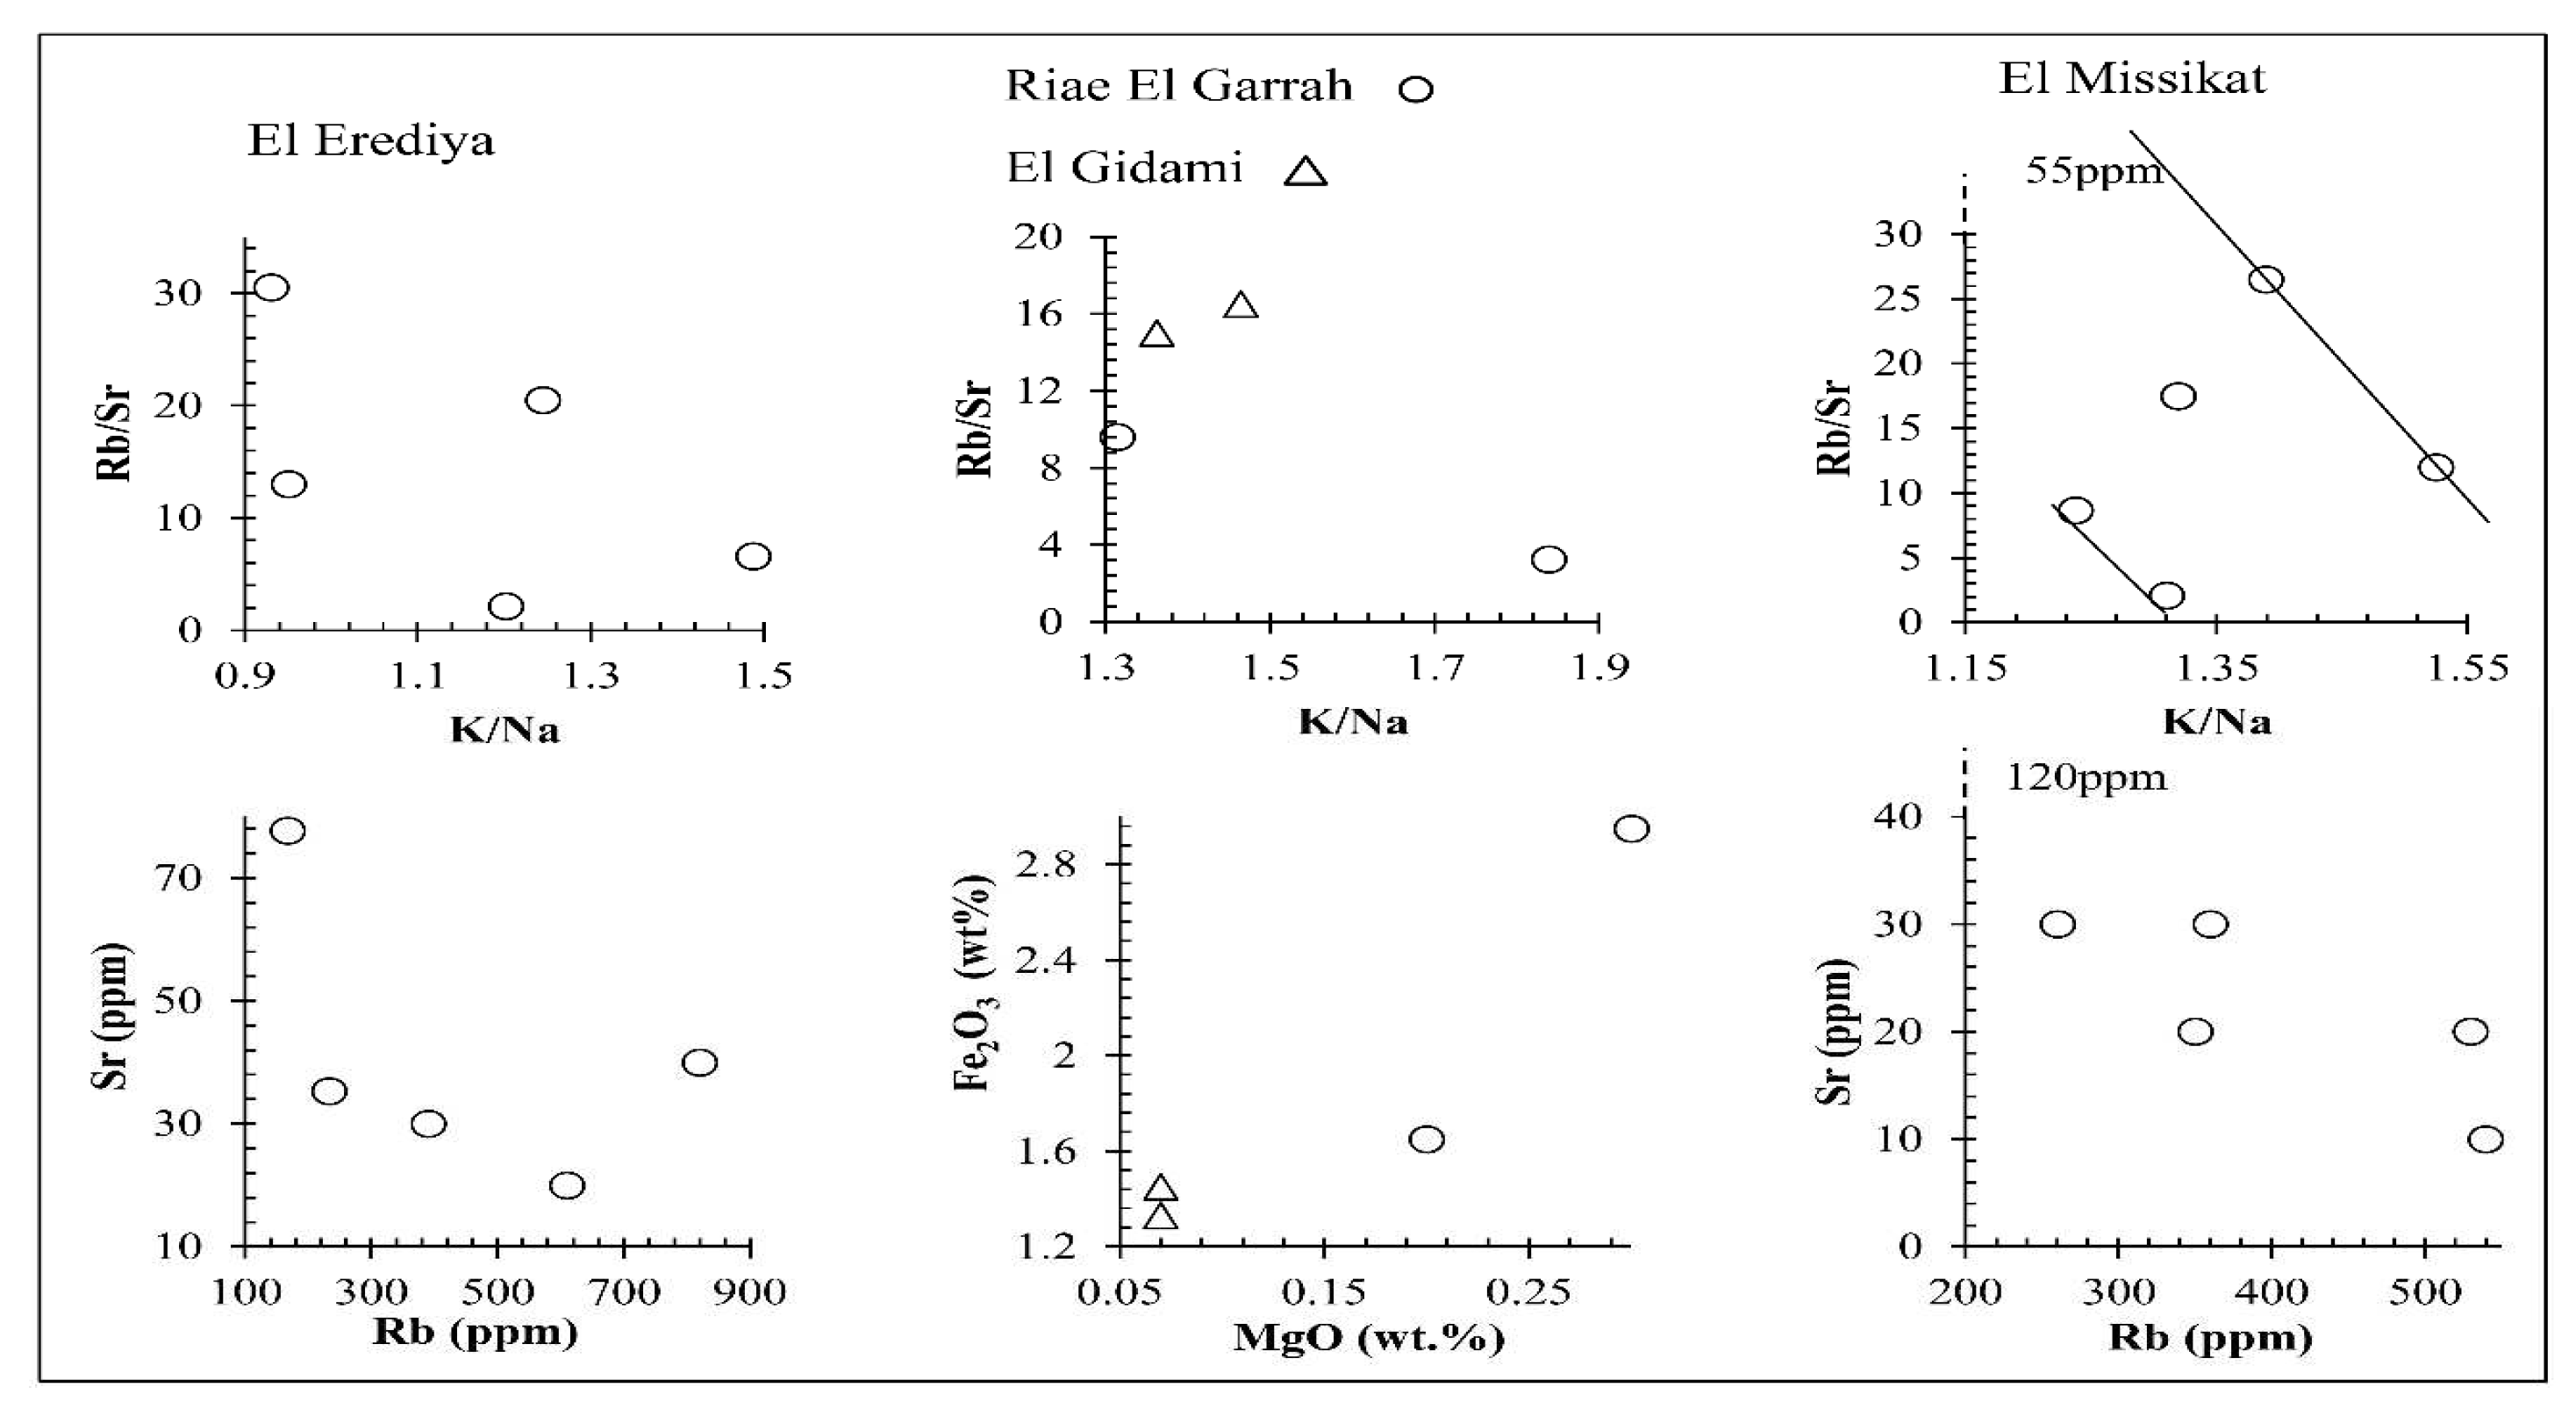
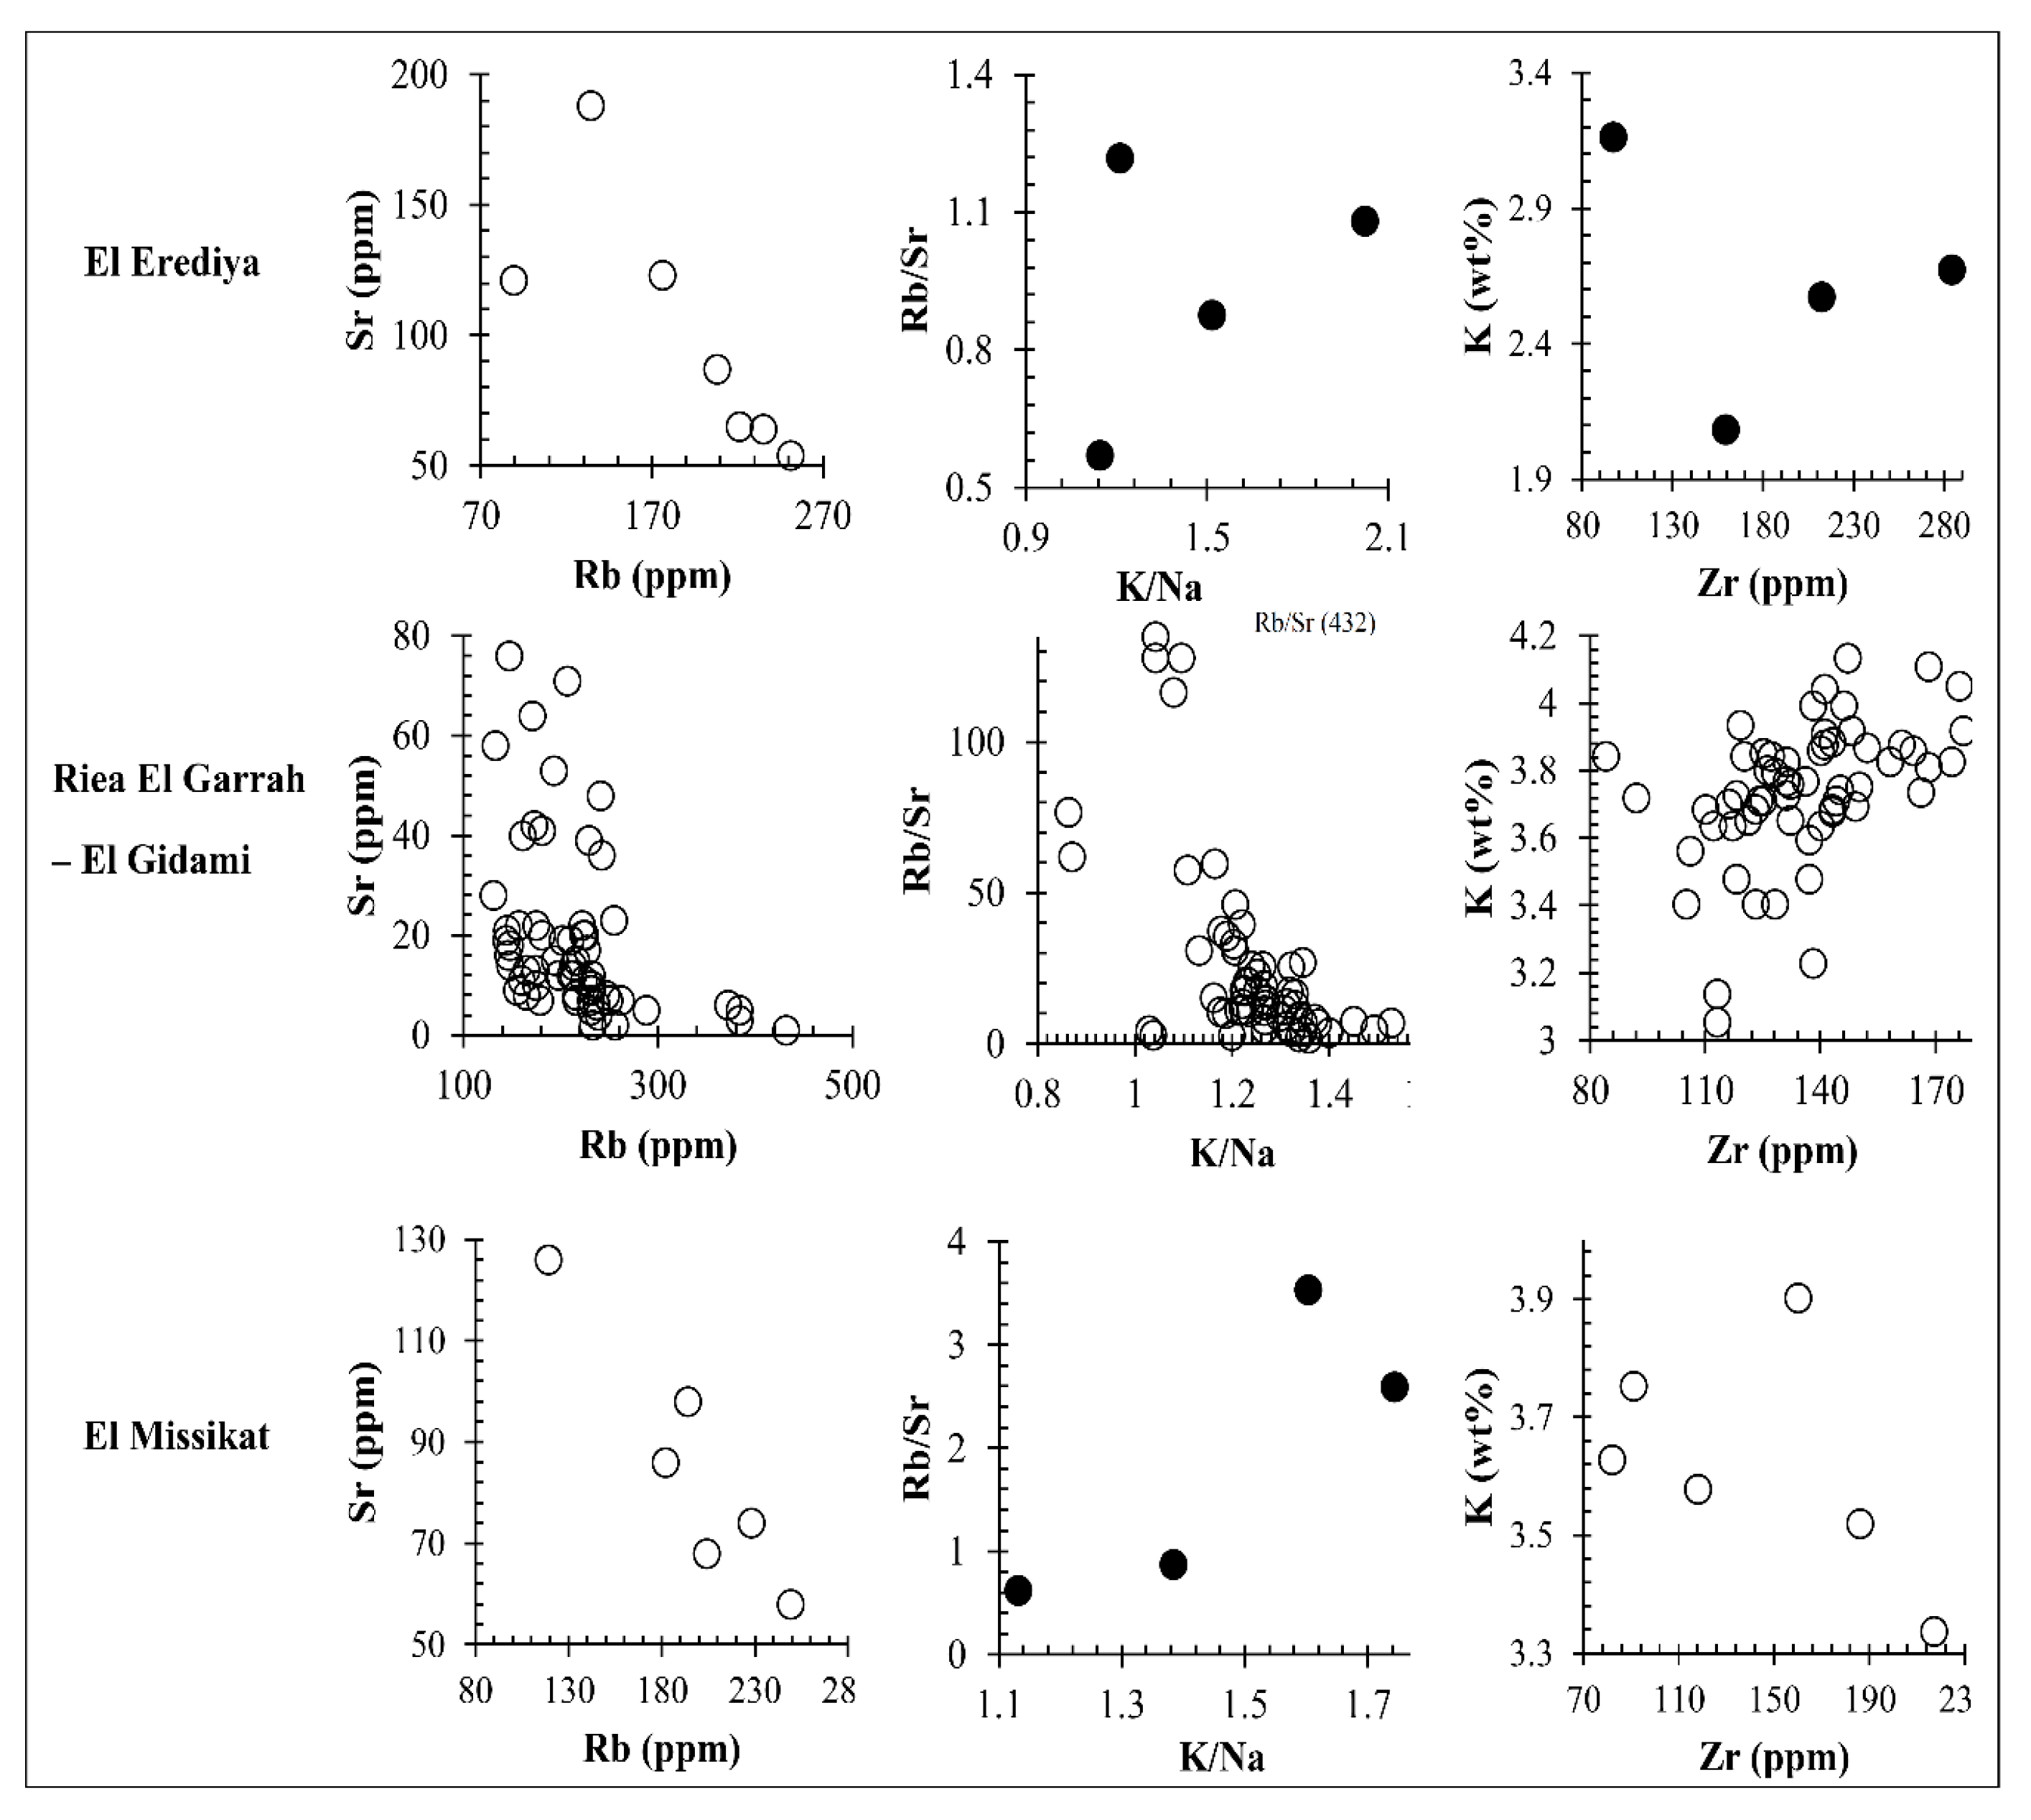
3.2.2. Geochemical Characteristics of Trace Elements Distribution
4. Discussion
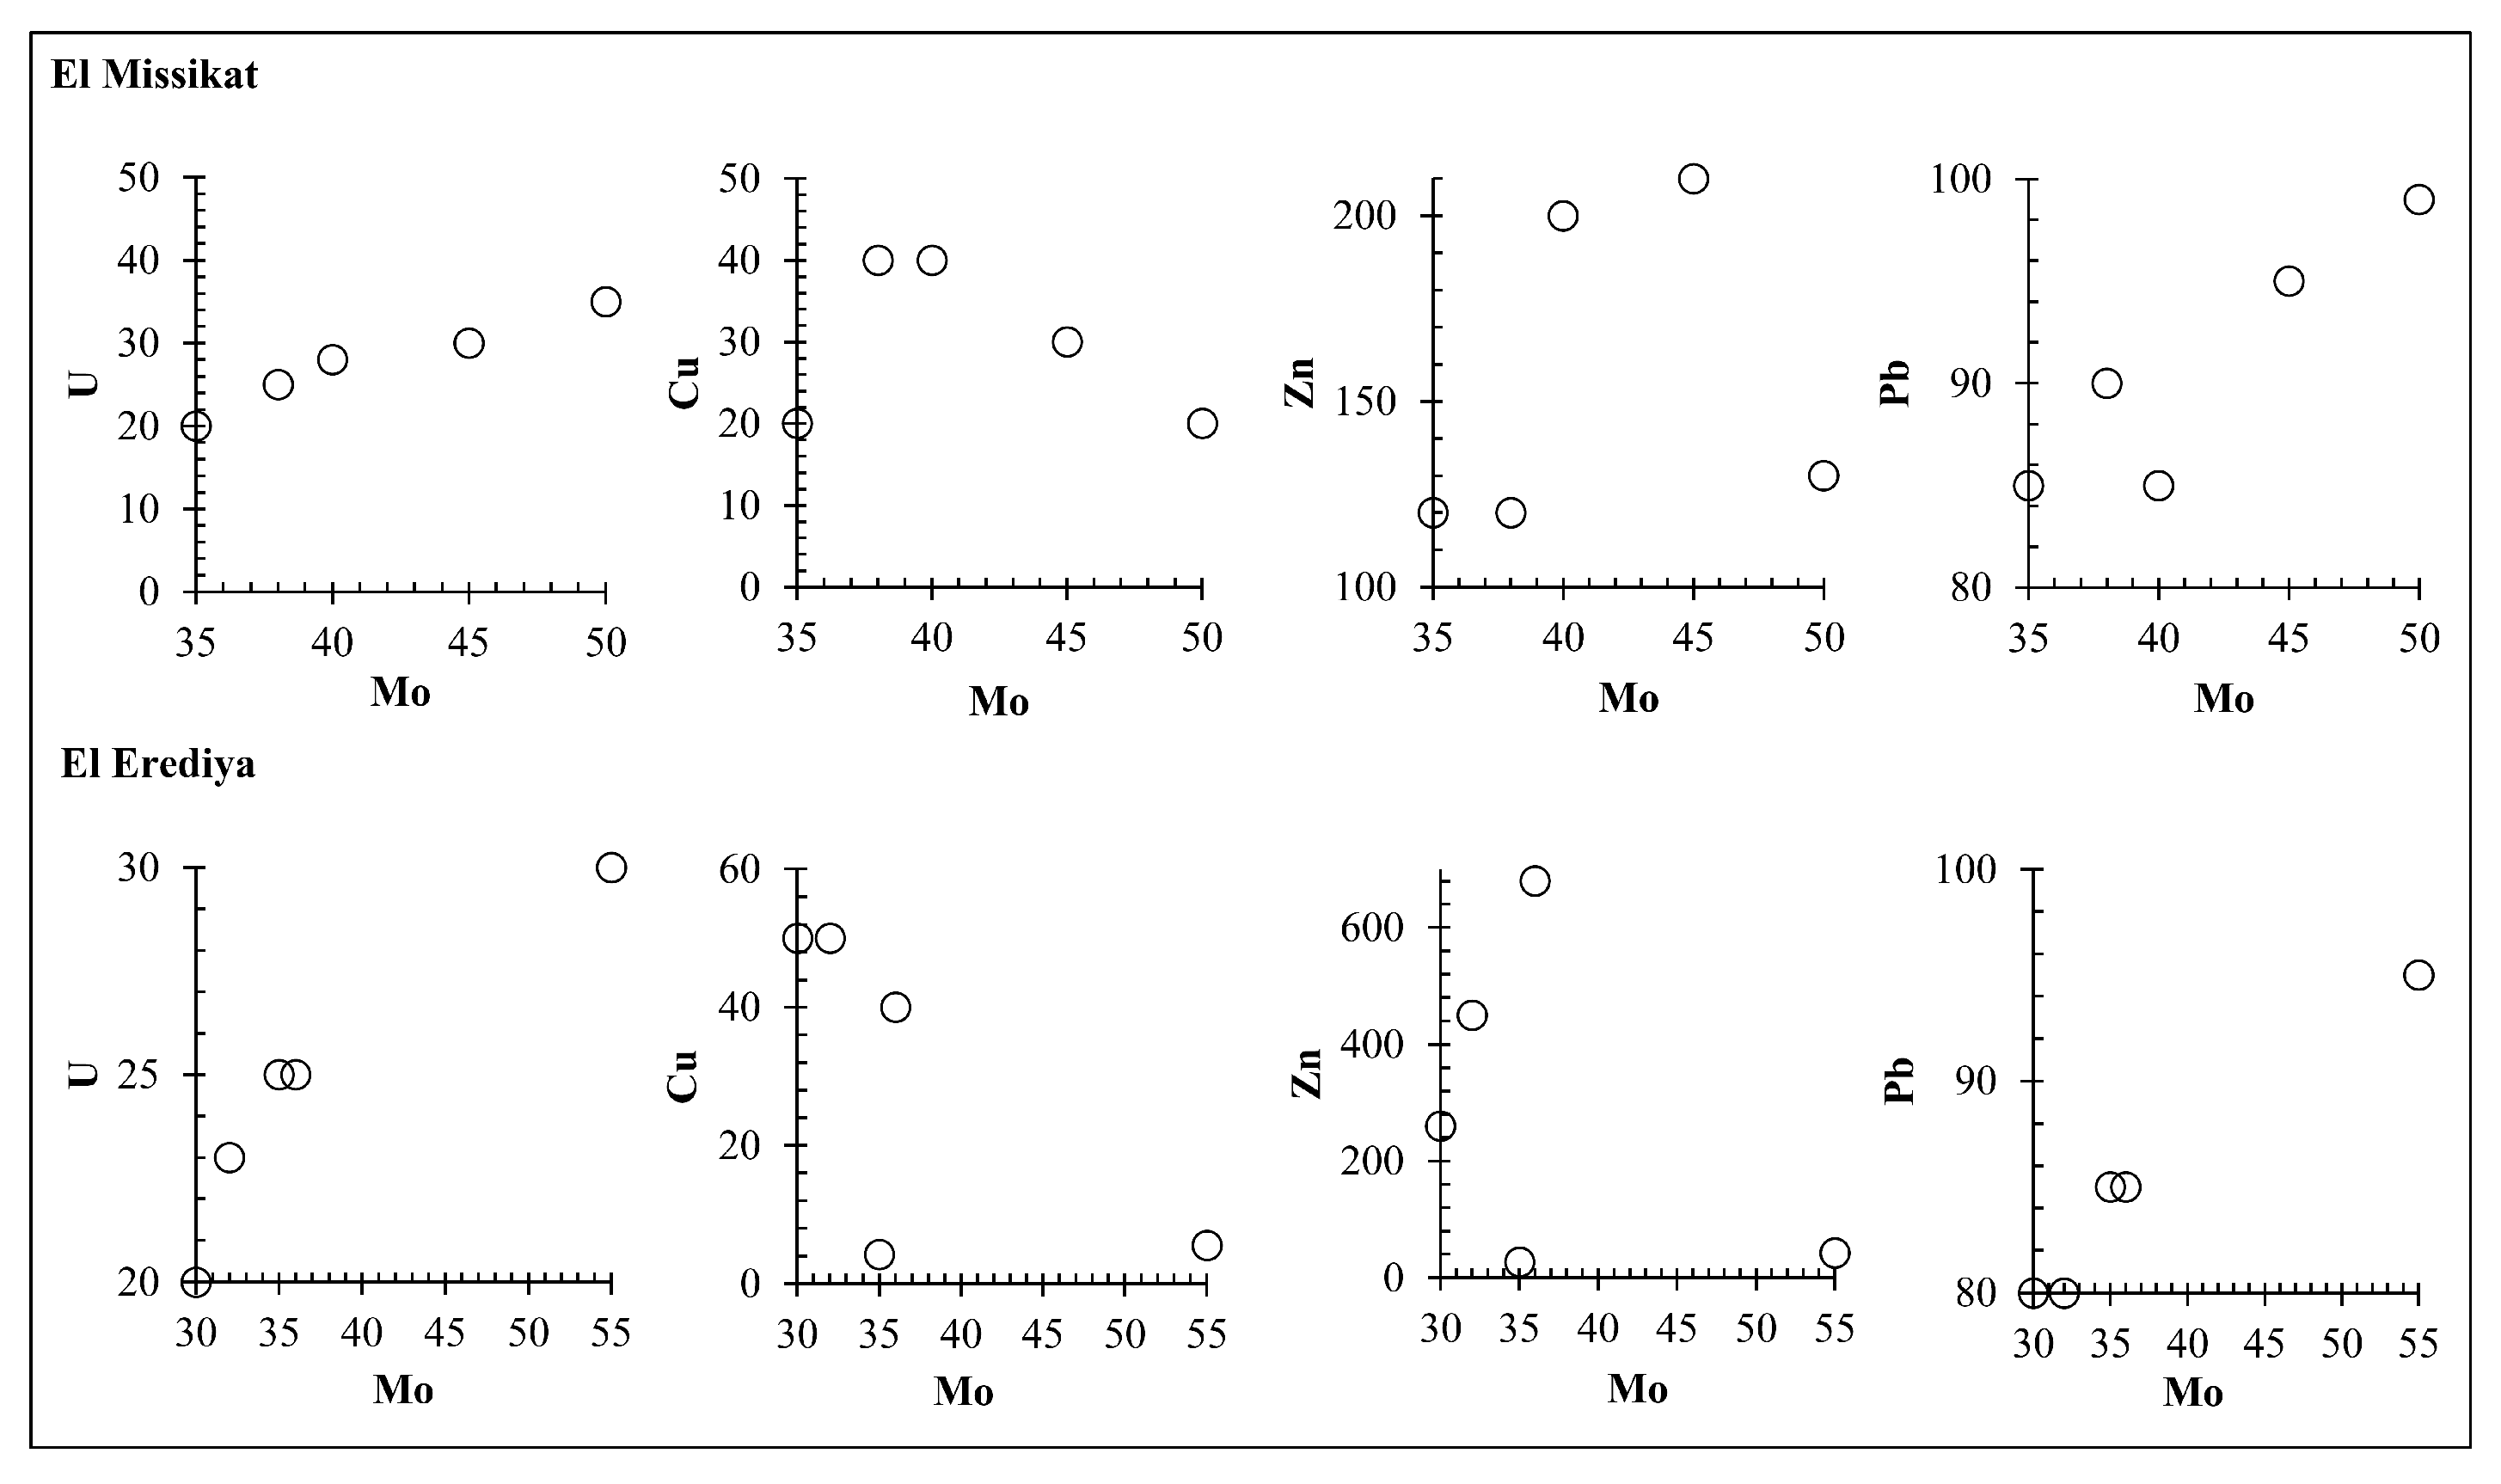
4.1. Geochemical Pathfinders
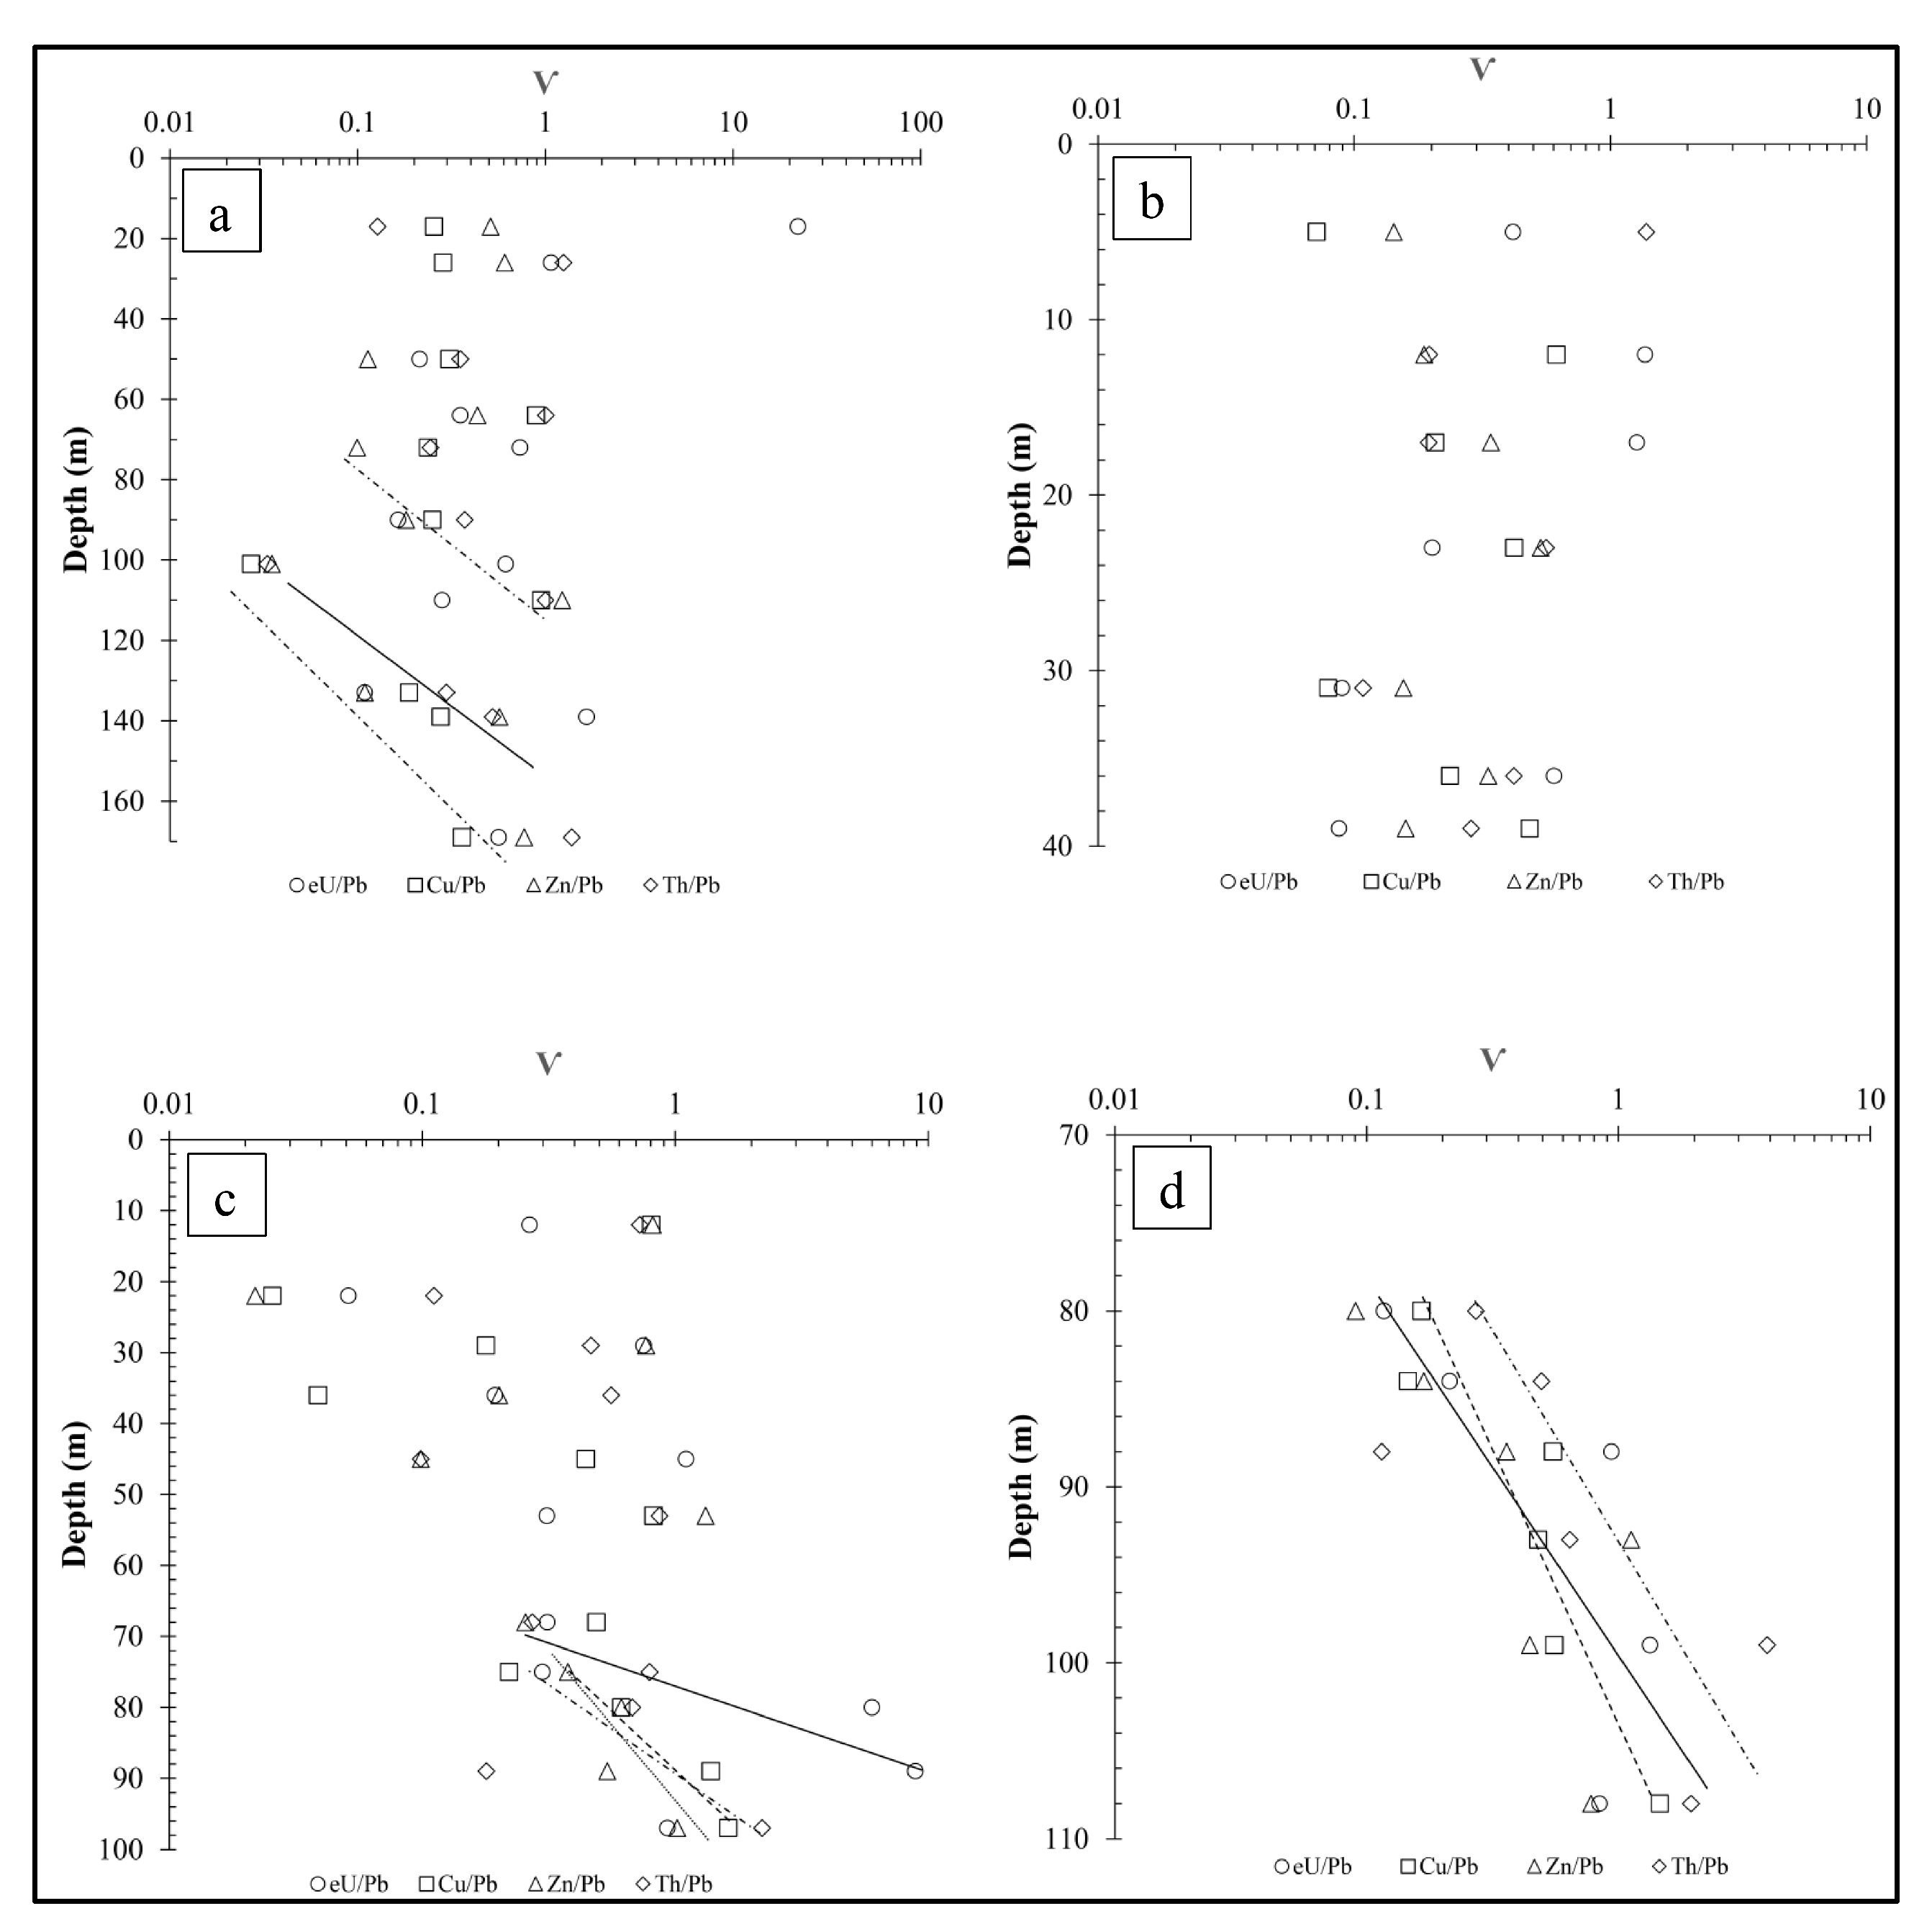
4.2. Uranium Deposits
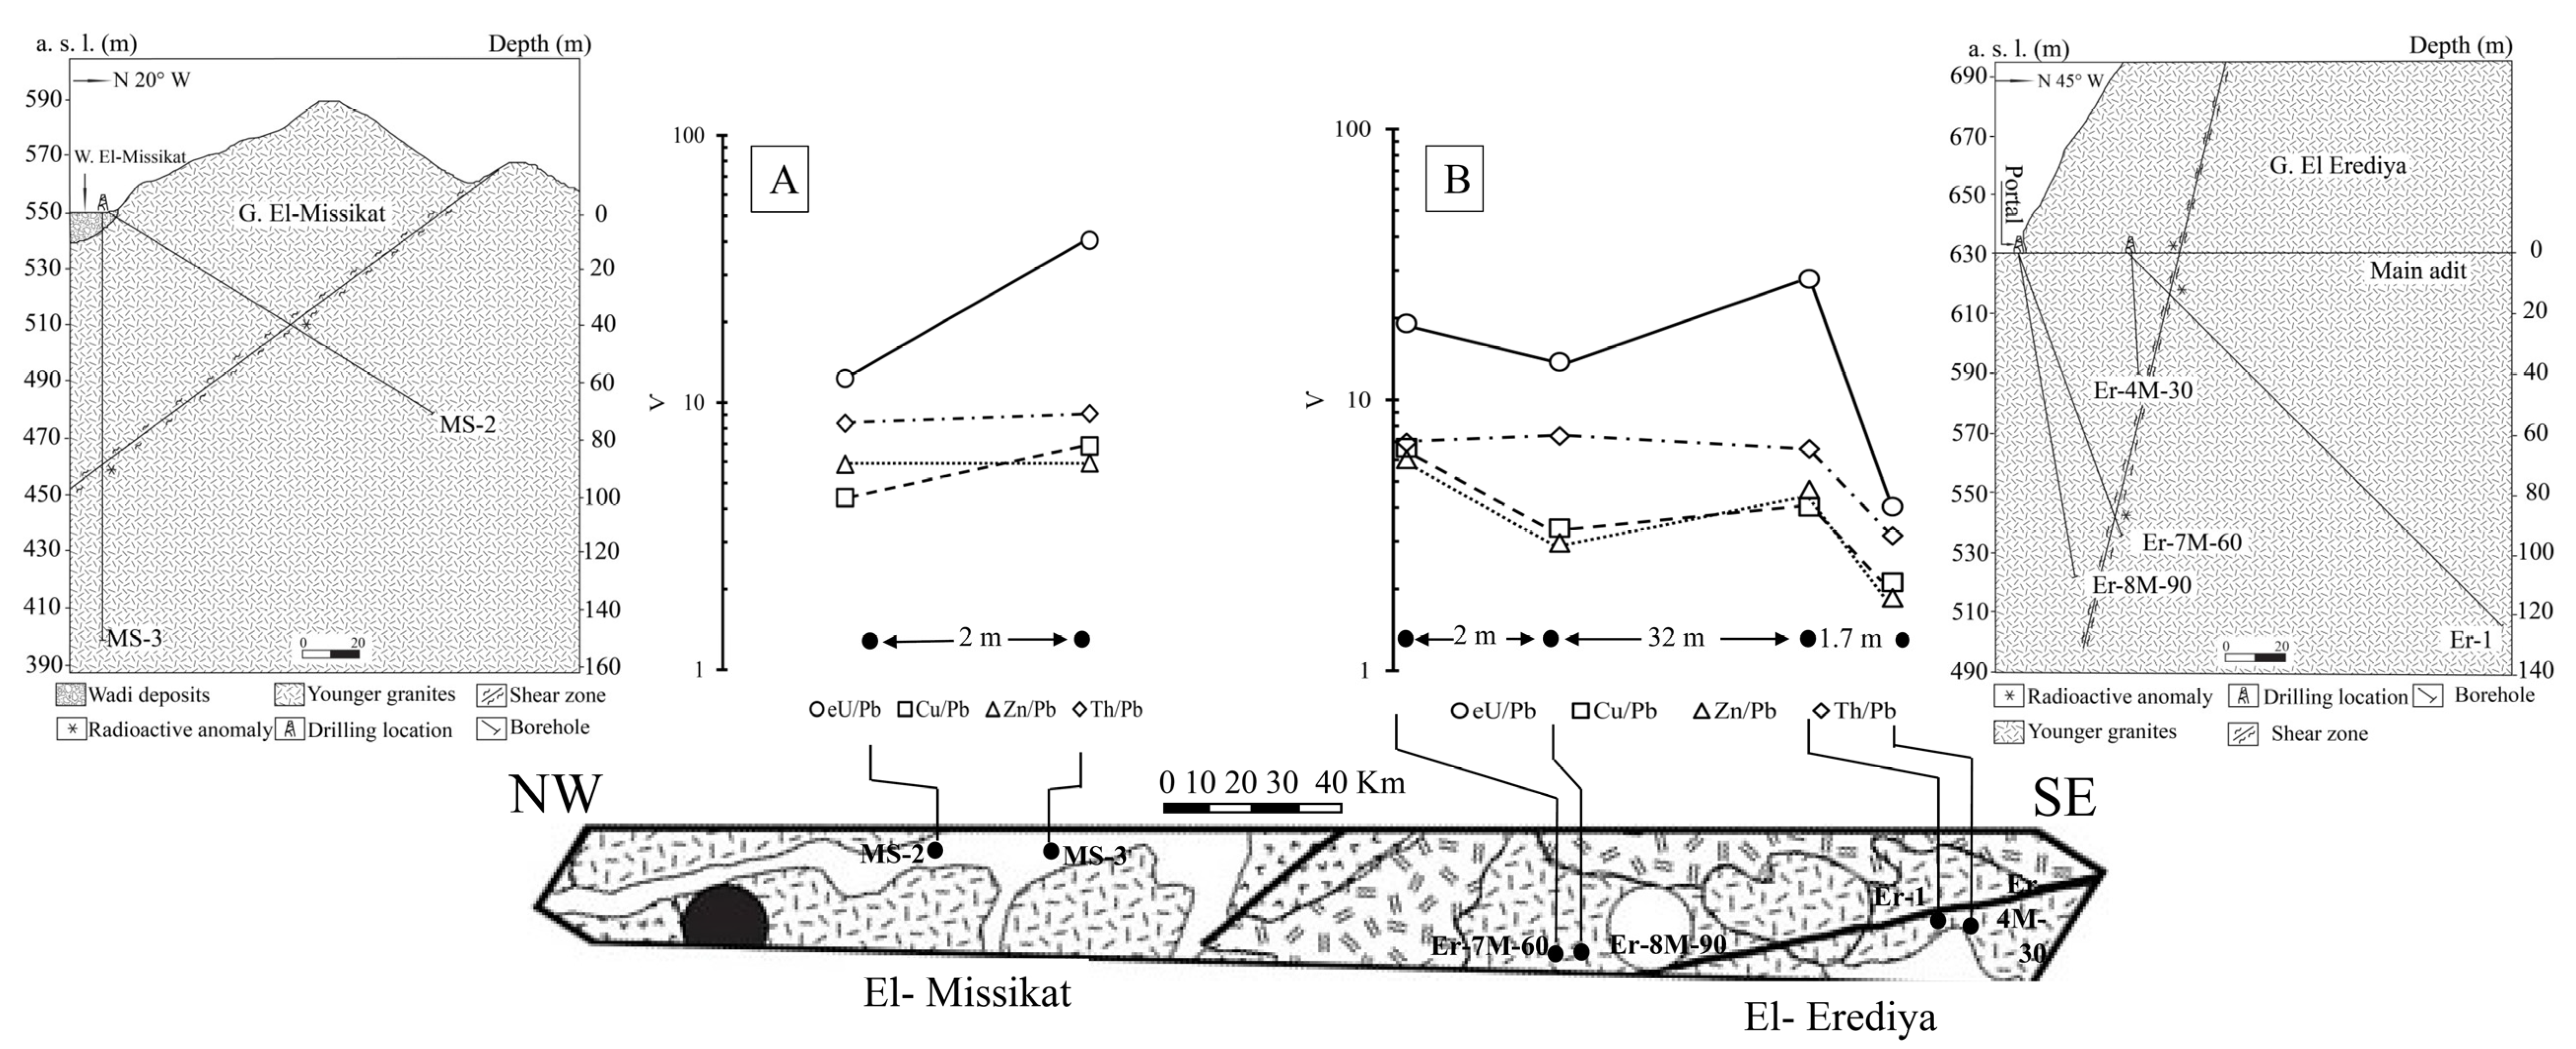
4.2.1. El-Missikat
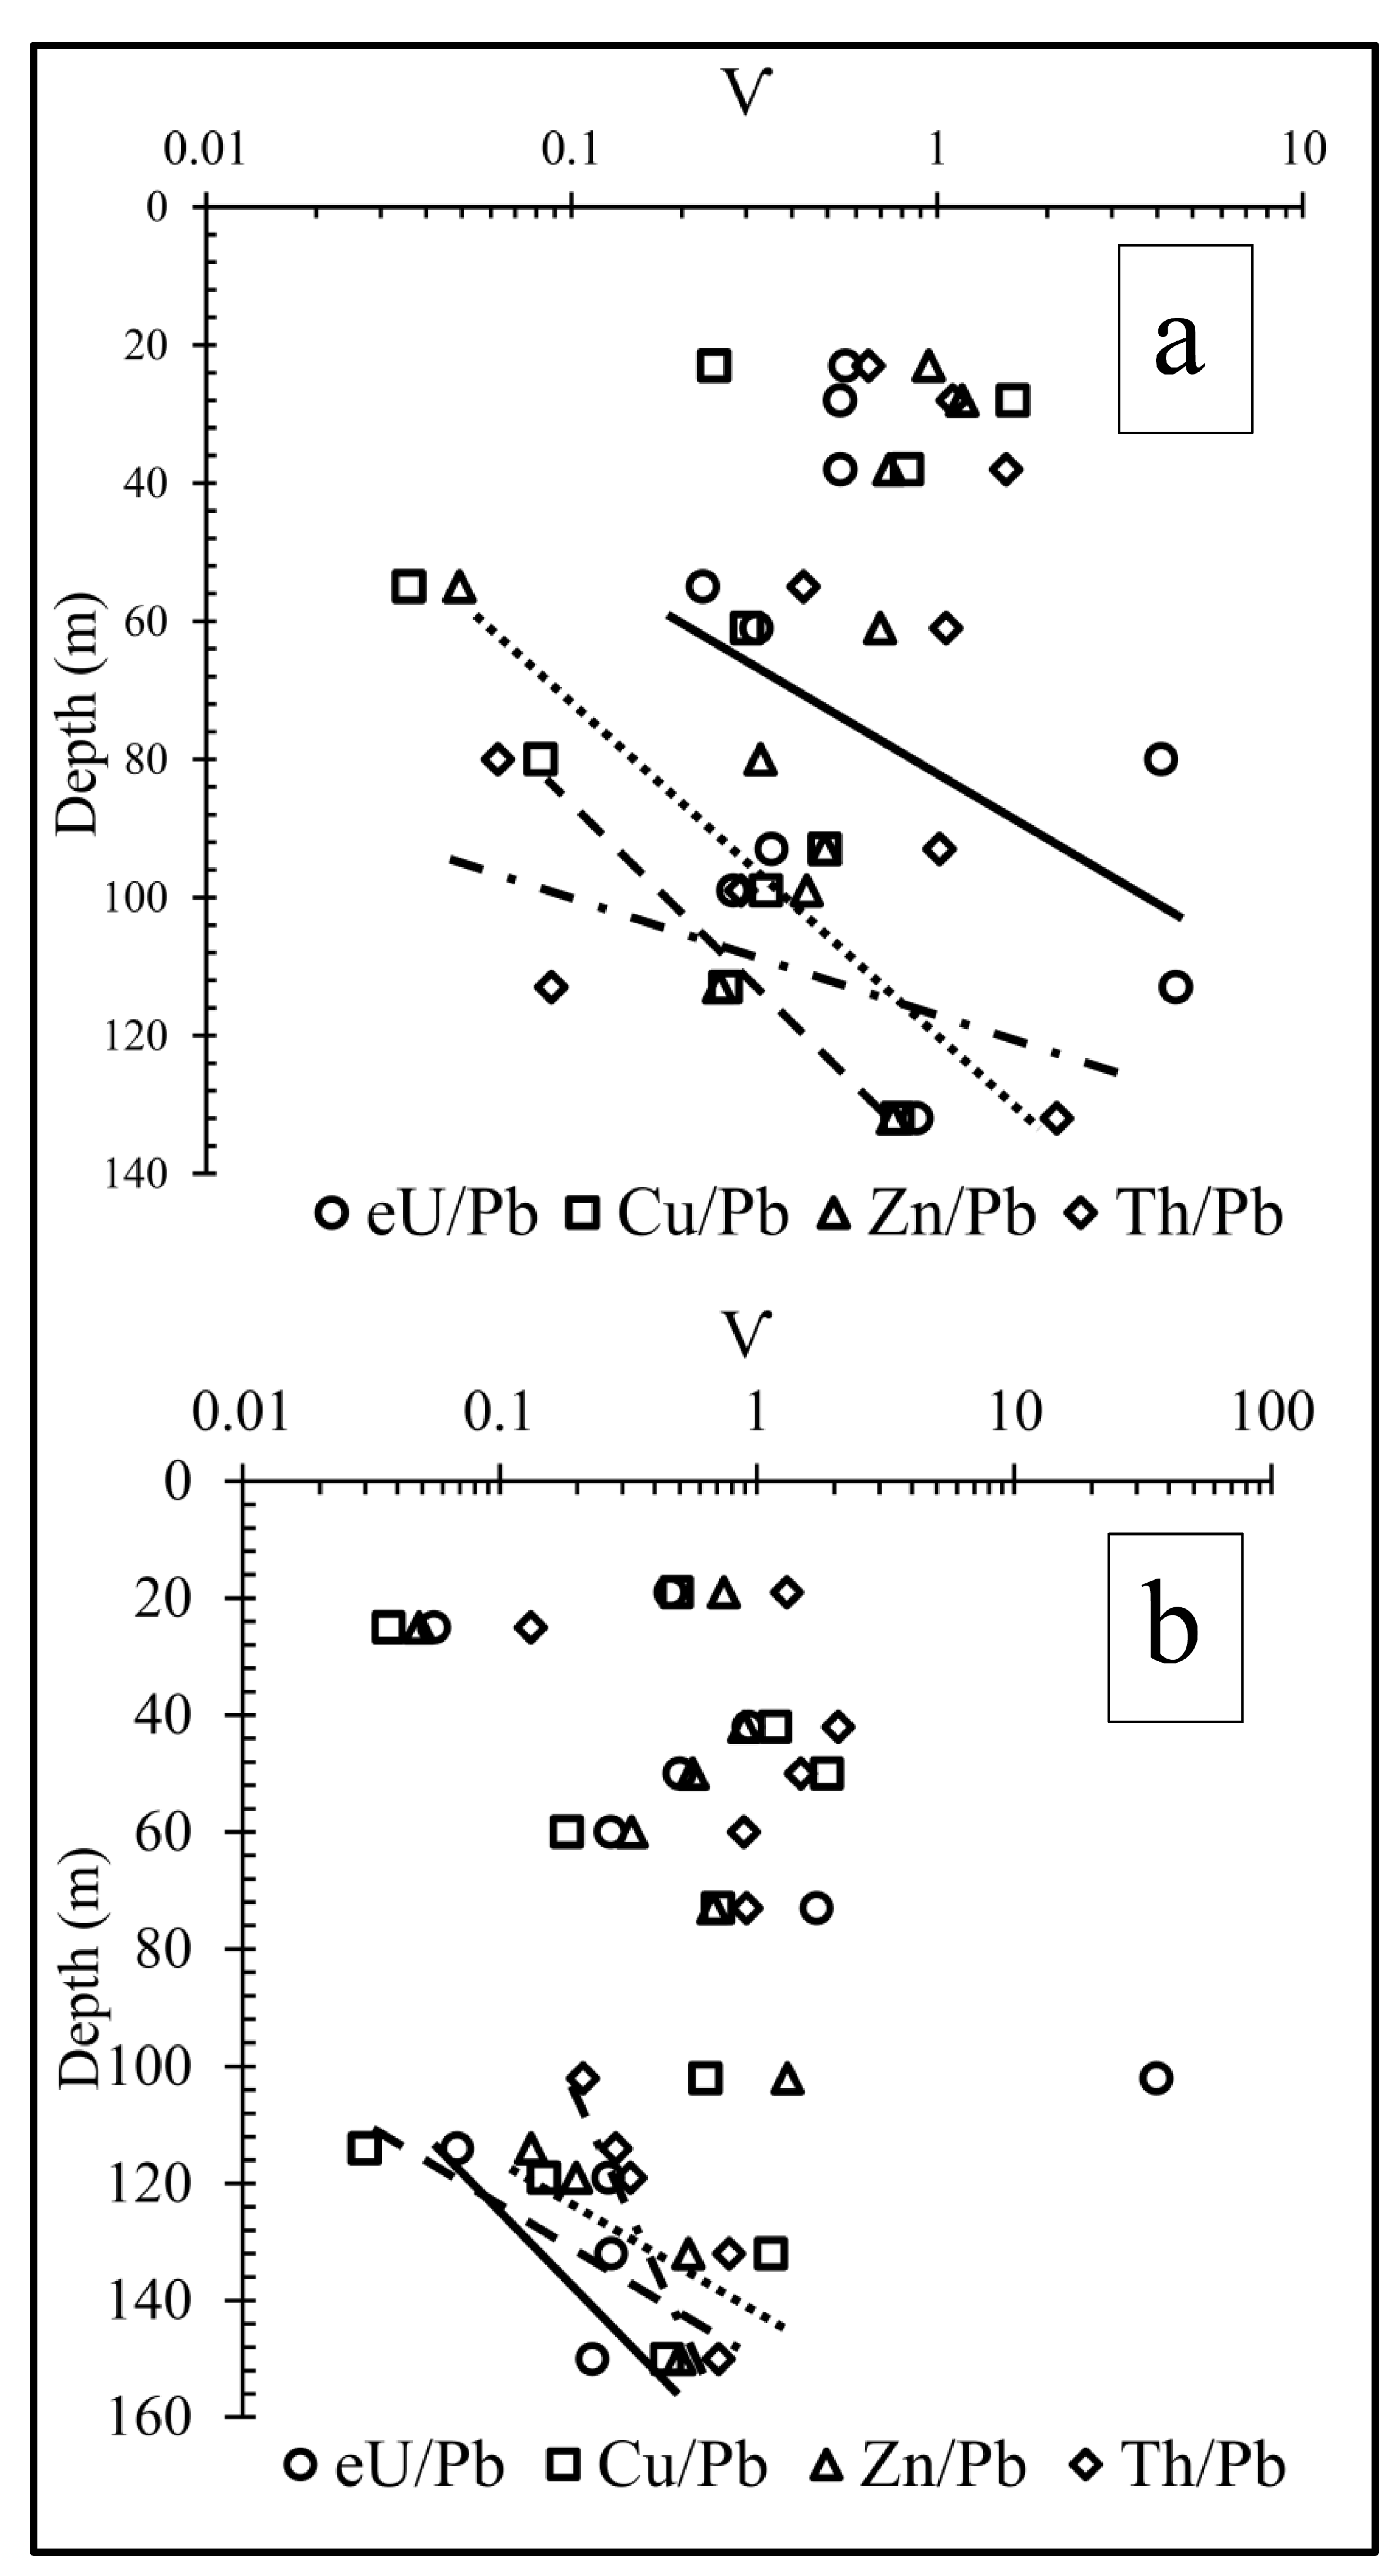
4.2.2. El-Erediya
4.3. Genesis of the Mineral Deposits
4.4. Correlation of Western Arch Mineralization

5. Conclusions
Author Contributions
Funding
Data Availability Statement
Conflicts of Interest
References
- Stern, R.J.; Hedge, C.E. Geochronologic and isotopic constraints on late Precambrian crustal evolution in the Eastern Desert of Egypt. Am. J. Sci. 1985, 285, 97–172. [Google Scholar] [CrossRef]
- Bentor, Y.K. The crustal evolution of the Arabo-Nubian massif with special reference to the Sinai Peninsula. Precambrian Res. 1985, 28, 1–74. [Google Scholar] [CrossRef]
- Johnson, P.R.; Andresen, A.; Collins, A.S.; Fowler, T.R.; Fritz, H.; Ghebreab, W.; Kusky, T. Late Cryogenian-Ediacaran history of the Arabian-Nubian Shield: A review of deposition, plutonic, structural, and tectonic events in the closing stages of the northern East African Orogen. J. Afr. Earth Sci. 2011, 61, 167–232. [Google Scholar] [CrossRef]
- Egyptian Geological Survey and Mining Authority. Geological Map of Aswan Quadrangle, Egypt; Sheet NG-36; Egyptian Geological Survey and Mining Authority: Cairo, Egypt, 1979.
- Moussa, E.M.; Stern, R.J.; Manton, W.I.; Ali, K.A. Shrimp zircon dating and Sm/Nd isotopic investigations of Neoproterozoic granitoids, Eastern Desert, Egypt. Precambrian Res. 2008, 160, 341–356. [Google Scholar] [CrossRef]
- Ghoneim, M.F.; Lebda, E.M.; Abu Anber, M.M.; Abd El-Wahed, M.A. Toward a new concept for the classification of the Eastern Desert, Egypt. Geothermobarometry constraints. In Proceedings of the Fifth International Conference on the Geology of Africa, Tanta, Egypt, 5–7 October 2007; Volume 1, pp. 131–142. [Google Scholar]
- Streckeisen, A. To each plutonic rock its proper name. Earth Sci. Rev. 1976, 12, 1–33. [Google Scholar] [CrossRef]
- Bakhit, F.S.; Assaf, H.A.; Abu-Deif, A.A. Correlation study on the geology and radioactivity of surface and subsurface working in El-Missikat area, Central Eastern Desert, Egypt. Min. Geol. 1985, 35, 345–354. [Google Scholar]
- Abu El-Hassan, E.A. Geologic Setting, Petrographic and Geochemical Characteristics of Uranium-Bearing Granitic Rocks in El Erediya-El Maghrabiya Area, Central Eastern Desert, Egypt. Unpublished. Ph.D. Thesis, Faculty of Science, South Valley (Qena) University, Qena, Egypt, 1999; pp. 24–59. [Google Scholar]
- Falham, O.M. Geologic, Petrographic and Geochemical Studies of Uraniferous Granitoids in El Garra—El Gidami Area, Central Eastern Desert, Egypt. Unpublished. Ph.D. Thesis, Faculty of Science, South Valley (Qena) University, Qena, Egypt, 1999; pp. 14–57. [Google Scholar]
- Abdel-warith, A.; Hammad, H.M. Geochemistry and radioactivity of gabal Ria El Garrah Younger Granites, Central Eastern Desert, Egypt. Egypt. J. Geol. 2001, 45, 808–812. [Google Scholar]
- Osman, A.M.; Salman, A.B.; El-Mansi, M.M.; Abdel Ghani, I.M.; Abdallah, S.M. Mineralogy and uranium distribution in some subsurface sections from El-Missikat and El-Erediya uranium occurrences, Eastern Desert, Egypt. Delta J. Sci. 2005, 29, 18–38. [Google Scholar]
- Moussa, E.M. Post Collisional A-Type Granites at El Missikat and El Eredia, Central Eastern Desert, Egypt. Geochemical Characteristics and REE Petrogenetic Modeling. In Proceedings of the 7th International Conference on Geochemistry, Alexandria University, Alexandria, Egypt, 24–27 September 2006; pp. 2–8. [Google Scholar]
- Ammar, F.A.; Omar, S.A.; El Sawey, E.H. Genetic affiliation of gold and uranium mineralization in El-Missikat granite, Central Eastern Desert, Egypt. Nucl. Sci. Sci. J. 2016, 5, 33–47. [Google Scholar] [CrossRef] [Green Version]
- Egyptian Geological Survey and Mining Authority. Metallogenic Map of Qena Quadrangle, Egypt; Egyptian Geological Survey and Mining Authority: Cairo, Egypt, 1984.
- Hassaan, M.M.; El-Desoky, H.M. Granites in the tectonic environs of the Nubian Shield, Egypt: Geochemical Characterizations and New Contributions. IJIAR 2017, 5, 53–56. [Google Scholar]
- Harms, U.; Darbyshire, D.P.F.; Denkler, T.; Hengst, M.; Schandelmeier, H. Evolution of the Neoproterozoic Delgo Suture Zone and crustal growth in northern Sudan: Geochemical and radiogenic isotope constrains. Geol. Rundsch. 1994, 83, 591–603. [Google Scholar] [CrossRef]
- Abdelsalam, M.G.; Abdeen, M.M.; Dowaidar, H.M.; Stern, R.J.; Abdelghaffar, A.A. Structural evolution of the Neoproterozoic western Allaqi–Heiani suture, southwestern Egypt. Precambrian Res. 2003, 124, 87–104. [Google Scholar] [CrossRef]
- Egyptian Geological Survey and Mining Authority. Geologic Map of Al Qusayr Quadrangle; Sheet NG 36 K; Egyptian Geological Survey and Mining Authority: Cairo, Egypt, 1992.
- Loizenbauer, J.; Wallbrecher, E.; Fritz, H.; Neumayr, P.; Khudeir, A.A.; Kloetzli, U. Structural geology, single zircon ages and fluid inclusion studies of the Meatiq metamorphic core complex: Implications for Neoproterozoic tectonics in the Eastern Desert of Egypt. Precambrian Res. 2001, 110, 357383. [Google Scholar] [CrossRef]
- Shalaby, A.; Stüwe, K.; Makroum, F.; Frtiz, H.; Kebede, T.; Klötzli, U. The Wadi Mubarak belt, Eastern Desert of Egypt: A Neoproterozoic conjugate shear system in the Arabian–Nubian Shield. Precambrian Res. 2005, 136, 27–50. [Google Scholar] [CrossRef]
- Hung, L.Q.; Batelaan, O.; De Smedt, F. Lineament extraction and analysis, comparison of LANDSAT ETM and ASTER imagery. Case study: Suoimuoi tropical karst catchment, Vietnam. In Proceedings of the SPIE—The International Society for Optical Engineering, Hanoi, Vietnam, 27 December 2005; Volume 598359830T-2. [Google Scholar]
- Habib, M.E. Landsat investigation of mineralized granites in the area between Gabals El-Urf and El-Erediya due best of Safaga. In Proceedings of the Egypt 8th International Data, LARS/Purdue University, West Lafayette, IN, USA, 5 August 1982; pp. 441–446. [Google Scholar]
- Nouri, R.; Jafari, M.R.; Arain, M.; Feizi, F. Hydrothermal alteration zones identification based on remote sensing data in the Mahin Area, West of Qazvin Province, Iran. Int. J. Geol. Environ. Eng. 2012, 6, 382–385. [Google Scholar]
- Velosky, J.C.; Stern, R.J.; Johnson, P.R. Geological control of massive sulfide mineralization in the Neoproterozoic Wadi Bidah shear zone, Southwestern Saudi Arabia, inferences from orbital remote sensing and field studies. Precambrian Res. 2003, 123, 235–247. [Google Scholar] [CrossRef]
- Crosta, A.P.; Moore, J.M. Enhancement of Landsat thematic mapper imagery for residual soil mapping in SW Minais Gerais State, Brazil: A prospecting case history in Greenstone belt terrain. In Proceedings of the Seventh Thematic Conference on Remote Sensing for Exploration Geology, Calgary, AL, Canada, 2–6 October 1989; pp. 1173–1187. [Google Scholar]
- Ridley, J. Ore Deposit Geology; Cambridge University Press: Cambridge, UK, 2013; p. 409. [Google Scholar]
- Middlemost, E.A.K. Magmas and Magmatic Rocks. An Introduction to Igneous Petrology; Longman Group Ltd.: London, UK; New York, NY, USA, 1980; p. 266. [Google Scholar]
- Cox, K.G.; Bell, J.D.; Pankhurst, R.J. The Interpretation of Igneous Rocks; Allen and Unwine: London, UK, 1979; p. 450. [Google Scholar]
- Sylvster, P.J. Post-collisional alkaline granites. J. Geol. 1989, 97, 261–280. [Google Scholar] [CrossRef]
- Batchelor, R.A.; Bowden, P. Petrogenetic interpretation of granitoid rock series using multicationic parameters. Chem. Geol. 1985, 48, 43–55. [Google Scholar] [CrossRef]
- Pearce, J.A.; Harris, N.B.W.; Tindle, A.G. Trace element discrimination diagrams for the tectonic interpretation of granitic rocks. J. Petrol. 1984, 25, 956–983. [Google Scholar] [CrossRef] [Green Version]
- Hassaan, M.M. Metallic Ore Deposits in the Nubian Shield in Egypt: Tectonic Environs, Geochemical Behaviour, Promising Sites; LAMBERT Acadamic Publication: London, UK, 2011; p. 256. [Google Scholar]
- Abdallah, S.M. Geological and Mineralogical Studies on Some Surface and Subsurface Sections from El-Missikat and El-Erediya Uranium Occurrences, Central Eastern Desert, Egypt. Unpublished. Ph.D. Thesis, Faculty of Science, Ain Shams University, Cairo, Egypt, 2004. [Google Scholar]
- Assaf, H.S.; Mahdy, M.A.; El Afandy, A.H. Egyptian younger granites, an approach to define parameters favoring formation of uranium deposits. In Proceedings of the 3rd Conference Geochemistry, Alexandria University, Alexandria, Egypt, 15–16 September 1997; pp. 409–420. [Google Scholar]
- Hall, A.; Walsh, J.N. Rapid method for the determination of fluorine in silicate rocks and minerals. Anal. Chem. Acta 1969, 45, 341–342. [Google Scholar] [CrossRef]
- Maurice, Y.T. Uraniferous granite and associated mineralization in the Fury and Hecla Strait area, Baffin Island. N.W.T. 1982. In Proceedings of the ‘Uranium in Granite’ Paper 81–23 Workshop, Ottawa, ON, Canada, 25–26 November 1980; pp. 101–115. [Google Scholar]
- El-Sherif, A.M. Mineralogical and radioactive characterization of Gabal El-Urf pegmatites, Central Eastern Desert, Egypt. Al-Azhar Bull. Sci. 2015, 26, 85–96. [Google Scholar]
- Hammouda, E.A. Geochemical Studies of Some Radioactive Outcrops Bearing Rare Earth Elements North Eastern Desert, Egypt. Unpublished. Ph.D. Thesis, Faculty of Science, Al-Azhar (Cairo) University, Cairo, Egypt, 1988. [Google Scholar]
- El Shazly, E.M. The geology of Egyptian Region, Chapter 8. In The Ocean Basins and Margins; Alan, E.M., Nairm, W.H., Kanes, F.G.S., Eds.; Plenum Publishing Corporation: New York, NY, USA, 1970; Volume 4A, pp. 379–444. [Google Scholar]
| Area | El Missikat | Riea El Garrah | El Gidami | El Erediya | |||||||||||
|---|---|---|---|---|---|---|---|---|---|---|---|---|---|---|---|
| S. No. | M2 | M7 | M12 | M16 | M18 | M20 | RG1 | RG4 | G1 | G3 | Er1 | Er3 | Er4 | Er5 | Er6 |
| Major oxides | |||||||||||||||
| SiO2 | 73.50 | 72.83 | 73.12 | 71.67 | 69.44 | 72.63 | 74.22 | 69.31 | 72.55 | 73.50 | 71.98 | 72.40 | 72.65 | 72.62 | 71.74 |
| TiO2 | 0.04 | 0.20 | 0.10 | 0.06 | 0.09 | 0.09 | 0.15 | 0.28 | 0.07 | 0.07 | 0.06 | 0.18 | 0.09 | 0.02 | 0.06 |
| Al2O3 | 14.40 | 13.95 | 14.75 | 15.08 | 16.55 | 14.29 | 13.49 | 14.80 | 14.61 | 14.05 | 15.99 | 14.56 | 14.36 | 14.88 | 14.87 |
| Fe2O3 | 1.11 | 2.19 | 1.09 | 1.44 | 1.37 | 1.19 | 1.65 | 2.95 | 1.45 | 1.33 | 0.50 | 1.86 | 1.71 | 1.03 | 1.50 |
| CaO | 0.56 | 1.18 | 0.88 | 0.72 | 1.33 | 1.14 | 0.80 | 1.37 | 0.83 | 0.80 | 0.08 | 1.24 | 0.92 | 0.55 | 0.80 |
| MnO | 0.04 | 0.05 | 0.01 | 0.03 | 0.01 | 0.01 | 0.03 | 0.06 | 0.03 | 0.03 | 0.01 | 0.12 | 0.06 | 0.04 | 0.05 |
| MgO | 0.06 | 0.26 | 0.11 | 0.08 | 0.14 | 0.13 | 0.20 | 0.30 | 0.07 | 0.07 | 0.02 | 0.28 | 0.19 | 0.08 | 0.14 |
| Na2O | 4.68 | 4.10 | 4.44 | 4.56 | 4.69 | 4.08 | 4.25 | 3.92 | 4.25 | 4.29 | 5.24 | 3.88 | 4.72 | 5.50 | 5.37 |
| K2O | 4.92 | 4.80 | 4.91 | 5.66 | 5.53 | 5.56 | 4.99 | 6.44 | 5.56 | 5.22 | 5.83 | 5.16 | 5.07 | 4.57 | 4.56 |
| P2O5 | 0.01 | 0.07 | 0.01 | 0.01 | 0.01 | 0.01 | 0.03 | 0.05 | 0.01 | 0.01 | 0.02 | 0.05 | 0.05 | 0.01 | 0.01 |
| SO3 | 0.01 | 0.02 | 0.07 | 0.07 | 0.22 | 0.29 | 0.07 | 0.03 | 0.07 | 0.07 | 0.07 | 0.03 | 0.05 | 0.03 | 0.22 |
| L. O. I. | 0.05 | 0.03 | 0.09 | 0.03 | 0.06 | 0.05 | 0.03 | 0.03 | 0.08 | 0.03 | 0.02 | 0.04 | 0.06 | 0.04 | 0.03 |
| Total | 99.36 | 99.66 | 99.58 | 99.41 | 99.42 | 99.45 | 99.91 | 99.52 | 99.57 | 99.48 | 99.80 | 100.43 | 99.93 | 99.37 | 99.34 |
| Trace elements | |||||||||||||||
| Cr | 50 | 15.7 | 6.8 | 5 | 7.8 | 65 | 16.8 | 120 | 16 | 45.9 | 40.1 | 103.8 | 36.1 | 109.8 | 18.5 |
| Ni | 40 | 30 | 40 | 60 | 40 | 30 | 2.6 | 70 | 50 | 60 | 50 | 2.8 | 1.3 | 30 | 50 |
| Cu | 40 | 30 | 40 | 20 | 20 | 0 | 4.6 | Bdl | 30 | 40 | 40 | 5.5 | 4.2 | 50 | 50 |
| Zn | 120 | 210 | 200 | 130 | 120 | 110 | 39.8 | 120 | 360 | 70 | 680 | 42.4 | 26.8 | 450 | 260 |
| Zr | 180 | 240 | 180 | 190 | 220 | 260 | 106.2 | 280 | 170 | 220 | 650 | 105.6 | 66.4 | 280 | 300 |
| Rb | 540 | 230 | 260 | 530 | 350 | 360 | 127.8 | 260 | 330 | 300 | 820 | 233.4 | 167.4 | 610 | 390 |
| Y | 210 | 70 | 130 | 200 | 170 | 170 | 64.4 | 110 | 150 | 170 | 90 | 58.9 | 38.7 | 110 | 230 |
| Ba | 580 | 270 | 100 | 1050 | 450 | 610 | 31 | 280 | 450 | 300 | 140 | 60.1 | 53.4 | 120 | 120 |
| Sr | 10 | 110 | 30 | 20 | 20 | 30 | 13.3 | 80 | 20 | 20 | 40 | 35.3 | 77.7 | 20 | 30 |
| Ga | 50 | 40 | 50 | 60 | 50 | 50 | 22.2 | 40 | 30 | 50 | 110 | 22.1 | 17.7 | 60 | 70 |
| Nb | 80 | 50 | 70 | 110 | 100 | 90 | 17.5 | 60 | 80 | 100 | 80 | 29.1 | 24.1 | 100 | 110 |
| Ti | Bdl | Bdl | Bdl | Bdl | Bdl | Bdl | 193.8 | Bdl | Bdl | Bdl | Bdl | 276.4 | 180.8 | Bdl | 10 |
| CIPW Norm | |||||||||||||||
| Q | 25.5 | 26.7 | 25.9 | 21.03 | 17.3 | 24.8 | 27.8 | 17.6 | 23.9 | 26.1 | 18.8 | 26.1 | 22.9 | 21.3 | 20.5 |
| Or | 29.1 | 28.4 | 29.02 | 33.5 | 32.7 | 32.9 | 29.5 | 38.1 | 32.9 | 30.9 | 34.5 | 30.5 | 29.9 | 27 | 26.9 |
| Ab | 39.6 | 34.7 | 37.6 | 38.6 | 39.7 | 34.5 | 35.9 | 33.2 | 35.9 | 36.3 | 44.3 | 32.8 | 39.9 | 46.5 | 45.4 |
| An | 2.7 | 5.4 | 4.3 | 3.5 | 6.5 | 4.3 | 2.9 | 3.8 | 4.1 | 3.7 | 0.3 | 5.8 | 3.01 | 2.4 | 2.9 |
| C | 0.4 | 0.03 | 0.6 | 0.2 | 0.5 | - | - | - | 0.1 | - | 0.9 | 0.5 | - | - | - |
| Ap | 0.02 | 0.2 | 0.03 | 0.03 | 0.03 | 0.02 | 0.1 | 0.1 | 0.02 | 0.03 | 0.1 | 0.1 | 0.1 | 0.02 | 0.03 |
| Py | 0.01 | 0.02 | 0.1 | 0.1 | 0.2 | 0.2 | 0.1 | 0.02 | 0.1 | 0.1 | 0.1 | 0.02 | 0.04 | 0.02 | 0.2 |
| Il | 0.08 | 0.4 | 0.2 | 0.1 | 0.2 | 0.2 | 0.3 | 0.5 | 0.1 | 0.1 | 0.1 | 0.3 | 0.2 | 0.04 | 0.1 |
| Mt | 0.2 | 0.4 | 0.2 | 0.3 | 0.3 | 0.2 | 0.3 | 0.6 | 0.3 | 0.3 | 0.1 | 0.4 | 0.3 | 0.2 | 0.3 |
| Di | - | - | - | - | - | 1.2 | 0.7 | 2.4 | - | 0.2 | - | - | 1.1 | 0.2 | 0.8 |
| Hy | 1.6 | 3.3 | 1.5 | 2.01 | 1.9 | 0.9 | 2.1 | 3.1 | 1.9 | 1.7 | 0.6 | 3.1 | 2.1 | 1.5 | 1.7 |
| Total | 99.2 | 99.5 | 99.4 | 99.2 | 99.1 | 99.1 | 99.7 | 99.3 | 99.3 | 99.3 | 99.7 | 99.6 | 99.7 | 99.2 | 99.06 |
| Niggli Norm | |||||||||||||||
| Q | 23.8 | 24.9 | 24.1 | 19.5 | 16 | 23.115 | 25.9 | 16.4 | 22.2 | 24.4 | 17.3 | 24.3 | 21.3 | 19.7 | 19.02 |
| Or | 29.2 | 28.6 | 29.2 | 33.6 | 32.7 | 33.115 | 29.7 | 38.4 | 33.04 | 31.1 | 34.1 | 30.7 | 29.9 | 26.9 | 26.9 |
| Ab | 42.2 | 37.2 | 40.1 | 41.1 | 42.1 | 36.933 | 38.4 | 35.5 | 38.4 | 38.9 | 46.6 | 35.1 | 42.4 | 49.3 | 48.2 |
| An | 2.8 | 5.5 | 4.3 | 3.5 | 6.5 | 4.289 | 3.01 | 3.8 | 4.1 | 3.7 | 0.3 | 5.9 | 3.02 | 2.4 | 3 |
| C | 0.4 | 0.03 | 0.6 | 0.2 | 0.5 | - | - | - | 0.1 | - | 1.04 | 0.5 | - | - | - |
| Ap | 0.02 | 0.2 | 0.02 | 0.02 | 0.02 | 0.021 | 0.1 | 0.1 | 0.02 | 0.02 | 0.04 | 0.1 | 0.1 | 0.02 | 0.02 |
| Py | 0.01 | 0.02 | 0.1 | 0.07 | 0.3 | 0.305 | 0.1 | 0.03 | 0.1 | 0.1 | 0.1 | 0.03 | 0.1 | 0.03 | 0.2 |
| Il | 0.06 | 0.3 | 0.14 | 0.08 | 0.1 | 0.126 | 0.2 | 0.4 | 0.1 | 0.1 | 0.1 | 0.3 | 0.1 | 0.03 | 0.1 |
| Mt | 0.2 | 0.3 | 0.2 | 0.2 | 0.2 | 0.164 | 0.2 | 0.4 | 0.2 | 0.2 | 0.1 | 0.3 | 0.2 | 0.1 | 0.2 |
| Di | - | - | - | - | - | 1.078 | 0.6 | 2.2 | - | 0.2 | - | - | 0.9 | 0.2 | 0.7 |
| Hy | 1.4 | 2.9 | 1.4 | 1.8 | 1.7 | 0.854 | 1.9 | 2.8 | 1.7 | 1.5 | 0.5 | 2.8 | 1.9 | 1.3 | 1.6 |
| Total | 100 | 100 | 100 | 100 | 100 | 100 | 100 | 100 | 100 | 100 | 100 | 100 | 100 | 100 | 100 |
| Field No. | Area | Ga | Zr | Ba | Nb | Rb | Sr | Y | Zn | Cr | Cu | Ti | Ni |
|---|---|---|---|---|---|---|---|---|---|---|---|---|---|
| M2 | El Missikat | 2.9 | 1 | 0.7 | 3.8 | 3.2 | 0.1 | 5.3 | 3.1 | 12.2 | 4 | - | 8.9 |
| M7 | 2.4 | 1.4 | 0.3 | 2.4 | 1.4 | 1.1 | 1.8 | 5.4 | 3.8 | 3 | - | 6.7 | |
| M12 | 2.9 | 1 | 0.1 | 3.3 | 1.5 | 0.3 | 3.3 | 5.1 | 1.7 | 4 | - | 8.9 | |
| M16 | 3.5 | 1.1 | 1.3 | 5.2 | 3.1 | 0.2 | 5 | 3.3 | 1.2 | 2 | - | 13.3 | |
| M18 | 2.9 | 1.3 | 0.5 | 4.8 | 2.1 | 0.2 | 4.3 | 3.1 | 1.9 | 2 | - | 8.9 | |
| M20 | 2.9 | 1.5 | 0.7 | 4.3 | 2.1 | 0.3 | 4.3 | 2.8 | 15.9 | - | - | 6.7 | |
| RG1 | Ria El Garrah | 1.3 | 0.6 | 0.04 | 0.8 | 0.8 | 0.1 | 1.6 | 1 | 4.1 | 0.5 | 84.3 | 0.6 |
| RG4 | 2.4 | 1.6 | 0.3 | 2.9 | 1.5 | 0.8 | 2.8 | 3.1 | 29.3 | - | - | 15.6 | |
| G1 | El Gidami | 1.8 | 1 | 0.5 | 3.8 | 1.9 | 0.2 | 3.8 | 9.2 | 3.9 | 3 | - | 11.1 |
| G3 | 2.9 | 1.3 | 0.4 | 4.8 | 1.8 | 0.2 | 4.3 | 1.8 | 11.2 | 4 | - | 13.3 | |
| Er1 | El Erediya | 6.5 | 3.7 | 0.2 | 3.8 | 4.8 | 0.4 | 2.3 | 17.4 | 9.8 | 4 | - | 11.1 |
| Er3 | 1.3 | 0.6 | 0.1 | 1.4 | 1.4 | 0.4 | 1.5 | 1.1 | 25.3 | 0.6 | 120.2 | 0.6 | |
| Er4 | 1 | 0.4 | 0.1 | 1.2 | 0.98 | 0.8 | 1 | 0.7 | 8.8 | 0.4 | 78.6 | 0.3 | |
| Er5 | 3.5 | 1.6 | 0.1 | 4.8 | 3.6 | 0.2 | 2.8 | 11.5 | 26.8 | 5 | - | 6.7 | |
| Er6 | 4.1 | 1.7 | 0.1 | 5.2 | 2.3 | 0.3 | 5.8 | 6.7 | 4.5 | 5 | 4.3 | 11.1 | |
| [8] | |||||||||||||
| S. No. | 1 | 2 | 3 | 4 | 5 | ||||||||
| Mo | 29.2 | 34.6 | 30.8 | 38.5 | 26.9 | ||||||||
| Ga | Zr | Ba | Nb | Rb | Sr | Y | Zn | Cr | Cu | Ti | Ni | |
|---|---|---|---|---|---|---|---|---|---|---|---|---|
| Ga | 1 | |||||||||||
| Zr | 0.91 | 1 | ||||||||||
| Ba | 0.14 | −0.04 | 1 | |||||||||
| Nb | 0.64 | 0.41 | 0.55 | 1 | ||||||||
| Rb | 0.87 | 0.77 | 0.29 | 0.61 | 1 | |||||||
| Sr | −0.19 | 0.05 | −0.25 | −0.44 | −0.32 | 1 | ||||||
| Y | 0.38 | 0.11 | 0.63 | 0.84 | 0.35 | −0.54 | 1 | |||||
| Zn | 0.76 | 0.82 | −0.14 | 0.36 | 0.77 | −0.06 | 0 | 1 | ||||
| Cr | −0.08 | 0.09 | −0.23 | −0.14 | 0.09 | 0.14 | −0.26 | 0.02 | 1 | |||
| Cu | 0.59 | 0.4 | −0.08 | 0.59 | 0.55 | −0.28 | 0.43 | 0.6 | −0.23 | 1 | ||
| Ti | −0.6 | −0.5 | −0.47 | −0.79 | −0.5 | 0.06 | −0.64 | −0.45 | 0.19 | −0.54 | 1 | |
| Ni | 0.54 | 0.48 | 0.48 | 0.73 | 0.43 | −0.08 | 0.64 | 0.32 | −0.05 | 0.39 | −0.82 | 1 |
Publisher’s Note: MDPI stays neutral with regard to jurisdictional claims in published maps and institutional affiliations. |
© 2022 by the authors. Licensee MDPI, Basel, Switzerland. This article is an open access article distributed under the terms and conditions of the Creative Commons Attribution (CC BY) license (https://creativecommons.org/licenses/by/4.0/).
Share and Cite
Hassaan, M.M.; Omar, S.A.; Khalil, A.E.; Shahin, T.M.; El-Naggar, I.M.; Sayyed, M.I.; Hanfi, M.Y. Prognostic Exploration of U-F-Au-Mo-W Younger Granites for Geochemical Pathfinders, Genetic Affiliations, and Tectonic Setting in El-Erediya-El-Missikat Province, Eastern Desert, Egypt. Minerals 2022, 12, 518. https://doi.org/10.3390/min12050518
Hassaan MM, Omar SA, Khalil AE, Shahin TM, El-Naggar IM, Sayyed MI, Hanfi MY. Prognostic Exploration of U-F-Au-Mo-W Younger Granites for Geochemical Pathfinders, Genetic Affiliations, and Tectonic Setting in El-Erediya-El-Missikat Province, Eastern Desert, Egypt. Minerals. 2022; 12(5):518. https://doi.org/10.3390/min12050518
Chicago/Turabian StyleHassaan, Mahmoud M., Sayed A. Omar, Ahmed E. Khalil, Taher M. Shahin, Islam M. El-Naggar, M. I. Sayyed, and Mohamed Y. Hanfi. 2022. "Prognostic Exploration of U-F-Au-Mo-W Younger Granites for Geochemical Pathfinders, Genetic Affiliations, and Tectonic Setting in El-Erediya-El-Missikat Province, Eastern Desert, Egypt" Minerals 12, no. 5: 518. https://doi.org/10.3390/min12050518