1. Introduction
Mining at great depths has a negative impact on local stress distribution and leads to the expansion and activation of fractures. If the rock mass disintegration develops, rock mass movement along these discontinuities may be expected. This poses a significant threat to the safety of exploitation [
1]. In most cases, such phenomena result in a rapid release of elastic strain energy from the rock mass, which in consequence may induce seismic tremors [
2,
3]. According to the latest research, this problem is observed in all countries conducting underground excavation of deposits [
4,
5,
6,
7,
8,
9,
10]. As Askaripour et al. [
11] pointed out, increasing demand for mineral resources translates into the necessity of performing mining works at ever greater depths. Thus, it may be stated that in the coming years, mining-induced seismicity will be even more intense [
12,
13,
14]. Therefore, advanced monitoring systems and appropriate preventive measures should be implemented in order to reduce ground-control-related hazards [
15,
16,
17].
One of the most commonly used methods of rockburst control in Polish copper mines is multi-face destress blasting [
18,
19,
20]. According to recent studies, the main goal of destress blasting in underground mines is to induce such seismic energy that will fracture the rock mass in the overloaded area and consequently shift the zone of the stress concentration away from the mining front [
21,
22,
23]. The fracturing of the rock mass is observed in the direct vicinity of the blastholes, while the range of the fractured zone is strictly related to the energy of detonation [
24]. In addition to rock mass fracturing, destress blasting is also the source of induced seismic vibrations. These vibrations may contribute to the triggering of tremors located even a few hundred meters away from the blasting site [
25]. In the most desired scenario, both of the above effects are combined, which significantly decreases ground control problems. Regardless of the expected effect of destress blasting, it is important to perform a continuous evaluation of its efficiency. There are many ways to perform such an assessment, including:
Analysis of provocation rate [
26,
27];
Estimation of induced energy [
28,
29];
Analyses of the seismic velocity changes based on geotomographic methods [
30];
Evaluation based on peak particle velocity [
31,
32];
Complex evaluation covering the input parameters of blasting and seismic records from the surrounding area [
25].
All the above-mentioned evaluation methods require continuous seismic measurements, preferably with the use of a well-developed seismic monitoring system [
33]. In order to achieve high reliability of the records collected by the seismic network, certain conditions must be fulfilled. One of the most important factors is the coverage of analyzed areas with appropriate sensors [
34]. With the increase in the number of monitoring points, the reliability and accuracy of destress blasting evaluation increases. Secondly, parameters of applied monitoring devices must be adapted to the local characteristics of seismic waves in terms of their frequency and amplitude [
35,
36].
However, as pointed out by Hudyma and Brummer [
37], the development of a dense seismic network in underground mines is associated with high costs of installation and maintenance. Therefore, due to economic constraints, in most cases, the density of the seismic network is planned in such a way that it allows the management of ground-related hazards. Hence, they are not dense enough to effectively monitor the effectiveness of blasting works or to perform continuous rock mass imaging.
This is why the expectations regarding seismic monitoring systems have increased considerably in the last decade. Along with these expectations, the rapid development of a cost-effective vibration monitoring system may be observed [
38]. One of the most recent and promising types of sensors is Micro-Electro-Mechanical Systems (MEMS). These types of devices are characterized by low weights and small sizes, reasonable prices and satisfactory parameters in terms of self-noise, amplitude-frequency characteristics and power consumption. Recently, MEMS accelerometers have been applied in:
Structural health monitoring [
41,
42];
Earthquake seismology [
38,
44,
45];
Microtremor surveys [
46].
However, the usefulness of MEMS-based accelerometers for the purposes of continuous long-term near-field destress blasting monitoring has not yet been fully investigated.
In this paper, preliminary studies of MEMS accelerometers’ capability for the assessment of blasting-induced seismic vibration were performed. The tests were conducted in one of the deep underground Polish copper mines located in the Lower Silesian Copper Basin. For the purposes of the analysis, records of 10 multi-face blasting instances were collected. The acceleration records were compared with those obtained using a regular mining seismic monitoring network.
2. Site Geology
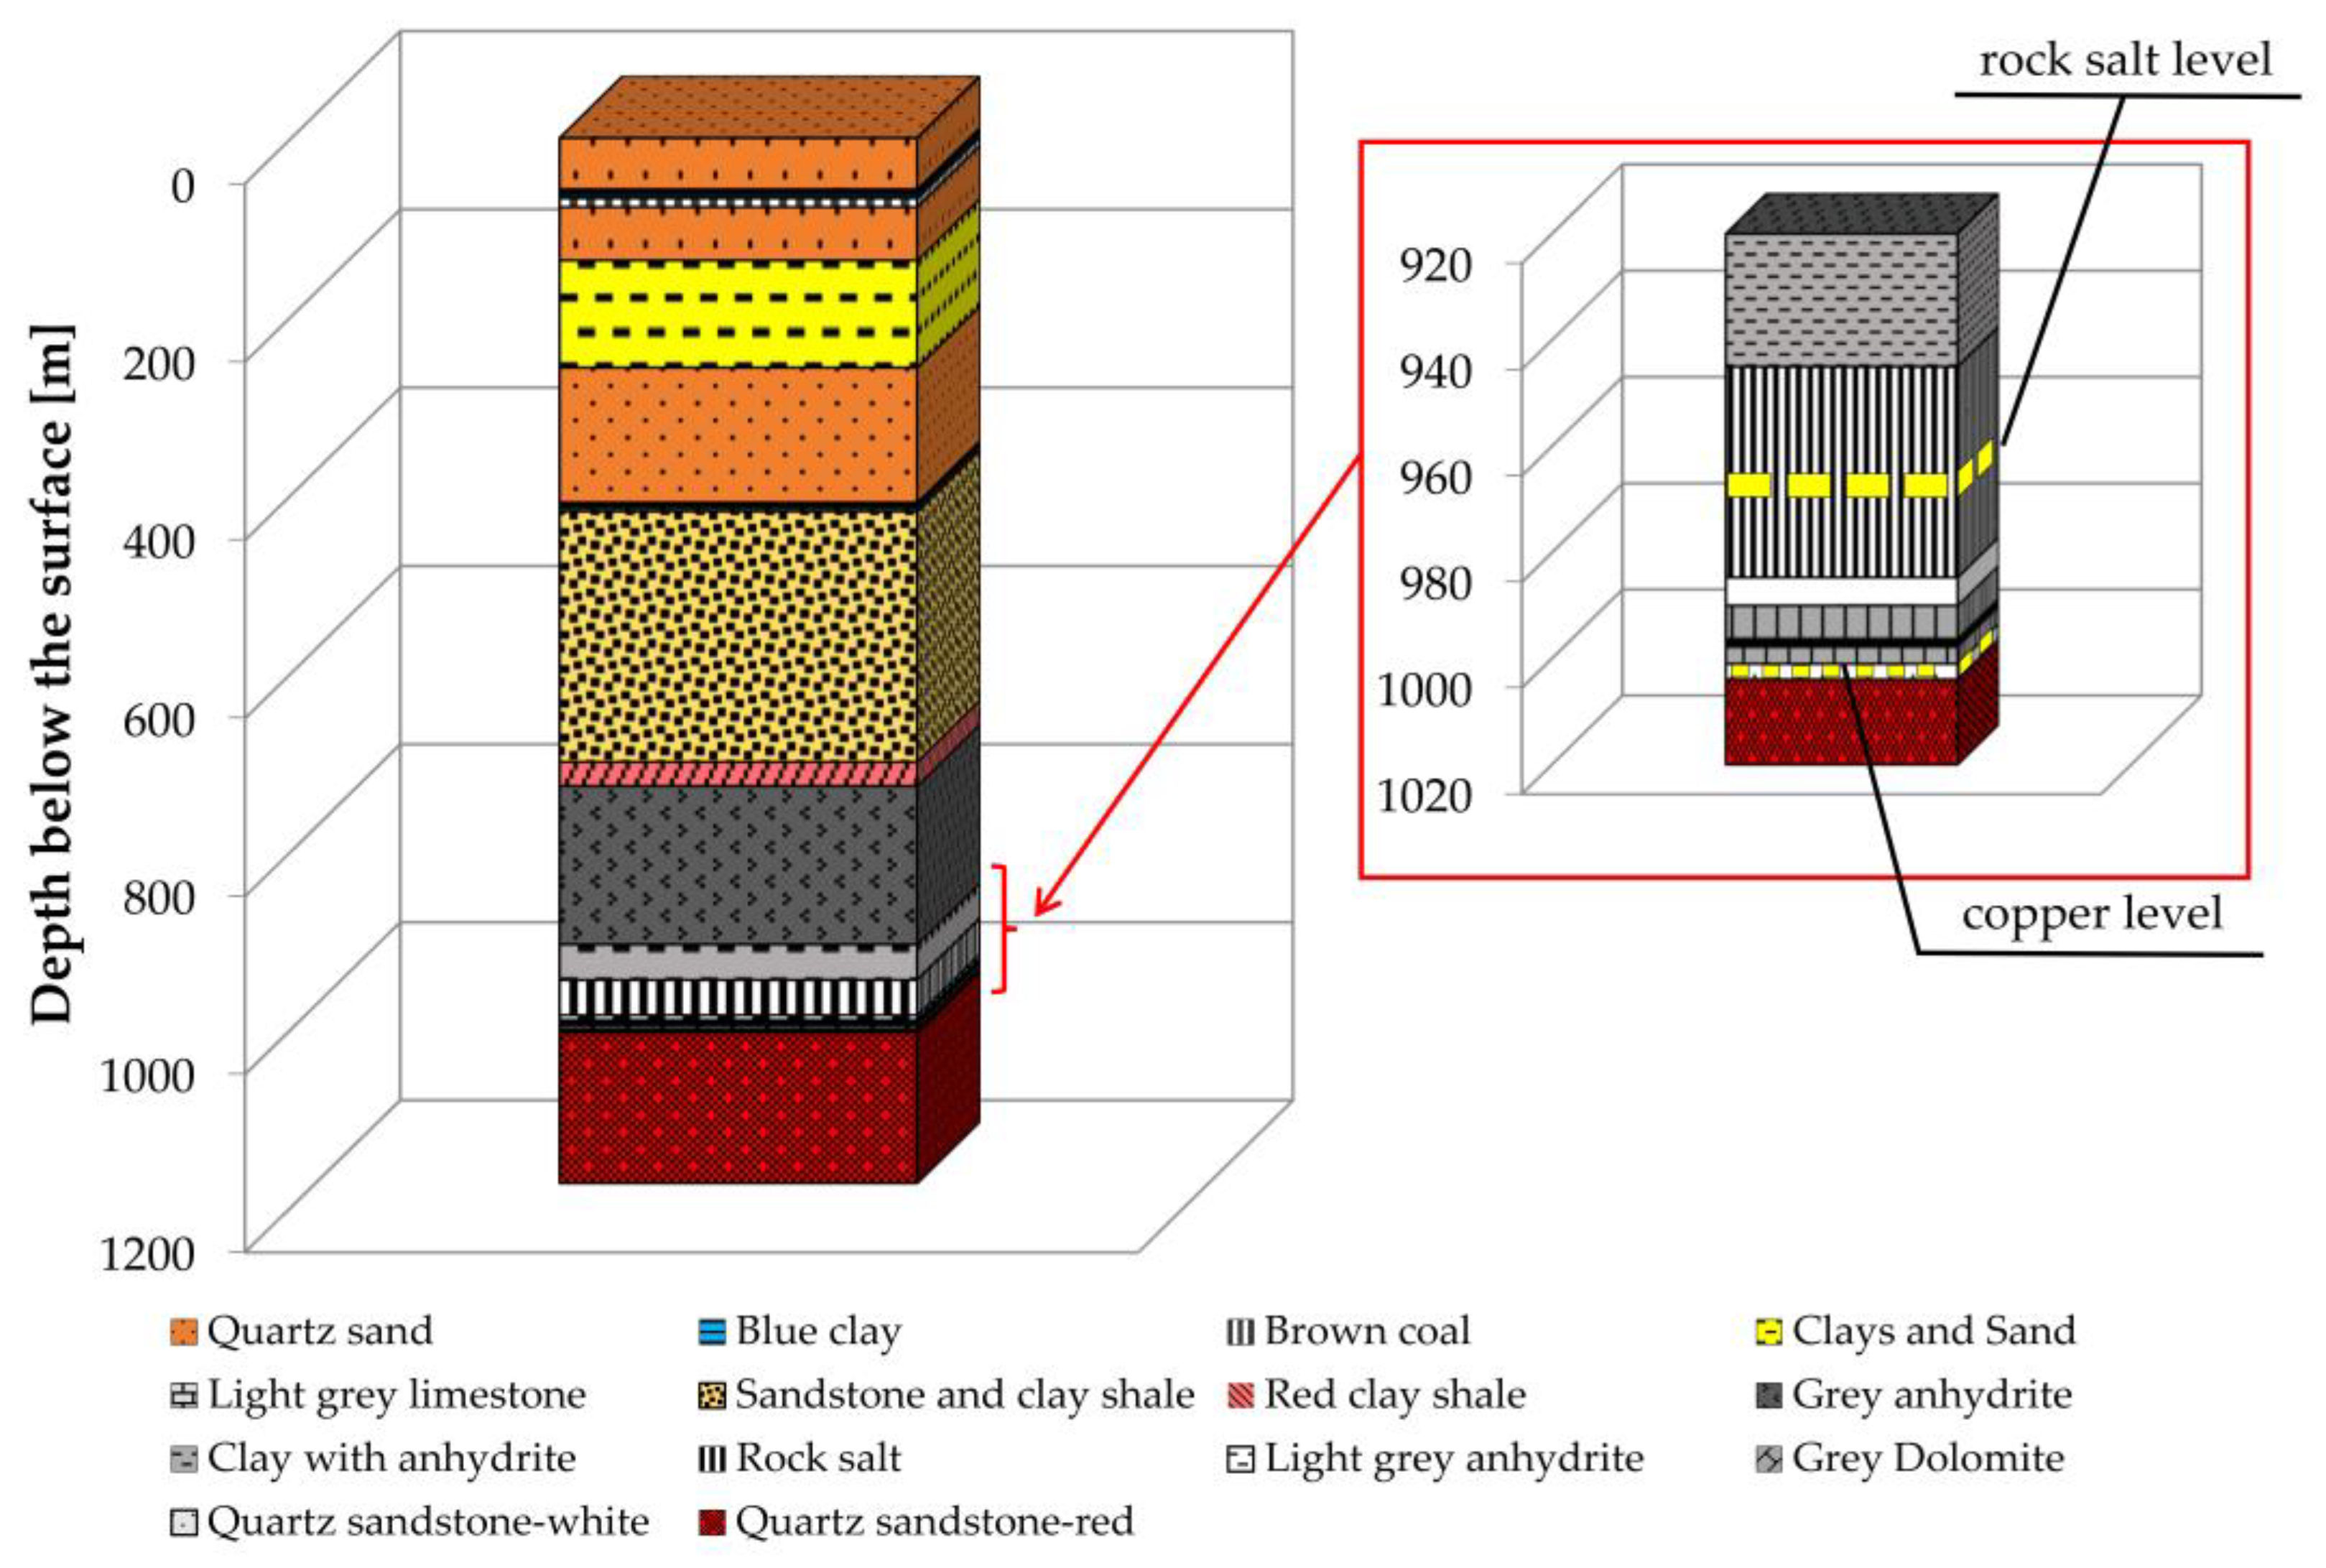
Continuous measurements of seismic acceleration were conducted in the Polkowice–Sieroszowice underground copper mine, which is located northwest of the Polkowice city in Lower Silesia. The mining activities over the analyzed area are performed at two levels including copper and rock salt.
Copper ore is excavated over 1000 m below the surface. The mining is carried out using the single-level room-and-pillar mining method with roof deflection and pillars softening while utilizing explosives. The geometry of rooms and pillars are chosen according to the local geomechanical conditions and strength parameters of the rocks. Directly above the copper mining level, the dolomite layers are located. In turn, in the floor of underground workings, the sandstone layers are located. The low deformability of the dolomite stratum and its high compressive strength lead to elastic energy accumulation above the mining workings. The compressive strength of roof dolomite may reach 250 MPa. In turn, the sandstone located in the floor stratum is much weaker. Its uniaxial compressive strength varies between 30 MPa and 100 MPa in most cases. With the progression of mining works, strong dolomite layers tend to fail due to the presence of high stresses. Such phenomena result in the occurrence of seismic events. Unfortunately, such a situation is occurring in all mining panels excavating copper ore in the Polkowice–Sieroszowice mine. Until recently, the whole mining exploitation in the Polkowice–Sieroszowice mine was performed at a single level. The situation changed recently when it was approved to mine copper under the salt level. It is expected that mining-induced seismicity will occur also within this area. In the analyzed area, blasting works within the copper mining panels are performed twice a day (after the second and fourth shift). In turn, the rock salt is excavated ca. 100–150 m above the copper deposit level with a bord-and-pillar mining system utilizing roadheaders and continuous miners (
Figure 1). The dimensions of excavated chambers are 15 m × 15 m and up to 200 m in length.
Due to the great depth and high strength parameters of carbonate rocks located between the copper and rock salt levels, it was expected that with the progress of copper exploitation, the seismicity level will increase as well. Therefore, a triaxial seismic velocity monitoring post has been installed in one of the rock salt chambers. This location was also suitable for preliminary tests of the MEMS accelerometer in underground conditions since drilling and blasting is a common method of copper excavation in this area. Therefore, it was decided that a MEMS accelerometer will be installed in a salt chamber located just above the progressing mining front of the copper deposit, next to the existing seismic monitoring system of the mine.
3. Materials and Methods
For the purposes of validation, the data recorded by the MEMS accelerometer were compared with the data recorded by the seismic network of the Polkowice–Sieroszowice mine. In order to increase the reliability of the analysis, a 3-axial accelerometer was installed next to three perpendicularly positioned seismometers connected to the mine’s seismic network. All sensors (one triaxial accelerometer and three seismometers) were rigidly fixed to the ground with gypsum mortar (
Figure 2).
3.1. Description of Seismic Monitoring Systems
During the measurements, a single low noise, low drift and low power 3-axis MEMS accelerometer ADXL355 manufactured by Analog Devices, Wilmington, USA, was used. The sensor records vibrations in three orthogonal directions, XYZ, and converts the analog signal into 20-bit digital. The basic parameters of the ADXL355 accelerometer, according to the technical datasheet, are presented in
Table 1.
The MEMS-based measuring system was equipped with a battery and supporting microchip fixed to a plastic plate (
Figure 3). The supporting microchip is intended to convert binary data transferred by the serial peripheral interface (SPI) into text data that can be exported into the computer via the integrated USB port. The data of recorded seismic vibrations were continuously collected on a rugged laptop manufactured by Getac, New Taipei City, Taiwan. The recording frequency in this system was 500 Hz. In turn, data from the seismic network of the Polkowice–Sieroszowice mine were collected with the use of three uniaxial seismometers, the model being Willmore MK III, manufactured by Sensonics Ltd., Hertfordshire, UK. They are adjustable-period velocity-sensing devices adapted for in-situ applications. This type of seismometer may work in vertical and horizontal positions. When used in the vertical position, the permanent magnet mass is counter-balanced by ligament springs, which are connected to the frame of the device with lever arrangement ensuring minimal stiffness on axial movement. In turn, these counterbalance springs are separated from the magnet mass when the seismometer is placed horizontally.
The recording rate of the Polkowice–Sieroszowice mine seismic network was 500 Hz.
The basic parameters of the Willmore MK III seismometers are presented in
Table 2.
3.2. Description of Blasting
The drilling and blasting patterns that were used during tests consisted of 30 blastholes into which from 3 to 5 kg of explosives were loaded. In the center of the face, a 4-hole V-cut was located. Each blasthole in the cut was loaded with 5 kg of bulk emulsion explosives, and 2–3 kg were loaded into the other holes. During the blasting, non-electric detonators were used. Time intervals between following delays were increased by 500 ms (
Table 3). There were 8 delays in the firing pattern used during the tests (
Figure 4).
During the measuring period, 10 group blasting trials were performed in the vicinity of the monitoring area. The number of detonated faces ranged from 10 to 17, while the total amount of explosives ranged from 828 kg to 1438 kg (
Table 4).
The spatial location of the seismic monitoring system in relation to mining fronts is presented in
Figure 5.
The copper ore working locations are marked black, while workings located within the salt excavation level are marked blue. In the current situation within the analyzed area, it may be noticed that in the vicinity of the measuring site, there were two active mining panels excavating copper ore where explosives were applied. The direction of the mining fronts at the copper ore level was moving towards the measuring site. The salt chamber in which seismic monitoring systems were installed was located at a distance of 800–1000 m from detonated faces.
3.3. Data Processing and Analysis
Prior to data analysis, the seismic waveforms were filtered with the use of 4th grade Butterworth bandpass filter in the 0.1–150 Hz frequency band. Baseline correction procedures were also applied. To compare data collected using Willmore MK III and MEMS records, the velocity-time histories were derived to the acceleration domain. The transformation from velocity to acceleration domain was calculated with the use of a derivative over the second-order central difference quotient. This was performed according to the following formula:
where N is the number of values in waveform.
In this approach, the obligatory number of interpolation points for the calculation of the central difference quotient is not available at the boundaries. Thus, calculation of the second-order forward difference quotient for the first two points of the channel was required. This may be performed according to the following formulas [
49]:
Then, the second-order backward difference quotient for the last two points of the waveform was determined using the following equations:
The calculation of the central difference quotient ensures that the length of the waveform remains unchanged.
Additionally, to analyze the spectral characteristic of noise, the powers spectral density (PSD) of waveforms was calculated. PSD estimates the distribution of power of signal with changes in the frequency. The PSD was calculated with NI DIAdem software developed by NI company, Austin, USA. Calculations were preformed utilizing the most common approach for quantification of the seismic background noise data with the direct Fourier transform method. The PSD was calculated according to the formula:
where RMS is the Root Mean Square of seismic amplitude and
is the frequency interval.
According to recent research, such an approach is currently a standard technique for quantification of seismic background noise [
50,
51].
A comparison of data collected with both types of seismic monitoring systems was conducted with the use of the 3D peak motion plots. The 3D curves, which are the results of seismic movement in X, Y and Z directions, were calculated according to the formula:
4. Results
4.1. Noise Characteristics
Based on the collected data set, the comparison of seismic noise characteristics at both types of sensors was performed. The records collected with the ADXL355 accelerometer were analyzed only in the acceleration domain, while waveforms recorded with the Willmore MK III seismometer have been presented in the velocity and acceleration domains.
To characterize noise levels, the PSD plots were calculated. The horizontal and vertical records were analyzed separately. The results of the calculation are presented in
Figure 6.
On the basis of the collected data set and the comparison of seismic noise characteristics of both types of measuring system, one may conclude that seismic noise recorded with the use of the MEMS-based accelerometer was characterized by a significantly higher level in comparison to the PSD of noise recorded with the Willmore MK III seismometer, both in horizontal and vertical directions. Additionally, the range of frequencies contained in the noise was significantly higher. Such a situation determines the inferior usability of the ADXL355 accelerometer compared to the Willmore MK III seismometer for the observation of microseismic events. Relatively high noise levels also affect the possibility of locating the epicentral and hypocentral position of the source, which is based on the determination of arrival times of P and S waves. However, this issue only concerns far-field events.
4.2. Blasting-Induced Seismicity Monitoring
In order to compare results in the time domain, the 3D peak ground motion plots were prepared. Then, the ground motion that was determined on the basis of the ADXL355 accelerometer and the derivation of records from the Willmore MK III seismometer were superimposed. The results are presented in
Figure 7.
Based on the resultant ground movement plots, one may conclude that waveforms recorded with the use of the MEMS-type accelerometer in the time domain correspond satisfactorily with the data derived from the Willmore MK III records. It is worth noting that in terms of peak ground acceleration, the difference between derivate and recorded data was smaller than 10% for 6 out of 10 blasting-induced waveforms. The biggest difference in recorded amplitudes was observed after the last multi-face blasting and reached a value of 29%. However, bearing in mind that different types of sensors were used during the measurements and that signals from the seismometer were transformed from velocity to acceleration domain, such differences are fully acceptable.
Apart from the peak ground movement amplitude during blasting, the precision of applied delays is of high importance as well. The properly selected delay times ensure high efficiency of rock extraction and allow the mitigation of geomechanical hazards. In the case of destress blasting, delay times are selected so that a seismic effect is intentionally amplified. In turn, when blasting is performed near key underground mine infrastructure, such as shafts or functional chambers, then such delays are selected in such a way that allows for the minimizing of the seismic effect. Therefore, seismic monitoring sensors capable of near-field monitoring of strong ground motion are highly recommended for that purpose. The records of blast-induced ground motion in the time domain are presented in
Figure 8.
The delay times used during the blasting were described in
Section 3.2. Numbers assigned to subsequent acceleration peaks correspond to delay times of detonators according to the drilling and blasting pattern presented in
Figure 4, which was used during the blasting.
The records from the MEMS accelerometer allow for more precise identification of the arrivals of seismic waves induced by the detonation of explosives in subsequent holes than velocity measurements with the Willmore MK III seismometer. Data collected with a seismometer were more scattered, especially for higher delays, where seismic waves induced from different blastholes tended to overlap. Additionally, the frequency band of the sensors used had a great impact on the final resolution of obtained data. The Willmore MK III seismometer is not suitable for recording ground motion with a dominant frequency over 150 Hz. In the case of near-field blasting, waves of such characteristics may be expected, and some fragments of the seismic wave may be not properly recorded. In the case of the ADXL 355 accelerometer, this problem is negligible because it is adapted for the measurements of waves characterized by dominant frequencies up to 1.9 kHz.
5. Discussion
Based on the preliminary in-situ measurements of the near-field blast-induced seismic wave, it was concluded that the MEMS-based ADXL 355 triaxial accelerometer may be successfully used for regular monitoring of multi-face blasting efficiency. The low price of MEMS sensors translates into the possibility of developing relatively cheap seismic networks. If more sensors are installed in particularly important regions of the mine, then more accurate coverage of the monitoring area will increase the reliability of near-field mining-induced seismicity monitoring. However, there is no information so far on the maintenance of such sensors during long-term underground measurements.
Due to the characteristics of MEMS sensors, they are able to effectively monitor the peak level and frequency content of the ground motion and can also be successfully used the determination of the delay accuracy of detonators used during the blasting. What is important is the fact that this type of sensor is characterized by a low offset drift over temperature and long-term stability, which allows for performing measurements in harsh environmental conditions.
Nevertheless, MEMS accelerometers should not be treated as a replacement for standard velocity sensors currently used in Polish underground copper mines, but rather as an addition to the seismic monitoring network. This is mainly because these types of accelerometers are characterized by a relatively high noise level, which makes them less suitable for monitoring low energy events and performing activities such as passive tomography [
52]. These limitations may be compensated for by a very dense seismic network, as a high noise level is not an issue in the case of short distances from the event. However, this approach affects the total number of channels in the seismic network.
Moreover, monitoring of mining-induced seismicity over longer distances could be challenging when using the MEMS sensors only. Determination of P and S wave arrival times that are used during the evaluation of tremors’ energy and location can be achieved more efficiently with the use of moderate and weak motion velocity sensors.
In view of the above, it may be concluded that MEMS-based sensors are suitable for underground monitoring of strong-motion records and may be successfully implemented for regular use in monitoring of near-field blasting in terms of their effectiveness.
6. Conclusions
Within this paper, the usefulness of triaxial MEMS-based sensors for regular seismicity monitoring in underground conditions was discussed and verified based on continuous measurements in a deep underground copper mine. During the preliminary tests, the ground motion acceleration induced by 10 multi-face blasting events was recorded. Based on analysis of gathered data, it was concluded that MEMS-based accelerometers may be successfully implemented for regular monitoring of near-field strong ground motion. Furthermore, MEMS accelerometers, apart from their small size and weight, are robust, which makes them suitable for use even in the harshest environmental conditions. In addition, MEMS sensors are very cost-effective, and, therefore, seismic networks may include many more sensors in comparison to standard seismic monitoring systems without increasing costs. Nevertheless, further investigations on MEMS systems for mining-induced seismicity monitoring should be carried out to verify their practical usefulness for monitoring high-energy tremors and blasting operations.
Author Contributions
Conceptualization, K.F., P.M., M.S. and L.S.; methodology, K.F., P.M. and L.S.; software, K.F. and M.S.; validation, K.F., L.S. and K.S.; formal analysis, P.M.; investigation, K.F., P.M., M.S. and L.S.; resources, K.F., L.S. and K.S.; data curation, K.F., P.M. and L.S.; writing—original draft preparation, K.F., P.M., M.S. and L.S.; writing—review and editing, K.F., P.M. and K.S.; visualization, K.F.; supervision, L.S.; project administration, P.M.; funding acquisition, P.M. All authors have read and agreed to the published version of the manuscript.
Funding
This research and the APC were prepared through the Horizon 2020 project funded by the European Union on “Next Generation Carbon Neutral Pilots for Smart Intelligent Mining Systems (NEXGEN-SIMS)” (Grant No. 101003591).
Data Availability Statement
The data presented in this study are available on request from the corresponding author.
Acknowledgments
The authors would like to thank KGHM Polska Miedź S.A. for providing necessary facilities and assistance during the field tests.
Conflicts of Interest
The authors declare no conflict of interest.
References
- Li, T.; Cai, M.F.; Cai, M. A Review of Mining-Induced Seismicity in China. Int. J. Rock Mech. Min. Sci. 2007, 44, 1149–1171. [Google Scholar] [CrossRef]
- Guha, S.K. Mining Induced Seismicity. In Induced Earthquakes; Springer: Dordrecht, The Netherlands, 2000; pp. 159–215. ISBN 9789048140091/9789401594523. [Google Scholar]
- Orlecka-Sikora, B.; Papadimitriou, E.E.; Kwiatek, G. A Study of the Interaction among Mining-Induced Seismic Events in the Legnica-Głogów Copper District, Poland. Acta Geophys. 2009, 57, 413–434. [Google Scholar] [CrossRef] [Green Version]
- Ortlepp, W. RaSiM Comes of Age—A Review of the Contribution to the Understanding and Control of Mine Rockbursts. In Proceedings of the Sixth International Symposium on Rockburst and Seismicity in Mines Proceedings, Perth, Australia, 9–11 March 2005; Australian Centre for Geomechanics: Perth, WA, Australia, 2005; pp. 3–20. [Google Scholar]
- Blake, W.; Hedley, D.G.F. Rockbursts Case Studies from North American Hard-Rock Mines; Society for Mining, Metallurgy, and Exploration: Littleton, CO, Australia, 2009; p. 128. [Google Scholar]
- Brown, E.T. Progress and Challenges in Some Areas of Deep Mining. Min. Technol. 2012, 121, 177–191. [Google Scholar] [CrossRef]
- Ptáček, J. Rockburst in Ostrava-Karvina Coalfield. Procedia Eng. 2017, 191, 1144–1151. [Google Scholar] [CrossRef]
- Pan, J.; Liu, S.; Wang, S.; Xia, Y. A New Theoretical View of Rockburst and Its Engineering Application. Adv. Civ. Eng. 2018, 2018, 4683457. [Google Scholar] [CrossRef]
- Keneti, A.; Sainsbury, B.-A. Review of Published Rockburst Events and Their Contributing Factors. Eng. Geol. 2018, 246, 361–373. [Google Scholar] [CrossRef]
- Wojtecki, Ł.; Gołda, I.; Mendecki, M.J. The Influence of Distant Coal Seam Edges on Seismic Hazard during Longwall Mining. J Seism. 2021, 25, 283–299. [Google Scholar] [CrossRef]
- Askaripour, M.; Saeidi, A.; Rouleau, A.; Mercier-Langevin, P. Rockburst in Underground Excavations: A Review of Mechanism, Classification, and Prediction Methods. Undergr. Space 2022, S2467967422000022. [Google Scholar] [CrossRef]
- Suorineni, F.T.; Hebblewhite, B.; Saydam, S. Geomechanics challenges of contemporary deep mining: A suggested model for increasing future mining safety and productivity. J. S. Afr. Inst. Min. Metall. 2014, 114, 1023–1032. [Google Scholar]
- Zhou, J.; Li, X.; Mitri, H.S. Evaluation Method of Rockburst: State-of-the-Art Literature Review. Tunn. Undergr. Space Technol. 2018, 81, 632–659. [Google Scholar] [CrossRef]
- Wu, M.; Ye, Y.; Wang, Q.; Hu, N. Development of Rockburst Research: A Comprehensive Review. Appl. Sci. 2022, 12, 974. [Google Scholar] [CrossRef]
- Grzebyk, W.; Stolecki, L. Volumetric Changes of Rock Massif Preceding Mining Seismic Events. Int. J. Rock Mech. Min. Sci. 2015, 80, 147–154. [Google Scholar] [CrossRef]
- Stolecki, L.; Grzebyk, W. The Velocity of Roof Deflection as an Indicator of Underground Workings Stability—Case Study from Polish Deep Copper Mines. Int. J. Rock Mech. Min. Sci. 2021, 143, 104717. [Google Scholar] [CrossRef]
- Stolecki, L.; Szczerbiński, K. Practical Use of Measuring the Deflection of Roof Layers in the Assessment of the Stability of Mining Excavations in the Polish Copper Ore Mine “Polkowice-Sieroszowice”. Mining 2021, 2, 13–31. [Google Scholar] [CrossRef]
- Fuławka, K.; Pytel, W.; Mertuszka, P. The Effect of Selected Rockburst Prevention Measures on Seismic Activity—Case Study from the Rudna Copper Mine. J. Sustain. Min. 2021, 17, 1–10. [Google Scholar] [CrossRef]
- Baranowski, P.; Damaziak, K.; Mazurkiewicz, Ł.; Mertuszka, P.; Pytel, W.; Małachowski, J.; Pałac-Walko, B.; Jones, T. Destress Blasting of Rock Mass: Multiscale Modelling and Simulation. Shock Vib. 2019, 2019, 1–11. [Google Scholar] [CrossRef] [Green Version]
- Pytel, W.; Mertuszka, P.; Fuławka, K.; Lurka, A.; Pałac-Walko, B. Resultant Axial Stresses in Instrumented Rockbolts Induced by Dynamic Effects Occurred Due to Multi-Face Blasting in the Working Areas. Tunn. Undergr. Space Technol. 2021, 116, 104088. [Google Scholar] [CrossRef]
- Vennes, I.; Mitri, H. Geomechanical Effects of Stress Shadow Created by Large-Scale Destress Blasting. J. Rock Mech. Geotech. Eng. 2017, 9, 1085–1093. [Google Scholar] [CrossRef]
- Drover, C.; Villaescusa, E. A Comparison of Seismic Response to Conventional and Face Destress Blasting during Deep Tunnel Development. J. Rock Mech. Geotech. Eng. 2019, 11, 965–978. [Google Scholar] [CrossRef]
- Mendecki, M.J.; Pakosz, R.; Wojtecki, Ł.; Zuberek, W.M. Spatiotemporal Analysis of Elastic and Inelastic Deformations in Roof-Rocks from Seismological Observations. Int. J. Min. Sci. Technol. 2021, 31, 241–251. [Google Scholar] [CrossRef]
- Baranowski, P.; Mazurkiewicz, Ł.; Małachowski, J.; Pytlik, M. Experimental Testing and Numerical Simulations of Blast-Induced Fracture of Dolomite Rock. Meccanica 2020, 55, 2337–2352. [Google Scholar] [CrossRef]
- Fuławka, K.; Mertuszka, P.; Pytel, W.; Szumny, M.; Jones, T. Seismic Evaluation of the Destress Blasting Efficiency. J. Rock Mech. Geotech. Eng. 2022, S1674775522000130. [Google Scholar] [CrossRef]
- Saiang, D.; Nordlund, E. Destressing and Preconditioning of Rock; Gallivare Hard Rock Research: Gallivare, Sweden, 2005; p. 120. [Google Scholar]
- Gogolewska, A.B.; Kowalczyk, M.M. Group Winning Blasting as a Measure to Mitigate Seismic Hazard in a Deep Copper Ore Mine, SW Poland. Min. Sci. 2020, 27, 155–164. [Google Scholar] [CrossRef]
- Sedlak, V. Energy evaluation of destress blasting. Acta Montan. Slovaca 1997, 2, 11–15. [Google Scholar]
- Sanchidrián, J.A.; Segarra, P.; López, L.K. Energy components in rock blasting. Int. J. Rock Mech. Min. Sci. 2007, 44, 130–147. [Google Scholar] [CrossRef]
- Kabiesz, J.; Lurka, A.; Drzewiecki, J. Selected Methods of Rock Structure Disintegration to Control Mining Hazards/Wybrane Metody Dezintegracji Struktury Skał Dla Zwalczania Zagrożeń Górniczych. Arch. Min. Sci. 2015, 60, 807–824. [Google Scholar] [CrossRef] [Green Version]
- Parida, A.; Mishra, M.K. Blast Vibration Analysis by Different Predictor Approaches-A Comparison. Procedia Earth Planet. Sci. 2015, 11, 337–345. [Google Scholar] [CrossRef] [Green Version]
- Mutke, G. Peak Particle Velocity as an Indicator of Dynamic Load Exerted on the Support of Underground Workings. Acta Geodyn. Et Geomater. 2016, 13, 367–378. [Google Scholar] [CrossRef] [Green Version]
- Wojtecki, Ł.; Kurzeja, J.; Knopik, M. The Influence of Mining Factors on Seismic Activity during Longwall Mining of a Coal Seam. Int. J. Min. Sci. Technol. 2021, 31, 429–437. [Google Scholar] [CrossRef]
- Barzegar, M.; Blanks, S.; Sainsbury, B.-A.; Timms, W. MEMS Technology and Applications in Geotechnical Monitoring: A Review. Meas. Sci. Technol. 2022, 33, 052001. [Google Scholar] [CrossRef]
- Fuławka, K.; Pytel, W.; Pałac-Walko, B. Near-Field Measurement of Six Degrees of Freedom Mining-Induced Tremors in Lower Silesian Copper Basin. Sensors 2020, 20, 6801. [Google Scholar] [CrossRef] [PubMed]
- Pytel, W.; Fuławka, K.; Mertuszka, P.; Pałac-Walko, B. Validation of Rayleigh Wave Theoretical Formulation with Single-Station Rotational Records of Mine Tremors in Lower Silesian Copper Basin. Sensors 2021, 21, 3566. [Google Scholar] [CrossRef] [PubMed]
- Hudyma, M.R.; Brummer, R.K. Seismic Monitoring In Mines—Design, Operation, Tricks and Traps. In Proceedings of the 1st Canada—U.S. Rock Mechanics Symposium, Vancouver, BC, Canada, 27–31 May 2007. [Google Scholar]
- D’Alessandro, A.; Scudero, S.; Vitale, G. A Review of the Capacitive MEMS for Seismology. Sensors 2019, 19, 3093. [Google Scholar] [CrossRef] [Green Version]
- Roy, S.; Mandal, S.; Hanumaiah, N. MEMS Accelerometer: From Engineering to Medicine. IEEE Potentials 2016, 35, 30–33. [Google Scholar] [CrossRef]
- Grankin, M.; Khavkina, E.; Ometov, A. Research of MEMS Accelerometers Features in Mobile Phone. In Proceedings of the 2012 12th Conference of Open Innovations Association (FRUCT), Oulu, Finland, 5–9 November 2012; IEEE: Piscataway, NJ, USA, 2012; pp. 1–6. [Google Scholar]
- Kong, Q.; Allen, R.M.; Kohler, M.D.; Heaton, T.H.; Bunn, J. Structural Health Monitoring of Buildings Using Smartphone Sensors. Seismol. Res. Lett. 2018, 89, 594–602. [Google Scholar] [CrossRef]
- Lin, J.-F.; Li, X.-Y.; Wang, J.; Wang, L.-X.; Hu, X.-X.; Liu, J.-X. Study of Building Safety Monitoring by Using Cost-Effective MEMS Accelerometers for Rapid After-Earthquake Assessment with Missing Data. Sensors 2021, 21, 7327. [Google Scholar] [CrossRef]
- Jin, L. Applications and Prospects of Mems Sensors in Automotive. J. Phys.: Conf. Ser. 2021, 1884, 012010. [Google Scholar] [CrossRef]
- Holland, A. Earthquake Data Recorded by the MEMS Accelerometer: Field Testing in Idaho. Seismol. Res. Lett. 2003, 74, 20–26. [Google Scholar] [CrossRef]
- Hu, X.-X.; Wang, X.-Z.; Chen, B.; Li, C.-H.; Tang, Y.-X.; Shen, X.-Y.; Zhong, Y.; Chen, Z.-L.; Teng, Y.-T. Improved Resolution and Cost Performance of Low-Cost MEMS Seismic Sensor through Parallel Acquisition. Sensors 2021, 21, 7970. [Google Scholar] [CrossRef]
- Datsyuk, Y.; Kuplovskyi, B. Use of MEMS Accelerometer ADXL355 in Microtremor Surveys. In Proceedings of the 2021 IEEE 12th International Conference on Electronics and Information Technologies (ELIT), Lviv, Ukraine, 19–21 May 2021; IEEE: Piscataway, NJ, USA, 2021; pp. 23–26. [Google Scholar]
- Analog Devices. Low Noise, Low Drift, Low Power MEMS Accelerometer ADXL354/ADXK355 Datasheet. 2022. Available online: https://www.analog.com (accessed on 10 March 2022).
- Sensonics. 2022. Available online: https://www.sensonics.co.uk (accessed on 10 March 2022).
- NI. 2022. Available online: https://zone.ni.com (accessed on 10 March 2022).
- Jana, N.; Singh, C.; Biswas, R.; Grewal, N.; Singh, A. Seismic Noise Analysis of Broadband Stations in the Eastern Ghat Mobile Belt of India Using Power Spectral Density. Geomat. Nat. Hazards Risk 2017, 8, 1622–1630. [Google Scholar] [CrossRef]
- McNamara, D.E.; Hutt, C.R.; Gee, L.S.; Benz, H.M.; Buland, R.P. A Method to Establish Seismic Noise Baselines for Automated Station Assessment. Seismol. Res. Lett. 2009, 80, 628–637. [Google Scholar] [CrossRef] [Green Version]
- Lurka, A. Location of High Seismic Activity Zones and Seismic Hazard Assessment in Zabrze Bielszowice Coal Mine Using Passive Tomography. J. China Univ. Min. Technol. 2008, 18, 177–181. [Google Scholar] [CrossRef]
| Publisher’s Note: MDPI stays neutral with regard to jurisdictional claims in published maps and institutional affiliations. |
© 2022 by the authors. Licensee MDPI, Basel, Switzerland. This article is an open access article distributed under the terms and conditions of the Creative Commons Attribution (CC BY) license (https://creativecommons.org/licenses/by/4.0/).


 ,
, 


