Article

Geochemical Assessment of Gypsum Scale Formation in the Hydrated Lime Neutralization Facility of the Daedeok Mine, South Korea

1
Geo-Environment Research Center, Korea Institute of Geoscience and Mineral Resources, Gwahak-ro 124, Yuseong-gu, Daejeon 34132, Korea
2
Technology Research & Development Institute, Korea Mine Rehabilitation & Mineral Resources Corp (KOMIR), Hyeoksin-ro 199, Wonju 26464, Korea
3
Department of Earth Resources and Environmental Engineering, Hanyang University, Wangsimni-ro 222, Seongdong-gu, Seoul 04763, Korea
*
Author to whom correspondence should be addressed.
Minerals 2022, 12(5), 574; https://doi.org/10.3390/min12050574
Submission received: 19 February 2022 / Revised: 22 April 2022 / Accepted: 26 April 2022 / Published: 2 May 2022

Abstract

:
Scale is widely observed in the hydrated lime mine drainage treatment plant of the Daedeok Mine in South Korea. In order to understand the environment in terms of the formation of scale minerals, scale and water were collected from the AMD treatment facility and analyzed. In addition, the saturation index was calculated based on geochemical modeling to predict the minerals that could be produced in the AMD treatment facility, and the results were then compared with an analysis of onsite scale minerals. Furthermore, the onsite mine drainage was neutralized from pH 3 to pH 9 in the laboratory, and the precipitates produced were identified. The changes in the Ca2+ and SO42− concentrations were also identified over time for each pH. The results of geochemical modeling predicted the possible precipitation of gypsum, anhydrite, and bassanite after AMD neutralization. Scanning electron microscope/energy dispersive X-ray spectroscopy (SEM/EDS) analysis results showed that the main mineral in scale formed at the AMD treatment facility was gypsum, produced by the reaction of SO42− and Ca2+ from lime during AMD. The laboratory neutralization experiment showed that gypsum was produced in all neutralization ranges from pH 3 to pH 9, and the higher the neutralization pH, the greater the amount of gypsum produced. It was demonstrated that simulated amounts of 2 g/L and 7 g/L gypsum at pH 5 and 9 were well matched with the experimental results. Iron (Fe), a major pollutant in the mine drainage system, was rapidly precipitated in the form of iron hydroxides after neutralization. As gypsum is produced slowly and continuously for a long period of time, it results in the growth of scale throughout the flow path. As a method of minimizing gypsum production in the AMD treatment facility using hydrated lime, it is recommended that the facility should be operated at the lowest pH possible, which will also enable the removal of major pollutants, such as iron and aluminum.

1. Introduction

Acid mine drainage (AMD) neutralization facilities mainly comprise a neutralization reactor, sedimentation basin, and a sludge treatment facility. Various types of AMD treatment facilities have been designed for use with mine drainage discharge sites, because the field conditions (such as the flow rate, water quality, sludge production, and usable land type) differ between sites [1,2] However, inexpensive hydrated lime is used in many countries to neutralize AMD and remove dissolved metals, such as Fe, Al3+, and Mn2+ [3]. The principle of the hydrated lime neutralization process is to remove dissolved metal components (Me2+) as insoluble metal hydroxides by increasing the pH of the AMD by following Equations (1) and (2),
Ca (OH)2 + 2H+ → Ca2+ + 2H2O
Ca (OH)2 + Me2+ → Me (OH)2 + Ca2+
Mine drainage contains sulfate ions in quantities ranging from tens of milligrams per liter to several grams per liter, and if sulfate exists in high concentrations, the Ca2+ from the hydrated lime may react with the sulfate ions during the neutralization process. This reaction produces gypsum (CaSO4·2H2O) via Equation (3),
Ca2+ + SO42− + 2H2O → CaSO4·2H2O
in addition to bassanite (2CaSO4·H2O), anhydrite (CaSO4), alunite (KAl3(SO4)2(OH)6, and jarosite (KFe3(SO4)2(OH)6 [4,5,6].
Among these minerals, gypsum is the most commonly produced, and it results in the development of scale within the system [2,7]. The solubility of gypsum is affected by the solution composition or ionic strength, but the equilibrium concentration of SO42− is in the range of 1500–2000 mg/L when in an equilibrium state [8,9,10]. Therefore, if the concentration of sulfate ions in the mine drainage system is higher than the equilibrium concentration, gypsum is formed and scale develops. Based on this principle, lime is used to remove sulfate [11,12,13]. If gypsum is produced in an AMD treatment facility, the following problems may arise [14]: first, hard gypsum scale is produced. Scale is difficult to remove from solid surfaces, and it affects components, such as pipes, overflow weirs, and pH probes; therefore, the components require inspection. Second, the amount of sludge treated is increased when gypsum is added to metallic sludge that contains components such as Fe and Al3+. Third, some of the lime dosage applied may be used in gypsum production, which increases the reagent cost.
In the 1990s, about 340 coal mines were closed due to economic decline in South Korea. After the closure of coal mines, AMD began to flow out of many coal mining areas. Mine drainage of about 10,000 tons/day or more was treated by active treatment, and a small amount of mine drainage of 1000 tons/day or less was treated by passive treatment. In the former case, lime neutralization facilities played a major role in improving the water quality. The latter case was designed according to the water quality, but the Successive Alkaline Production System (SAPS), setting pond, and oxic wetland were placed and used for AMD treatment [15,16]. However, in the case of AMD with high acidity and high iron and aluminum concentrations, the efficiency of water treatment decreased in many passive treatment facilities over time [17]. In recent years, even when the flow rate is low, if the contamination level is high, water treatment facilities that use neutralizers instead of passive treatment are designed, and facilities with poor performance compared with passive treatment facilities built in the past are treated in a semiactive manner. Therefore, research on water treatment in semiactive treatment plants is needed for future passive treatment improvement projects.
The average mine drainage flow rate within the Daedeok Mine in Wanju-gun, South Korea is less than 50 m3/d. Although this rate is low, the flow is contaminated with Fe (1240 mg/L), Al3+ (418 mg/L), Mn2+ (20 mg/L), and SO42− (5870 mg/L), which pollute agricultural waterways. A water treatment facility has been installed to prevent water pollution from the above metal components, and it comprises a dosing tank, neutralization tank, and two sedimentation basins. By placing hydrogen peroxide in the raw water, iron (II) is oxidized, after which 20% hydrated lime is used to neutralize the water to pH 8.5. After the neutralized water flows into the rectangular sedimentation basin, metal hydroxide flocs pile up while the overlying water is finally discharged. When the amount of piled up sludge in the sedimentation basin reaches a certain height, the flow path of the neutralized water, which has a high concentration of suspended solids, is diverted to another sedimentation basin, and the accumulated sludge in the first basin is removed. This facility is an unmanned system, in which 5% hydrogen peroxide and 20% hydrated lime are automatically input. Personnel periodically visit the facility to manage equipment, such as the chemical dosing system and the pH electrodes. However, three months after the water treatment facility became operational, white scale was observed on the pH electrodes at the final discharging point and on the walls of the sedimentation basins in contact with the overlying water. Furthermore, a lot of red sludge was observed inside the sedimentation basins. The white scale deposits are expected to be the main obstacle to the future effective maintenance and management of the facility, and it is thus necessary to understand the conditions in which they are produced.
In this study, therefore, a mineral analysis of the white scale observed in the on-site treatment facility was conducted to determine the composition of the scale minerals. The water quality in the treatment facility was also analyzed to examine the association with mineral production due to changes in water quality during the neutralization process. A geochemical model was then used to predict the minerals precipitated according to the hydrated lime dosage, and the model results were then compared with the actual onsite scale minerals. Furthermore, the onsite mine drainage was neutralized in a laboratory and the concentration of scale minerals produced over time was recorded. The quality of the water when hydrated lime was added was then simulated to quantify the amount of gypsum produced, and the results were compared with those of the neutralization experiment to predict the amount of gypsum produced according to the neutralization pH. A strategy for reducing the scale was then proposed after conducting a comprehensive analysis of the onsite survey, indoor neutralization experiment, and geochemical modeling results.

2. Methods

2.1. Onsite Survey and Neutralization Experiments

In February 2020, onsite measurements of pH (HACH pH meter: HQ40d) were obtained in influent water, neutralized water, and the final effluent water at the Daedeok Mine treatment facility, and three samples of each water type were collected to conduct water quality analyses (Figure 1). In this respect, the samples were filtered using a 0.45 μm filter, and concentrated nitric acid was then added to samples prior to cation analysis. The concentrations of K+, Na+, Ca2+, Mg2+, Fe, Mn2+, and Al3+ were analyzed using inductively coupled plasma-optical emission spectrometry (ICP-OES) (Thermo Scientific ICS-6000, USA), and the F, Cl, NO3, and SO42− components were analyzed using ion chromatography (IC) (Dionex ICS-6000, USA). White scale was collected from within the onsite sedimentation basin and at the final discharge point (Figure 1b and c, respectively), and its texture and major components were analyzed using a scanning electron microscope/energy dispersive spectroscopy (SEM/EDS) device (Merlin Compact, Carl Zeiss, Germany). In June 2020, onsite effluent samples were placed in plastic containers and transported to a laboratory to conduct the neutralization experiments.
The aim of the neutralization experiments was to observe the concentration changes in the Ca2+ and SO42− components and the production of white scale over time for each neutralization pH level. While stirring at 250 rpm, 1500 mL of the mine drainage water was neutralized to pH 3, 4, 5, 7, and 9, respectively, using 20% liquid hydrated lime. After 0, 0.5, 1, 2, 4, 6, and 24 h had elapsed, water was collected from each pH sample, and the Ca2+ and SO42− components were analyzed. After 2 h, a beaker was used to move 1000 mL of the overlying water to an Imhoff cone, and the amount of white precipitate produced was analyzed. While the white precipitate was continuously generated, the bottom of the neutralizing beaker was accumulating red iron precipitate that had previously precipitated, which became an obstacle to observing the occurrence of the white precipitate. In order to easily observe the amount of only the white precipitate generated in the neutralized water for 24 h, the overlying water was separated and observed in a separate container.

2.2. Geochemical Modeling and Simulation

Geochemical modeling can be used to predict mineral production [18,19,20,21,22]. In this study, the saturation index (SI) was calculated using the SpecE8 module of the Geochemist’s Workbench (GWB). The SI is defined as follows,
SI =   logQ / Ksp
where Q is the ion activity product and Ksp is the solubility.
If the SI value of a particular mineral is 0, the state is saturated; a positive SI implies that the solution is oversaturated, and a negative SI implies that the state is nonsaturated (Equation (4)). Oversaturated and saturated states indicate that a certain mineral can be precipitated thermodynamically. The modelling incorporated the water quality results (Figure 2) of the raw water, neutralized water, and final effluent obtained from the onsite AMD treatment, but the main minerals of interest were limited to the Ca sulfate minerals. The React module of GWB was used to predict the concentration changes in the Ca2+ and SO42− components and the resulting amount of Ca sulfate produced. In this respect, the onsite water quality (Ca2+ 438 mg/L, SO42− 5870 mg/L, pH 2.8) was input. Reflecting the concentration of 20% hydrated lime used at the site, 20.88 g of Ca (OH)2 was applied to 1 kg of mine drainage in the reactant. The concentration changes in Ca2+ and SO42− and the amount of gypsum produced were simulated for each pH level.

3. Results and Discussion

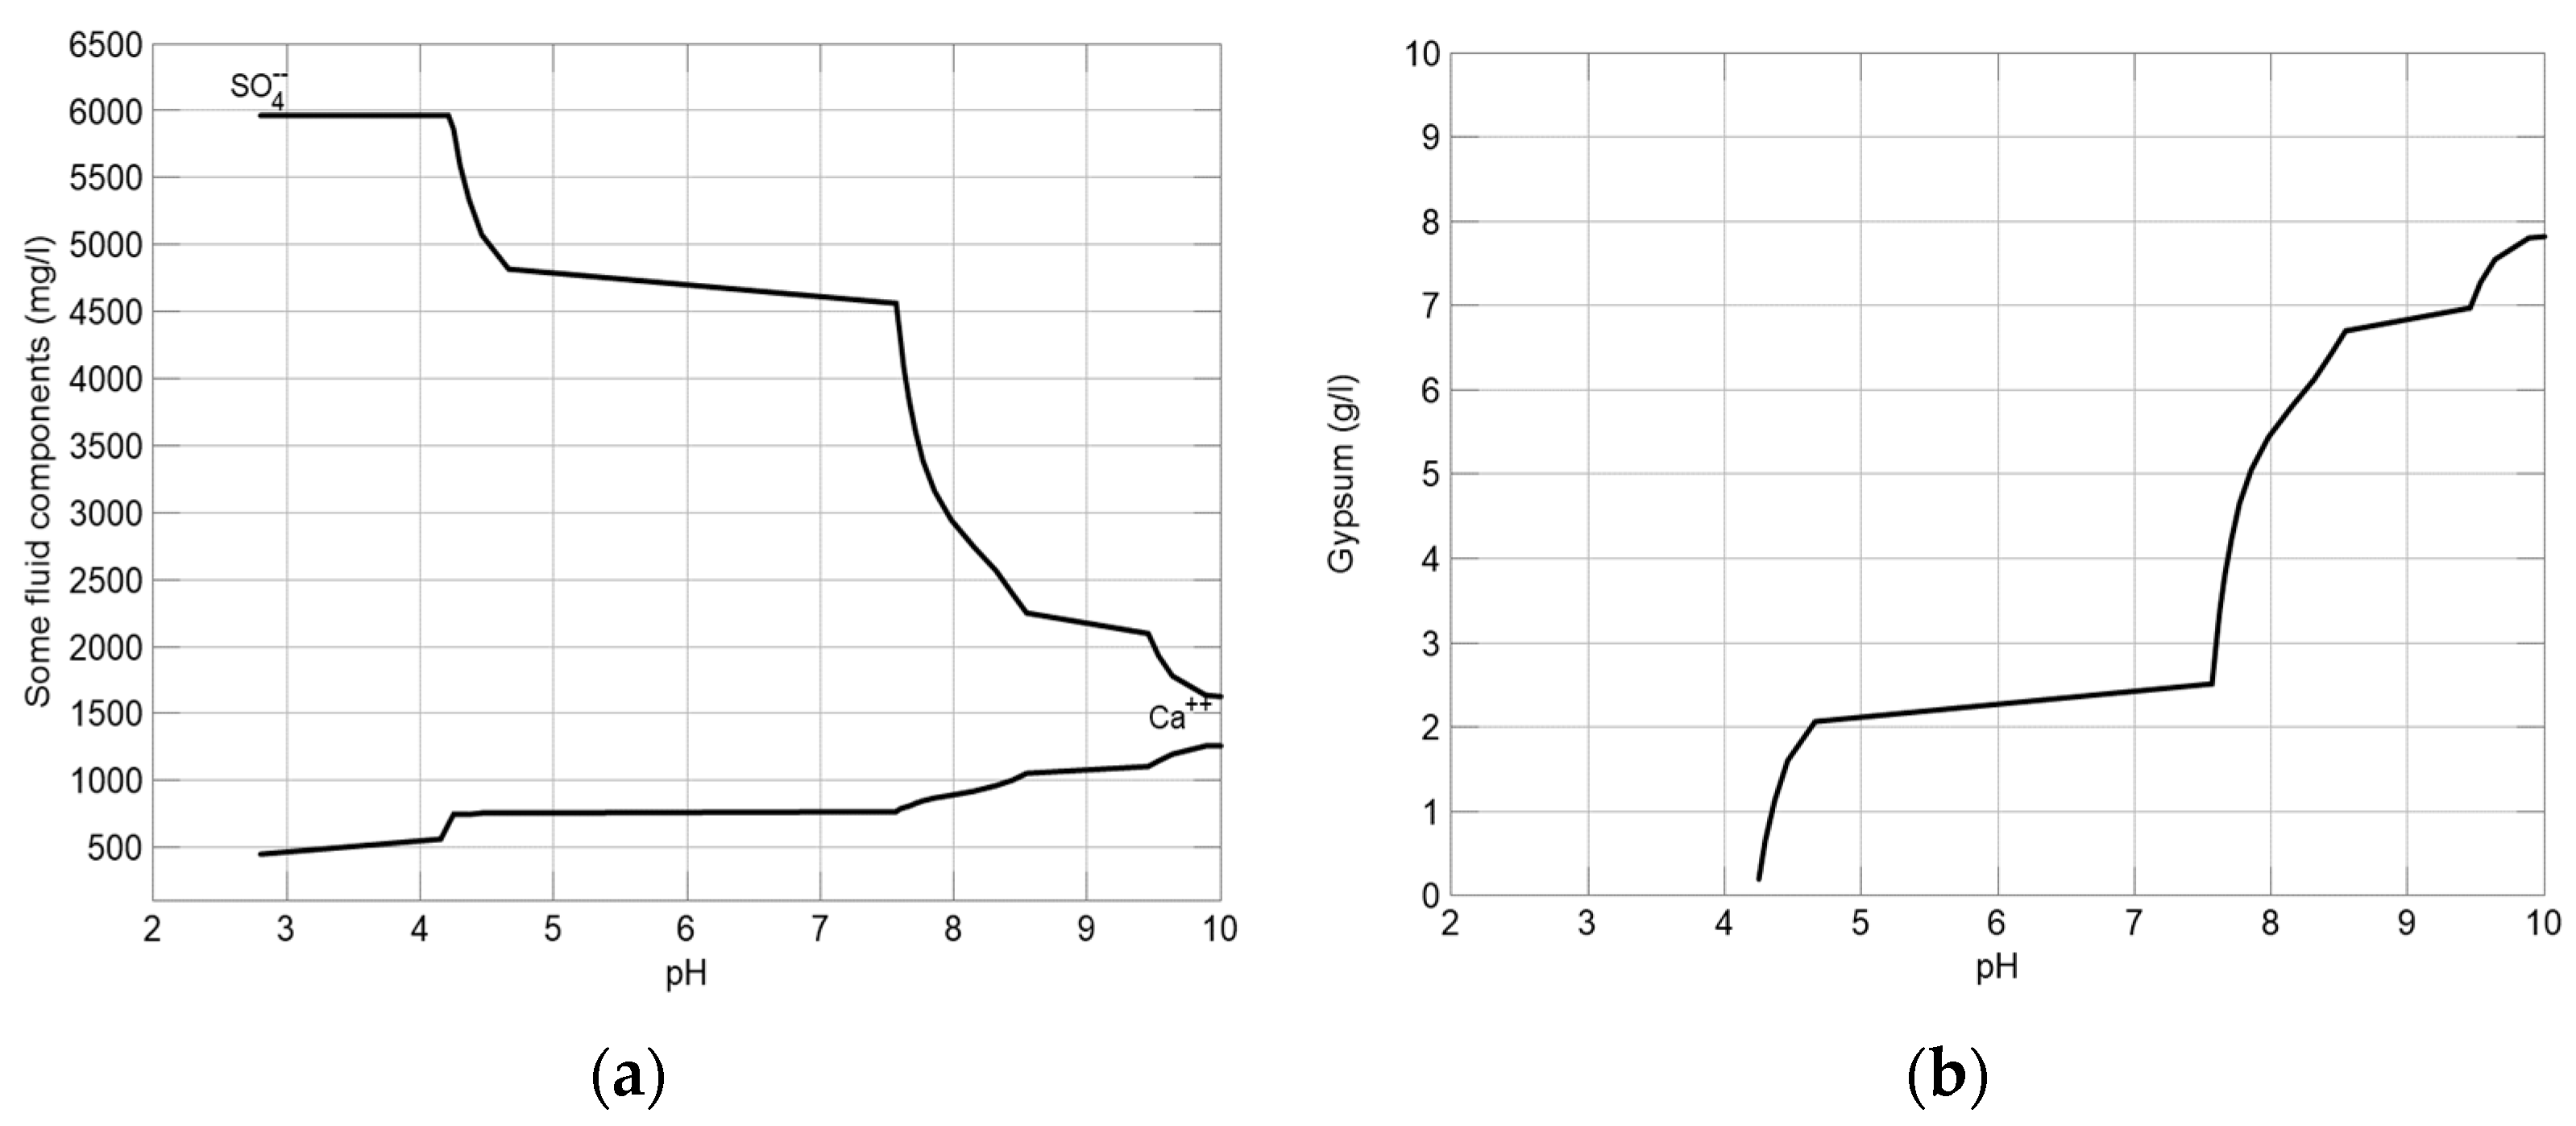
3.1. Prediction of Water Quality Changes and Mineral Production in the Lime Neutralization Facility

The water quality results showed that the pH of the raw water was 2.8, and then it increased to 8.37 in the neutralization reactor and then subsequently decreased to 5.57 at the final effluent point (Figure 2). The decrease in pH of neutralized water in the sediment basin could decrease due to hydrogen ion release from CaCO3(s) formation induced by CO2 dissolution, in accordance with Equation (5),
CO2(g) + Ca2+ + H2O → CaCO3(s) + 2H+
With the addition of hydrated lime, more Ca (OH)2 was supplied into the reactor. For Mg2+, the concentration of 245 mg/L decreased to 122 mg/L at the final effluent point, indicating that precipitation of dissolved Mg2+ ions to Mg(OH)2 occurred by consuming OH [5], as shown by Equation (6),
MgSO4 + Ca (OH)2 + H2O → Mg (OH)2 + CaSO4 H2O
The K+ component concentration was 13 mg/L in raw water and 3 mg/L at the final effluent point. The Na+ component showed almost no concentration change. The sulfate ion concentration was 5870 mg/L in the raw water, but it decreased to 2560 mg/L at the final effluent point, because the SO42− component reacted with the Ca2+ component to produce Ca sulfate minerals [23,24]. (Equation (3)). As the AMD was neutralized, the concentrations of Ca2+ and SO42− increased and decreased, respectively. The water quality data shown in Figure 2 were thus used to calculate the SI of the minerals in the hydrated lime neutralization process, with a particular focus on those related to the SO42− ions (Figure 3).
The geochemical modelling results showed an increase in the SI of the Ca sulfate minerals in the following order: gypsum (CaSO4H2O) > anhydrite (CaSO4) > bassanite (2CaSO4 H2O). It is expected that gypsum minerals are produced thermodynamically when the mine drainage is neutralized with hydrated lime.

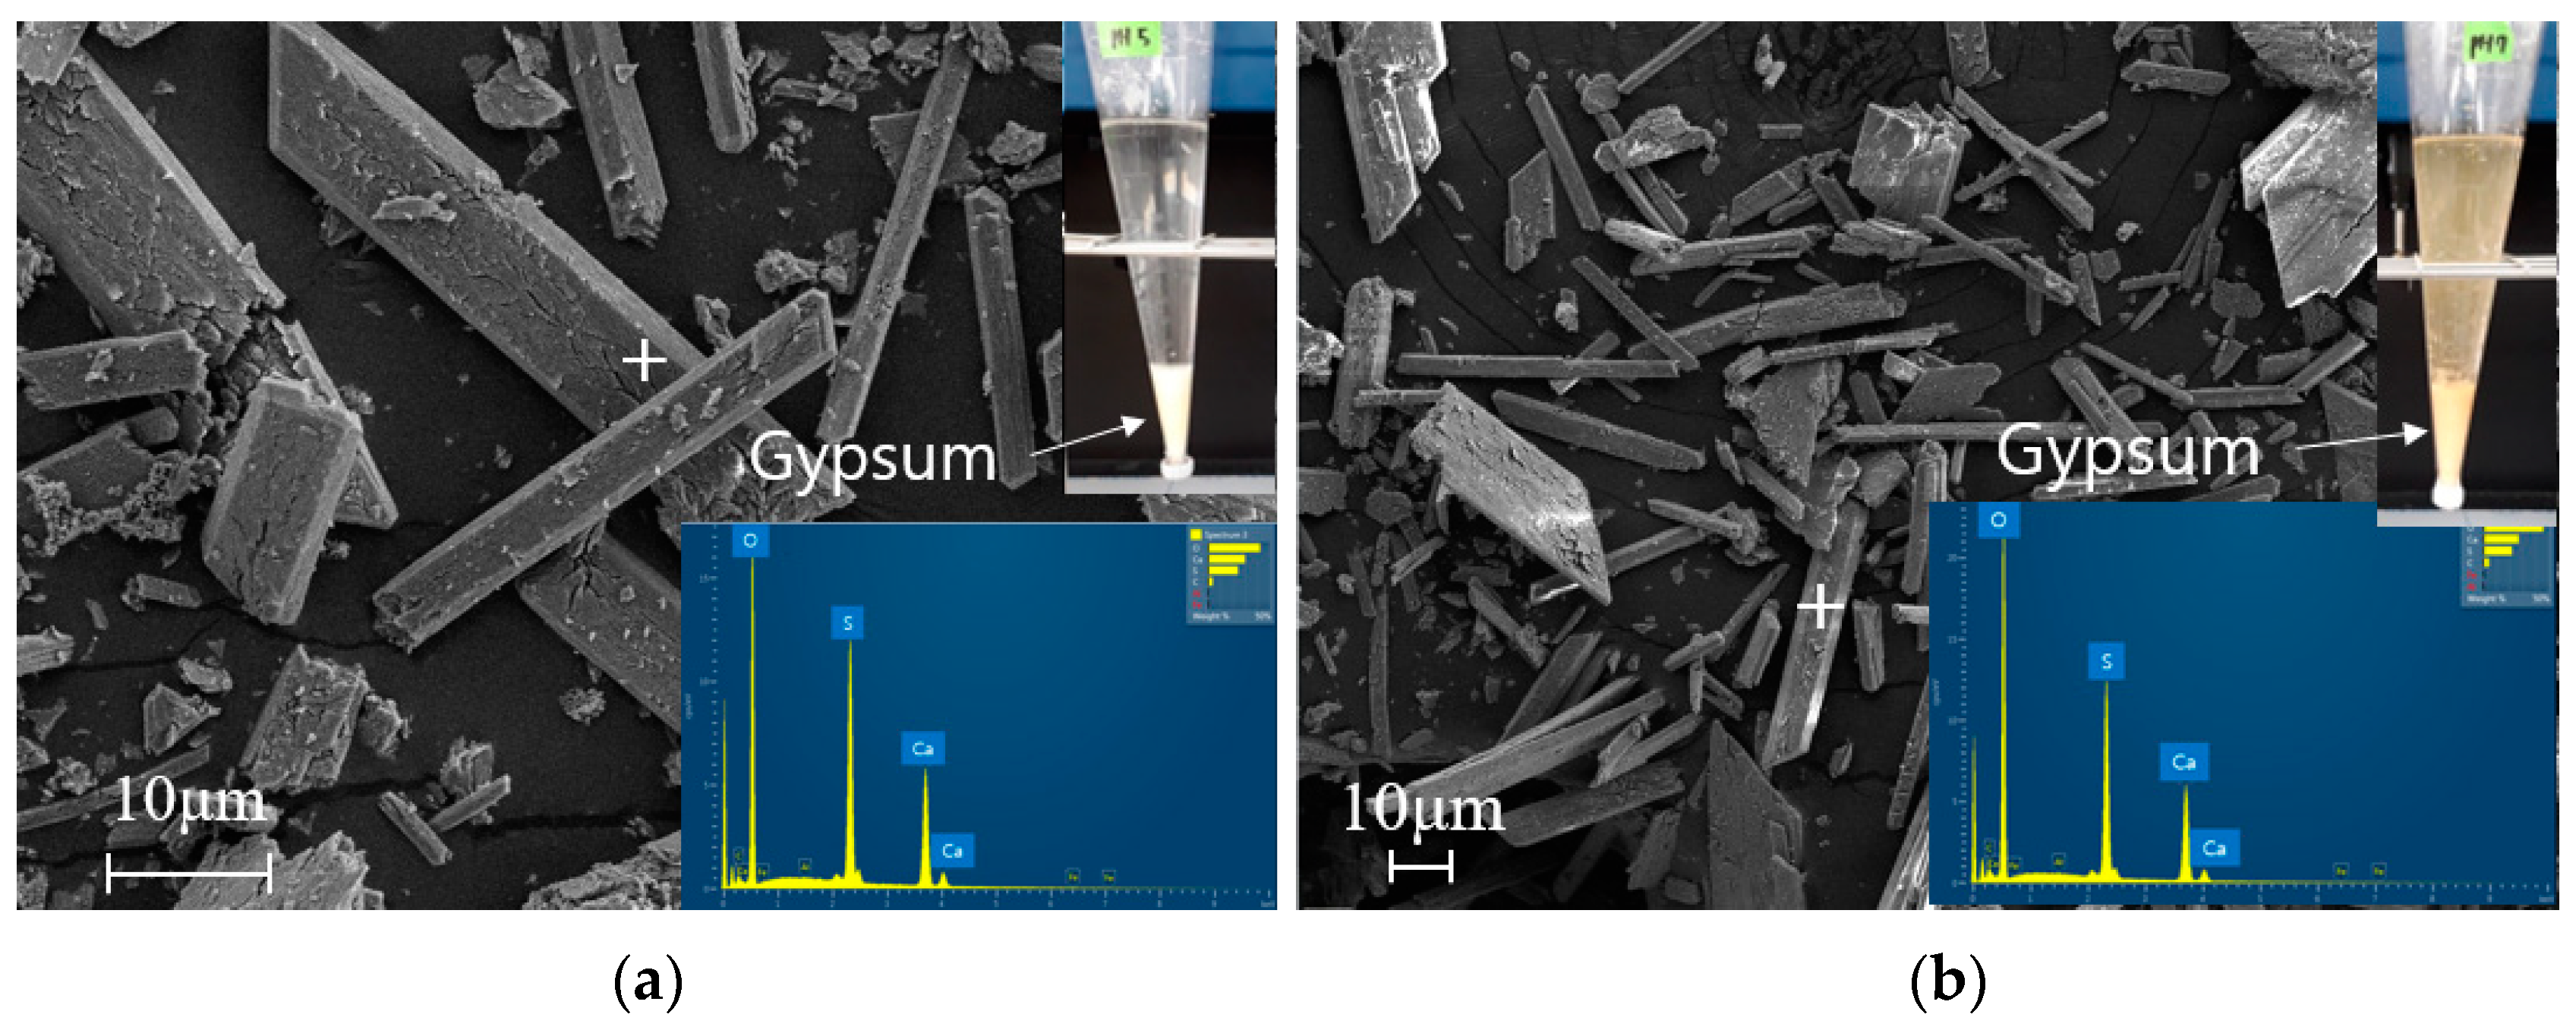
3.2. Identification of Scale Minerals within the Lime Neutralization Facility

Scale was observed on the pH electrodes at the effluent point and on the concrete walls of the onsite sedimentation basins that were in contact with the neutralized water (Figure 4a,b). An SEM image of the scale on the pH meter showed the presence of gypsum with a rod shape and the following composition: O (62.41 wt.%), S (26.02 wt.%), and Ca (11.57 wt.%) (Figure 4c)). The XRD analysis of the same sample also identified the dominant formation of gypsum [25]. Gypsum is well known as a scale-causing substance, and its production is difficult to suppress, even when the pH is adjusted [23,26]. Gypsum scale was observed throughout the whole sedimentation basin (including the final effluent point) during the onsite survey. However, Fe and Al hydroxide sediments were discovered around the front of the basin (Figure 4a,b)). These phenomena could result from a difference in the rate of precipitation between Ca2+ ions and Fe/Al3+ ions under alkaline conditions. In other words, Fe and Al3+ would precipitate quickly as hydroxide forms after neutralization. Subsequently, the solids might pile up from the floor at the front of the sedimentation basin, which is evidence of the relatively rapid precipitation of Fe and Al3+ under the present conditions. However, Ca2+-derived gypsum settled throughout the entire sedimentation basin when neutralized water continuously flowed into the basin, and scale developed on the walls and on the surface of the pH electrodes. This gap in the precipitation rate was also confirmed when the AMD was neutralized in a lab-scale experiment: the Fe and Al hydroxides settled on the floor of the beaker within 1 h, but gypsum was formed slowly over 24 h. As a result, it is estimated that the precipitation rate of dissolved ions is a key factor determining the dispersion degree of precipitates in the neutralization process.

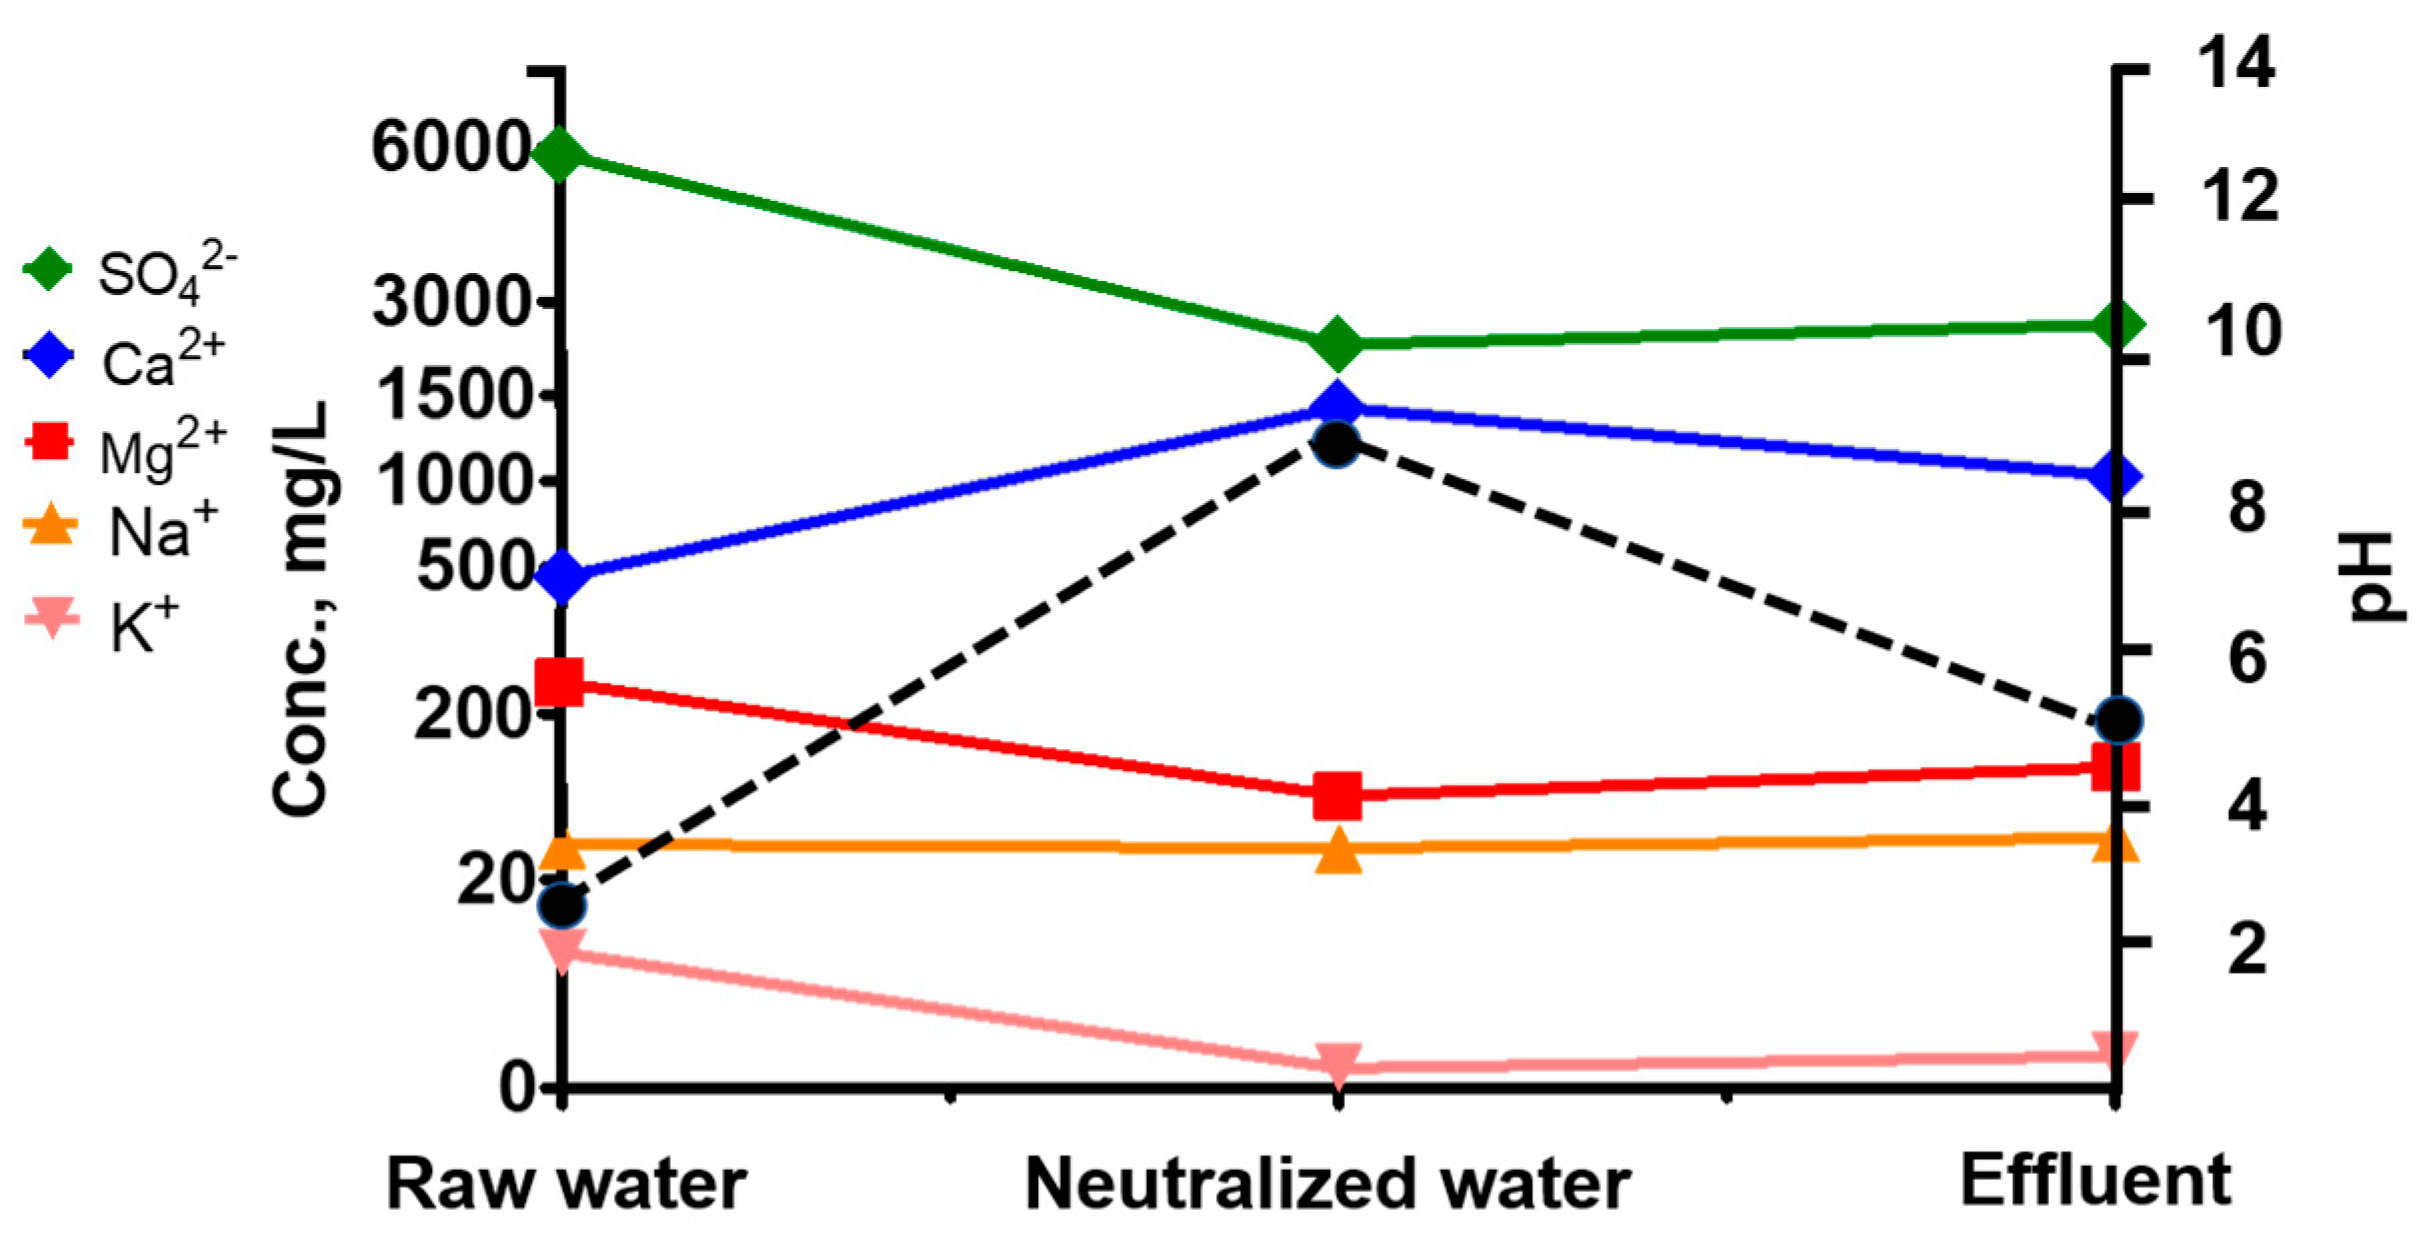
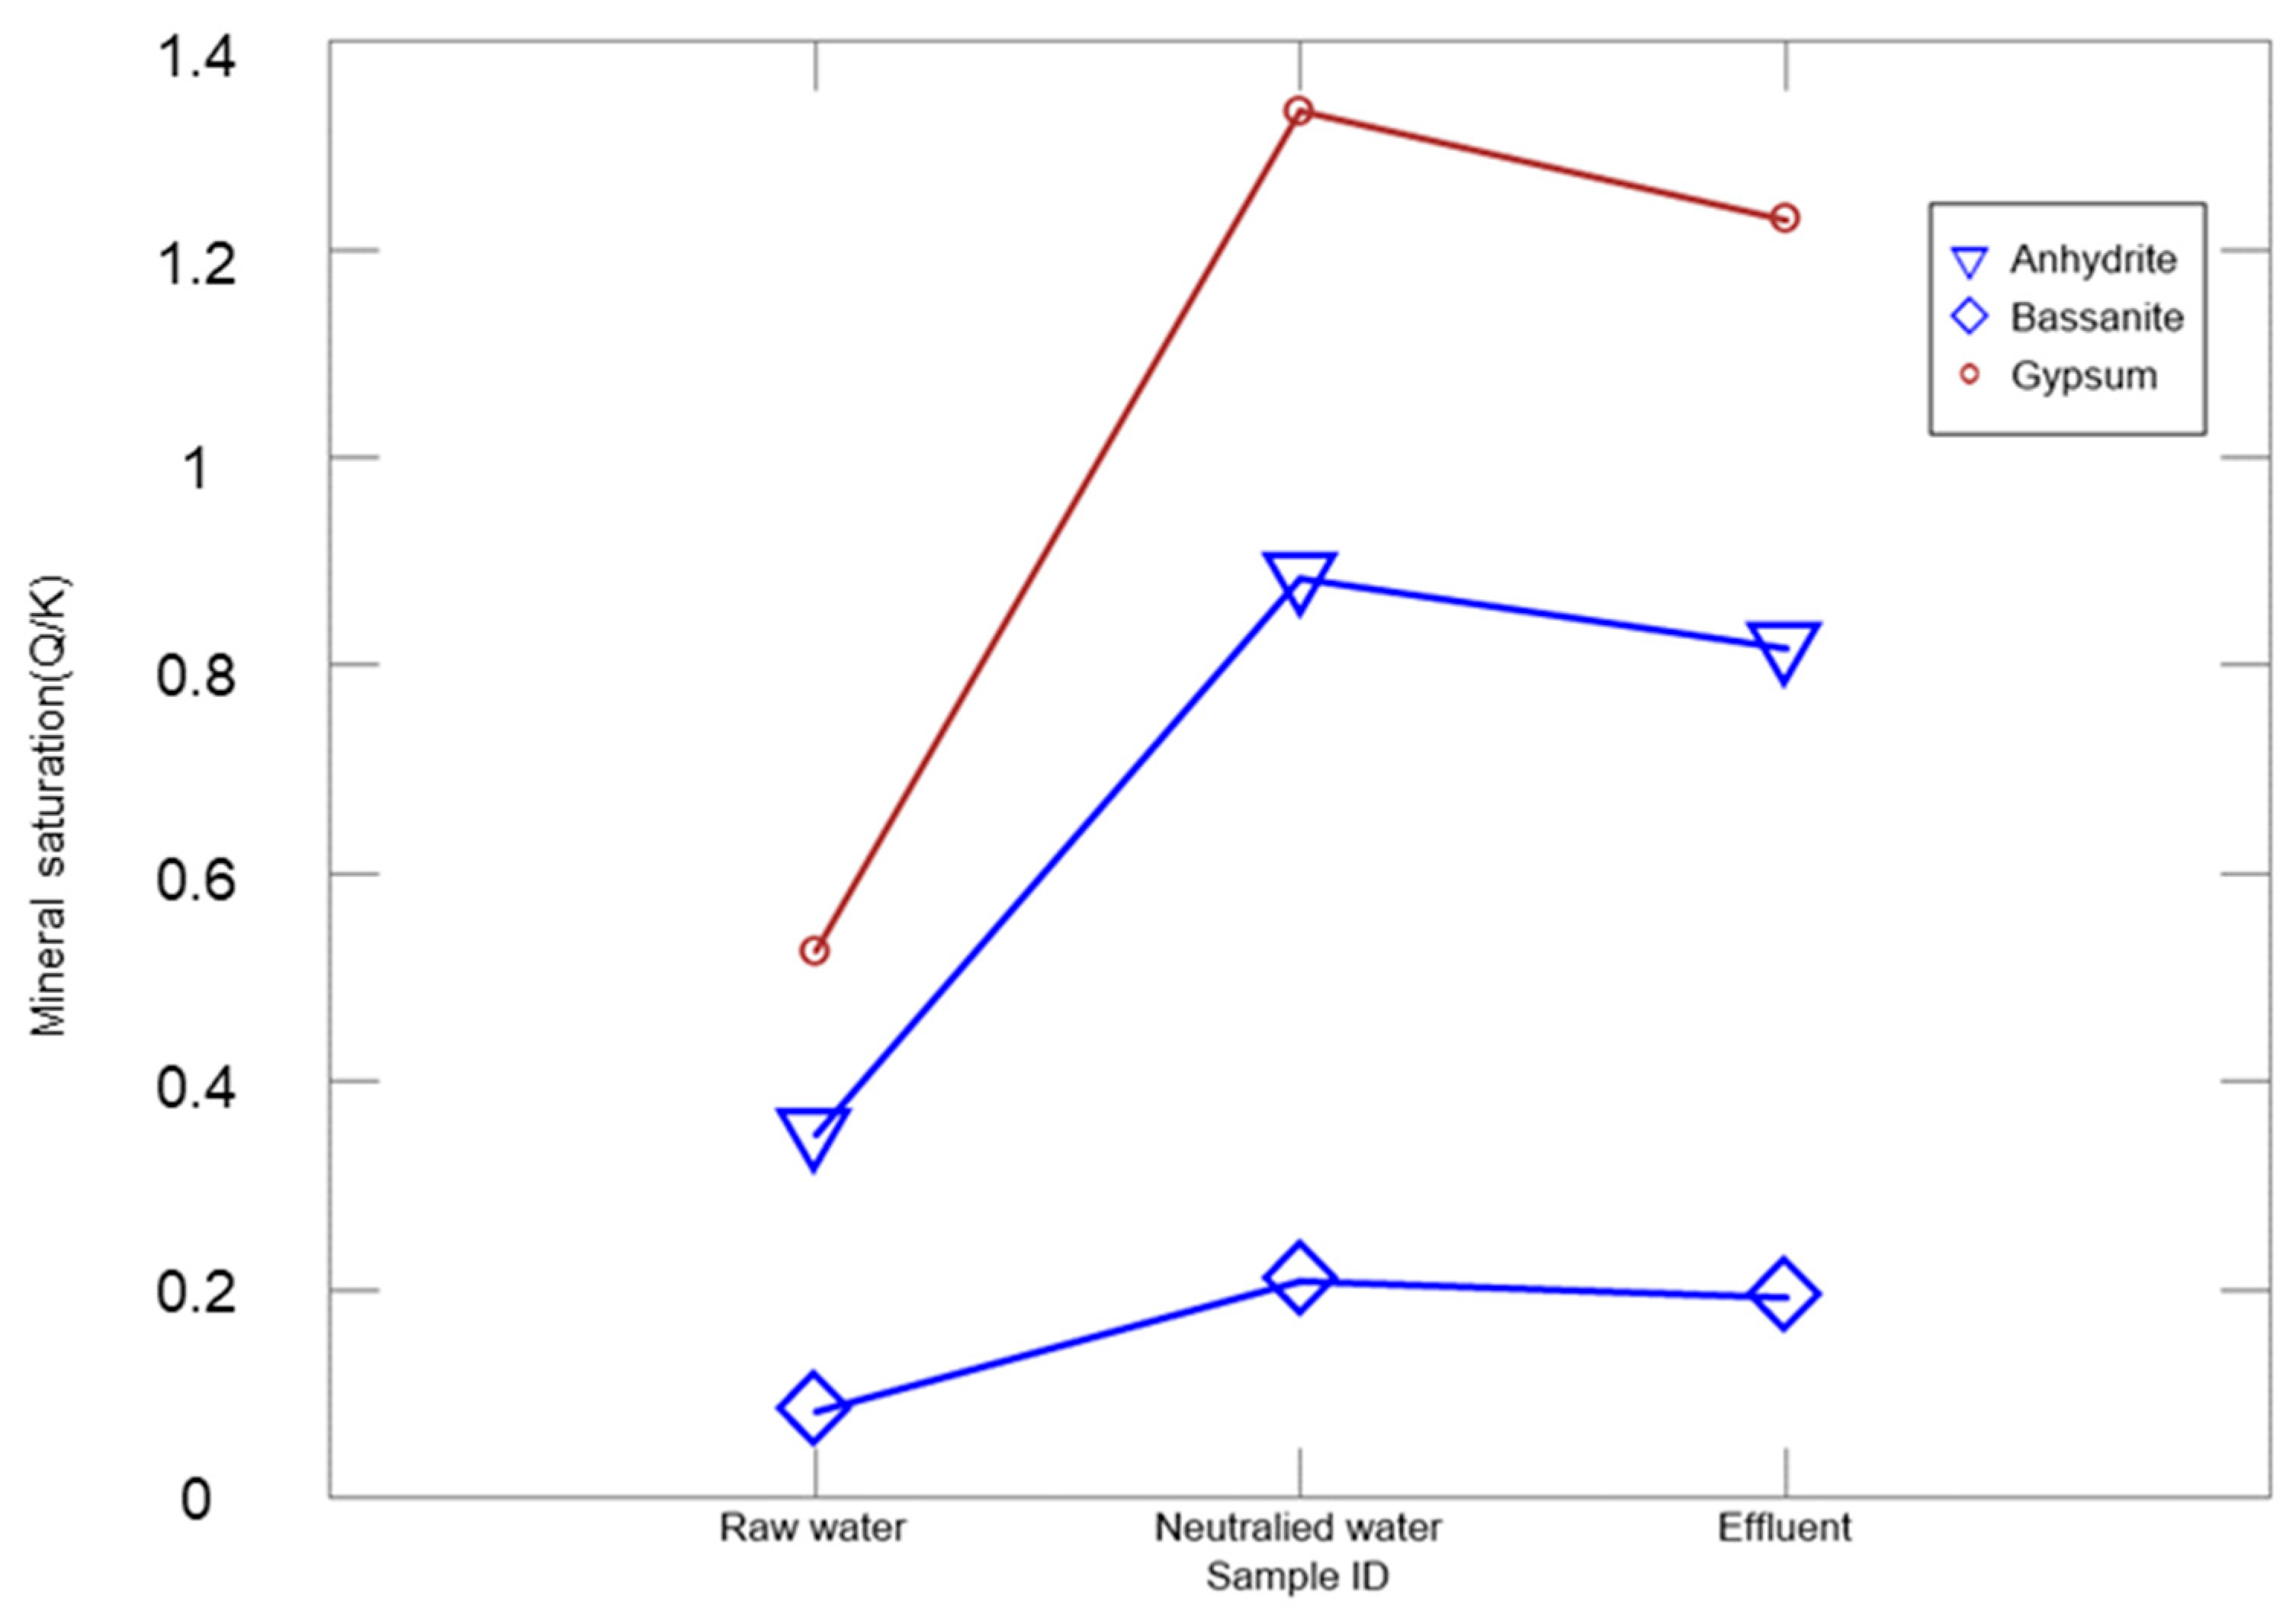
3.3. Changes in Ca/SO4 Concentrations and Gypsum Production during Simulation and Neutralization Experiments

A geochemical modelling method was used to simulate the concentration of minerals produced based on the reaction between the AMD solution and hydrated lime [18]. The simulation results for the neutralization of onsite mine drainage with 20% hydrated lime showed an increase in Ca2+ and a decrease in SO42− (Figure 5a). At pH 9, the Ca2+ content increased to more than 1000 mg/L, and the SO42− component decreased to approximately 2000 mg/L. The concentrations of two components changed dramatically within the pH 4–5 and pH 7.5–8.5 ranges, where approximately 2 g/L and 2.5 < 7 g/L of gypsum, respectively, were produced (Figure 5b). As the neutralization was set to pH 8.5 at the onsite water treatment facility, the simulation predicted that approximately 6.5 g/L of gypsum would be produced. It can be predicted that a large amount of gypsum would inevitably be generated at the targeted pH of neutralized water (pH 8.5) in the Daedeok coal mine facility.
Figure 6 shows the concentration levels of Ca2+/SO42− classified by each pH group obtained from the neutralization experiments. The data for Ca2+ and SO42− were relatively clumped together at pH 3 and pH 4, but they were scattered widely at pH 5, pH 7, and pH 9, showing that the concentrations differed according to the pH value. Path A in Figure 6 shows that as the pH increased, the concentration of Ca2+ increased, while that of SO42− decreased. When neutralization of the AMD was increased to pH 5, differences in concentrations occurred over time, as shown by Path B. While the sulfate concentration was maintained at 2000 ± 500 mg/L, which is the equilibrium concentration level for gypsum, the Ca2+ component decreased (Figure 6). Gypsum was produced for 24 h, and changes in the concentrations of Ca2+ and SO42− were observed over 24 h [27]. The evolutionary processes of the minerals within the water are shown in Figure 6, where it is evident that the water was initially oversaturated with gypsum, but it then became saturated over time. However, this event was not confirmed in the simulation results [28].

3.4. Amount of Gypsum Produced in Neutralization Experiments

When the mine drainage was neutralized in a laboratory, a white substance was continuously produced in the overlying water over 24 h. The precipitates collected at pH 5 and pH 9 were analyzed using SEM/EDS, and the results confirmed that they had long shapes (a typical characteristic of gypsum) and that the main components were O, S, and Ca (Figure 7). A small amount of gypsum was observed when the pH of the AMD was 3, although it was difficult to distinguish the particles of gypsum, because tiny iron flocs were highly suspended. However, at pH levels of 4 and higher, the precipitation of gypsum in the Imhoff cone could be observed with the naked eye. The volume of gypsum was measured at pH 5 and 9, respectively, and the results showed that the amount of gypsum in 1 L (volume) of neutralized water corresponded to 2.2% and 3% (Figure 7) of the total contents and weighed 1.4 g and 3.0 g, respectively. After neutralization for 24 h, the gypsum incorporated into the metal sludge and the gypsum attached to the inner wall of the Imhoff cone could not be considered in the measurements; however, the actual amount of gypsum produced was greater than the amount measured. The simulation results (shown in Figure 5b) predicted that gypsum amounts of approximately 2 g/L and 7 g/L would be produced at pH 5 and 9, respectively. Therefore, both the neutralization experiment and the simulation showed identical results: gypsum was produced in the early stage of neutralization, and its volume increased as the pH increased.
The simulation results also showed that when neutralizing the pH to 7.5 or higher, the concentration of SO42− rapidly decreased and the amount of gypsum rapidly increased. As the pH of the onsite lime neutralization treatment facility is set at 8.5, it is necessary to lower the neutralization pH value to remove the dissolved metal ions (Total Fe or Al3+) in order to reduce the formation of gypsum.

4. Conclusions

The AMD treatment facility at Daedeok Mine in South Korea comprises a water collection tank, neutralization tanks, and sedimentation basins. After oxidizing iron (II) by injecting hydrogen peroxide, 20% hydrated lime is used to neutralize the water at pH 8.5 to remove Fe, Al3+, and Mn2+ (MIRECO, 2020). This facility is an unmanned water treatment facility that features real-time pH monitoring and the automatic injection of chemicals for neutralization. However, gypsum develops within the AMD treatment facility; this not only results in the development of scale, which is problematic for the pH monitoring system and other instruments but also increases the amount of sludge produced. Furthermore, the production of gypsum is not economically desirable, because hydrated lime, which is used as a neutralizer, is unintentionally consumed during gypsum production.
Water samples were collected from the AMD system at Daedeok Mine to identify the scale minerals produced and analyze the water quality. In addition, geochemical modelling using onsite water quality data and a simulation was conducted, and the results showed that the settlement of Ca sulfate minerals (such as gypsum) occurred following the application of hydrated lime. As the pH increased, the amount of gypsum production increased, and 7 g/L was produced at pH 9 in the simulation. The SEM/EDS analysis showed that the main scale collected at the site was gypsum, and it was thermodynamically identical to the mineral expected. The mine drainage was neutralized from pH 3 to pH 9 in a laboratory, and the results showed that gypsum production began at pH 3 and then increased with an increase in the neutralization pH. The geochemical simulation results were similar, and the reaction rate of gypsum was found to be slower than that of iron hydroxides. After neutralization with hydrated lime, the Ca2+ and SO42− components existed as gypsum in an oversaturated state, and gypsum scale was thus produced up to the final effluent point. The results of this study reveal the importance of relatively lowering the neutralization pH to mitigate the formation of gypsum scale in hydrated lime AMD treatment facilities aimed at the removal of Fe, Al3+, and Mn2+. A quantification approach to the sediment at a specific pH through a geochemical simulation as well as neutralization experiment is useful.

Author Contributions

Conceptualization: Y.-W.C., D.-W.C. and G.-J.Y.; methodology: D.-W.C. and G.-J.Y.; formal analysis: D.-W.C., H.-S.P. and G.-J.Y.; investigation: Y.-W.C., H.-S.P. and J.-H.L.; writing—original draft preparation: Y.-W.C.; writing—review and editing: Y.-W.C., S.-J.K. and J.-H.L.; project administration: D.-W.C. and G.-J.Y.; funding acquisition: Y.-W.C. and J.-H.L. All authors have read and agreed to the published version of the manuscript.

Funding

This study was supported by the Basic Research Project of the Korea Institute of Geoscience and Mineral Resources (Project code: 22-3412) and the Mine Reclamation Corporation (MIRECO).

Data Availability Statement

Not applicable.

Conflicts of Interest

The authors declare no conflict of interest.

References

  1. Younger, P.L.; Banwart, S.A.; Hedin, R.S. Mine water: Hydrology, pollution, remediation. Kluwer Acad. Publ. 2002, 1, 1–442. [Google Scholar]
  2. Aube, B.; Zinck, J. Lime treatment of acid mine drainage in Canada. In Proceedings of the Brazil-Canada Seminar on Mine Rehabilitation, Florianópolis, Brazil, 1–3 December 2003. [Google Scholar]
  3. Aube, B.; Lee, D. The high density sludge (HDS) process and sulphate control. In Proceedings of the 10th International Conference on Acid Rock Drainage (ICARD) & IMWA Annual Conference, Santiago, Chile, 21–24 April 2015. [Google Scholar]
  4. Kim, S.K.J.; Kim, J.; Tazaki, K. Mineralogical characterization of microbial ferrihydrite and schwertmannite, and non-biogenic Al-sulfate precipitates from acid mine drainage in the Donghae mine area, Korea. Environ. Earth Sci. 2002, 42, 19–31. [Google Scholar] [CrossRef]
  5. Masindi, V.; Madzivire, G.; Tekere, M. Reclamation of water and the synthesis of gypsum and limestone from acid mine drainage treatment process using a combination of pre-treated magnesite nanosheets, lime, and CO2 bubbling. Water Resour. Ind. 2018, 20, 1–14. [Google Scholar] [CrossRef]
  6. Park, I.; Tabelin, C.B.; Jeon, S.; Li, X.; Seno, K.; Ito, M.; Hiroyoshi, N. A review of recent strategies for acid mine drainage prevention and mine tailings recycling. Chemosphere 2019, 219, 588–606. [Google Scholar] [CrossRef] [PubMed]
  7. Fazel, M.; Chesters, S.; Gibson, G. Controlling calcium sulphate scale formation in acid mine waters. In Proceedings of the 5th World Congress on Mechanical, Chemical, and Material Engineering, Lisbon, Portugal, 15–17 August 2019; 2019; 124, pp. 1–10. [Google Scholar]
  8. Tolonen, E.T.; Sarpola, A.; Hu, T.; Ramo, J.; Lassi, U. Acid mine drainage treatment using by-products from quicklime manufacturing as neutralization chemicals. Chemosphere 2014, 117, 419–424. [Google Scholar] [CrossRef] [PubMed]
  9. Madzivire, G.; Petrik, L.F.; Gitari, W.M.; Ojumu, T.V.; Balfour, G. Application of coal fly ash to circumneutral mine waters for the removal of sulphates as gypsum and ettringite. Miner. Eng. 2010, 23, 252–257. [Google Scholar] [CrossRef]
  10. USPDEP. PA DEP-BAMR Active Mine Drainage Treatment Facilities. 2019. Available online: http://files.dep.state.pa.us/Mining/Abandoned%20Mine%20Reclamation/AbandonedMinePortalFiles/AMDSetAsideProgram/BAMR_Current_Active_AMD_Treatment_Plants_02-21-2019.pdf (accessed on 18 February 2022).
  11. International Network for Acid Prevention (INAP). Treatment of Sulphate in Mine Effluents; Lorax Environmental: Vancouver, BC, Canada, 2003; Available online: https://www.inap.com.au/wp-content/uploads/Treatment_of_Sulphate_in_Mine_Effluents_-_Lorax_Report.pdf (accessed on 19 February 2022).
  12. Liang, H.C.; Tamburini, J.; Johns, F. Designing a mine water treatment facility to remove sulfate. In Proceedings of the 10th International Conference on Acid Rock Drainage (ICARD) & IMWA Annual Conference, Santiago, Chile, 21–24 April 2015. [Google Scholar]
  13. Kinnunen, P.; Kyllönen, H.; Kaartinen, T.; Mäkinen, J.; Heikkinen, J.; Miettinen, V. Sulphate removal from mine water with chemical, biological and membrane technologies. Water Sci. Technol. 2017, 2017, 194–205. [Google Scholar] [CrossRef] [PubMed] [Green Version]
  14. Miller, A.W.; Sibrell, P.L.; Wildeman, T.R. Comparison of sludge characteristics between lime and limestone/lime treatment of acid mine drainage. In Proceedings of the 24th National meetings of the American Society of Mining and Reclamation (ASMR), Gillette, WY, USA, 2–6 June 2007; 1, pp. 213–222. [Google Scholar]
  15. Ji, S.-W.; Lim, G.-J.; Cheong, Y.-W.; Yoo, K. Treatment efficiency of acid mine drainage by the Ho-Nam Coal Mine passive treatment system. Geosystem Eng. 2012, 15, 27–32. [Google Scholar] [CrossRef]
  16. Kefeni, K.K.; Msagati, T.A.M.; Mamba, B.B. Acid mine drainage: Prevention, treatment options, and resource recovery: A review. J. Clean. Prod. 2017, 151, 475–493. [Google Scholar] [CrossRef]
  17. Ji, S.; Kim, S.; Ko, J. The status of the passive treatment systems for acid mine drainage in South Korea. Environ. Earth Sci. 2008, 55, 1181–1194. [Google Scholar] [CrossRef]
  18. Gasparon, M.; Smedley, A.; Jong, T.; Costagliola, P.; Benvenuti, M. Acid Mine Drainage at Mount Morgan, Queensland (Australia): Experimental Simulation and Geochemical Modelling of Buffering Reactions. In Water in Mining Environments; IMWA Symposium: Cagliari, Italy, 2007; pp. 433–436. [Google Scholar]
  19. Freitas, R.M.; Perilli, T.A.G.; Ladeira, A.C.Q. Oxidative precipitation of manganese from acid mine drainage by potassium permanganate. J. Chem. 2013, 2013, 1–8. [Google Scholar] [CrossRef]
  20. Camden-Smith, B.; Johnson, R.H.; Camden-Smith, P.; Tutu, H. Geochemical modelling of water quality and solutes transport from mining environments. Res. Pract. Water Qual. 2015, 39–64. [Google Scholar] [CrossRef] [Green Version]
  21. Vriens, B.; Plante, B.; Seigneur, N.; Jamieson, H. Mine waste rock: Insights for sustainable hydrogeochemical management. Minerals 2020, 10, 728. [Google Scholar] [CrossRef]
  22. Muniruzzaman, M.; Karlsson, T.; Kauppila, P.M. Modelling tools for the prediction of drainage quality from mine wastes. Geol. Surv. Finl. Bull. 2018, 408, 27–42. [Google Scholar]
  23. Geldenhuys, P.; Maree, A.J.; Beer, J.P.; Hlabela, M. An integrated limestone/lime process for partial sulphate removal. J. South Afr. Inst. Min. Metall. 2003, 103, 345–354. [Google Scholar]
  24. Gominšek, T.; Lubej, A.; Pohar, C. Continuous precipitation of calcium sulfate dihydrate from waste sulfuric acid and lime. J. Chem. Technol. Biotechnol. 2005, 80, 939–947. [Google Scholar] [CrossRef]
  25. Mine Reclamation Corp (MIRECO). Development of enhanced process to improve physico-chemical treatment efficiency of mine drainage. Res. Rep. 2020, 36, 179–184. [Google Scholar]
  26. Le Gouellec, Y.; Elimelech, M. Calcium sulfate (gypsum) scaling in nanofiltration of agricultural drainage water. J. Membr. Sci. 2002, 205, 279–291. [Google Scholar] [CrossRef]
  27. Gitari, W.; Petrik, L.; Etchebers, O.; Key, D.; Okujeni, C. Utilization of fly ash for treatment of coal mines wastewater: Solubility controls on major inorganic contaminants. Fuel 2008, 87, 2450–2462. [Google Scholar] [CrossRef]
  28. Madzivire, G.; Gitari, W.M.; Vadapalli, V.R.K.; Ojumu, T.V.; Petrik, L.F. Fate of sulphate removed during the treatment of circumneutral mine water and acid mine drainage with coal fly ash: Modelling and experimental approach. Miner. Eng. 2011, 24, 1467–1477. [Google Scholar] [CrossRef] [Green Version]
Figure 1. Sampling points ((a,b,c)) in the AMD treatment facility.
Minerals 12 00574 g001
Figure 2. Changes in water quality at the various sampling points.
Minerals 12 00574 g002
Figure 3. Comparison of mineral saturation at the three sampling points.
Minerals 12 00574 g003
Figure 4. (a) Scale on the wall of the concrete sedimentation basin and (b) on the pH electrode. (c) SEM/EDS Image of scale obtained from the pH electrode.
Minerals 12 00574 g004
Figure 5. Simulation results for the (a) Ca2+ and SO42− concentrations and (b) the amount of gypsum with an increasing pH.
Minerals 12 00574 g005
Figure 6. Changes in concentrations of Ca2+ and SO42− versus the pH level over 24 h.
Minerals 12 00574 g006
Figure 7. White precipitates (gypsum) in Imhoff cones at (a) pH 5 and (b) pH 9 and their SEM/EDS analysis results.
Minerals 12 00574 g007
Publisher’s Note: MDPI stays neutral with regard to jurisdictional claims in published maps and institutional affiliations.

