Article

Dynamic Propagation and Electro-Mechanical Characteristics of New Microcracks in Notched Coal Samples Studied by the Three-Point Bending Test System and AFM

1
BGRIMM Technology Group, Beijing 102628, China
2
National Centre for International Research on Green Metal Mining, Beijing 102628, China
3
School of Civil and Resource Engineering, University of Science and Technology Beijing, Beijing 100083, China
4
Department of Chemical and Materials Engineering, University of Alberta, Edmonton, AB T6G 1H9, Canada
*
Author to whom correspondence should be addressed.
Minerals 2022, 12(5), 582; https://doi.org/10.3390/min12050582
Submission received: 27 March 2022 / Revised: 23 April 2022 / Accepted: 28 April 2022 / Published: 5 May 2022

Abstract

:
This work extends research on the mechanism of electromagnetic radiation (EMR) induced by coal or rock fractures to the category of microscopic dynamic experimental research. A custom-made three-point bending test system and atomic force microscope (AFM) were integrated to obtain the microdynamic loading test system. The notched coal samples were prepared specially. The dynamic propagation of new microcracks in coal samples was measured, and the propagation velocity was calculated. The morphology and electro-mechanical characteristics of new microcracks were tested. More importantly, the causes of the changes in the electro-mechanical characteristics before and after fracture were analyzed, and the effects of these changes on the EMR were discussed. The results showed that the average propagation velocities during the same time interval are 9.5 μm/s, 12.1 μm/s, and 16.2 μm/s. The elastic modulus of the material at the microcrack edge is generally smaller than that of the material in other locations, while the adhesion and deformation are larger. Moreover, the closer the material is to the microcrack, the higher its surface potential. The electrons generated at the microcrack edge and emitted into the atmosphere, which made the greater potentials of the microcrack edge. Many electrons with different velocities and directions migrate in similar parallel-plate capacitors, which are formed by the relative microscale surface of the coal microcrack tip and have different field strengths, resulting in EMR with complex frequencies and different intensities. This study provides a micro-dynamic experimental basis for research on the electromagnetic radiation mechanism.

1. Introduction

In recent years, with the increase in the depth and intensity of coal mining, coal or rock dynamic failures have become one of the main disasters faced by coal mining safety at home and abroad [1,2,3]. In the field of monitoring and early warning of coal or rock dynamic disasters, many engineering practices prove that coal or rock electromagnetic radiation technology has broad application prospects [4,5,6,7,8,9], but the mechanism of EMR generated by the deformation and fracture of coal or rock masses is still unclear. Researchers have explained this using many aspects, such as the piezoelectric effect [10,11], triboelectric charging [12,13,14], flow potential [15], stress-induced polarization [16,17], oscillating electric dipole [18], and R-C oscillation loop excitation [19,20,21]. However, most of these explanations are based on experiments at the macro/mesoscale or on assumptions.
In the past few years, our research team has carried out continuous studies on the influence of coal properties on electromagnetic radiation (EMR) from the microscopic level. He et al. [22] selected 10 coal samples with different ranks for experiments, used Fourier transform infrared spectroscopy to determine the surface microstructures of coal, and measured the surface potential by atomic force microscope (AFM). Subsequently, the effect of coal microstructures on surface electrical properties was analyzed, and the correlations between these two parameters were also established. These results provide a better understanding of the EMR mechanism at the microscopic scale. Wang et al. [23] employed an optical microscope, digital microhardness tester and AFM to measure the surface morphology, surface microhardness and electro-mechanical characteristics of coal regarding the mechanism of EMR induced by deformation and failure of coal or rock. Tian et al. [24] measured the microsurface potential of different coals (reflectance range; R0 = 0.90%~2.47%) by AFM at five scanning scales to gain clearer insights into the electrical characteristics of coal microsurfaces. These works have made some progress in this field; however, these studies are based on static experiments. A dynamic experimental study at the macro/mesoscale has not yet been carried out, and the influence of the dynamic change process on the electro-mechanical properties of coal at the microscale has not been studied.
Experiments at the macro/mesoscale show that the surface potential generated by the coal or rock fracture is a macroscopic physical phenomenon in which the coal or rock mass makes free charges during the loading fracture process [15]. There is a special relationship between the free charge generation and the microdamage of coal, and the microdamage of coal is closely related to the microload state and its micromechanical properties. Furthermore, the microdamage and fracture of coal are dynamic processes. To date, there is a lack of research on the electro-mechanical characteristics of coal at the macro/mesoscale in the dynamic fracture process. The study of this challenge must solve two critical problems: how to generate and control microfracture of coal, and how to test the electro-mechanical characteristics of coal at the micro/nanoscale before and after dynamic fracture.
Among most experimental techniques, the three-point bending test has proven to be very useful for the study of fracture features of brittle materials such as ceramic [25], glass [26], rock [27,28], and coal [29] under dynamic and static loading conditions at the mesoscale. Following the above research, the three-point bending test was used to generate and control the microcracks in the coal samples. However, the measurement at the micro/nanoscale relies on extremely sophisticated test instruments. AFM, as an atomic-level precision instrument, has been widely employed in research on the mechanical and electrical properties of materials at the micro/nanoscale. Worldwide, many scholars have studied the mechanical properties (such as elastic modulus, adhesion, and deformation) of coal [30], oil sand [31], and abalone shell [32] at the micro/nanoscale by AFM. Similarly, AFM has been used to investigate the surface charge density and surface potential distribution of coal [24], quartz sand [33], silicate [34], and scheelite crystals [35] at the micro/nanoscale. Therefore, AFM is suitable for the measurement of the electro-mechanical properties of coal at the micro/nanoscale.
In this study, the three-point bending test system and AFM were integrated to build a microdynamic loading test system. Then, microcracks in the coal samples were generated and controlled, and the dynamic propagation characteristics of microcracks were measured. At the same time, the electro-mechanical properties of microcracks at the micro/nanoscale were tested. This study extends the research on the EMR mechanism from static experimental research to dynamic experimental research at the micro/nanoscale, and provides a microdynamic experimental basis for research on the EMR mechanism.

2. Theory of EMR

As determined from the study of electrodynamics, the electric and magnetic fields induced by the movement of charged particles in a uniform electric field can be described in Equations (1) and (2), respectively [36].
E * = e 4 π ε 0 r 2 × 1 v 2 c 2 n v c 1 n v c 3 + e 4 π ε 0 c 2 r n × n v c × a 1 v n c 3 = E X + E Y
B * = e n 4 π ε 0 c r 2 × 1 v 2 c 2 n v c 1 n v c 3 + e n 4 π ε 0 c 3 r × n × n v c × a 1 n v c 3 = B X + B Y
where v is the charged particle velocity, c is the electromagnetic wave propagation velocity in vacuum, i.e., the speed of light, e is the charged particle, ε 0 is the absolute permittivity, v is the vector velocity of the charged particle, r is the distance between the charged particle and field point, n is the unit vector in the normal direction, a is the vector acceleration when charged particles move, E X , B X is the Coulomb field generated by moving charged particles and the associated magnetic field, and E Y , B Y is the radiated field generated by moving charged particles and the associated magnetic field.
Therefore, the electromagnetic field induced by the variable-speed moving charged particles is divided into two parts. E X , B X , called the inductive field, which is inversely proportional to r2. This part of the field is associated with the electric charge and does not represent the electromagnetic field of the radiation. E Y , B Y , which are inversely proportional to r, belong to the radiation field that can exist independently from the source, can radiate out, and are related to acceleration a .
In the electric field (ignoring gravity), let the charged particle with a mass of m and a charge of e be subjected to the resultant force F which is obtained by Newton’s second law; then,
F = m a = E e
The uniform electric field is calculated by
E = U d
where U is the potential between the two plates formed by the two micro elements, and d is the distance between the two plates; then
a = U e m d
Bring Equation (5) into Equations (1) and (2) to obtain
E = e 4 π ε 0 r 2 × 1 v 2 c 2 n v c 1 n v c 3 + e 4 π ε 0 c 2 r × n × n v c 1 n v c 3 × U e m d = E x + E y
B = e n 4 π ε 0 c r 2 × 1 v 2 c 2 n v c 1 n v c 3 + e n 4 π ε 0 c 3 r × n × n v c 1 n v c 3 × U e m d = B x + B y
The electric field and the magnetic field are proportional to the charge quantity e, the acceleration of the charged particles a , and the potential U and are inversely proportional to the distance d and the mass m of the charged particle. The electric field and the magnetic field propagate alternately in perpendicular ways to generate electromagnetic waves, and those waves are emitted into the air to form EMR.

3. Materials and Methods

3.1. Construction of the Microdynamic Loading Test System

In the experiment, the Dimension Icon AFM produced by Bruker was used, and the microdynamic loading system was customized, which mainly consisted of a loading device, loading controller, and loading control software, as shown in Figure 1. The size of the loading device is approximately 156 mm × 83 mm × 37 mm, and the ranges of the interchangeable load cell with an accuracy of ±1% of the full range are 660 N and 2000 N, respectively. The maximum stroke of the loading device is 20 mm (10 mm~30 mm), and the displacement loading rate is 0.05 mm/min~0.4 mm/min. The resolution of the displacement meter is 3 μm. The microdynamic loading test system is shown in Figure 1.

3.2. Sample Preparation

The block coal samples used in the tests were obtained at one coal seam from Henan Province, China. Proximate analysis of one block coal sample was conducted by the GF-A2000 auto proximate analyzer following the Chinese National Standard GB/T 212-2008. The results of the proximate analysis and ultimate analysis are presented in Table 1.
The block coal sample was crushed, and coal samples of approximately 30 mm × 20 mm × 10 mm were selected and ground to a size of approximately 5 mm × 3 mm × 2 mm using a grinding and polishing machine with 400-mesh sandpaper, as shown in Figure 2a–e. Then, they were placed in the mosaic mold, and epoxy resin and the coagulant were poured into the mosaic mold to inlay coal samples into cylindrical samples of Φ 20 mm × 10 mm, as shown in Figure 2f,g. The cylindrical samples prevent the coal samples from being broken during grinding and polishing. Next, the samples were ground and polished by a YMP-1 grinding and polishing machine, and the surfaces with exposed coal samples were ground and polished, respectively, with 400 mesh, 800 mesh, 1200 mesh, and 1500 mesh water-resistant sandpaper. Next, they were polished with polishing cloths and polishing paste for 10 min so that the surface morphology undulation did not exceed 100 nm. Then, they were ground into regular cuboid samples of approximately 20 mm × 10 mm × 5 mm on 400-mesh sandpaper, and the epoxy resin was evenly wrapped on both sides of the long side of the samples. After this, the polished samples were pre-notched in the middle of the long side, as shown in Figure 2h. The samples were placed in an ultrasonic cleaner containing deionized water for 1 min and dried in a vacuum dryer for 10 min at 105 °C. Finally, the samples were sealed and stored to prevent impurities adsorbed on the surface from affecting the experiment.

3.3. Experimental Setup and Procedure

First, the prepared notch sample was placed in the three-point bending holder, 20 N preloading force was set to hold the sample, and conductive tape was used to connect the coal surface with the AFM sample stage. Then, the displacement loading mode was used in the three-point bending loading experiment, as shown in Figure 3a, at a loading rate of 0.05 mm/min. During the experiment, the dynamic process of microcrack propagation was captured by the optical imaging system of AFM. When the microcrack propagated stably, the loading was stopped to keep the load constant and to render the microcrack in a static state. Next, the microcracks were measured by AFM, and the scanning scales were 2 μm × 2 μm, 5 μm × 5 μm, and 10 μm × 10 μm. Figure 3b shows the diagram of the experimental scheme. In the experiment, five samples were prepared for the microdynamic loading test experiment.
The SCM-PIT-V2 probe was employed in AFM, with a cantilever elastic coefficient k = 2.8 N/m, a resonant frequency f0 of approximately 60 kHz, a tip radius of 20 nm, and a scanning frequency of 1 Hz. The image resolution was set to 256 × 256. The measurement was performed in tapping mode, and the experiment was carried out in a stable atmospheric environment (temperature 20 °C and humidity 30%). Nanoscope Analyses software was used for image acquisition and data extraction.

4. Results

4.1. Characteristics of Microcrack Dynamic Propagation

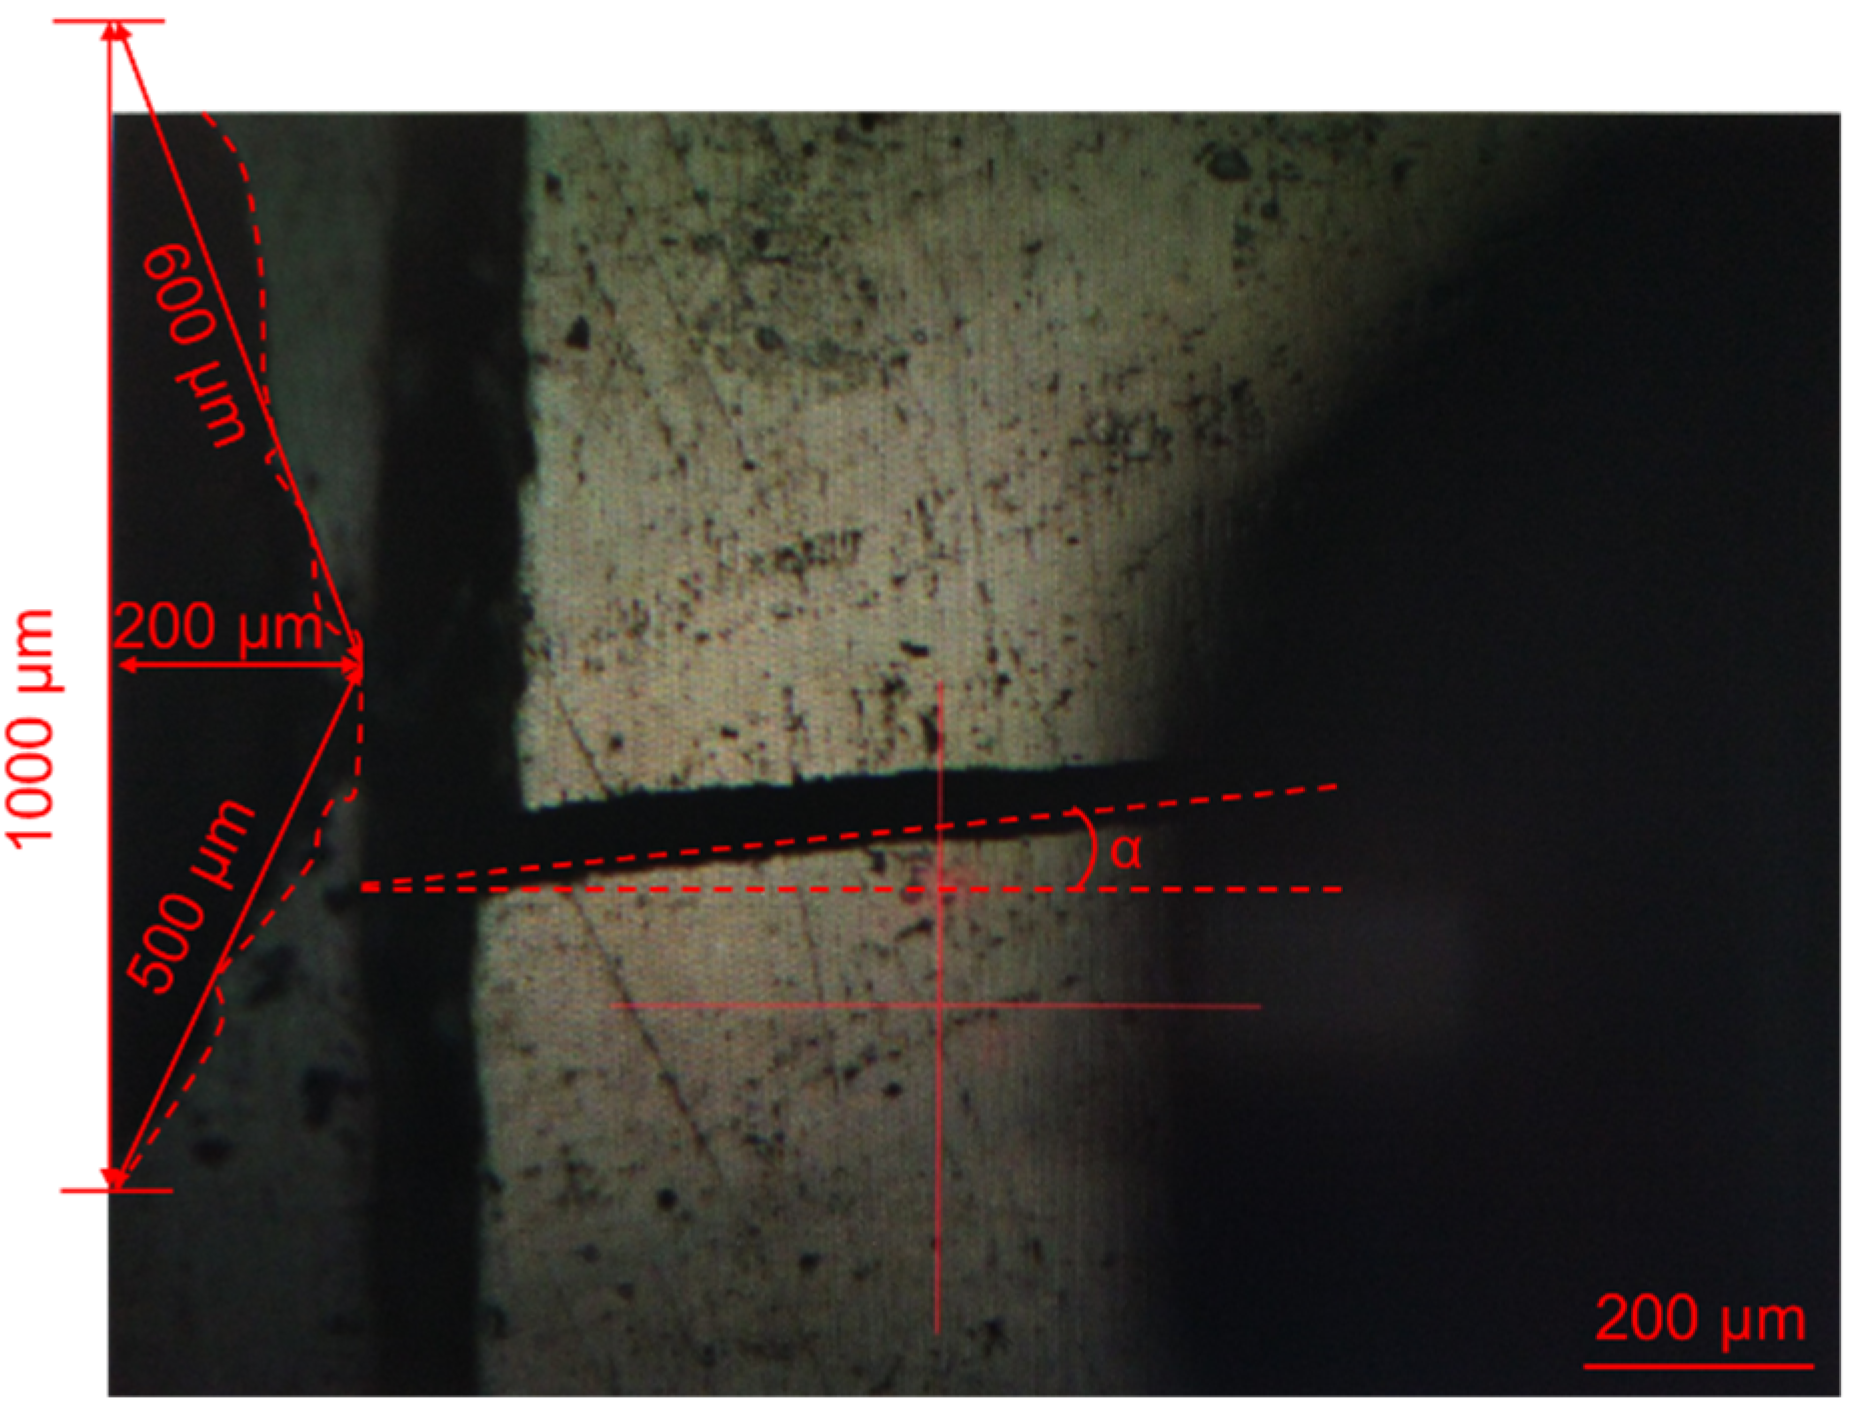
After counting the initiation position of the crack in 5 samples, it was found that the initiation position of microcracks appears at the notch tip in 4 samples, indicating that the notch plays a useful role in controlling the initiation position of microcracks, as shown in Figure 4. In Figure 4, the notch tip is the initiation position of the microcrack. The notch is shaped like a triangle, with three sides measuring 1000 μm, 600 μm and 500 μm in length. The angle of the initial microcrack propagation α is approximately 6°.
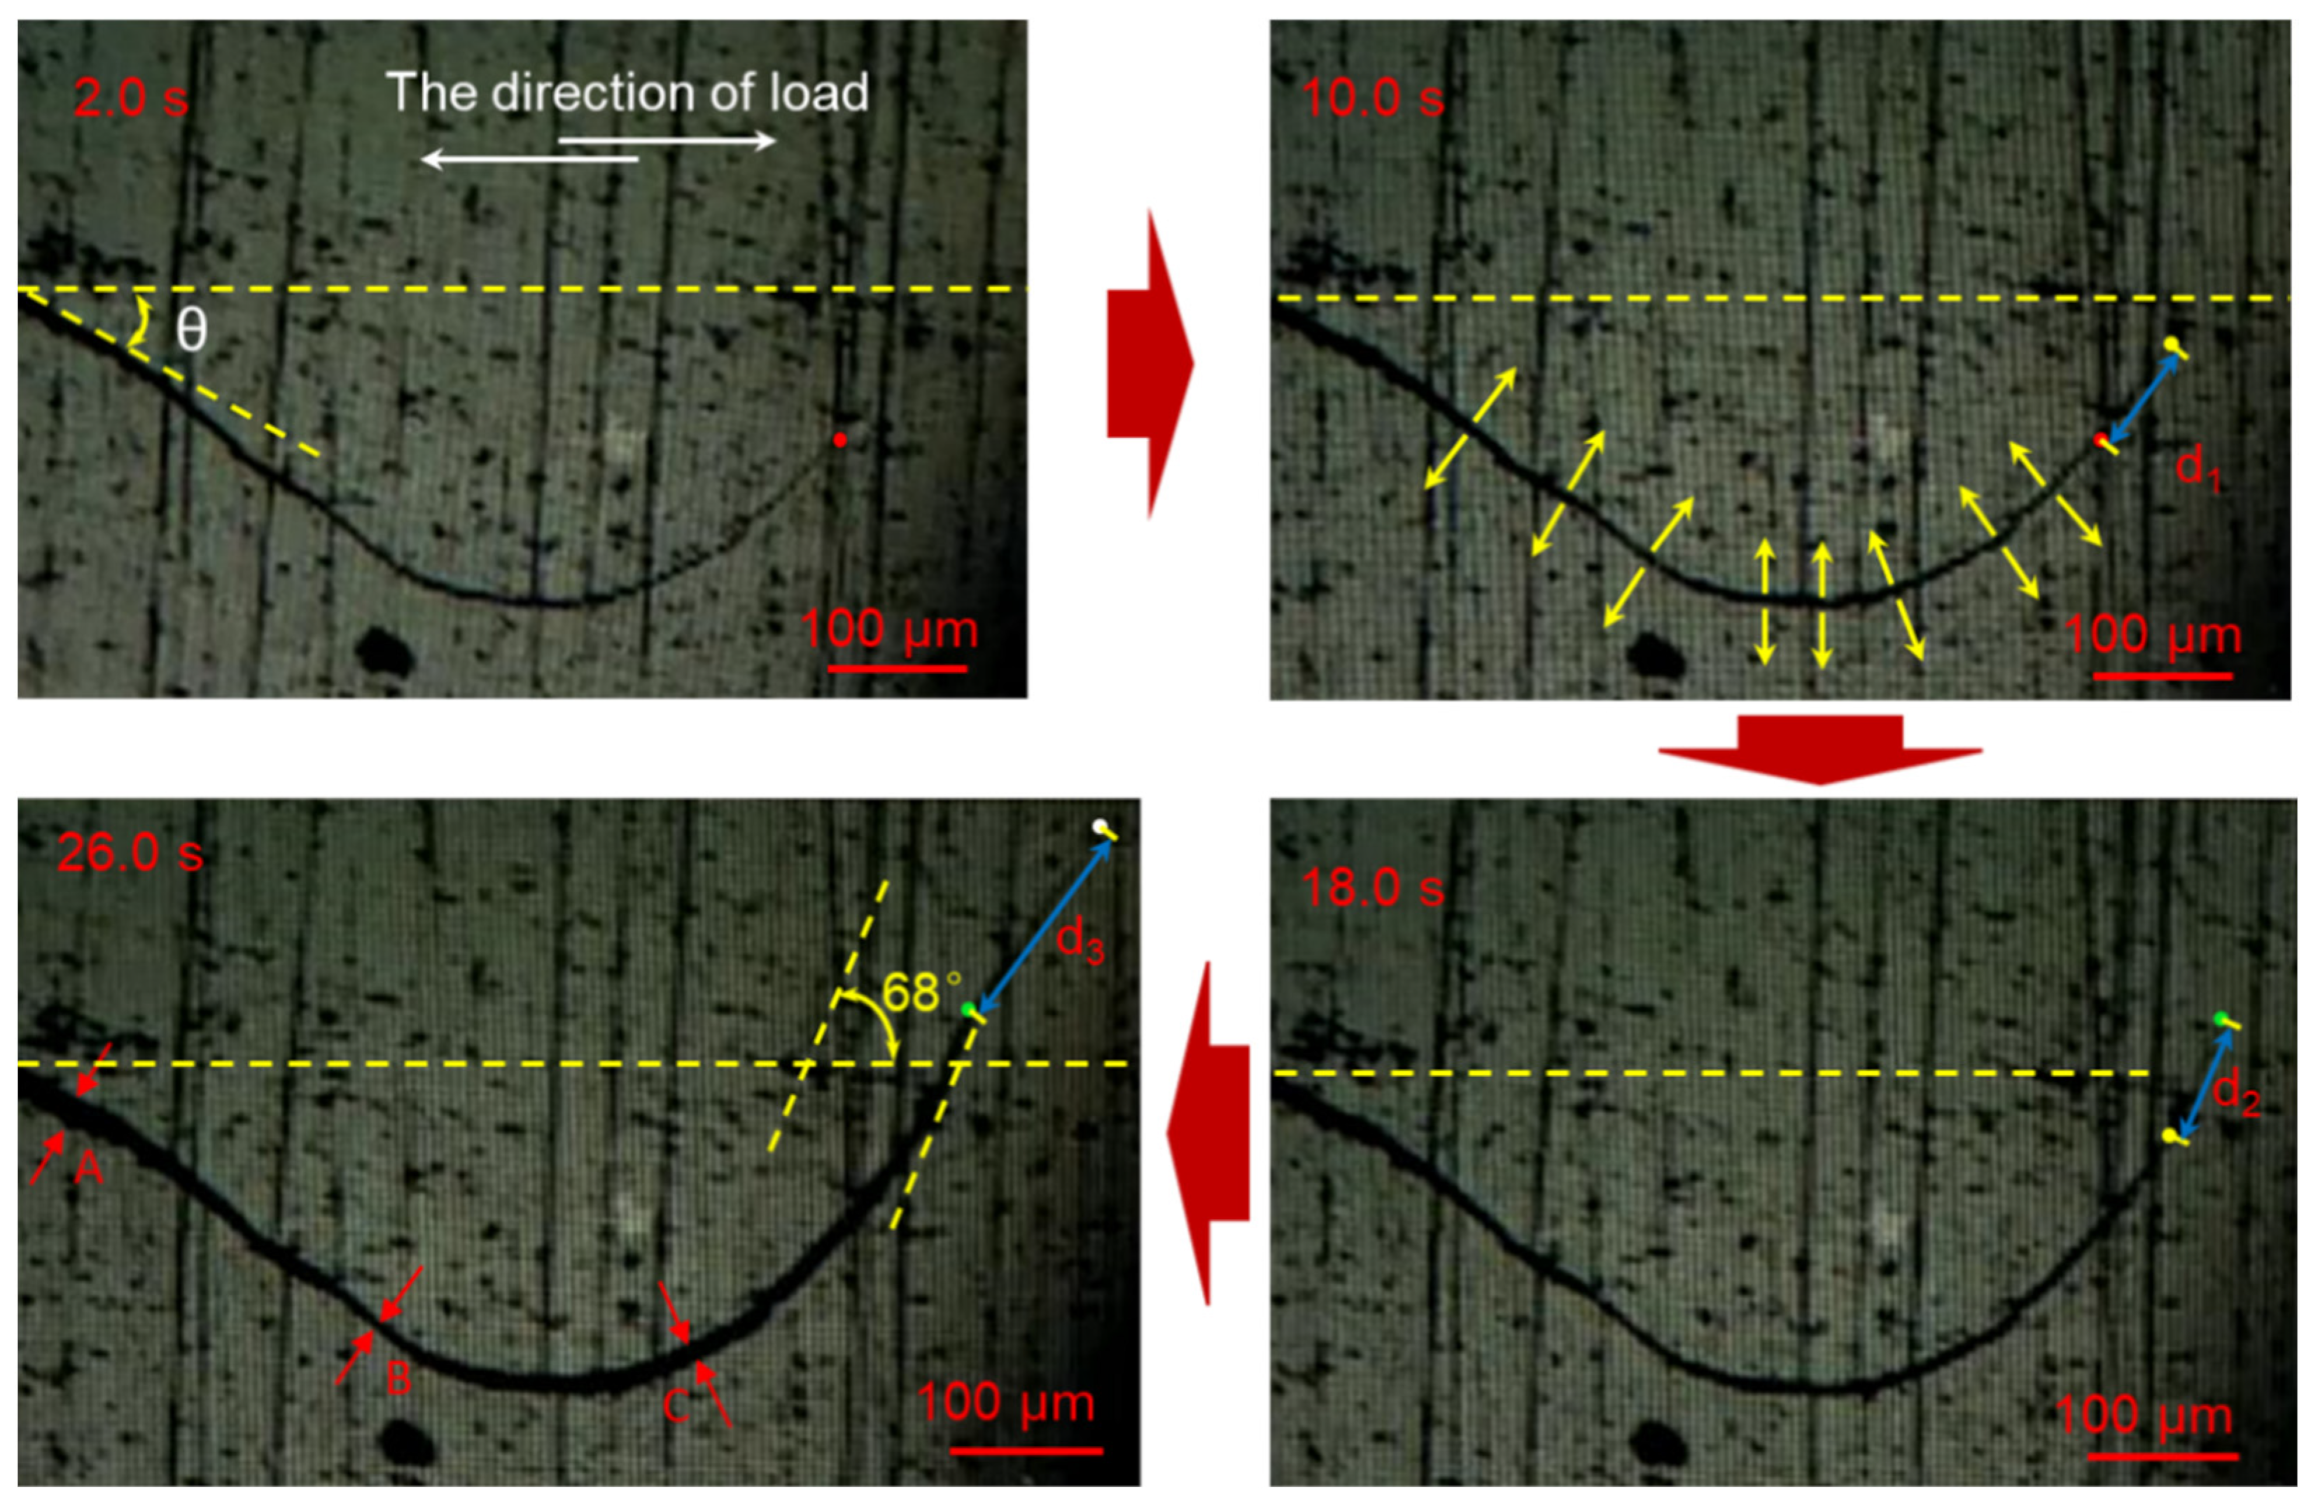
The propagation process of microcracks was obtained through the optical imaging system of AFM, and the continuous and dynamic process of microcrack propagation is shown in Figure 5, which contains several microcrack images at different times. It was found that the width of the microcrack does not uniformly increase when the microcrack propagates. For example, in the picture obtained at 26.0 s, the microcrack widths at positions A, B, and C were different. Position A was propagated first, followed by position B, and finally position C. However, the order of the microcrack width in the three positions was A > C > B.
In addition, the propagation velocities of microcrack were different at different times. The microcrack propagation path was extracted by MATLAB’s image processing function, and the lengths d1, d2, and d3 of the crack propagation on the coal sample surface in the same time interval (2.0 s~10.0 s, 10.0 s~18.0 s, 18.0 s~26.0 s) in Figure 5 were calculated as 76.2 μm, 96.9 μm, and 129.8 μm, respectively. Then, the average velocities of microcrack propagation on the coal sample surface in the same time interval were calculated as 9.5 μm/s, 12.1 μm/s, and 16.2 μm/s, which suggests that the microcrack propagation velocity becomes increasingly faster at the same loading rate, with the change in time. The reason why this phenomenon occurs is that the coal sample is always in the state of being loaded, so that the fracture accelerates continuously until the whole sample is fractured. In this research, the microcrack dynamic propagation process for brittle materials such as coal was successfully observed by the microdynamic loading test system.

4.2. Characteristics of New Microcracks and Surface Morphology

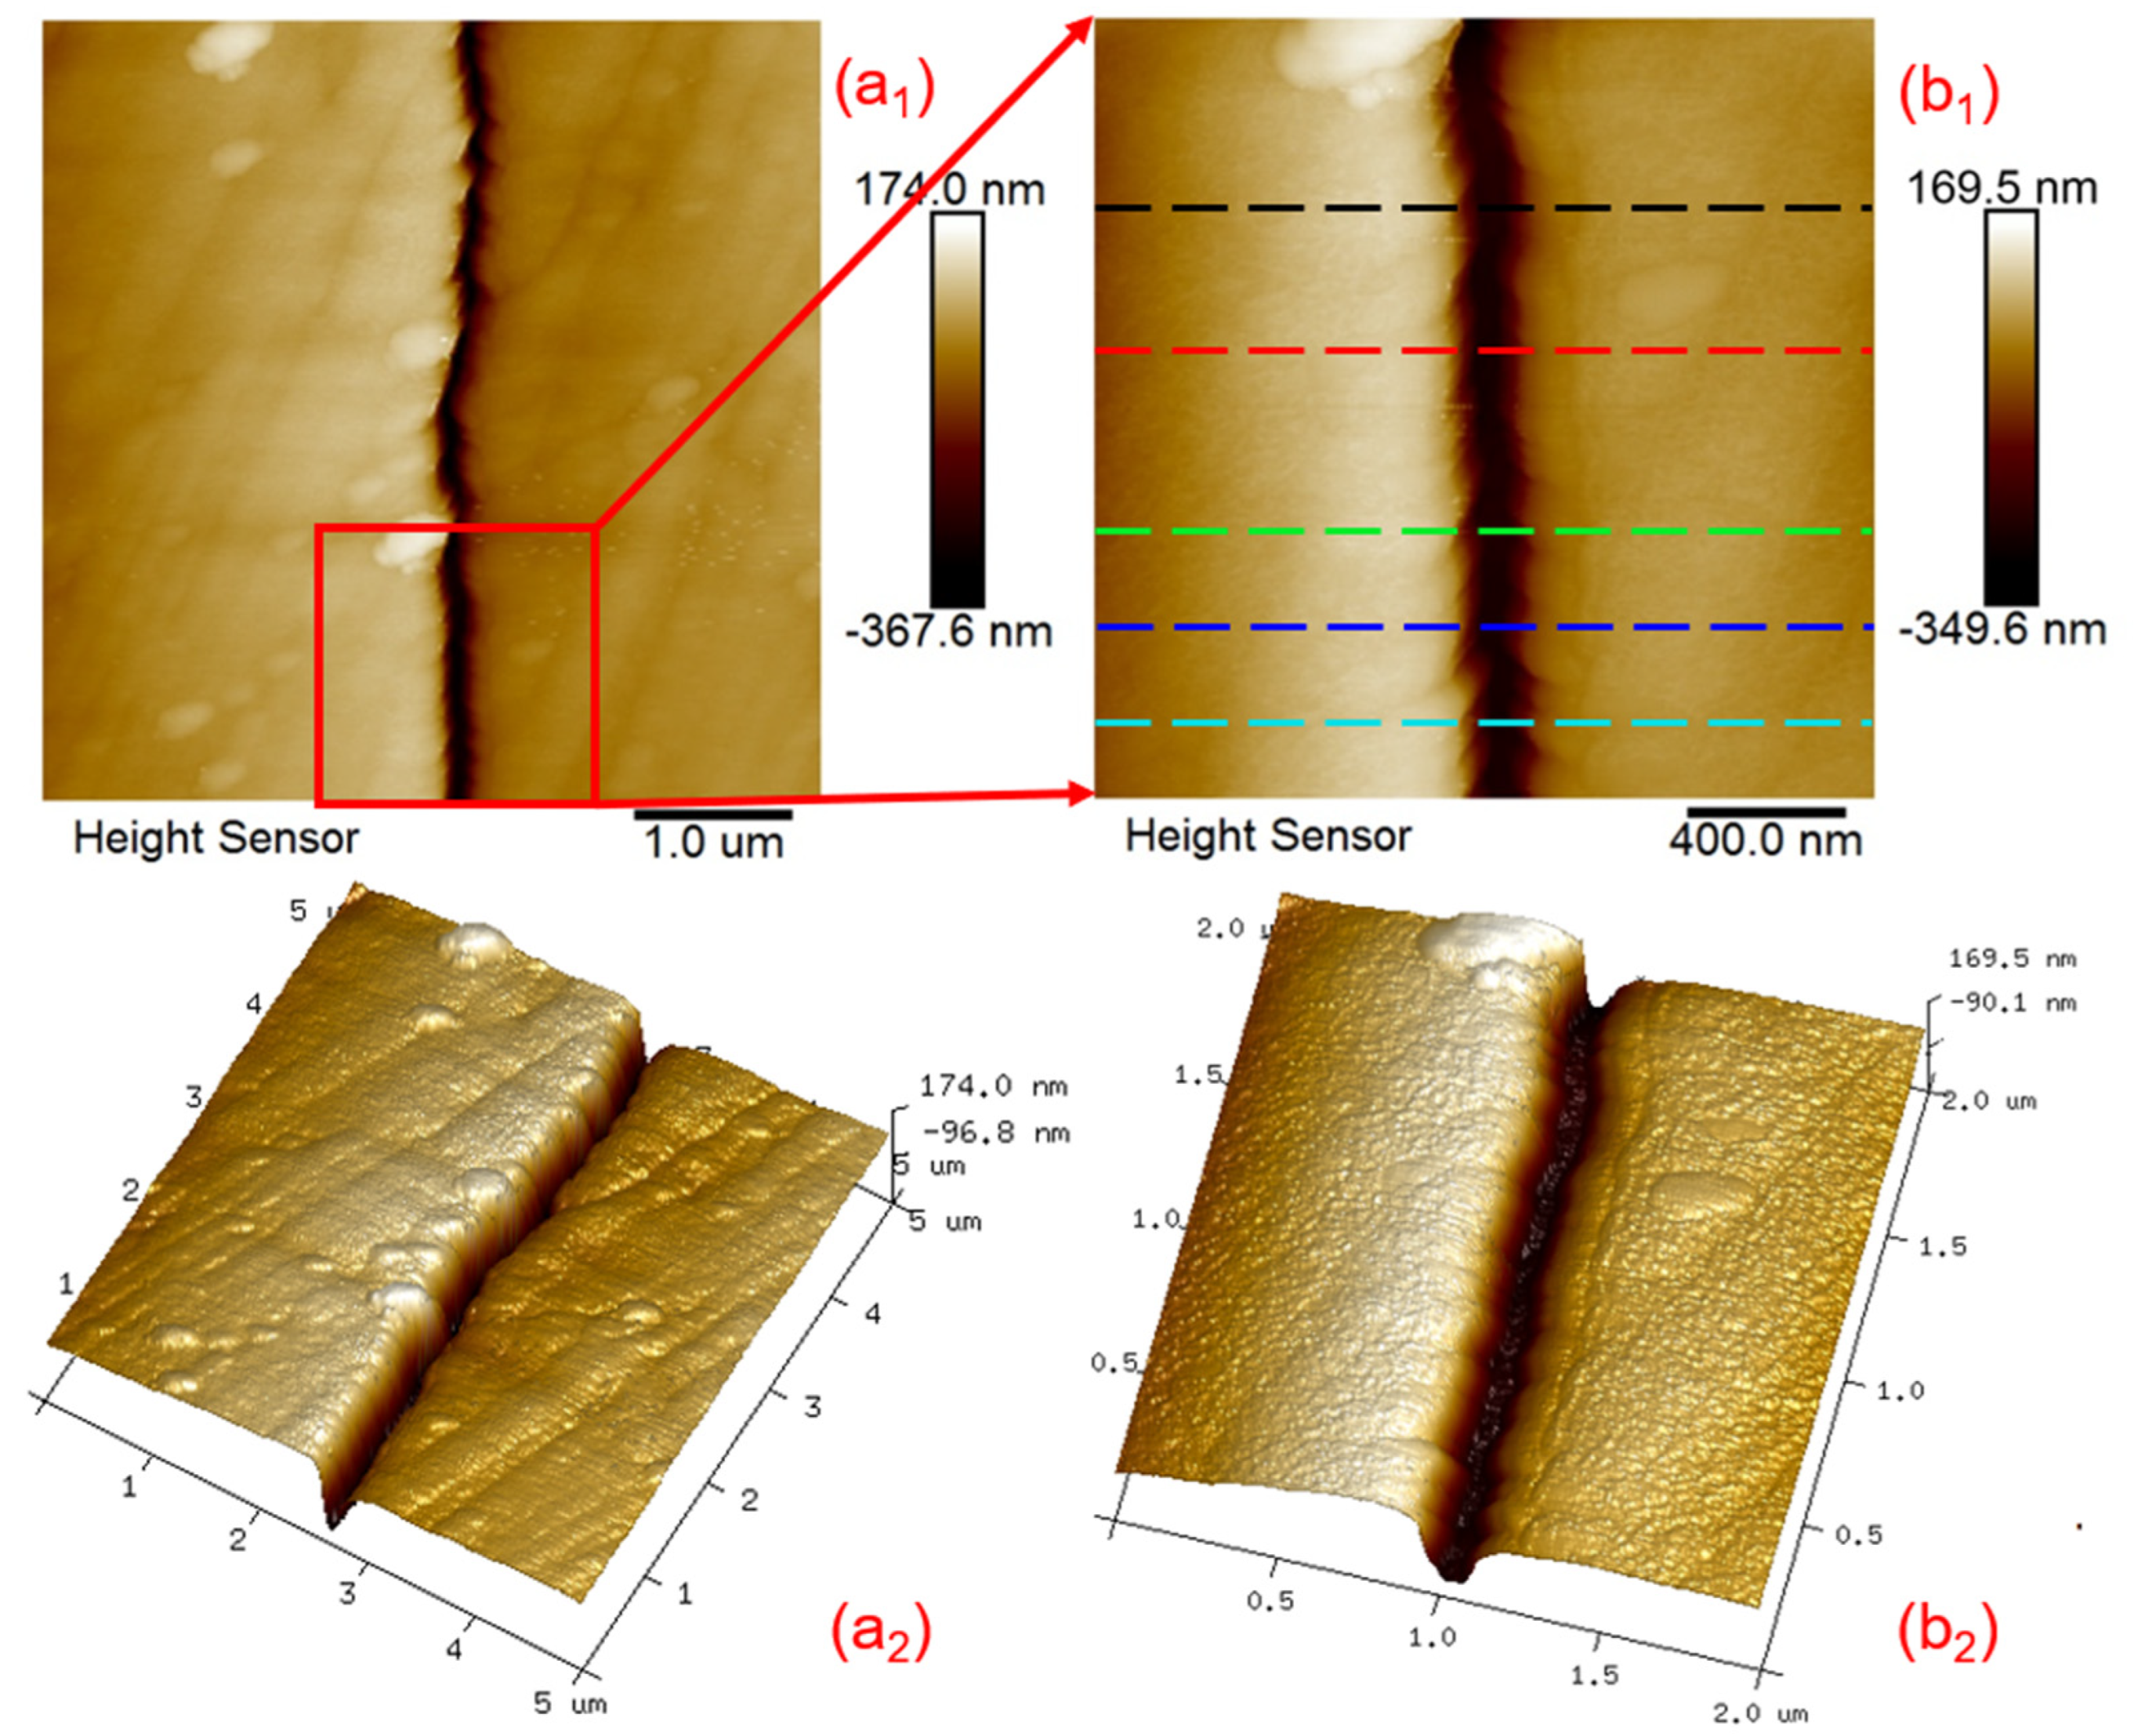
High-resolution images of the new microcrack morphology of the coal sample were explored by AFM, as shown in Figure 6. Figure 6(a1,a2) are 2D and 3D images of the new microcrack morphology, with a range of 5 μm × 5 μm, and Figure 6(b1,b2) are the partial and enlarged views of a1 and a2, with a range of 2 μm × 2 μm. The coal sample surface containing the microcracks appears relatively flat. The microcrack shows a curved shape, and the width varies with different positions. The reason for this is the heterogeneity of coal. Otherwise, the heterogeneity of coal also leads to new fracture surfaces that are not vertical, and many uneven microsurfaces appear on the walls of the new microcrack.

4.3. Micro Mechanical Distribution Characteristics of New Microcracks

Figure 7(a1–d1,a2–d2) are the 2D and 3D profiles of the surface morphology, elastic modulus, adhesion, and deformation of the microcrack, respectively, with a scale of 10 μm × 10 μm. The statistical analysis shows that the elastic modulus varies from 20.41 MPa to 1.05 GPa, the adhesion changes between 1.82 nN and 93.7 nN, and the deformation fluctuates from 3.18 nm to 90.67 nm. This is because the heterogeneity of coal makes its mechanical properties inhomogeneous.
In addition, the fitting curve of the proportion for each parameter has two peaks, as shown in Figure 8. For the elastic modulus, the two peaks appear at 0.06 GPa and 0.40 GPa, representing the average elastic modulus at the microcrack edge and that around the microcrack, respectively. For the adhesion, the two peaks show at 30.29 nN and 90.64 nN, expressing the average adhesion around the microcrack and that at the microcrack edge, respectively. For the deformation, the two peaks exhibit at 14.14 nm and 85.67 nm, reflecting the average deformation around the microcrack and that at the microcrack edge, respectively. Interestingly, one peak is more dominant than the other. This is because the test data corresponding to the dominant peak are abundant, and their proportion is large, indicating the test data around the microcrack. The test data corresponding to the other peak are short, and its proportion is small, indicating the test data at the microcrack edge. The total amount of data is 65,536 (256 × 256).
When the test position is far from the microcrack, its mechanical properties will no longer be affected by the microcrack and can be equivalent to the mechanical properties before fracture. In particular, the elastic modulus at the microcrack edge decreases before fracture, while the adhesion and deformation are more significant, which indicates that the mechanical properties of the material at the microcrack edge have been changed. This phenomenon reflects the impact of the fracture on the material at the microcrack.

4.4. Surface Potential Distribution Characteristics of New Microcracks

In the experiment, the surface potential was measured by the probe of AFM using a two-scan method. The first step is the Main Scan, and the surface morphology of the sample is obtained by tapping mode. The second step is the Interleave Scan: the probe is lifted to a certain height, and an AC voltage VAC sin ωt is applied to the probe. According to the morphology information obtained from the Main Scan, the system keeps the vertical distance between the probe and the sample constant and then the surface potential of the sample is measured.
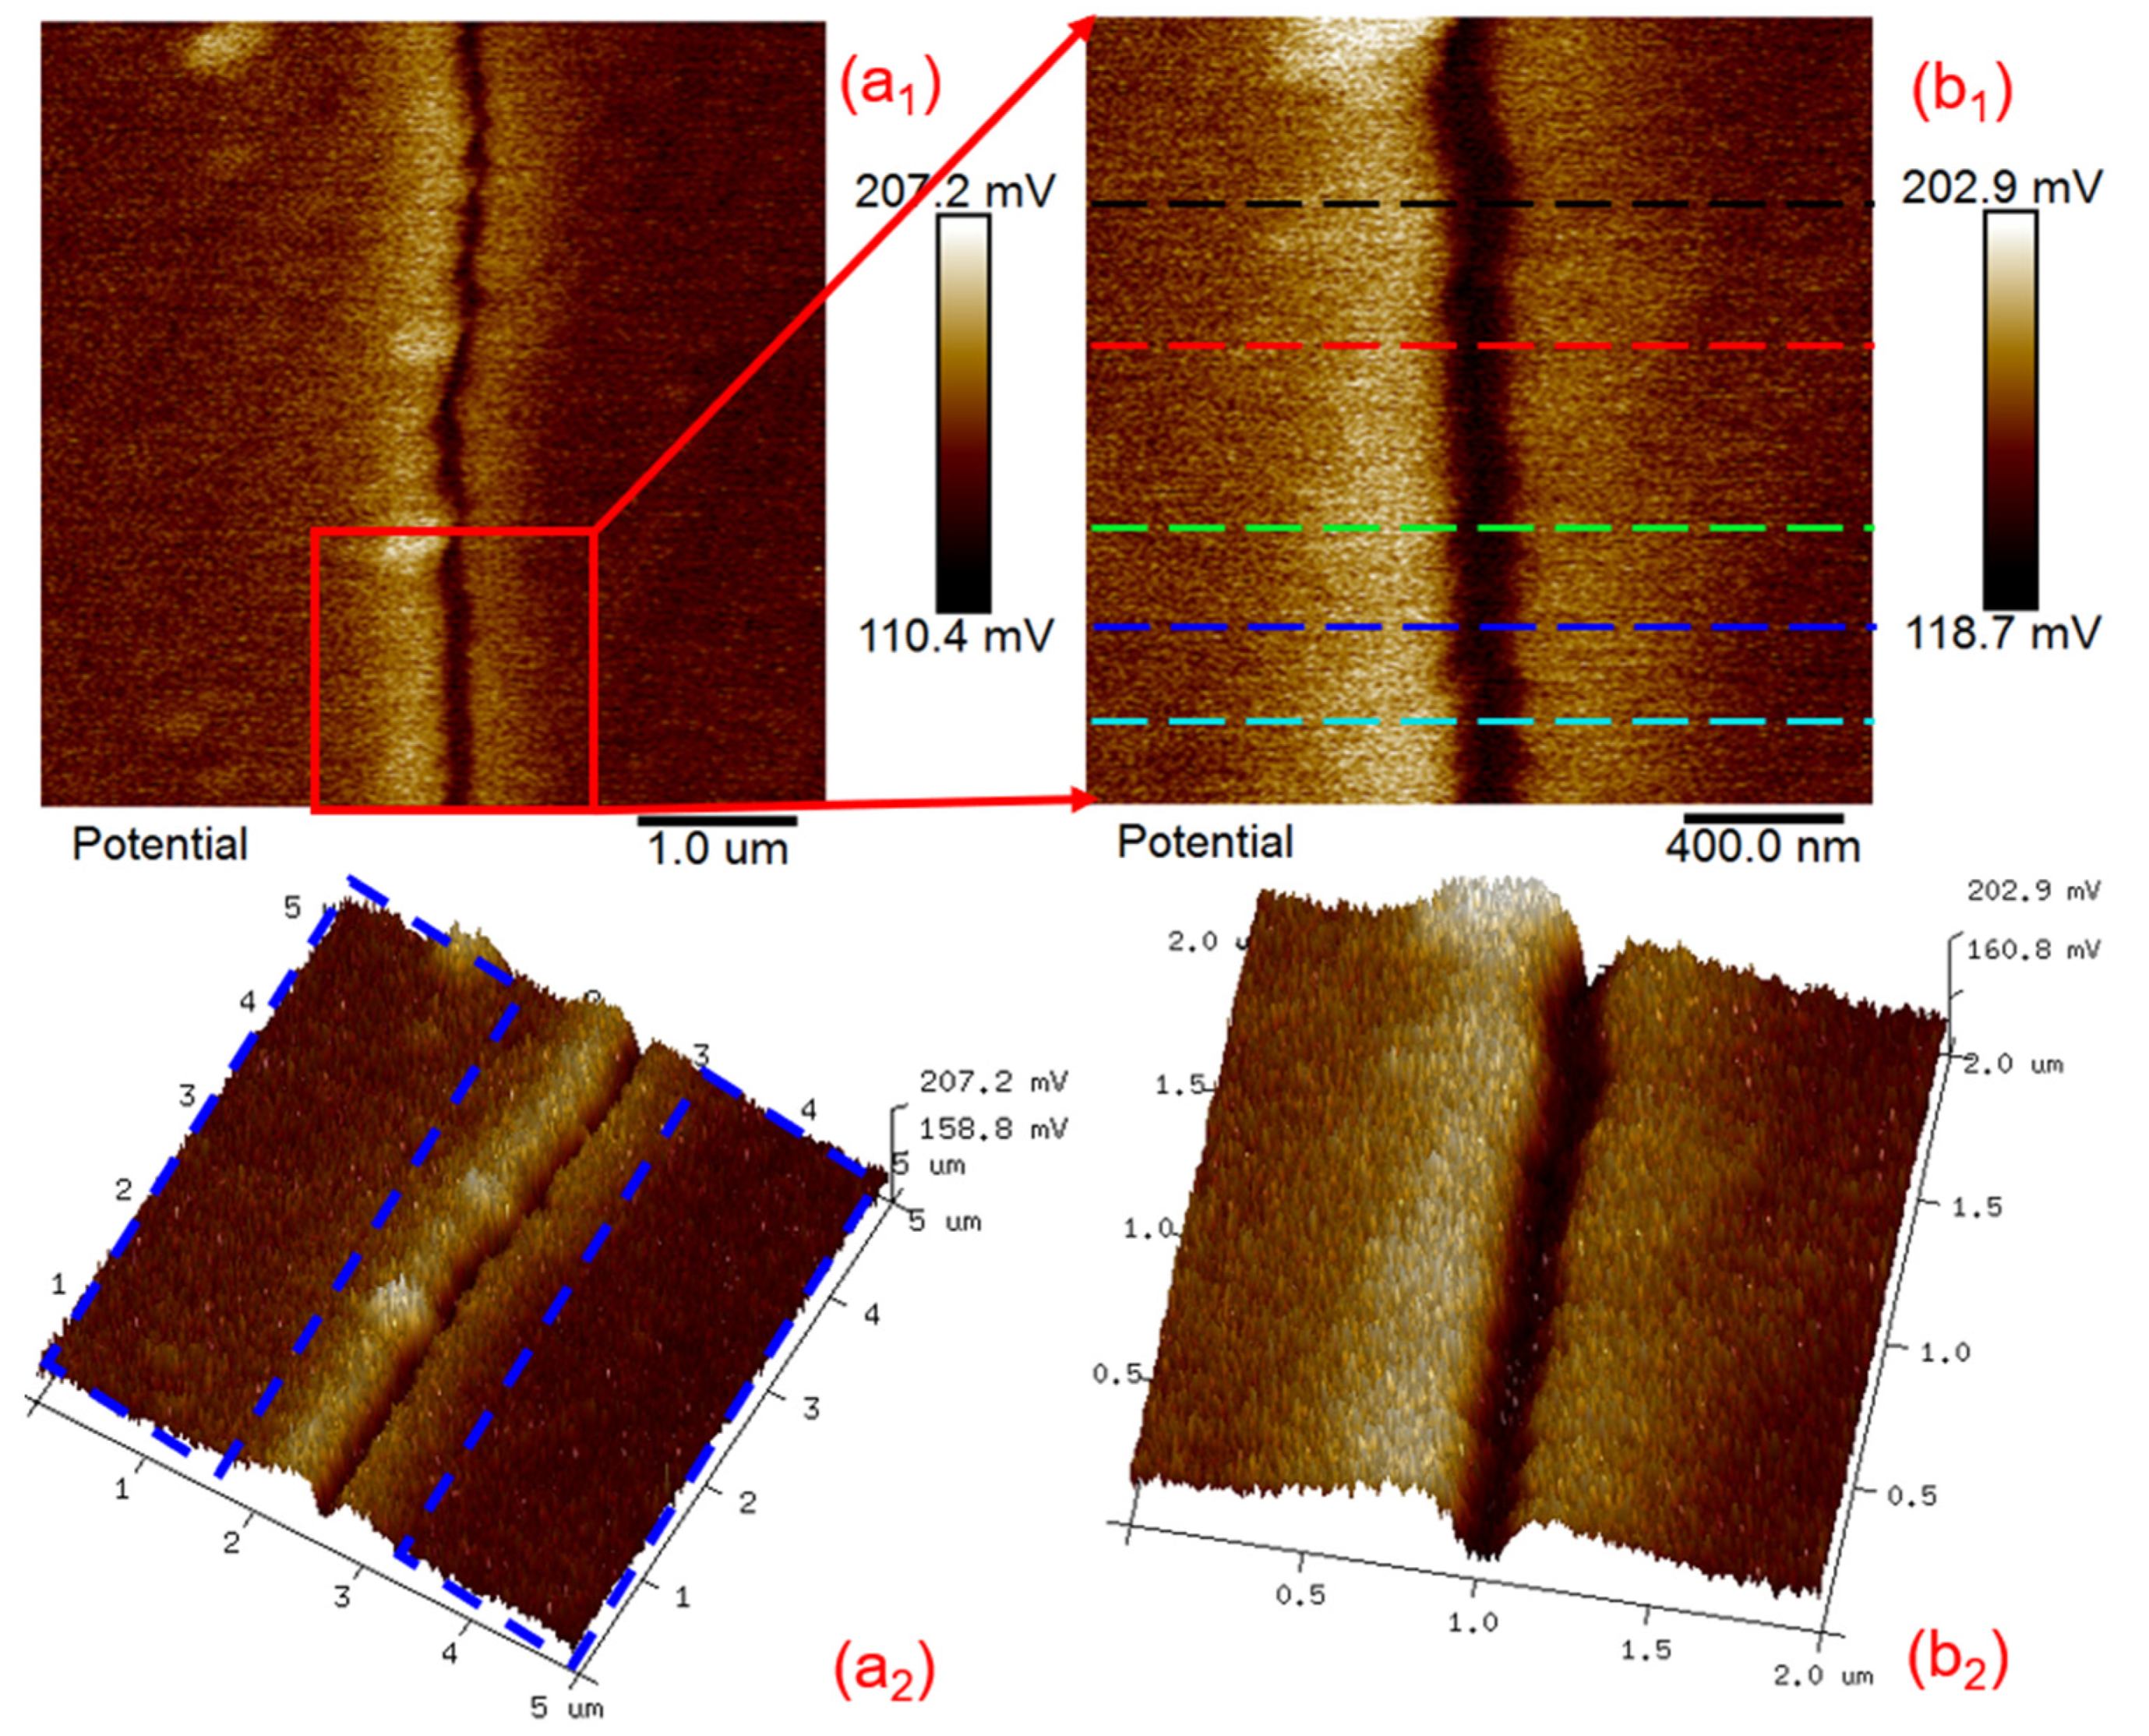
Figure 9(a1,a2) are 2D and 3D images of the surface potential distribution around the new microcracks, respectively, with a scale of 5 μm × 5 μm, Figure 9(b1,b2) are partial and enlarged views of Figure 9(a1,a2), respectively, with a scale of 2 μm × 2 μm. In the figure, bright colors represent higher surface potential, while dark colors represent lower surface potential. Therefore, it is clear that the surface potential at the microcrack edge is significantly higher than that at other locations far from the microcrack.
However, the surface potential of the unbroken surface does not have this obvious feature, and the surface potential distribution is more discrete and random, as shown by the blue line in Figure 9(a2). The value of surface potential in Figure 9(a1,b1) was analyzed, and the proportion distribution was found, as shown in Figure 10. Figure 10 shows that the surface potential varies from 121.16 mV to 201.37 mV on the scale of 5 μm × 5 μm, while, on the scale of 2 μm × 2 μm, the surface potential changes between 123.95 and 192.29 mV. The former is more discrete than the latter, which reflects the heterogeneity of the coal sample and illustrates that the larger the scale is, the more obvious the heterogeneity, which is similar to the conclusion studied by Tian et al. [24]. It also shows that the distribution of surface potential on the scale of 5 μm × 5 μm and 2 μm × 2 μm conforms to the normal distribution, and the R2 values are 0.9896 and 0.9565, respectively.
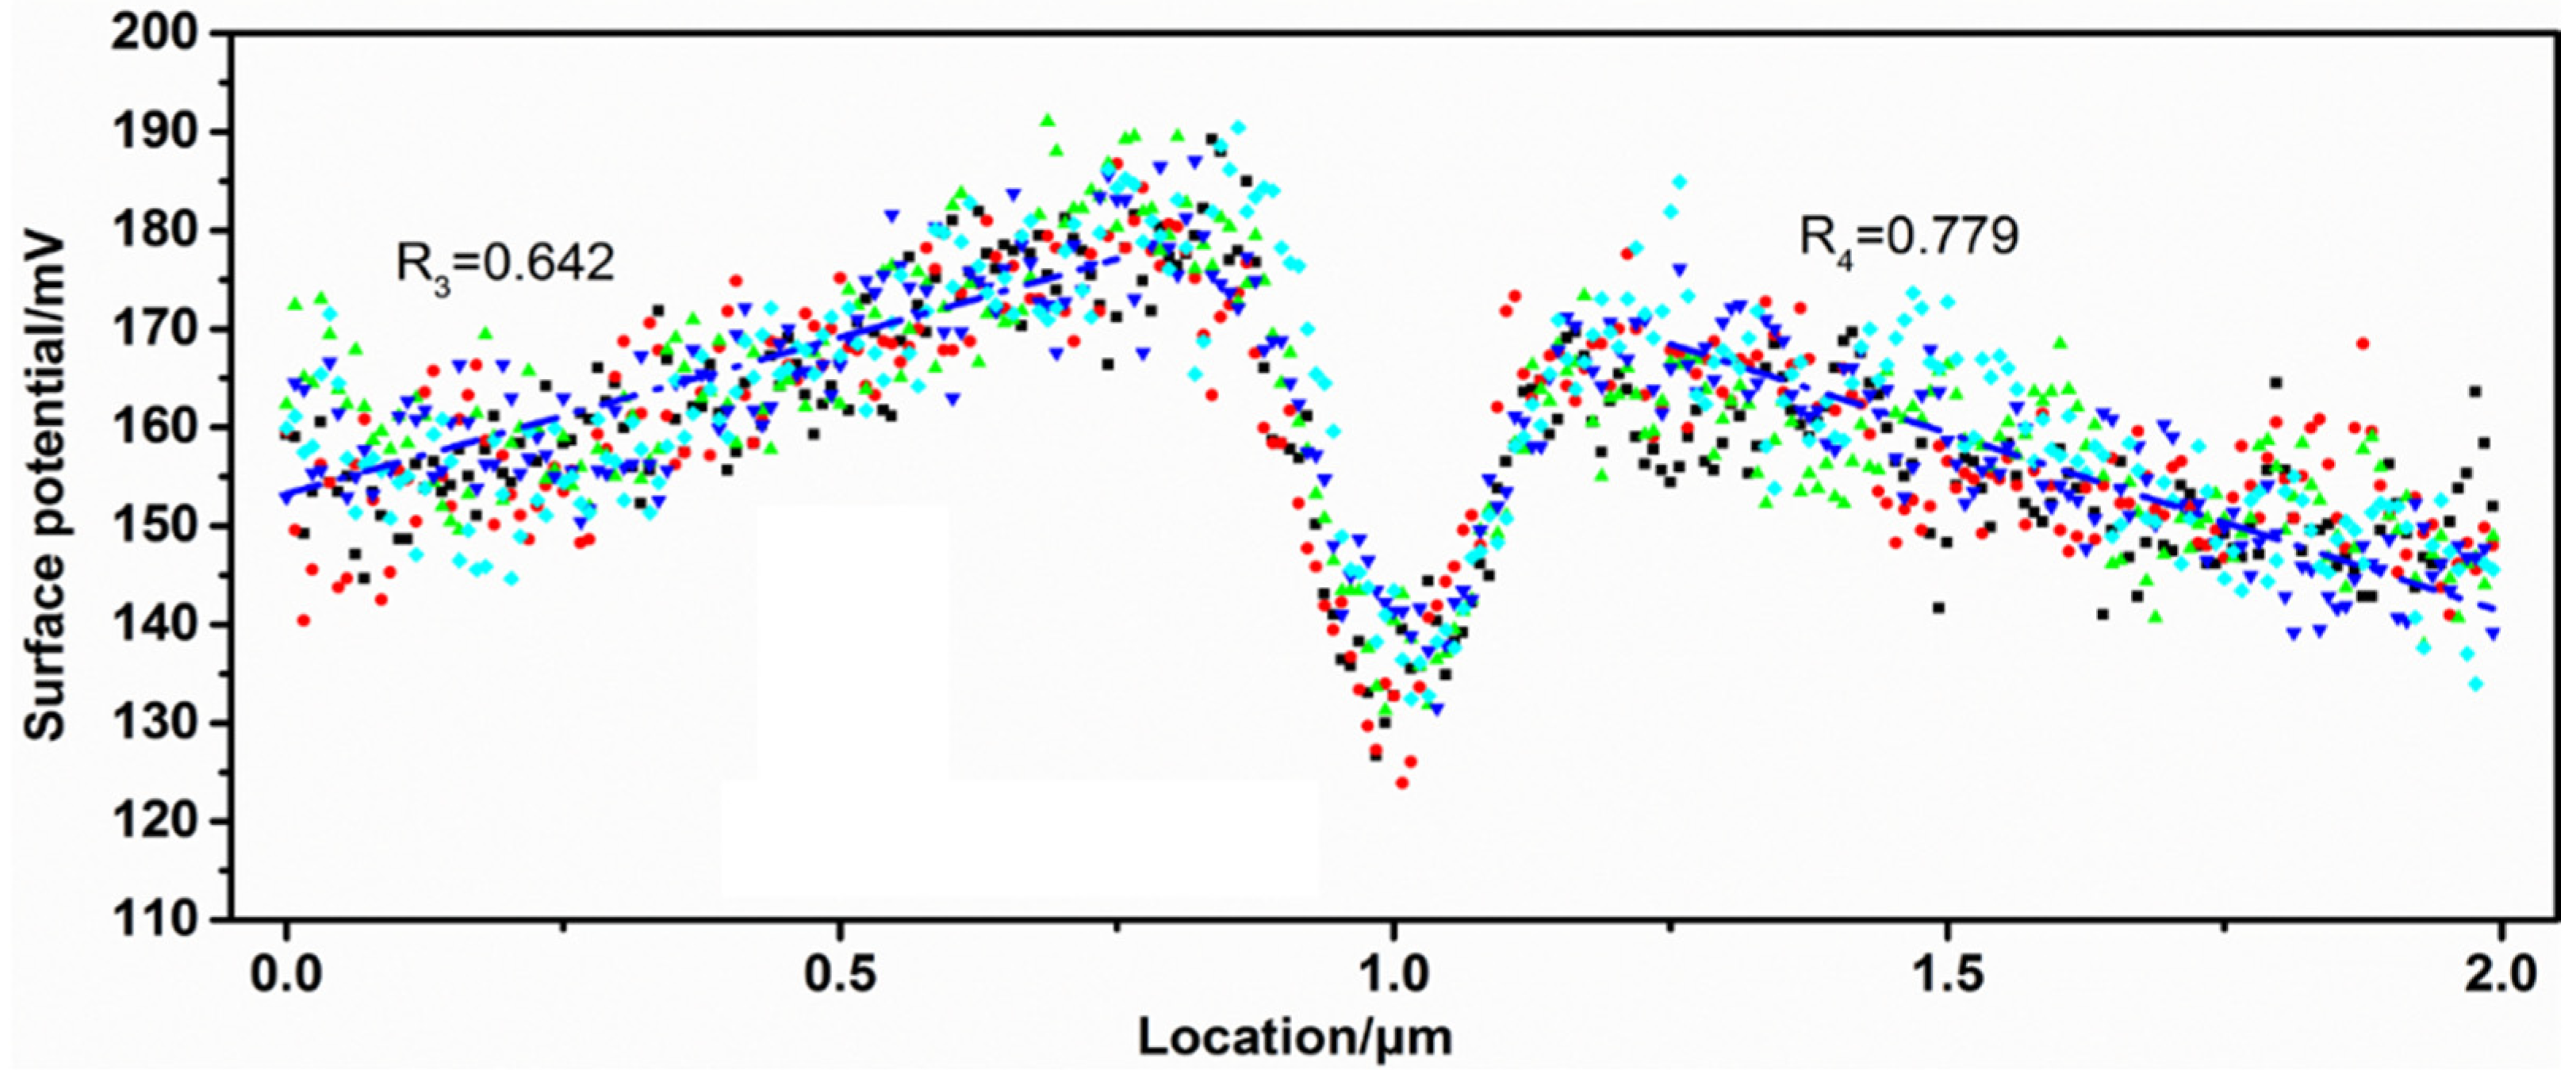
The cross-sectional data at the five dotted lines in Figure 9(b1) were extracted, and the surface potential cross-sections were plotted, as shown in Figure 11. The surface potential of the 0~0.75 μm segment on the left side of the microcrack and that of the 1.25 μm~2.0 μm segment on the right side of the microcrack on the blue cross-section are fitted separately, as shown in Figure 11. Two slope fitting straight lines are acquired, and the fitting degrees R2 are 0.642 and 0.779, respectively. These two fitting lines also clearly show that the surface potential of the 0~0.75 μm segment shows a gradually increasing trend with increasing distance and that of the 1.25 μm~2.0 μm segment shows a gradually decreasing trend with increasing distance. However, they have two characteristics in common. One is that the closer the material on the surface is to the crack, the higher the surface potential is, and the other is that the difference between the maximum and minimum surface potential values is approximately 25 mV.

5. Discussion

5.1. The Reason for the Changes of Electro-Mechanical Characteristics before and after Fracture

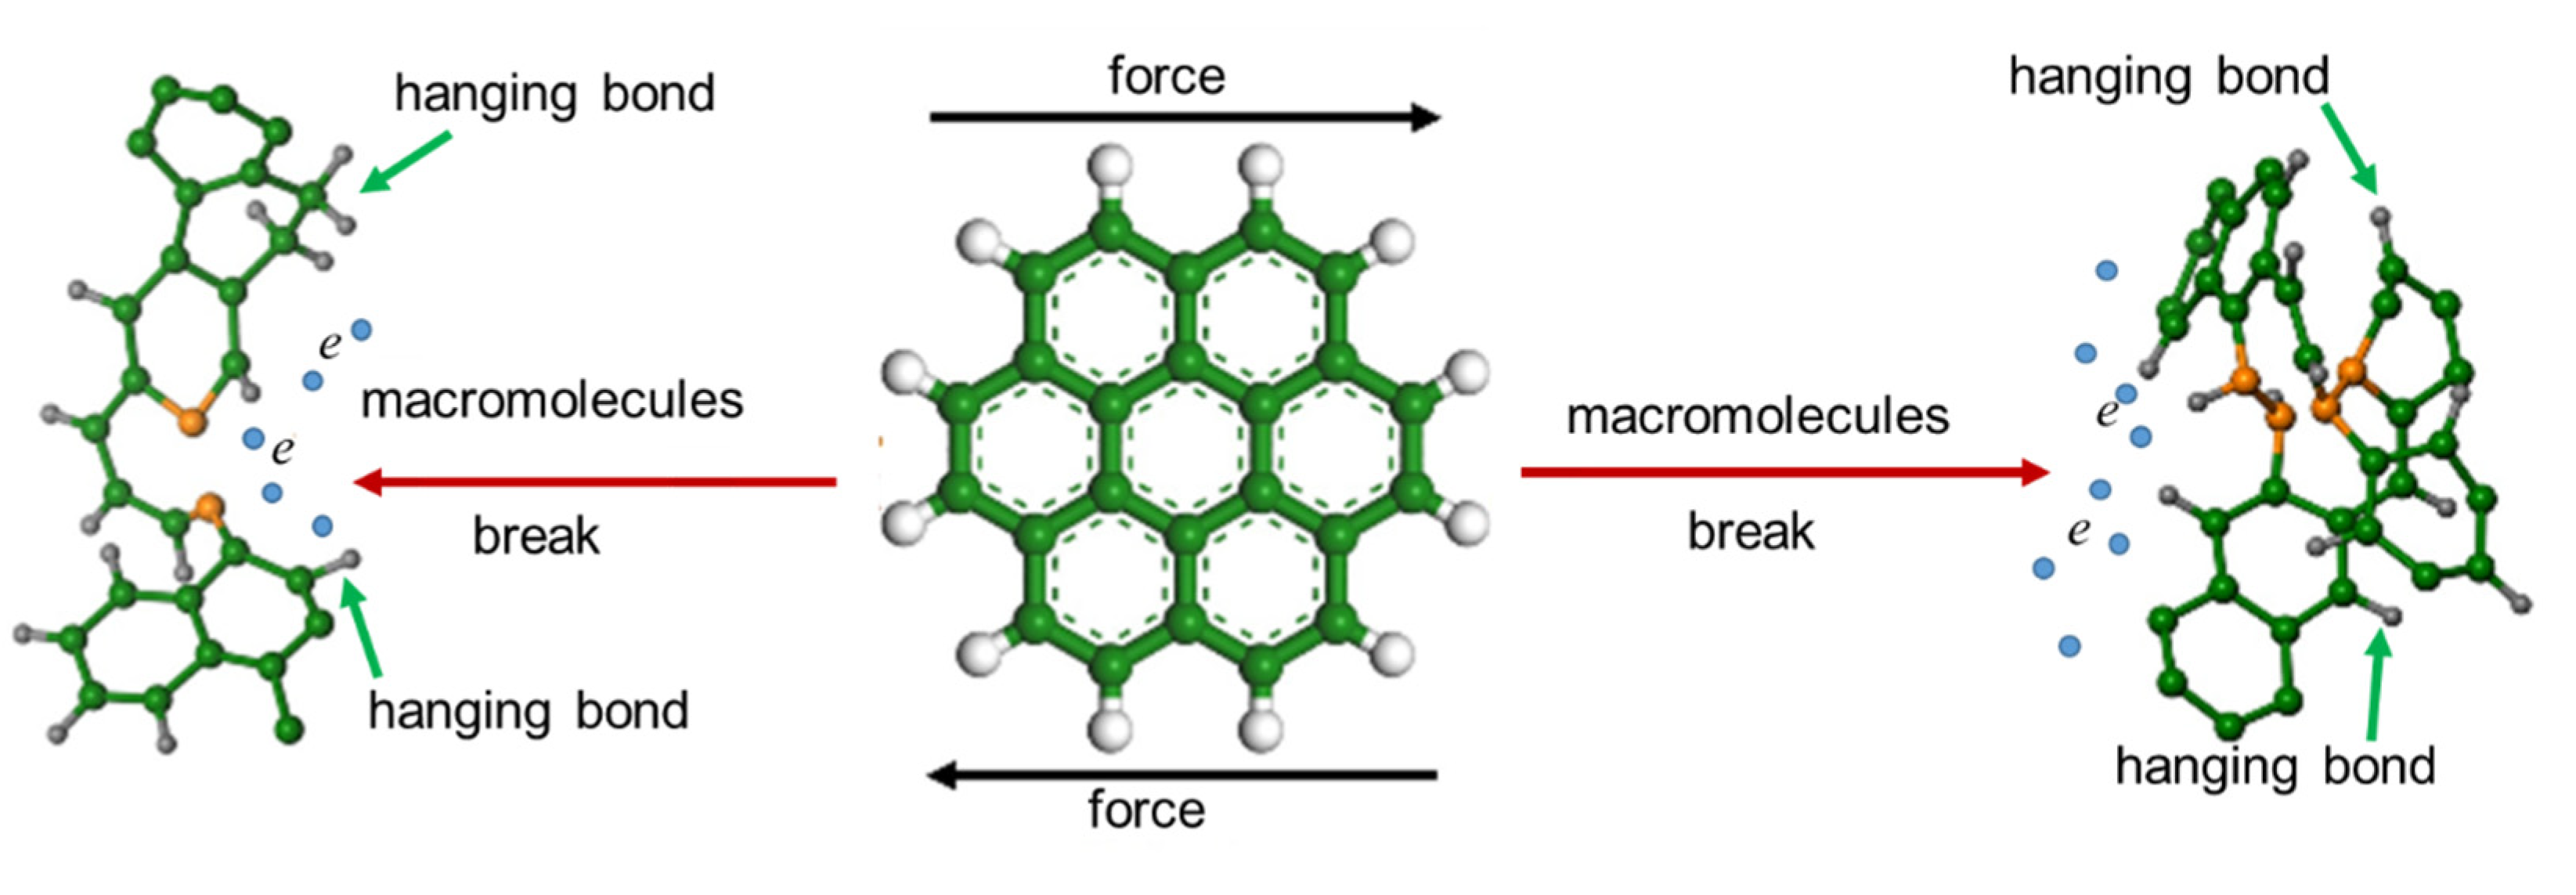
The macromolecule of coal is a three-dimensional structure formed by a plurality of structurally similar but not identical basic elements connected by bridge bonds [37,38]. These bridge bonds include methine bonds (–CH2), ether bonds (–O–), thioethers (–S–), methine ethers (–O–CH2–), and aromatic carbon-carbon bonds (C=C) [39]. The bridge bonds at the joints of these basic elements have lower bond energies and are prone to damage. Since the essence of the bridge bond is the electrical interaction, charge transfer occurs when the bridge bonds break during the damage of the coal mass, resulting in a change in the surface charge distribution of coal, as shown in Figure 10. At the same time, these broken bridge bonds form some dangling bonds on the section and will also charge the coal surface.
Anthracite contains hydroxyl groups (–OH), carbonyl groups (C=O), C–O groups, hydrogen bonds (–H) [40,41], etc. Because the electronegativity of oxygen atoms is strong, the attraction to electrons is much greater than that of hydrogen atoms and carbon atoms, causing the common electron pair formed by the corresponding groups to be biased toward oxygen atoms, thereby resulting in the hydroxyl group (–OH), the carbonyl group (C=O), and the CO group, which have a strong polarity. Due to the presence of polar groups in the coal [42], the electrical distribution of the coal surface is nonuniform, which leads to the coal mass exhibiting certain weak electric properties at the nanoscale. Additionally, previous studies by Epstein and Shubina [43] have shown that hydrogen bonds affect the surface potential of coal.
Anthracite also has a large amount of C=C bonds, which are mainly present on aromatic rings, including polycondensed aromatic rings, hydrogenated aromatic rings, and various heterocyclic rings [44]. These aromatic rings contain aromatic π-electrons, which are electron donors or electron acceptors, showing some electrical properties [45,46]. In addition, the six-π-electron in the benzene molecule is located on the large π bond orbit, forming the closed-shell electron configuration. The electrons above and below the ring plane can migrate in the delocalized π molecular orbit, which shows the charge transfer phenomenon. Therefore, the existence of π electrons provides a source for the surface charge of coal. In addition, a large number of graphite microcrystalline structures, which are also prone to surface-related electrical phenomena under external disturbances, of the aromatic layer have been formed in anthracite.
At the molecular scale, the molecules of the coal are in equilibrium before the fracture. When the sample surface is broken by the load, the force between the molecules in the equilibrium state becomes nonequilibrium. The molecules on the new microcrack walls lose the balance of the force among molecules in the three-dimensional structure due to the lack of adjacent molecules. The molecules of the new surface molecular layer move because of the interaction and seek a new equilibrium position to reduce the energy of the system. The structure (such as bond length and bond angle, etc.) of the nonequilibrium molecule then changes and finally reaches a stable equilibrium, as shown in Figure 12. When the probe tip acts on the edge of the new microcrack, the force between the probe tip and the surface molecules makes the surface molecules displace in different directions, since the energy of the molecular system at the edge of the new microcrack decreases and the molecule at the edge of the new microcrack has free space on both sides in the physical structure. In this process, the deformation of the material at the microcrack edge increases under the same peak force, the elastic modulus decreases, and the adhesion increases, as shown in Figure 7. Similarly, due to the relatively unstable molecular structure at the microcrack edge, when the surface potential is tested, the phenomenon of molecular polarization and the deviation of the positive and negative charge centers in the molecule are more likely to occur, resulting in a higher surface potential, as shown in Figure 9.
When the coal is deformed and destroyed, the internal crack evolution causes the friction force among the mineral particles, impurities, and cements to do work [47]. A part of the mechanical energy is converted into heat energy to generate a thermal effect, which causes the friction surface temperature to rise [48]. When friction heats the crack, electrons will be excited. These electrons escape into space, leading to a rise in the surface potential at the crack edge, as shown in Figure 9.
In summary, the elastic modulus of coal at the crack edge decreases, which is caused by the loss of the force balance among coal molecules in the three-dimensional state. The surface potential of the coal at the crack edge increases. On the one hand, the molecular structure at the crack edge is relatively unstable, and phenomena such as molecular polarization and deviation of the center of positive and negative charges in the molecule are more likely to be caused. On the other hand, it is caused by the increase in the energy of molecules and the excitation of more electrons due to friction heating.

5.2. Effect of Coal Fracture on EMR

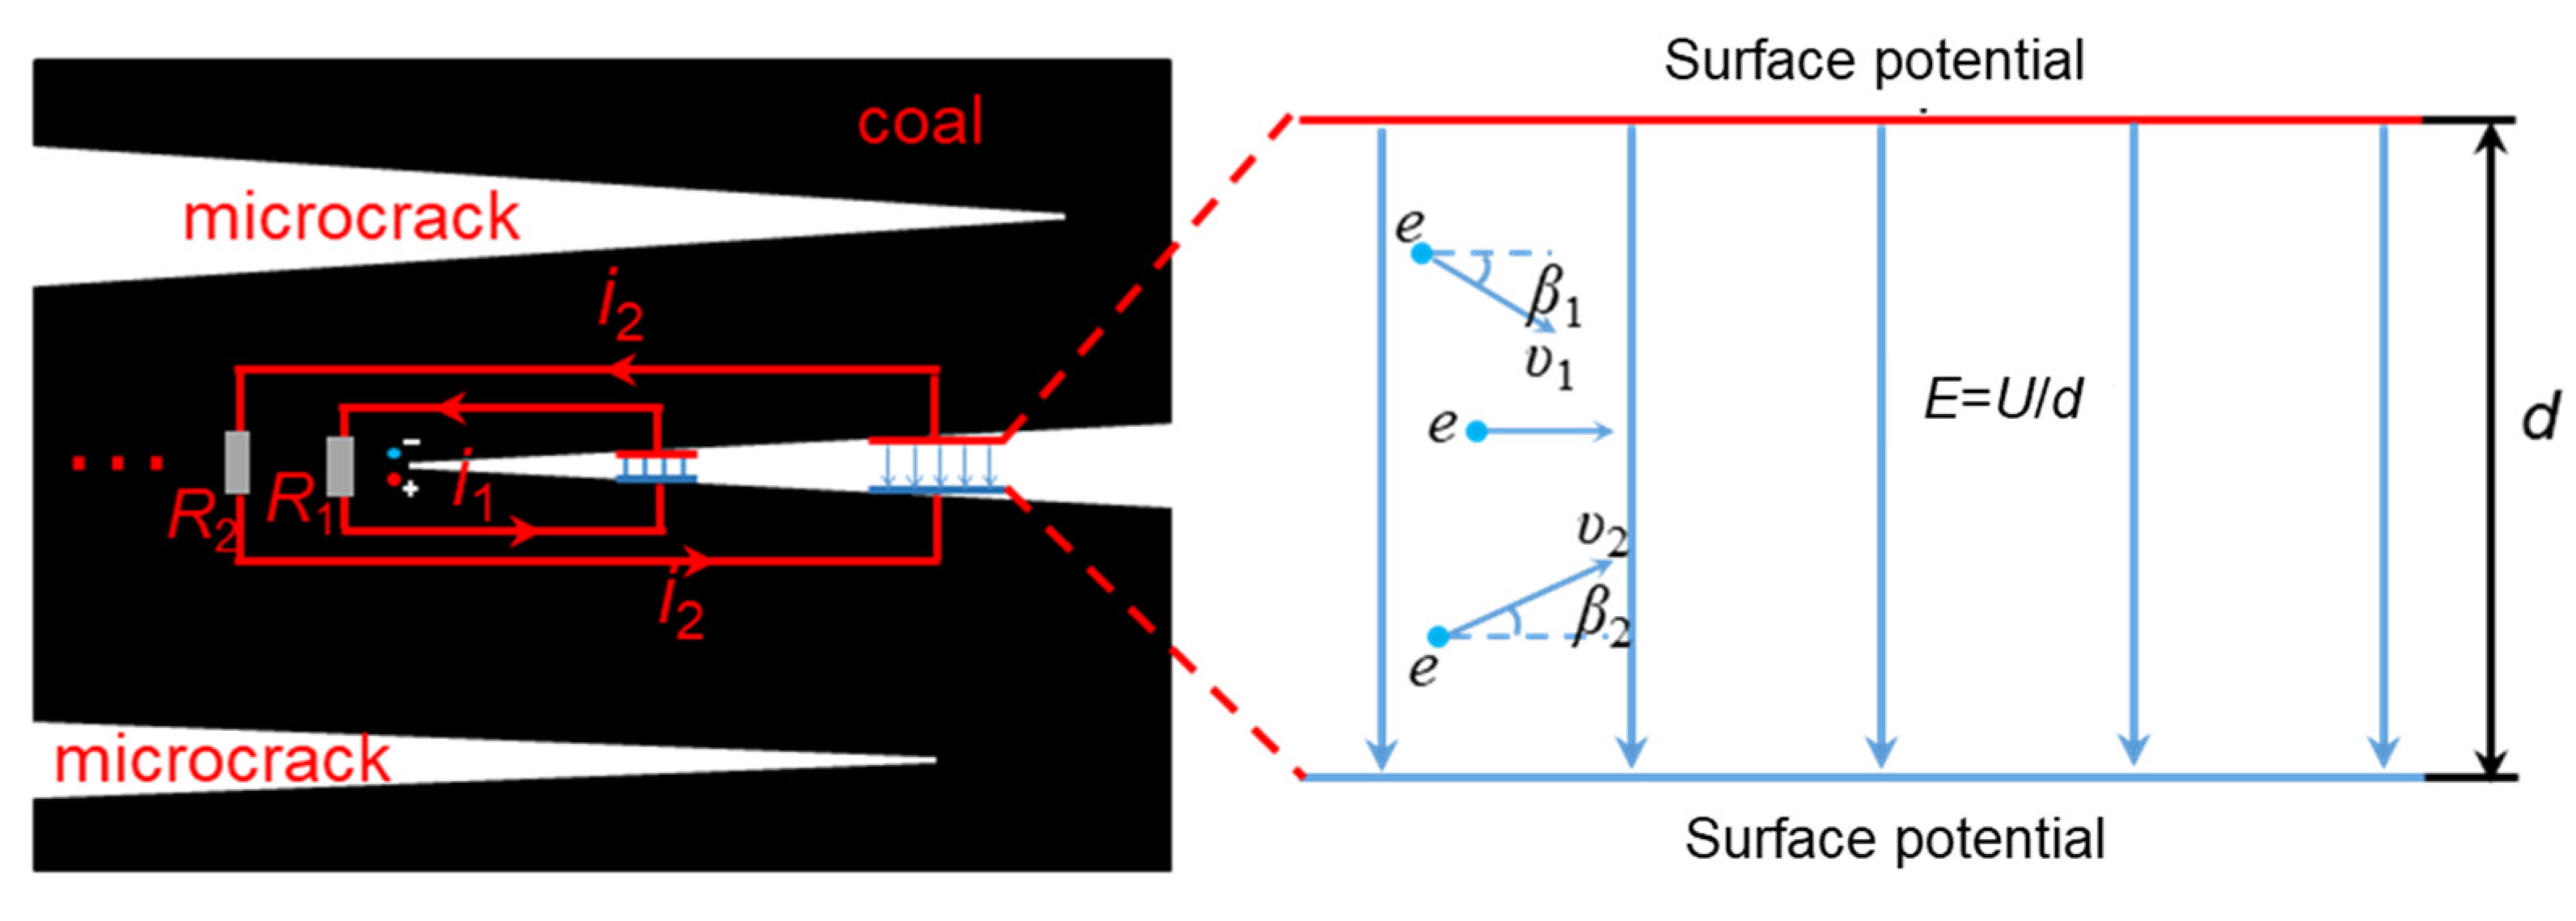
Coal can be regarded as the conductor of electricity, and many similar parallel-plate capacitors will be formed at the microcrack tip of coal during the fracture process [49], as shown in Figure 13. At the nanoscale, when the coal is broken, the bulges in the coal will be separated, and many nano similar parallel-plate capacitors will be formed between the bulges on the new microcrack tips. It is assumed that the area of the two opposite parallel plates of the similar parallel-plate capacitor is very small, less than 100 nm2, and the electric field between them is regarded as a uniform electric field. It can be obtained from this work that electrons are generated during coal fracture. These electrons can produce EMR when they move in a uniform electric field of the nano similar parallel-plate capacitor, according to Equations (6) and (7).
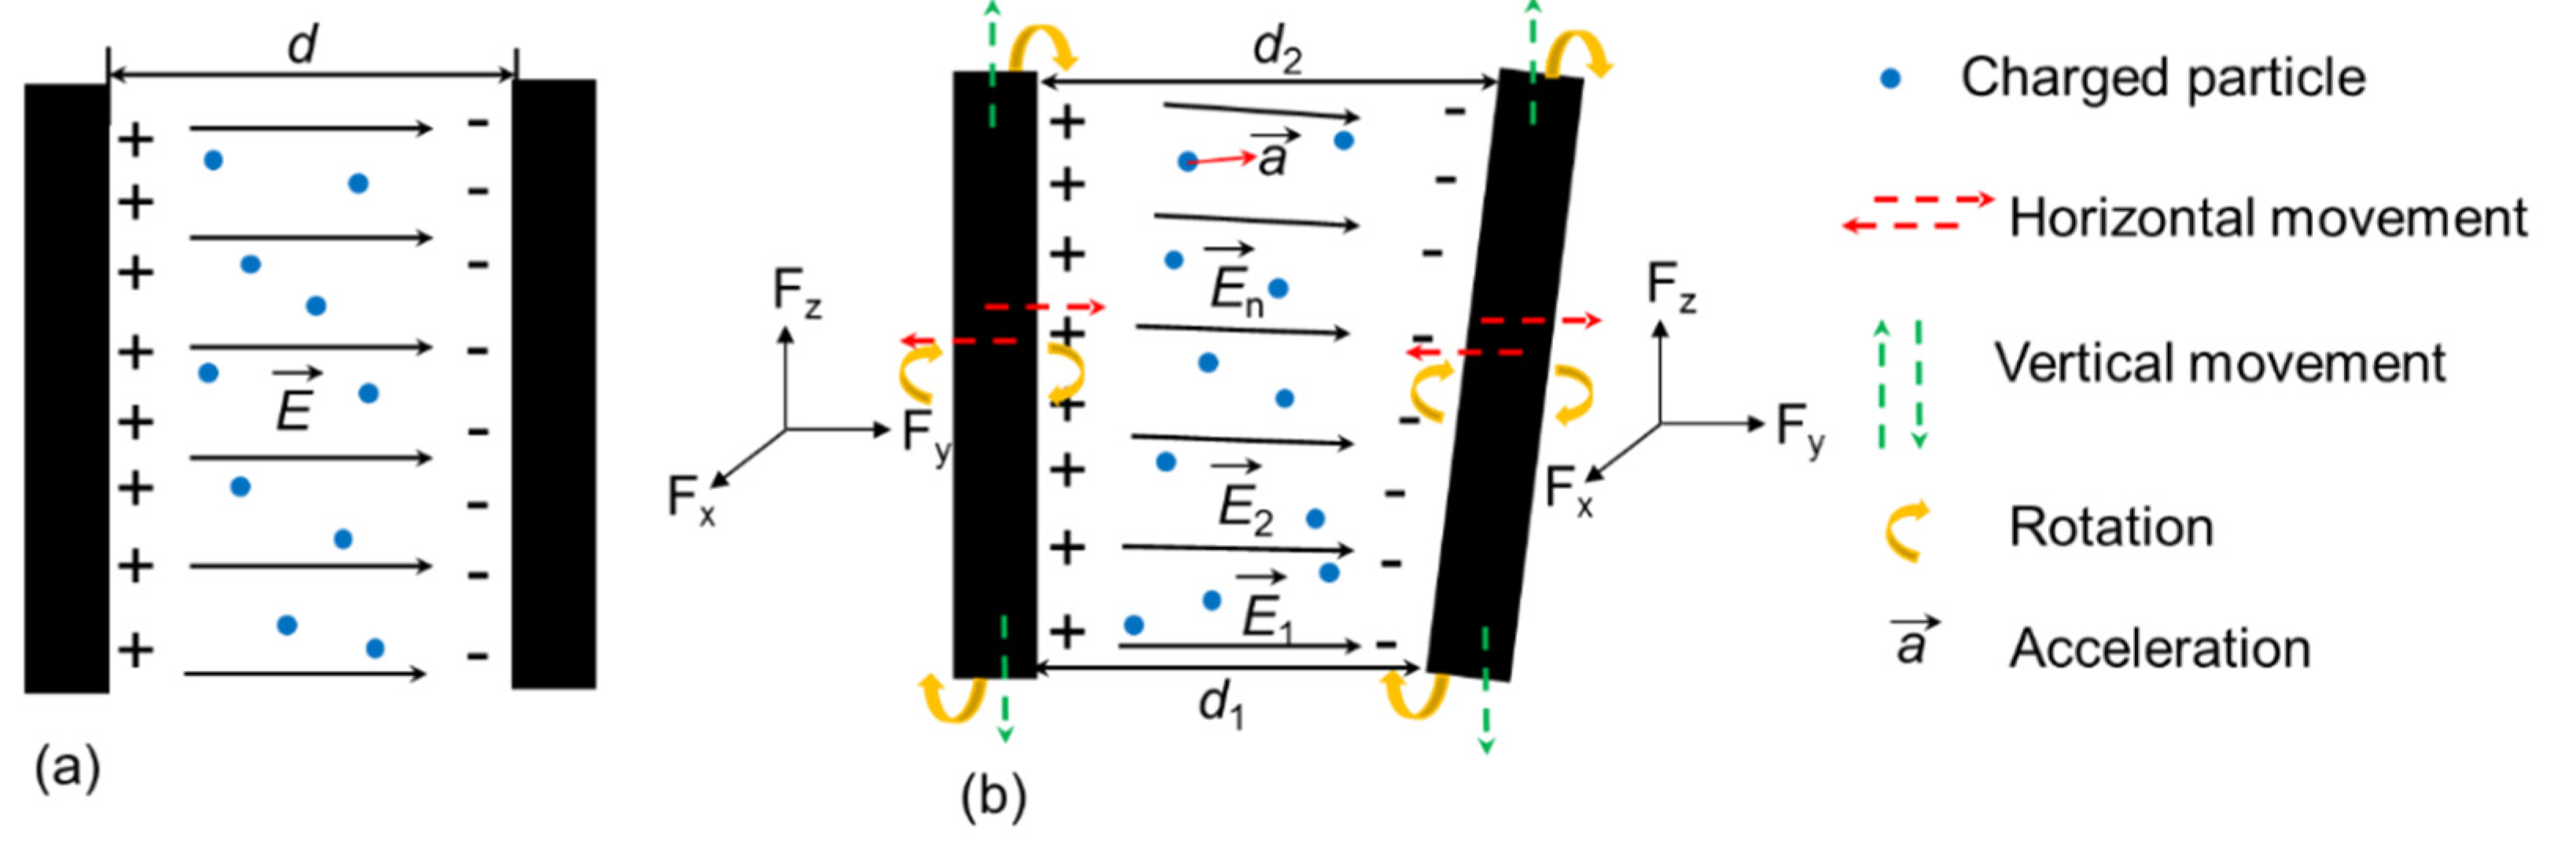
In this study, we found that the rate of crack propagation accelerated with loading, as shown in Section 4.1, and the micro elastic modulus of the coal sample was nonuniform, as explained in Section 4.3. When the coal mass is stressed, the micro elements of coal have different deformations, which leads to different crack propagation speeds at the interface of different micro elements. Therefore, with the evolution of the coal structure, the deformation and fracture of the coal mass are increasingly violent. The number of electrons generated per unit of time becomes more different, and the velocities of electrons vary. Moreover, due to the uneven distribution of the potential (|U|∈(121.16 mV, 201.37 mV)) on the microsurface, as illustrated in Section 4.4, the potential on the two parallel plates is not evenly distributed. The distance d between the two parallel plates of similar parallel-plate capacitors in the coal varies with time due to the interaction of the three-dimensional nonuniform stress Fx, Fy, Fz, as shown in Figure 14. The strength and frequency of the electric and magnetic fields excited in each similar parallel-plate capacitor vary. Because the electric and magnetic fields are vectors, their superposition meets the principle of vector superposition. Then, EMR waves with multiple frequencies and different intensities are generated.

6. Conclusions

(1) At a loading rate of 0.05 mm/min, the average velocities of microcrack propagation in the same time interval are 9.5 μm/s, 12.1 μm/s, and 16.2 μm/s, which indicates that the velocity increases with microcrack propagation at a constant loading rate. The elastic modulus of the material at the edge of the coal microcrack is smaller than that of the material around the edge of the coal microcrack, while the adhesion and deformation are larger. The closer the material is to the microcrack, the higher the surface potential is. The microfracture changes the structure of the surface material at the microcrack edge by breaking the bridge bonds of the coal macromolecules, which affects the mechanical and electrical properties of the coal.
(2) The mechanical properties of the coal at the microcrack edge change, which is caused by the loss of the force balance among the coal macromolecules in the three-dimensional state. The surface potential of the coal at the crack edge increases. On the one hand, the macromolecular structures at the crack edge are relatively unstable, and more likely to cause phenomena such as molecular polarization and deviation of the center of positive and negative charges in macromolecules. On the other hand, it is caused by the increase in the energy of molecules and the excitation of more electrons due to friction heating.
(3) Many nano similar parallel-plate capacitors will be formed at the coal microcrack tip during the fracture process, and electrons can produce EMR when they move in a uniform electric field of the similar parallel-plate capacitor. For one similar parallel-plate capacitor, the strength and frequency of the electric and magnetic fields excited by many electrons vary. Because the electric and magnetic fields are vectors, their superposition meets the principle of vector superposition. Then, for amounts of similar parallel-plate capacitors formed at time T, EMR waves with multiple frequencies and different intensities are generated.

Author Contributions

Conceptualization, W.W. and D.S.; Methodology, W.W. and X.H.; Validation, W.W. and Z.L.; Formal Analysis, Q.L.; Investigation, W.W. and Z.L.; Data Curation, W.W.; Writing—Original Draft Preparation, W.W.; Writing—Review & Editing, W.W., D.S. and Q.L.; Visualization, W.W. and L.Q.; Supervision, D.S.; Project Administration, X.H.; Funding Acquisition, D.S., X.H. and G.M. All authors have read and agreed to the published version of the manuscript.

Funding

This work was financially supported by the National Key Research and Development Program of China (2018YFC0604605), the National Natural Science Foundation of China (51634001, 51774023), Beijing Nova Program (xx2018073), the Fundamental Research Funds for the Central Universities (FRF-TP-18-007C1), and the State Scholarship Fund of China organized by the China Scholarship Council (2018–2019).

Data Availability Statement

Not applicable.

Conflicts of Interest

The authors declare no conflict of interest.

References

  1. He, X.; Zhou, C.; Song, D.; Li, Z.; Cao, A.; He, S.; Khan, M. Mechanism and monitoring and early warning technology for rockburst in coal mines. Int. J. Miner. Met. Mater. 2021, 28, 1097–1111. [Google Scholar] [CrossRef]
  2. He, S.; Song, D.; Li, Z.; He, X.; Chen, J.; Li, D.; Tian, X. Precursor of Spatio-temporal Evolution Law of MS and AE Activities for Rock Burst Warning in Steeply Inclined and Extremely Thick Coal Seams Under Caving Mining Conditions. Rock Mech. Rock Eng. 2019, 52, 2415–2435. [Google Scholar] [CrossRef]
  3. Bahadori, M.; Amnieh, H.; Khajezadeh, A. A new geometrical-statistical algorithm for predicting two-dimensional distribution of rock fragments caused by blasting. Int. J. Rock Mech. Min. Sci. 2016, 86, 55–64. [Google Scholar] [CrossRef]
  4. Qiu, L.; Zhu, Y.; Song, D.; He, X.; Wang, W.; Liu, Y.; Xiao, Y.; Wei, M.; Yin, S.; Liu, Q. Study on the Nonlinear Characteristics of EMR and AE during Coal Splitting Tests. Minerals 2022, 12, 108. [Google Scholar] [CrossRef]
  5. Qiu, L.; Liu, Z.; Wang, E.; He, X.; Feng, J.; Li, B. Early-warning of rock burst in coal mine by low-frequency electromagnetic radiation. Eng. Geol. 2020, 279, 105755. [Google Scholar] [CrossRef]
  6. Ma, Y.; Nie, B.; He, X.; Li, X.; Meng, J.; Song, D. Mechanism investigation on coal and gas outburst: An overview. Int. J. Miner. Met. Mater. 2020, 27, 872–887. [Google Scholar] [CrossRef]
  7. Meng, F.; Zhou, H.; Wang, Z.; Zhang, L.; Kong, L.; Li, S.; Zhang, C. Experimental study on the prediction of rockburst hazards induced by dynamic structural plane shearing in deeply buried hard rock tunnels. Int. J. Rock Mech. Min. Sci. 2016, 86, 210–223. [Google Scholar] [CrossRef]
  8. Frid, V.; Vozoff, K. Electromagnetic radiation induced by mining rock failure. Int. J. Coal Geol. 2005, 64, 57–65. [Google Scholar] [CrossRef]
  9. Frid, V. Electromagnetic radiation method for rock and gas outburst forecast. J. Appl. Geophys. 1997, 38, 97–104. [Google Scholar] [CrossRef]
  10. Nitsan, U. Electromagnetic emission accompanying fracture of quart-bearing rock. Geophys. Res. Lett. 1977, 4, 333–336. [Google Scholar] [CrossRef]
  11. Cress, G.; Brady, B.; Rowell, G. Sources of electromagnetic radiation from fracture of rock samples in the laboratory. Geophys. Res. Lett. 1987, 14, 331–334. [Google Scholar] [CrossRef]
  12. Enomoto, Y.; Hashimoto, H. Emission of charged particles from indentation fracture of rocks. Nature 1990, 346, 641–643. [Google Scholar] [CrossRef]
  13. O’Keefe, S.; Thiel, D. A mechanism for the production of electromagnetic radiation during fracture of brittle materials. Phys. Earth Planet. Inter. 1995, 89, 127–135. [Google Scholar] [CrossRef]
  14. Kawaguchi, Y. Charged particle emission and luminescence upon bending fracture of granite. Jpn. J. Appl. Phys. 1998, 37, 3495. [Google Scholar] [CrossRef]
  15. Wang, E.; He, X. An experimental study of the electromagnetic emission during the deformation and fracture of coal or rock. Chin. J. Geophys. 2000, 43, 134–140. [Google Scholar] [CrossRef]
  16. Rabinovitch, A.; Frid, V.; Bahat, D. Surface oscillations-a possible source of fracture induced electromagnetic radiation. Tectonophysics 2007, 431, 15–21. [Google Scholar] [CrossRef]
  17. Han, J.; Huang, S.; Zhao, W.; Wang, S. Stress excited electrical dipole model for electromagnetic emission induced in fractured rock. Int. J. Appl. Electromagn. Mech. 2016, 52, 1023–1034. [Google Scholar] [CrossRef]
  18. Han, J.; Huang, S.; Zhao, W.; Wang, S.; Deng, Y. Study on electromagnetic radiation in crack propagation produced by fracture of rocks. Measurement 2019, 131, 125–131. [Google Scholar] [CrossRef]
  19. Rabinovitch, A.; Frid, V.; Bahat, D.; Goldbaum, J. Fracture area calculation from electromagnetic radiation and its use in chalk failure analysis. Int. J. Rock Mech. Min. Sci. 2000, 37, 1149–1154. [Google Scholar] [CrossRef]
  20. Frid, V.; Rabinovitch, A.; Bahat, D. Fracture induced electromagnetic radiation. J. Phys. D: Appl. Phys. 2003, 36, 1620. [Google Scholar] [CrossRef] [Green Version]
  21. Gade, S.; Sause, M. Measurement and study of electromagnetic emission generated by tensile fracture of polymers and carbon fibres. J. Nondestruct. Eval. 2017, 36, 9. [Google Scholar] [CrossRef] [Green Version]
  22. He, X.; Liu, X.; Song, D.; Nie, B. Effect of microstructure on electrical property of coal surface. Appl. Surf. Sci. 2019, 483, 713–720. [Google Scholar] [CrossRef]
  23. Wang, W.; Song, D.; He, X.; Liu, X.; Li, Z.; Tian, X. The heterogeneity and electro-mechanical characteristics of coal at the micro-and nanoscale. J. Geophys. Eng. 2019, 16, 717–728. [Google Scholar] [CrossRef]
  24. Tian, X.; Song, D.; He, X.; Liu, H.; Wang, W.; Li, Z. Investigation of micro-surface potential of coals with different metamorphism by AFM. Measurement 2021, 172, 108915. [Google Scholar] [CrossRef]
  25. Pashmforoush, F.; Fotouhi, M.; Ahmadi, M. Damage characterization of glass/epoxy composite under three-point bending test using acoustic emission technique. J. Mater. Eng. Perform. 2012, 21, 1380–1390. [Google Scholar] [CrossRef]
  26. Kozłowski, M.; Kadela, M.; Kukiełka, A. Fracture energy of foamed concrete based on three-point bending test on notched beams. Procedia Eng. 2015, 108, 349–354. [Google Scholar] [CrossRef] [Green Version]
  27. Zuo, J.; Xie, H.; Dai, F.; Ju, Y. Three-point bending test investigation of the fracture behavior of siltstone after thermal treatment. Int. J. Rock Mech. Min. Sci. 2014, 70, 133–143. [Google Scholar] [CrossRef]
  28. Lu, Y.; Li, W.; Wang, L.; Meng, X.; Wang, B.; Zhang, K.; Zhang, X. In-situ microscale visualization experiments on microcracking and microdeformation behaviour around a pre-crack tip in a three-point bending sandstone. Int. J. Rock Mech. Min. Sci. 2019, 114, 175–185. [Google Scholar] [CrossRef]
  29. Zhao, Y.; Zhao, G.; Jiang, Y. Experimental and numerical modelling investigation on fracturing in coal under impact loads. Int. J. Fract. 2013, 183, 63–80. [Google Scholar] [CrossRef]
  30. Tian, X.; Song, D.; He, X.; Liu, H.; Wang, W.; Li, Z. Surface microtopography and micromechanics of various rank coals. Int. J. Miner. Met. Mater. 2019, 26, 1351–1363. [Google Scholar] [CrossRef]
  31. Liu, J.; Wang, J.; Huang, J.; Cui, X.; Tan, L.; Liu, Q.; Zeng, H. Heterogeneous distribution of adsorbed bitumen on fine solids from solvent-based extraction of oil sands probed by AFM. Energy Fuels 2017, 31, 8833–8842. [Google Scholar] [CrossRef]
  32. Li, T.; Zeng, K. Nanoscale elasticity mappings of micro-constituents of abalone shell by band excitation-contact resonance force microscopy. Nanoscale 2014, 6, 2177–2185. [Google Scholar] [CrossRef] [PubMed]
  33. Huang, L.; Fang, H.; Chen, M. Experiment on surface charge distribution of fine sediment. Sci. China Technol. Sci. 2012, 55, 1146–1152. [Google Scholar] [CrossRef]
  34. Yan, L.; Englert, A.; Masliyah, J.; Xu, Z. Determination of anisotropic surface characteristics of different phyllosilicates by direct force measurements. Langmuir 2011, 27, 12996–13007. [Google Scholar] [CrossRef] [PubMed]
  35. Gao, Z.; Hu, Y.; Sun, W.; Drelich, J. Surface-charge anisotropy of scheelite crystals. Langmuir 2016, 32, 6282–6288. [Google Scholar] [CrossRef] [PubMed]
  36. Heald, M.; Marion, J. Classical Electromagnetic Radiation, 3rd ed.; Dover Publications, Inc.: New York, NY, USA, 2012. [Google Scholar]
  37. Casal, M.; Vega, M.; Diaz-Faes, E.; Barriocanal, C. The influence of chemical structure on the kinetics of coal pyrolysis. Int. J. Coal Geol. 2018, 195, 415–422. [Google Scholar] [CrossRef]
  38. Liu, X.; Song, D.; He, X.; Nie, B.; Wang, Q.; Sun, R.; Sun, D. Coal macromolecular structural characteristic and its influence on coalbed methane adsorption. Fuel 2018, 222, 687–694. [Google Scholar] [CrossRef]
  39. He, X.; Liu, X.; Nie, B.; Song, D. FTIR and Raman spectroscopy characterization of functional groups in various rank coals. Fuel 2017, 206, 555–563. [Google Scholar] [CrossRef]
  40. Zhou, C.; Zhang, Y.; Wang, J.; Xue, S.; Wu, J.; Chang, L. Study on the relationship between microscopic functional group and coal mass changes during low-temperature oxidation of coal. Int. J. Coal Geol. 2017, 171, 212–222. [Google Scholar] [CrossRef]
  41. Liu, X.; Song, D.; He, X.; Nie, B.; Wang, L. Insight into the macromolecular structural differences between hard coal and deformed soft coal. Fuel 2019, 245, 188–197. [Google Scholar] [CrossRef]
  42. Huheey, J. The electronegativity of groups. J. Phys. Chem. A. 1965, 69, 3284–3291. [Google Scholar] [CrossRef]
  43. Epstein, L.; Shubina, E. New types of hydrogen bonding in organometallic chemistry. Coord. Chem. Rev. 2002, 231, 165–181. [Google Scholar] [CrossRef]
  44. Krzesińska, M.; Szeluga, U.; Smędowski, Ł.; Majewska, J.; Pusz, S.; Czajkowska, S.; Kwiecińska, B. TGA and DMA studies of blends from very good coking Zofiówka coal and various carbon additives: Weakly coking coals, industrial coke and carbonized plants. Int. J. Coal Geol. 2010, 81, 293–300. [Google Scholar] [CrossRef]
  45. Liu, J.; Holuszko, M.; Mastalerz, M. Applications of micro-FTIR technique in studying hydrophobicity of coal. Int. J. Coal Geol. 2017, 178, 74–83. [Google Scholar] [CrossRef]
  46. Keiluweit, M.; Kleber, M. Molecular-level interactions in soils and sediments: The role of aromatic π-systems. Environ. Sci. Technol. 2009, 43, 3421–3429. [Google Scholar] [CrossRef] [PubMed]
  47. Ma, L.; Sun, H.; Zhang, Y.; Zhou, T.; Li, K.; Guo, J. Characteristics of infrared radiation of coal specimens under uniaxial loading. Rock Mech. Rock Eng. 2016, 49, 1567–1572. [Google Scholar] [CrossRef]
  48. Sun, H.; Ma, L.; Adeleke, N.; Zhang, Y. Background thermal noise correction methodology for average infrared radiation temperature of coal under uniaxial loading. Infrared Phys. Technol. 2017, 81, 157–165. [Google Scholar] [CrossRef]
  49. Ogawa, T.; Oike, K.; Miura, T. Electromagnetic radiations from rocks. J. Geophys. Res. Earth Surf. 1985, 90, 6245–6249. [Google Scholar] [CrossRef]
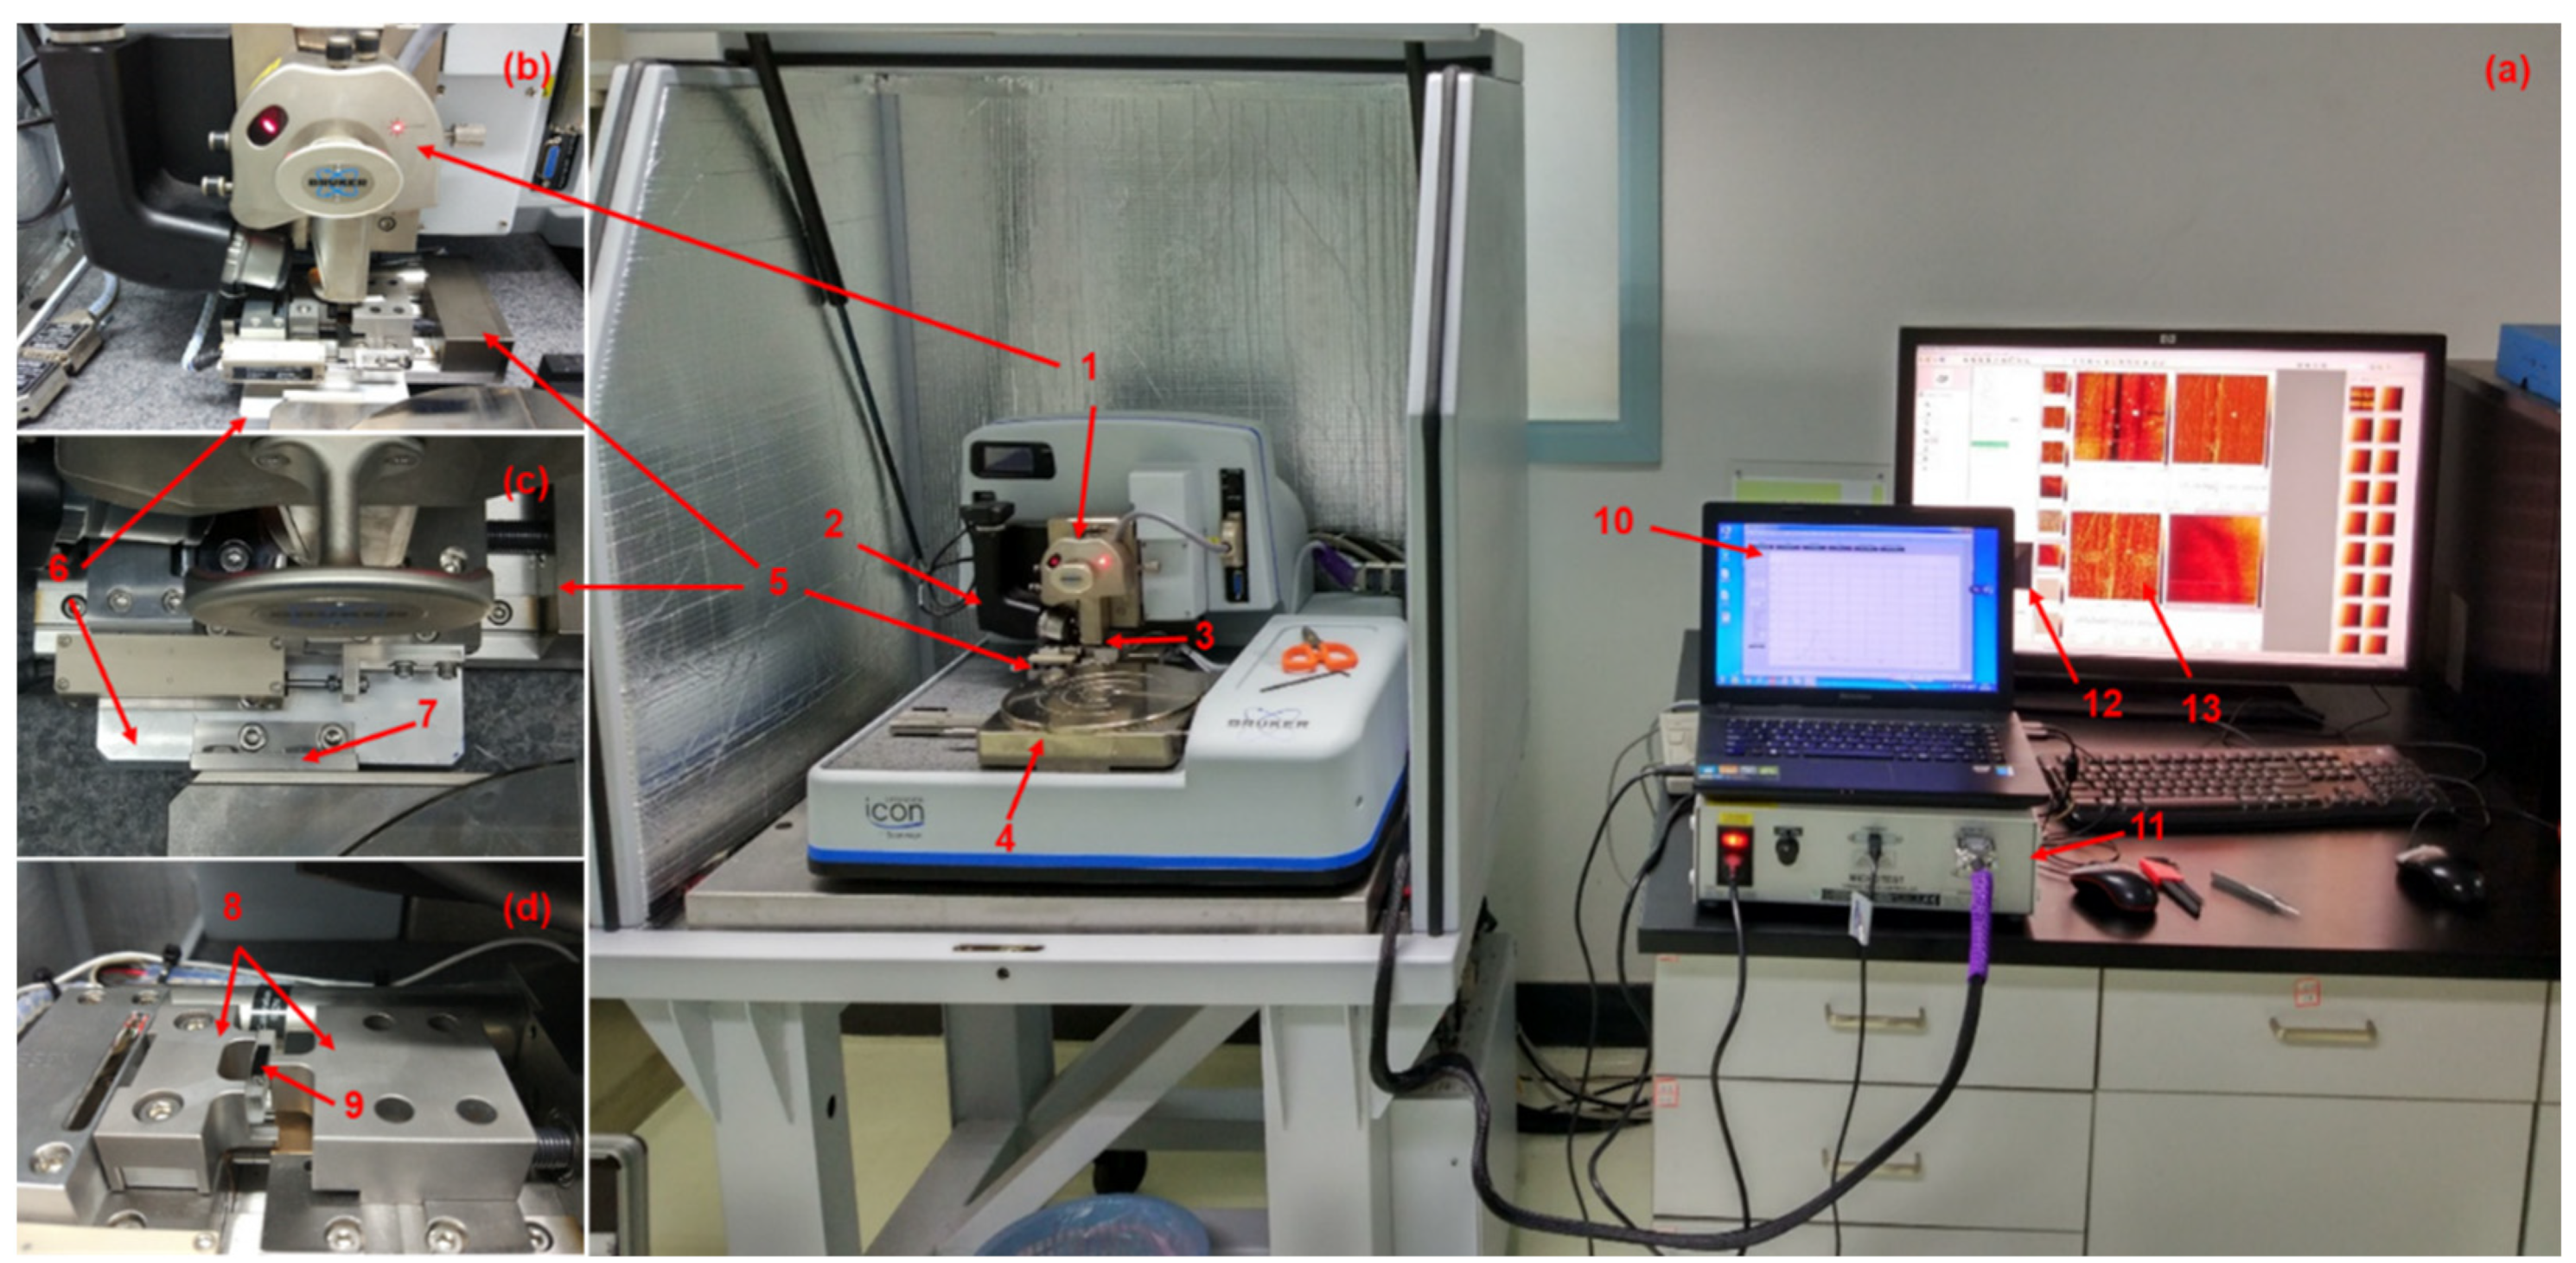
Figure 1. (a) Microdynamic loading test system (b) Enlarged view of AFM scanner and microdynamic loading device (c) Enlarged view of connection part (d) sample holder and sample; 1—Scanner, 2—Optical auxiliary system, 3—Probe clip and probe, 4—AFM sample stage, 5—Three-point bending microdynamic loading device, 6—Sliding ball base, 7—Right angle connection piece, 8—Three-point bending sample holder, 9—Sample, 10—Loading control software, 11—Loading controller, 12—Display screen of optical imaging system, 13—Figure tested by AFM.
Minerals 12 00582 g001
Figure 2. Process of sample preparation. (a) Block coal samples collected from the mine at one coal seam; (b) and (c) Irregular small coal samples obtained after breaking block coal sample; (d) YMP-1 grinding and polishing machine; (e) Regular small coal samples after polishing; (f) and (g) Small coal samples inlaid with epoxy resin and solidifying agent; (h) Regular small coal samples with 20 mm × 10 mm × 5 mm and evenly wrapped by the epoxy resin on both sides of the long side.
Minerals 12 00582 g002
Figure 3. Schematic of the three-point bending test and specimen geometry (a) and schematic of the experimental scheme (b).
Minerals 12 00582 g003
Figure 4. Dimensions of the notch.
Minerals 12 00582 g004
Figure 5. Microcrack propagation at different times. A, B and C—Positions of different microcrack widths. d1—Length of the crack propagation on the coal sample surface in 2.0 s~10.0 s; d2—Length of the crack propagation in 10.0 s~18.0 s; d3—Length of the crack propagation in 18.0 s~26.0 s.
Minerals 12 00582 g005
Figure 6. 2D images (a1,b1) and 3D images (a2,b2) of the microcrack morphology.
Minerals 12 00582 g006
Figure 7. Characterization of micro mechanical properties: (a1) 2D surface morphology; (b1) 2D elastic modulus; (c1) 2D adhesion; (d1) 2D deformation; (a2) 3D surface morphology; (b2) 3D elastic modulus; (c2) 3D adhesion; (d2) 3D deformation.
Minerals 12 00582 g007
Figure 8. Statistical distribution of microcrack elastic modulus (a), adhesion (b), and deformation (c).
Minerals 12 00582 g008
Figure 9. 2D images (a1,b1) and 3D (a2,b2) images of the surface potential about and around the new microcrack.
Minerals 12 00582 g009
Figure 10. Proportion distribution of surface potential and fitting curve in 2 μm × 2 μm and 5 μm × 5 μm.
Minerals 12 00582 g010
Figure 11. Cross-section of the surface potential in Figure 9(b1).
Minerals 12 00582 g011
Figure 12. Schematic of fracture of coal macromolecules under external force with electron release and hanging bond formation.
Minerals 12 00582 g012
Figure 13. Schematic of a similar parallel-plate capacitor formed at the coal microcrack tip.
Minerals 12 00582 g013
Figure 14. Schematic of the electric field and interface movement between microelement interfaces in the coal mass. (a) Uniform electric field and (b) changing electric field.
Minerals 12 00582 g014
Table 1. Proximate analysis and ultimate analysis of the coal sample.
Proximate Analysis wt (%)Ultimate Analysis wt (%, Daf)R0 (%)
MadAadVdafFCadCHONS2.7
3.077.136.5883.2287.493.505.922.460.63
Note: Mad and Aad represent the moisture content and the ash content on an air-dried basis, respectively; Vdaf is the volatile matter content on a dry-ash-free basis; and FCad is the fixed carbon on an air-dried basis. Oxygen was calculated by difference. R0 is the vitrinite reflectivity of coal.
Publisher’s Note: MDPI stays neutral with regard to jurisdictional claims in published maps and institutional affiliations.