Article

α-Fe2O3 Nanoparticles/Iron-Containing Vermiculite Composites: Structural, Textural, Optical and Photocatalytic Properties

by
Marta Valášková
1,*,
Kamila Kočí
1,
Jana Madejová
2,
Lenka Matějová
1,
Jiří Pavlovský
3,
Beatriz Trindade Barrocas
1 and
Kateřina Klemencová
1
1
Institute of Environmental Technology, CEET, VŠB-Technical University of Ostrava, 17. Listopadu 2172/15, 708 00 Ostrava-Poruba, Czech Republic
2
Institute of Inorganic Chemistry, SAS, Dúbravská Cesta 9, 845 36 Bratislava, Slovakia
3
Department of Chemistry and Physico-Chemical Processes, Faculty of Material Science and Technology, VŠB-Technical University of Ostrava, 17. Listopadu 2172/15, 708 00 Ostrava-Poruba, Czech Republic
*
Author to whom correspondence should be addressed.
Minerals 2022, 12(5), 607; https://doi.org/10.3390/min12050607
Submission received: 5 April 2022 / Revised: 22 April 2022 / Accepted: 8 May 2022 / Published: 11 May 2022

Abstract

:
Vermiculite two-dimensional mixed-layer interstratified structures are a very attractive material for catalysis and photocatalysis. The iron-containing vermiculite from the Palabora region (South Africa) and its samples, which calcined at 500 and 700 °C, were studied in comparison with the α-Fe2O3 nanoparticles/vermiculite composites for the first time as photocatalysts of methanol decomposition, which is an organic pollutant and an efficient source for hydrogen production. The aim of the work was to characterize their structural properties using X-ray fluorescence, X-ray diffraction, infrared spectroscopy, nitrogen physisorption, diffuse reflectance UV-Vis spectroscopy and photoluminescence spectroscopy to explain the photocatalytic effects. The photocatalytic test of the samples was performed in a batch photoreactor under UV radiation of an 8W Hg lamp. The photocatalytic activity of vermiculite–hydrobiotite–mica-like layers at different water hydration states in the interstratified structure and the substitution ratio of Fe(III)/Al in tetrahedra can initiate electrons and h+ holes on the surface that attack the methanol in redox processes. The activity of α-Fe2O3 nanoparticle photocatalysts stems from a larger crystallite size and surface area. The hydrogen production from the methanol–water mixture in the presence of vermiculites and α-Fe2O3 nanoparticles/vermiculite composites was very similar and higher than the yield produced by the commercial TiO2 photocatalyst Evonik P25 (H2 = 1052 µmol/gcat.). The highest yield of hydrogen was obtained in the presence of the Fe/V–700 composite (1303 µmol/gcat after 4 h of irradiation).

1. Introduction

Many researchers have focused on raw phyllosilicates as ideal materials for the immobilization of photocatalytic active nanoparticles to avoid potential environmental and health risks (e.g., [1,2]). Vermiculites play a great role as the layered carrier in the synthesis of photocatalysts with high performance. The structural unit layer of the 2:1 TOT type consists of two tetrahedral (T) Si-O sheets and an octahedral (O) Al-O/Al-OH sheet between them. The central Si atoms in the tetrahedra substituted by Al, and/or the octahedral Al atoms by atoms of lower oxidation number such as Mg, generate the negative charges of the layers that are compensated by interlayer cations [3,4]. Iron in the amounts varying from traces to up to 30 mass % can also substitute for Si in tetrahedral or for Al in octahedral sites [5]. The redox reaction Fe(II)–Fe(III) occurs on the clay mineral edges and the basal surface [6].
Vermiculite formed as a weathering product of phlogopite when K+ in the interlayer was replaced by exchangeable interlayer cations such as Mg2+, usually coordinated between two layers of water [7]. The hydration state of vermiculite is defined by the number of water layers in the interlayer space of the different phases, such as zero-, one- and two-water layer hydration states (0-, 1- and 2-WLHS, respectively) of mica, hydrobiotite and vermiculite [8,9,10]. Vermiculite from the Palabora (South Africa) occurring in the phlogopite- and apatite-rich pyroxenites was designated as a reference clay mineral sample named hydrobiotite [11]. The vermiculitization process of phlogopite was supported by oxidation of the Fe(II) at the octahedral sites and migration and oxidation to the Fe(III) at the tetrahedral sites in the mixed–layer phase [12]. Cation replacement in octahedra and tetrahedra averages layer orientation of water hydrated to the interlayer cation [13].
From the catalytic point of view, the vermiculite two-dimensional layered structure is a very attractive material due to the cation substitutions in the tetrahedral position, which provide more Brønsted-type acid sites on the surface in comparison with other hydrous 2:1 layer minerals such as smectites. Contributors to Brønsted acidity are also water molecules coordinated to the exchangeable cations and hydroxyl groups at the crystal edges. The Lewis acid sites are associated with unsaturated central atoms at the crystal edges, and the exchangeable cations (especially transition metal ions) and acidity resulting from the dissociation of water molecules in the hydration shell around the exchangeable cations in the interlayer (e.g., [14]).
Vermiculite (VMT) has been investigated as carrier of oxide nanoparticles, such as photocatalysts: TiO2/VMT [15], NiO/VMT [16], CeO2/VMT [17,18] and Fe2O3/VMT [19], or mixed oxides, such as MnOx-Fe2O3/VMT [20], MnOx-CeO2-Fe2O3/VMT [21] and CeO2-Fe2O3/VMT [22] catalysts. Reli et al. [22] confirmed that the CeO2-Fe2O3 nanoparticles deposited on vermiculite only at 35%–70% showed slightly lower photocatalytic activity then stand-alone CeO2-Fe2O3 nanoparticles.
Unlike many reports synthesizing photocatalytically active catalysts and clay minerals used as catalyst supports, the number of reports utilizing the catalytic effects of natural vermiculite materials is still very rare. Vermiculites for the first time were successfully used to effectively split water for hydrogen generation under visible light [23] and were employed as a catalyst on thermal depolymerization products of polystyrene [24].
The clay-based photocatalyst has been recognized as one of the most popular solid photocatalysts for hydrogen production and wastewater degradation due to its special layered structure, large specific surface area and high adsorption capacity, which are suitable for the capture of organic pollutants. Interfacial water molecules associated with the clay surface (anionic director) were observed mainly in montmorillonites, where cation isomorphous substitution occurs only in the octahedral layer. Clay/clay base materials applied in the photo-reforming/water-splitting reaction for hydrogen production from water were attapulgite [25] and Hangjin2# clay [26].
The oxides are currently used as optically active materials because of their chemical stability and low cost. Among them, hematite α-Fe2O3 as a narrow-band semiconductor can convert about 40% of solar radiation into useful energy [27]. Therefore, it is generally assumed that the impregnation of clay with Fe2O3 will increase the conversion of light into chemical energy. Until recently, there were few articles on photocatalytic water reduction using an α-Fe2O3/clay-based heterosystem, and to the best of our knowledge, α-Fe2O3/natural illitic clay was used for the first time [28].
Nowadays, major global problems have arisen, namely, increasing energy consumption, depletion of fossil fuels, and environmental pollution caused by human activity. Hydrogen appears to be a very promising possibility to replace fossil fuels with minimal impact on the environment. Water splitting is a promising technology based on natural, sustainable and clean resources. Hydrogen generation from water splitting is energetically an uphill process. For that reason, a sacrificial agent (such as methanol) was used as an electron donor for water splitting [29,30,31,32].
This study is an ongoing work on the structural, textural, optical and photocatalytic properties of raw and heat-treated vermiculite from the deposit in Palabora [24]. Vermiculite and its samples calcined at 500 and 700 °C were studied in comparison with the α-Fe2O3 nanoparticles/vermiculite composite heterosystem for the first time as photocatalysts of methanol decomposition. The aim was to explain the photocatalytic effects based on the structural properties of photocatalysts using X-ray fluorescence, X-ray diffraction, infrared spectroscopy, nitrogen physisorption, diffuse reflectance UV-Vis spectroscopy and photoluminescence spectroscopy.

2. Materials and Methods

2.1. Materials and Samples Preparation

Vermiculite mined from the deposit in the Palabora region in the Northern Province of South Africa was supplied by the company Grena Co. (Veselí nad Lužnicí, Czech Republic). The hematite precursor was iron chloride hexahydrate (FeCl3∙6H2O) and sodium hydroxide (NaOH), supplied by Lach-Ner Co., Czech Republic).
The vermiculite was pulverized in a ball mill to a powder and sieved with a particle size <40 μm to the sample denoted as Ver. The Ver was then calcined to the samples denoted as V–500 and V–700 in a muffle oven (NABERTHERM P 330, NABERTHERM Inc., New Castle, USA) at 500 and 700 °C using a temperature ramp of 10 °C min−1 and an isothermal step of one hour at the final temperature.
The crystalline α–Fe2O3 nanoparticles were prepared by chemical precipitation method [33]. The nanoparticle precursor was iron(III) chloride hexahydrate (FeCl3·6H2O) salt and sodium hydroxide (NaOH) solution as precipitator. An amount of 4 g of FeCl3∙6H2O in 100 mL of distilled water was stirred in bottle at 450 rpm for 30 min at 70 °C in Heidolph Reax overhead shaker (REAX 20/4, Heidolph Instruments GmbH & Co. KG, Schwabach, Gerrmany), to which 2 M NaOH was added drop by drop, until pH 11 value was reached.
α–Fe2O3 nanoparticles/vermiculite composites were obtained from three water dispersions containing 4 g of each Ver, V–500 and V–700 in 100 mL distilled water, which were stirred in bottles at 450 rpm for 30 min at 70 °C in Heidolph Reax overhead shaker (REAX 20/4, Heidolph Instruments GmbH & Co. KG, Schwabach, Gerrmany). The solution of 100 mL of α–Fe2O3 nanoparticles precursor prepared before was then added and mixed together for 30 min. The precipitates were denoted as Fe/Ver, Fe/V–500 and Fe/V–700, collected and centrifuged at 6000 rpm. The solid fractions were repeatedly washed to free chlorides. The samples were dried at 40 °C and calcined at 500 °C using a temperature ramp of 10 °C min−1 and an isothermal step of one hour at the final temperature in a muffle furnace (NABERTHERM L9/11/SW, Nabertherm GmbH, Lilienthal, Germany) to obtain crystalline α–Fe2O3 nanoparticles sole and attached to the vermiculite support.

2.2. Methods

The elemental analysis was obtained using a SPECTRO XEPOS energy dispersive X-ray fluorescence (ED-XRF) spectrometer (Spectro Analytical Instruments, Kleve, Germany). Each sample (2 × 4 g) was mixed with wax (0.9 g) and pressed at 10 tons for 30 s using a manual hydraulic press (BSL-2, Brio, Czech Republic) and a standard 24 mm diameter die, resulting in a cylindrical pellet thick of about 4 mm. Analysis was performed in an inert atmosphere (He). The amount of Fe(II) in Ver, V–500 and V–700 samples was determined by redox titration with the 0.1 M solution of potassium dichromate (K2Cr2O7), which was then subtracted from the total Fe concentration determined by XRF. The difference was the amount of Fe(III).
The scanning electron microscope (SEM) JEOL JSM 7610F+ (JEOL, Tokyo, Japan) with Schottky cathode was utilized to examine the samples prepared on stubs with carbon tape and coated with 20 nm layer of Pt. Elemental composition analysis and mapping were performed using energy-dispersive X-ray spectroscope (EDS) Aztec Ultima Max 65 (Oxford Instruments, Abingdon, UK).
X-ray powder diffraction (XRD) phase analysis was performed using Rigaku SmartLab diffractometer (Rigaku Corporation, Tokyo, Japan), equipped with a detector D/teX Ultra 250 under CoKα radiation. The sieved samples before analysis were further powdered using agate mortar and pressed using microscope glass into a rotational sample holder. The XRD patterns were obtained in the reflection mode (Bragg-Brentano geometry) at 40 kV and 40 mA, at 15 rpm/min, a step size of 0.01° at the speed of 0.5 deg/min. The XRD patterns were evaluated using PDXL2 software No. 2.4.2.0 (Rigaku Corporation, Tokyo, Japan) and compared with database PDF-2, 2015 (ICDD, Newton Square, USA). In order to calculate the average crystallite size of the formed α-Fe2O3 nanoparticles, Scherrer equation: D(012) = 0.9λ/β cos θ, was utilized. In this equation, the parameters λ, β, and θ stand for the incident X-rays wavelength, the full width at half maximum (FWHM) of the 012 diffraction peak, and the diffraction angle, respectively.
The infrared (IR) spectra were obtained on a Nicolet 6700 FTIR spectrometer from Thermo Scientific (Mundelein, IL, USA), equipped with an IR source, KBr beamsplitter and DTGS detector. The KBr pressed disk technique (1 mg of sample and 200 mg of KBr) was utilized to measure spectra in the mid-IR region (4000–400 cm−1). The pellets were overnight heated at 120 °C to remove water adsorbed on the sample and KBr. The spectra were analyzed by the Thermo Scientific OMNIC™ software package. To compare the intensities of the bands of the samples, the spectra were normalized to the same intensity of the Si-O band near 1000 cm−1. The exact position of the overlapping bands (marked with * in the figures) was found by the second derivative operation using the Savitsky–Golay derivative embedded in OMNIC software.
The nitrogen physisorption measurements were performed on the 3Flex physisorption set-up (Micromeritics, USA). The specific surface area, SBET, was evaluated according to Brunauer–Emmett–Teller (BET) theory at 77 K for the p/p0 = 0.05–0.25 measuring overall the 11 points within this relative pressure range [34]. The total pore volume, Vtot, was evaluated as the adsorbed nitrogen volume at maximum p/p0 ~0.99 from the adsorption branch of nitrogen adsorption–desorption isotherm. The micropore volume (Vmicro) and the mesopore surface area (Smeso), were verified using the t-plot method, applying the Broekhoff-de Boer standard isotherm [35]. The mesopore–macropore-size distribution was evaluated from the adsorption branch of the nitrogen adsorption–desorption isotherm via the Barrett–Joyner–Halenda (BJH) method [36], assuming the cylindrical-pore geometry characterized by the diameter dp of the pores. The micropore-size distribution was evaluated from the adsorption branch of the nitrogen adsorption–desorption isotherm, applying the Horwath–Kawazoe method [37] assuming the slit pore-geometry characterized by the width wp of the pores.
The UV-Vis diffuse reflectance spectra (UV-Vis DRS) were recorded using a Shimadzu UV-2600 Series spectrophotometer (Shimadzu Scientific Co., Tokyo, Japan) from 220 to 800 nm. The measurements of all spectra were carried out by external 2D detector, an average diameter of 60 mm of an integration sphere and using the BaSO4 standard. Kubelka–Munk function [38] was obtained by calculation from reflectance spectrum. The direct band-gap energies (Eg) values were determined from Tauc plot for n = 2 (constant for direct band-gap energy) [39].
The photoluminescence (PL) spectra were recorded using a spectrometer FLSP920 Series (Edinburgh Instruments, Ltd., Livingston, UK) from 350 to 620 nm with a 450 W Xenon lamp (Xe900) and a R928P type PMT detector. All PL spectra were measured at fixed 325 nm excitation wavelength with the width of the excitation slit at 3.0 nm, emission slit at 8.0 nm and dwell time of 0.5 s.
The photocatalytic tests were performed in a homemade photoreactor. Detailed description, scheme and real photo of photocatalytic apparatus are in the Supplementary Materials.

3. Results

3.1. XRF and SEM Analysis

The chemical composition of elements obtained from XRF analysis was recalculated to the stoichiometric metal oxides concentrations (Table 1). Different amounts of alkali oxides K2O, Na2O and MgO in Ver, V–500 and V–700 vermiculite samples in comparison with the Fe/Ver, Fe/V–500 and Fe/V–700 composite samples indicated partial cation exchange Na+ for K+ during the preparation procedure with NaOH precipitator. The amount of Fe2O3 9.17, 10.20 and 11.12 mass% in Ver, V–500 and V–700, respectively, increased in the Fe/Ver, Fe/V–500 and Fe/V–700 composite samples due to the deposited hematite nanoparticles by 28.2, 25.0 and 28.0 mass%, respectively.
The metal oxygens from the XRF chemical analyses of Ver, V–500 and V–700 (Table 1) were recalculated based on the 22 negative charges per formula unit (pfu) to the cation content for the half-unit cell composition O10(OH)2 according to Foster [3] (Table 2).
SEM images of vermiculite flakes Ver, V–700 and Fe/V–700 observed in the backscattered electron mode (Figure 1) showed discontinuities, marginal undulations and bumps of various sizes. Striking aggregates of flakes were observed in the Ver sample (Figure 1a) and more compact and larger flakes in V–700 (Figure 1b). Calcination temperature influenced micro-morphological textural variations in surface observed as small humps, marginal rolling and discontinuity of the layers. The Fe/V–700 composite contained large aggregates (clusters) of randomly oriented vermiculite flakes, with no hematite nanoparticles observed (Figure 1c). The EDX mapping images confirmed a less homogeneous distribution of Fe on the surface of Ver in comparison to calcined V–700. The EDX elemental spectra of Ver and V–700 are very similar and demonstrate hematite nanoparticles by a higher amount of Fe on the surface of Fe/V–700.

3.2. XRD Phase Analysis

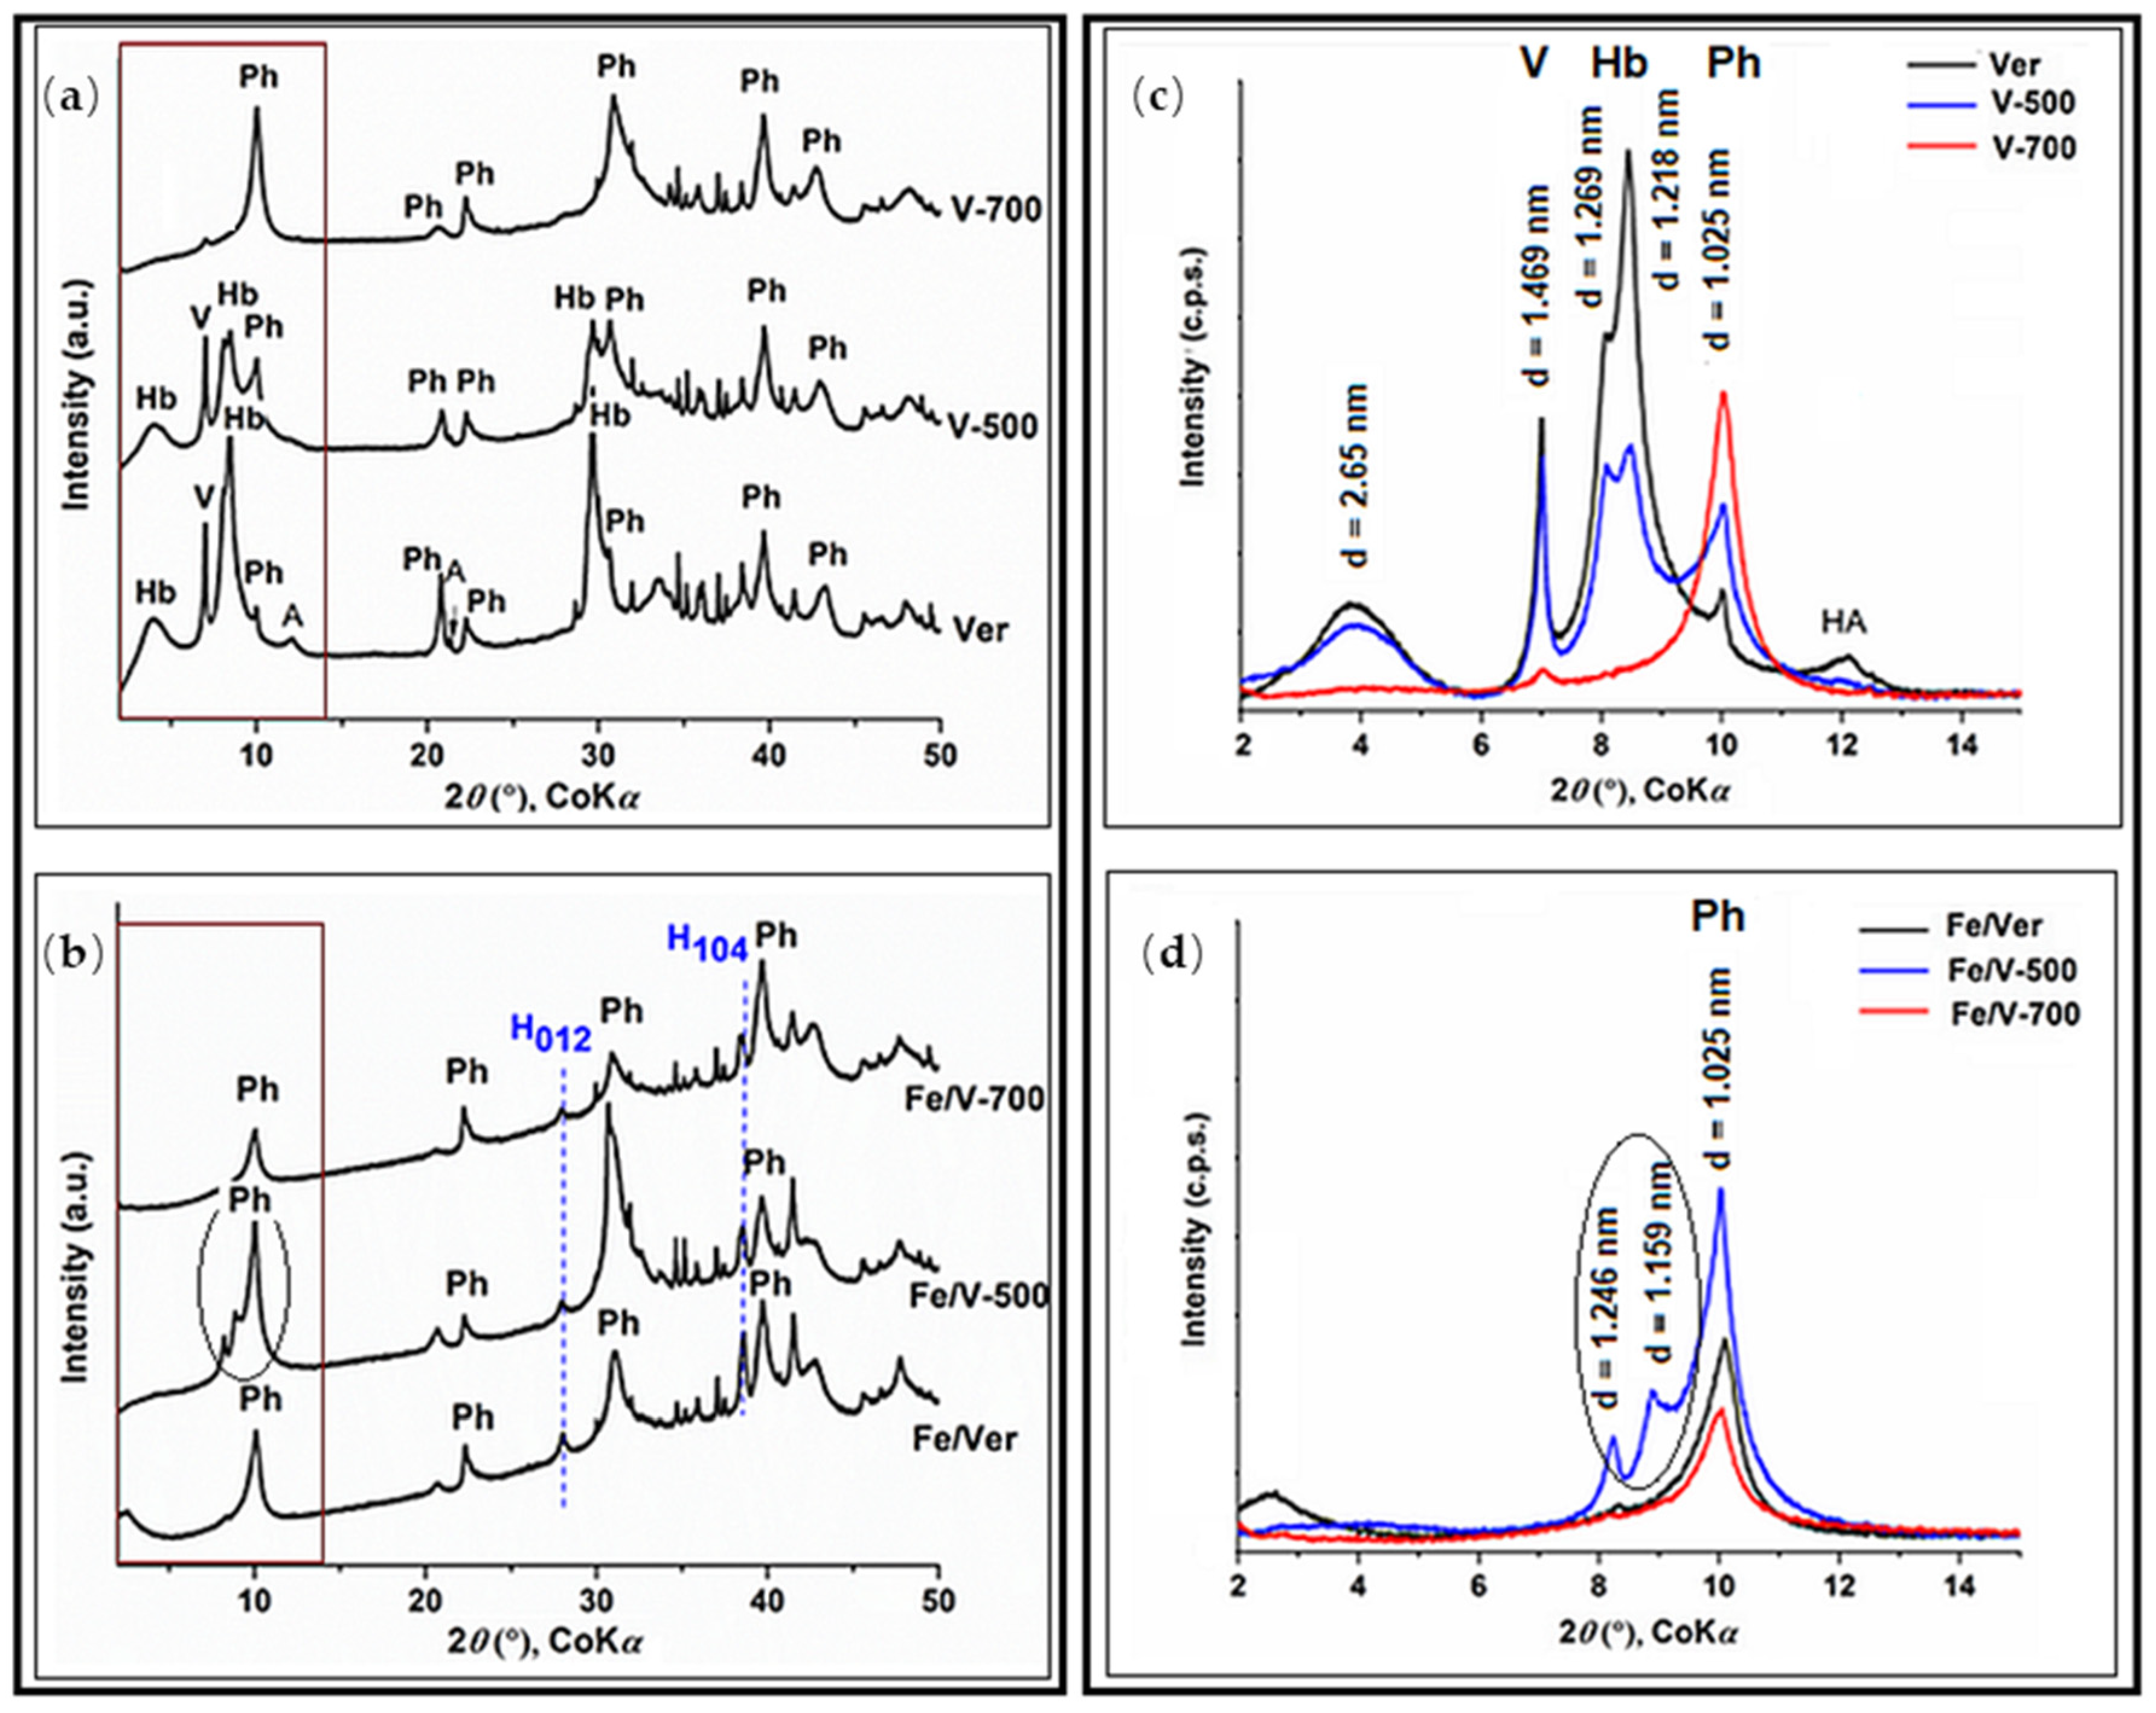
The XRD patterns from 2 to 50° 2θ (Figure 2a,b) of Ver, V–500 and V–700show vermiculite (marked as V, JCPDS card no. 00-076-0847), hydrobiotite (marked as Hb, JCPDS card no. 00-049-1057) and phlogopite (marked as Ph, JCPDS card no. 01-074-3145) and only Ph in V–700 (Figure 2a). The XRD patterns of Fe/Ver, Fe/V–500 and Fe/V–700 composite samples (Figure 2b) contained only Ph and hematite (H) (Fe2O3, JCPDS card no. 01-073-2234).
Hydroxyapatite (marked as HA, JCPDS card no. 00-064-0738) was a mineral residue from the parent phlogopite–apatite-rich pyroxenites occurring in all samples. The chemical composition of HA corresponds to the nearly identical CaO/P2O5 ratios of 3.00 ± 0.04 mass% and 2.61 ± 0.08 mass% in all vermiculite samples and in Fe/vermiculite composite samples, respectively (Table 1).
Characterization of the mixed layers of hydrobiotite [40] occurring in the interstratification domains of vermiculites is performed according to the basal space values, which are given for each peak in the range from 2 to 15° 2θ (Figure 2c,d). The basal peak series in vermiculite samples (Figure 2c) suggest mixed layering of vermiculite–mica-like layers, containing the interlayer cations at different water layer hydration states (WLHS). Ver is composed of hydrobiotite, Hb (1-WLHS, d = 1.216 nm), which predominates over vermiculite, V (2-WLHS, d = 1.469 nm), and a very small peak of phlogopite, Ph (0-WLHS, d = 1.025 nm). The hydrobiotite-type layer sequence [41] produced a broad peak with d = 2.65 nm of Hb in the various mixed-layer stacking sequences in the long-range order [11]. The peak with d = 1.269 nm was assigned to the transitional phase, which can be formed due to an interstratification between the 2-WLHS of V and a less hydrated Hb. The peak with d = 1.025 nm of Ph suggests 0/1-WLHS in the interlayer space [10]. Vermiculite (V) in V-500 was partly dehydrated to the Hb and Ph of the similar peak intensities. In the V-700, a small peak of V (d = 1.469 nm) and only Ph (d = 1.025 nm) can be observed.
The basal peak series in α-Fe2O3/vermiculite samples (Figure 2d) corresponds to the Ph (d = 1.025 nm, 1/0-WLHS). However, Fe/V–500 contains interstratification domains composed of mixed layers of Ph and other dehydrated phases: the transient 1-WLHS phase (d = 1.159 nm) and mixed layered 1/0 intermediate space (d = 1.246 nm) The interstratifications between these contracting and non-contracting forms were observed in many vermiculites [41].
Diffractions of hematite (H) and the Ph are mostly overlapped. Therefore, the single reflection from the H(012) plain (marked H012 in Figure 2b) was used to calculate the mean coherent crystallite size D(012) [42] (Table 3). The obtained mean size of Fe2O3 crystallites, generated as a result of deposition from the Fe(OH)3 precursor (Table 3), indicates that the mean crystallite size is about 30 nm and the deviation from the mean value is about 3 nm.

3.3. Infrared Spectroscopy Analysis

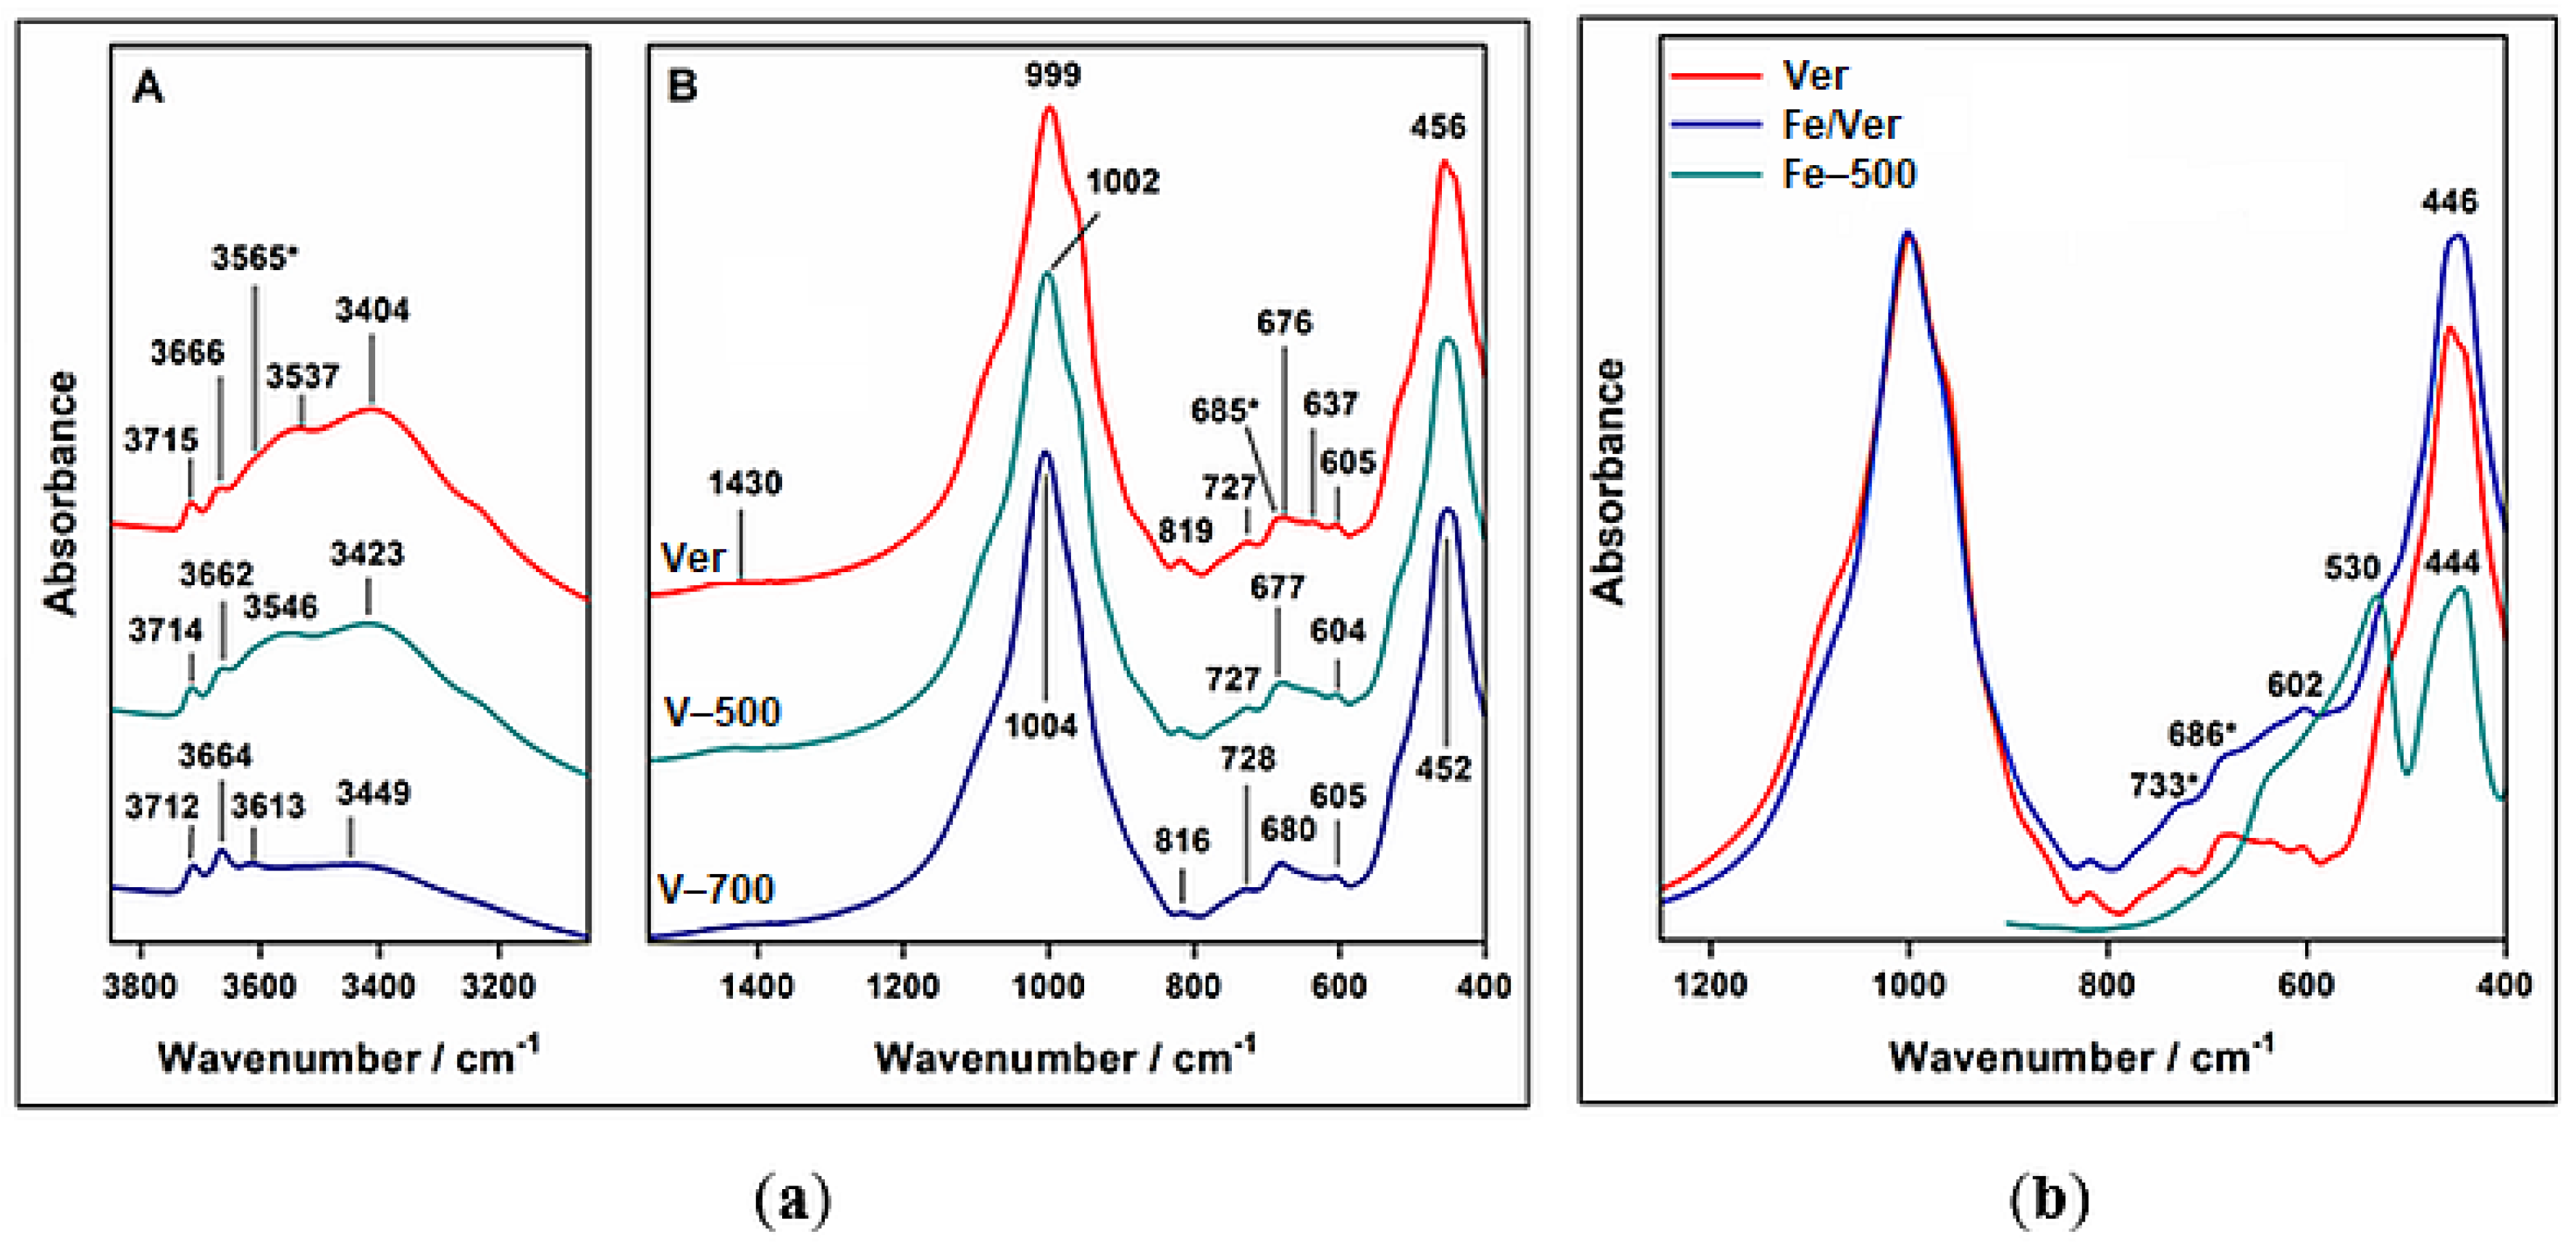
The IR spectra of Ver, V–500 and V–700 were analyzed to obtain information on the changes in the composition of Ver upon heating (Figure 3a). In contrast to XRD, the identification of the individual minerals in vermiculites is less straightforward because IR spectroscopy provides evidence, primarily on the nearest environment of the OH groups, i.e., on the occupancy of the central positions in the trioctahedral sheet. Therefore, for the example, this method is not able to detect unambiguously hydrobiotite but only biotite and vermiculite. The spectrum of Ver shows a broad complex band in the OH stretching region (Figure 3A). The absorption band at 3715 cm−1 related to the stretching vibration (ν) of the Mg3OH groups, is characteristic of phlogopite, while a band at 3666 cm−1 is ascribed to the vibrations of Mg2Fe2+OH groups, which can be present also in the biotite or vermiculite [43,44,45]. The inflection at 3565* cm−1 (revealed by the second derivative) and a weak band at 3537 cm−1 probably correspond to νMgFe3+OH and νFe3+Fe3+OH, respectively, of biotite and/or vermiculite. The broad band at 3404 cm−1 belongs to the stretching vibrations of water molecules. Heating to 500 °C only slightly modifies the shape of the complex OH stretching band; more pronounced changes are recognized after vermiculite heating at 700 °C (Figure 3A). The intensity of the broad band of water significantly decreased alike those of the νMgFe3+OH and νFe3+Fe3+OH bands. The bands of phlogopite at 3712 and 3661 cm−1 remained unchanged, which is in agreement with XRD results indicating phlogopite as the dominant phase in V–700.
In the 1200–400 cm−1, the bands related to the OH bending vibrations are overlapped with the bands resulting from stretching and bending (δ) vibrations of the tetrahedral sheets (Figure 3B). The low position of the dominant band of this region near 1000 cm−1, related to the stretching vibrations of the central atoms of the tetrahedral sheet, confirmed the presence of Al or Fe in addition to Si in tetrahedra. This broad Si-O bond was shifted from 999 cm−1 in Ver to 1002 cm−1 in V–500 and 1004 cm−1 in V–700. The bands at 818, 727 and 685 cm−1 are due to AlIV-Oap, AlIV-O-Si and Si-Oap, respectively. The band at 676 cm−1 is related to δMg3OH of vermiculite, while the position at 605 cm−1 is assigned to δMg3OH of phlogopite [43]. The weak band at 637 cm−1 corresponds to δMg2Fe2+OH [45]. The spectra of V–500 and V–700 show only minor changes compared to the unheated sample. Only a decrease in the 637 cm−1 band intensity signalized changes in the trioctahedral sheet occupancy (Figure 3B).
Precipitation procedure and calcination temperature of 500 °C of hematite nanoparticles onto vermiculite modified the shape of the spectrum in the 700–400 cm−1 region, i.e., in the area where vibrations of the Fe2O3 occur (Figure 3b). The contribution of the hematite bands at 530 and 444 cm−1 increases the absorption in this region; however, the positions of the bands observed for Ver remained almost unchanged for Fe/Ver, i.e., near 1000 cm−1 (νSi-O), 818 cm−1 (AlIV-Oap), 733 cm−1 (AlIV-O-Si), 686 cm−1 (Si-Oap) and 602 cm−1 (Mg3OH). The IR patterns of the Fe/V–500 and Fe/V–700 were identical to that of Fe/Ver; therefore, they are not presented. Unfortunately, the IR spectroscopy cannot distinguish whether hematite particles are interacting with the vermiculite surface or if the samples consist of two separate phases of vermiculite and hematite.

3.4. Textural Properties SBET and Vtot

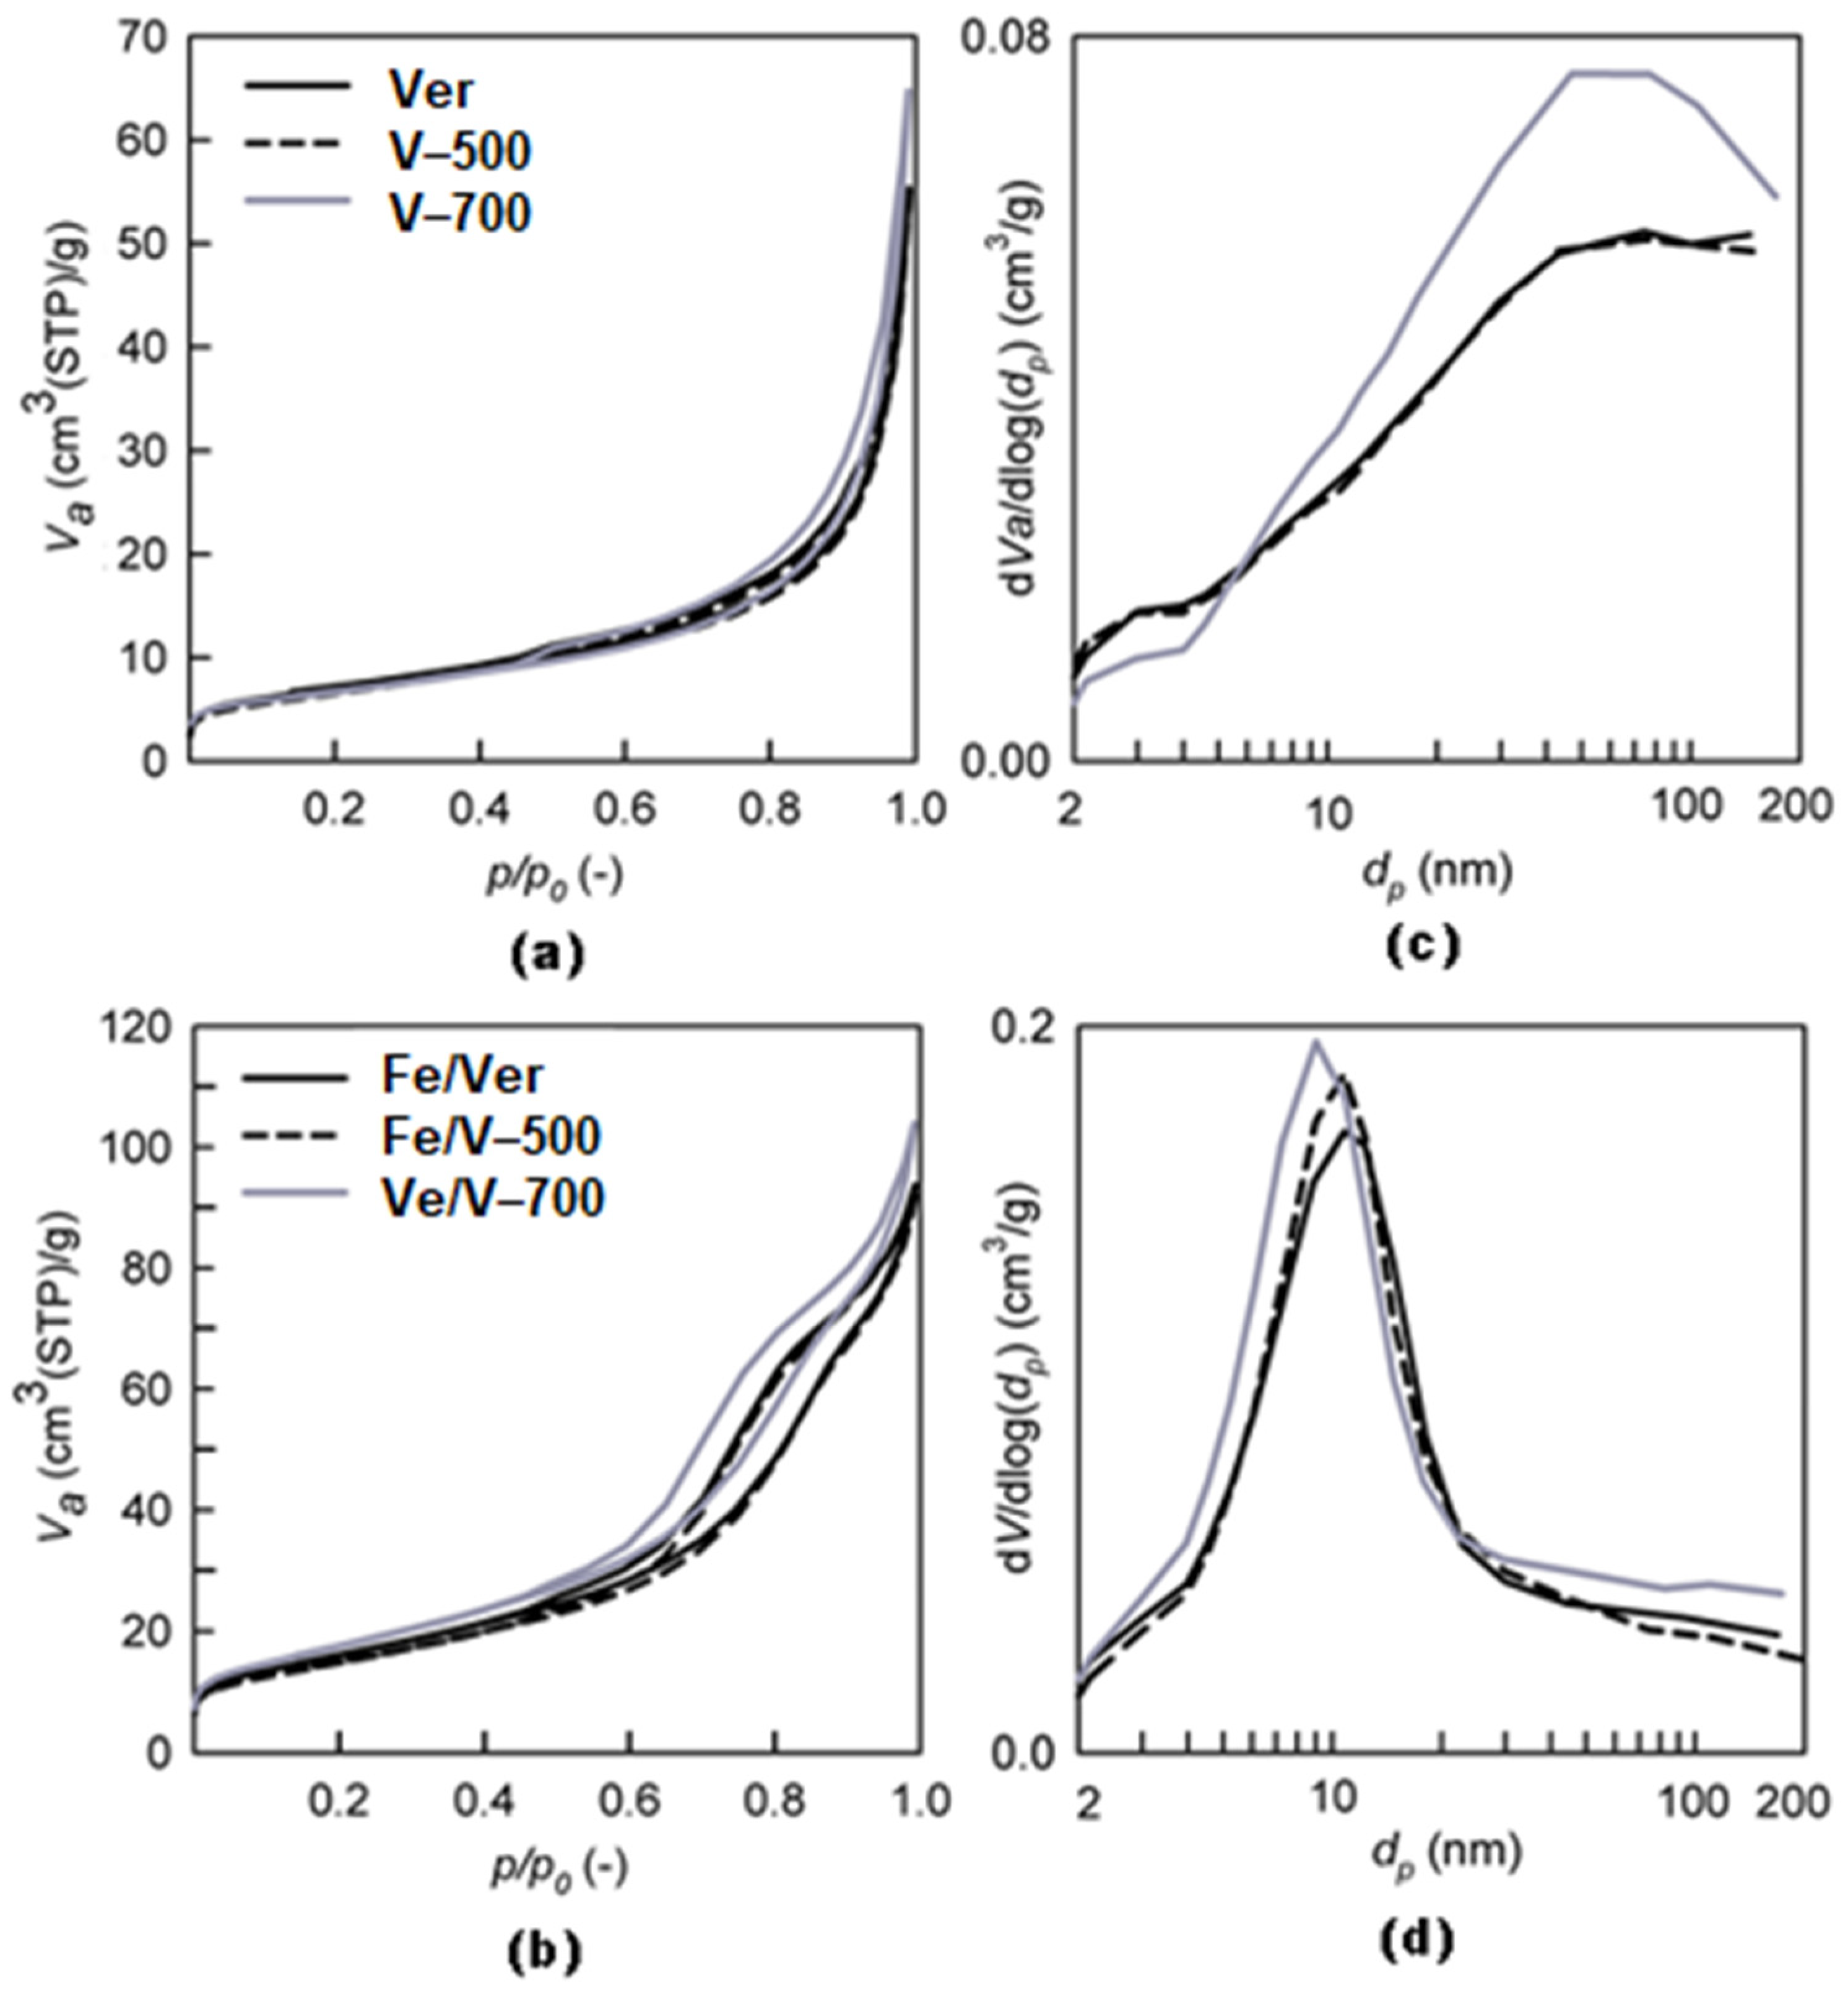
Measured nitrogen adsorption–desorption isotherms (Figure 4a,b) and evaluated pore-size distributions (Figure 4c,d) of Ver and its heated samples revealed any significant changes within the meso- and macroporous structure, arising from particle-to-particle interactions [46]. Vermiculites, Ver, V–500 and V–700, comprise minor smaller mesopores (dp about 3 nm) corresponding to the basal interlayer space and dominant large mesopores and macropores (dp> 40 nm) corresponding to the slit-shaped pores between particles (Figure 4c).
The surface area of 23 m2/g and the total pore volume of 85 mm3liq/g of V–500 were slightly smaller in comparison with Ver (25 m2/g and 86 mm3liq/g). The heating of Ver at 700 °C increased in V–700 the total pore volume to 100 mm3liq/g in the mesoporous–macroporous structure while the size of the surface area did not change (Table 4).
The Fe–500 nanoparticles sample showed a surface area of 36 m2/g and a total pore volume of 197 mm3liq/g. Precipitation of nanoparticles on Ver, V–500 and V–700 and heating at 500 °C to the Fe/Ver, Fe/V–500 and Fe/V–700 composites caused an increase in the specific surface area of about 2.5, 2.2 and 2.6 m2/g times and a total pore volume about 1.7 mm3liq/g times (Table 4). Moreover, the mesopores with the pore diameter of about 10–11 nm formed mainly in Fe/V-700 composite can be beneficial to the transformation, diffusion and adsorption of molecules [47].

3.5. UV-Vis Diffuse Reflectance (DR) Spectroscopy

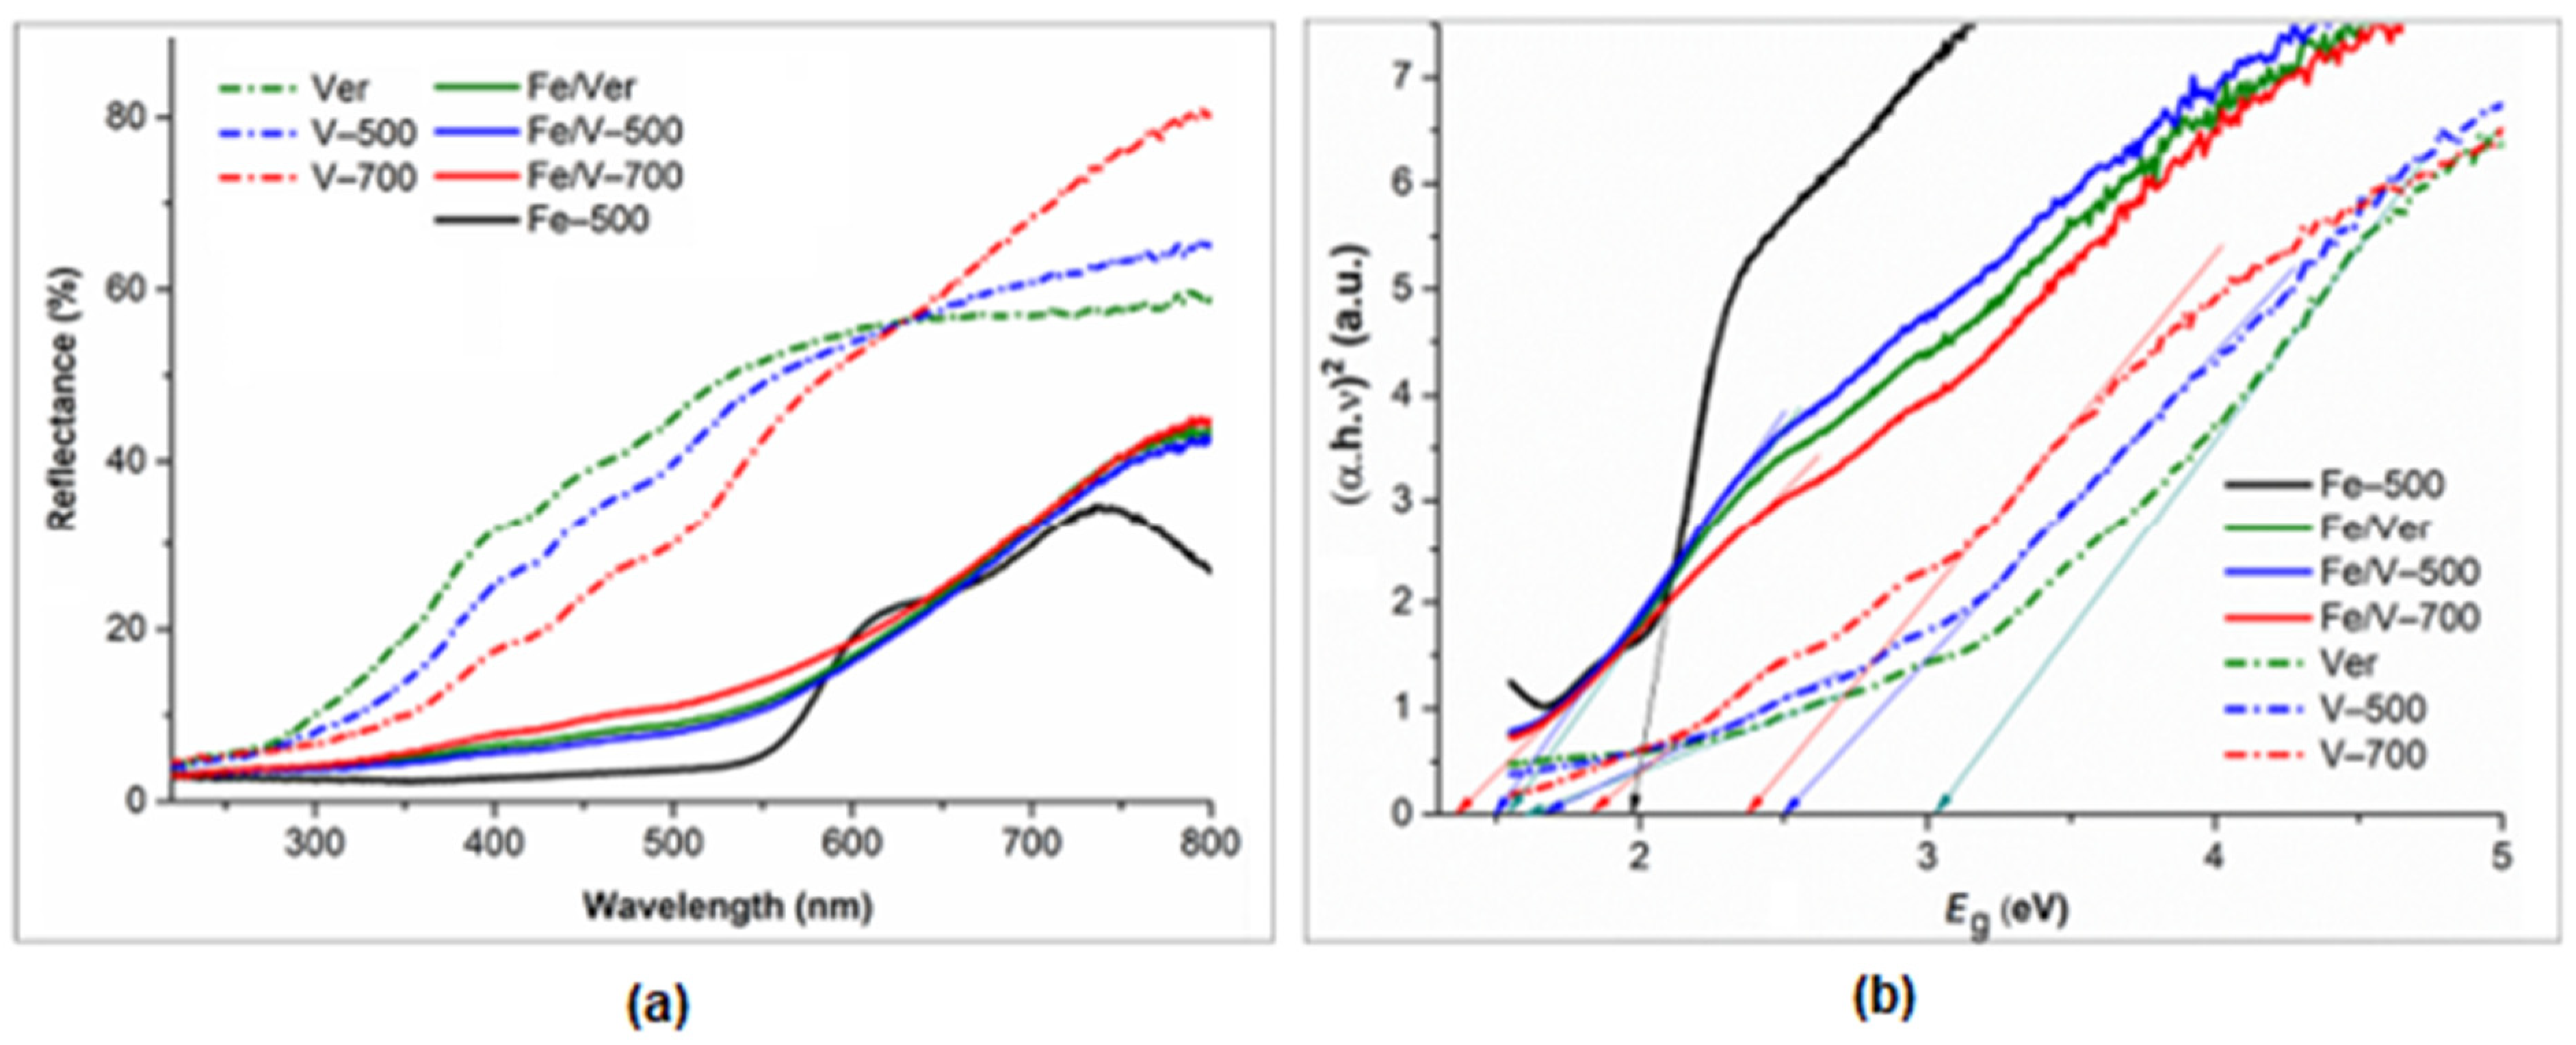
Vermiculites have a certain capacity for adsorbing light in the UV-Vis region on the absorption edge around 450 nm [47] (Figure 5). The optical ability of the samples is performed by the UV-Vis diffuse-reflectance spectra (DRS) (Figure 5a). The reflectance recalculated into the absorption intensities of the direct band energy gap (Eg) [39] can then be estimated in the Tauc plot (Figure 5b) using the intercept of the tangent to the plot of the optical adsorption coefficient α and photonic energy hν.
The first Eg values 1.64 eV in Ver, 1.70 eV in V–500 and 1.86 eV in V–700 were assigned to the iron bound in the vermiculite structure, as it was also documented by IR spectra above. The second Eg value of 3.03 eV in Ver decreasing to the 2.50 eV in V–500 and to 2.36 eV in V–700 was attributed to the vermiculite [47,48] (Figure 5a; Table 5).
The Fe–500 nanoparticles showed characteristic nearly constant reflectivity in the range of 350–550 nm, a shoulder near 620 nm, and a maximum near 750 nm (Figure 5a), in a good agreement with the spectrum of hematite powder [49] and the Eg value of 1.99 eV (Figure 5b). The Eg value of the iron oxide (Fe2O3) semiconductor material is about 2.3 eV [50]. The Eg values of α-Fe2O3 nanoparticles prepared using different methods were reported in the range from 1.88 to 1.93 eV [51].
Hematite nanoparticles attached to the vermiculite surface changed the shape of the spectra and shift the maximum reflectance to about 750 nm. The Eg value, 1.99 eV, of Fe–500 nanoparticles decreased to 1.55 eV in Fe/Ver composite and then to 1.50 eV in Fe/V–500 and to 1.35 eV in Fe/V–700 composites (Figure 5b; Table 5). The reduction in the band-gap Eg value of the Fe2O3 photocatalyst can be ascribed to a combination effect of vermiculite negative layer charge.

3.6. Photoluminescence (PL) Study

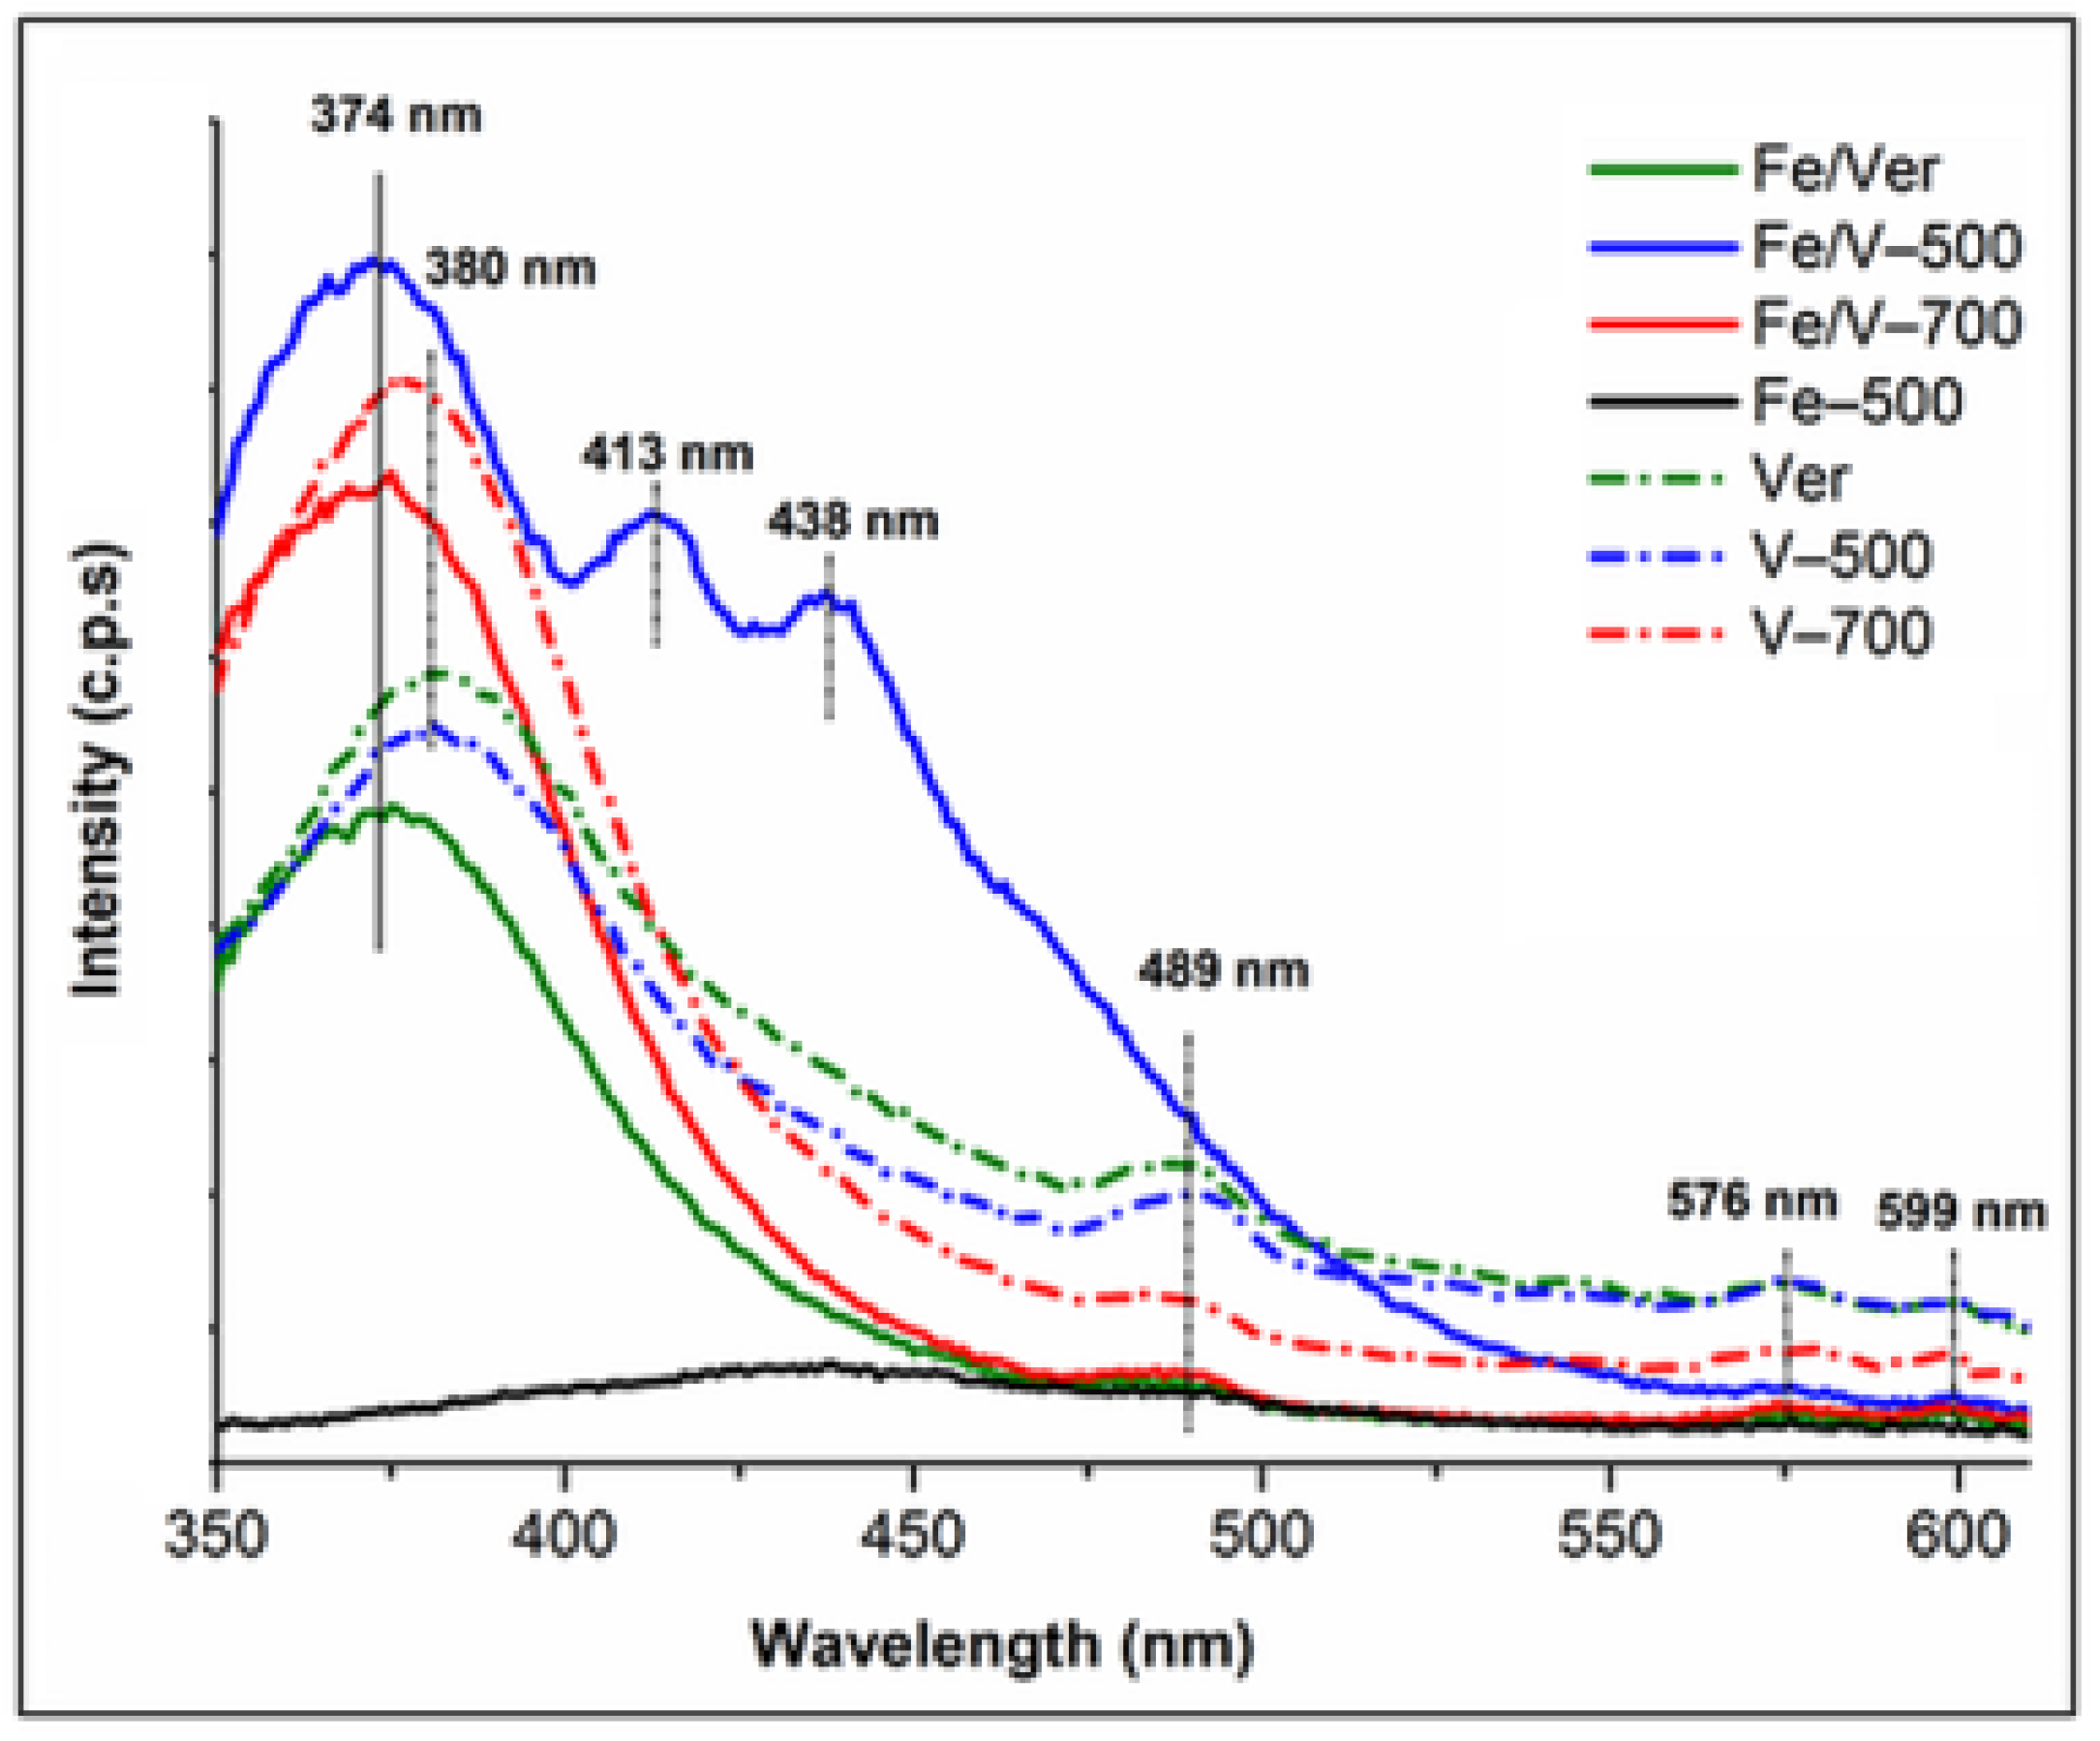
Hematite nanoparticle has a local collapse of the Fe magnetic moment and strong local lattice distortion in the strong antiferromagnetic background, which can generate luminescence after photoexcitation [52]. Photoluminescence (PL) spectra (Figure 6) in the wavelength range of 350–600 nm show a UV emission band (374–380 nm) and a green-yellow emission band (410–500 nm). The position of the UV band at 380 nm in Ver, V–500 and V–700 was found to shift towards a lower wavelength at 374 nm in Fe/Ver, Fe/V–500 and Fe/V–700 composites. This position was attributed to the electron transition from the donor level formed by oxygen vacancies to the acceptor level [53]. The sole Fe–500 nanoparticles exhibited a relatively weak emission band and the intensity of the spectra increase in Fe/Ver, Fe/V–500 and Fe/V–700 composites. However, α-Fe2O3 nanoparticles attached to the interstratified structure of the Fe/V–500 composite (Figure 2c,d) exhibited the most intensive PL spectrum. The emission band at 413 nm and 438 nm can be attributed to emission deep level defects associated with oxygen vacancies or at the particle boundaries [53,54].
The emission band at about 489 nm in Ver, V–500 and V–700 was assigned to the charge transfer transition between the iron ions [55], whose intensity corresponds to the Fe2+/Fe3+ ratios of 0.36, 0.19 and 0.04 in the octahedral positions, respectively (Table 2). The emission bands at about 576 nm and 599 nm were assigned to the Fe3+ ligand field transition [56] of the recombination of electrons trapped at oxygen vacancy near the conduction band edge with holes in deep Fe-related surfaces [53].

3.7. Photocatalytic Hydrogen Generation from Methanol–Water Mixture

Photocatalytic hydrogen generation from the methanol–water mixture in the presence of vermiculite and Fe/vermiculite composite samples at 254 nm irradiation was performed during the time (0, 1, 2 and 4 h) and the yields of products of hydrogen (divided by 10), methane and carbon monoxide after 4 h (Figure 7). Methane and CO2 are typical intermediates of photocatalytic methanol decomposition [57]. The generation of hydrogen yields from the photocatalytic decomposition of methanol–water mixture with the presence of vermiculites, α-Fe2O3/vermiculite composites and commercial photocatalyst TiO2-P25 showed the dependence on the time of irradiation 0–4 h (Figure 7a). The highest yields of hydrogen were obtained in the presence of Fe/V–700 composite (1303 µmol/gcat). All investigated photocatalysts produced higher yields of hydrogen than commercial TiO2 photocatalyst Evonik P25 (1052 µmol/gcat.) (Figure 7b).

4. Discussion

The mixture of hydrated vermiculite–hydrobiotite–mica-like layers in the interstratified structure of vermiculite transformed on the thermal treatment to the dehydrated phases. The specific surface area and the total pore volume within the mesoporous–macroporous texture of Ver and V–500 were very similar, but a higher total pore volume was formed in V–700 (Table 4).
The similar yields of hydrogen produced from the mixture of methanol–water and vermiculites Ver (1197 µmol/gcat.), V–500 (1202 µmol/gcat.) and V–700 (1183 µmol/gcat.) did not support the knowledge of improving the photocatalytic properties of the catalysts by higher annealing temperature [47,48,58].
In general, photocatalytic degradation of methanol takes place in two ways [29,59,60]. One way is the direct hole transfer reaction, where photo-generated holes serve as oxidation sites for adsorbed methanol molecules. The following possible decomposition reactions in Equations (1)–(4) indicate the release of CH2O (formaldehyde) and CO as intermediate products and H+ as the final decomposition product:
CH3OH + h+ → •CH2OH + H+
•CH2OH → CH2O + H+ + e
CH2O + 2O → •CHO + HO2
•CHO + 2O → •CO + HO2
The indirect hole transfer reactions occur by the hole photo-induced products while the presence of HO• radicals to decompose the molecules is essential, e.g., in Equations (5)–(7):
H2O + h+ → HO• + H+
CH3OH + HO•→ •CH2OH + H2O
CH2OH + HO•→ •CH2O + H2O
H+ + e→ H•
H• + H•→ H2
The holes are strong oxidizing agents and responsible for the splitting of water to form H2 according to Equations (8) and (9).
The vermiculite structure contained ions that can promote the formation of electron e/holes h+ pairs. The created h+ can directly react with the methanol, OH in the medium and also with the hydroxyl groups at the edges and surface of vermiculite to form HO• radicals. The presence of water on the vermiculite photocatalyst can initiate the indirect hole transfer process via the generation of HO• radicals, which are responsible for the methanol oxidation and the similar intermediates as of direct hole transfer [60].
Hydrogen yield on V–500 was slightly higher in comparison with the yield on Ver and V–700 while not dependent on a specific surface (Figure 8a), but dependency on the substitution of Fe(III) and Al in tetrahedra expressed as the Fe(III)/Al ratio in tetrahedra of Ver, V–500 and V–700 is 0.533, 0.521 and 0.553, respectively, (Table 2; Figure 7b).
The crystallite size is generally related to the photoactivity of materials [61,62]. The positive photocatalytic effect of α-Fe2O3 nanoparticles containing larger crystallites was observed on the most active photocatalyst Fe/V–700 composite with the highest surface area (63 m2/g) (Figure 8a). The largest crystallite size (34 nm) provided a larger number of active sites (Figure 8c) to produce the highest yield of hydrogen (1303 µmol/gcat.) from all the tested samples.
The Fe/V–500 composite of the smallest surface area (53 m2/g) (Figure 8a) and the nanoparticles’ smallest crystallite size (27 nm) (Figure 8c) produced the lowest yield of hydrogen (1094 µmol/gcat.) from all the tested samples.
The recombination rate of electrons and holes can be determined from PL spectra (Figure 6). A lower PL intensity indicates a lower recombination rate of photo generated charge carriers. The α-Fe2O3 nanoparticles in the Fe/V–500 composite significantly increased photoluminescence in contrast to the other samples indicating the highest electron-hole recombination rate resulting in the few electrons and holes that can participate in the redox reactions.
It is also known that the hematite surface in an aqueous solution can become hydroxylated and the surface chemistry indicated a different relationship between energy levels of the conduction band edge on the surface and hydrogen reduction [63]. Therefore, both direct and indirect transfer mechanisms can work competitively over the Fe/Ver, Fe/V–500 and Fe/V–700 composite surfaces on photocatalytic methanol decomposition.

5. Conclusions

The aim of this study was a detailed characterization of the structural and textural properties of raw and heat-treated iron-containing vermiculite in comparison with their use as carriers in α-Fe2O3/vermiculite composites to explain their photocatalytic activity under 254 nm light irradiation on the hydrogen production from methanol–water mixture.
The results of the XRF, XRD and IR analyses, physisorption and optical analysis allow a comparison of the vermiculite properties after calcination at temperatures of 500 and 700 °C as follows:
  • Calcination decreased LOI = 12.3 mass% in Ver to 5.5 and 5.3 mass% in V–500 and V–700, respectively.
  • Change in the hydration state of vermiculite was observed in the interlayer space of the V-Hb-Ph phases. The intensity of the basal peaks allows the representation of V-Hb-Ph (%) phases in Ver: V(30)-Hb(60)-Ph(10), in V–500: V(35)-Hb(37)-Ph(28) and in V–700: V(6)-Hb(0)-Ph(94) to be estimated.
  • Infrared spectroscopy, confirmed the calcination effect on the presence of Al or Fe in addition to Si in the tetrahedral sheet.
  • Calcination at 700 °C increased the pores volume with the formation of slit-like pores between the particles.
  • Calcination supported increasing the amount of Fe(III) bound in the structure, which increases the direct band energy gap (Eg), while reducing the Fe2+/Fe3+ ratio in octahedra and PL intensity.
The photocatalytic degradation of methanol–water mixture takes place on the surface of vermiculite by the action of iron ions that can promote the generation of e/h+ pairs, which play a role in the redox reaction. The similar proportion of one- and two-water layers in the interstratified structure of V–150 initiated higher photocatalytic activity due to the indirect hole transfer process via the generation of HO• radicals.
The photocatalytic activity of α-Fe2O3/vermiculite composites increased both with increasing specific surface area and increasing crystallite size of α-Fe2O3. The experimental results showed that all the investigated photocatalysts exhibited higher photoactivity compared to the commercial TiO2 photocatalyst Evonik P25.

Supplementary Materials

The following supporting information can be downloaded at: https://www.mdpi.com/article/10.3390/min12050607/s1, Figure S1. Scheme (a) and real photo (b) of photocatalytic experiment. Figure S2. Repeated photocatalytic experiments in presence Fe/V-500 (a) and Fe/V-700 photocata-lysts (b).

Author Contributions

Conceptualization, M.V. and K.K. (Kamila Kočí); methodology, K.K. (Kamila Kočí); J.M., L.M. and J.P.; validation, M.V., K.K. (Kamila Kočí), J.P. and L.M.; formal analysis, K.K. (Kateřina Klemencová) and B.T.B.; investigation, K.K. (Kateřina Klemencová) and B.T.B.; resources, K.K. (Kamila Kočí); data curation, K.K. (Kateřina Klemencová); J.P., J.M. and L.M.; writing—original draft preparation, M.V., K.K. (Kamila Kočí), J.M. and L.M.; writing—review and editing, M.V. and K.K. (Kamila Kočí); visualization, M.V., K.K. (Kamila Kočí), J.M. and L.M.; supervision, M.V. and K.K. (Kamila Kočí); project administration, K.K. (Kamila Kočí); funding acquisition, K.K. (Kamila Kočí) and L.M. All authors have read and agreed to the published version of the manuscript.

Funding

This work was supported by EU structural funding in Operational Programme Research, Development and Education, project No. CZ.02.1.01./0.0/0.0/17_049/0008419 “COOPERATION”. Experimental results were accomplished by using Large Research Infrastructure ENREGAT supported by the Ministry of Education, Youth and Sports of the Czech Republic under project No. LM2018098. Financial support of the Slovak Grant Agency VEGA (project No. 2/0166/21) is acknowledged.

Data Availability Statement

Not applicable.

Acknowledgments

The authors thank Alexandr Martaus for performing elemental XRF analysis and XRD patterns and Gabriela Kratošová for SEM images.

Conflicts of Interest

The authors declare no conflict of interest. The funders had no role in the design of the study; in the collection, analyses, or interpretation of data; in the writing of the manuscript, or in the decision to publish the results.

References

  1. Matějka, V.; Tokarský, J. Photocatalytical nanocomposites: A Review. J. Nanosci. Nanotechnol. 2014, 14, 1597–1616. [Google Scholar] [CrossRef] [PubMed]
  2. Holešová, S.; Štembírek, J.; Bartošová, L.; Pražanová, G.; Valášková, M.; Samlíková, M.; Pazdziora, E. Antibacterial efficiency of vermiculite/chlorhexidine nanocomposites and results of the in vivo test of harmlessness of vermiculite. Mater. Sci. Eng. C 2014, 42, 466–473. [Google Scholar] [CrossRef] [PubMed]
  3. Foster, M.D. Interpretation of the composition of vermiculites and hydrobiotites. Clays Clay Miner. 1963, 10, 70–89. [Google Scholar] [CrossRef]
  4. Brigatti, M.F.; Galan, E.; Theng, B.K.G. Structures and mineralogy of clay minerals. In Handbook of Clay Science. Developments in Clay Science; Bergaya, F., Theng, B.K.G., Lagaly, G., Eds.; Elsevier: Amsterdam, The Netherlands, 2006; Volume 1, pp. 19–86. [Google Scholar]
  5. Stucki, J. Properties and behaviour of iron in clay minerals. In Handbook of Clay Science. Developments in Clay Science; Bergaya, F., Theng, B.K.G., Lagaly, G., Eds.; Elsevier: Amsterdam, The Netherlands, 2006; Volume 1, pp. 423–475. [Google Scholar]
  6. Neumann, A.; Olson, T.L.; Scherer, M.M. Spectroscopic evidence for Fe(II)–Fe(III) electron transfer at clay mineral edge and basal sites. Environ. Sci. Technol. 2013, 47, 6969–6977. [Google Scholar] [CrossRef] [PubMed]
  7. Banfield, J.F.; Eggleton, R.A. Transmission electron microscope study of biotite weathering. Clays Clay Miner. 1988, 36, 47–60. [Google Scholar] [CrossRef]
  8. Suzuki, M.; Wada, N.; Hines, D.R.; Whittingham, M.S. Hydration states and phase transitions in vermiculite intercalation compounds. Phys. Rev. B 1987, 36, 2844–2851. [Google Scholar] [CrossRef]
  9. Ruiz-Conde, A.; Ruiz-Amil, A.; Pérez-Rodríguez, J.L.; Sánchez-Soto, P.J. Dehydration-rehydration in magnesium vermiculite: Conversion from two-one and one-two water hydration states through the formation of interstratified phases. J. Mater. Chem. 1996, 6, 1557–1566. [Google Scholar] [CrossRef]
  10. Marcos, C.; Argüelles, A.; Ruíz-Conde, A.; Sánchez-Soto, P.J.; Blanco, J.A. Study of the dehydration process of vermiculites by applying a vacuum pressure: Formation of interstratified phases. Miner. Mag. 2003, 67, 1253–1268. [Google Scholar] [CrossRef]
  11. Kikuchi, R.; Kogue, T. Structural and compositional variances in “hydrobiotite” sample from Palabora, South Africa. Clay Sci. J.-Stage 2018, 22, 39–52. [Google Scholar]
  12. Badreddine, R.; Grandjean, F.; Vandormael, D.; Fransolet, A.M.; Long, G.J. An Fe-57 Mossbauer spectral study of vermiculitization in the Palabora Complex, Republic of South Africa. Clay Miner. 2000, 35, 653–663. [Google Scholar] [CrossRef]
  13. Grandjean, J. Water sites at a clay interface. J. Colloid Interface Sci. 1997, 185, 554–556. [Google Scholar] [CrossRef] [PubMed]
  14. Theng, B.K.G. Surface acidity and catalytic activity. In Clay Mineral Catalysis of Organic Reactions, 1st ed.; CRC Press Taylor & Francis Group: Boca Raton, FL, USA, 2018; pp. 85–130. [Google Scholar]
  15. Ying, S. Preparation and properties of vermiculite supported TiO2 photocatalyst. Chin. J. Inorg. Chem. 2011, 27, 40–46. [Google Scholar]
  16. Li, P.; Wen, B.; Yu, F.; Zhu, M.; Guo, X.; Han, Y.; Kang, L.; Huang, X.; Dan, J.; Ouyang, F.; et al. High efficient nickel/vermiculite catalyst prepared via microwave irradiation-assisted synthesis for carbon monoxide methanation. Fuel 2016, 171, 263–269. [Google Scholar] [CrossRef]
  17. Valášková, M.; Kupková, J.; Kočí, K.; Ambrožová, N.; Klemm, V.; Rafaja, D. Structural properties and photocatalytic activity of ceria nanoparticles on vermiculite matrix. J. Nanosci. Nanotechnol. 2016, 16, 7844–7848. [Google Scholar] [CrossRef]
  18. Valášková, M.; Kupková, J.; Simha Martynková, G.; Seidlerová, J.; Tomášek, V.; Ritz, M.; Kočí, K.; Klemm, V.; Rafaja, D. Comparable study of vermiculites from four commercial deposits prepared with fixed ceria nanoparticles. Appl. Clay Sci. 2018, 151, 164–174. [Google Scholar] [CrossRef]
  19. Valášková, M.; Tokarský, J.; Pavlovský, J.; Prostějovský, T.; Kočí, K. α–Fe2O3 nanoparticles/vermiculite clay material: Structural, optical and photocatalytic properties. Materials 2019, 12, 1880. [Google Scholar] [CrossRef] [Green Version]
  20. Zhang, K.; Yu, F.; Zhu, M.; Dan, J.; Wang, X.; Zhang, J.; Dai, B. Enhanced low temperature NO reduction performance via MnOx-Fe2O3/vermiculite monolithic honeycomb catalysts. Catalysts 2018, 88, 100. [Google Scholar] [CrossRef] [Green Version]
  21. Wan, Y.; Tian, J.; Qian, G.; Liu, Z.; Li, W.; Dan, J.; Dai, B.; Yu, F. Ultralow specific surface area vermiculite supporting Mn-Ce-Fe mixed oxides as “curling catalysts” for selective catalytic reduction of NO with NH3. Green Chem. Eng. 2021, 2, 284–293. [Google Scholar] [CrossRef]
  22. Reli, M.; Ambrožová, N.; Valášková, M.; Edelmannová, M.; Čapek, L.; Schimpf, C.; Motylenko, M.; Rafaja, K.; Kočí, K. Photocatalytic water splitting over CeO2/Fe2O3/Ver photocatalysts. Energy Convers. Manag. 2021, 238, 114156. [Google Scholar] [CrossRef]
  23. Zhang, J.; Liu, T.; Chen, R.; Liu, X. Vermiculite as a natural silicate crystal for hydrogen generation from photocatalytic splitting of water under visible light. RSC Adv. 2014, 4, 406–408. [Google Scholar] [CrossRef]
  24. Valášková, M.; Madejová, J.; Inayat, A.; Matějová, L.; Ritz, M.; Martaus, A.; Leštinský, P. Vermiculites from Brazil and Palabora: Structural changes upon heat treatment and influence on the depolymerization of polystyrene. Appl. Clay Sci. 2020, 192, 105639. [Google Scholar] [CrossRef]
  25. Zhang, J.; Chen, A.; Wang, L.; Li, X.; Huang, W. Striving toward visible light photocatalytic water splitting based on natural silicate clay mineral: The interface modification of attapulgite at the atomic-molecular level. ACS Sustain. Chem. Eng. 2016, 4, 4601–4607. [Google Scholar] [CrossRef]
  26. Liu, Z.; Wang, J.; Ma, H.; Cheng, L.; Ar, S.; Yang, J.; Zhang, Q. A new natural layered clay mineral applicable to photocatalytic hydrogen production and/or degradation of dye pollutant. Environ. Prog. Sustain. Energy 2018, 37, 1003–1010. [Google Scholar] [CrossRef]
  27. Boumaza, S.; Boudjemaa, A.; Omeiri, S.; Bouarab, R.; Bouguelia, A.; Trari, M. Physical and photoelectrochemical characterizations of hematite α-Fe2O3: Application to photocatalytic oxygen evolution. Sol. Energy 2010, 84, 715–721. [Google Scholar] [CrossRef]
  28. Mekatel, E.; Trari, M.; Nibou, D.; Sebai, I.; Amorkrane, S. Preparation and characterization of a-Fe 2O 3 supported clay as a novel photocatalyst for hydrogen evolution. Int. J. Hydrogen Energy 2019, 44, 10309–10315. [Google Scholar] [CrossRef]
  29. Ibrahim, N.S.; Leaw, W.L.; Mohamad, D.; Alias, S.H.; Nur, H. A critical review of metal-doped TiO2 and its structure–physical properties–photocatalytic activity relationship in hydrogen production. Int. J. Hydrogen Energy 2020, 45, 28553–28565. [Google Scholar] [CrossRef]
  30. Kazi, M.-K.; Eljack, F.; El-Halwagi, M.M.; Haouari, M. Green hydrogen for industrial sector decarbonization: Costs and impacts on hydrogen economy in Qatar. Comput. Chem. Eng. 2021, 145, 107144. [Google Scholar] [CrossRef]
  31. Yue, M.; Lambert, H.; Pahon, E.; Roche, R.; Jemei, S.; Hissel, D. Hydrogen energy systems: A critical review of technologies, applications, trends and challenges. Renew. Sustain. Energy Rev. 2021, 146, 111180. [Google Scholar] [CrossRef]
  32. Otha, T.; Masegi, H.; Noda, K. Photocatalytic decomposition of gaseous methanol over anodized iron oxide nanotube arrays in high vacuum. Mater. Res. Bull. 2018, 99, 367–376. [Google Scholar]
  33. Lassoued, A.; Dkhil, B.; Gardi, A.; Ammar, S. Control of the shape and size of iron oxide (α–Fe2O3) nanoparticles synthesized through the chemical precipitation method. Results Phys. 2017, 7, 3007–3015. [Google Scholar] [CrossRef]
  34. Brunauer, S.; Emmett, P.H.; Teller, E. Adsorption of gases in multimolecular layers. J. Am. Chem. Soc. 1938, 60, 309–319. [Google Scholar] [CrossRef]
  35. Broekhoff, J.C.P.; de Boer, J.H. Studies on pore systems in catalysts: XI. Pore distribution calculations from the adsorption branch of a nitrogen adsorption isotherm of open cylindrical pores A. Fundamental equations. J. Catal. 1967, 9, 8–14. [Google Scholar] [CrossRef]
  36. Barrett, E.P.; Joyner, L.G.; Halenda, P.P. The determination of pore volume and area distributions in porous substances. I. Computations from nitrogen isotherms. J. Am. Chem. Soc. 1951, 73, 373–380. [Google Scholar] [CrossRef]
  37. Horvath, G.; Kawazoe, K. Method for the calculation of effective pore-size distribution in molecular-sieve carbon. J. Chem. Eng. J. 1983, 16, 470–475. [Google Scholar] [CrossRef] [Green Version]
  38. Kubelka, P.; Munk, F. Ein Beitrag zur Optik der Farbanstriche. Z. Tech. Phys. 1931, 12, 593–601. [Google Scholar]
  39. Tauc, J.; Grigorovici, R.; Vancu, A. Optical properties and electronic structure of amorphous germanium. Phys. Status Solidi B 1966, 15, 627–637. [Google Scholar] [CrossRef]
  40. Brindley, G.W.; Zalba, P.E.; Bethke, C.M. Hydrobiotite, a regular 1:1 interstratification of biotite and vermiculite layers. Am. Mineral. 1983, 68, 420–425. [Google Scholar]
  41. Marcos, C.; Arango, Y.C.; Rodriguez, I. X-ray diffraction studies of the thermal behaviour of commercial vermiculites. Appl. Clay Sci. 2009, 42, 368–378. [Google Scholar] [CrossRef]
  42. Scherrer, P. Bestimmung der Grösse und der inneren Struktur von Kolloidteilchen mittels Röntgenstrahlen. Gött. Nachr. 1918, 2, 98–100. [Google Scholar]
  43. Farmer, V.C. The layer silicates. In The Infrared Spectra of Minerals; Farmer, V.C., Ed.; Mineralogical Society: London, UK, 1974; pp. 331–363. [Google Scholar]
  44. Madejova, J.; Gates, W.P.; Petit, S. IR spectra of clay minerals. In Infrared and Raman Spectroscopies of Clay Minerals. Developments in Clay Science; Gates, W.P., Klopproge, J.T., Madejova, J., Bergaya, F., Eds.; Elsevier: Amsterdam, The Netherlands, 2017; Volume 8, pp. 107–149. [Google Scholar]
  45. Swayze, G.A.; Lowers, H.A.; Benzel, W.M.; Clark, R.N.; Driscoll, R.L.; Perlman, Z.S.; Hoefen, T.M.; Dyar, M.D. Characterizing the source of potentially asbestosbearing commercial vermiculite insulation using in situ IR spectroscopy. Am. Mineral. 2018, 103, 517–549. [Google Scholar] [CrossRef]
  46. Heller-Kallai, L. Chapter 10.2—Thermally modified clay minerals. In Developments in Clay Science; Bergaya, F., Lagaly, G., Eds.; Elsevier Ltd.: Amsterdam, The Netherlands; The Hebrew University of Jerusalem: Jerusalem, Israel, 2013; Volume 5411–5433. [Google Scholar]
  47. Huang, C.; Fan, E.; Xu, H.; Li, M.; Shao, G.; Wang, H.; Lu, H.; Zhang, R. Effect of particle size of vermiculite on the microstructure and photocatalytic performance of g-C3N4/vermiculite composite. Solid State Sci. 2021, 113, 106533. [Google Scholar] [CrossRef]
  48. Martínez-Costa, J.I.; Rivera-Utrilla, J.; Leyva-Ramos, R.; Sánchez-Polo, M.; Velo-Gala, I. Individual and simultaneous degradation of antibiotics sulfamethoxazole and trimethoprim by UV and solar radiation in aqueous solution using bentonite and vermiculite as photocatalysts. Appl. Clay Sci. 2018, 160, 217–225. [Google Scholar] [CrossRef]
  49. Yamanoi, Y.; Nakashima, S.; Katsura, M. Temperature dependence of reflectance spectra and color values of hematite by in situ, high-temperature visible micro-spectroscopy. Am. Mineral. 2009, 94, 90–97. [Google Scholar] [CrossRef]
  50. Mishra, M.; Chun, D.-M. α–Fe2O3 as a photocatalytic material: A review. Appl. Catal. A Gen. 2015, 49, 126–141. [Google Scholar] [CrossRef]
  51. Vayssieres, L.; Sathe, C.; Butorin, S.M.; Shuh, D.K.; Nordgren, J.; Guo, J. One-dimensional quantum-confinement effect in α–Fe2O3 ultrafine nanorod arrays. Adv. Mater. 2005, 17, 2320–2323. [Google Scholar] [CrossRef]
  52. Wheeler, D.A.; Wang, G.; Ling, Y.; Li, Y.; Zhang, J.Z. Nanostructured hematite: Synthesis, characterization, charge carrier dynamics, and photoelectrochemical properties. Energy Environ. Sci. 2012, 5, 6682–6702. [Google Scholar] [CrossRef]
  53. Mahadik, M.A.; Shinde, S.S.; Mohite, V.S.; Kumbhar, S.S.; Rajpure, K.Y.; Moholkar, A.V.; Bhosale, C.H. Photoelectrocatalytic activity of ferric oxide nanocatalyst: A synergestic effect of thickness. Ceram. Int. 2014, 40, 9463–9471. [Google Scholar] [CrossRef]
  54. Cherepy, N.J.; Liston, D.B.; Lovejoy, J.A.; Deng, H.; Zhang, J.Z. Ultrafast studies of photoexcited electron dynamics in γ– and α–Fe2O3 semiconductor nanoparticles. J. Phys. Chem. B 1998, 102, 770–776. [Google Scholar] [CrossRef]
  55. Zhu, J.; Zheng, W.; He, B.; Zhang, J.; Anpo, M. Characterization of Fe–TiO2 photocatalysts synthesized by hydrothermal method and their photocatalytic reactivity for photodegradation of XRG dye diluted in water. J. Mol. Catal. A Chem. 2004, 216, 35–43. [Google Scholar] [CrossRef]
  56. Mathevula, L.E.; Noto, L.L.; Mothudi, B.M.; Chithambo, M.; Dhlamini, M.S. Structural and optical properties of sol-gel derived α–Fe2O3 nanoparticles. J. Lumin. 2017, 192, 879–887. [Google Scholar] [CrossRef]
  57. Miller, T.L.; Wolin, M.J. Oxidation of hydrogen and reduction of methanol to methane is the sole energy source for a methanogen isolated from human feces. J. Bacteriol. 1983, 153, 1051–1055. [Google Scholar] [CrossRef] [PubMed] [Green Version]
  58. Patil, A.B.; Jadhav, B.D.; Bhoir, P. Optical band gap modification of Ce/ZnO for visible light photocatalytic H2 production from aqueous methanol solution. Opt. Mater. 2021, 121, 111503. [Google Scholar] [CrossRef]
  59. Sadale, S.B.; Noda, K.; Kobayashi, K.; Yamada, H. Real-time investigation on photocatalytic oxidation of gaseous methanol with nanocrystalline WO3–TiO2 composite films. Thin Solid Films 2012, 520, 3847–3851. [Google Scholar] [CrossRef]
  60. Masegi, H.; Goto, H.; Sadale, S.B.; Noda, K. Real-time monitoring of photocatalytic methanol decomposition over Cu2O-loaded TiO2 nanotube arrays in high vacuum. J. Vac. Sci. Technol. B 2020, 38, 052401. [Google Scholar] [CrossRef]
  61. Jung, K.Y.; Park, S.B.; Ihm, S.-K. Linear relationship between the crystallite size and the photoactivity of non-porous titania ranging from nanometer to micrometer size. Appl. Catal. A 2002, 224, 229–237. [Google Scholar] [CrossRef]
  62. Jung, K.Y.; Park, S.B. Photoactivity of SiO2/TiO2 and ZrO2/TiO2 mixed oxides prepared by sol–gel method. Mater. Lett. 2004, 58, 2897–2900. [Google Scholar] [CrossRef]
  63. Tanwar, K.S.; Lo, C.S.; Eng, P.J.; Catalano, J.G.; Walko, D.A.; Brown, G.E., Jr.; Waychunas, G.A.; Chaka, A.M.; Trainor, T.P. Surface diffraction study of the hydrated hematite (1ī02) surface. Surf. Sci. 2007, 601, 460–474. [Google Scholar] [CrossRef]
Figure 1. SEM images and EDX scanning distribution of Fe (red points) on the surface with the EDX elemental spectra of: (a) Ver, (b) V–700 and (c) Fe/V–700.
Minerals 12 00607 g001
Figure 2. XRD patterns from 2 to 50° 2θ of: (a) vermiculites (Ver, V–500 and V–700) and (b) α-Fe2O3 nanoparticles/vermiculite composites (Fe/Ver, Fe/V–500 and Fe/V–700). Peaks are marked: V = vermiculite, Hb = hydrobiotite, Ph = phlogopite, H = hematite and HA = hydroxyapatite; and XRD patterns from 2 to 15° 2θ with d-values of peaks of: (c) vermiculites and (d) α-Fe2O3 /vermiculite composites.
Minerals 12 00607 g002
Figure 3. IR spectra of: (a) vermiculite (Ver) and samples heated at 500 °C (V–500) and 700 °C (V–700), (A)–OH stretching region; (B)–Si-O and OH bending region. * indicates the position obtained by the second derivative operation and (b) Ver, Fe/Ver and Fe–500.
Minerals 12 00607 g003
Figure 4. Nitrogen adsorption–desorption isotherms of: (a) Ver, V–500 and V–700 and (b) Fe/Ver, FeV–500 and Fe/V–700 and pore size distributions of: (c) Ver, V–500 and V–700 and (d) Fe/Ver, Fe/V–500 and Fe/V–700.
Minerals 12 00607 g004
Figure 5. DRS spectra (a) and Tauc plots (b) of vermiculites, α-Fe2O3 nanoparticles and α-Fe2O3 /vermiculite composites.
Minerals 12 00607 g005
Figure 6. PL emission spectra of vermiculites, α-Fe2O3 nanoparticles and α-Fe2O3/vermiculite composites.
Minerals 12 00607 g006
Figure 7. Photocatalytic hydrogen generation from the methanol–water mixture in the presence of vermiculite and Fe/vermiculite composite samples at 254 nm irradiation: (a) Time dependence on the yields of hydrogen and (b) Yields of H2, CH4 and CO after 4 h of irradiation; P25 = commercial photocatalyst TiO2 Evonik P25; H2/10 = yield divided by 10.
Minerals 12 00607 g007
Figure 8. The yields of hydrogen in the presence of investigated photocatalysts dependency on: (a) the surface area (SBET), (b) Fe(III)/Al ratio in tetrahedral position of vermiculite samples and (c) the mean crystallite size D(012) of α-Fe2O3 nanoparticles anchored in nanocomposite samples.
Minerals 12 00607 g008
Table 1. Chemical XRF analysis (mass%) of vermiculites and α-Fe2O3 nanoparticles/vermiculite composites and the statistical error with a confidence interval of 1 sigma.
SampleSiO2TiO2Al2O3Fe2O3
FeO
P2O5CaOMgOK2ONa2OL.O.I. 1Sum
Ver35.53 ± 0.021.26 ± 0.017.59 ± 0.019.17 ± 0.011.16 ± 0.013.67 ± 0.0123.02 ± 0.055.60 ± 0.010.08 ± 0.0112.3099.91
0.53
V–50038.27 ± 0.031.34 ± 0.018.11 ± 0.0210.20 ± 0.011.22 ± 0.013.74 ± 0.0124.46 ± 0.055.92 ± 0.010.09 ± 0.015.5399.50
0.62
V–70037.39 ± 0.031.35 ± 0.017.73 ± 0.0211.12 ± 0.011.61 ± 0.014.53 ± 0.0123.36 ± 0.055.85 ± 0.010.07 ± 0.015.2798.41
0.13
Fe/Ver25.94 ± 0.010.97 ± 0.015.40 ± 0.0137.38 ± 0.021.15 ± 0.013.33 ± 0.0116.55 ± 0.053.86 ± 0.011.40 ± 0.013.8799.85
Fe/V–50027.26 ± 0.020.96 ± 0.015.82 ± 0.0135.16 ± 0.021.28 ± 0.013.19 ± 0.0117.12 ± 0.053.83 ± 0.011.41 ± 0.013.8699.89
Fe/V–70024.97 ± 0.020.92 ± 0.015.23 ± 0.0139.15 ± 0.021.21 ± 0.013.26 ± 0.0116.34 ± 0.053.60 ± 0.011.23 ± 0.013.8799.78
1 L.O.I. —Loss on ignition at 1000 °C.
Table 2. Cations on the basis 22/O10(OH)2 in vermiculite samples.
AtomsSiAlFe3+Tet.ch.AlFe3+Fe2+MgTiOct.ch.Tot.ch.
Ver2.8870.7260.387−1.1130.000.1730.0632.6870.077+0.327−0.786
V–5002.9000.7230.377−1.1000.000.2040.0392.6810.076+0.366−0.734
V–7002.9020.7070.391−1.0980.000.2580.0102.6530.079+0.416−0.682
Tet.ch.—Tetrahedral charge; Oct.ch.—Octahedral charge; Tot.ch.—Layer unit charge.
Table 3. The mean coherent crystallite size D(012) of hematite in α-Fe2O3 nanoparticles sole and in α-Fe2O3/vermiculite composites.
SamplesFe–500Fe/VerFe/V–500Fe/V–700
D(012) (nm)29312734
Table 4. Textural properties SBET and Vtot of vermiculites, α-Fe2O3 nanoparticles and α-Fe2O3 nanoparticles/vermiculite composites.
VerV–500V–700Fe–500Fe/VerFe/V–500Fe/V–700
SBET (m2/g) 25232436585363
Vtot (mm3liq/g)8685100197145143161
Table 5. The band-gap energies Eg of vermiculite samples, α-Fe2O3 nanoparticles and α-Fe2O3 nanoparticles/vermiculite composite samples.
VerV–500V–700Fe–500Fe/VerFe/V–500Fe/V–700
Eg (eV)1.641.701.861.991.551.501.35
3.032.502.36
Publisher’s Note: MDPI stays neutral with regard to jurisdictional claims in published maps and institutional affiliations.