Article

A Practical Procedure to Determine Natural Radionuclides in Solid Materials from Mining

by
Alejandro Barba-Lobo
1,*,
Manuel Jesús Gázquez
2 and
Juan Pedro Bolívar
1
1
Radiation Physics and Environment Group (FRYMA), Center for Natural Resources, Health and Environment (RENSMA), University of Huelva, 21071 Huelva, Spain
2
Radioactivity and Environment Group, Department of Applied Physics, Marine Research Institute (INMAR), University of Cádiz, 11510 Cádiz, Spain
*
Author to whom correspondence should be addressed.
Minerals 2022, 12(5), 611; https://doi.org/10.3390/min12050611
Submission received: 22 March 2022 / Revised: 28 April 2022 / Accepted: 10 May 2022 / Published: 12 May 2022
(This article belongs to the Special Issue Natural Radionuclides in the Mineral Processing and Metallurgy)

Abstract

:
There are many regulations related to the radiological control of NORMs (Naturally Occurring Radioactive Materials) in activities such as mining, industry, etc. Consequently, it is necessary to apply fast and accurate methods to measure the activity concentrations of long-lived natural radionuclides (e.g., 238U, 234,232,230,228Th, 228,226Ra, 210Pb, 210Po, and 40K) in samples characterized by a wide variety of compositions and densities, such as mining samples (wastes, minerals, and scales). Thus, it is relevant to calculate the radioactive index (RI), which summarizes for all radionuclides the ratio between the activity concentration and its respective threshold activity concentration as established by regulations, in order to classify a material as a NORM. To proceed with the determinations of these radionuclides, two spectrometric techniques based on both alpha-particle and gamma-ray detections should be employed. In the case of gamma-ray spectrometry, it is necessary to correct the full-energy peak efficiency (FEPE) obtained for the calibration sample, ε c , due to self-attenuation and true coincidence summing (TCS) effects. The correction is especially significant at low gamma emission energies, that is, E γ < 150 keV, such as 46 keV (210Pb) and 63 keV (234Th). On the other hand, in samples which contain radionuclides that are in secular disequilibrium with others belonging to the same series (238U or 232Th series), like wastes or intermediate products, it is necessary to measure some pure-alpha emitters (232Th, 230Th, 210Po) by employing alpha-particle spectrometry. A practical and general validated procedure based on both alpha and gamma spectrometric techniques and using semiconductor detectors is presented in this study.

1. Introduction

Research related to NORMs (Naturally Occurring Radioactive Materials) has become essential to the study of natural radionuclides, that is, radionuclides belonging to the 238U and 232Th series, as well as 40K, which are useful in many fields related to environmental radioactivity. These radionuclides can provide relevant information related to the exposure to ionizing radiation levels associated with NORM samples. Today, NORM samples are subjected to many regulations to evaluate the possible radiological risks associated with them [1,2,3,4,5].
In the case of the mining industry, many NORMs are present, involving different material types such as minerals, wastes, scales, intermediates, and final products. Consequently, evaluation of the possible radiological risks to which workers are subjected is required [6,7,8]. For this, it is important to be able to decide if a sample should be considered a NORM by making use of the radioactive index (RI), which is the metric recommended by the standard regulations governing new building materials made using NORM wastes. The equation for RI can be defined as follows:
R I = i a i / a i r
where a i is the activity concentration calculated for each radionuclide contained in each sample and a i r is the minimum activity concentration for each radionuclide i at which a sample can be considered a NORM (see Table 1 for the a i r values established for each sample type [9]).
It is also necessary to consider the emission types in order to properly select a suitable radiometric technique. Thus, since there are several radionuclides that are pure alpha-particle emitters such as 238U, 232,230Th and 210Po, in this study, two spectrometric techniques were employed, based on alpha-particle and gamma-ray detection. However, in the case of samples for which the great majority of the radionuclides belonging to each radioactive series were in secular equilibrium, only one spectrometric technique, e.g., gamma-ray spectrometry, was required, making the radionuclide determinations easier.
This study aimed to develop a general and practical procedure to determine natural radionuclide concentrations in mining samples. For this, a calibration methodology based on the full-energy peak efficiency (FEPE) was employed for gamma-ray emitter measurements, while in the case of alpha-particle emitters, it was necessary to make use of chemical tracers to evaluate the recovery yields (Rq) after applying the radiochemical procedure. Furthermore, several mining samples were selected to analyze a wide range of materials that occur in mining, as well as to study the secular disequilibria between the radionuclides belonging to the same radioactive series for each sample matrix type.

2. Materials and Methods

2.1. Materials

An extended energy range (XtRa) high-purity germanium detector was used in this study due to the very wide energy range covered by this detector (up to about 3 MeV), which allowed us to determine all radionuclides of interest. The XtRa detector (model GX3519, Canberra) has a relative efficiency of 38.4% at 1332 keV (60Co) in relation to a 3″ × 3″ NaI (Tl) detector, a full width at half maximum (FWHM) of 1.74 keV and 0.88 keV at 1332 keV (60Co) and 122 keV (57Co), respectively, and a peak-to-Compton ratio of 67.5:1. Regarding the electronic system connected to the XtRa detector, a FET preamplifier (model 2002 CSL) was employed, where the bias voltage value was fixed at 3500 V.
The alpha-particle spectrometer system consisted of eight chambers, which were equipped with ion-implanted silicon detectors of 450 mm2 (passivated implanted planar silicon (PIPS) detectors), of which the detection efficiencies were about 25%. Furthermore, since alpha-particles are characterized by a high stopping power, a vacuum system was needed, which consisted of a vacuum pump (EDWARDS, model RV8) with a pumping speed of 8.5 m3·h−1, reaching a vacuum of 2 × 10⁻³ mbar.
Regarding the standards selected in this work to carry out the full-energy peak efficiency (FEPE) calibration of the XtRa detector described above, three certified reference materials (codes RGU-1, RGTh-1, and RGK-1) provided by the International Atomic Energy Agency (IAEA) were used, which contained only natural radionuclides from 238U series, 232Th series, and 40K, with certified activity concentrations of 4940(15) Bq·kg−1, 3250(45) Bq·kg−1, and 14,000(200) Bq·kg−1, respectively [10], where the uncertainties are given at 1 sigma level. In the case of calibration of the alpha-particle detectors, a punctual source was employed which contained 233U (4824.2 keV), 239+240Pu (5155.4 keV), and 241Am (5485.7 keV), with a reference activity of 199.0(1.0) Bq.
Ten samples from different mines located in Spain were selected. Among these samples, there were three scales (Scale-1, Scale-2, and Scale-3), the formation of which was promoted by the presence of dissolved salts in a supersaturated solution; a final product (FP); and two intermediate products which were the feed material for screening tables (IP-1) and decanted material from inside a flotation cell (IP-2). In addition, three wastes were taken, which were a material deposited on the bottom of a tank (Waste-1), an osmosis residue formed on a filter press (Waste-2), and a sludge formed in a treatment plant (Waste-3). Moreover, an ilmenite sample (Ilmenite) was chosen since it is a typical mineral present in mining.

2.2. Methods

2.2.1. Gamma-ray Spectrometry

Regarding the efficiency calibration carried out for the XtRa detector, first, the most intense gamma emissions were selected. The standards (RGU-1, RGTh-1 and RGK-1) were then compacted until the chosen thickness values were reached (ranging from 5 to 50 mm), achieving an apparent density of 1.63(2) g·cm−3. After calculating the experimental FEPEs, an empirical function was found which provided the FEPEs versus the sample thickness (h) at each selected energy. Finally, the efficiency calculated for the standard matrices ( ε c ) needed to be transformed to the one obtained for any problem sample ( ε ) to compensate the differences of attenuation between calibration and problem samples, where this type of correction is more relevant as the gamma emission energy decreases [11,12]. For this, the self-attenuation factor (f) was employed, which depended on the chemical composition, thickness (h), which was the same for both the calibration and problem samples), and apparent densities of the calibration and problem samples. See [13] for a detailed explanation of the efficiency calibration methodology developed for gamma-ray spectrometry.
The experimental FEPEs were obtained from the calibration matrices using the following equation:
ε c e x p ( E γ , h ) = ε c e x p ( E γ , m c ) = G B F I P γ   a   m c   t
where G, B, F, and I are the total number of counts for the full-energy peak of interest, the Compton continuum, the background, and the interference term, respectively. The interference term is considered when a full-energy peak is very close to another one related a radionuclide of interest. Therefore, in such cases, the interference term must be considered in order to obtain the net count (N). P γ is the gamma emission probability (taken from [14]); a and m c are the activity concentration and mass (obtained for each h) of the calibration sample, respectively; E γ is the gamma emission energy; and t is the counting time. See Tables S1 and S2 in the Supplementary Material for further information about the obtained ε c e x p .
The empirical function that best fitted ε c e x p was of an asymptotic exponential type [13]:
ε c ( E γ , h ) = a r 1 e x p ( a r 2 h ) + a r 3
where a r 1 , a r 2 , and a r 3 are the parameters that resulted from fitting the experimental FEPEs versus h for each E γ of interest (in Tables S3 and S4 (in Supplementary Material), the values obtained for the a r i parameters can be found).
Once the efficiency was obtained for the calibration sample, it was possible to calculate ε by using the relationship between ε c and ε , that is, ε = f ε c , where the f factor can be determined using the Cutshall model [15]:
f ( E γ , h , η c ,   ρ c , η , ρ ) = η c ρ c ( 1 e x p ( η ρ h ) ) η ρ ( 1 e x p ( η c ρ c h ) )
where h and E γ are the problem sample thickness and the energy for which the self-attenuation correction factor is calculated; η c and η are the mass attenuation coefficients of the calibration and problem samples, respectively; and ρ c and ρ are the apparent densities measured for the calibration and problem samples, respectively. The values for η c and η at each energy and the methodology developed for their calculation in reference [11] are shown.
On the other hand, for samples with significant 222Rn losses (waste, scales, etc.), it is recommendable to carry out 226Ra determination using its gamma-emission energy (186 keV) to avoid waiting at least a month for secular equilibrium to be reached between 226Ra and 222Rn. For this, two cases were considered: with and without considering secular equilibrium between 238U and 226Ra. For the first case, an equivalent probability of 226Ra + 235U, P γ * , had to be calculated at 186 keV. Thus, in this case, the 226Ra activity concentration, a 226 Ra , was obtained as follows:
a 226 Ra = N P γ *   ε 186 keV   m   t
where N, P γ * = 6.14(6)%, and ε 186 k e V are the net counts for the full-energy peak and the equivalent probability of 226Ra + 235U at 186 keV, and the efficiency calculated in the problem sample matrix at 186 keV, respectively, and m and t are the sample mass and the counting time, respectively.
For the other case, it was necessary to consider the interference term between 226Ra and 235U, I235U, which was found using the following equation [12,13]:
I 235 U = A 235 U   P γ   ( 235 U ) ε 186 keV   t         = 0.0263   A 238 U   ε 186 keV   t
where A 235 U and A 238 U are the 235U and 238U activities, respectively; P γ (235U) and ε 186 k e V are the 235U gamma emission probability and the efficiency calculated in the problem sample matrix at 186 keV, respectively; and t is the counting time. Additionally, in Equation (6), A 235 U = 0.046   A 238 U [16], and a secular equilibrium between 238U and 234Th is considered.
For this second case, the a 226 R a can be calculated as follows:
a 226 R a = G B F I 235 U P γ ( 226 R a )   ε 186 keV   m   t = G B f t 0.0351   m   ε 186 keV   t 0.75   a 234 T h
where G, B, F, f, I 235 U , P γ (226Ra), and ε 186 keV are the gross, the Compton continuum, the environmental background expressed in counts and counts per second, the interference term, the 226Ra emission probability, and the efficiency calculated in the real sample matrix at 186 keV, respectively, and t, m, and a 234 T h are the counting time, the sample mass, and the 234Th activity concentration, respectively.

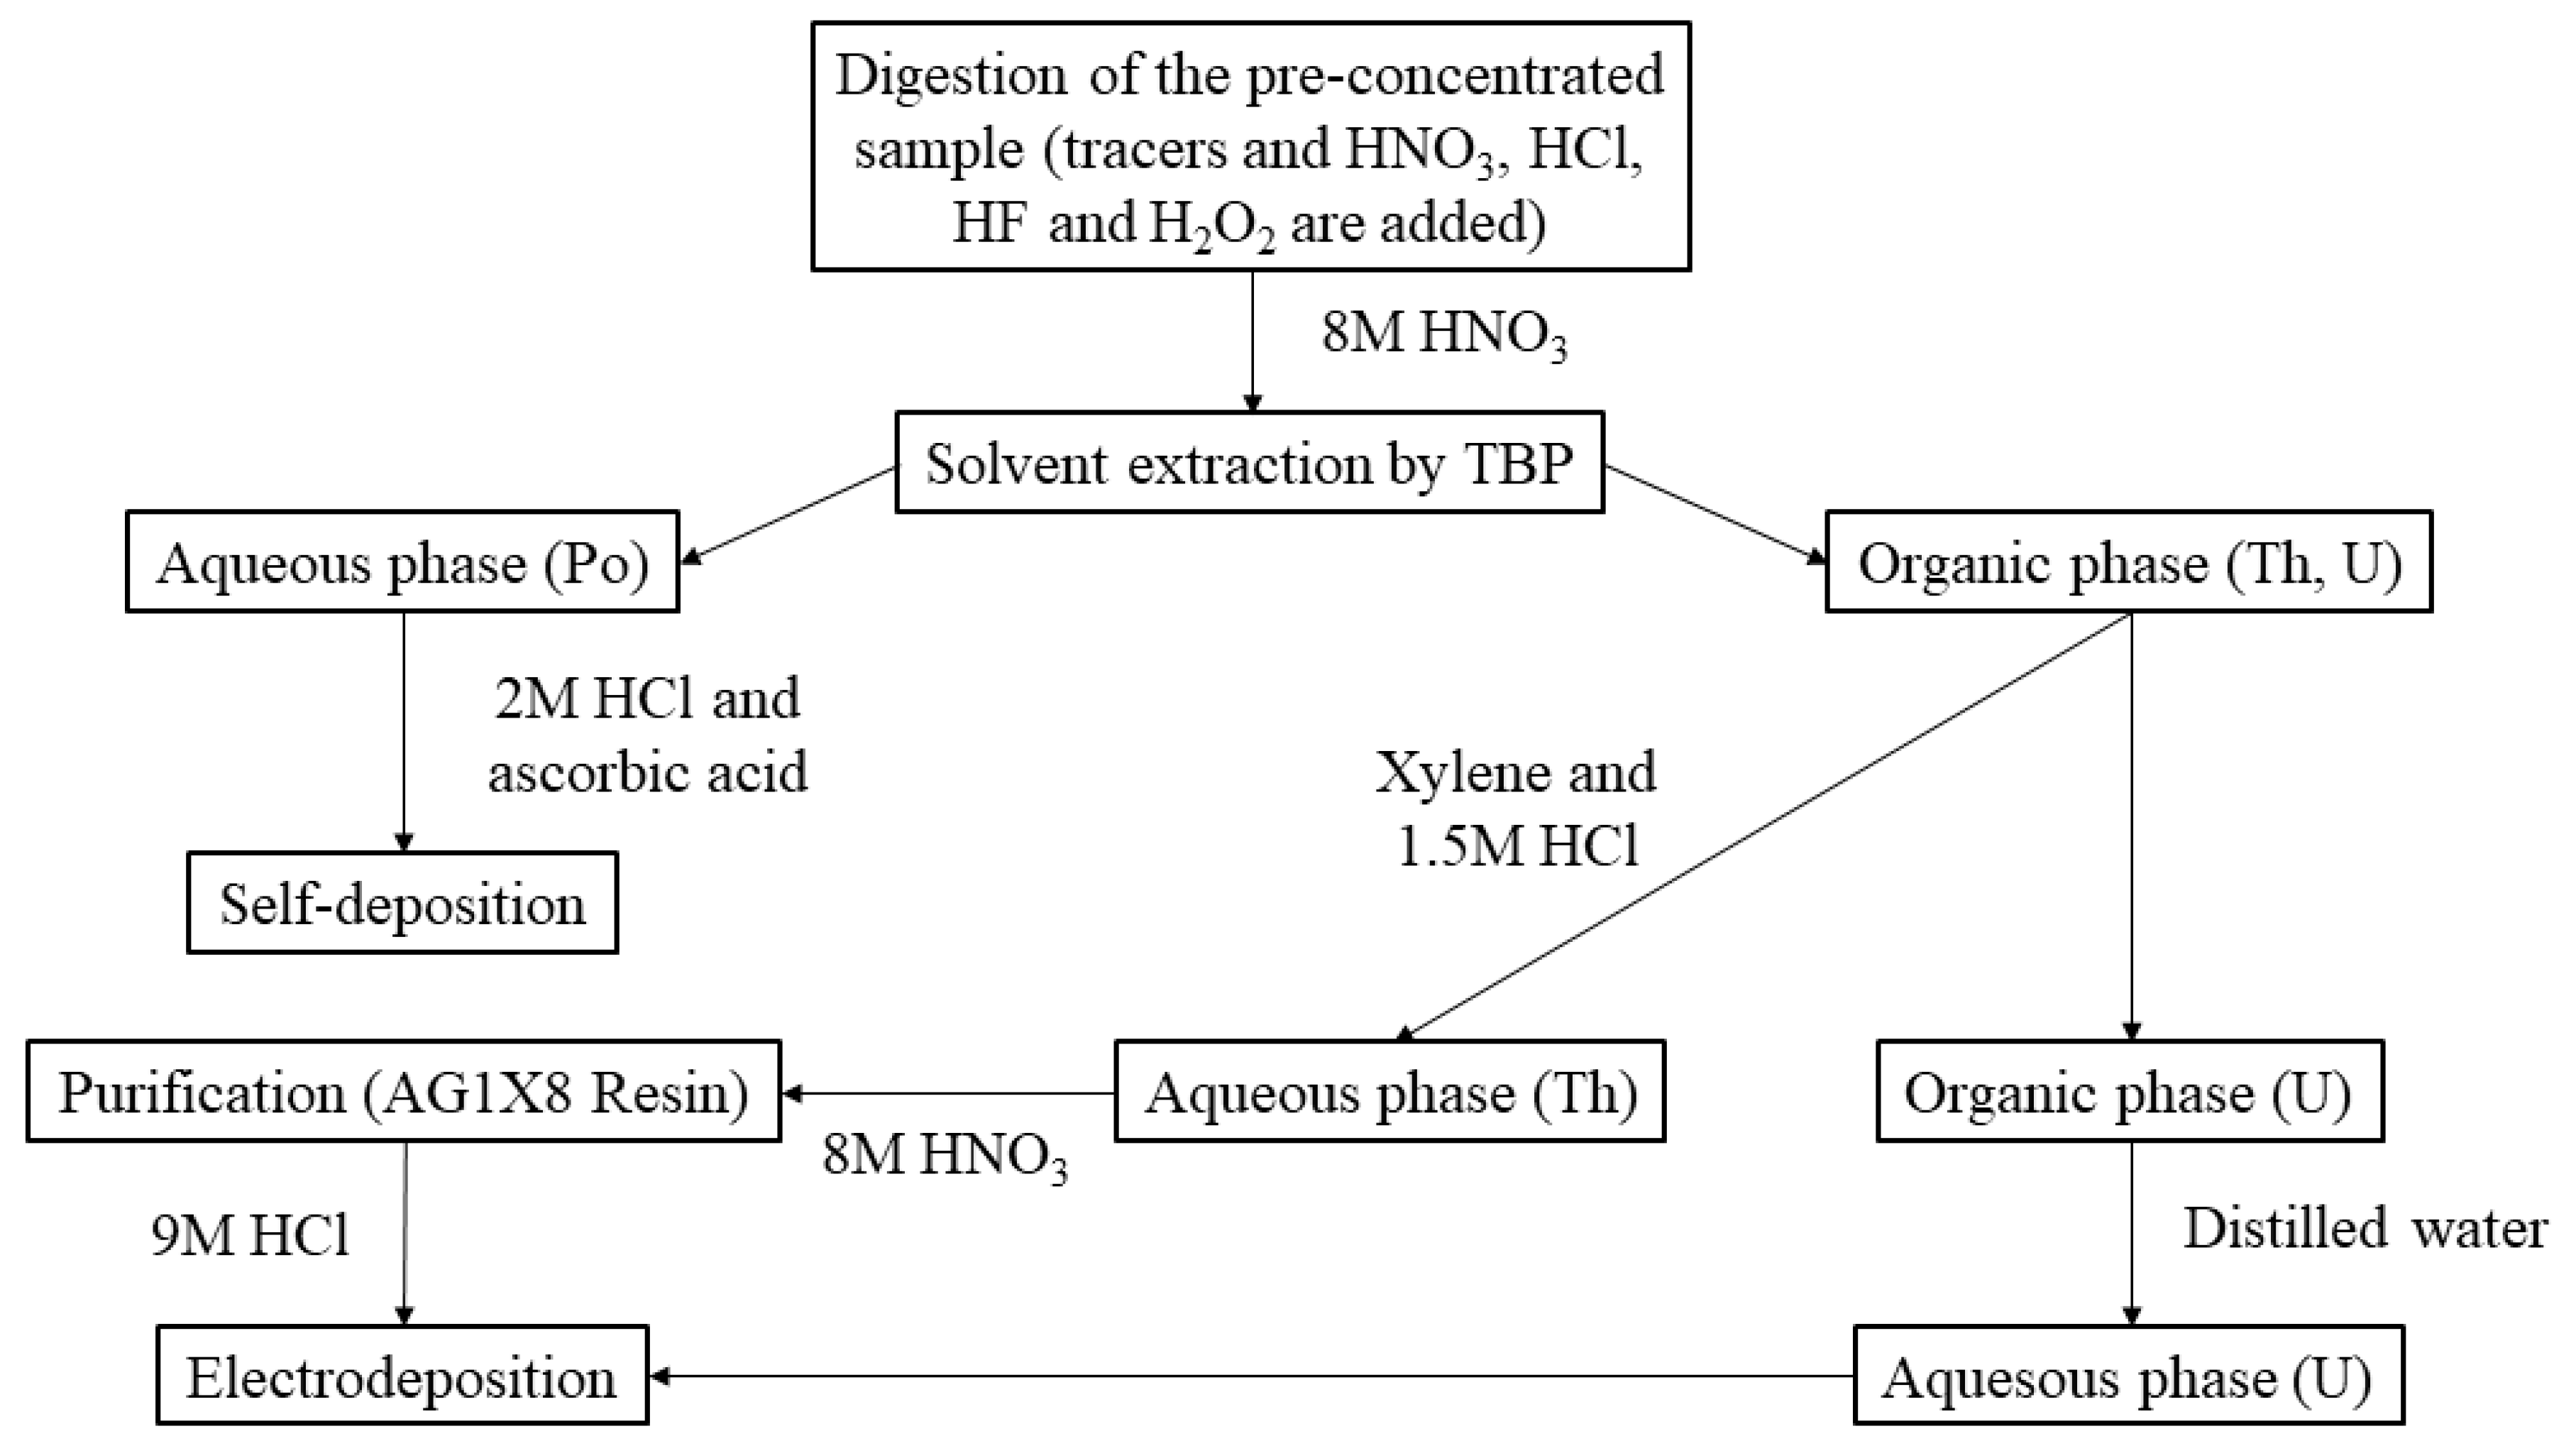
2.2.2. Alpha-Particle Spectrometry

The alpha-particle spectrometry technique with Si detectors is needed to determine pure alpha emitters. The first step in alpha emitter determination is to calibrate in energy and efficiency the employed Si detectors. For this, the punctual source previously described in Section 2.1 was used, which was measured for 600 s using each Si detector. After the measurement was taken by each detector, the experimental efficiency of each Si detector was calculated using an expression analogous to Equation (2) but in the case of the alpha-particle emitters that were present in a punctual source. Once the calibrations of the Si detectors had been performed, it was necessary to apply the radiochemical method which allowed us to isolate the different radioelements of interest, and in our case a radiochemical process based on tributilphosphate (TPB) was applied (see Figure 1).
The first step was to add the solutions containing the isotopic tracers: 209Po (T1/2 = 102 years), 229Th (T1/2 = 7340 years), and 232U (T1/2 = 68.9 years). These solutions were certified materials with activity concentrations of 105.58(7) mBq·mL−1, 86.8(5) mBq·mL−1, and 138.9(6) mBq·mL−1, respectively.
For the dissolution of the solid sample, 9 mL HNO3, 2 mL HCl, 3 mL HF, and 2 mL H2O2 were added. The mixture thus obtained was evaporated to dryness and 5 mL of 8 M HNO3 was added. Next, 5 mL of TBP (tributyl phosphate) was added [17], allowing us to separate the Po isotopes (aqueous phase) while leaving an organic phase with Th and U isotopes. The aqueous phase extraction was done three times. After dissolving the residue containing Po isotopes using 10 mL of 2 M HCl, 50 mg of ascorbic acid was added to reduce Fe3+ into Fe2+ and the sample was filtered. Finally, the sample containing the Po isotopes was gently agitated for 6 h, with the result that the Po isotopes self-deposited onto a sheet of silver [18,19].
By adding 20 mL of xylene and 15 mL of 1.5 M HCl to the previous organic phase, it was possible to extract the Th isotopes into the aqueous phase, leaving an organic phase (U). The aqueous phase extraction was done three times. It was then necessary to purify the Th isotopes using an anion exchange resin (AG1X8 resin) [20,21], ensuring that the traces of U and interferences were removed. Thus, after dissolving the residue with 5 mL of HNO3, it was evaporated to dryness and 10 mL of 8 M HNO3 was added. This sample was transferred to a column in which the AG1X8 resin is placed. Thus, after adding 80 mL of 8 M HNO3, the Th isotopes were extracted using 40 mL of 9 M HCl. Finally, the solution containing Th was transferred onto an electrodeposition cell, with the result that the Th isotopes were electrodeposited onto a stainless steel disk.
In the case of the U, 15 mL of distilled water was added to the organic phase obtained after previously extracting the Th isotopes, achieving extraction of the U isotopes. The aqueous phase extraction was done three times. The sample containing U was then transferred to an electrodeposition cell and the U isotopes were electrodeposited onto a stainless steel disk.
The disks containing the Po, Th, and U were counted in the vacuum chamber of the alpha-particle spectrometer, and the activity concentrations of the different radionuclides were calculated using the following equation:
a R N α = a T r   N R N α   m T r N T r   m   e λ R N α Δ t
where R N α is the alpha-particle emitter of interest; Tr is the tracer used for R N α ; N T r and N R N α are the net counts in the region of spectrum corresponding to Tr and R N α , respectively; a T r is the activity concentration of Tr added; m T r and m are the tracer and sample masses, respectively; λ R N α is the R N α decay constant; and Δ t is the time elapsed between the R N α deposition onto the disk and the counting start.
The recovery yield resulting from the procedure applied for each chemical element, R q T r , was determined using the following equation [22]:
R q T r = N T r ε   P α   a T r   t
where N T r are the net counts of tracer, a T r is the tracer activity concentration added, Pα is the emission probability of an alpha particle (100% in our case), t is the counting time, and ε is the efficiency of detection. Regarding the recovery yield, the steps of the radiochemical method that contribute mainly to the activity losses in the overall process are the evaporations of the solutions containing the samples, the separations of the aqueous phase from the organic phase, and the transference of those solutions from one beaker to another. Furthermore, in the case of the Th isotopes, activity losses can also be caused due to the purification using the column in which the resin is placed. For this reason, the activity losses in the case of Th isotopes are usually higher than the ones obtained for U and Po isotopes, for which the purification step is not necessary after extraction.

3. Results and Discussion

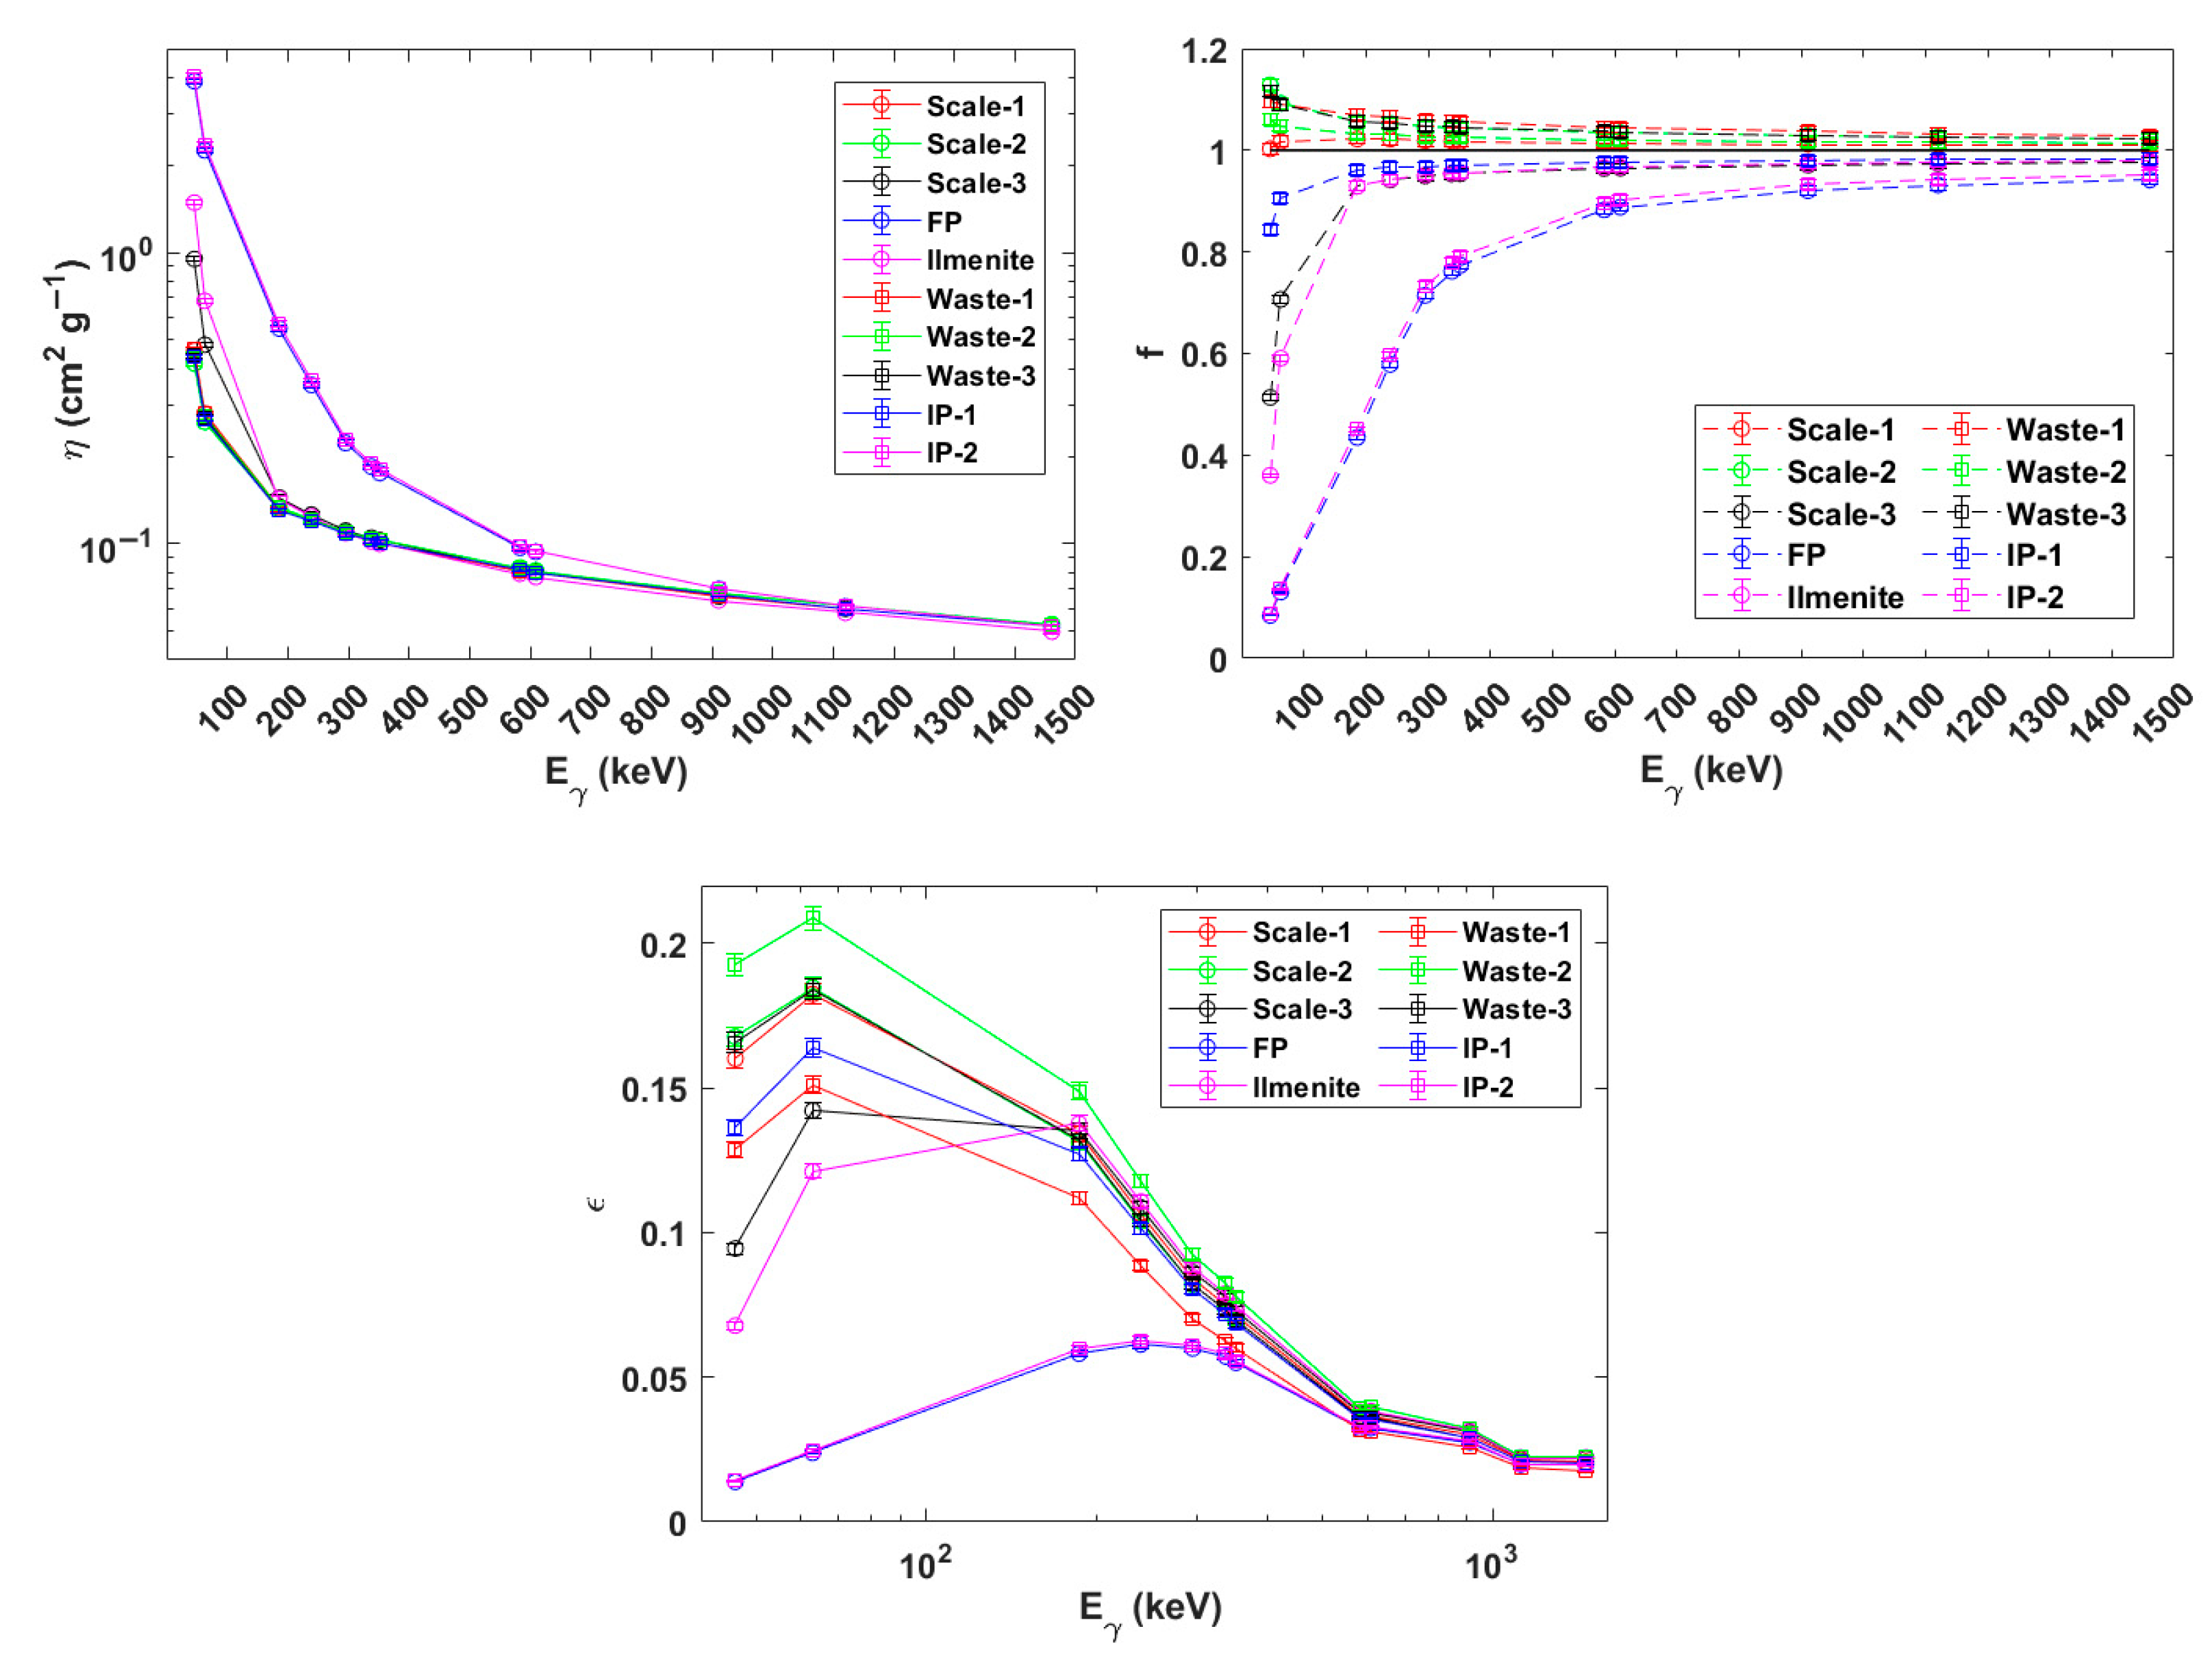
3.1. FEPE Obtention for Problem Samples

In this section, the FEPE values obtained for each problem sample ( ε ) versus the energies of interest are shown. For this, it was necessary to calculate the η at each selected energy and to apply the f factor to correct the self-attenuation effects present for the photons emitted at each E γ . As can be seen in Figure 2, η , f, and ε were plotted versus the E γ values of interest for each mining sample selected in this study.
In Figure 2, it is possible to observe that η decreased as E γ increased for all samples, which was consistent since as E γ decreases, it is easier for photons to be attenuated. Furthermore, the highest η values (about 4 cm2·g−1) were found for the FP and IP-2 samples. This was because these two samples had average atomic numbers, <Z> = 67 and 66, respectively, that were much higher than the ones of the other samples. Furthermore, in cases where the chemical compositions of two samples were very similar (for example, FP and IP-2), the apparent density and thickness were the main factors that caused differences between the self-attenuation effects of one sample type and another, which was especially true at energies lower than 150 keV. The chemical composition and apparent density of all samples analyzed in this study can be found in Table 2.
With respect to the behavior followed by the f factor for each sample, f was found to be less than 1 for problem samples (Scale-3, Ilmenite, IP-1, IP-2, and FP) for which <Z> and ρ were higher than the calibration sample ones (about 13 and 1.63 g·cm−3, respectively), within which the highest differences between ε and ε c were reached for the FP and IP-2 samples (f  0.08 at 46 keV). This was consistent because as <Z> and ρ were higher than the calibration sample values, the photon attenuation occasioned by the problem sample matrices was higher than that resulting from the calibration sample matrix. Consequently, the ε values obtained for those problem samples were less than ε c . On the other hand, for the other samples (Scale-1, Scale-2, Waste-1, Waste-2, and Waste-3), for which <Z> and ρ were lower than for the calibration sample, the resulting f values were higher than 1, in agreement with the previous reasoning where the highest f values (about 1.15 at 46 keV) were obtained in the cases of the Scale-2 and Waste-3 samples.
Regarding the ε values obtained for each problem sample, it is possible to observe that the behavior of the ε curve obtained versus E γ for each sample was very similar to the other ε curves shown in Figure 2, where ε ranged from 1.38(3)% (46 keV, FP and IP-2) to 20.9(4)% (63 keV, Waste-2). Furthermore, note that the highest ε values were obtained for E γ values ranging from about 63 keV to 110 keV, which was consistent since the photoelectric effect is more likely to take place at low energies ( E γ < 150 keV).

3.2. Determination of the Gamma-ray and Alpha-Particle Emitters: Obtention of the RI Index

The activity concentrations obtained for the radionuclides of interest using spectrometric techniques based on gamma-ray and alpha-particle detection are shown, as well as the values for the RI index obtained for each mining sample. In Table 2 and Table 3, the activity concentrations are shown for the radionuclides contained in the Scale-1, Scale-2, Scale-3, FP, and Ilmenite, and Waste-1, Waste-2, Waste-3, IP-1, and IP-2 samples, respectively.
As can be seen in Table 3 and Table 4, it is possible to observe that the highest activity concentration for 238U was 22,300(400) Bq·kg−1 (Waste-3), while in the cases of 228Ra (via 228Ac), 228Th (via 212Pb or 208Tl), 226Ra(186 keV or via 214Pb or 214Bi), 210Po, and 40K, the highest values were found for the Scale-3 sample, which were about 50,000 Bq·kg−1, 16,000–18,000 Bq·kg−1, 35,000 Bq·kg−1, 1900 Bq·kg−1 and 2600 Bq·kg−1, respectively. In the case of 232Th and of 230Th and 210Pb, the highest activity concentrations were found for the Ilmenite sample (357(11) Bq·kg−1) and for the IP-2 sample (2590(90) Bq·kg−1 and 1411(110) Bq·kg−1, respectively), respectively.
On the other hand, the lowest activity concentrations were found to be 2.2(1.4) Bq·kg−1 (Waste-1), <1.5 Bq·kg−1 (Waste-2), about 111 Bq·kg−1 (Ilmenite), <50 Bq·kg−1 (Scale-2 and Scale-3), 3.7(8) Bq·kg−1 (Waste-2), about 1.5 Bq·kg−1 (Scale-1, Scale-2, and Waste-2), about 20 Bq·kg−1 (Waste-3), about 10 Bq·kg−1 (Waste-3), and 4(7) Bq·kg−1 (FP) for 238U, 230Th, 226Ra, 210Pb, 210Po, 232Th, 228Ra, 228Th, and 40K, respectively.
Furthermore, in the case of the radionuclides determined using alpha-particle spectrometry, it is necessary to know the recovery yields obtained for the Po, Th, and U isotopes, which were higher than 90%, 65%–82%, and 70%–85%, respectively.
In Table 5, the RI values obtained for each mining sample are presented. According to the results shown in Table 5, all mining samples selected in this study can be considered NORMs except the Waste-1 sample, which had a RI value was 1.05(7), where the RI index related to a typical soil (Soil) was much less than 1, that is, 0.250(15). Furthermore, it is necessary to highlight the very high RI values obtained for the three scale samples (from Scale-1 to Scale-3), which had RI values of 23(2), 7.8(5), and 149(9), respectively. This agrees very well with the high activity concentrations obtained for a large number of radionuclides in the case of these three scales, which were previously shown in Table 3.

3.3. Secular Disequilibria between Radionuclides Belonging to the 238U and 232Th Series

In this section, the disequilibria between the radionuclides belonging to each radioactive series (238U and 232Th series) were analyzed for each selected mining sample. Thus, in Figure 3, the ratios 234Th/238U, 234U/238U, 226Ra/238U, 230Th/234Th, 214Pb/226Ra, 210Po/210Pb, 228Ra/232Th, and 228Th/228Ra can be found for each sample.
As can be seen in Figure 3, very significant disequilibria (a ratio of about 1000) were found between 226Ra and 238U for the three scale samples, as well as for Waste-1 and Waste-2. This fact is clearly related to the formation process of the samples, due to the fractionation process of the radionuclides under normal operating conditions (pressure, temperature, pH, etc.) usual in any industrial processes. In the case of the 234U/238U, the ratios were about 1 for all samples. Another ratio that must be considered is the one related to 234Th/238U; Ilmenite was the sample for which this ratio was the highest (about 3.5). This significant difference between 238U and 234Th may be due to the high concentration of Fe in the case of the Ilmenite, which was about 37% (see Table 2). Consequently, the digestion of the Ilmenite is very complicated, which can explain those differences between 238U and 234Th. For the 230Th/234Th ratio, the main disequilibria were observed for the Scale-3 and Waste-3 samples, where the 230Th/234Th ratio values were about 4 and 0.01, respectively. In order to evaluate the losses of 222Rn present in each sample, it was necessary to take the 214Pb/226Ra ratio. For this ratio, there was a sample (Waste-3) for which the 214Pb/226Ra value was found to be about 0.05. Regarding the disequilibria existing between 210Pb and 210Po, there was a sample (Scale-3) that stood out among the others, with a 210Po/210Pb of about 70. In addition, it is necessary to note that the differences between 210Pb and 210Po were also relatively significant for the Ilmenite sample, where a 210Po/210Pb ratio about 0.5 was found. This may also be due to the high presence of Fe in the case of the Ilmenite, which makes the reduction of Fe3+ into Fe2+ very complicated when using ascorbic acid, resulting in the low activity concentration of 210Po obtained after measuring the silver disks.
On the other hand, with respect to the disequilibria occurring in the 232Th series, it is important to highlight the ones existing between 232Th and 228Ra, where a ratio about 1000 was found for the three scale samples, as well as for Waste-1 and Waste-2. This can prove the dependence of the RI index on time due to the 228Ra half-life (about 5.8 years). In the case of the 228Th/228Ra, it was interesting to note that the ratios were about 1 for all samples, except for the three wastes (from Waste-1 to Waste-3), as well as for the Scale-2 and Scale-3, where the 228Th/228Ra ratios ranged from about from 0.03 (Waste-2) to 0.5 (Waste-3).
Consequently, it is necessary to highlight the need to use both spectrometric techniques, this being especially true in the cases of samples originating in chemical reactions such as scales or wastes, where the secular disequilibria between the radionuclides belonging to each radioactive series were found to be the highest in general [23,24]. Furthermore, it is necessary to highlight the need to measure 226Ra by making use of its gamma-emission energy (186 keV), which is recommendable for samples characterized by significant 222Rn losses [12,13,25,26,27].

4. Conclusions

In the present study, a general and practical methodology was developed to determine the natural radionuclides contained in mining samples, in which spectrometric radiometric techniques based on alpha-particle and gamma-ray detections are employed.
In the case of gamma-ray spectrometry, a validated efficiency calibration based on the full-energy peak efficiency (FEPE) was selected in the case of the natural radionuclides, where a general efficiency was obtained as a function of the sample thickness (h) for each gamma emission energy ( E γ ). Furthermore, corrections related to the self-attenuation effects of photons were needed in order to compensate for the differences of the photon attenuations that were caused by the calibration and problem matrices, where the chemical composition and apparent density needed to be known. In addition, it is necessary to highlight that these corrections are important to consider, especially at low energies, that is, E γ < 150 keV. In the case of the alpha-particle spectrometry, it was necessary to use solutions containing 209Po, 229Th, and 232U in order to trace the chemical behaviors of the Po, Th, and U isotopes, respectively. In this way, it is possible to know that the sample activity recovered after applying the radiochemical method, which can be quantified by the recovery yield (Rq).
Regarding the calculations of the RI index carried out in order to decide if a sample can be considered NORM, the scale samples (from Scale-1 to Scale-3) were the samples for which the RI values were found to be the highest (23(2), 7.8(5), and 149(9), respectively) compared with the values obtained for the other mining samples. This agrees with the activity concentrations obtained for the radionuclides contained in these three samples, where the highest ones were measured for these three scales, this being especially true for Scale-3.
The disequilibria between the radionuclides belonging to the same radioactive series (238U series and 232Th series) were also analyzed for all mining samples selected in this study. On the one hand, in the case of the 238U series, the great majority of the 234Th/238U ratios were about 1 and, therefore, for these sample types, it was possible to determine 238U via 234Th by using gamma-ray spectrometry for many sample types. For the 230Th/234Th ratios in the case of the Scale-3 and Waste-3, very high disequilibria were found, where their ratio values were about 4 and 0.01, respectively. Therefore, for the 230Th determination, it was necessary to make use of alpha-particle spectrometry in the cases of the samples that originated spontaneously via several chemical reactions. Furthermore, another relevant ratio to be considered is the 214Pb/226Ra, where it is recommended to carry out the 226Ra determination using gamma-emission energy (186 keV) when the sample is characterized by significant 222Rn losses.
On the other hand, in the cases corresponding to the 232Th series, the main disequilibria took place between 232Th and 228Ra, obtaining 228Ra/232Th ratios about 1000 for the three scale samples, as well as for Waste-1 and Waste-2. This is important to consider since the RI index has a strong dependence on time due to the half-life of the 228Ra (about 5.8 years), which is essential in order to valorize building materials. This makes it necessary to apply alpha-particle spectrometry for several mining sample types, this being especially true for the ones formed by chemical procedures.

Supplementary Materials

The following supporting information can be downloaded at: https://www.mdpi.com/article/10.3390/min12050611/s1, Table S1: Experimental efficiency values ( ε c e x p ) resulting for the calibration matrix of the RGU-1 standard. Table S2: Experimental efficiency values ( ε c e x p ) resulting for the calibration matrix of the RGTh-1 and RGK-1 standards. Table S3: a r 1 , a r 2 and a r 3 , the reduced chi-square values, χ R 2 (where the and relative average residuals, <Res>, were obtained for each energy after fitting efficiencies in the RGU-1 calibration matrix. Table S4: a r 1 , a r 2 and a r 3 , the reduced chi-square values, χ R 2 (where the critical χ R 2 is 2.01 at 0.05 of significance level and 7 degrees of freedom) and relative average residuals, <Res>, were obtained for each energy after fitting efficiencies in the RGTh-1 and RGK-1 calibration matrices.

Author Contributions

Conceptualization, Data curation, Formal analysis, Investigation, Methodology, Validation, Writing—original draft, Writing—review & editing: A.B.-L.; Conceptualization, Data curation, Formal analysis, Investigation, Methodology, Validation, Writing—original draft, Writing—review and editing: M.J.G.; Conceptualization, Data curation, Formal analysis, Investigation, Methodology, Supervision, Validation, Writing—original draft, Writing—review and editing: J.P.B. All authors have read and agreed to the published version of the manuscript.

Funding

This research was partially funded by the projects of the Regional Government of Andalusia called “Basic processes regulating the fractionations and enrichments of natural radionuclides under acid mine drainage conditions” (Ref.: UHU-1255876), and “Treatment of acid leachates from phosphogypsum piles located at Huelva, and transport modelling of the released radionuclides” (Ref.: P20_00096), the projects funded by the Spanish Ministry of Science, Innovation and Universities’ Research Agency “Development and optimization of a process for removing natural radionuclides in phosphogypsum leachates” (Ref.: PID2020-116461RB-C21) and “Valorization of wastes generated from the process for removing natural radionuclides in phosphogypsum leachates” (Ref.: PID2020-116461RA-C22), and the Project for Novel Principal Investigators “Quantitative study of the variables involved in the radon exhalation rate for granular solids; application to rafts of granular solid phosphogypsum” (Ref.: UHUPJ-00005-632).

Data Availability Statement

Data will be made available on request.

Conflicts of Interest

The authors declare that they have no known competing financial interest or personal relationship that could have appeared to influence the work reported in this paper.

References

  1. Chambers, D.B. Radiological protection in North American naturally occurring radioactive material industries. Ann. ICRP 2015, 44, 202–213. [Google Scholar] [CrossRef] [PubMed] [Green Version]
  2. European Commission. Council Directive 2013/59/Euratom of 5 December 2013. Laying down Basic Safety Standards for Protection against the Dangers Arising from Exposure to Ionising Radiation. 1983. Available online: https://ec.europa.eu/energy/sites/ener/files/rp_188.pdf (accessed on 5 February 2022).
  3. Ravisankar, R.; Vanasundari, K.; Chandrasekaran, A.; Rajalakshmi, A.; Suganya, M.; Vijayagopal, P.; Meenakshisundaram, V. Measurement of natural radioactivity in building materials of Namakkal, Tamil Nadu, India using gamma-ray spectrometry. Appl. Radiat. Isot. 2012, 70, 699–704. [Google Scholar] [CrossRef]
  4. Szabó, Z.; Völgyesi, P.; Nagy, H.É.; Szabó, C.; Kis, Z.; Csorba, O. Radioactivity of natural and artificial building materials—A comparative study. J. Environ. Radioact. 2013, 118, 64–74. [Google Scholar] [CrossRef] [PubMed]
  5. Krieger, K. NORM contamination—Now you see it, now you don’t. Health Phys. 2005, 89, S20–S21. Available online: http://radonattahoe.com/TENORM.pdf (accessed on 15 February 2022). [CrossRef] [PubMed]
  6. Innocent, A.J.; Onimisi, M.Y.; Jonah, S.A. Evaluation of Naturally Occurring Radionuclide Materials in Soil Samples Collected From Some Mining Sites in Zamfara State, Nigeria. Br. J. Appl. Sci. Technol. 2013, 3, 684–692. [Google Scholar] [CrossRef]
  7. Odumo, O.B.; Mustapha, A.O.; Patel, J.P.; Angeyo, H.K. Radiological survey and assessment of associated activity concentration of the naturally occurring radioactive materials (NORM) in the Migori artisanal gold mining belt of southern Nyanza, Kenya. Appl. Radiat. Isot. 2011, 69, 912–916. [Google Scholar] [CrossRef] [PubMed]
  8. Michalik, B. NORM impacts on the environment: An approach to complete environmental risk assessment using the example of areas contaminated due to mining activity. Appl. Radiat. Isot. 2008, 66, 1661–1665. [Google Scholar] [CrossRef] [PubMed]
  9. Consejo de Seguridad Nuclear (CSN). Guide for the Control of the Exposure to Natural Radioactive Sources. Available online: https://www.csn.es/documents/10182/896572/GS%2011-02%20Control%20de%20la%20exposici%C3%B3n%20a%20fuentes%20naturales%20de%20radiaci%C3%B3n (accessed on 18 January 2022).
  10. IAEA. Preparation of Gamma-Ray Spectrometry Reference Materials RGU-1, RGTh-1 and RGK-1. Report-IAEA/RL/148, Vienna. 1987. Available online: https://nucleus.iaea.org/sites/ReferenceMaterials/Shared%20Documents/ReferenceMaterials/Radionuclides/IAEA-RGTh-1/rl_148.pdf (accessed on 7 January 2022).
  11. Barba-Lobo, A.; Mosqueda, F.; Bolívar, J.P. A general function for determining mass attenuation coefficients to correct self-absorption effects in samples measured by gamma spectrometry. Radiat. Phys. Chem. 2021, 179, 109247. [Google Scholar] [CrossRef]
  12. Barba-Lobo, A.; San Miguel, E.G.; Lozano, R.L.; Bolívar, J.P. A general methodology to determine natural radionuclides by well-type HPGe detectors. Measurement 2021, 181, 109561. [Google Scholar] [CrossRef]
  13. Barba-Lobo, A.; Mosqueda, F.; Bolívar, J.P. An upgraded lab-based method to determine natural γ-ray emitters in NORM samples by using Ge detectors. Measurement 2021, 186, 110153. [Google Scholar] [CrossRef]
  14. The Decay Data Evaluation Project. Available online: http://www.nucleide.org/DDEP_WG/DDEPdata.htm (accessed on 11 January 2022).
  15. Cutshall, N.H.; Larsen, I.L.; Olsen, C.R. Direct analysis of 210Pb in sediment samples: Self-absorption corrections. Nucl. Instrum. Methods Phys. Res. A 1983, 206, 309–312. [Google Scholar] [CrossRef]
  16. Agha, A.R.; El-Mongy, S.A.; Kandel, A.E. Assay of uranium isotopic ratios 234U/238U, 235U/238U in bottom sediment samples using destructive and non destructive techniques (Nasser Lake). In Proceedings of the Eighth Nuclear and Particle Physics Conference (NUPPAC-2011), Hurghada, Egypt, 20–24 November 2011; Volume 43, pp. 221–229. Available online: https://inis.iaea.org/search/search.aspx?orig_q=RN:43099476 (accessed on 3 February 2022).
  17. Holm, E.; Fukai, R. Method for multi-element alpha-spectrometry of actinides and its application to environmental radioactivity studies. Talanta 1977, 24, 659–664. [Google Scholar] [CrossRef]
  18. El-Daoushy, F.; Olsson, K.; Garcia-Tenorio, R. Accuracies in Po-210 determination for lead-210 dating. Hydrobiologia 1991, 214, 43–52. [Google Scholar] [CrossRef]
  19. Hurtado, S.; García-Tenorio, R.; García-León, M. 210Pb determination in lead shields for low-level γ-spectrometry applying two independent radiometric techniques. Nucl. Instrum. Methods Phys. Res. Sect. A 2003, 497, 381–388. [Google Scholar] [CrossRef]
  20. Lee, S.-H.; La Rosa, J.; Gastaud, J.; Povinec, P.P. The development of sequential separation methods for the analysis of actinides in sediments and biological materials using anion-exchange resins and extraction chromatography. J. Radioanal. Nucl. Chem. 2005, 263, 419–425. [Google Scholar] [CrossRef]
  21. AG1X8 Resin. Available online: https://www.bio-rad.com/es-es/sku/1401441-ag-1-x8-anion-exchange-resin-analytical-grade-100-ndash-200-mesh-chloride-form-500-g?ID=1401441 (accessed on 8 February 2022).
  22. Cuesta, E.; Barba-Lobo, A.; Lozano, R.L.; San Miguel, E.G.; Mosqueda, F.; Bolívar, J.P. A comparative study of alternative methods for 210Pb determination in environmental samples. Radiat. Phys. Chem. 2022, 191, 109840. [Google Scholar] [CrossRef]
  23. Kobashi, A.; Sato, J.; Saito, N. Radioactive Disequilibrium with Uranium, Thorium and Radium Isotopes Leached from Euxenite. Radiochim. Acta 1979, 26, 107–111. [Google Scholar] [CrossRef]
  24. Kratz, J.-V.; Heinrich, K. Nuclear and Radiochemistry: Fundamentals and Applications, 3rd ed.; Wiley: Hoboken, NJ, USA, 2013. [Google Scholar]
  25. Köhler, M.; Preuβe, W.; Gleisberg, B.; Schäfer, I.; Heinrich, T.; Knobus, B. Comparison of methods for the analysis of 226Ra in water samples. Appl. Radiat. Isot. 2002, 56, 387–392. [Google Scholar] [CrossRef]
  26. Ebaid, Y.Y.; El-Mongy, S.A.; Allam, K.A. 235U–γ emission contribution to the 186 keV energy transition of 226Ra in environmental samples activity calculations. Int. Congr. Ser. 2005, 1276, 409–411. [Google Scholar] [CrossRef]
  27. Völgyesi, P.; Kis, Z.; Szabó, Z.; Szabó, C. Using the 186-keV peak for 226Ra activity concentration determination in Hungarian coal-slag samples by gamma-ray spectroscopy. J. Radioanal. Nucl. Chem. 2014, 302, 375–383. [Google Scholar] [CrossRef]
Figure 1. Scheme for the radiochemical method used to extract the Po, Th, and U isotopes.
Minerals 12 00611 g001
Figure 2. Obtention of the mass attenuation coefficient, η, at each energy of interest (Eγ) for several sample matrices selected in this study, which were scale samples (from Scale-1 to Scale-3), a final product (FP), an ilmenite (Ilmenite), wastes (from Waste-1 to Waste-3), and intermediate products (IP-1 and IP-2). The self-attenuation correction factor, f, is shown versus Eγ for each chosen sample, allowing us to calculate the detector efficiency for each problem sample, ε.
Minerals 12 00611 g002
Figure 3. Activity concentration ratios for the radionuclides present in each mining sample analyzed in this work, where the ratios selected to study the secular disequilibria between the radionuclides belonging to the 238U and 232Th series were: 234Th/238U, 234U/238U, 226Ra/238U, 230Th/234Th, 214Pb/226Ra, 210Po/210Pb, 228Ra/232Th, and 228Th/228Ra.
Minerals 12 00611 g003
Table 1. Minimum activity concentrations (in kBq·kg−1) of each radionuclide at which a sample can be considered a NORM, where two types of samples were taken into account: any material and the sludges from petroleum and gas industries. (sec): Radionuclide in secular equilibrium with all its daughters. (+): Radionuclide in secular equilibrium with its short-lived daughters.
RadionuclideAll MaterialsSludges from Petroleum and Gas Industries
U-238 (sec) incl. U-235 (sec)0.55
Natural U5100
Th-23010100
Ra-226+0.55
Pb-210+5100
Po-2105100
U-235 (sec)110
U-235+550
Pa-231550
Ac-227+110
Th-232 (sec)0.55
Th-2325100
Ra-228+110
Th-228+0.55
K-405100
Table 2. Chemical compositions (each chemical element, Zi, given in %) and apparent densities (ρ, in g·cm−3) of the mining samples analyzed in this work.
ρ, ZiScale-1Scale-2Scale-3FPIlmeniteWaste-1Waste-2Waste-3IP-1IP-2
ρ1.321.002.663.692.731.081.070.982.163.30
O48.0049.0042.8039.0033.0050.8053.7854.3044.4540.7
Na2.003.000.59 3.592.000.591.69
Mg6.009.000.62 3.625.000.621.50
Al10.0012.001.50 3.0010.005.502.20
Si14.209.0030.27 25.6810.0032.6832.40
P0.700.900.08 2.750.700.08
S10.0012.00 2.0010.00
K0.800.608.31 0.880.220.091.97
Ca7.304.501.1613.50 4.167.302.972.2015.30
Ti 0.45 30.000.45 0.450.50
Mn1.00 0.06 1.601.000.060.09
Fe 10.67 37.001.47 2.6713.00
Cu 2.00
Ba 1.00
W 47.50 44.00
Pb 0.50
Table 3. Activity concentrations obtained for gamma-ray and pure-alpha emitters contained in several scale samples (from Scale-1 to Scale-3), a final product (FP), and an ilmenite (Ilmenite), where Eγ and Eα are the emissions selected to determine the gamma-ray and pure-alpha emitters, respectively. Furthermore, in the case of the 226Ra (186 keV), two cases were taken into account: considering and without considering secular equilibrium between 238U and 226Ra (sec. eq. and non-sec. eq., respectively). Uncertainties are given at 1 sigma level. (*) Radionuclides determined using alpha-particle spectrometry.
RNEγ, Eα (keV)Scale-1Scale-2Scale-3FPIlmenite
a (Bq·kg−1)a (Bq·kg−1)a (Bq·kg−1)a (Bq·kg−1)a (Bq·kg−1)
238U *4150 and 42004.7(8)2.9(9)8.5(1.9)1140(30)27(3)
234Th63.29<18<15<181380(140)96(8)
234U *4722.4 and 4774.66.3(3)4.4(4)9.4(1.8)1130(30)38(3)
230Th *4620.5 and 4687.0<3<240(10)1170(50)88(4)
226Ra185.96 (non-sec. eq.)8658(254)2962(95)43,725(1015)932(110)113(8)
185.96 (sec. eq.)4906(336)1695(118)24,998(1015)1194(82)106(6)
226Ra(214Pb)295.228744(201)2965(69)50,973(2044)1256(29)112(5)
351.938607(197)2911(67)52,635(2109)1291(30)111(5)
226Ra(214Bi)609.318770(203)2911(68)56,612(2272)1304(30)111(5)
1120.298825(230)3021(84)58,996(2406)1340(35)136(9)
210Pb46.54352(53)22(12)<50399(67)139(12)
210Po *5330644(18)38(3)1852(27)1440(120)65(6)
232Th *3947.2 and 4012.30.4(1.4)<1.514(6)34(6)357(11)
228Ra(228Ac)338.423829(651)1997(340)30,719(1242)34(8)521(22)
911.163884(105)2043(56)34,619(1398)27(3)511(21)
228Th(212Pb)238.633082(69)520(13)15,827(635)26.8(1.6)506(20)
228Th(208Tl)583.193047(71)513(15)17,886(728)29(2)483(20)
40K1460.83251(60)183(30)2600(206)4(7)32(5)
Table 4. Activity concentrations obtained for gamma-ray and pure-alpha emitters contained in several wastes (from Waste-1 to Waste-3) and intermediate products (IP-1 and IP-2), where Eγ and Eα are the emissions selected in order to determine the gamma-ray and pure-alpha emitters, respectively. Furthermore, in the case of the 226Ra (186 keV), two cases were taken into account: considering and without considering secular equilibrium between 238U and 226Ra (sec. eq. and non-sec. eq., respectively). Uncertainties are given at 1 sigma level. (*) Radionuclides determined using alpha-particle spectrometry.
RNEγ, Eα (keV)Waste-1Waste-2Waste-3IP-1IP-2
a (Bq·kg−1)a (Bq·kg−1)a (Bq·kg−1)a (Bq·kg−1)a (Bq·kg−1)
238U *4150 and 42002.2(1.4)7.2(8)22,300(400)865(20)2510(60)
234Th63.29<15<1420,300(1500)1290(110)2210(190)
234U *4722.4 and 4774.64.0(1.4)6.4(8)22,350(410)846(20)2560(60)
230Th *4620.5 and 4687.09(3)<1.5179(9)895(22)2590(90)
226Ra185.96 (non-sec. eq.)4117(96)1514(55)4216(1169)2675(120)1544(179)
185.96 (sec. eq.)2356(96)863(61)10,226(689)2147(145)1989(136)
226Ra(214Pb)295.224065(163)1507(36)179(5)2488(57)2020(46)
351.934002(161)1509(35)211(5)2546(58)2097(48)
226Ra(214Bi)609.314116(166)1536(37)116(4)2569(59)2113(49)
1120.294172(173)1528(46)109(7)2665(67)2178(56)
210Pb46.54<15<20216(14)704(21)1411(110)
210Po *533032(1)3.7(8)52(4)682(21)1610(230)
232Th *3947.2 and 4012.33.4(1.9)<1.55(2)16(2)98(12)
228Ra(228Ac)338.423074(125)1159(198)24(5)55(11)86(16)
911.163017(123)1169(33)16(3)47(5)81(5)
228Th(212Pb)238.63464(19)34(2)7.9(1.9)45.1(1.8)84(3)
228Th(208Tl)583.19448(20)34(6)10(3)47(4)80(4)
40K1460.83275(24)69(22)28(8)615(21)44(11)
Table 5. Radioactive index (RI) values calculated for each sample analyzed in this study as well as for a typical soil (Soil), where a sample can be classified as NORM or non-NORM when RI > 1 or RI  1, respectively.
SampleRI
Soil0.250(15)
Scale-123(2)
Scale-27.8(5)
Scale-3149(9)
FP3.7(2)
Ilmenite1.88(12)
Waste-11.05(7)
Waste-22.20(15)
Waste-32.20(11)
IP-16.0(3)
IP-26.0(3)
Publisher’s Note: MDPI stays neutral with regard to jurisdictional claims in published maps and institutional affiliations.

