1. Introduction
The kaolin minerals (kaolinite, dickite, nacrite and halloysite) belong to the phyllosilicates and are widely used in paints, paper making, rubber, resin composites, and zeolite preparation [
1,
2,
3,
4,
5,
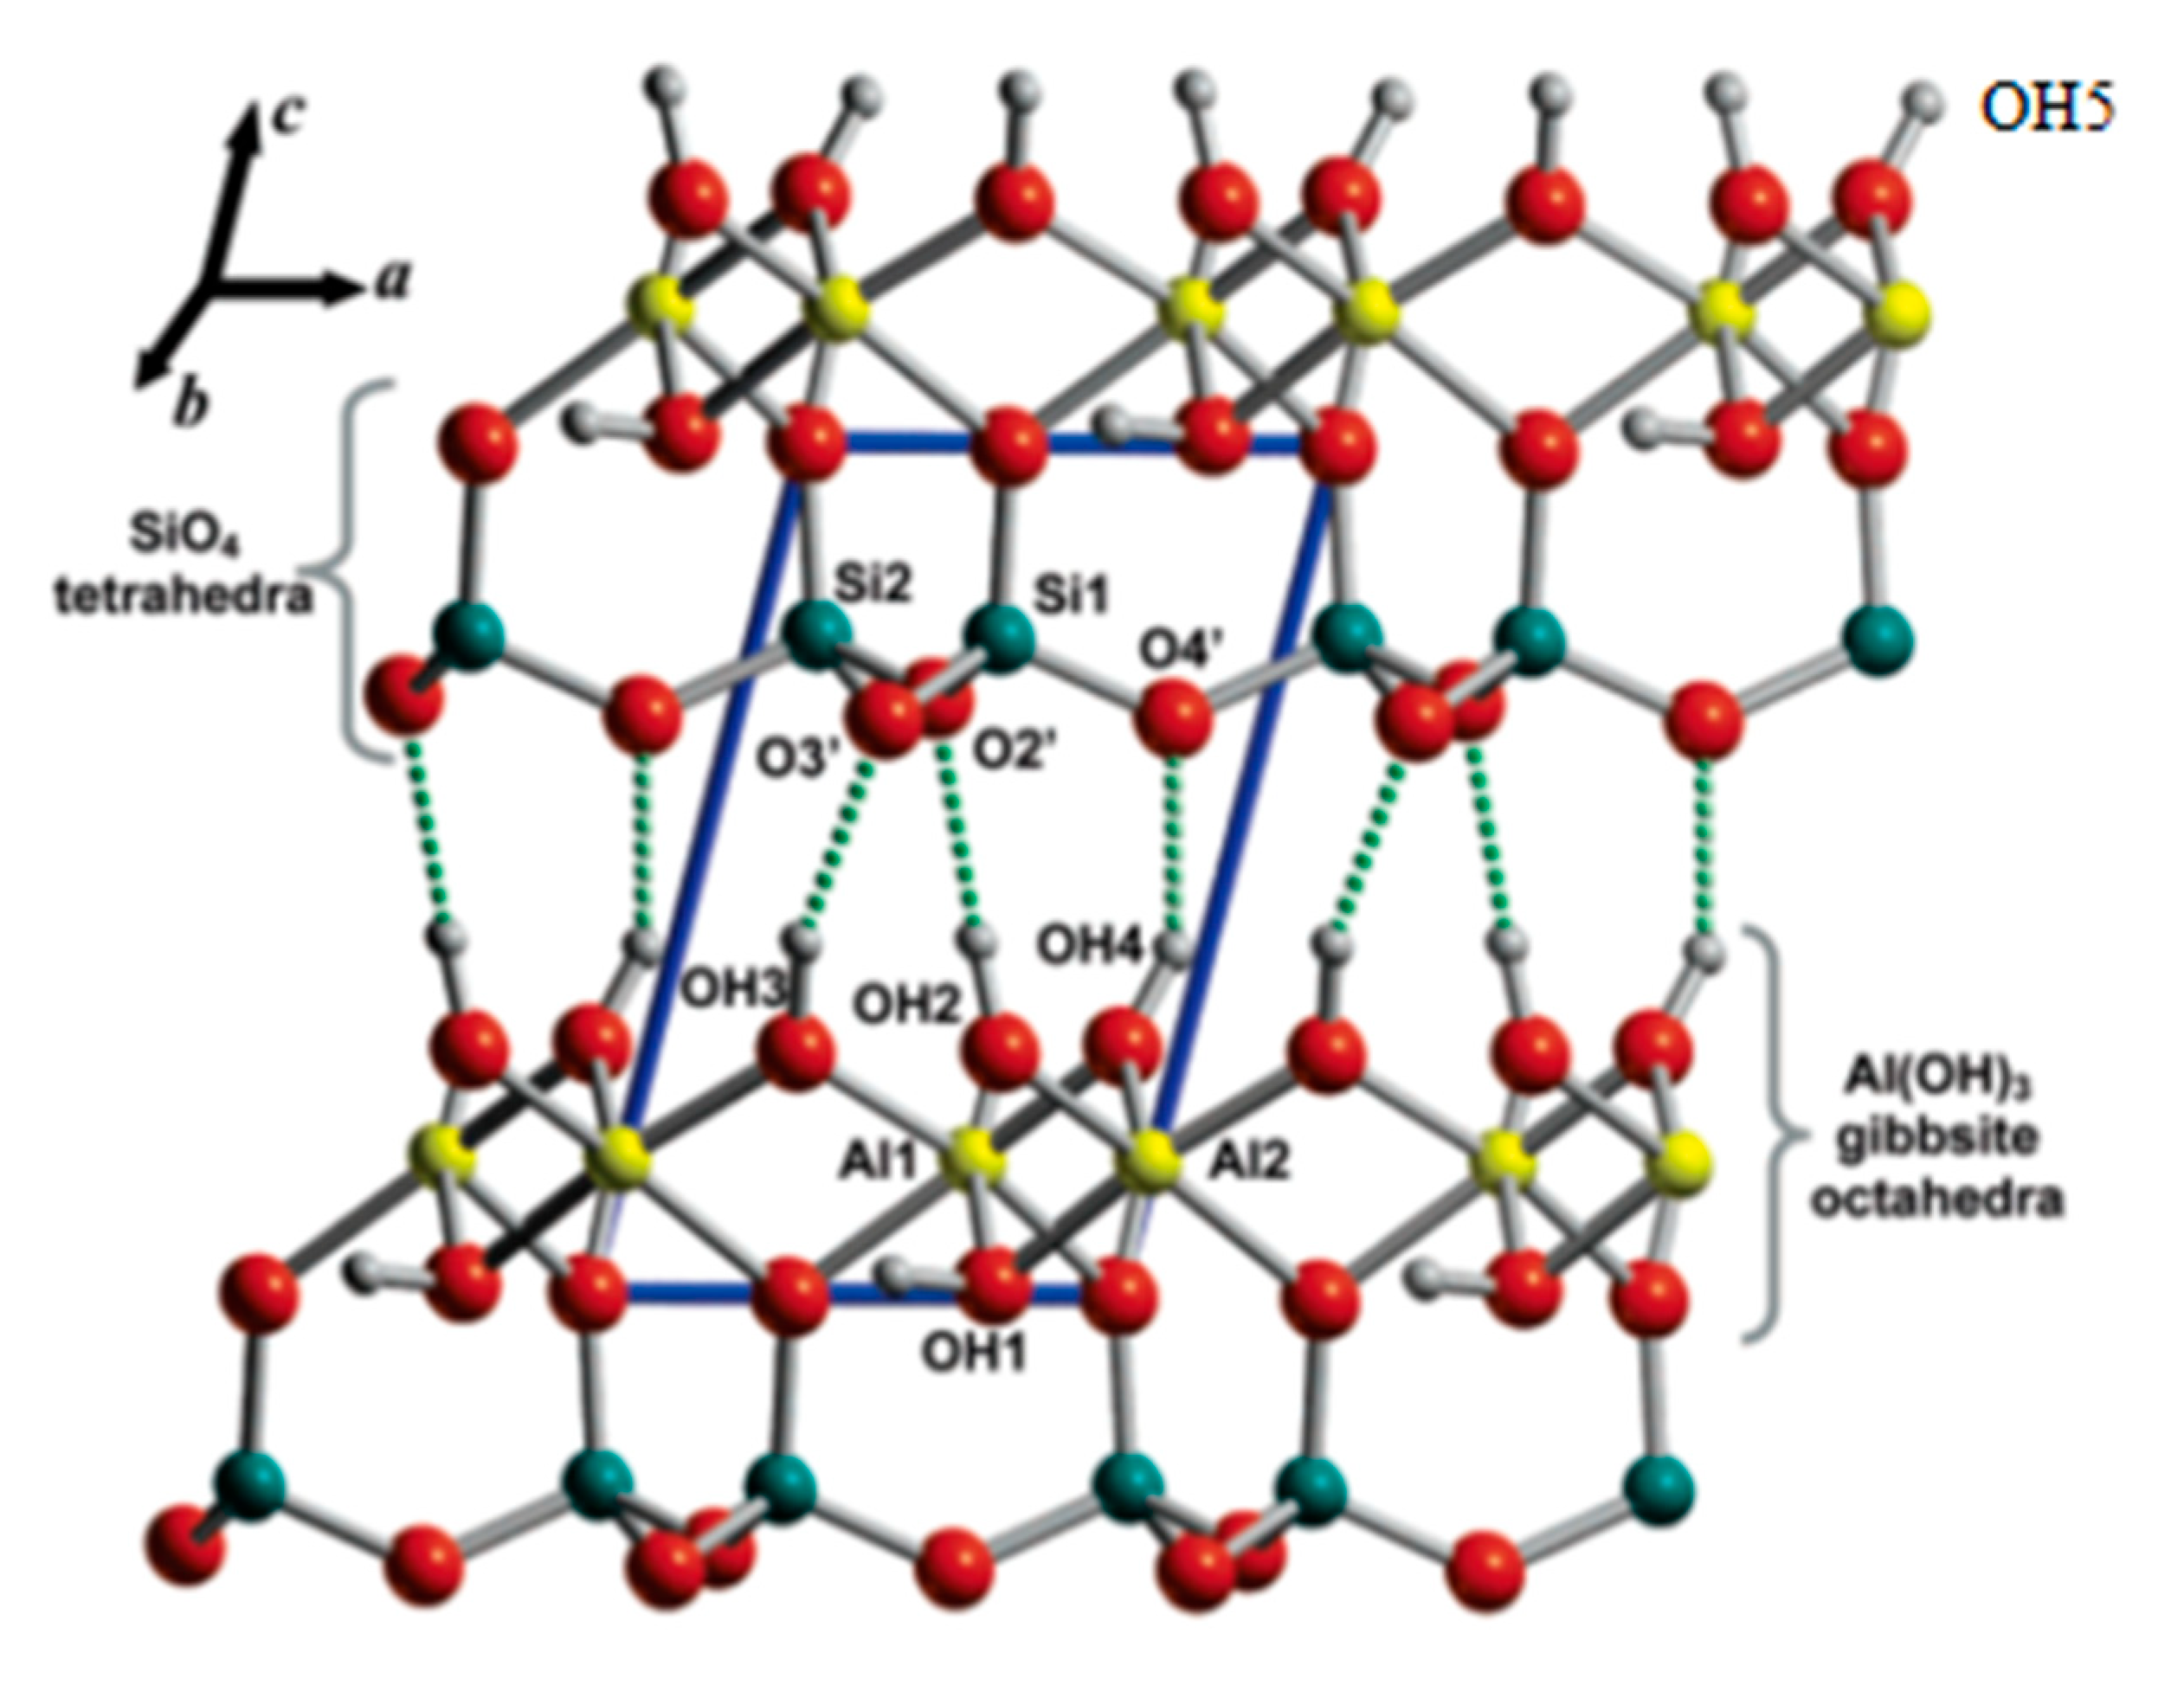
6] due to its excellent performances such as high whiteness, good bonding ability, great electrical insulating property, relatively low surface area, and high alumina and silica content. Natural kaolin usually contains small amounts of other minerals or soil. It needs to be separated by washing or flotation when applied. Kaolinite is a layered aluminosilicate with a 1:1 Si/Al ratio and 17 atoms in its triclinic unit cell (Al
2 Si
2O
5(OH)
4) (
C1 space group). The layers stack along the c axis, and every single layer is composed of a SiO
4 tetrahedral sheet connected to a gibbsite-like Al (OH)
3 one. There are two styles of OH groups: the inner surface OH group (free OH groups at the sides of the crystals, OH group situated at the surface of octahedral sheets, OH5, and OH groups between the octahehral and tetrahedral sheet, OH2, OH3, and OH4) and inner OH group (OH1) (
Figure 1) [
7]. Although, structurally speaking, OH5 is the same as OH4, except for the fact that there is no next layer. Within the context of surface modification, the difference is great.
These OH groups play an essential role in the surface modification reaction that gives kaolinite good interfacial compatibility with organic matrices. Some surface modifiers, such as coupling agents, can very quickly condensate with the external surface -OH groups. However, compared to the interlayer surface area, the external specific surface area of kaolinite is small, and the contribution of the -OH groups at the edges or surface defects to the grafting reaction is modest [
8]. To realize the interlayer grafting of kaolinite, it has to overcome the effect of the hydrogen-bond interactions between the adjacent layers.
In recent years, many efforts have been made to solve this problem. Earlier studies’ results indicate that small organic molecules, such as DMSO, acetates, urea, hydrazine, formamide, methanol, ethanolamine, adonitol, butanediols, and hexanol [
9,
10,
11,
12,
13,
14], can be inserted into the interlayer of kaolinite and bond onto the inner surface. Later studies show that some larger molecules such as aminopropyl triethoxysilane (APTES) may also bond onto the inner surface of kaolinite [
8,
15,
16]. Firstly, dimethyl sulfoxide (DMSO) was inserted in the interlayer space of the kaolinite, which enlarged the interlayer distance, after which the APTES displaced the DMSO between the layers and finished the grafting process. Using a similar alternative intercalation method, Faria et al. [
17] grafted 2-hydrocyethyl methacrylate and 2-(trimethoxysilyl) propyl methacrylate onto kaolinite. Detellier et al. [
18] achieved an intercalation of ethylene glycol in kaolinite and obtained a composite. The above reports show that intercalation/displacement/grafting is an effective way to carry out the silylation of kaolinite. However, it is an energy and time-consuming process that usually requires severe conditions, including high temperature, hydrous solvent for hydrating larger molecules, inert atmosphere, wasting-time, etc.
In Shanxi Province, China, the use of a large amount of coal-bearing kaolinite or coal gangue (3–5% wt.% carbon content) is restricted to the paint industry due to the requirement of whiteness. In order to meet the market demand, some enterprises produce calcined kaolin at 900~1000 °C. The calcination has two main functions: removing hydroxyl groups, and removing components such as carbon. The iron oxides that affect whiteness are removed by magnetic separation before calcination. Due to the dehydroxylation effect, the hexahedral Al structure is partially destroyed, and the calcined products no longer have the originally layered structure. It is conventionally called calcined kaolin; in fact, it is metakaolin and may contain other minor components such as mullite or spinel, depending on the calcination temperature. Its surface modification should be easier than that of the original kaolinite due to the change in the structure. Yang et al. [
19] suggested that the -OH group of the hydrated silane coupling agent (SCA) was combined with the Al atom of calcined kaolin according to the chemical shift of
27Al MAS NMR before and after the modification of calcined kaolin. Liu et al. [
20] indicated that this modification was a condensation reaction between the -OH group of hydrated SCA and the residual -OH group of Al in calcined kaolin. Yuan [
2] used toluene diisocyanate as a modifier. After ball milling, according to
29Si MAS NMR spectrum analysis, it was found that the modification reaction mainly occurred between the Si-O bond and the modifier molecule, rather than between the Al-O bond and the modifier molecule. Mechanochemical activation can lead to the breaking of the Si-O bond but cannot complete dehydroxylation, even after 20 h of milling [
21]. These studies indicate that the modification mechanism of calcined kaolin is different depending on the modification conditions. The traditional opinion would seem to suggest that only hydrated APTES can modify the powder because it contains OH groups, whereas unhydrated APTES has no OH groups. However, unhydrated APTES also has the same modification effect. The modification mechanism is not completely clear and needs to be studied further.
In this study, the unhydrated APTES was used as the modifier. A simple method was used to modify calcined kaolin. XRD, MAS-NMR, FT-IR, XPS, SEM and other analytical methods were used to investigate the effect of the modification on the properties of calcined kaolin and the mechanism of modification. The aim is to obtain a better understanding of the modification mechanism.
2. Materials and Methods
Kaolinite and calcined kaolin were obtained from Shanxi Jinkun Mineral Products Co. Ltd. (Shuozhou, China). Their chemical constituents are listed in
Table 1. Calcination condition: 1000 °C × 1 h. APTES was purchased from Shandong Qufu Yishun Chemical Co. Ltd. (Qufu, China). Anhydrous alcohol (analytically pure grade) was purchased from Taiyuan Chemical Agent Co. Ltd. (Taiyuan, China).
The modifier solution (APTES: alcohol = 1:20) was prepared in a flask, and magnetic stirring was carried out for 30 min to ensure that the APTES was evenly dispersed in ethanol. A total of 100 g calcined kaolin was placed inside a closed machine with a rotating blade. The rotating speed was kept at 1500 rpm while the temperature was increased to 80 °C. The modifier solution was atomized from the top nozzle for 10 s at interval. The sample was kept rotating for another 30 min after the spray process had finished. The modified powders were taken out from the side outlet. The calculated amounts of solution according to the mass percentage of APTES and calcined kaolin were: 0.5%, 1%, 1.5%, 2%, 3%, 4%, and 5%. The modified samples were labeled as calcined kaolin-0.5%, calcined kaolin-1%, calcined kaolin-1.5%, calcined kaolin-2%, calcined kaolin-3%, calcined kaolin-4%, and calcined kaolin-5%.
Chemical constituents of the samples were tested on a PW4400 X-ray fluorescence Spectrometer. XRD patterns were obtained on a Bruker D8 Advance diffractometer. The powder sample was put into a circular box, and was flattened with a glass sheet. Cu anode was used and the radiation wave length was 0.15418 nm. The scan angle range was 10–80° 2theta and step size was 0.02°. Scan speed and counting time were 0.1876°/s and 373 s, respectively. Infrared spectra were obtained on a Nicolet iS50FT-IR (Thermo Nicolet Corporation, Waltham, MA, USA) spectrometer. Samples were directly put on the ATR setup, and the measure process was completed. Resolution was 0.5 cm−1. For each sample, 16 scans were accumulated. The microstructure details of the samples were observed and recorded on a JSM-IT500HR (JEOL, Tokyo, Japan) scanning electronic microscope (SEM). Platinum was used as the conductive coating before observation. X-ray photoelectron spectroscopy (XPS) was performed on an X-ray photoelectron spectrometer (Axisultradld Kratos Analytical Company, Manchester, UK). The test conditions were as follows: sample analysis region: 700 µm × 300 µm, anode is Al, power/90 W, full scanning penetration/160 eV, step length/0.05 eV, the base vacuum/5 × 10−9 Pa. electron binding energy was calibrated using the main C1s peak (284.8 eV). The MAS-NMR spectra were obtained on a Bruker Avance III 600 MHz Wide Bore spectrometer (14.1 T). The chemical shift was referenced to TMS and AlCl3 for Si and Al, respectively. MAS spinning rate and relaxation time D1 were 12 kHz, 1 s for 27Al, and 10 kHz, the 20 s for 29Si, respectively.
The whiteness was measured on a Datacolor colorimeter. The error was less than 0.3%. Activity index is a method used to characterize the effect of modification. The specific test steps were as follows: 2 g samples were put into a 250 mL separatory funnel, 200 mL of deionized water was added, after which the samples were oscillated up and down 30 times and allowed to rest for 30 min. The upper part of the suspensions were removed, and the sediments were filtered out. Finally, the samples were dried and weighed. The formula to calculate the activity index is H = (WO − WS)/WO × 100%. Here, WO and WS refer to original sample and sedimentary samples, respectively. The samples were tested three times in parallel and the average value was obtained. The error was ≤0.2% in all cases. The particle size distribution of the samples was obtained on Malvern Laser particle size analyzer (MS3000, Malvern Insturments Co. LTD, Melvin, UK). Ultrasonication and stirring were carried out throughout the entire test process. The n-heptane and water vapor adsorption experiment of samples were as follows: 50 mL of n-heptane and water were put into two 250 mL beakers, respectively. The stainless steel mesh disk was suspended 2 cm above the liquid level. Each powder sample was pressed under the same pressure of 2 MPa and molded into a tablet. These tablets were placed on a mesh disk. The outlet was covered with plastic film and they were put into two oil baths at 80 °C for 24 h. After the three parallel experiment ended, the samples were weighed, the adsorption ratio was calculated, and the average values were obtained. The error was ≤0.02 in all cases. The contact angles of heptane and water on the sample tablet were measured on a contact angle test instrument (SDC-200S, Sindin Company, Kunshan, China). The drop of water and oil fell separately through capillaries onto the surface of the sample tablet. The camera recorded the shape of water droplets and oil droplets on the surface. The contact angles of the samples were tested by SDC-200S measure software (SDC-200S, Sindin Company, Kunshan, China).
3. Results
3.1. XRD Analysis of Kaolinite and Metakaolin
Figure 2 shows the XRD patterns of kaolinite and calcined kaolin. The calcined kaolin contained kaolinite and some quartz. The original structure of the kaolinite was destroyed and converted into metakaolin and mullite after high-temperature treatment, as indicated in the XRD pattern of the calcined kaolin showing mainly the presence of metakaolin and some mullite.
3.2. SEM Observation of the Samples before and after Modification
Figure 3 shows the SEM images of all samples. Before calcination, the kaolinite particles were dispersed and rarely aggregated. The layer structure can be clearly seen in the section of particles (white arrow in
Figure 3). After calcination, some flake-like particles (yellow arrow) can be observed in calcined kaolin and calcined kaolin-1%. A larger majority of the sample particles have a size less than 2 μm and exhibit irregular particles due to the effect of the mechanical force during the grinding process. They are loosely distributed and do not adhere to each other. The modification gives these particles an organic coating on the surface, which makes them adhere to each other to form aggregates with larger sizes. The larger the modifier content, the bigger the sizes of these aggregates. The largest size observed was 6 μm (red arrow). The few remaining layered structures are barely visible in the SEM images of the calcined kaolin with the modifier content beyond 2% because the smaller particles adhere to the surfaces of the larger particles under the effect of the modifier.
3.3. FT-IR Analysis
Figure 4 shows the FT-IR spectra of all samples. For kaolinite, bands near 3691 and 3618 cm
−1 were assigned to the vibrational modes of inner surface OH groups and inner OH group [
22,
23]. The two bands located at 1009 and 1031 cm
−1 are sharp and strongly overlap, almost merging into one band. They were assigned to the Si-O stretching mode (perpendicular mode) and in-plane Si-O stretching vibrations, respectively [
24]. The three bands located at 790, 754, and 690 cm
−1 were attributed to the deformation vibration of Si-O bonds and perpendicular vibration of Si-O bonds, respectively [
24]. However, some OH groups are still present inside the calcined kaolin, as shown by the sharp band at 911 cm
−1 in kaolinite assigned to the inner OH-Al
VI groups [
23], which did not completely disappear and just merged with the band at 806 cm
−1 into a broad band. The corresponding band at 3653 cm
−1 attributed to the stretching mode of inner surface OH groups is very weak. The calcination destroyed the crystal structure of kaolinite, resulting in different bonds in calcined kaolin in comparison to the bonds in kaolinite. Two new bands at 726 and 806 cm
−1 appeared and were assigned to the vibration mode of Al
VI-O and the formation of Al
IV-O in calcined kaolin, respectively [
23,
25]. Another wide band at 1074 cm
−1 in calcined kaolin appeared and was attributed to the symmetry vibration of the Si-O sheet [
23].
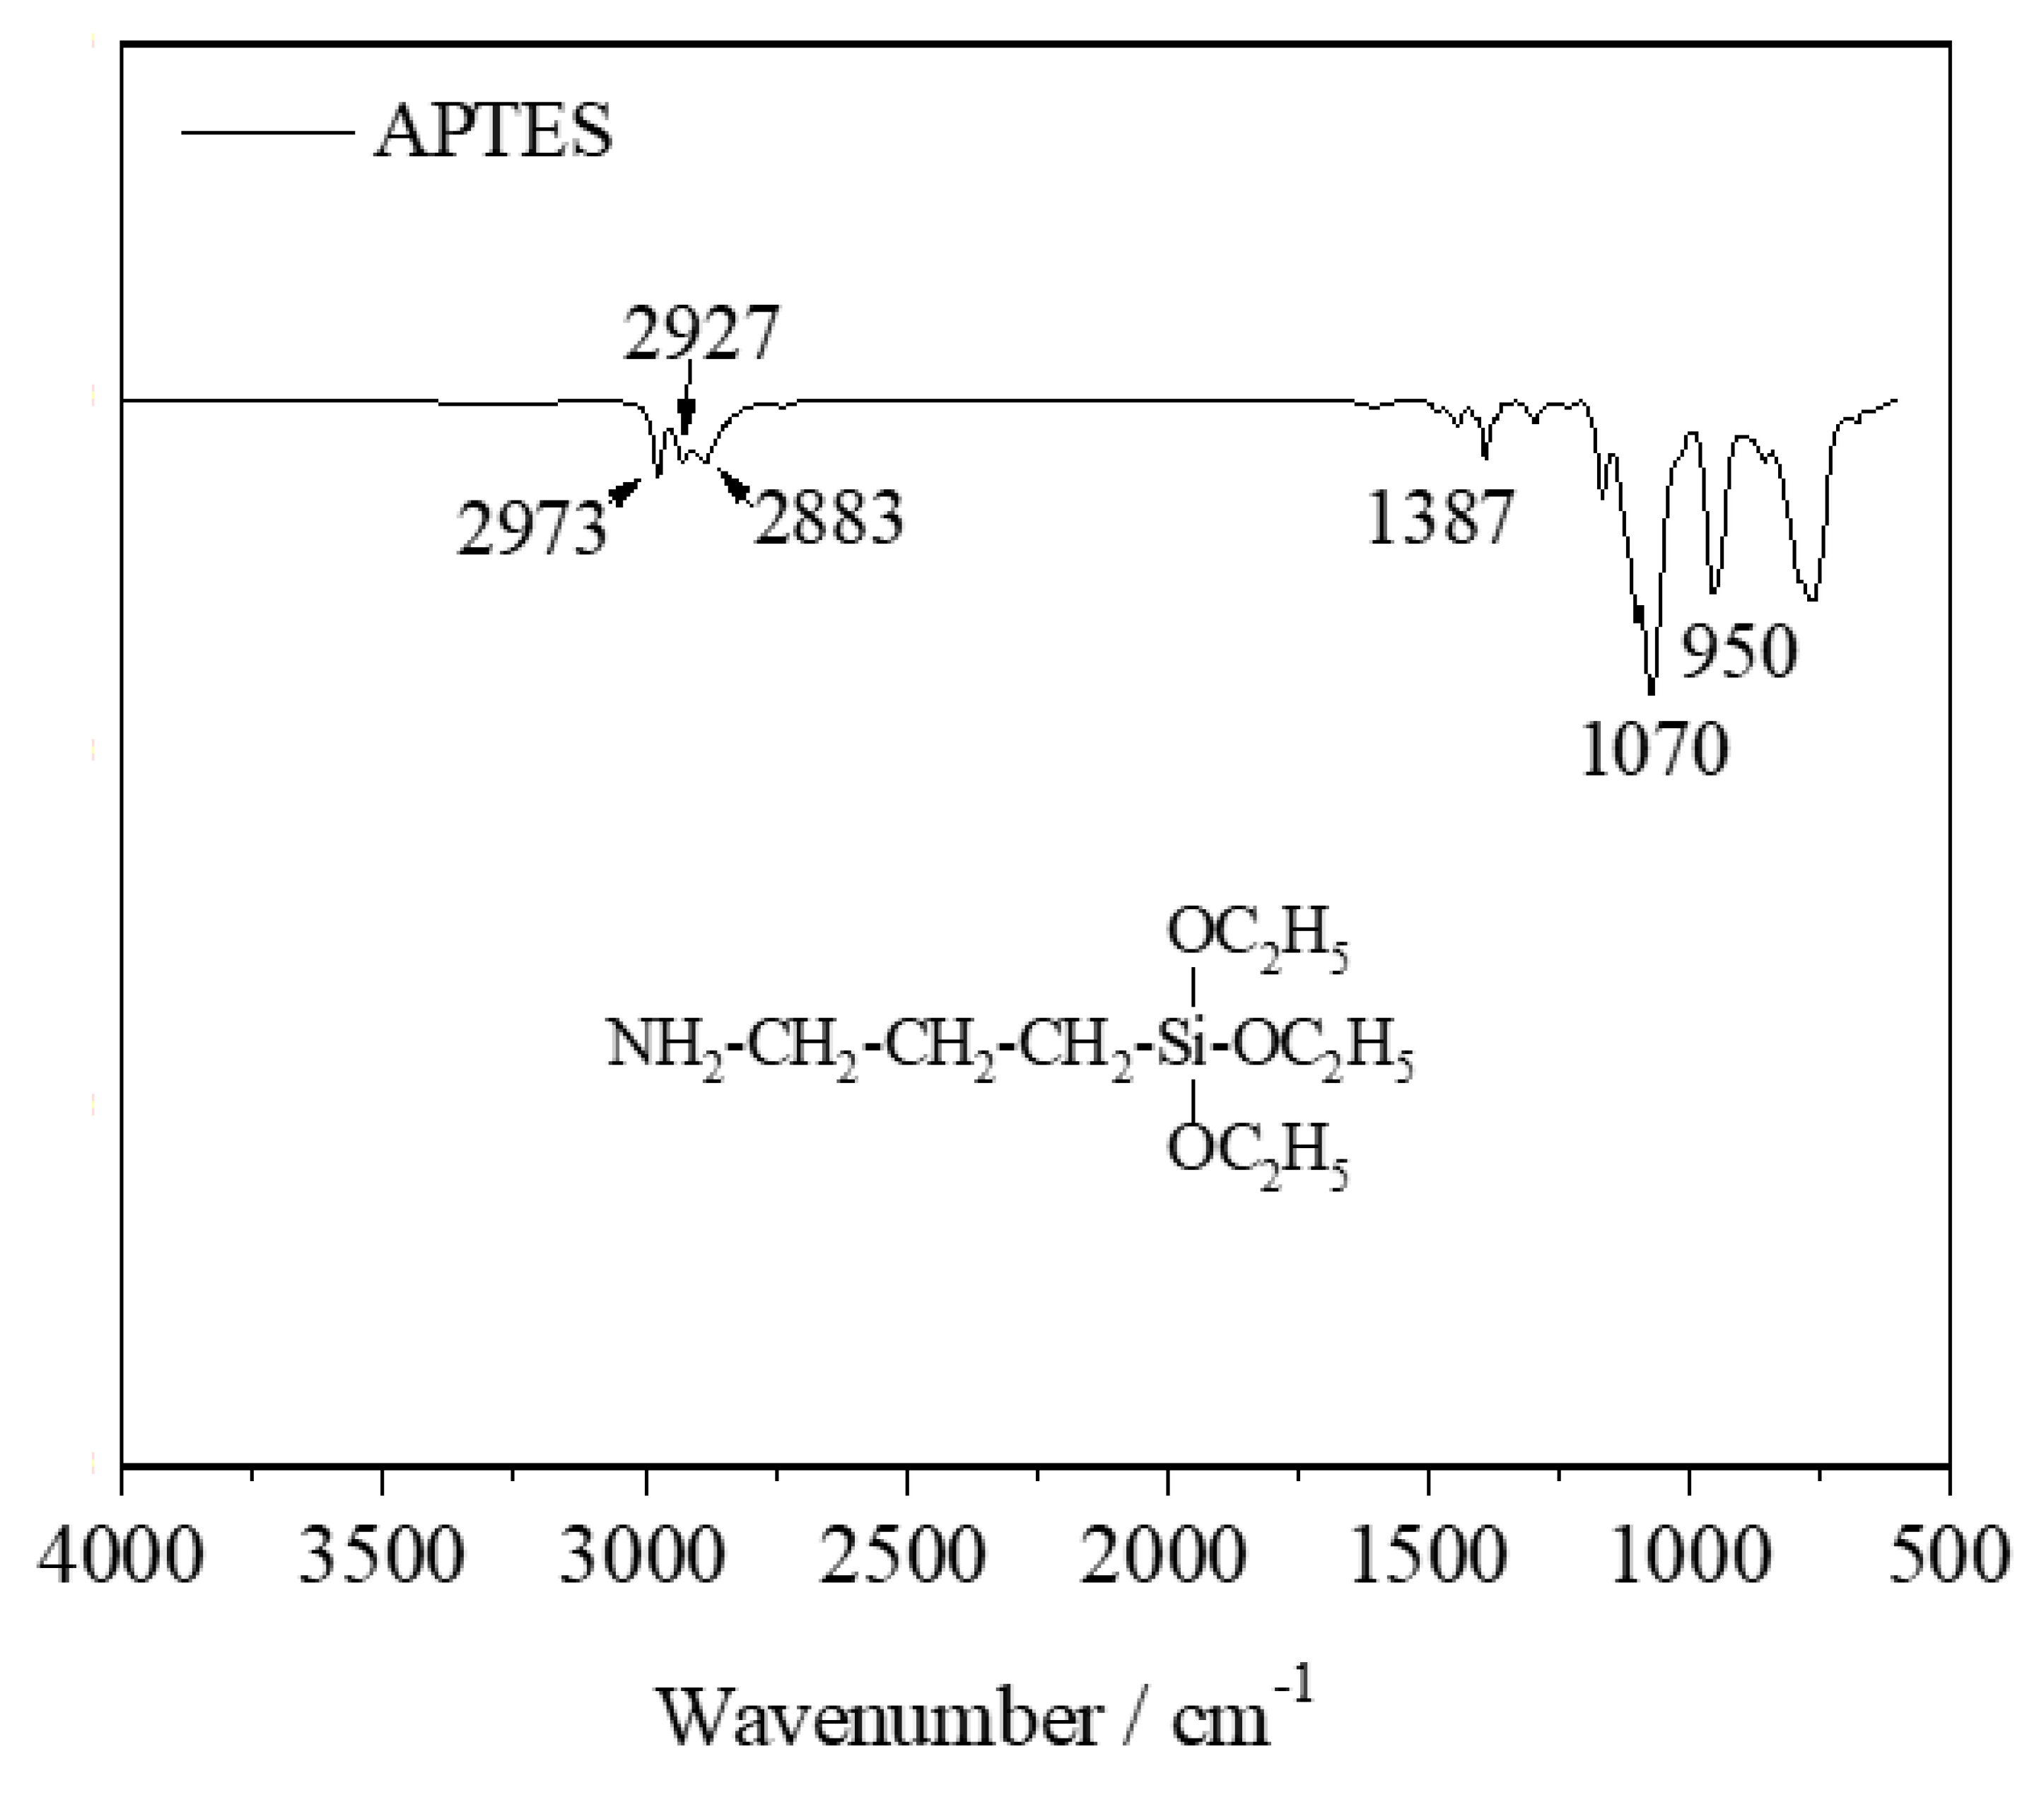
In the FT-IR spectrum of APTES, the three small bands at 2973, 2927, and 2883 cm
−1 were assigned to the asymmetric stretching vibration of CH
3, C-H asymmetric, and symmetric stretching vibrations of CH
2, respectively [
26,
27,
28]. The weak band at 1387 cm
−1 and strong peak at 1070 cm
−1 were attributed to the characteristic vibrational modes of Si-O-C
2H
5 [
26]. Another sharp band at 950 cm
−1 was assigned to the deformation vibration of the N-H bond. The three bands do not appear in the modified samples due to the overlap with the broad bands of the calcined kaolin.
The FT-IR spectra of the calcined kaolin show two new bands at 2929 and 2855 cm−1 that became visible in the spectrum of calcined kaolin-3%, indicating the APTES molecules interact with the surface of the calcined kaolin. The changes in the FT-IR spectra of the samples before and after modification further prove the presence of APTES molecules on the surface of the calcined kaolin.
3.4. MAS-NMR Analysis
In calcined kaolin, Si species have three types of units Qn (n = 2, 3, 4) depending on the number of bridge oxygen (BO) atoms. Q2 represents two BOs in the SiO4 unit, whereas the other two are no bridge oxygens (NBOs), and Q4 represents all BOs.
To better understand whether the modification reaction occurred at the surface of calcined kaolin, MAS-NMR spectroscopy was performed on the samples. The obtained
29Si and
27Al spectra of the samples were fitted using the PeakFitv4.12 software.
Figure 5 shows the
27Al and
29Si MAS-NMR spectra of calcined kaolin and calcined kaolin-5%. In the
27Al MAS-NMR spectrum of calcined kaolin, the peaks at 2.04, 47.02, and 62.74 ppm were assigned to Al
VI, Al
V, and Al
IV, respectively [
23]. In its
29Si MAS-NMR spectra, the three peaks at −109.41, −100.47, and −88.48 ppm are attributed to Si in Q
4 [
29], Q
3 in metakaolin, and Q
2 in mullite [
25], respectively.
Figure 5 shows that the chemical shifts of the
27Al MAS-NMR spectrum change after modification with APTES. In the
27Al MAS-NMR spectra, the peak at 2.04 ppm shifted to 2.65 ppm, whereas the peaks at 47.02 and 62.74 ppm shifted to 44.89 and 60.84 ppm, respectively. These distinct shifts show that the chemical environment around Al
VI, Al
V, and Al
IV on the surface of calcined kaolin was significantly altered by the unhydrated APTES. In the
29Si MAS-NMR spectra, there were similar changes in the chemical shifts; the three peaks at −109.41, −100.47, and −88.48 ppm in calcined kaolin shifted to −110.63, −103.38 and −89.71 ppm in calcined kaolin-5%, respectively. The shift of −1.22, −2.91, and −1.23 ppm explain that the chemical environment around
29Si in Q
4, Q
3, and Q
2 units were also significantly altered by the unhydrated APTES. These changes indicate that the modification reaction took place between the unhydrated APTES molecules and Al
VI, Al
V, Al
IV, Q
4, Q
3 as well as Q
2. These results disagree with the past opinion suggesting that only hydrated APTES bond to Al atoms via oxygen atom [
20]. It also conflicts with the current results that indicated that the hydrated APTES molecules bond to Si atoms via oxygen atoms [
2].
Another two peaks at −17.60 ppm and −16.68 ppm in the
27Al MAS-NMR spectra of calcined kaolin and calcined kaolin-5%, respectively, can possibly be assigned to Al
V [
23].
3.5. XPS Analysis
To further explore the modification reaction, calcined kaolin and calcined kaolin-5% were investigated by XPS. Though XPS testing only offers some information on functional groups several nanometers deep into the sample surfaces, it may still offer valuable information that can explain the surface modification reaction.
Figure 6 shows the broad scan XPS spectra of the calcined kaolin and calcined kaolin-5%. A small peak located at the position near 398.4 eV is attributed to the N1s inside APTES. Other strong peaks show that Si, Al, O are the main elements in the samples; these results are consistent with the chemical constituent data listed in
Table 1. A small amount of carbon is always present as surface contamination on all samples.
Figure 7 shows the fitting peaks of XPS spectra of C1s, O1s, Si2p, and Al2p for the calcined kaolin and calcined kaolin-5% by PeakFit software. The fitting results are shown in
Figure 7. In the Cls spectra of calcined kaolin, according to the XPS standard electronic binding energy table, three peaks at 284.80, 285.70, and 288.94 eV are assigned to C-H [
30], C-OR bonds, and COOR groups, respectively. After surface modification, they moved to 284.80, 285.41, and 288.93 eV, respectively. The percentage of C-H bonds decreased to 49.03% from 62.70%. The C-OR groups increased from 32.65% to 46.68%, whereas the COOR groups only slightly decreased from 4.65% to 4.29%, indicating that the APTES existed on the surface of calcined kaolin, and the OC
2H
5 groups were towards the outside. Therefore, their relative percentage changes as described above.
The O1s spectra of calcined kaolin include two peaks: one peak at 531.25 eV (NBO) was assigned to Al-OH groups, another peak at 532.44 eV was attributed to BO that connects two Si atoms, or a Si and Al atom [
31]. After modification, the area of the peak at 531.03 eV (NBO) increased to 26.48% from 20.61%, which is thought to be due to the formation of Al-O-C groups. Another two peaks at 532.14 and 532.86 eV were attributed to BOs [
32]. In the Si 2p spectra of the samples, three peaks at 102.72, 103.19, and 103.79 eV, were attributed to Q
2, Q
3, and Q
4 [
31], respectively. After modification, the peak area of the Q
2 peak at 102.28 eV increased to 27.91% from 23.07%. The area percentage of the Q
3 peak at 103.02 eV increased to 57.60% from 48.09%. In contrast, the Q
4 peak at 103.86 eV was reduced to 14.49% from 28.84% in calcined kaolin. A reason is that the absorbed ethanol molecules on the NBO atom reacted with the NH
2- in APTES molecules and established a new hydrogen bonding between the NBO of calcined kaolin-5% and NH
2-groups. The changes indicate that the modification reaction mainly occurred on the Q
4 structure and less on Q
2 and Q
3, altering the electron cloud distribution around the Si nucleus. The modification reaction altered the chemical environment around Si. In fact, the calcined kaolin contains more Q
4 structure than Q
2 and Q
3. This is consistent with the fact that the peak area of Q
4 is larger than those of Q
2 and Q
3 in the
29Si MAS-NMR spectra.
The Al 2p spectra of the calcined kaolin include three peaks at 73.22, 73.93, and 74.61 eV, which were assigned to Al
IV, Al
V, and Al
VI [
33,
34,
35,
36]; the modification reaction made these peak positions move toward low binding energy and at 72.97, 73.63, and 74.47eV, respectively. The area percentage of the peak at 73.63 eV (assigned to Al
V) increased to 59.86% from 44.51% in calcined kaolin. The Al
VI peak reduced from 29.80% to 15.30%. The Al
IV peak area only slightly decreased (25.69% to 24.84%). These changes indicate that the modification reaction occurred more frequently on Al
VI than on Al
IV and Al
V. The priority order of reaction is Al
VI> Al
IV > Al
V. As shown in the FT-IR spectra, the calcined kaolin still contained a few residual Al
VI-OH groups, as in kaolinite. These OH groups reacted with the NH
2 groups in APTES molecules. However Al
V and Al
VI were transformed from Al
VI in the high-temperature dehydroxylation. They only absorbed H
2O via NBO to balance the charge when on the surface of particles. When the NH
2 groups in the APTES molecules approached these NBOs, they reacted with the water molecules and formed hydrogen bonds. This is the reason why the chemical shift also occured in Al
V and Al
IV in the MAS-NMR, just like Al
VI.
3.6. Modification Mechanism of Unhydrated APTES on Metakaolin
Based on the above analysis, the modification reaction mechanism can be proposed. Kaolinite is a clay mineral, and every layer is composed of a SiO
4 tetrahedral sheet and an AlO
6 octahedral sheet. The layers interact with each other through hydrogen bonds. Every SiO
4 tetrahedra connects with two SiO
4 tetrahedra and one AlO
6 octahedra via three BOs and form a Q
3 structure. The -OH groups form part of the Al octahedra. After calcination, this structure was destroyed and converted into metakaolin and mullite, but there remained some Q
3 sites in the calcined kaolin. Other Q
3 sites transformed into Q
4 and Q
2 sites. Some Al
VI was converted to Al
IV, and others transformed into Al
V, a transient state between Al
VI and Al
IV. The calcination process removed most OH groups; still, some OH groups remained linked to Al
VI. The other structural units such as Q
2, Q
3, Q
4, Al
IV, and Al
V have no OH groups. However, they can absorb some ethanol molecules due to charge imbalance effects if they exist on the surface of calcined kaolin. These OH groups and adsorbed ethanol on the surface of the samples offer reactive sites to the APTES molecules. Therefore, the modification reaction can successfully finish.
The above five reactions explain the modification process. The AlVI–OH groups displaced the NH2- of the APTES molecules and established the Al-O-C bonds (Equation (1)). The NBOs in Q2, Q3, Q4 on the surface absorbed ethanol molecules. When the NH2- of the APTES molecules approached them, these NBOs established hydrogen bonds with the NH2- groups, while ethanol was displaced (Equation (3)). The same reaction also occurred on the NBOs in AlV and AlIV on the surface of the samples. The hydrogen bonds were established between these NBOs and NH2- groups. Thus, APTES molecules covered the surface of the metakaolin particles. Another terminal of APTES molecules, -OC2H5 is facing outside. This is consistent with the result from the XPS high-resolution spectra of the C1s.
3.7. Effect of Surface Modification on the Properties of Metakaolin
Whiteness is an important index for the application of metakaolin in building paint.
Figure 8 indicates that the modification with APTES did not reduce the whiteness of metakaolin, which means that the modification does not have a negative effect on its application in white coatings. The subject of surface modification can improve the surface characteristic of calcined kaolin and strengthen the interface bond with the organic matrix when it is applied as a filler in rubber or resin [
37]. Original metakaolin is generally hydrophilic, which impedes rapid wetting and dispersion in an organic phase [
20]. Hence, it can be entirely dispersed into the water. The activity index of metakaolin in
Figure 9 also proves this.
To further check the modification effect, the activity index was introduced, which reflects the impact of the surface modification on the surface properties of calcined kaolin. The higher the activation index, the better the compatibility of calcined kaolin with an organic matrix.
Figure 9 shows that the activity index first increased dramatically, then drastically dropped with the increase in modifier content. It reaches a maximum of 76.7% when the modifier content is 2%, indicating that the modifier amount of 2% is a suitable modification ratio. Obviously, the surface modification improves the suspension and dispersion ability of calcined kaolin powder in water.
Figure 10 shows the contact angle of water and n-heptane as a function of the modifier content on calcined kaolin surface changed.
The contact angles of water on the sample tablet increased as the modifier content increased from 0% to 4%. The contact angle of n-heptane on the sample tablet showed a fluctuating decline when the modifier content increased. In comparison, according to the trend analysis of contact angle change, the modification slightly increases the lipophilicity and decreases the hydrophility when the modifier content is less than 4%.
Figure 11 shows that the n-heptane and water vapor adsorption ratio also first increased, then decreased as the modifier content increased, indicating that the surface modification reduced the hydrophilicity of the sample. These results are consistent with the data in
Figure 10. However, it does not seem to match the activity index change in
Figure 9. Considering the agglomeration between the modified sample particles, the change of activity index is natural. The micropores between the particles on the surface of the tablet can adsorb n-heptane and water molecules when the modifier content is low. With the increase in modifier content, these micropores were filled with modifier and became smaller. They can only absorb small molecules of water, and the adsorption capacity of large molecules of n-heptane decreases, so their adsorption ratio decreases. When the modifier content is less than 2%, the modification reaction takes place between the APTES molecule and active sites or OH groups on the surface of calcined kaolin. The sample particles are small at this time (
Figure 3 and
Figure 12), so the activity index increases with the content of the modifier. However, when these reactive sites or OH groups on the surface of calcined kaolin are consumed and the modifier content is increased, the particles will adhere to each other and aggregate into large particles due to the adhesive attraction of APTES molecules (
Figure 3). As the size of the aggregated particle increased, the hydrophobic groups on the surface of the particle decreased, and the activity index decreased. As
Figure 12 shows, the particle size at the main peak center of calcined kaolin increased from 2.5 µm (APTES content < 1%) to 3.5 µm (APTES content < 4%) and exhibited a tail toward large particle size with the increase in modifier dosage, which supports this judgment. It is possible, however, that the particle sizes of the samples were reduced to a certain extent due to the force of the strong mechanical stirring during the modification process, though this cannot be deduced from the particle size distribution. On the other hand, some active sites on the surface of particles were produced due to particle breakage. The particle size of the modified sample was less than that of the original sample when the modifier content was less than 2% (
Figure 12). This can also explain why the active index increases in the initial stage of the curve of
Figure 9.


