3.1. Phosphogypsum Characterization
As shown in
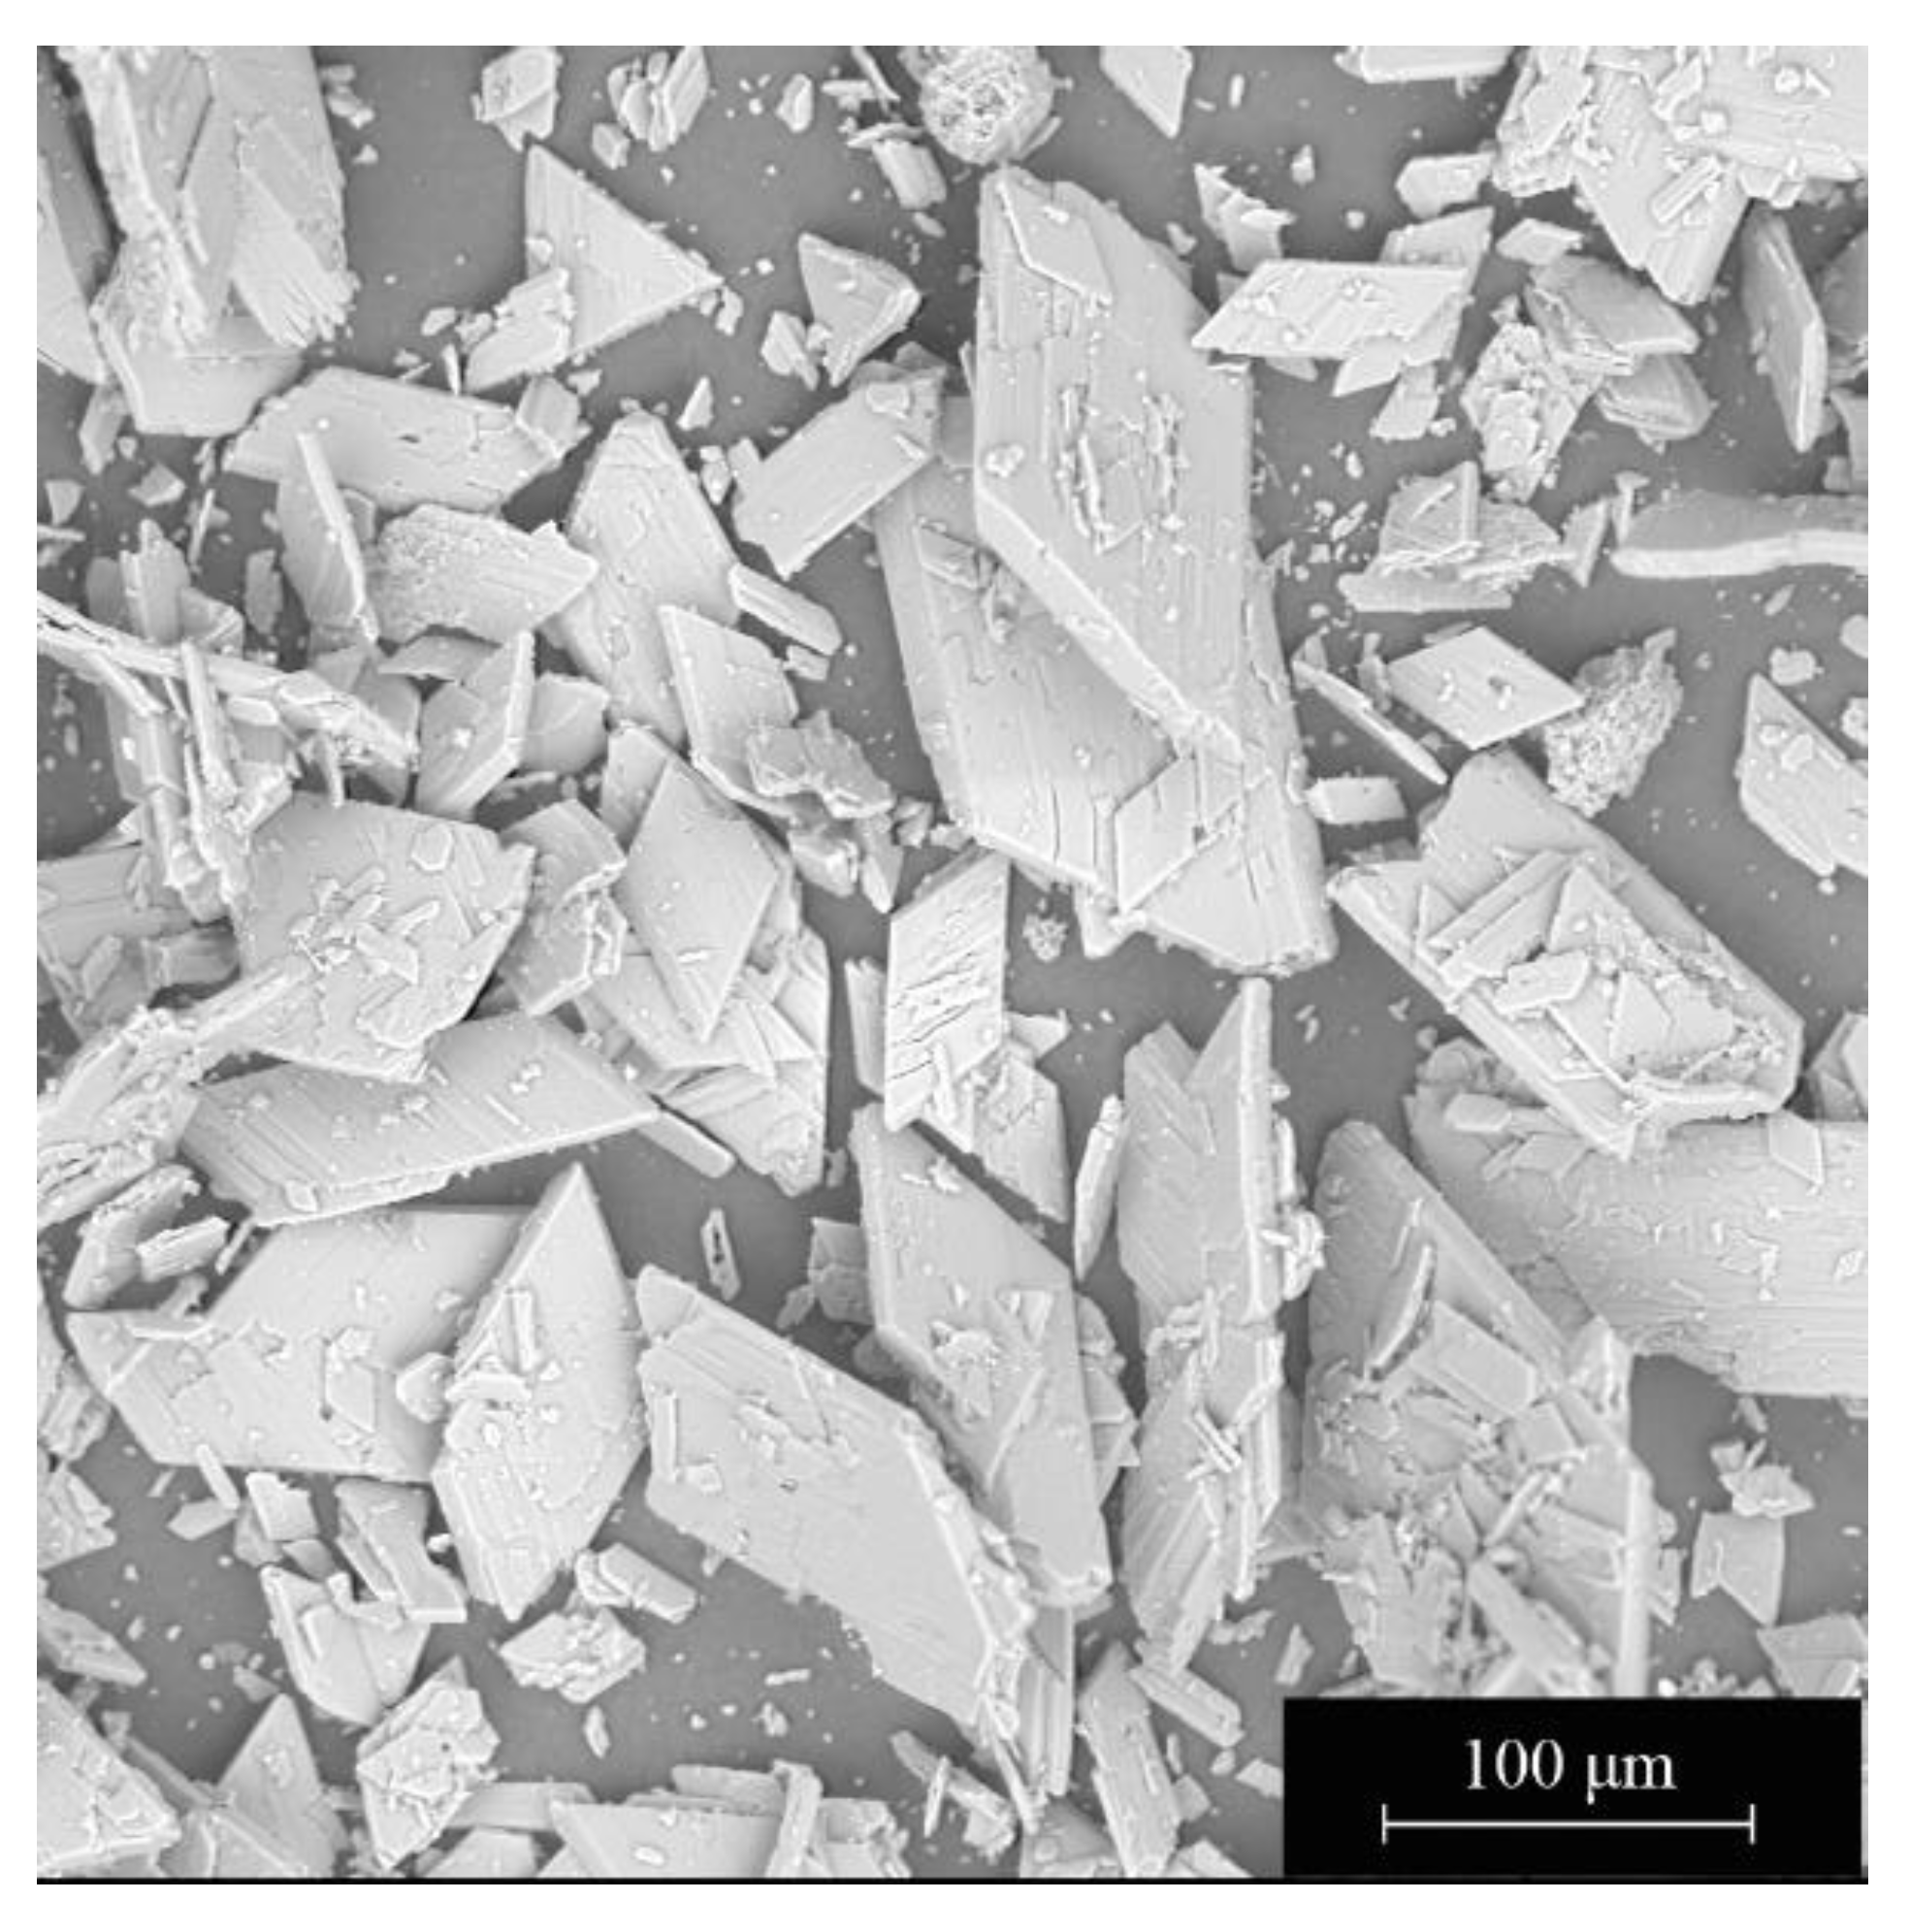
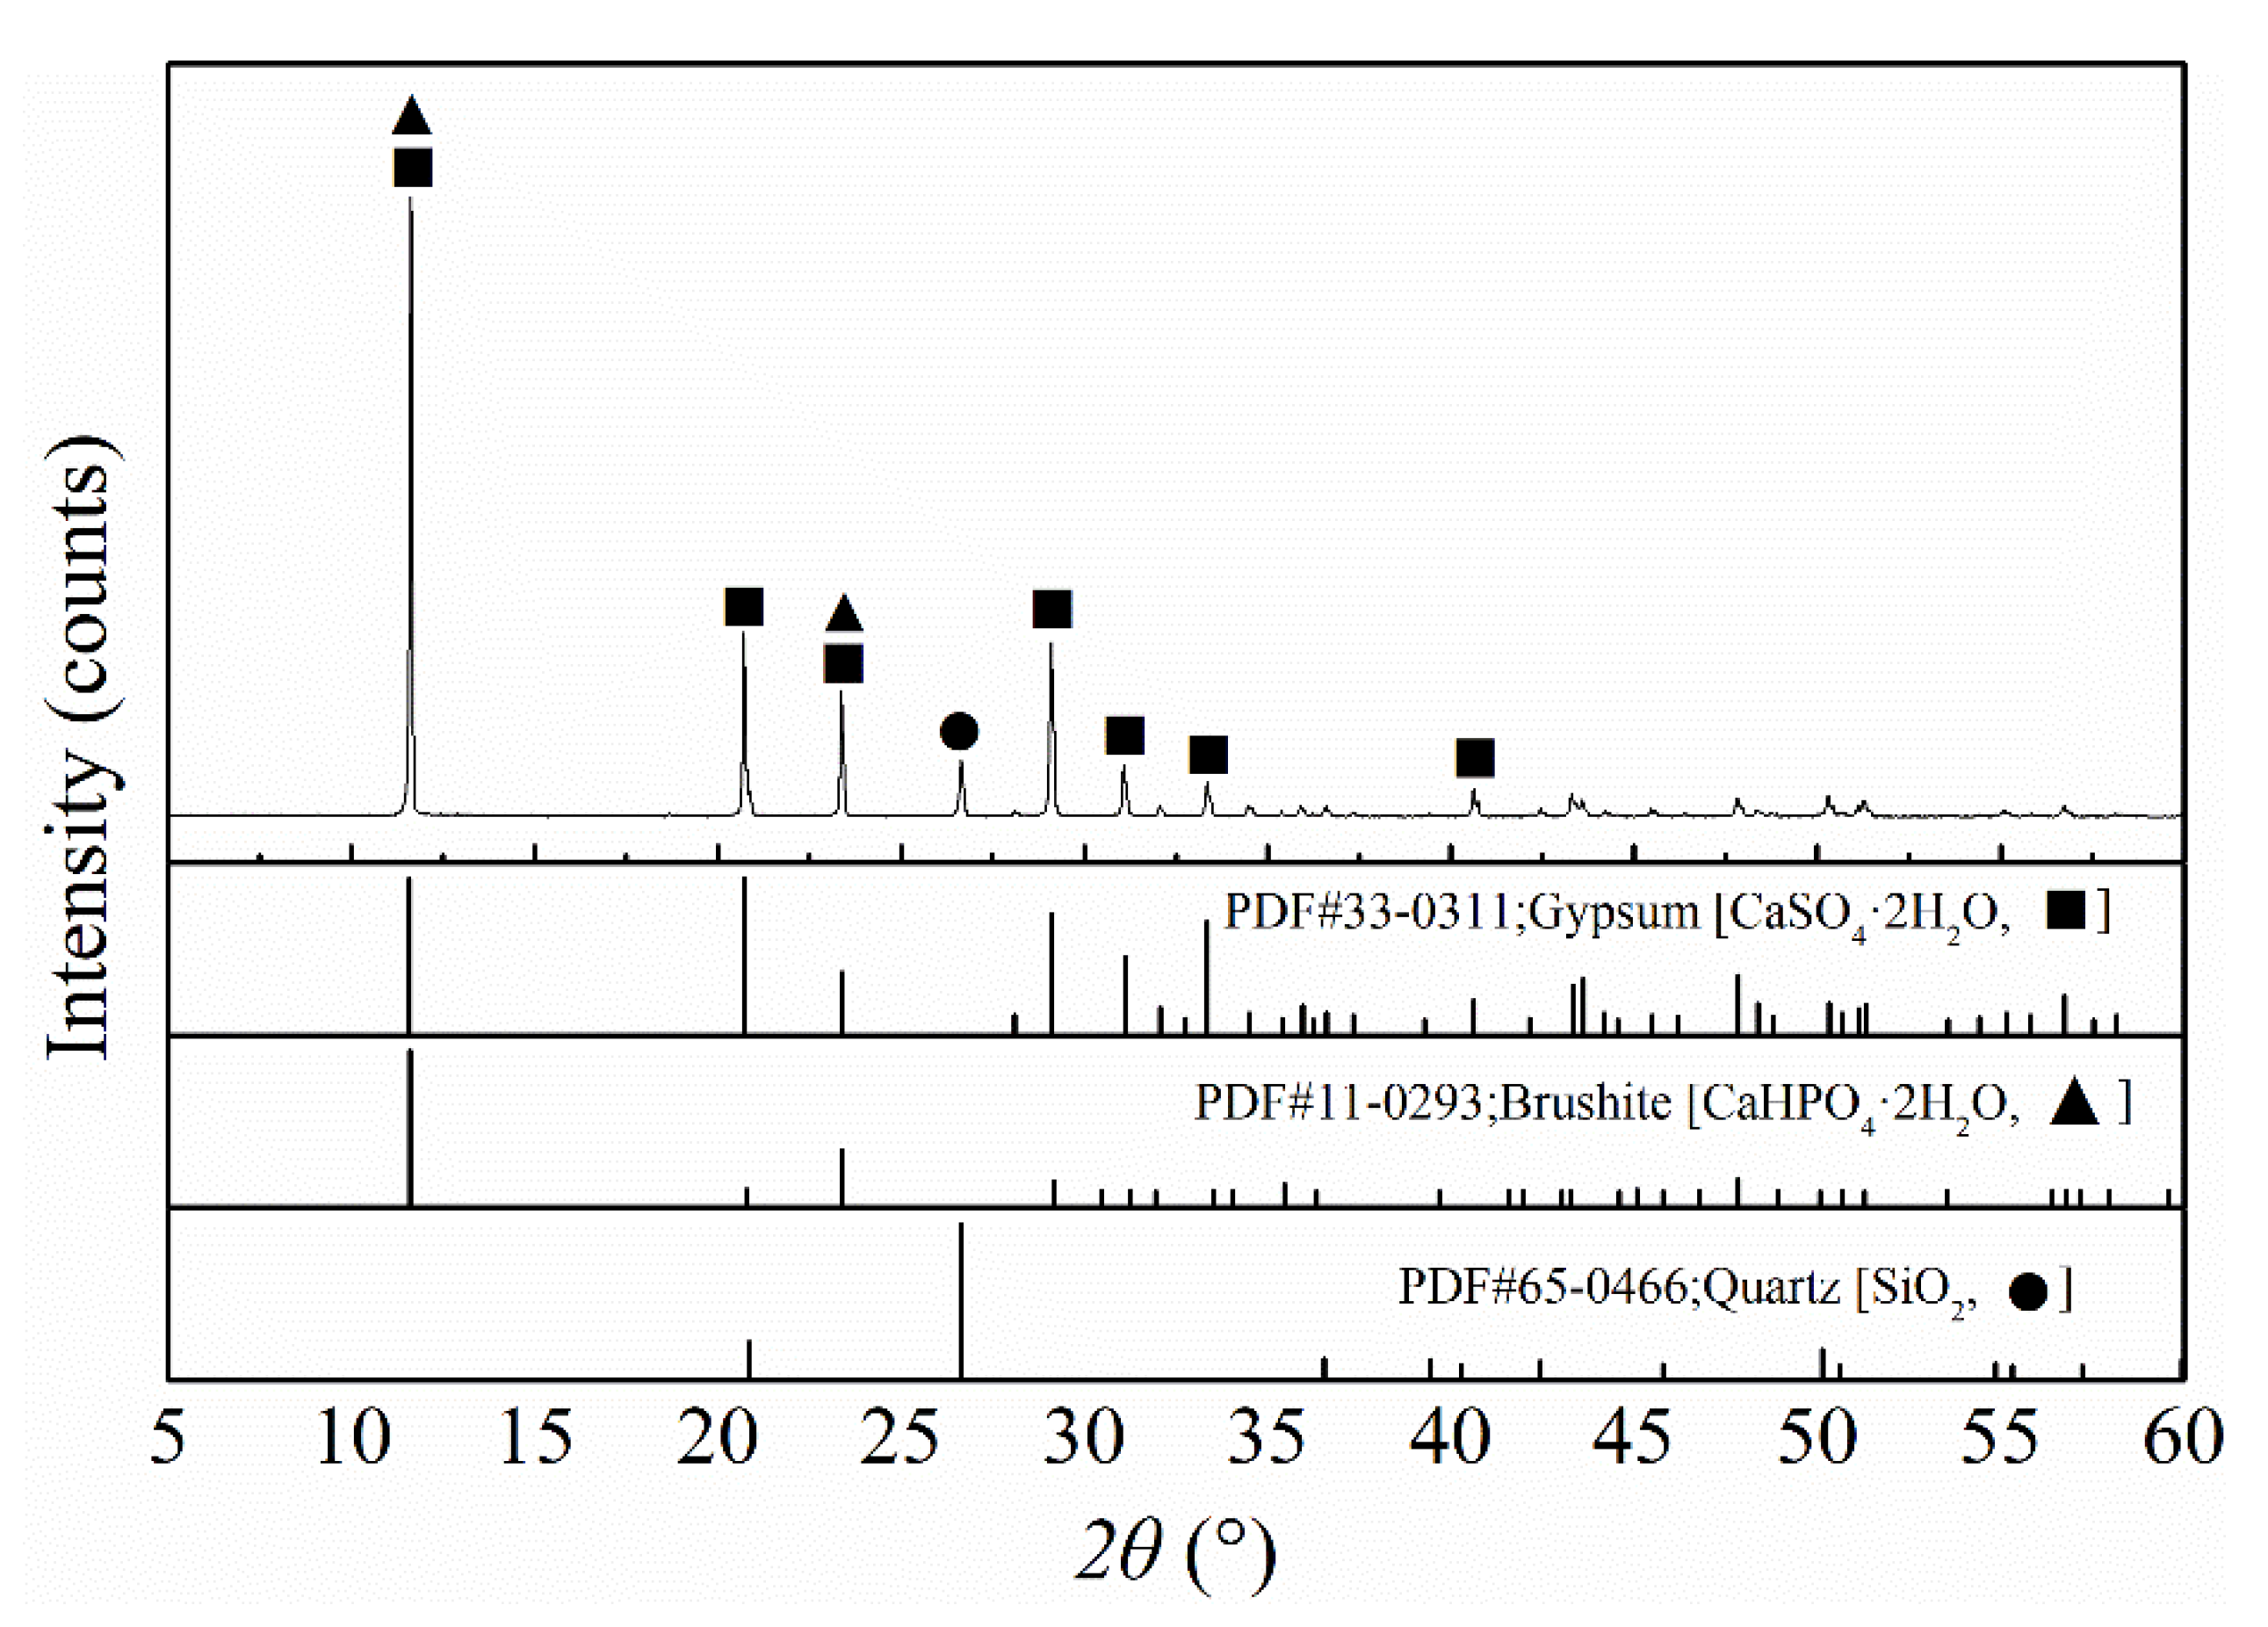
Figure 3, the PG mainly presented as long rhombic flakes with occasional fragments. The XRD results (
Figure 4) show that the main component of the PG was gypsum (CaSO
4·2H
2O), as well as a small amount of brushite (CaHPO
4·2H
2O) and quartz (SiO
2).
XRF results (
Table 1) illustrated that in addition to the main elements of S, O and Ca, the PG also contained impurities such as Si, P, Al, and F. If SO
3, CaO, and crystal water all came from dihydrate gypsum (CaSO
4·2H
2O), the mass fractions of dihydrate gypsum in PG calculated from these three components were 90.95%, 92.38%, and 91.59%, respectively. XRD revealed that there was still a small amount of brushite (CaHPO
4·2H
2O) which also included CaO and crystal water in the PG. Therefore, the proportion of dihydrate gypsum calculated by SO
3 was relatively accurate, which implied that the PG contained more than 90% of dihydrate gypsum. In addition, neither XRD nor XRF detected the presence of REEs, which may be due to their low concentration.
To further determine the REE content, the PG was digested according to the HJ781-2016 standard, and analyzed by ICP-OES. The elemental analyses (
Table 2) show that the total content of REEs was 208 ppm, of which yttrium, lanthanum, cerium, and neodymium are the four highest content elements with the concentration of 74, 46, 32, and 30 ppm, respectively. Due to the very low concentration in other REEs, we only considered the four REEs (Y, La, Ce, and Nd) with the highest concentration in the PG.
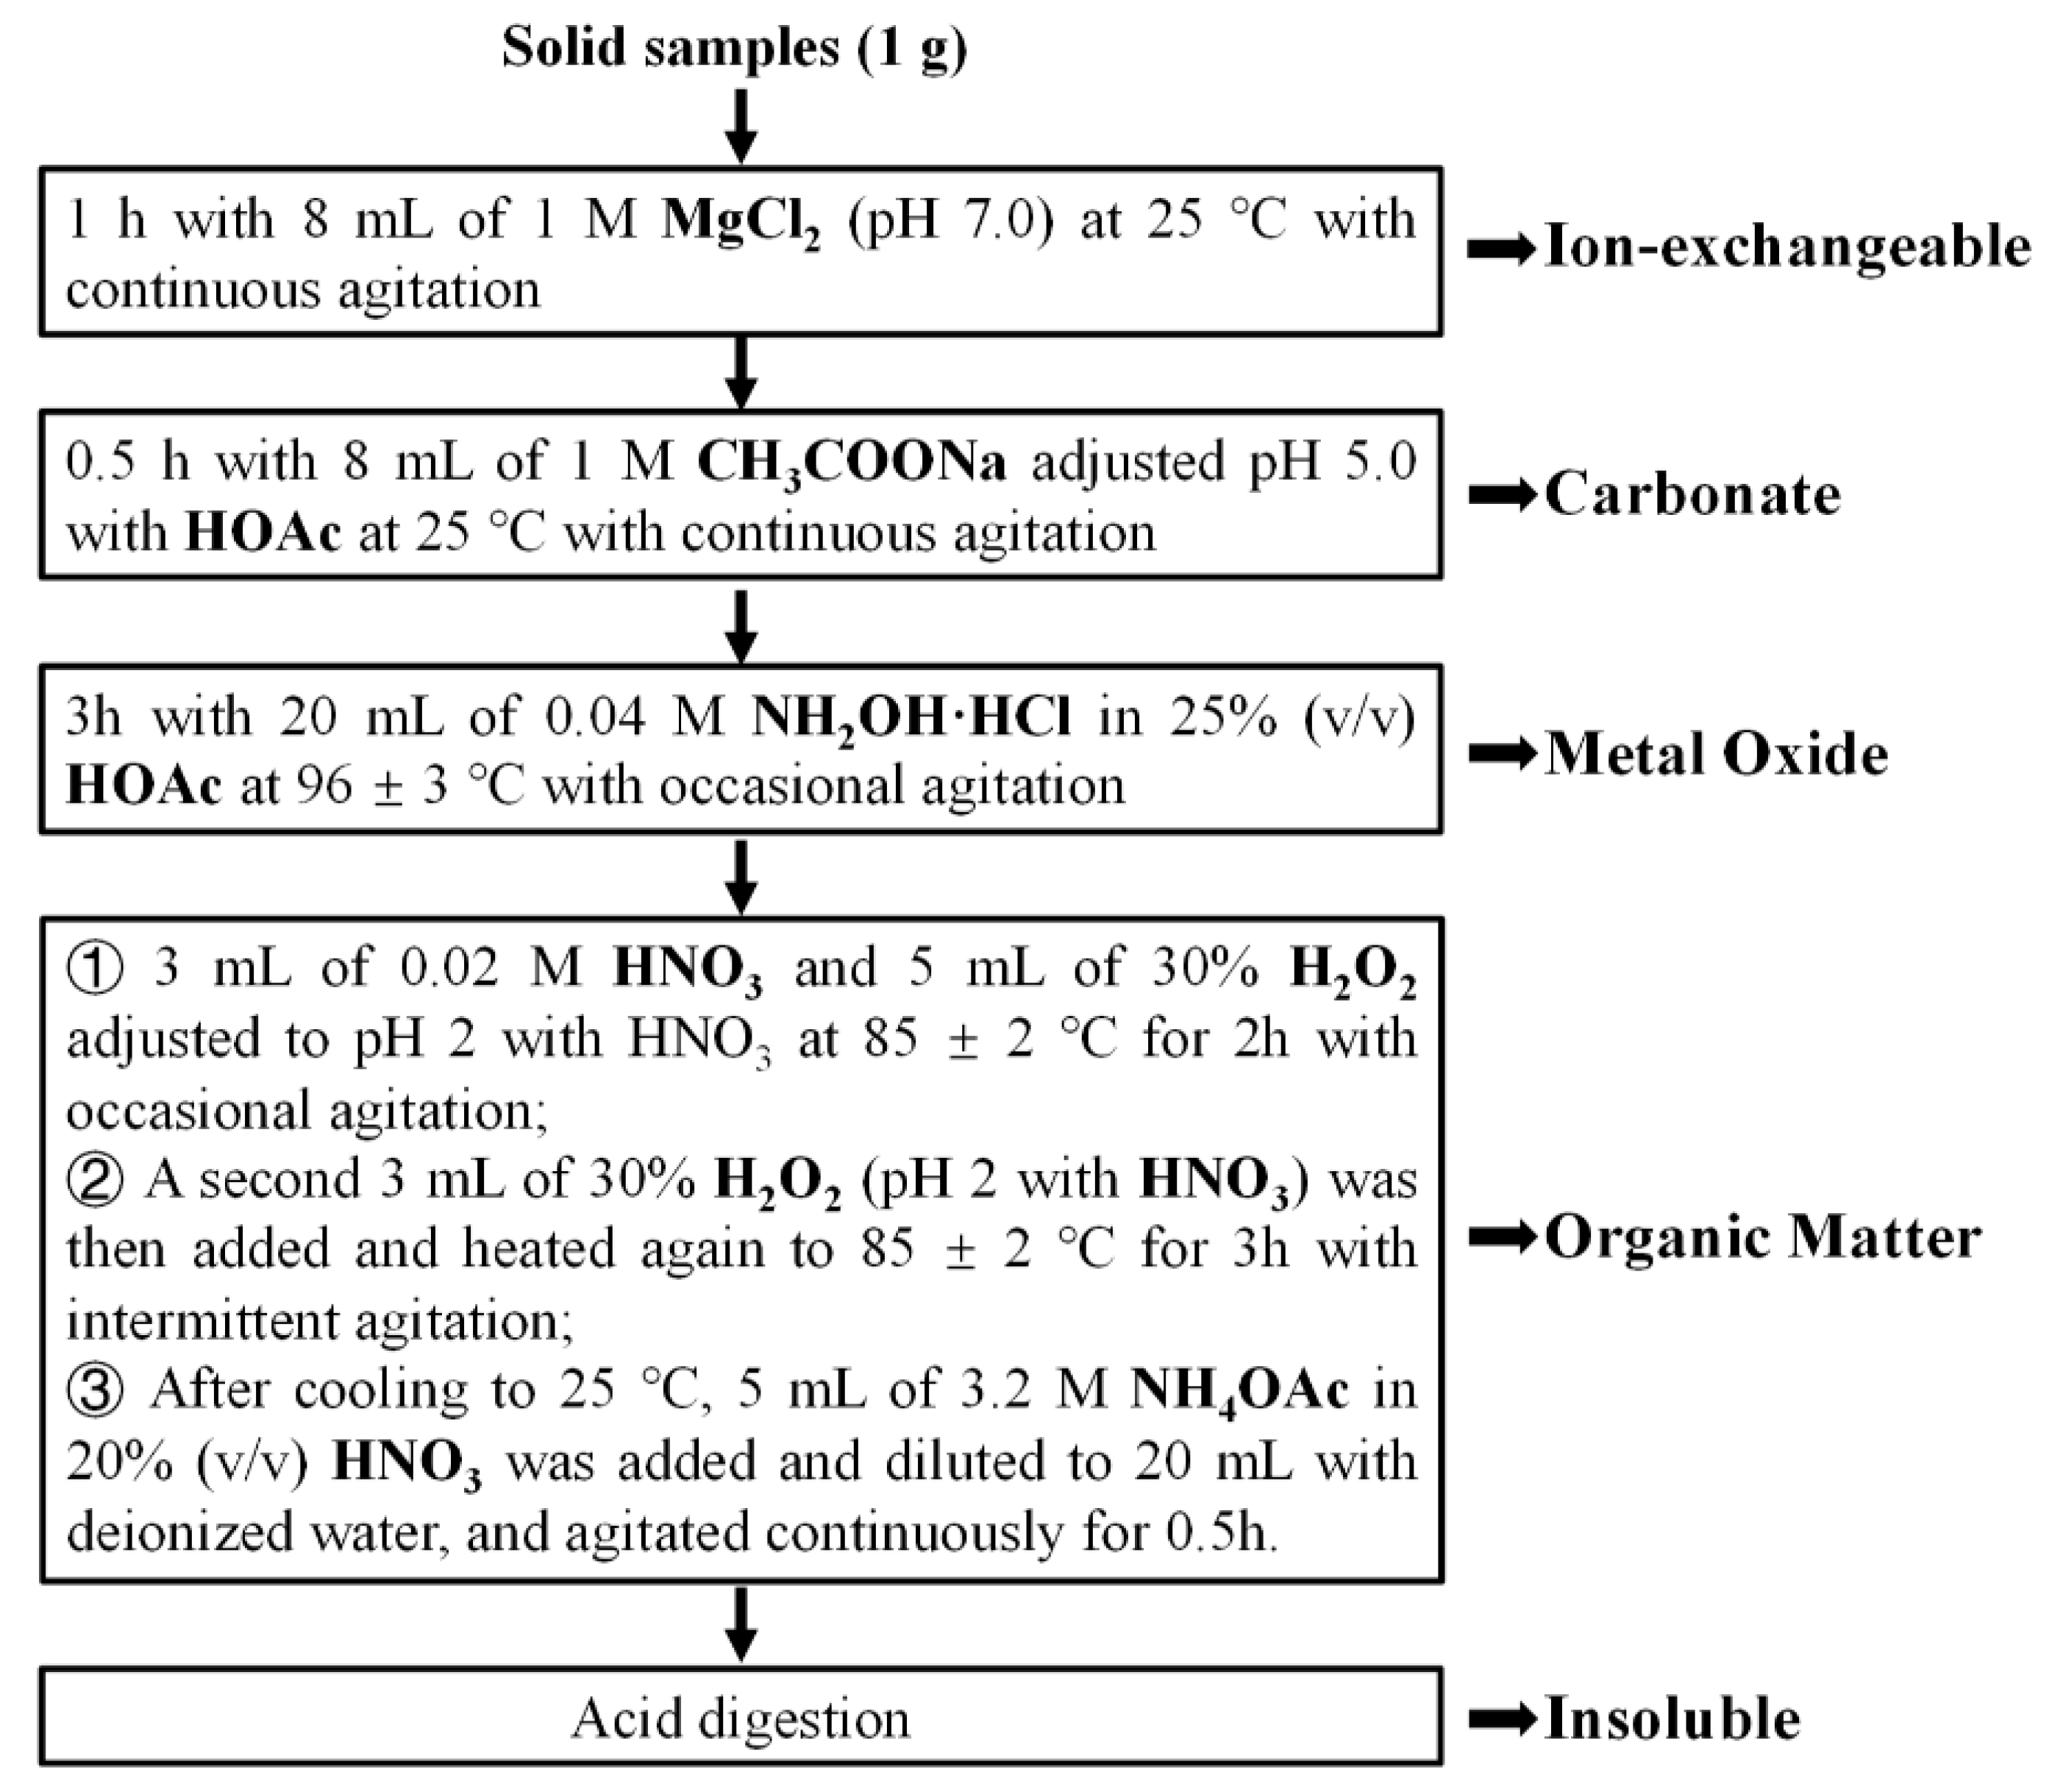
The sequential chemical extraction (SCE) was carried out to determine the occurrence modes of the 4 REEs and calcium. As stated in the experimental section, the elements in the PG were classified into five different modes of occurrence including ion-exchangeable, carbonate, metal oxide, organic matter, and insoluble (see
Figure 1).
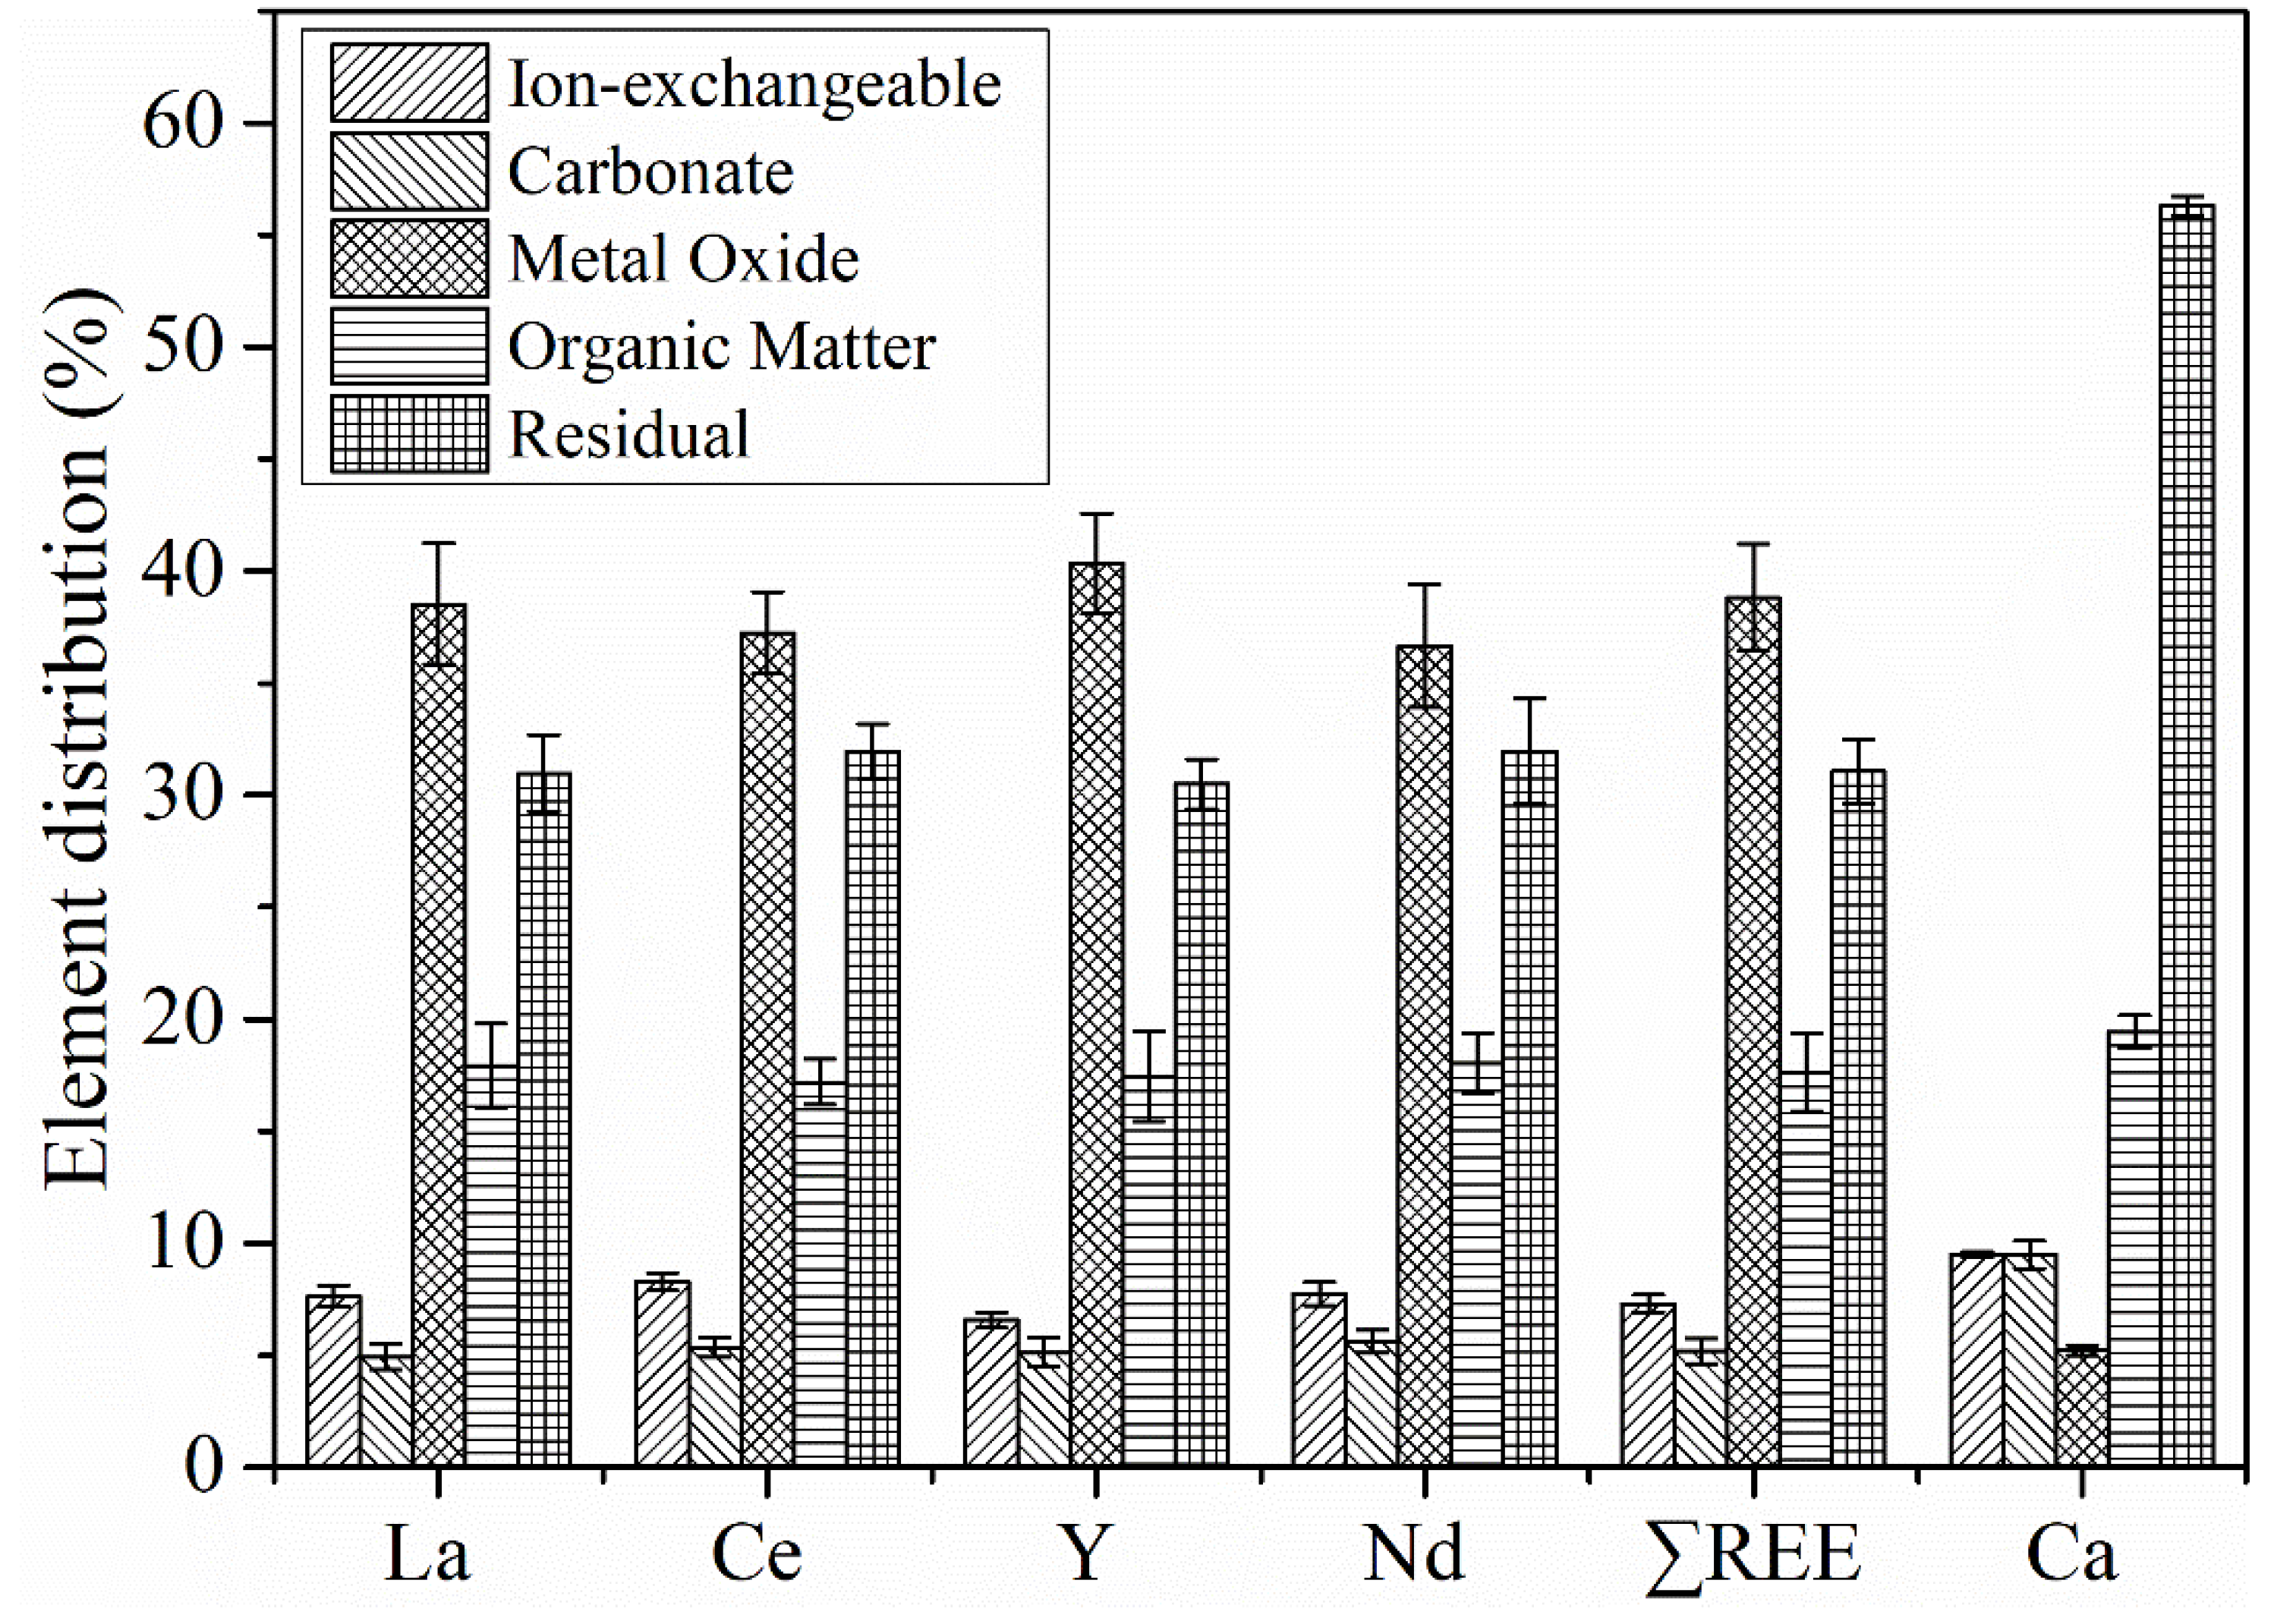
Figure 5 shows the distributions of the four REEs and calcium in the different occurrence modes. In the PG, the distributions of La, Ce, Y, and Nd among the five occurrence modes were basically the same, of which REEs in the metal oxide form accounted for the largest proportion, followed by the residual, organic matter, and ion-exchangeable fractions, and REEs bound to carbonates were the least. This partially agreed with the findings of Santos, et al. [
33], especially for lanthanum. The distribution of total REEs (∑REE) among the five occurrence modes were 39% in the metal oxide fraction, 31% in the residual fraction, 18% in the organic matter fraction, 7% in the ion-exchangeable fraction, and 5% in the carbonate fraction, respectively. Among them, the ion-exchangeable, carbonate, and metal oxide forms are easy-to-leach REE minerals, which are more soluble in relatively weak acid conditions. The organic matter form requires strong acid solutions for dissolution, and the residual is difficult to dissolve.
The distributions of calcium in the five occurrence modes were distinctly different from the REE distributions, of which the residual calcium (CaSO4·2H2O) accounted for the largest proportion of 56%, followed by the organic matter with 19%, and the least proportion was the metal oxide form with 5%. This was obviously controversial with the result that dihydrate gypsum accounted for more than 90% of the PG by XRF. The main reason for this result was the slight solubility of dihydrate gypsum, which resulted in the dissolution of part of the dihydrate gypsum in each of the first four steps of the SCE experiment, thereby reducing the calcium content in the residual forms. Additionally, this caused part of REEs contained in the gypsum crystals, which should be the residual REEs, to enter into the first four occurrence modes of the SCE experiment, and thus increased the REE content in the first four occurrence forms and decreased their content in the residual.
Although the distribution results obtained through the SCE experiment had a certain deviation, it was determined that REEs in the PG was mainly presented in the form of residuals (existed in the gypsum lattice) and metal oxides (easily leached) by the comparison of distributions between REEs and calcium among different occurrence modes.
3.2. REE Leaching Tests
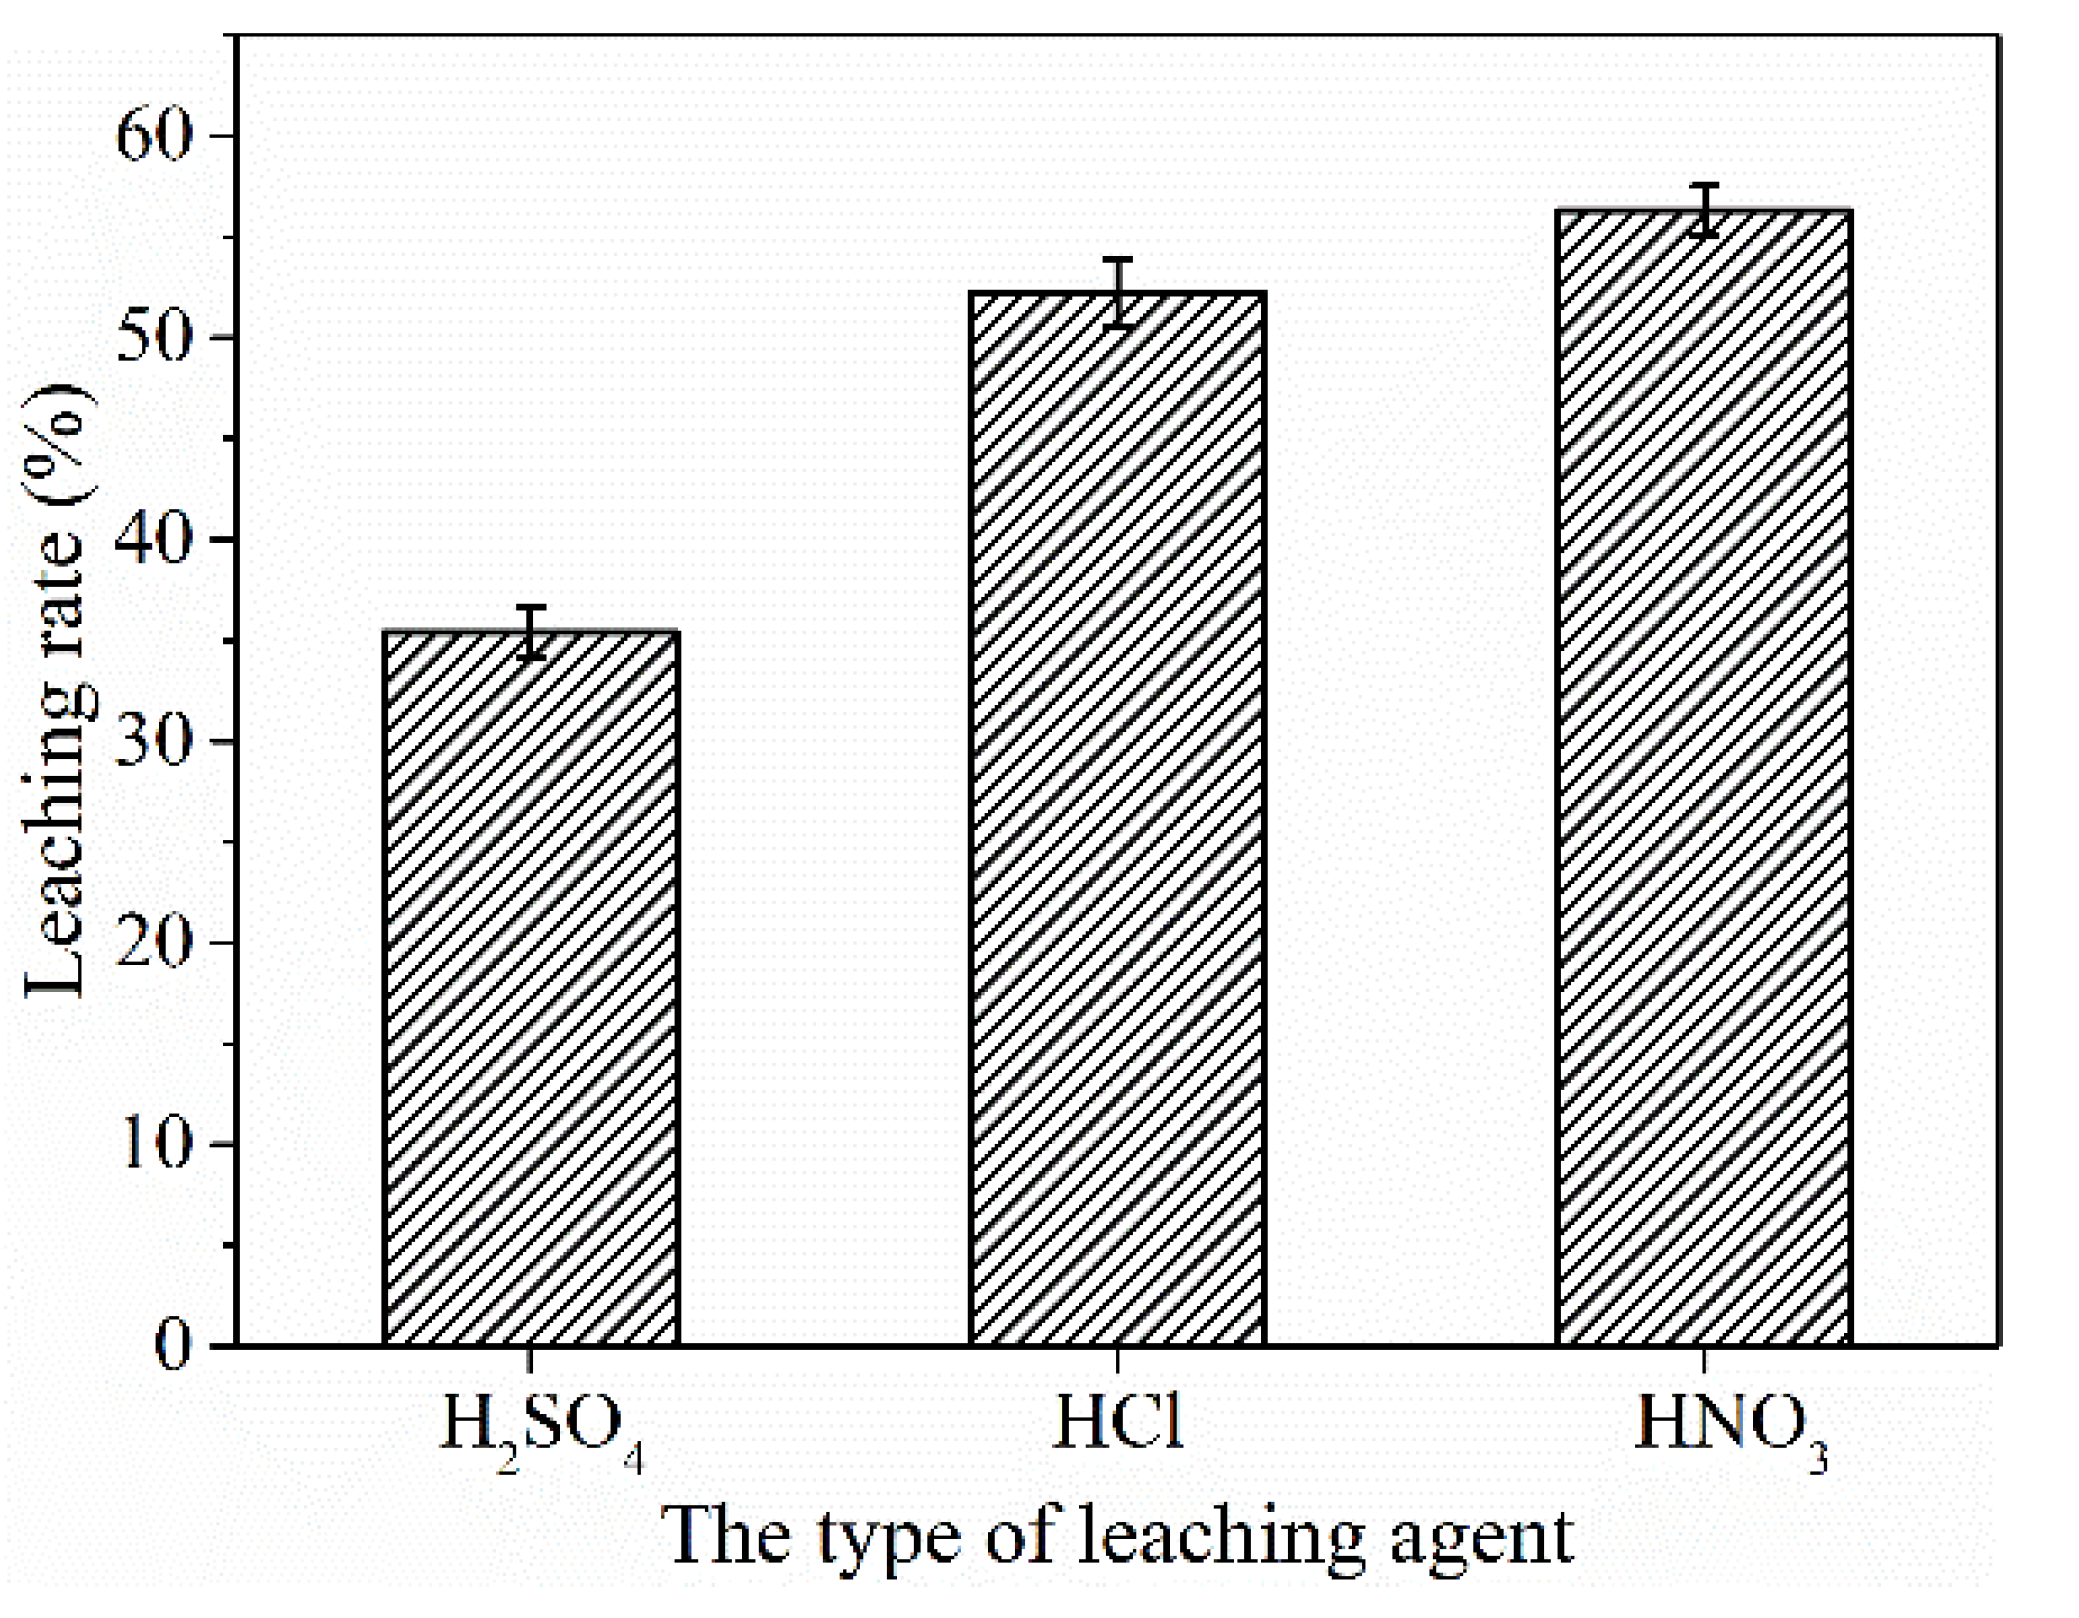
It can be seen from
Figure 6 that at 30 °C, acid concentration of 1.65 mol/L, solid-to-liquid (S/L) ratio of 1/10 and leaching for 2 h, the maximum ∑REE leaching rates of H
2SO
4, HCl and HNO
3 were 35.4%, 52.2% and 56.3%, respectively. Compared with other studies [
3], the ∑REE leaching rate in H
2SO
4 was relatively high, which was mainly ascribed to the fact that a large part of REEs in the PG was presented in the form of metal oxides that were easily leached. However, in the presence of potassium ions (as shown in
Table 1), it was easy to form insoluble rare earth sulfate double salts [
37], especially in the cyclic leaching process, resulting in the loss of REEs in the H
2SO
4 leaching solution. Compared with H
2SO
4, HCl and HNO
3 were more effective leaching agents. In view of the small difference in leaching rate between HCl and HNO
3, and the price advantage of HCl, HCl was a more suitable leaching agent for leaching REEs from the PG [
3].
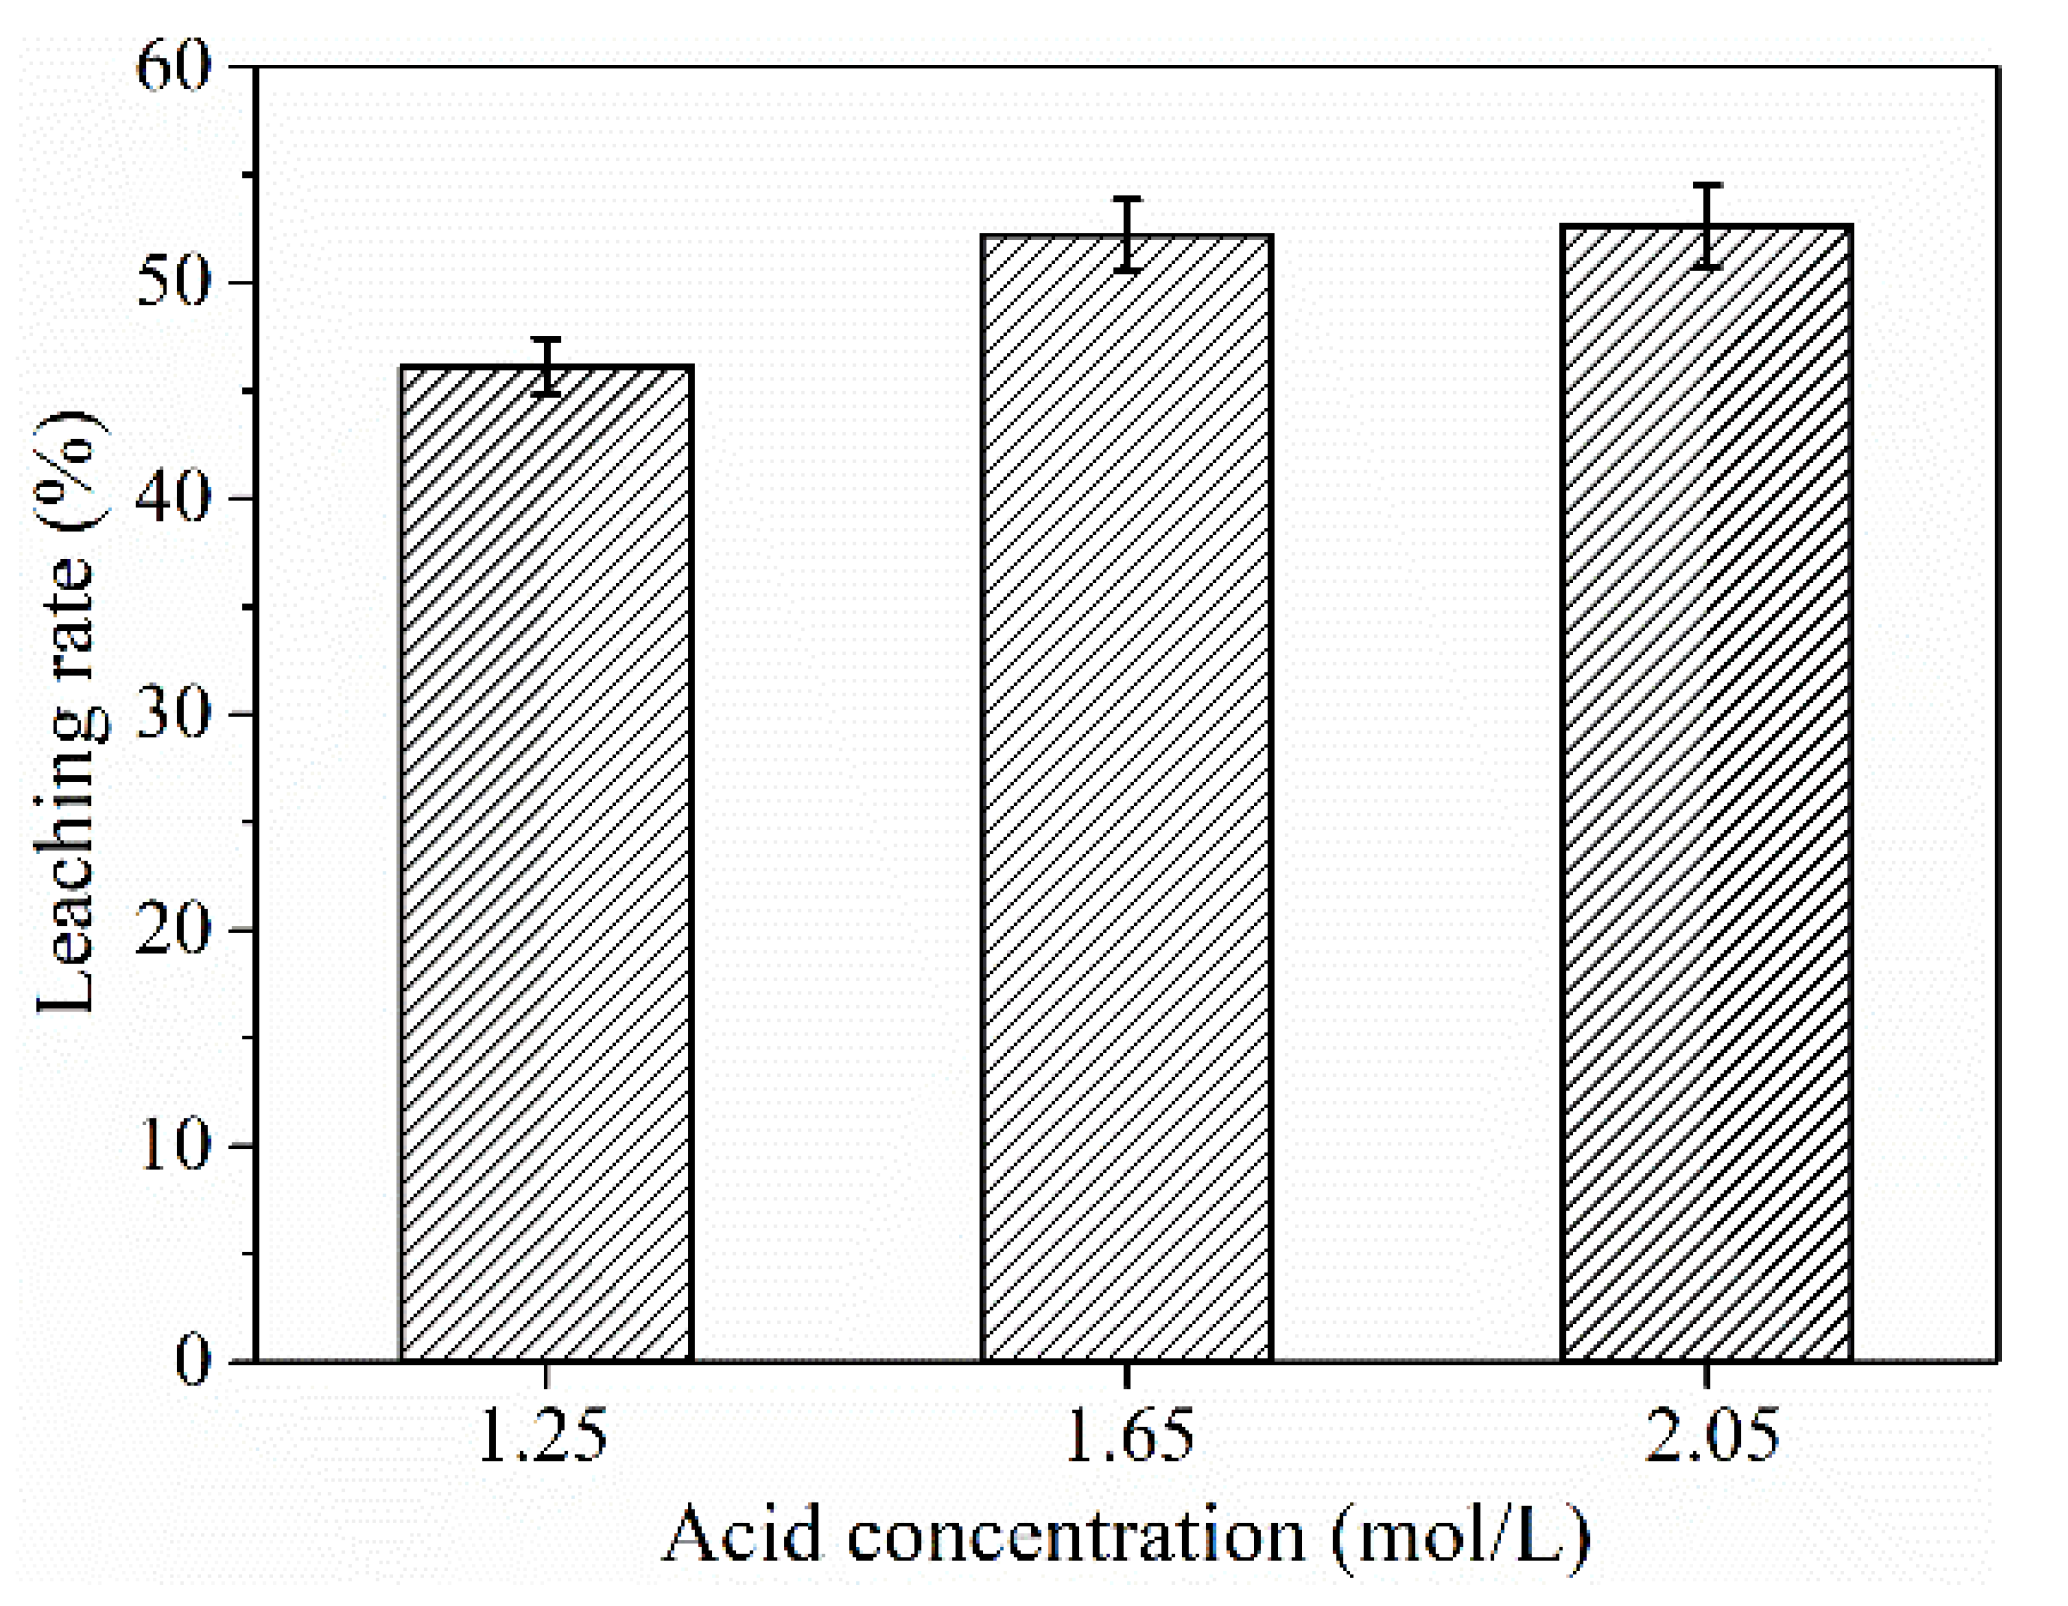
From
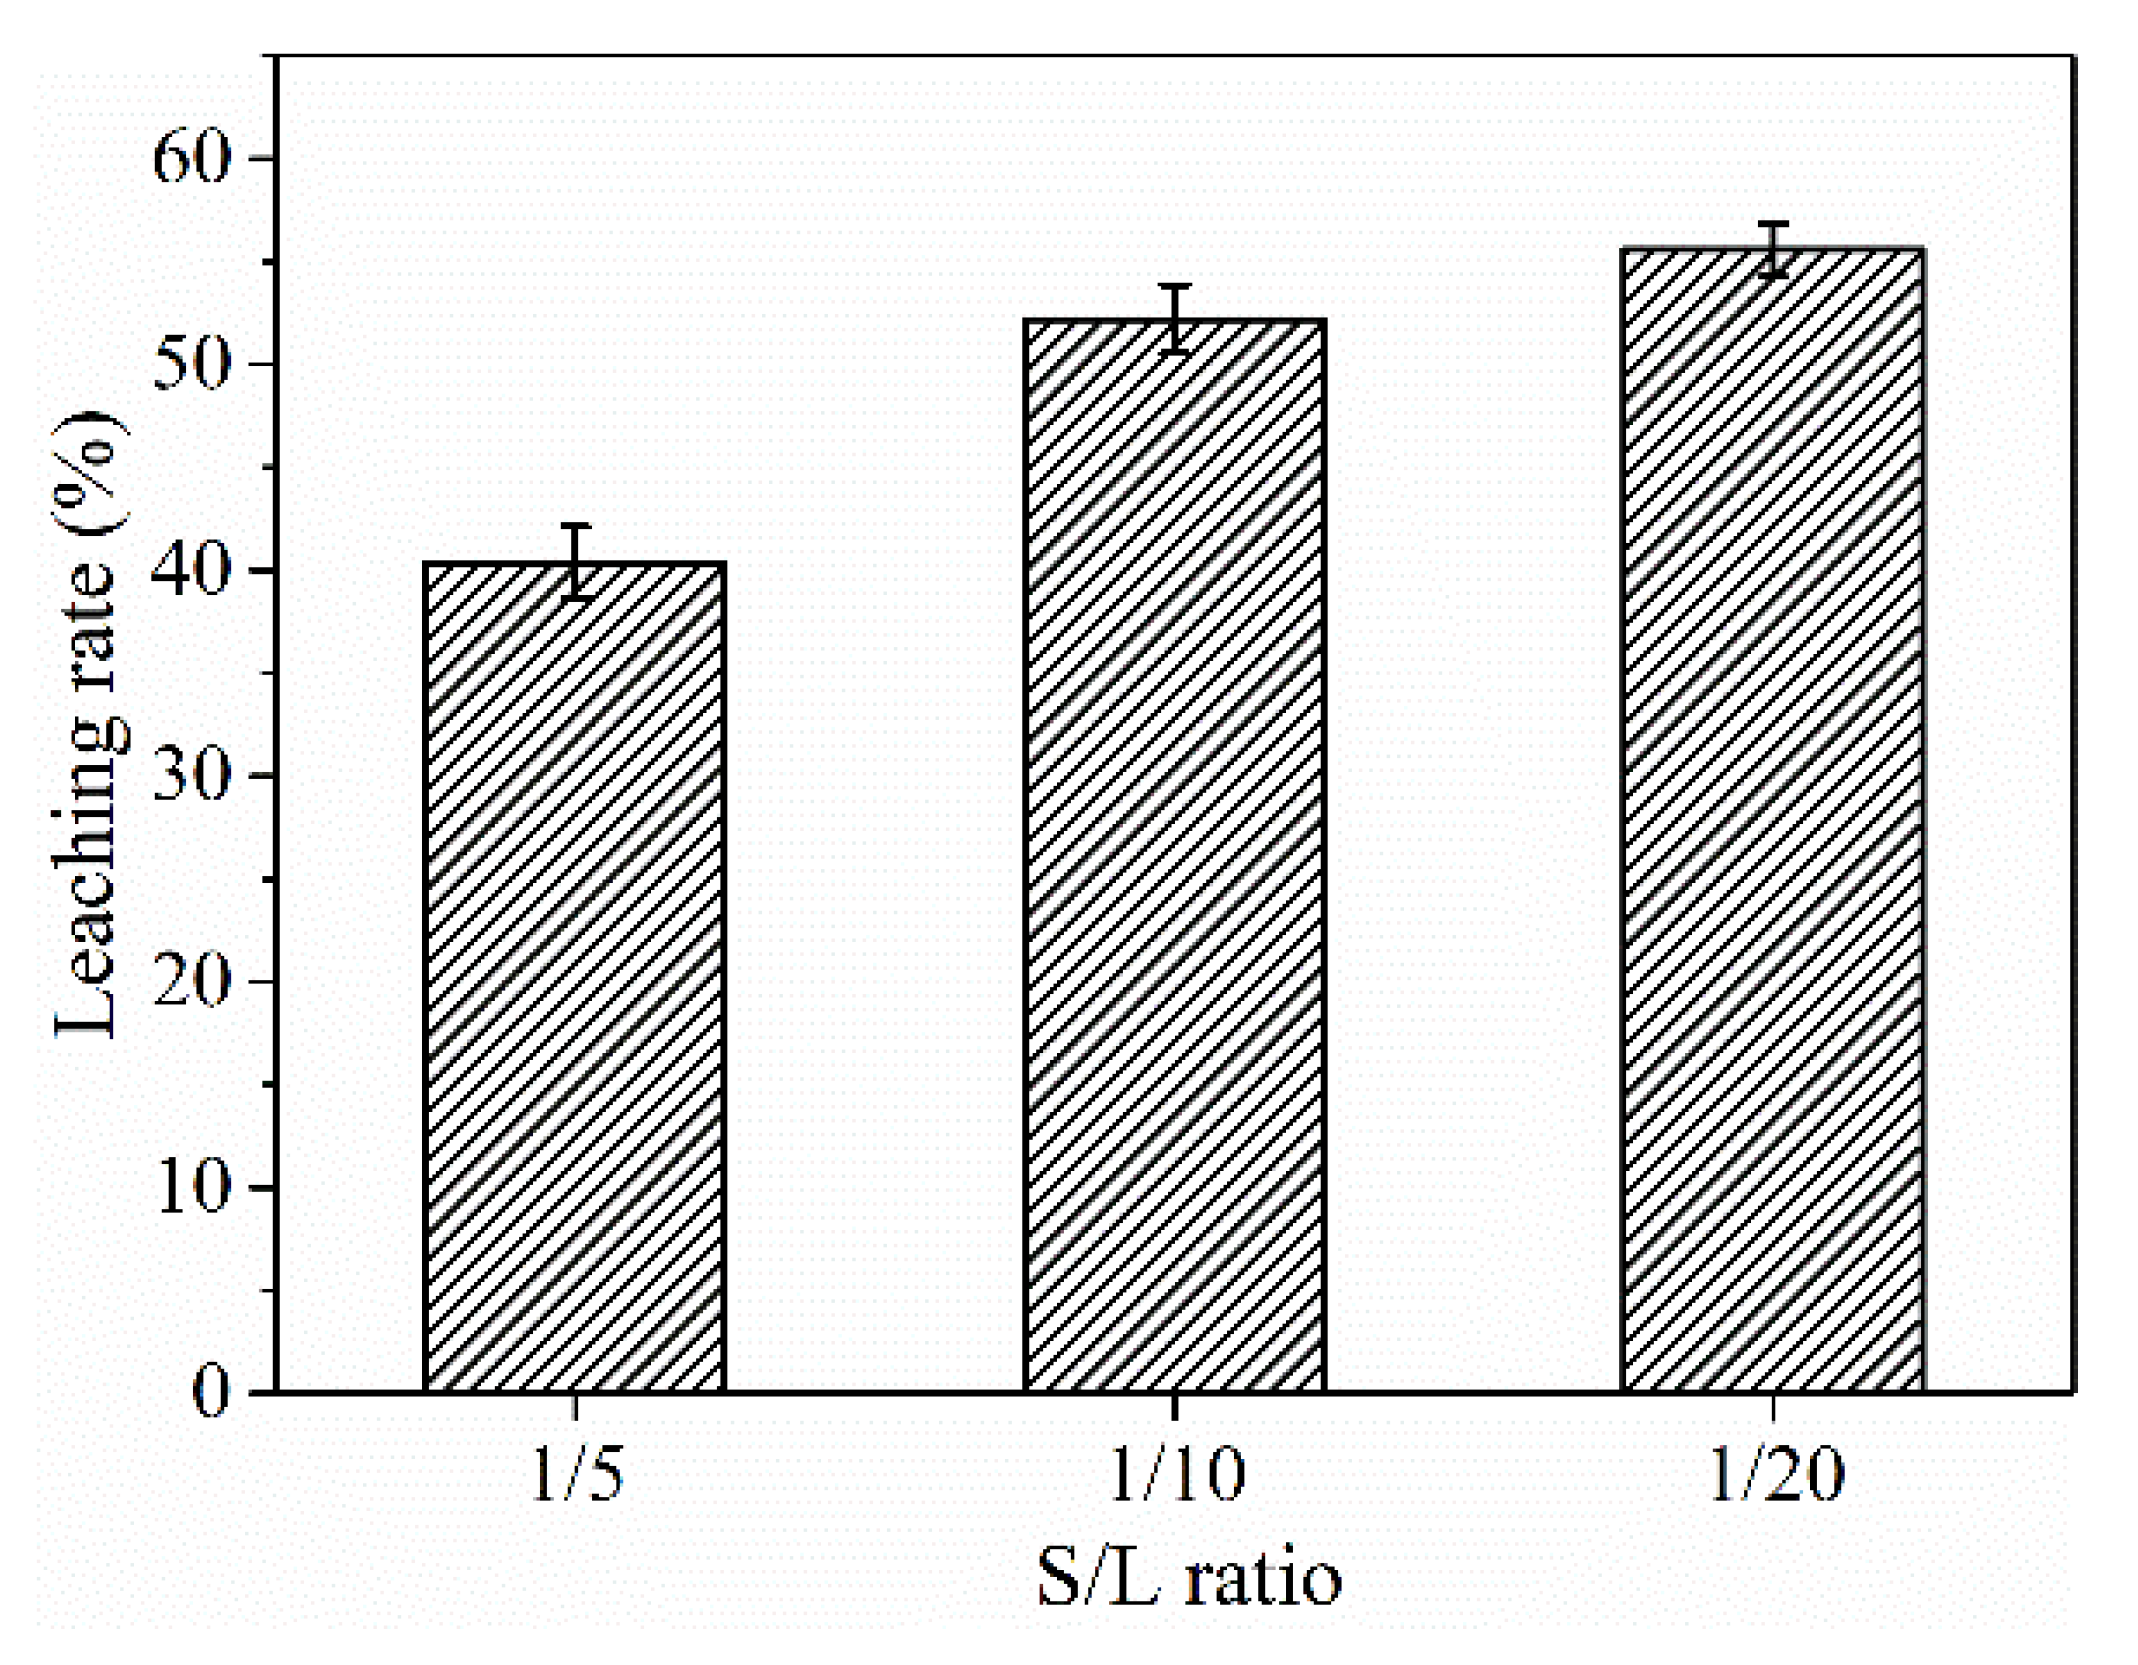
Figure 7, increasing the acid concentration from 1.25 mol/L to 1.65 mol/L enhanced the leaching efficiency of ∑REE significantly, from 44.2% to 52.2%. In addition, a continued increase of acid concentration to 2.05 mol/L only increased the leaching rate slightly by 0.6%. As shown in
Figure 8, the leaching efficiency increased with decreasing S/L ratio. When the S/L ratio decreased from 1/5 to 1/10, the ∑REE leaching rate increased remarkably from 37.5% to 52.2%, and the continued decrease in the S/L ratio to 1/20 only increased the REE leaching rate by 3%.
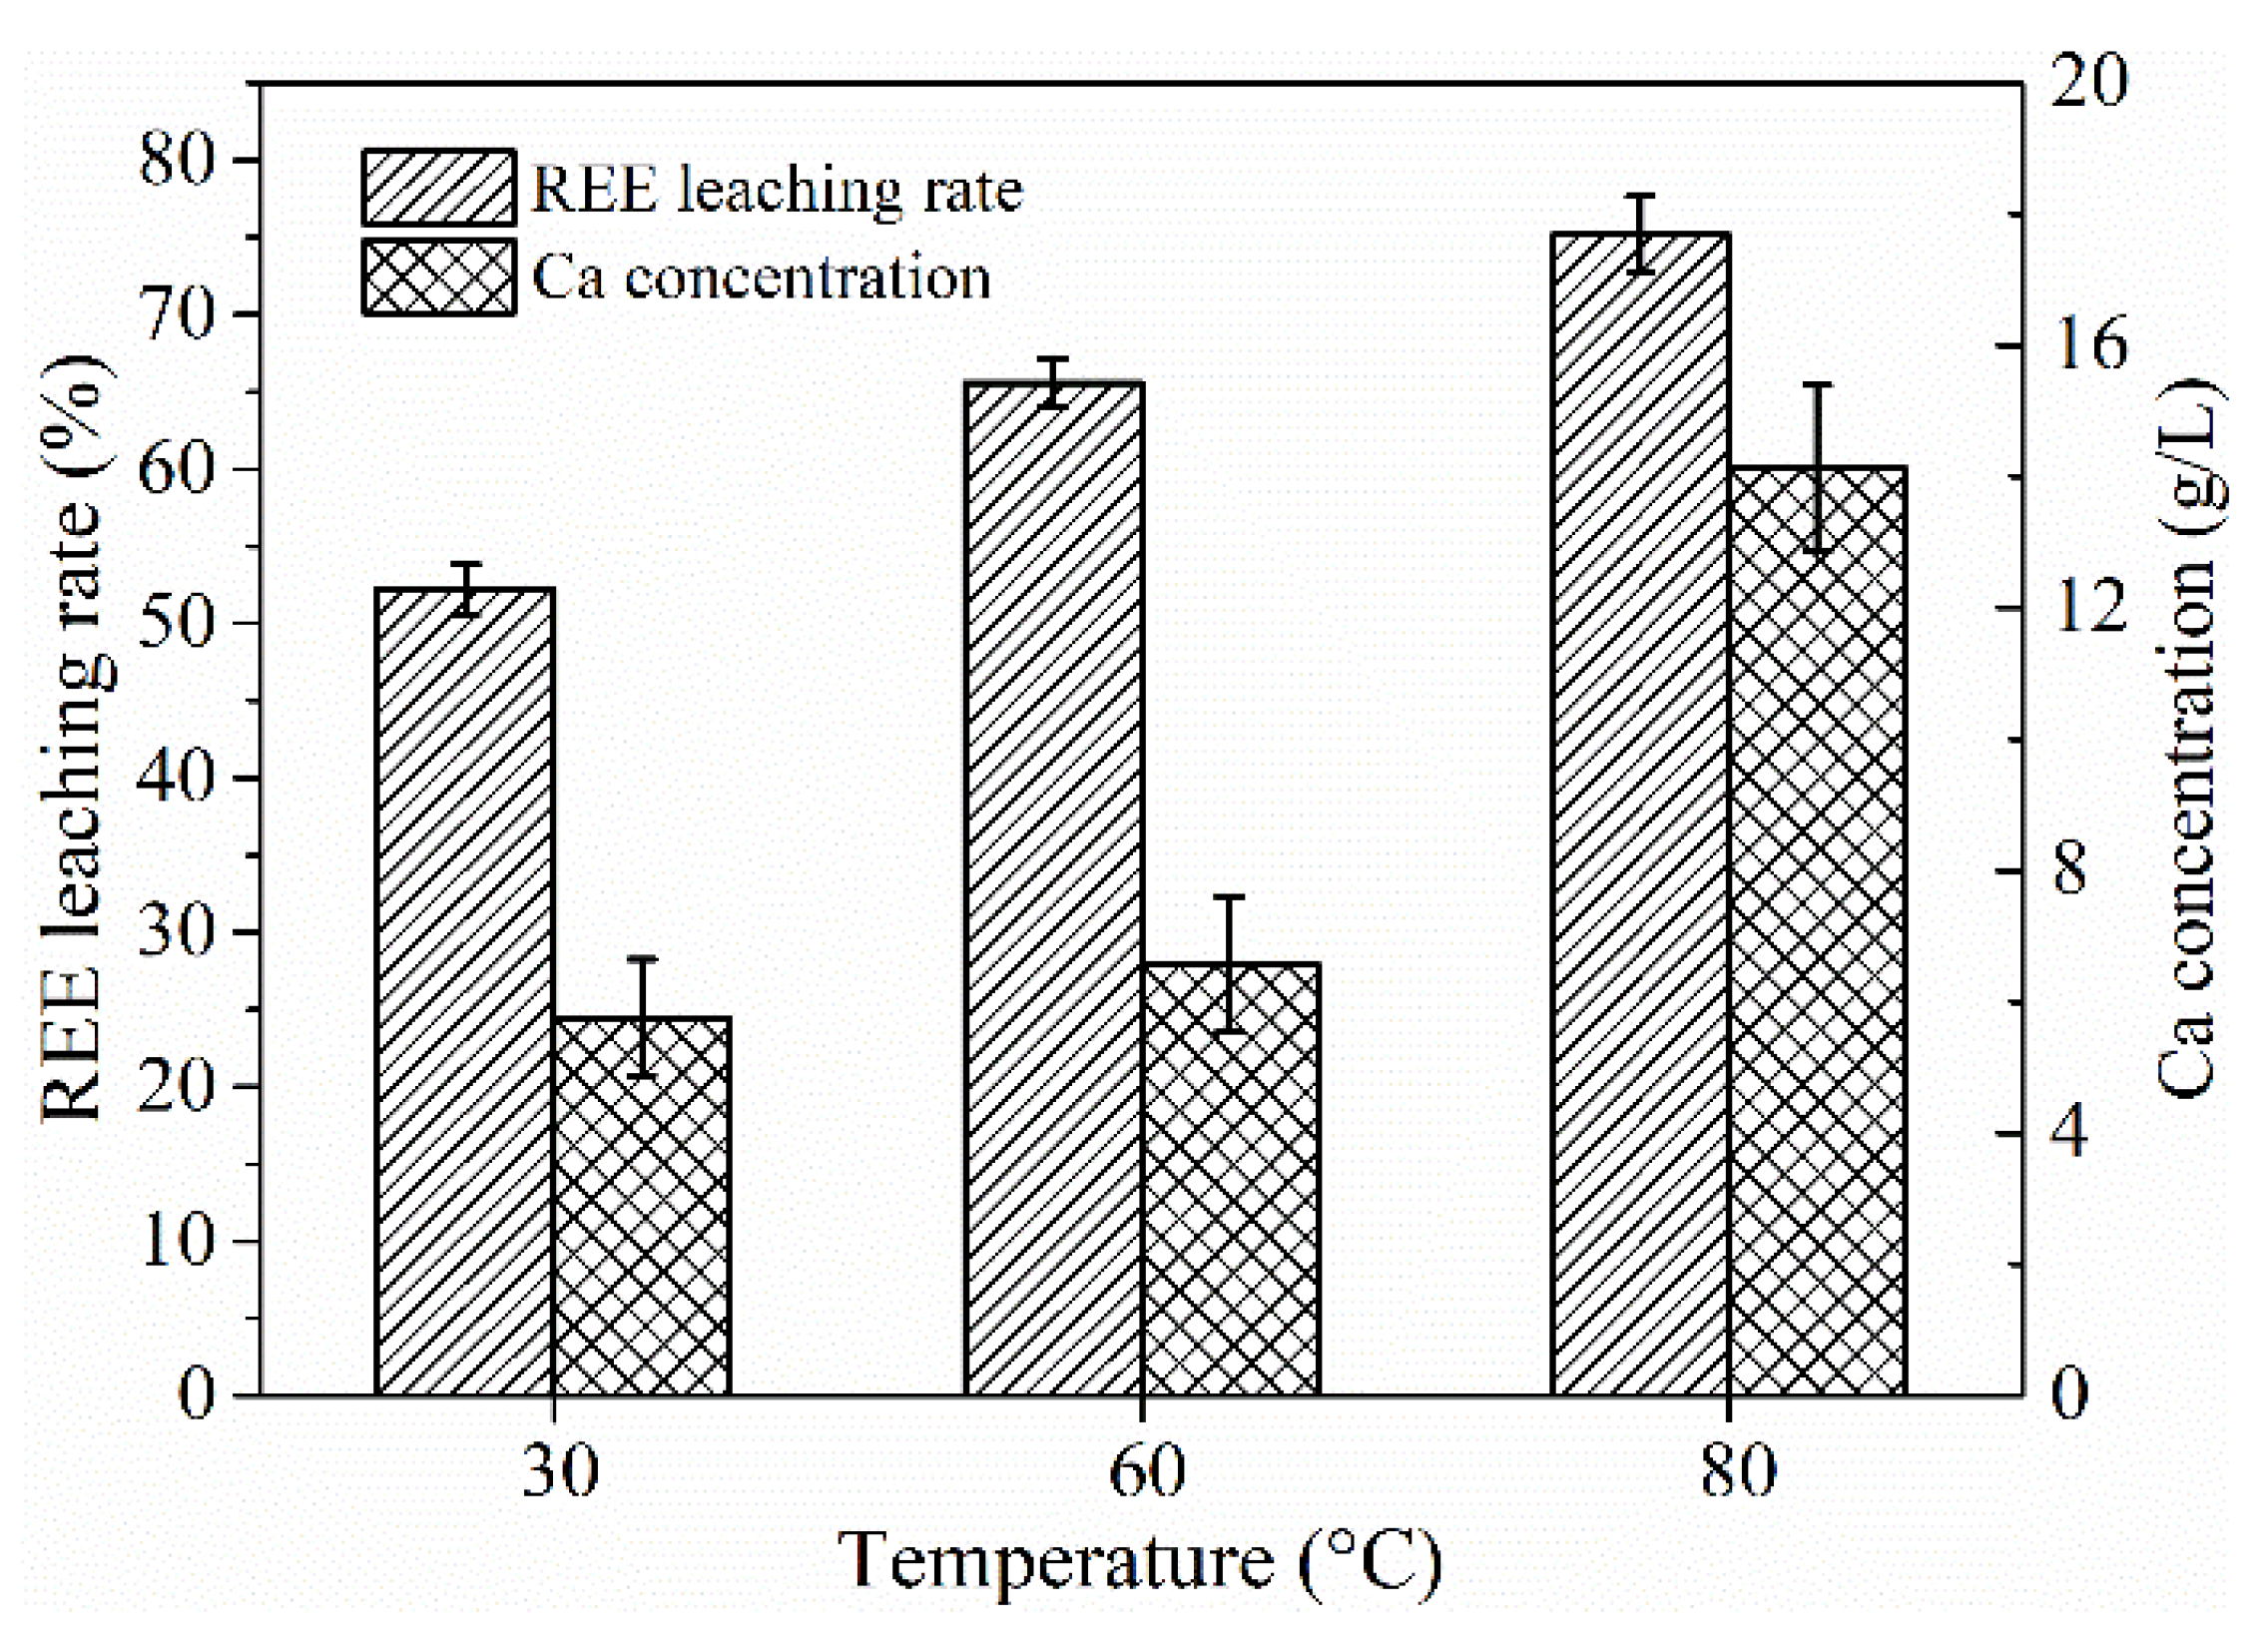
From
Figure 9, we can see that an increase in the reaction temperature could boost the leaching efficiency of ∑REE and calcium. When the leaching temperature was increased from 30 °C to 60 °C, the ∑REE leaching rate increased by 13.4%, while the calcium concentration only increased from 5.8 g/L to 6.6 g/L. With increased the leaching temperature to 80 °C, the ∑REE leaching rate increased by 9.6%, and the calcium concentration significantly increased to 14.1 g/L. The substantial increase of calcium in the leachate would greatly increase the burden of impurity removal in the subsequent process. Hence, the suitable leaching temperature for leaching REEs in the PG with HCl was 60 °C.
Therefore, comprehensive consideration of economy and leaching efficiency, the appropriate operating conditions of REE leaching from the PG using HCl as the leaching agent were acid concentration of 1.65 mol/L, S/L ratio of 1/10, and reaction temperature of 60 °C.
3.3. REE Leaching Kinetics
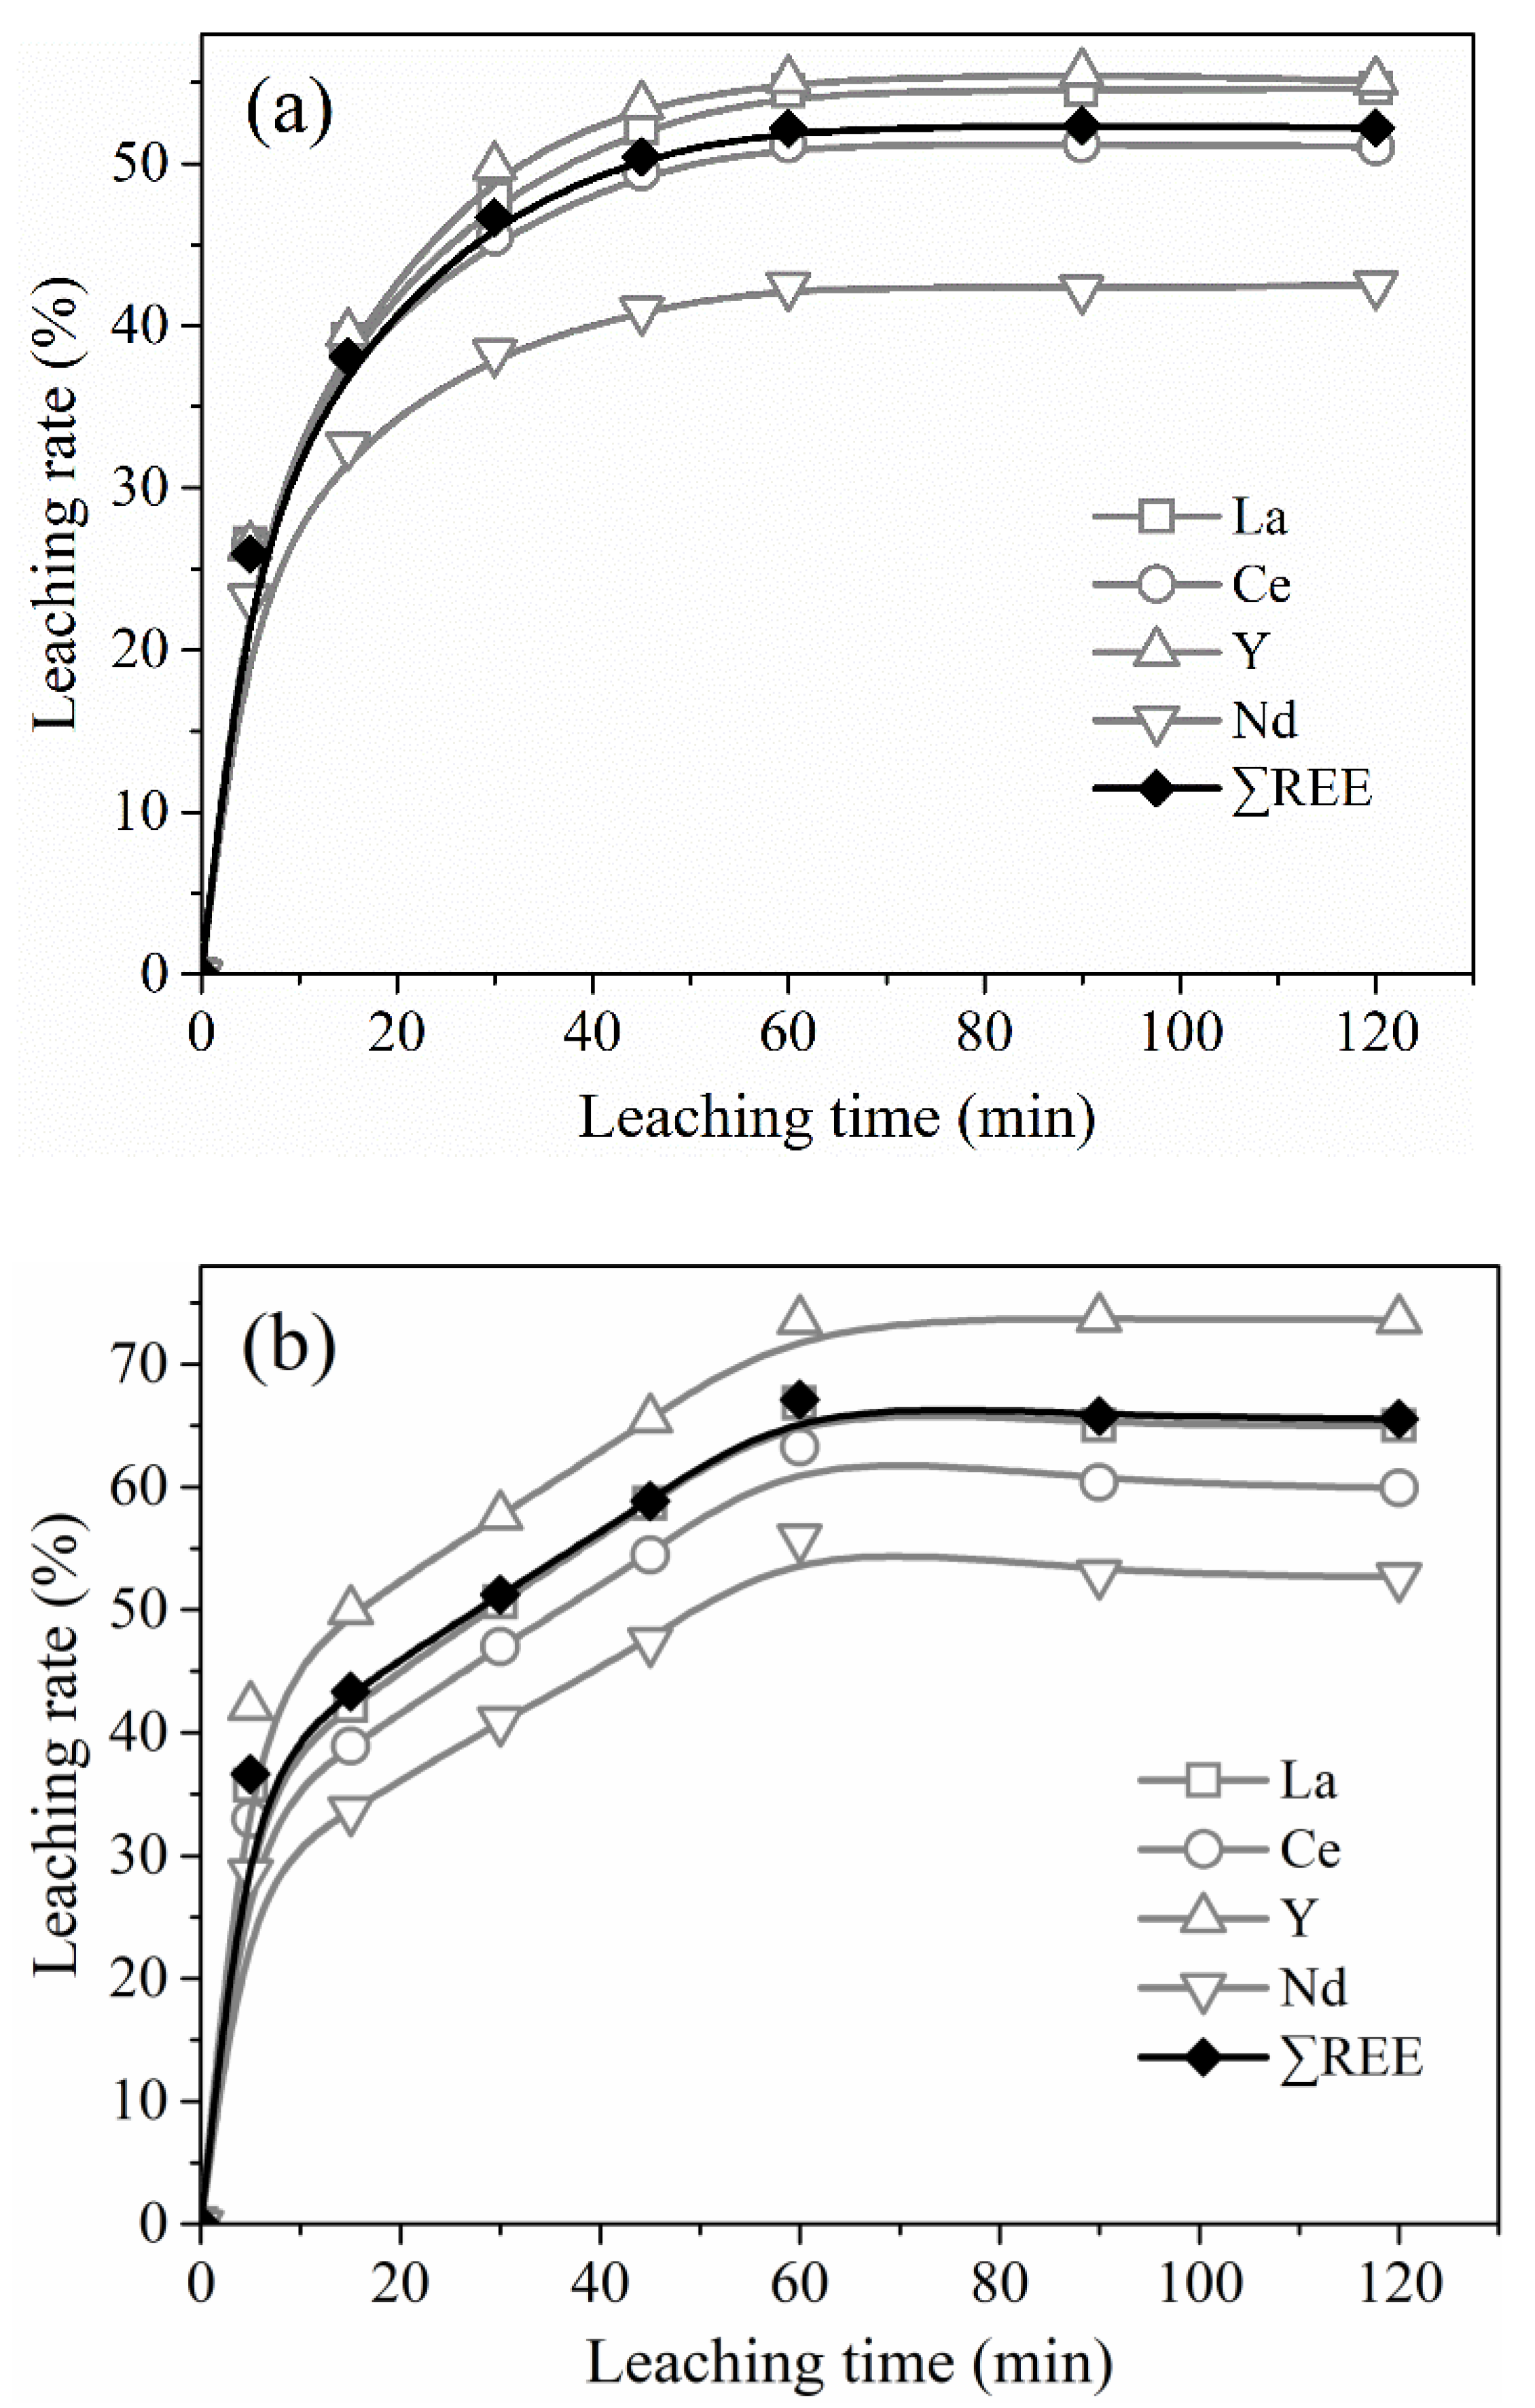
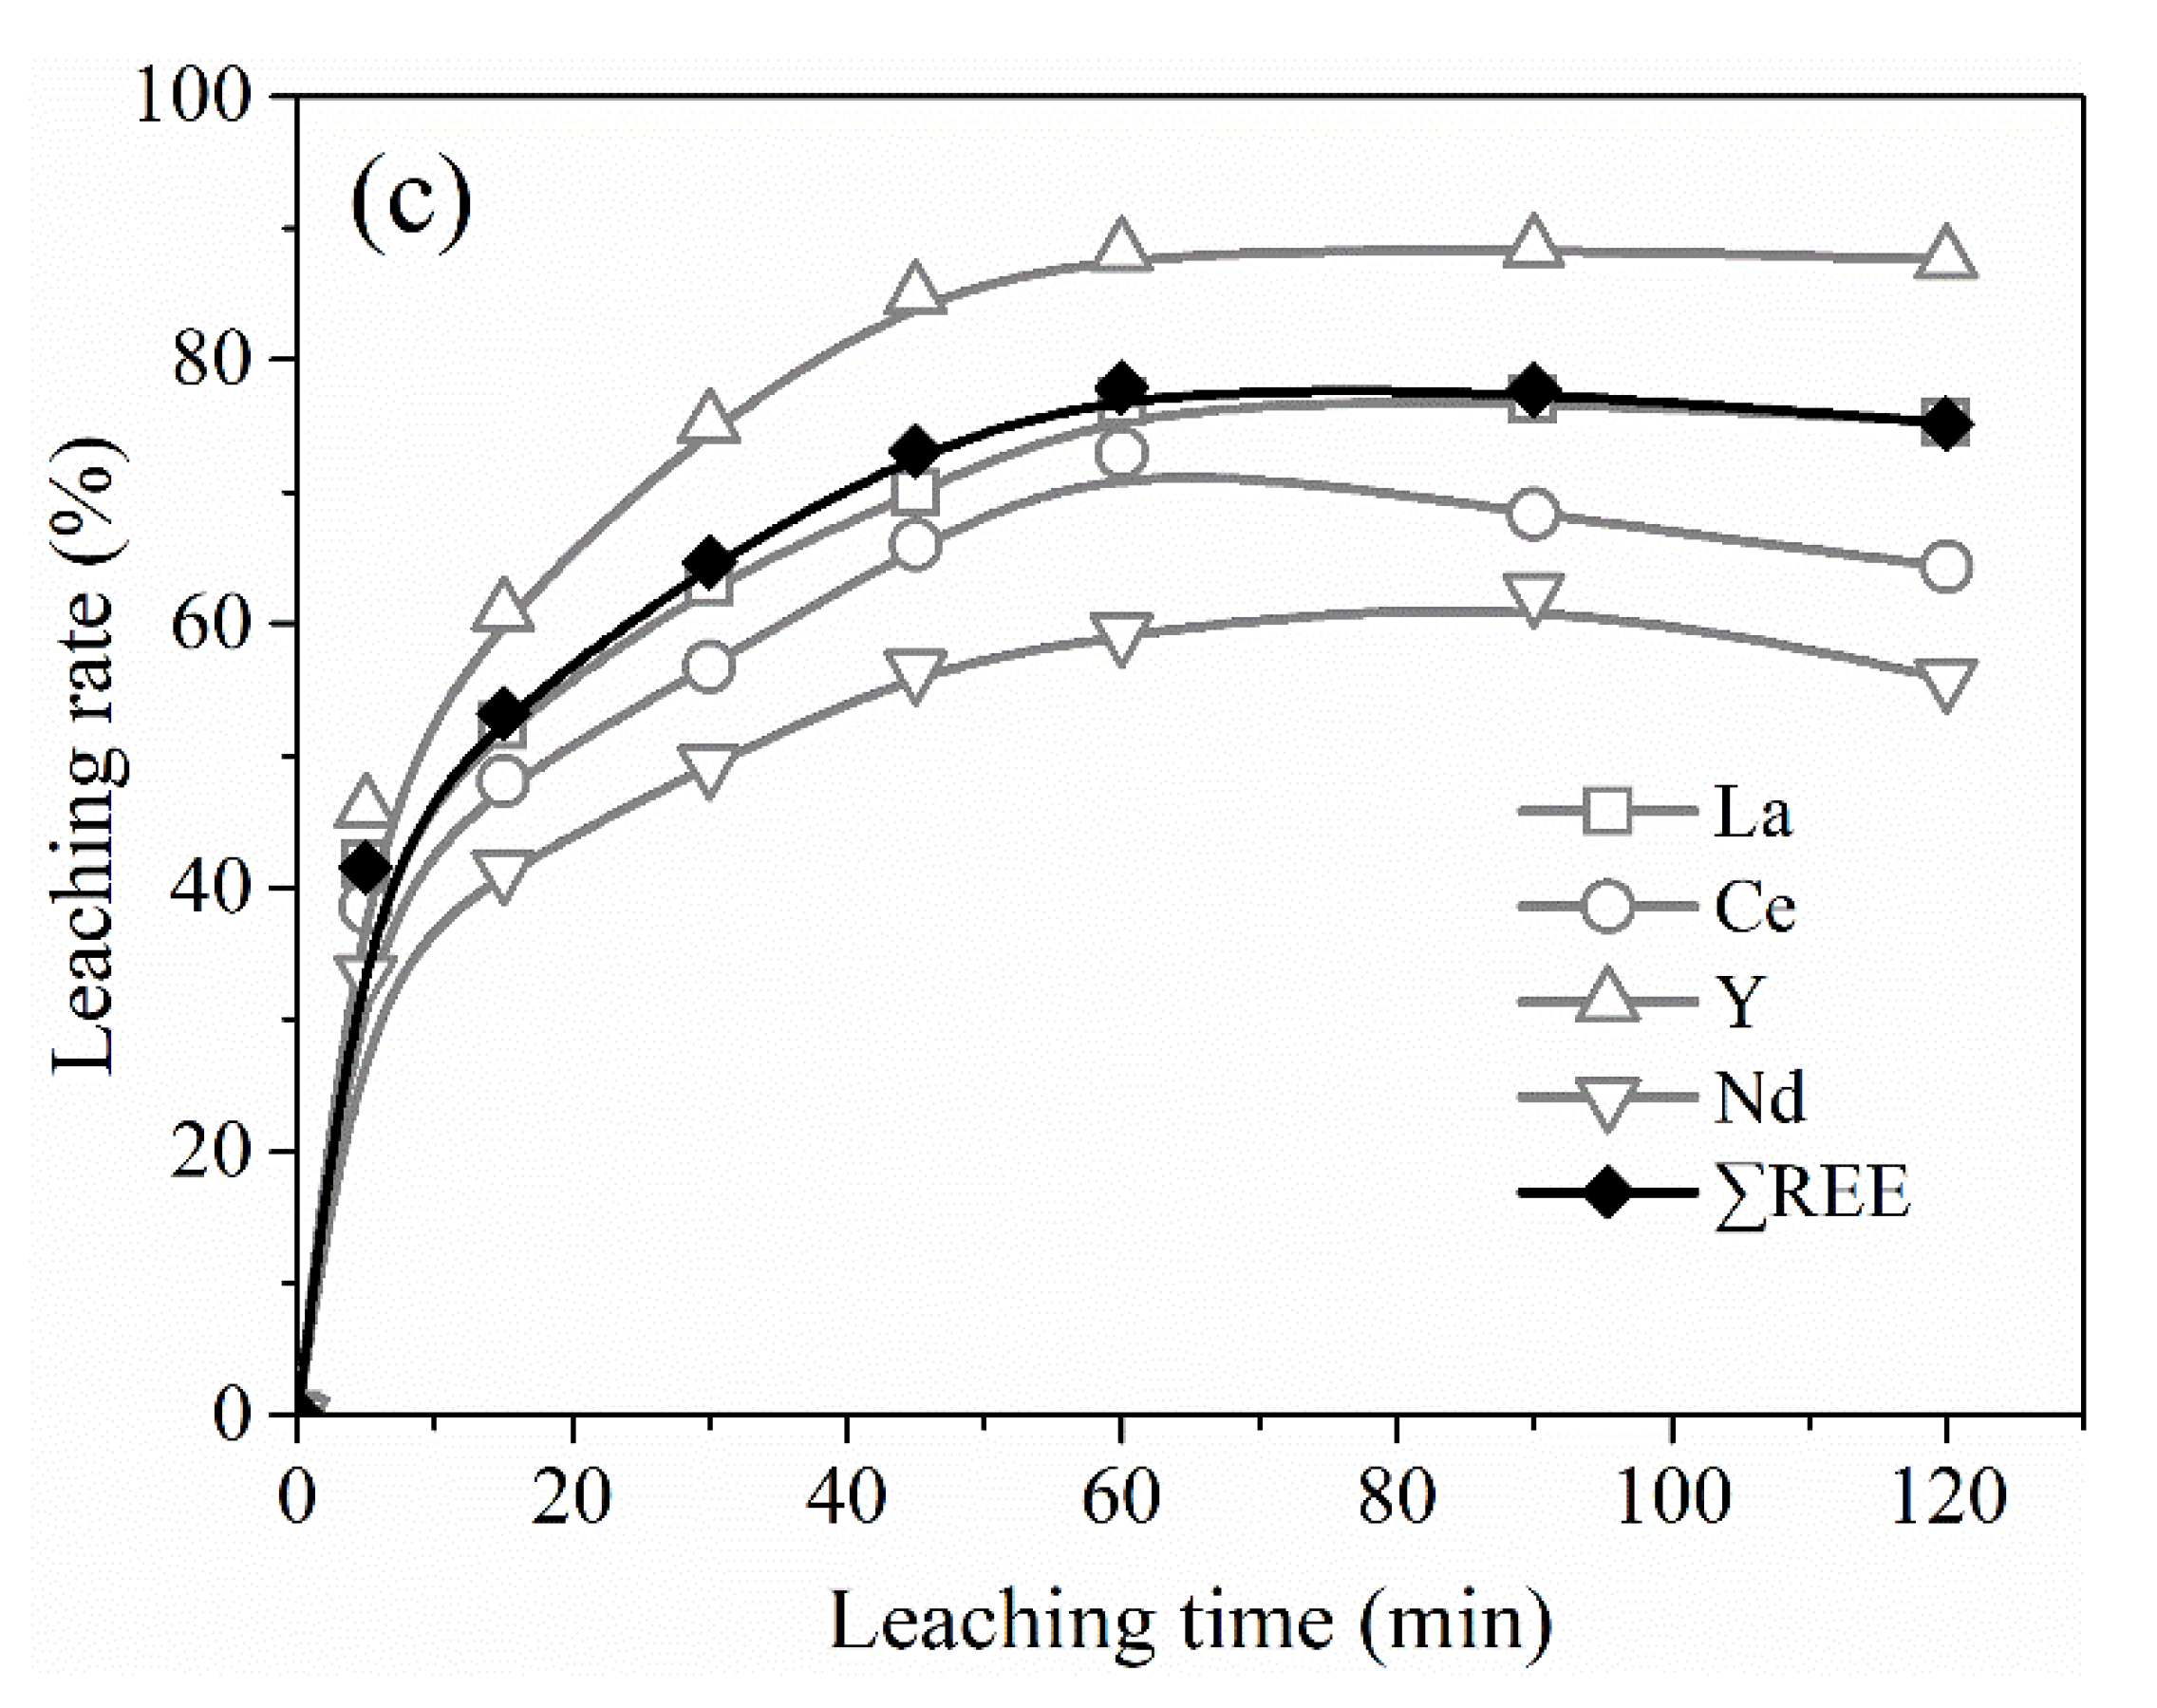
In order to study the leaching kinetics of REEs from PG in HCl solutions, the recovery data of La, Ce, Y, and Nd as a function of leaching time for different temperatures were illustrated in
Figure 10. From
Figure 10, the leaching process of the four REEs by HCl at different temperatures was roughly the same, which could be divided into three stages, i.e., quick leaching at the beginning, slow leaching at the middling, and basically reaching equilibrium after leaching 1 h. Among the four REEs, the yttrium leaching rate was the highest and reached 55.6%, 73.8%, and 88.4% at 30 °C, 60 °C, and 80 °C, respectively, which may be owing to its maximum content and the largest proportion of easily leached occurrence modes (as shown in
Figure 5).
To better understand the reaction rates and leaching mechanisms of REEs from PG, the data plotted in
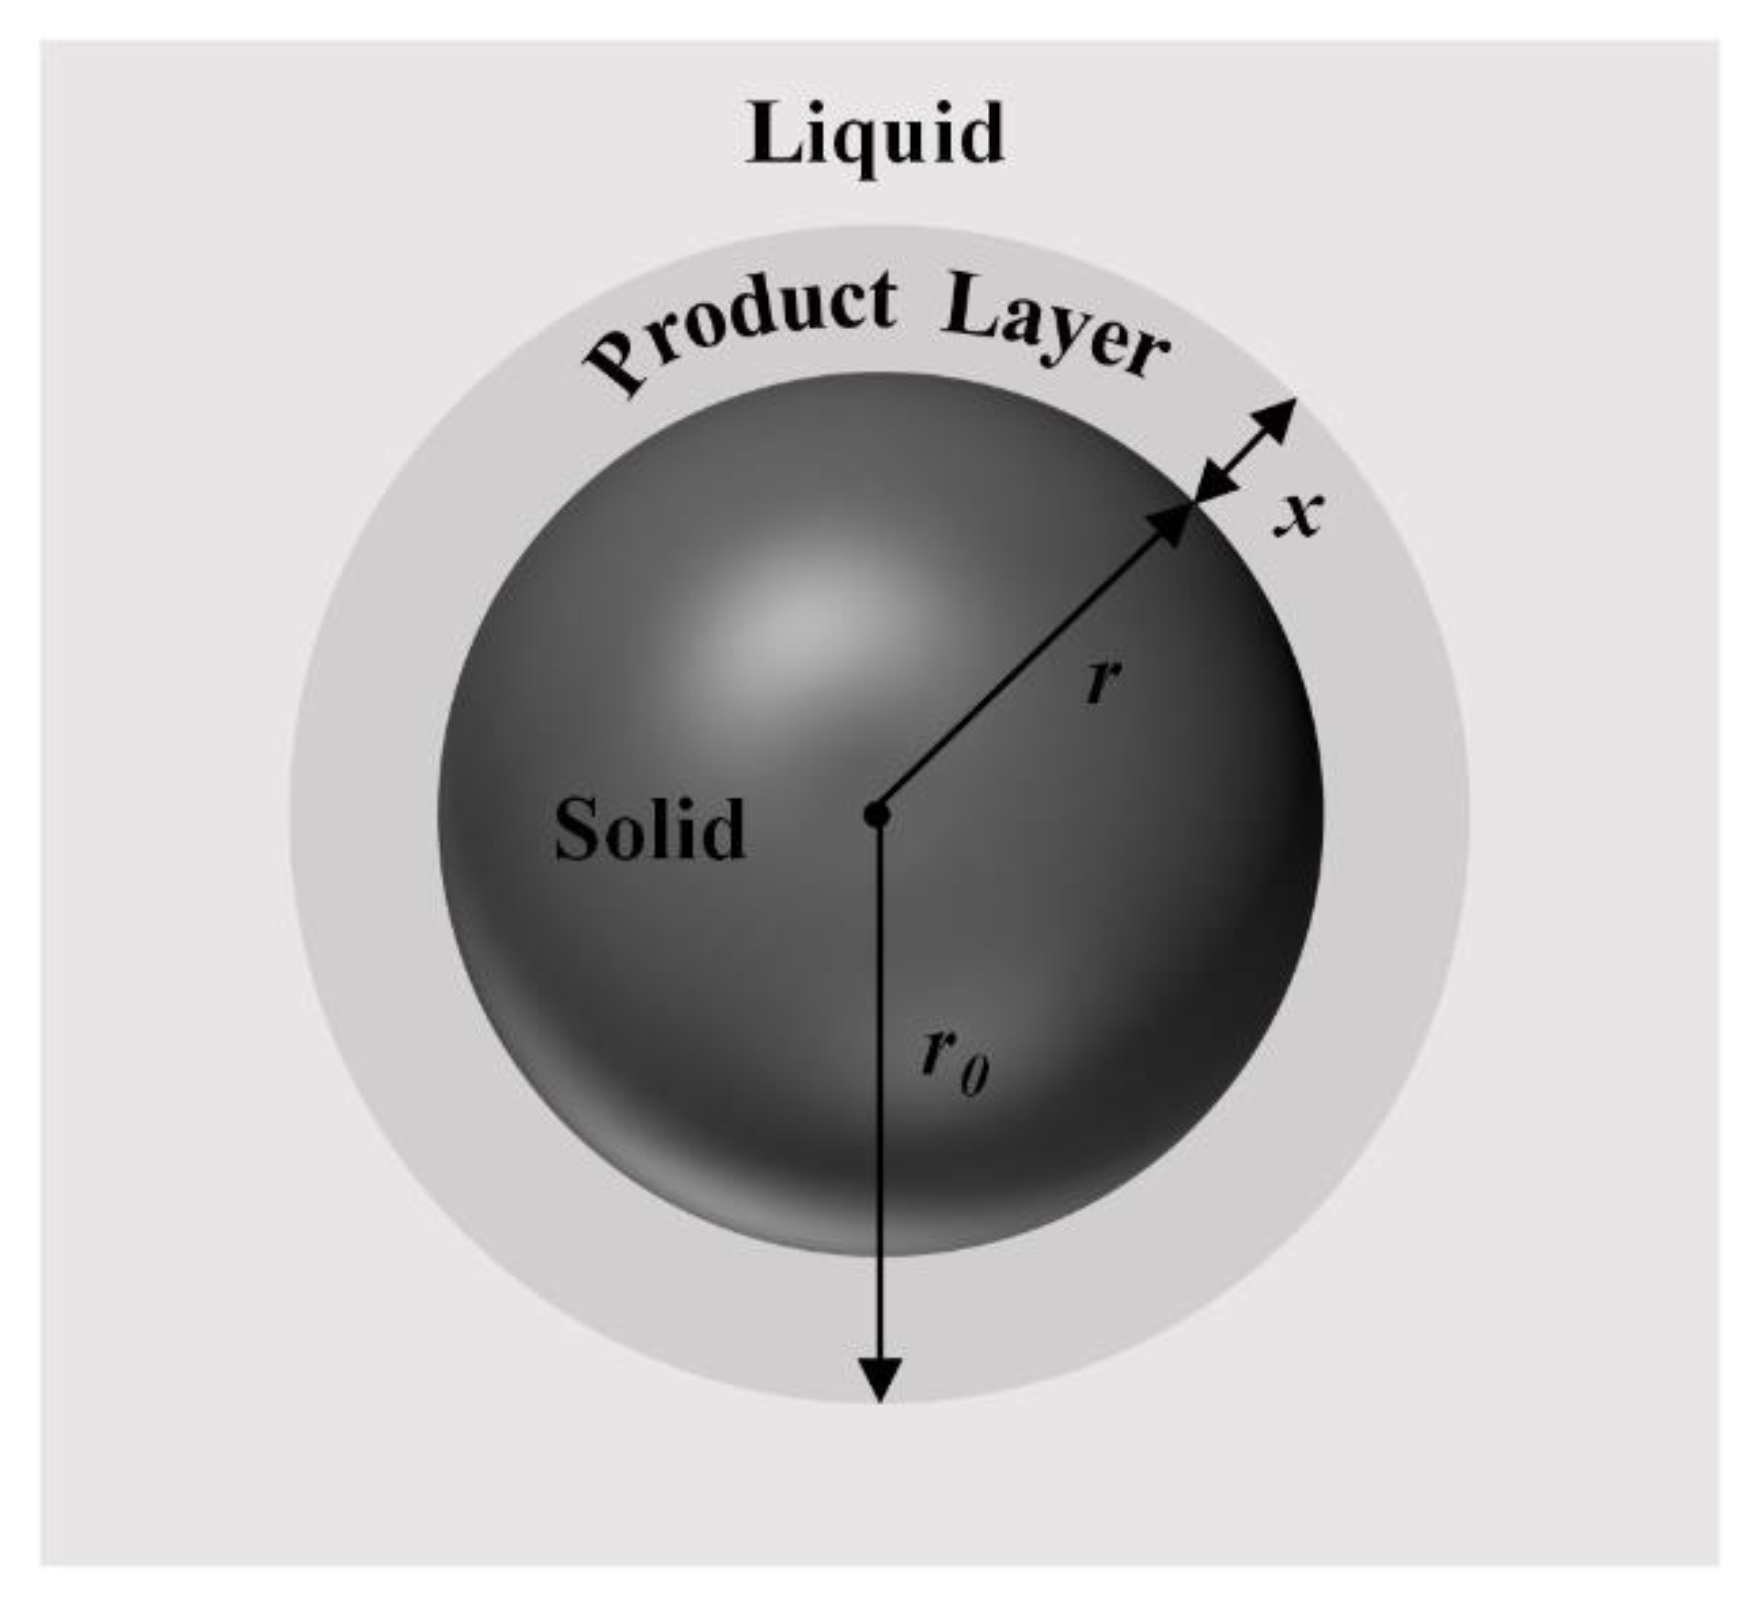
Figure 10a–c were analyzed by fitting the data to standard kinetic models. Since the leaching rates of REEs reached equilibrium or decreased after one hour, the kinetic analyses were only carried out within one hour of leaching time. Initially, the shrinking core model (SCM) for spherical particles (
Figure 11), a common model used to describe multiphase solid–liquid reaction processes, was used to fit the data [
38,
39]. According to the model, if the reaction rate is controlled by the surface chemical reaction, the integral rate equation can be expressed as follows:
where
kc represents the surface chemical rate constant, α the leaching rate in decimal, and
t the reaction time. Alternatively, if the reaction rate is controlled by diffusion through the product layer, the integral rate expression is as follow:
where
ksd represents the pore diffusion rate constant.
The rate constants and the corresponding adjusted coefficient of determination (R
2adj) values for the SCM of chemical reaction control and diffusion control based on spherical particles are shown in
Table 3 and
Table 4, respectively. As indicated by the R
2adj values, the leaching of REEs from PG was more precisely fitted by the diffusion model relative to the chemical reaction model. Consequently, the data suggest that the leaching kinetics of REEs from PG were not controlled by the surface chemical reaction but rather by diffusion through the product layer.
Figure 3 shows that the PG was mainly long rhombic flakes. Thus, we consider whether the cylindrical model can better illustrate the leaching kinetics of REEs from PG than the spherical model.
If the reaction rate is controlled by diffusion through the product layer of cylindrical particles, the integral rate expression is as follows [
40]:
where
kcd represents the pore diffusion rate constant for the SCM of cylindrical particles.
Table 5 shows the rate constants and the corresponding R
2adj values for the shrinking core diffusion model based on cylindrical particles. By comparing
Table 4 and
Table 5, we can see that the R
2adj values based on cylindrical particles were all greater than those based on spherical particles for the linear fitting of REE leaching from PG. This indicates that the leaching of REEs from the PG can be more accurately fitted by the cylindrical shrinking core diffusion model than the spherical model.
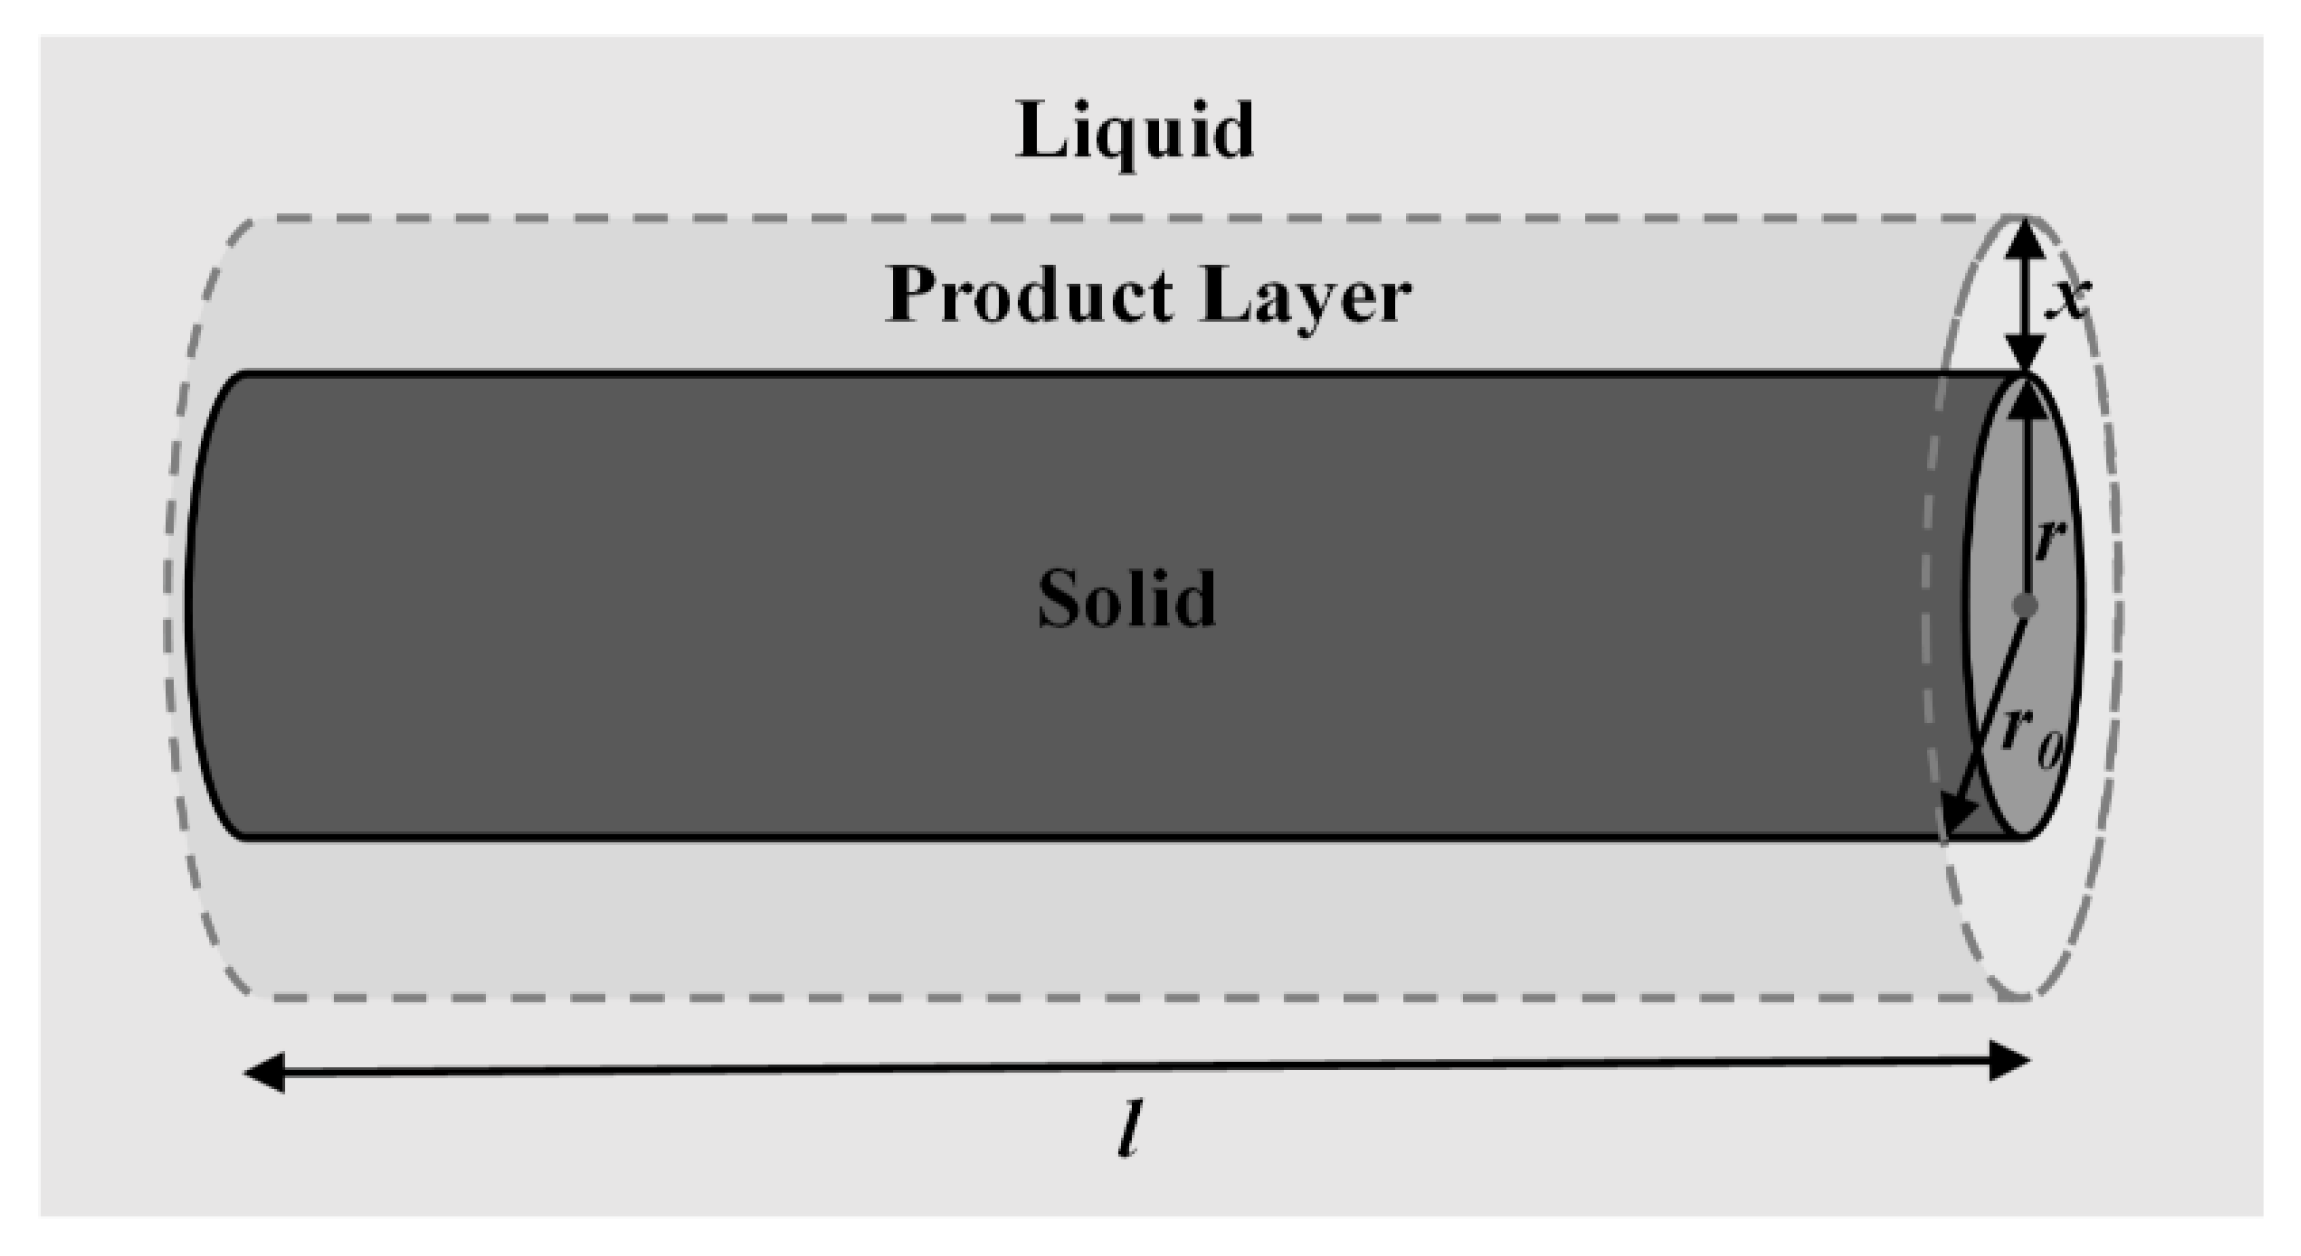
To elaborate the kinetics of fluid-particle reaction more precisely, on the basis of diffusion control, we also considered the influence of interfacial transfer on the reaction rate [
40,
41], and deduced a new rate expression of SCM for the dissolution reaction of a cylindrical solid particle (
Figure 12) under control of the interfacial transfer and diffusion across the product layer. The derivation process is as follows.
Assuming that the ends of the cylinder are inactive [
40] and the original radius of the particle equals
r0, after reacting for time
t, the radius is decreased to
r and the solid-liquid interface moves inwards a distance
x (namely
x =
r0 −
r). Based on the description, the fraction of unreacted solid on a volume basis is:
Integrating the Equation (11) gives,
Moreover, it is assumed that the diffusion across the product layer follows the parabolic diffusion law, which defines that the rate of reaction is inversely proportional to the product layer thickness:
where
x is the thickness of the product layer,
D the diffusion coefficient (slowest transport),
Vm the volume of the product layer formed from 1 mol of the slowest penetrating component, and
C0 the concentration of the penetrating species at the surface. When the diffusion across the product layer and the transfer across the contacting surface both control the rate,
where
km = 2π
DVmC0l. Since both ends of the cylinder are inactive and thus do not diffuse,
l is constant during the reaction process.
Substituting for
x,
dx, and
r gives,
Integrating the above equation gives,
where
Km = km/
r0, and represents the apparent rate constant.
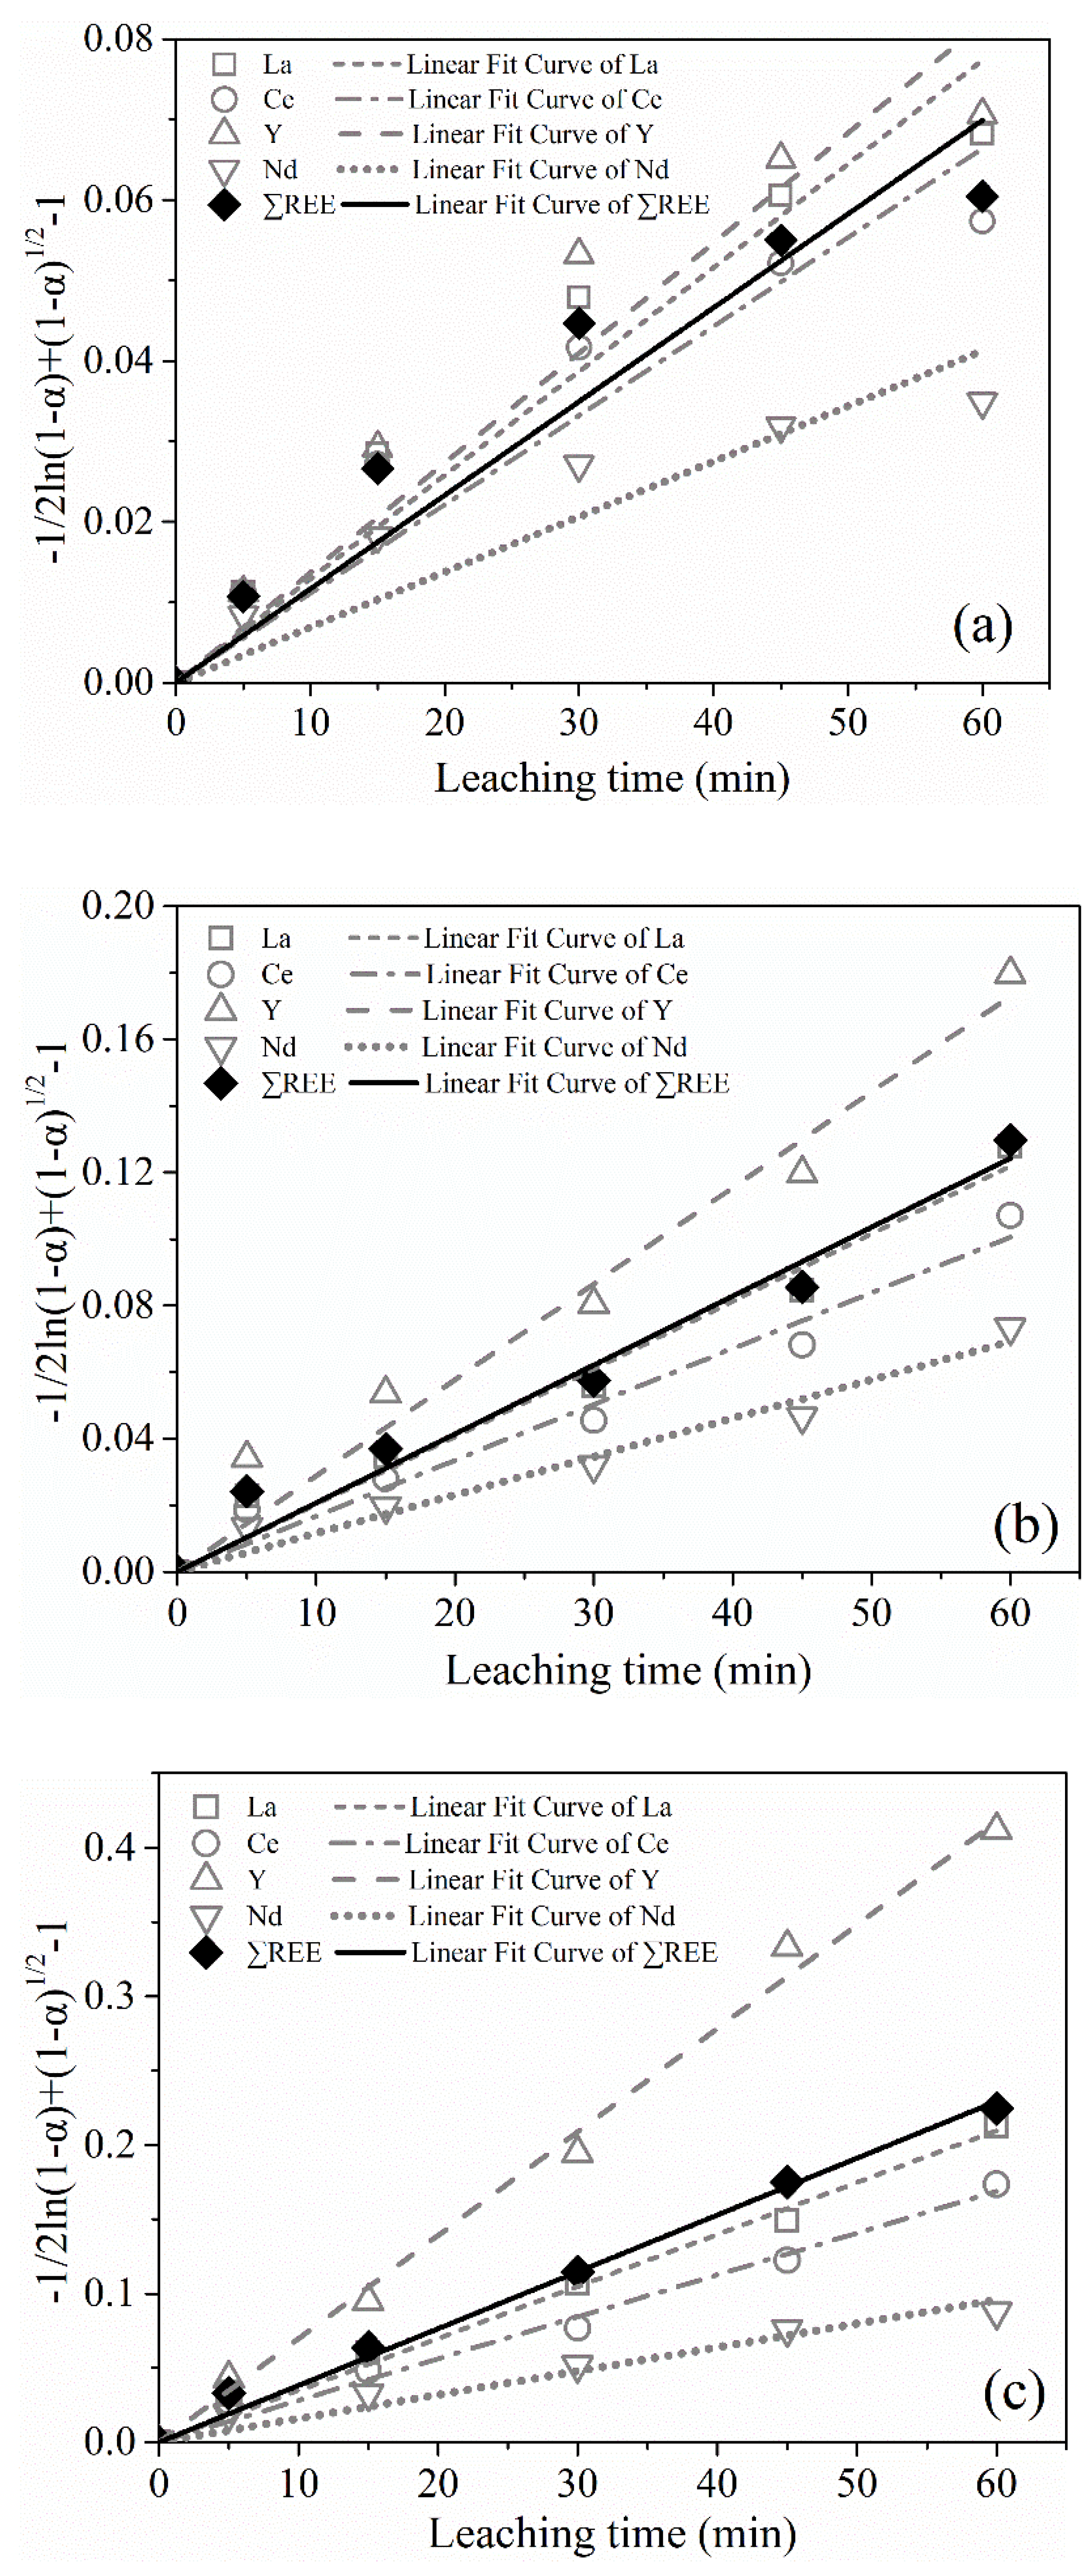
The
Km values of leaching process at different temperatures were calculated as shown in
Table 6 from the slopes of the straight lines given in
Figure 13a–c. As shown in
Table 6, the new variant model fitted the leaching data better than the inner diffusion model, especially for the leaching at 60 °C and 80 °C with R
2adj basically more than 0.98. Therefore, the leaching rates of REEs from the PG were controlled by the interfacial transfer and diffusion across the product layer.
3.4. Leaching Apparent Activation Energy
The apparent activation energy is determined based on the Arrhenius equation, as follows Equations (21) and (22).
where
Km is the apparent rate constant for the SCM of interfacial transfer and diffusion control based on cylindrical particles (min
−1),
A the preexponential factor,
T the reaction temperature (K),
R the universal gas constant (8.314 J·mol
−1·K
−1), and
Ea is the activation energy (kJ·mol
−1).
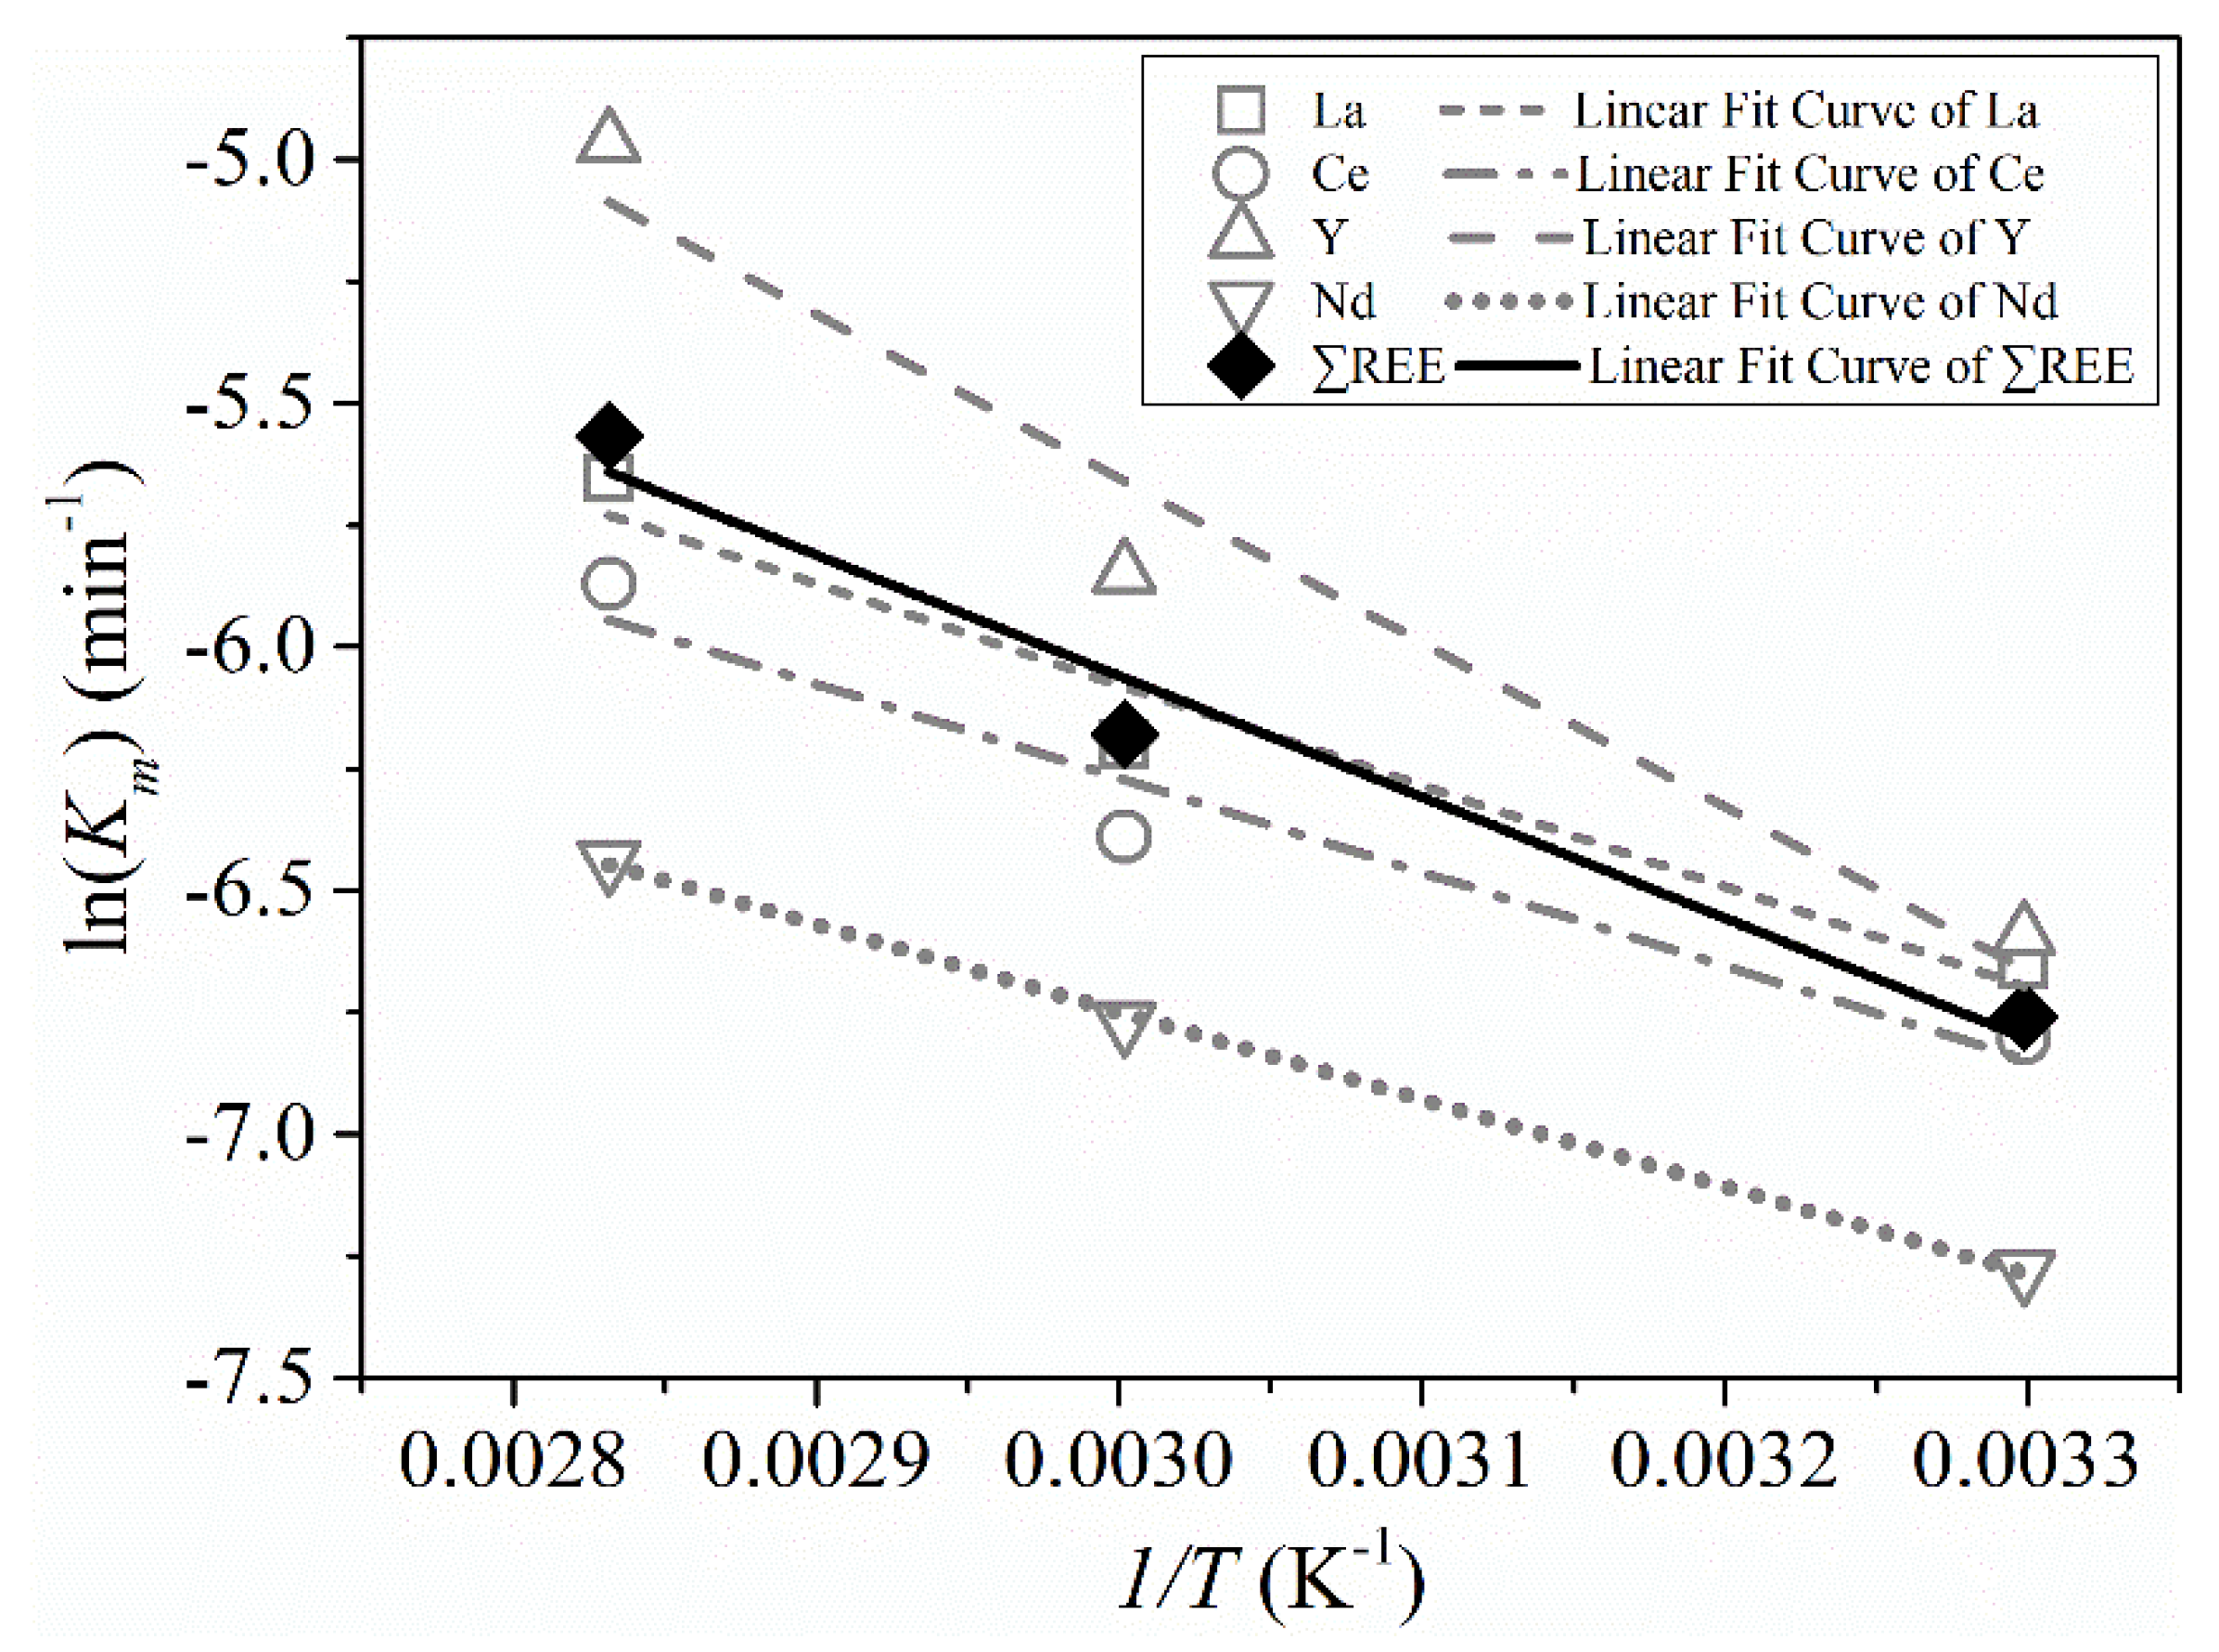
Figure 14 presents the linear Arrhenius plots of ln(
Km) vs. 1/T with the slopes (
k slope), and the related parameters of the linear Arrhenius plots are shown in
Table 7. According to Equation (23), the apparent activation energy of La, Ce, Y, and Nd leaching from PG was calculated at 17.19, 16.04, 22.41, and 14.90 kJ·mol
−1, respectively, as shown in
Table 7. In addition, the activation energy for the ∑REE leaching was determined to be 20.65 kJ·mol
−1. In general, chemically-controlled reactions have an
Ea > 40 kJ·mol
−1, while diffusion-controlled reactions have a lower
Ea (<40 kJ·mol
−1) [
42,
43]. Furthermore, other scholars [
44,
45,
46] have also obtained
Ea values similar to this study during the leaching process under the control of interfacial transfer and diffusion across the product layer. Therefore, it is determined that the reaction rates of leaching REEs from the PG were controlled by the interfacial transfer and diffusion across the product layer.


 ,
, 


