Article

Corded Ware and Contemporary Hunter-Gatherer Pottery from Southeast Lithuania: Technological Insights through Geochemical and Mineralogical Approaches

by
Eglė Šatavičė
1,2,*,
Gražina Skridlaitė
3,4,
Inga Grigoravičiūtė-Puronienė
5,
Aivaras Kareiva
5,
Aušra Selskienė
6,
Sergej Suzdalev
7,
Gailė Žalūdienė
3 and
Ričardas Taraškevičius
3,7
1
Faculty of History, Vilnius University, Universiteto 7, LT-01513 Vilnius, Lithuania
2
Cultural Heritage Salvage Group, Piliakalnio 10, LT-06229 Vilnius, Lithuania
3
Nature Research Centre, Akademijos 2, LT-08412 Vilnius, Lithuania
4
Institute of Geosciences, Vilnius University, M.K. Čiurlionio 21/27, LT-03101 Vilnius, Lithuania
5
Institute of Chemistry, Vilnius University, Naugarduko 24, LT-03225 Vilnius, Lithuania
6
Department of Characterisation of Materials Structure, Center for Physical Sciences and Technology, Saulėtekio 3, LT-10257 Vilnius, Lithuania
7
Marine Research Institute, Klaipėda University, Universiteto 17, LT-92294 Klaipėda, Lithuania
*
Author to whom correspondence should be addressed.
Minerals 2022, 12(8), 1006; https://doi.org/10.3390/min12081006
Submission received: 23 June 2022 / Revised: 7 August 2022 / Accepted: 8 August 2022 / Published: 10 August 2022

Abstract

:
A geochemical and mineralogical approach was used to analyze 3rd millennium BCE pottery from Southeast Lithuania that is attributed to the foreign Corded Ware Culture and local hunter-gatherers. SEM-EDS, XRF, XRD, and FTIR were used to study the peculiarities of the pottery and to develop hypotheses about the raw material and technology choices present. The amounts of ten major elements in the bulk and clay matrix compositions (XRF, SEM-EDS) and eleven trace analytes in the bulk compositions (XRF) were compared with the Clarke values and tested to highlight the significance (Mann–Whitney U and Wilcoxon Matched Pairs Tests) of the differences in the elemental quantities between the clay matrix and bulk compositions, and between the lighter and darker clay matrixes. These also revealed the advantage of Ward’s clustering method using the City-block distance of bulk compositions as a tool for inter-correlating ceramics in attributing them to specific communities and locations. The XRD, FTIR, and SEM-EDS mineralogical analyses indicated a predominance of iron-rich illite clay, quartz, and alkali feldspar, in addition to very low to medium firing temperatures. All of the pottery samples consisted of hydromicaceous clay from local Quaternary glacial sediments that contain weathered granitoid fragments.

1. Introduction

The phenomenon of certain Corded Ware pottery, which spread during the 3rd millennium BCE in a huge part of Central, Eastern, and Northern Europe, has been intensely discussed. Corded Ware sites (2800–2400/2000 BCE) are characterized by single burials of males in a crouched position, polished stone battle axes, beakers decorated with cord impressions, and short-wave molded pots. The transmission of Corded Ware traditions is associated with massive migrations and important demographical, social, and economical changes [1,2,3,4,5,6,7]. However, most discussions, except for a few petrographic and geochemical studies [8,9,10,11,12], are only based on stylistic description and typological classification of the pottery without any analysis of the ceramic paste recipes or any technological insights.
The Corded Ware spatial distribution area also includes Southeast Lithuania (Figure 1a). In Lithuania, Corded Ware communities are interpreted as the first pastoralists and bearers of agricultural traditions [6]. However, the classical Corded Ware typical for Central and Northern Europe [9,10,11,12,13] is rare in this region, where diverse non-typical cord-decorated pottery and, until the late 2nd millennium BCE, the strong influence and continuity of the indigenous hunter-gatherer traditions, are seen more often [14,15]. The majority of the Late Neolithic (3000–1800 BCE) settlements in Southeast Lithuania are found in the Dubičiai-Rudnia microregion (Varėna District) (Figure 1b) where different communities settled multiple times beside the lakes and rivers. Because the acidic sandy soil there causes any organic material to decay, the surviving small potsherds are the only representatives of the heritage of both the first farmer and the hunter-gatherer communities. Therefore, the aim of this study was to use a geochemical and mineralogical approach using scanning electron microscopy with energy dispersive spectroscopy (SEM-EDS), X-ray fluorescence (XRF), X-ray diffraction (XRD), and Fourier transform infrared spectroscopy (FTIR) data to investigate the technological choices made for the Corded Ware and contemporary hunter-gatherer pottery and to evaluate the transformations resulting from the encounter of different traditions within the study area.

2. Study Area, Materials, and Methods

2.1. Study Area

The Dubičiai-Rudnia microregion is located next to the Lithuanian-Belorussian border in Southeast Lithuania (Figure 1b), an area characterized by Quaternary glacial sediments [16]. The base layer formed during the Saalian (Medininkai) glacial period was overprinted by the last Weichselian (Nemunas) glaciation. The entire region is covered by sandy-gravelly layers deposited by glacial meltwater [17]. Clay can be found under a thick layer of glaciolacustrine, glaciofluvial, and aeolian sand. Morainic till and silt layers appear on the surface only in a few places, mostly near rivers or former lakes. The shores of some of the region’s paleolakes had glaciolacustrine layers of clay, but it is mostly found only in deep boreholes [18].
Although around 80 Neolithic settlements are known in the Dubičiai–Rudnia microregion, only a few have been investigated [19]. During 1980–1985, three multiperiod sites—1064 m2 at Margiai [20], 808 m2 at Barzdis [21], and 636 m2 at Šakės [22]—were excavated by Dr Rimantienė. The settlements contained various Stone Age and Early Metal period hearths together with stratigraphically mixed ceramics and flint assemblages that can be classified only typologically.
The Margiai (54°2′24″ N, 24°41′42″ E) and Barzdis (54°1′59″ N, 24°42′32″ E) settlements are located near former Lake Dūba on a glaciolacustrine plain covered by fine sand (Figure 1b). The shore sites meant that clay could be of glaciolacustrine origin exposed at surface at that time. The Margiai site yielded various cord-decorated and hunter-gatherer pottery dating to the 3rd millennium BCE [20], but the Barzdis site, despite its similar environmental conditions, had only 3rd-millennium BCE hunter-gatherer ceramics [21].
The Šakės settlement (54°3′25″ N, 24°38′9″ E) near the River Ūla-Pelesa may have clay layers exposed at the riverbanks instead of alluvial fine sand topsoil (Figure 1b). The settlement yielded ceramics from the first half of the 3rd-millennium BCE hunter-gatherer communities and late 3rd-millennium BCE Corded Ware [22].

2.2. Materials

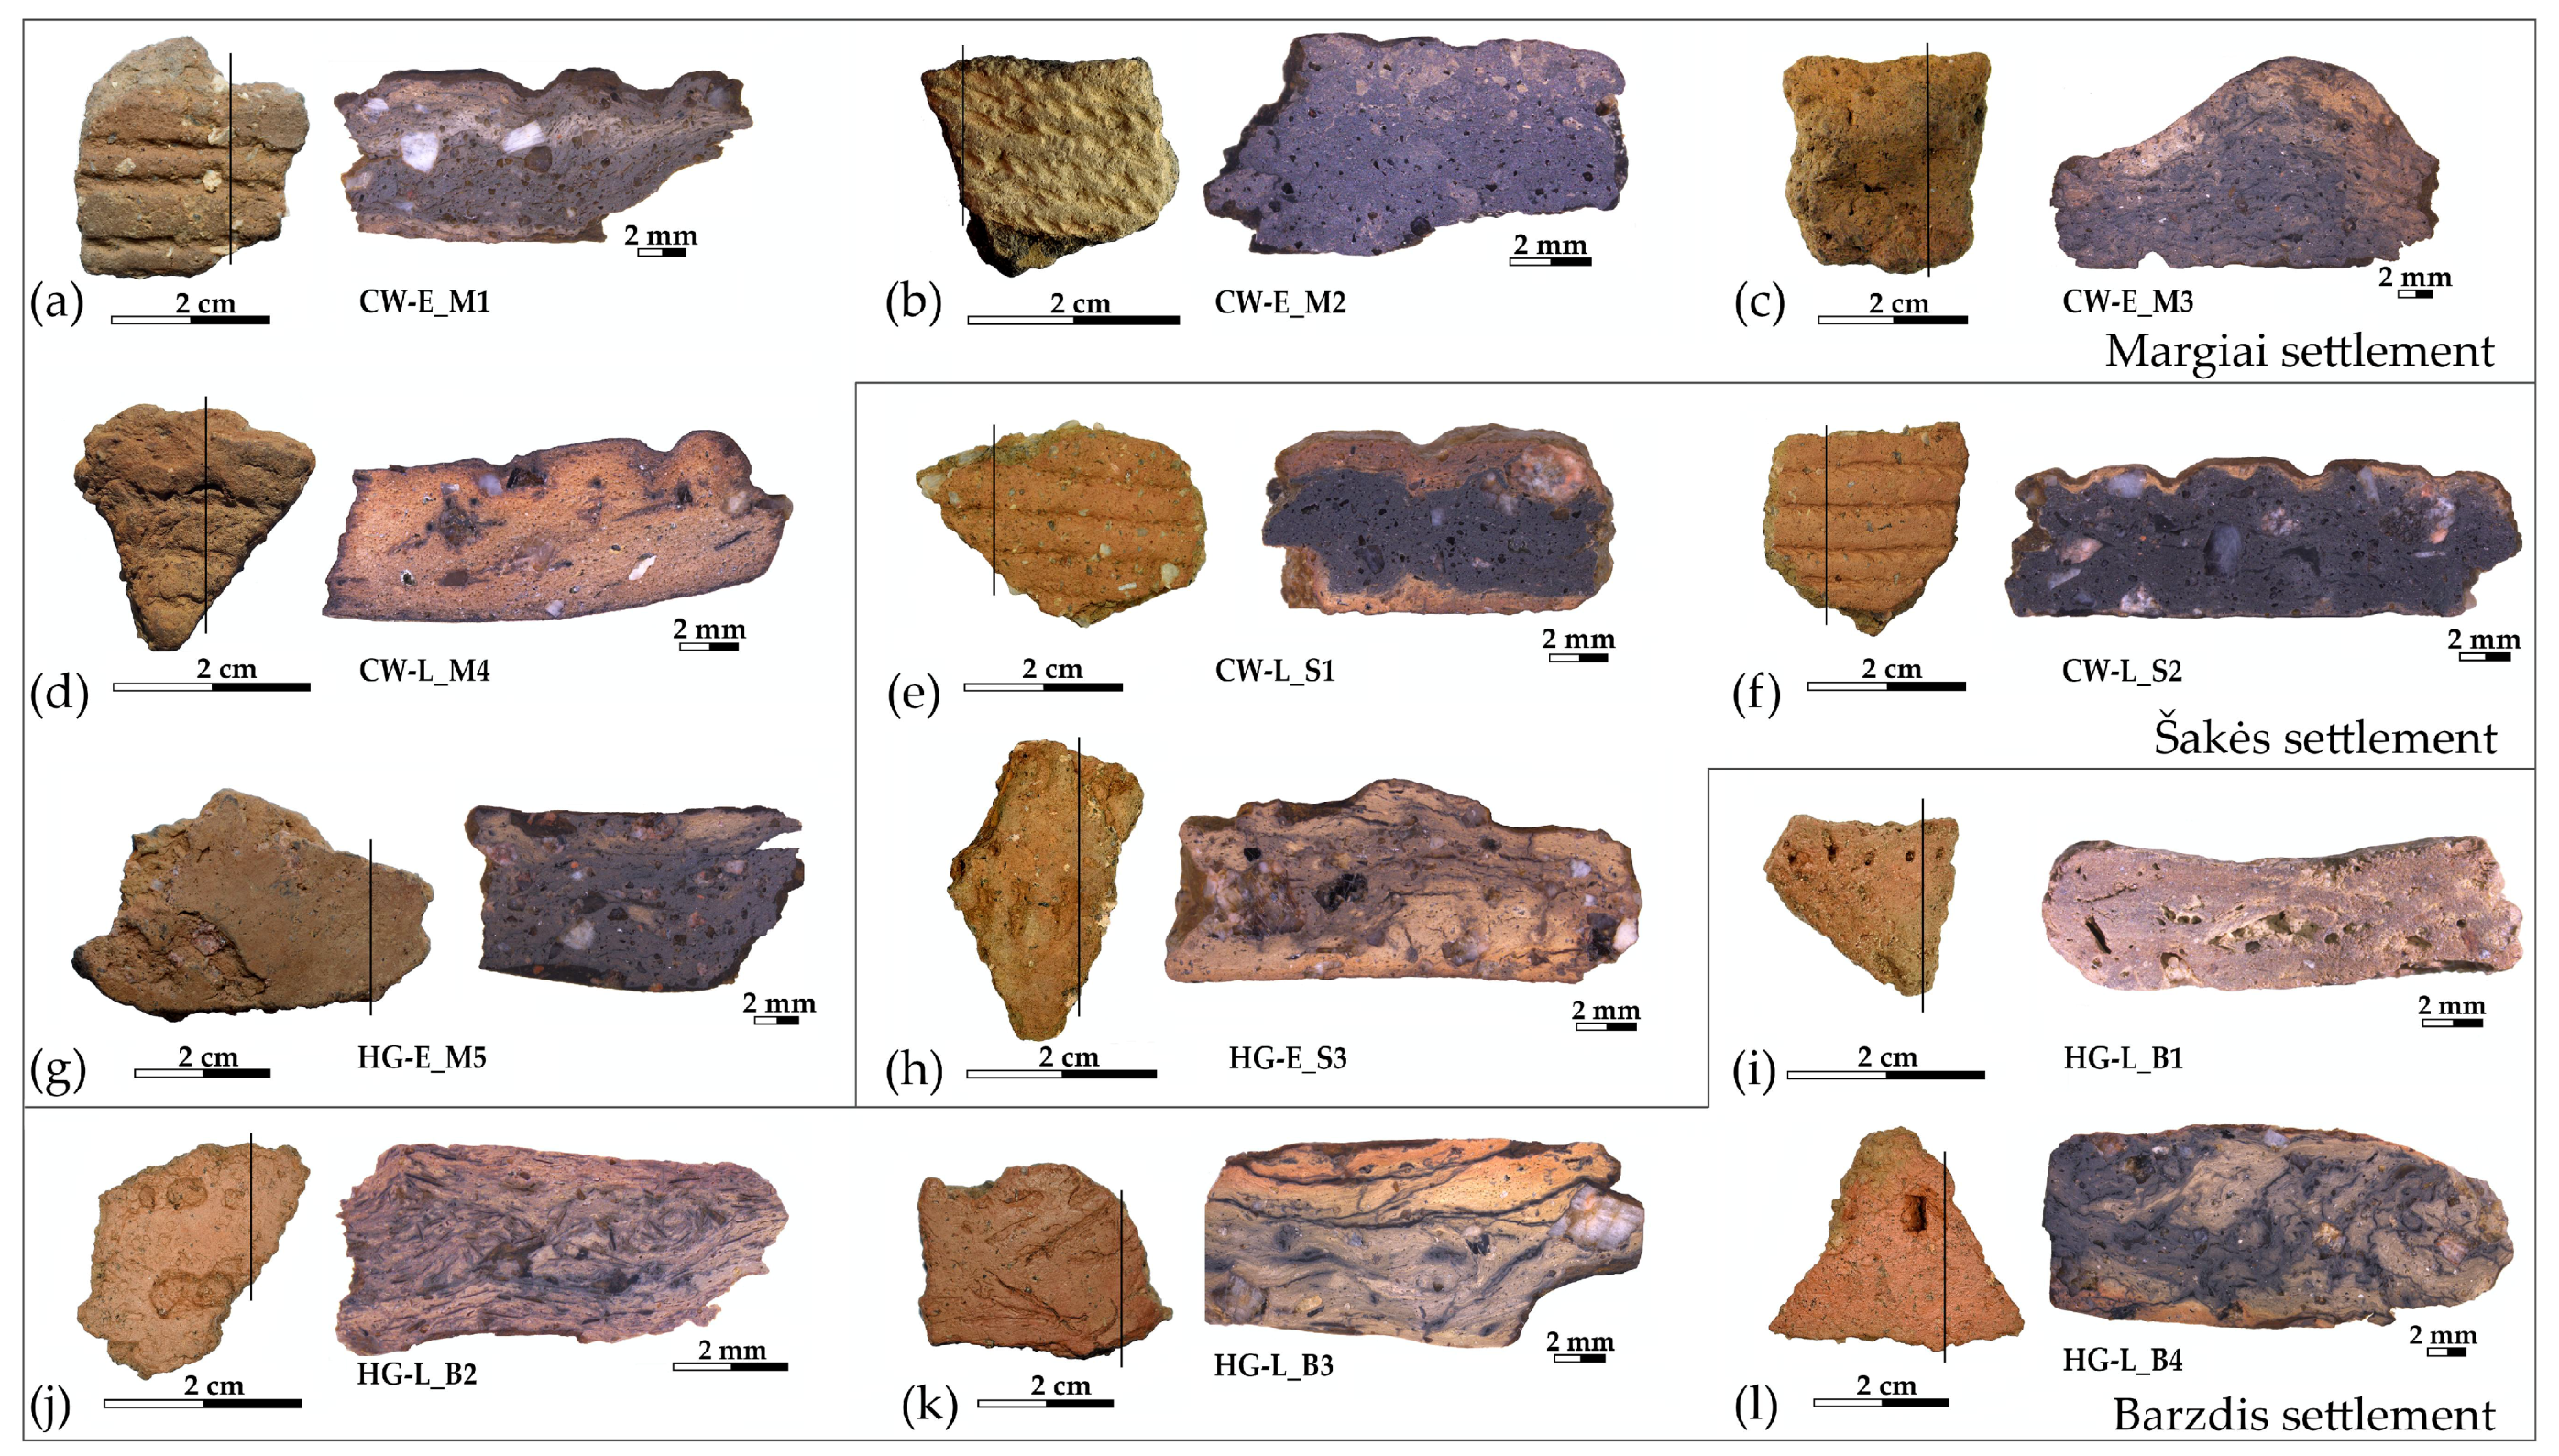
Twelve potsherds were selected from the over 800 potsherds the National Museum of Lithuania has preserved from the Margiai, Šakės, and Barzdis settlements: six of various cord-decorated pottery assigned to the first farming communities and six from the indigenous hunter-gatherer heritage, which were chosen as representatives to compare the microstructure, and geochemical and mineralogical composition (Figure 2a–l).
All the samples were found at a depth of 10–30 cm in sandy soil [20,21,22] and were typologically classified to the early period (first half of the 3rd millennium BCE), which is characterized by exceptional ceramic features, and the late period (second half of 3rd millennium BCE), which has an amalgamation of various cultural traditions. Detailed information is presented in Table 1.
The studied potsherds were too small to determine the vessel’s exact height and rim diameter. The external and internal vessel surfaces had a fairly homogenous color—light brown or orange—and had been smoothed [23]. Samples HG-E_M5, HG-E_S3, and CW-L_S1 had a glossy surface (Figure 2e,g,h), which archaeologists believe to have been formed by a clay slip coating or burnishing [15].
The pottery samples varied in thickness from 5.08 to 6.36 mm, for a thin-walled cup or Corded Ware beaker, to 7.20–11.73 mm for cooking and storage pots. Their cores varied in color from light brown or marble to very black (Figure 2a–l), and displayed two types of voids: holes from straw temper and various naturally occurring organic impurities, in addition to elongated planar voids formed by shrinkage during the clay’s drying or firing [24,25]. The elongated planar voids and the coil joints run obliquely or parallel to the vessel walls, suggesting that the vessels were formed by coiling [26,27], but the cup (Figure 2i) and beakers (Figure 2b,d) could have been made by pinching [8,27].
The early cord-decorated potsherds were only found at the Margiai settlement. Because cord-decorated pottery from the Globular Amphora Culture in Southeast Lithuanian till is now usually assigned to Corded Ware [20], sample CW-E_M1 from the Globular Amphora Culture (Figure 2a) was selected intentionally in order to analyze the differences in early cord-decorated pottery. The Globular Amphora Culture (3400–2700 BCE), which predates the Central European Corded Ware Culture, is characterized by globular pots with two or four handles. Corded Ware and Globular Amphora Culture communities share similar pottery ornamentation and subsistence economy traditions, but the genetic data reveals different ancestries [6].
Samples CW-E_M2 and CW-E_M3 represent typical vessels from the classic Corded Ware Culture: a beaker and a short-wave molded pot (Figure 2b,c) that were made, as is characteristic for this culture, from black matrix clay with light clay inclusions that are usually interpreted as grog (crushed pottery temper) [8,9,10,11,12].
The two samples of late Corded Ware beakers (CW-L_S1 and CW-L_S2) (Figure 2e,f), which were found in a 1 m2 concentration of similar cord-decorated sherds at the Šakės settlement [22], were selected in order to analyze possible technological differences in the pottery produced by the same community.
Samples HG-E_M5 and HG-E_S3 (Figure 2g,h) represent classic Neman Culture pottery with typical ornamentation and surface treatments [15]. Meanwhile, the late hunter-gatherer pottery with straw (Figure 2i,j) and mineral temper (Figure 2k,l) from the Barzdis settlement best reflects the diversity and synthesis of different cultural traditions.

2.3. Methods

Twelve potsherds were analyzed using X-ray fluorescence (XRF), X-ray diffraction (XRD), and Fourier transform infrared spectroscopy (FTIR) to obtain the bulk geochemical and mineralogical characteristics of the ceramic paste, and using scanning electron microscopy with energy dispersive spectroscopy (SEM-EDS) to evaluate the microstructure and the geochemical variability of the clay matrix. A quantity of 1.50 g of each pottery sample was pulverized using an agate mortar and pestle. Considering that ceramic heterogeneity can be influenced by natural and cultural factors [28,29], and by post-depositional alterations [30,31], XRF was employed to obtain bulk chemical signatures for the pottery samples [32]. Therefore, a 20 mm diameter pressed pellet consisting of 1.25 g of ceramic powder bound with 0.28 g of Licowax was made from each sample. The pellets were analyzed at the Marine Research Institute at Klaipėda University using the energy-dispersive XRF equipment Xepos HE (SPECTRO Analytical Instruments GmbH, Kleve, Germany) and the TurboQuant (TQ) for the pressed pellets calibration module to determine the contents of ten crustal major elements Al, Ca, Fe, K, Mg, Mn, Na, P, Si, Ti, and eleven trace elements Cr, Cu, Hf, Nb, Ni, Rb, S, Sr, V, Zn, and Zr. The TQ method combines different procedures: calculation of the mass attenuation coefficient, using the extended Compton model, and final calibration based on the fundamental parameter’s method. Advantages of polarization and the TQ calibration method were described previously [33]. The last modification of the TQ method, intended for Xepos HE, is offered by the manufacturer for samples with various matrices. More detailed information about of the analysis quality and lower limits of detection analytes is given in [34,35]. In our study, each side of the pressed pellet was examined 3 times. The medians of relative standard deviation values of measurements of all selected analytes were <3%. Quality control and improvement of laboratory results was performed by participation in the ‘International Soil-Analytical exchange’ (ISE) program organized by Wageningen University [36,37]. Materials of the ISE program (Wageningen University, period 2010–2017) and reference standard SRM 679 (Brick Clay) were prepared pari passu and used for the recalibration of the real total contents of the selected analytes. The amounts of crustal major elements were recalculated by stoichiometry as oxides using Oxford INCA software and are reported as average weight percentage values of oxides.
Microsoft Excel (Office 365, Microsoft, Redmond, WA, USA) was used to calculate the main statistical parameters of elemental content in the pottery samples, and STATISTICA software (Version 9.0, StatSoft Inc., Tulsa, OK, USA) was used to perform the following algorithms: (1) non-parametric Spearman R correlation analysis, hierarchical cluster analysis for variables (analytes) by Ward’s method using 1-Spearman R distance measure, and for cases by Ward’s method using City-block distance; (2) testing of different non-parametric hypotheses by Mann–Whitney U-test (U’ test), Wilcoxon Matched Pairs (MP’ test) and Friedman ANOVA test. The U’ test helped to reveal significant differences in the elemental contents between two selected independent data sets, whereas the MP’ test and Friedman ANOVA test were used to identify significant differences for dependent sets. XRF and hierarchical cluster analysis methods were previously applied for tracing sources of clays’ raw materials for archaeological and modern bricks [38].
To determine the mineral phases and the firing temperatures [39,40,41], the Vilnius University Institute of Chemistry performed XRD analysis using a diffractometer Rigaku MiniFlex II with Cu Kα1 radiation of λ = 1.5406 Å. The powdered samples were homogeneously dispersed using ethanol on a monocrystalline silicon slide which served as a sample holder. The diffraction patterns were recorded at 2θ angles in a 10–60° range with a 0.005° step size and a 2 s/step measuring time. The quantification of the crystalline phases was conducted using the ICDD Powder Diffraction File and Match! software (Version 3.0, Crystal Impact GbR, Bonn, Germany).
FTIR spectroscopy was employed at the Vilnius University Institute of Chemistry to detect the presence of crystalline and amorphous phases [42] and to determine the firing temperatures [43,44,45,46,47]. The FTIR analysis of the ceramic powders was conducted using a Bruker Alpha FTIR spectrometer with a Platinum ATR single reflection diamond module by placing the sample on a diamond ATR cell and pressing. The FTIR spectra of the powdered samples were recorded in the mid-IR frequency region at 4000–400 cm−1, at 4 cm−1 resolution in 32 repetitive scans. The spectra were analyzed using peak fitting and band intensity measurement with Spectragryph v.1.2.15 software [48]. To allow comparison, all the FTIR absorbance spectra were normalized to 1 a.u. at the maximum absorption peak (at around 423 cm−1).
The Department of Characterisation of Materials Structure at the Center for Physical Sciences and Technology prepared polished resin-mounted cross-sections (Figure 2) and analyzed them according to the protocol described by Holmqvist et al. [9]. All of the potsherds were cut vertically, mounted in epoxy resin blocks (except sample HG-L_B1 due to its small size), and the cut surface polished. The polished resin-mounted cross-sections were coated with carbon to prevent electrostatic charging, and geochemical and microstructural analyses were then performed using a Helios Nanolab 650 station (FEI, Netherlands) with an X-ray detector X-Max and the INCA Energy EDS software (Oxford Instruments) (SEM-EDS). Images were taken using a secondary electron detector (SEM SE). The content of the main crustal analytes (Al2O3, CaO, Fe2O3, K2O, MgO, MnO, Na2O, P2O5, SiO2, TiO2) of the light (light grey, yellow to red) and dark (dark grey, brown to black) clay matrixes was measured in various 200 × 150 µm sized areas by applying 4–5 measurements in each matrix type (SEM-EDS), and average values for the clay matrix type of each sample were obtained. The geochemical data allowed us to observe the differences between the light and dark clay matrix, but did not answer some questions about the technological choices and the nature of the different clay matrix textures visible in the SEM SE images.
In order to provide an opportunity for clarification, additional mineralogical study was carried out. The Open Access Centre of the Nature Research Centre in Vilnius determined the mineralogical chemistry of the same eleven (except sample HG-L_B1) carbon-coated, polished resin-mounted cross-sections using a Quanta 250 instrument with an X-ray detector X-Max, an INCA X-stream digital pulse processor, and INCA Energy EDS software (Oxford Instruments) (SEM-EDS). Mineral formulas were calculated using a GabbroSoft spreadsheet [49]. Images were taken using a backscattered electron detector (SEM BSE).
A textural analysis of ceramic material [50,51,52] was conducted by comparing stereomicrographs of the polished resin-mounted cross-sections to the SEM SE and BSE images. A quantitative and qualitative evaluation of the ceramic microstructure, voids, and aplastic inclusions [24,25] was performed via digital image analysis using JMicroVision v.1.3.4 software [53]. The mineral grain size was described using the Udden–Wentworth scale [54]. The study used Kretz abbreviations for the mineral names [55].

3. Results and Discussion

3.1. Main Geochemical Peculiarities of the Pottery

The selected statistical characteristics of the bulk (using XRD) and clay matrix (using SEM-EDS) geochemical compositions are arranged by descending Clarke values (Cv), i.e., the mean contents for the upper continental crust [56,57] (Table S1). As described earlier [38], such a comparison of analytes’ contents is useful for an instant examination of the essential geochemical features of a studied object (in this case ceramics) against the overall background of the Earth’s geochemical structure. Thus, compared to the Cv, a distinctive feature of the complete data set for the 12 samples is a marked increase in P: the bulk composition and the clay matrix of the pottery is enriched with phosphorus (median values), of 6.7 and 7.4 times more, respectively. The material of the pottery samples is slightly enriched with K, Ti, Fe, and Al: 1.4- and 1.7-times higher content being observed for K in the bulk composition and clay matrix, respectively; Ti is characterized by 1.3- and 1.7-times higher content; Fe by 1.2- and 1.9-times; and Al by 1.0- and 1.4-times. However, compared to the Cv, the pottery samples are characterized by lower amounts of Ca, Na, and Si: Ca—6.7 times lower in bulk composition and 5.4 lower in the clay matrix; Na—5.9 and 11.4 times; and Si—1.1 and 1.2 times, respectively.
Mg and Mn show different accumulation trends. The amount of Mg in the bulk composition of the pottery is almost 1.5 times lower compared to the upper continental crust, whereas in the clay matrix it is almost 1.1 times higher, while Mn is roughly 1.4 times higher and roughly 1.8 times lower, respectively. The median and mean values of all the studied trace elements, except Cr and Hf, in the bulk composition of the pottery samples are, in general, lower than the Cv. Both the bulk composition and clay matrix have the most variable amounts of Mn and P, with coefficient of variation (CV, %) values exceeding 47%. Ti content is more variable in the clay matrix with a CV value reaching 40.4%, but this is only 11.8% in the bulk composition, whereas Ca, Na, Mg, Sr, Rb, Zn, and Ni are characterized by a 25% or higher CV value. The variability in the analyte content for most of the crustal major elements (7 of the 10, i.e., Si, Al, Fe, Na, K, Mg, and P) in the bulk composition of the pottery is higher than in the clay matrix. The most stable analyte is Si.
The areas of darker (dark grey, dark brown, or black) clay matrix are 1.5 times wider than the lighter ones (shades from light grey and yellow to red), the ratio of such areas in the potsherds being 59.9 and 40.1% (Tables S2 and S3). This predominant part is enriched by 1.1 times only for Na and Si, while lighter areas are enriched by 1.1 times for Ti, 1.4 times for Mn, and by even 2.0 times for P. The amounts of Mn and P are mostly variable in both areas. The CV values reach 49–66% for P, and even 95–96% for Mn.
The contents of Ti, P, Fe, and Mg are more variable (with a difference of at least 5% in the CV value) in the lighter clay matrix compared to the darker one, whereas those of Na and Ca are more variable in the darker one.

3.2. Elemental Clusters of Selected Data Sets

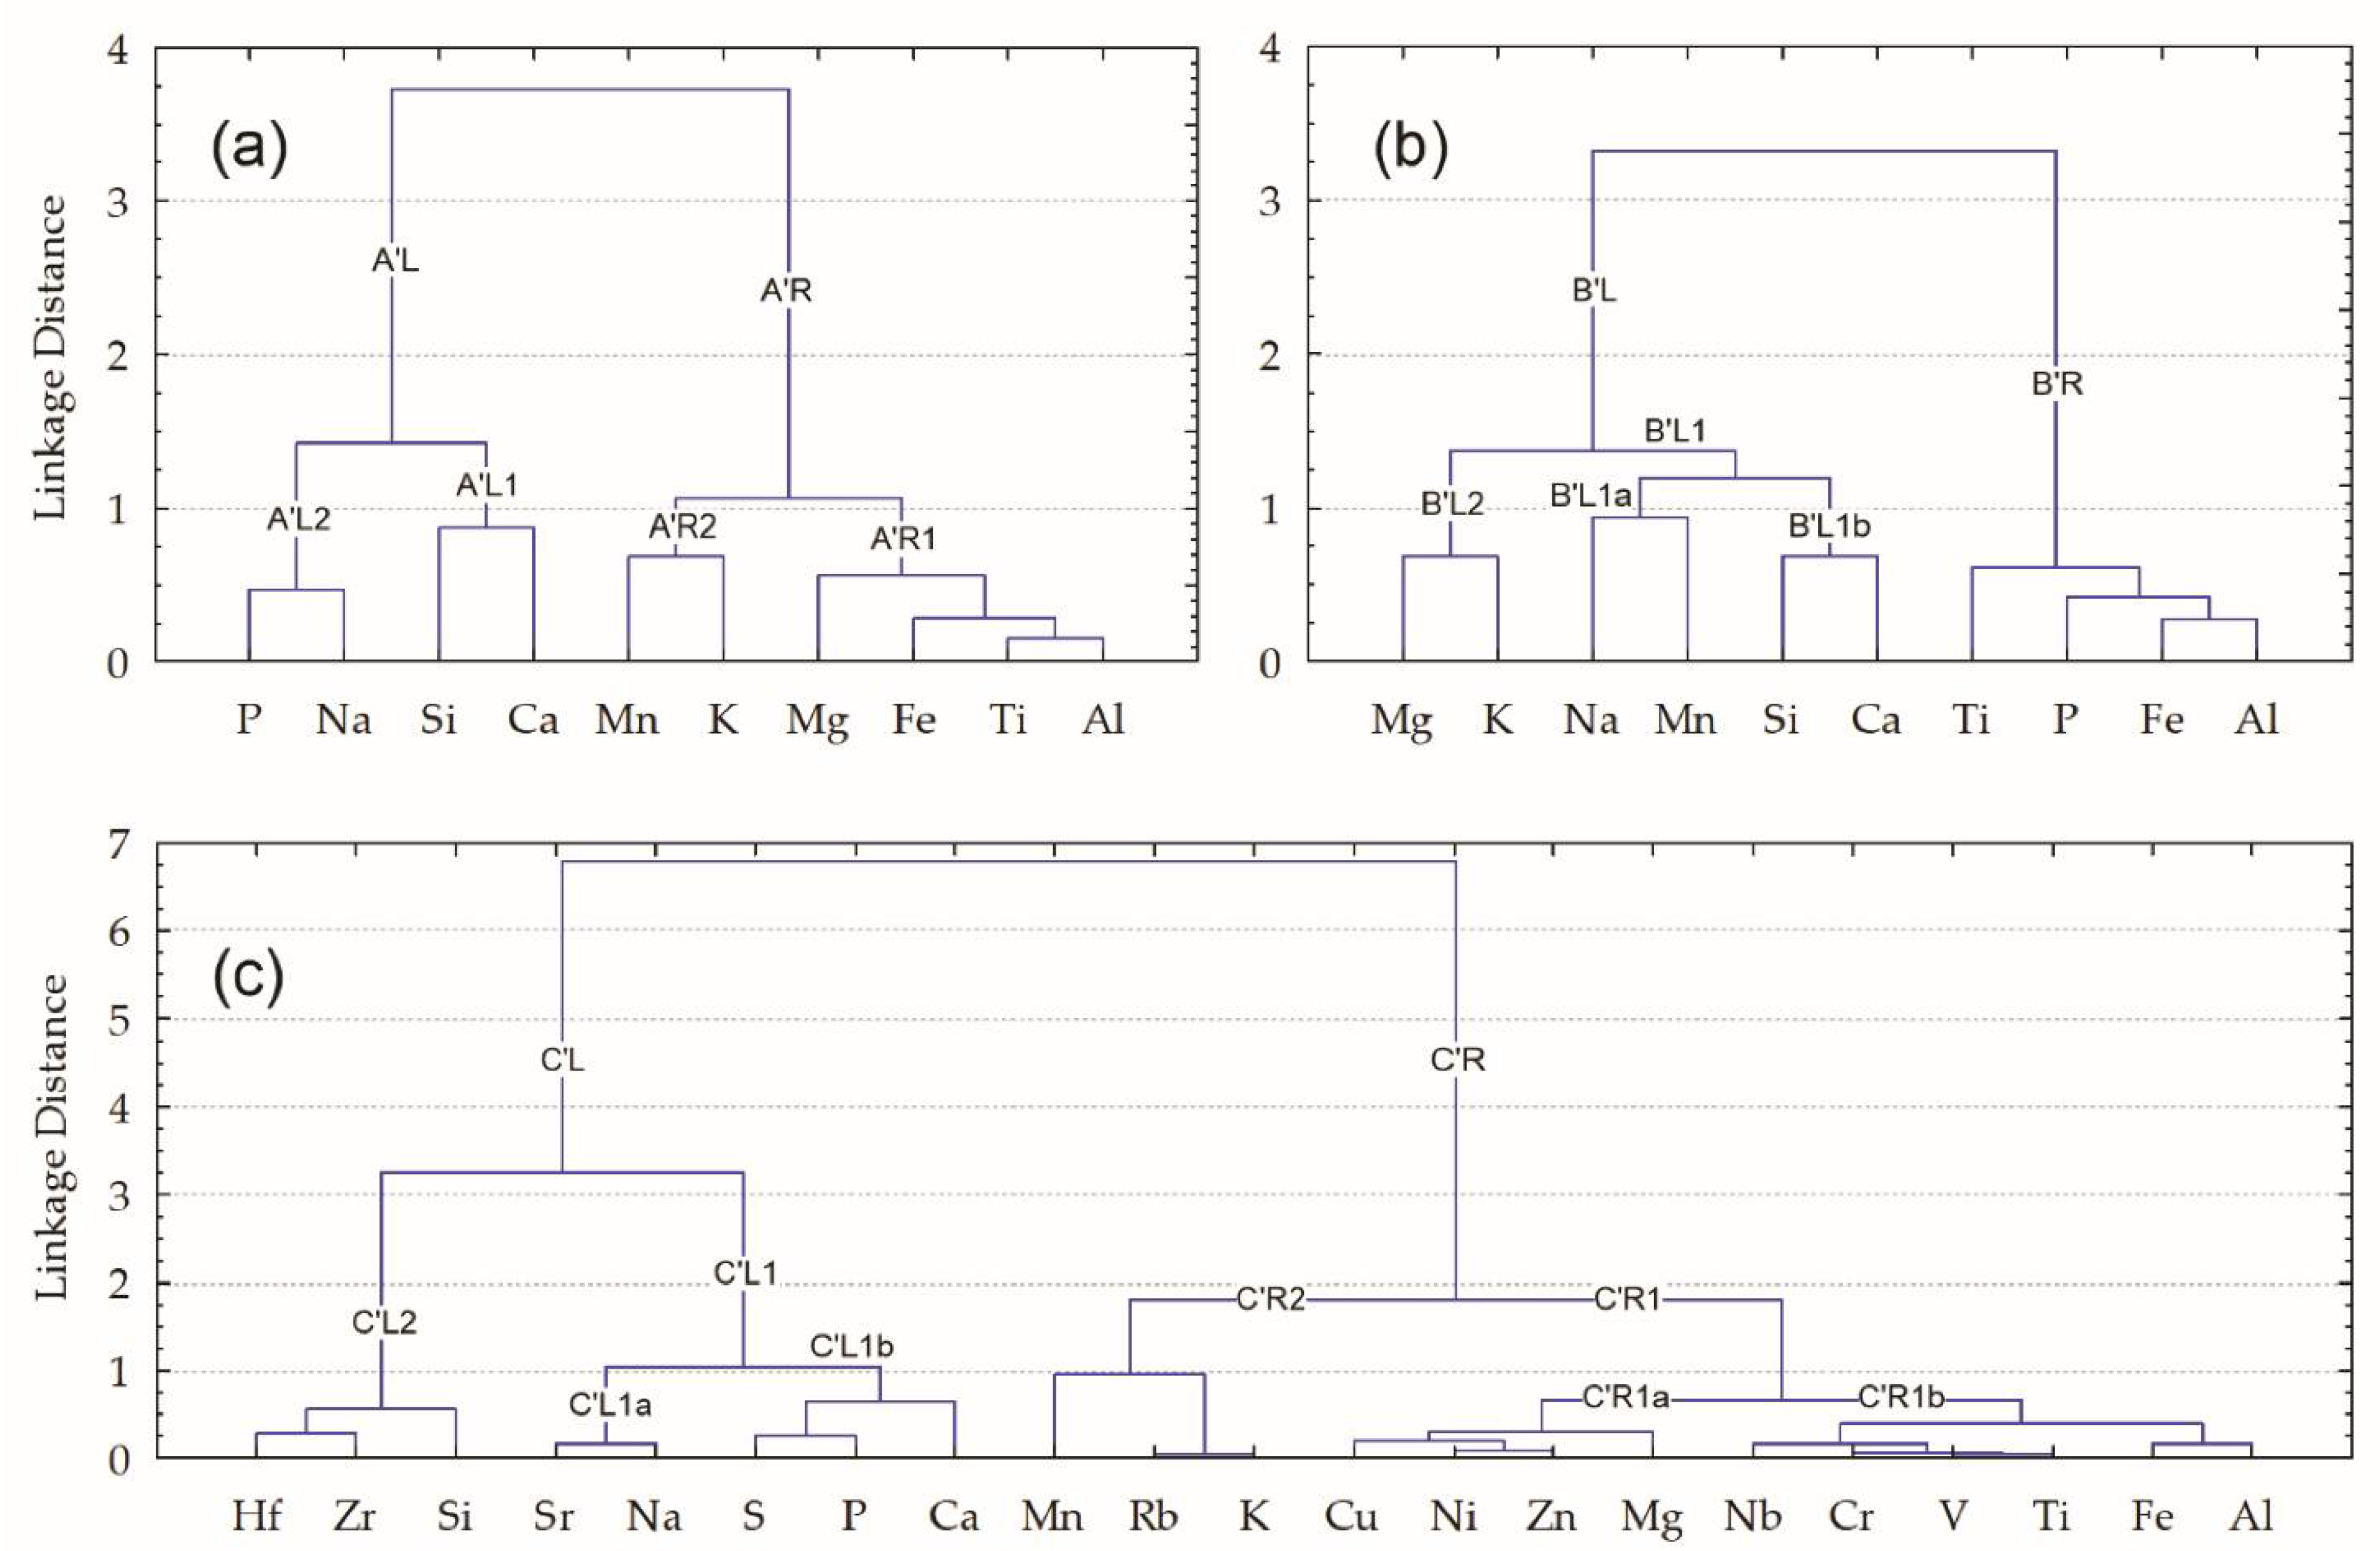
Cluster analysis demonstrates the nature of the connection between correlating analytes (Figure 3). The tree dendrograms slightly differ for the major elements in the pottery’s bulk composition and clay matrixes.
Five known geochemical elemental indices—Al, Ti, Fe, Mg, and K—of the glacial clay and till sediments [58,59,60,61] are located closely in the right branch (A’R1 and A’R2) in the bulk composition (Figure 3a), but in the clay matrix (Figure 3b) two of five, K and Mg, are located in the left branch (B’L2), whereas Al, Fe, and Ti are in the right branch (B’R).
The geochemical indices for the biogenic accessories, represented by P and Ca [31,62,63,64,65], are also in different branches: in the bulk composition both are in left subbranches (A’L2 and A’L1) (Figure 3a), but in the clay matrix (Figure 3b) Ca remains in the left subbranch (B’L1b), whereas P moves to the right (B’R).
The whole set of 21 studied analytes (10 major and 11 trace elements) in the bulk composition of all the pottery samples (Figure 3c) reflects typical lithogenic elemental associations [38,58,65]. In the right branch (C’R), there is the prevalence of the essential indices for the major crustal elements for glacial clay deposits [58]: Al, Fe, Ti, Mg, and K are seen. They are accompanied by characteristic satellites–trace elements, distributed in separate subbranches: Al, Fe, and Ti are more closely connected with V, Cr, and Nb (C’R1b); Mg with Ni, Zn, and Cu (C’R1a); and K with Rb and Mn (S’R1a). The left branch is composed of two clearly separate clusters that differ in nature, i.e., C’L2–Si~(Hf~Zr) and C’L1–(Sr~Na)~((S~P)~Ca). The former (C’L2) represents the sandy part of sedimentary rocks, the latter (C’L1) highlights the importance of biotic elements in the creation of this connection [31,65,66].

3.3. Evaluation of the Influence of Potential Distribution Characteristics for Geochemical Peculiarities

Before discussing the comparison of our results with similar published data from other researchers, we attempted to identify if there are any visually noticeable features such as: (1) lighter and darker shades of clay matrix, (2) differences in clay matrix and bulk compositions, and (3) knowledge of ‘cultural’ dependence (in our case, the distribution of hunter-gatherer and Corded Ware pottery), which can be significant. For this purpose, we used two non-parametric sample difference significance tests: Wilcoxon Matched Pairs test (MP’ test) for dependent, harmonized in matched pairs pottery samples, and the Mann–Whitney U test (U’ test) for the independent (not harmonized in matched pairs) complete data sets of pottery samples, selected for comparing purposes.

3.3.1. The Effect of Elemental Composition for Lighter and Darker Shades of Clay Matrix

Macroscopically observed differences in the color and internal microstructure of potsherds are usually explained by the firing temperature and reducing-oxidizing conditions [43,67,68]. The presence of a few differently colored clay types due to poor homogenization [24,69], intentional mixing [69,70,71,72], or slurry coating [26] in the same pottery sample is also discussed. However, studies of the geochemical variability of the light and dark clay parts of the same vessel are rare [73].
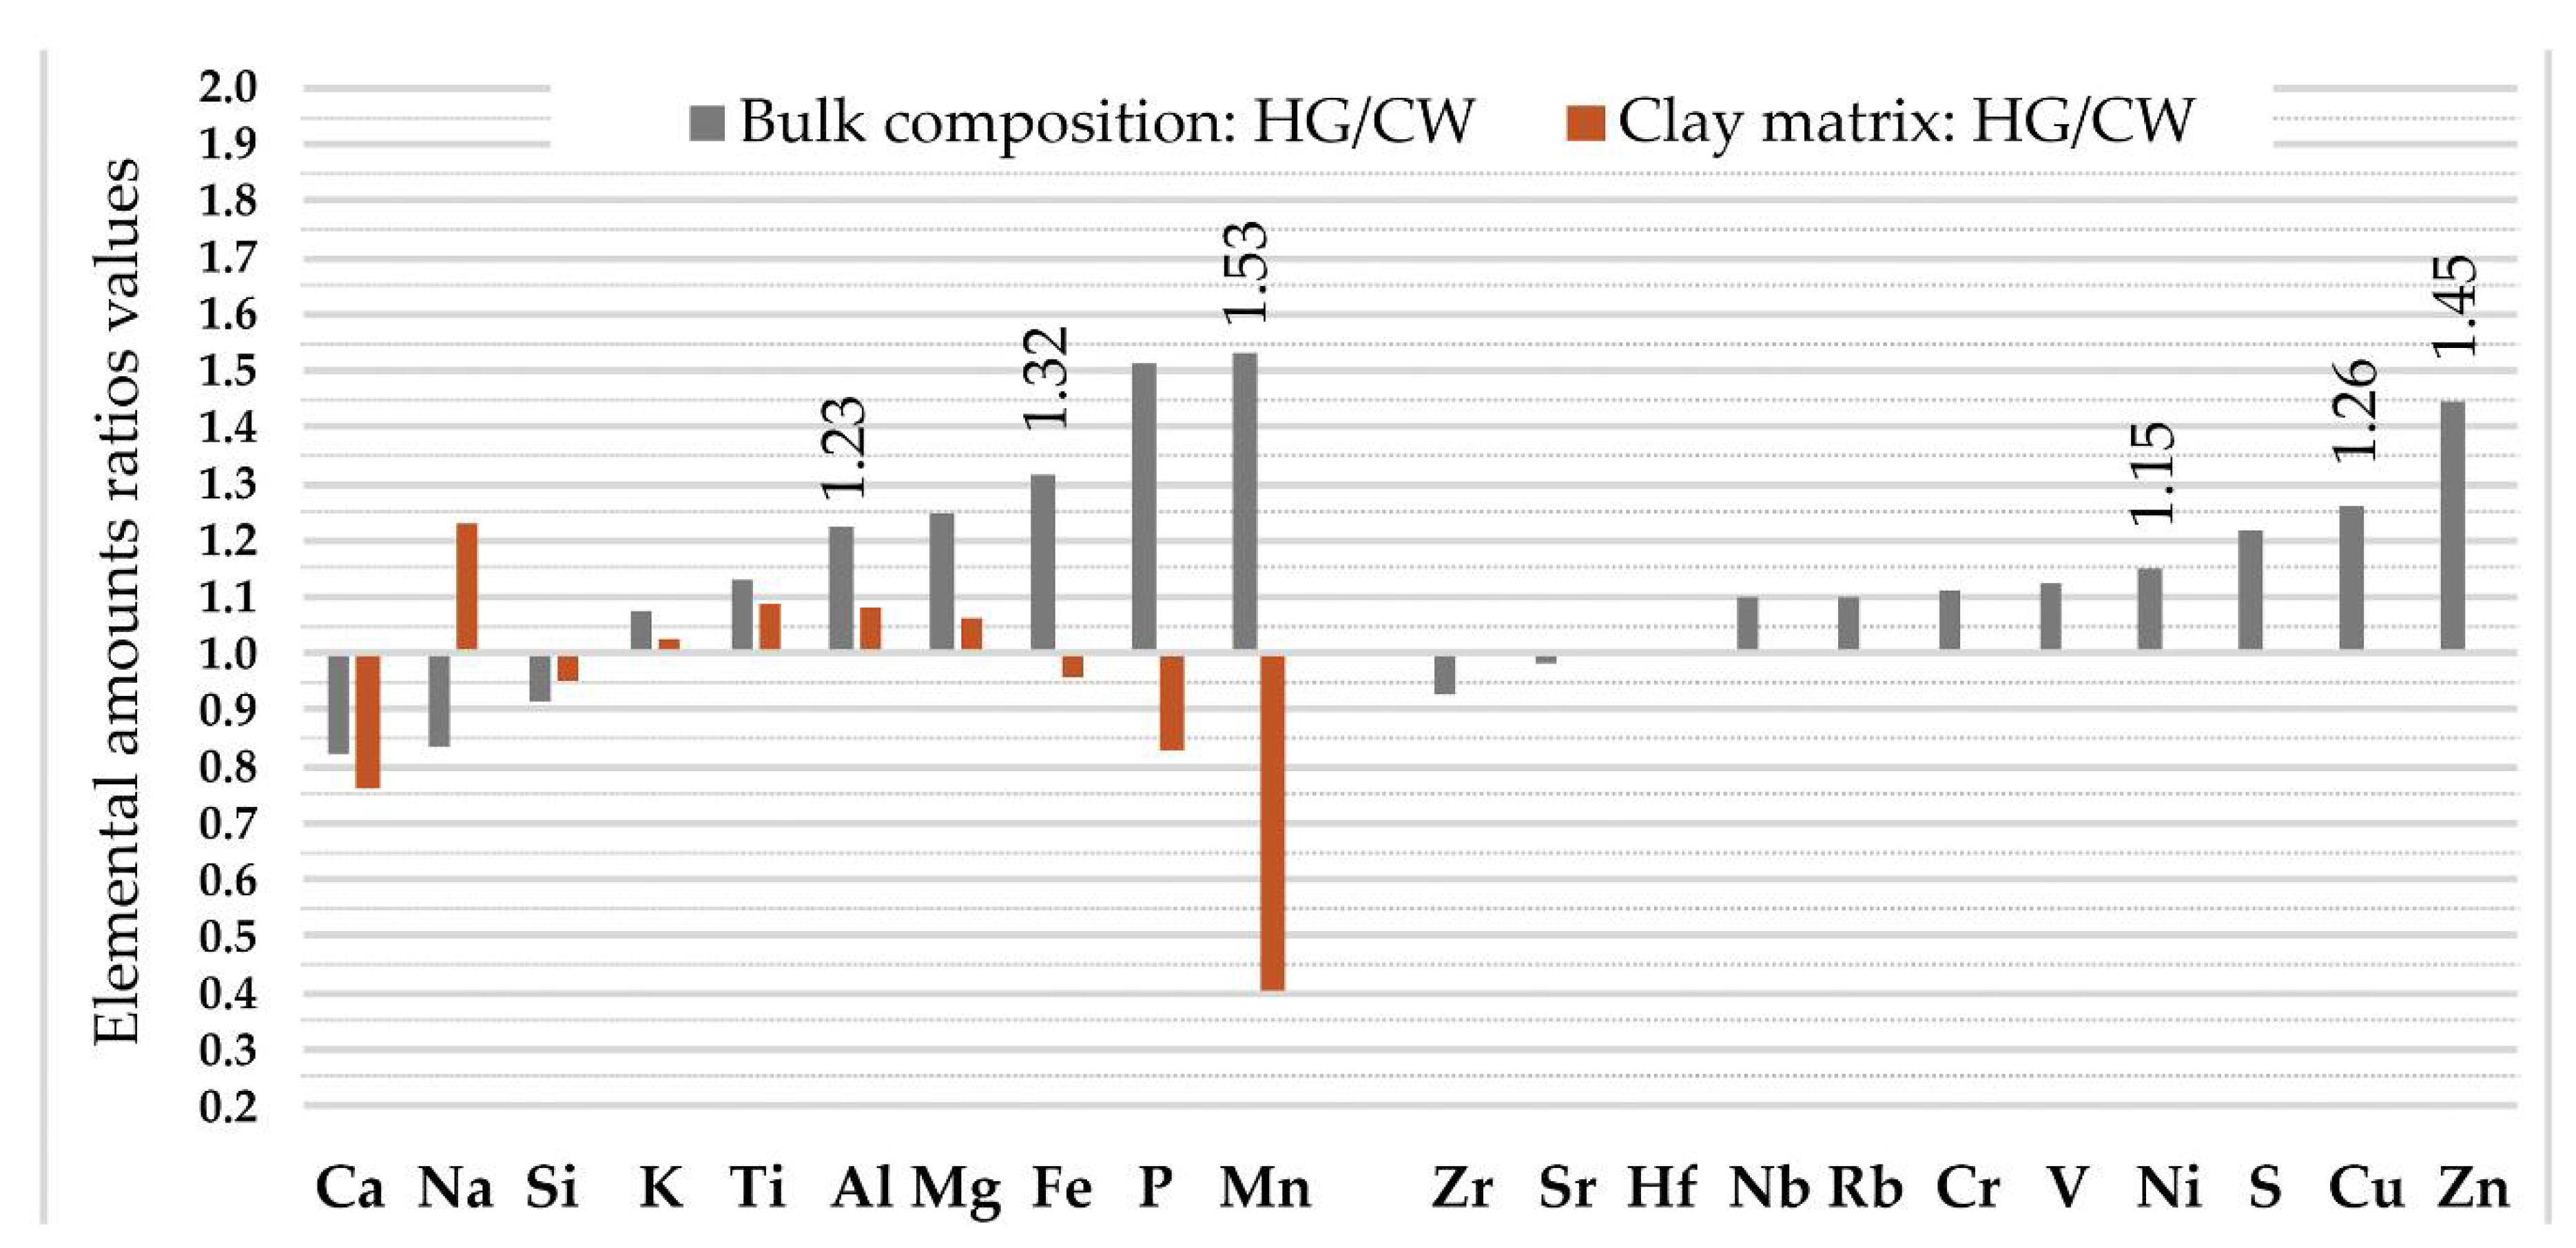
We considered SEM-EDS and XRF results of pottery samples with lighter (light grey, from yellow to red) and darker (dark grey, dark brown or black) clay matrix areas to determine whether the shade may be regarded as a significant geochemical feature. The MP’ test was used in search of geochemical differences between matched pairs of lighter and darker clay matrix areas in eleven pottery samples (sample HG-L_B1 was without a darker shade), whereas the U’ test enabled comparison of differently colored clay types analyzed in all twelve pottery samples (Table S2). The median values of elemental content ratios in eleven matched pairs (50th MP), and the ratio of median values in differently colored clay types in all twelve pottery samples (50th IND), are presented in Figure 4. The latter ratios (50th IND) are presented in Table S3.
When the p-value is between the 0.01 and 0.05 levels of significance (i.e., 0.01 < p < 0.05), it can be hypothesized that shade differences can be affected by lower Si (50th MP < 0.92) and higher P (both, 50th MP and 50th IND values, are >1.31) amounts (Figure 4). The p-values for phosphorus in this range are detected by both tests (MP’ test and U’ test) and for silicon by MP’ test only.
However, it seems that the decrease in Si content and the increase in P content are not related to the brightness of the sample shade. Non-parametric Spearman R pairwise correlation analysis showed that the values of the R correlation index did not confirm a significant relationship between Si and P, even at a low level of significance (p < 0.05): Spearman RSi~P value, although being negative, was equal to only −31 (Table S4). When studying inter-correlations between other analytes, it may be appropriate to note that the decrease in Si content at the p < 0.05 level of significance is inversely proportional to Fe (Spearman RSi~Fe = −0.82), whereas the increase in P content is directly related to Ti (RP~Ti = 0.65).
Discussions about Si as a factor in changing the shade of clay matrix have not been published by other researchers. However, the relatively high variability of P has been noted and discussed by other researchers [59,62,74]. Sometimes P is associated with cooking food [63,64] or with apatite in the clay matrix [75,76], but more commonly with the post-depositional effect [31,62,74].
Calculated 50th IND values for Mn (1.38) and for P (1.99) are 1.38 and 1.52 times higher, in comparison with 50th MP values found for corresponding analytes (Table S3). However, despite relatively higher values, the U’ test did not show major differences in any of them at the p < 0.01 level of significance.
To summarize, it should be mentioned that, in this particular case, none of the ten major crustal analytes (Si, Al, Fe, Mg, K, Ti, Na, Ca, P, and Mn) can be regarded as a systematic reason for the color of the pottery samples. This means that all the analysis results obtained using SEM-EDS, despite their own clay matrix shade, can be combined into a common data set. This insight is used below to compare the geochemical differences between bulk composition and clay matrix.

3.3.2. The Effect of Clay Matrix and Bulk Compositions Differences

The overall pattern for the complete data set of all twelve studied samples is that, of the ten analyzed major analytes, only the amounts of Mn, Na, and Si in bulk composition are higher than in clay matrix (Table S1).
In both cases of analytical results’ composition, either using the independent data set or applying a method of matched pairs, the sequence of differences between their median quantities (50th IND and 50th MP) between the clay matrix and the bulk composition is similar (Figure 5). In the first case, the median elemental values (50th IND) are distributed as Mg, Fe > Al > Ti > Ca > K > P > Si > Na > Mn, whereas in the second case (50th MP): Mg, Fe > Ca > P > Ti > Al > K > Si > Na > Mn. Both are characterized by the highest relative enrichment (more than ~1.1 times) by Mg (1.58–1.67 times), Fe (1.58–1.66), Al (1.24–1.31), Ca (1.23–1.31), Ti (1.26–1.28), K (1.19–1.20), and P (1.11–1.30) in a clay matrix, followed by the depletion of Mn (0.41–0.47), Na (0.49–2.05), and Si (1.07) compared to bulk composition.
Both the MP’ test and the U’ test confirm that the differences in amounts for Mg, Fe, Al, Ti, K, and Na are significant at the p < 0.01 level, while the MP’ test additionally confirms the significance at the p < 0.01 level for Si and Ca. Both tests also confirm the difference in Mn levels at the level of 0.01 < p < 0.05. An insignificant difference was only observed in the case of P amounts. This can be explained by a high (>35%) CV value.
A huge similarity in the composition of enriching analytes was observed when comparing the data provided by Kurosawa et al. [77] for contemporary cord-decorated pottery from Bulgaria (for calculation we used average values given in Table 4 of [77]): Mg, Fe, P, Al, Ca, and K are among the analytes enriched in the clay matrix, whereas Na, Mn, Si, and Ti dominate in a bulk composition. Thus, nine of ten analytes studied by Kurosawa et al. [77] showed the same links as in our case. The opposite enrichment pattern was only observed in the case of Ti: the clay matrix analyzed within the current study showed enrichment in Ti, whereas the clay matrix of cord-decorated pottery from Bulgaria is less enriched in Ti in comparison to bulk composition [77].

3.3.3. Geochemical Proxies of the Effect of Cultural Peculiarity

In order to clarify whether ‘cultural’ dependence can be characterized by significant differences in any of the analyte contents, both in the bulk composition (Table S5) and in the clay matrix (Table S6), the U’ test was employed to compare the geochemical data from the studied hunter-gatherer and Corded Ware pottery.
We found that calculated median (50th) values of the major crustal elements (Al, Fe, Mg, Mn, P, and Ti) and of the trace elements (Cu, Ni, S, and Zn) in the bulk composition of the hunter-gatherer pottery are more than 1.1 times higher in comparison with the correspondent values of the analytes in the Corded Ware. Most of these analytes are typical geochemical indices of glacial clayey deposits, whereas two of them, P and S, are bioindicators. Of the ten listed analytes, as many as six (Al, Fe, Mn, Cu, Ni, and Zn) in the bulk composition of the hunter-gatherer pottery are significantly (at p < 0.05 significance level) higher than those in the Corded Ware (Figure 6; Table S5). Despite the fact that the median content of Mn in the clay matrix of the Corded Ware is nearly 2.5 times higher than that in hunter-gatherer pottery, whereas the Ca and p values are 1.3 and 1.2 higher, none of these three analytes nor any of the other seven show significant differences in the amounts, even at the p < 0.05 level (Figure 6; Table S6). A comparison of the strength of the inter-analyte correlation using non-parametric Spearman R correlation analysis shows that the regularity at the p < 0.05 significance level is typical only for the Al and Si values: for the hunter-gatherer pottery the value of Spearman RAl-Si = −0.89, whereas for the Corded Ware it is RAl-Si = −0.94, and Ca and K have a different relationship (Table S7). Such data allowed us to assume the slightly different nature of the raw clays used.
Provided that the geochemical environment is not different within the archaeological sites of the Corded Ware and hunter-gatherers (Figure 1b), the elemental differences in the bulk compositions discussed above suggest that hunter-gatherers tried to choose a fat raw clay. Such an assumption can be confirmed by the lower ratio value of the elemental median amounts of the main clay indices (Fe, Mg, Al, Ti, K) [78] between the clay matrix and the bulk compositions for hunter-gatherer pottery compared to the same characteristics specified for the Corded Ware. The differences in the Ca content suggest (at a p = 0.078 significance level) that the hunter-gatherers may have opted for less Ca-enriched clay raw material (Figure 7).
Few research papers provide values for the key statistical indicators, which are represented by an elemental mean or median (accompanied by standard deviation or variation coefficient values), and briefly describe the geochemical features of pottery from different cultures [79,80]. Episodically available papers either describe only partial find groups (samples), which are distinguished by clustering or other statistical multi-elemental grouping methods [9,59,81,82,83,84,85,86], or do not mention any methods at all. Therefore, the possibility of finding and highlighting equivalents or differences for the geochemistry of our pottery at both the inter-regional and inter-cultural levels is very limited. Moreover, we failed to find any research papers that provide estimates of the difference in the significance of the analyte results in studied pottery samples, using statistical tests for the calculation of p-values.

3.4. Clustering and Conditional Formatting of the Geochemical Data for Linking Ceramics

As mentioned above, the number of publications that present the geochemical features of different cultures pottery by means of their mean or median values is quite low [58,79,80,81]. In most of the available works [9,59,83,84,85,86], the mentioned values are used for the characterization and update of relevant geochemical and other features of the interconnected data sets of finds belonging to the same culture, which are obtained with the help of clustering methods.
Within the current study, we employed cluster analysis of the pottery samples belonging to two different cultural groups—hunter-gatherers and the Corded Ware Culture. This type of study, in which clustering is applied to samples from more than one cultural group, is not common [79,80].
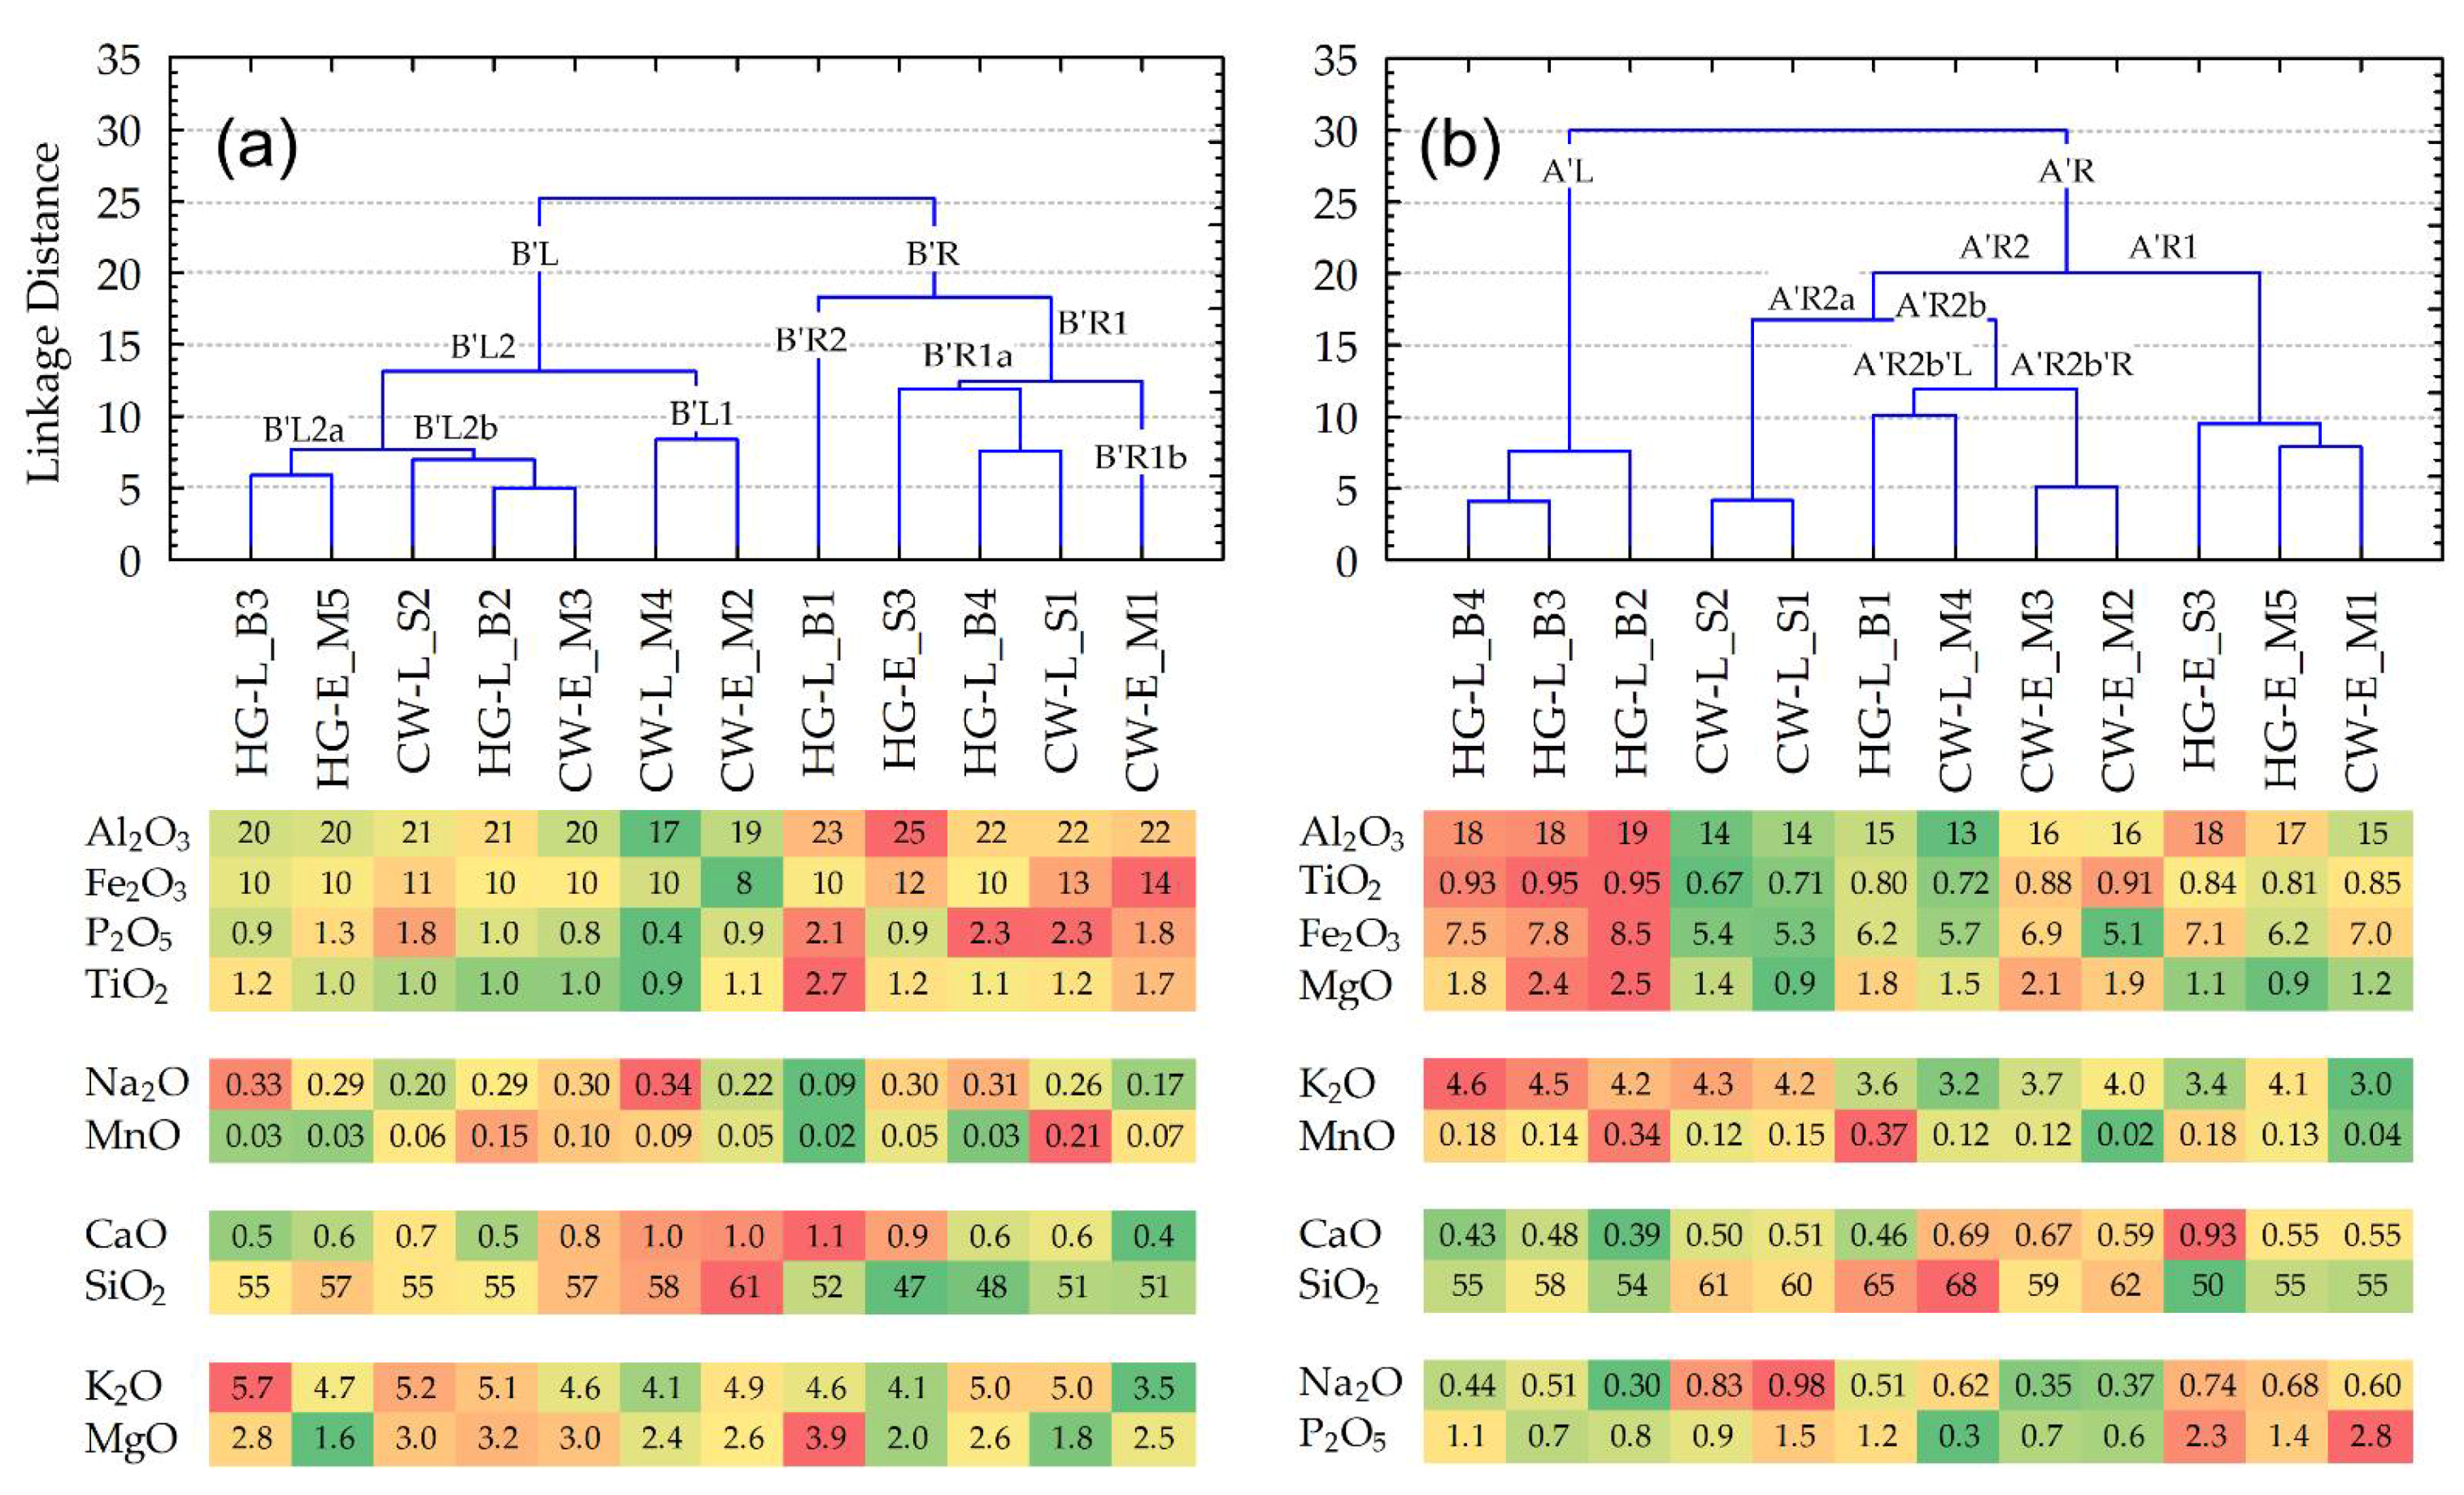
Firstly, we would like to emphasize the character of the pottery samples, presented in the first-level clusters (FLC) or by chains of them [38], formed by the use of 10 major analyte dendrogram (tree diagram) groups found in the pottery’s clay matrix and bulk composition (Figure 8).
Thus, in the case of the clay matrix, for samples, joined at a linkage distance of less than 10, the following aspects can be observed (Figure 8a):
  • There are only two FLCs representing the same culture, i.e., {HG-L_B3~HG-E_M5} and {CW-L_M4~CW-E_M2}. However, both clusters include pottery finds from different periods (‘E’ or ‘L’ (early or late)), whereas only one of them (representing Corded Ware) was collected in the same location.
  • None of the pottery samples forming an FLC group have any ‘chaining effect’ (term used in [38]) occurring in at least one of the two finds ‘from the same culture’ or ‘from the same location’.
  • Linkage distances between any samples, joined in an FLC, in general, have larger values than bulk composition samples.
Otherwise, in the case of the major elements, which form the bulk compositions of the pottery (Figure 8b), the dendrogram shows:
  • Three FLC groups forming pairs of samples from the same cultures, i.e., {HG-L_B4~HG-L_B3}, {CW-L_S2~CW-L_S1}, and {CW-E_M3~CW-E_M2}, characterized by not only the same period (‘E’ or ‘L’ (early or late)) but also the same locations. Moreover, the first and third groups include identical (from the same period and location) pottery samples HG-L_B3 and CW-E_M2, which are connected as a ‘chain’.
  • Ten of the twelve samples formed by the FLC consist of finds from the same location, i.e., three (of the four) ‘B’ samples (from the Barzdis settlement) are closely connected in the left major branch A’L: {{HG-L_B4~HG-L_B3}~HG-L_B2}; two (of the three) ‘S’ samples (from the Šakės settlement) are in the A’R2a sub-branch {CW-L_S2~CW-L_S1}; four of the five ‘M’ samples (from the Margiai settlement) form pairs: samples {CW-E_M3~CW-E_M2} are in sub-branch A’R2b’R, {HG-E_M5 ~ CW-E_M1} in subbranch A’R1.
For the geochemical highlighting of characteristic analytes, and determining sample puzzles both in compositions of main clusters and in an FLC, it is particularly effective and beneficial to present individual contents or mean values of analytes as conditionally formatted color scaling.
For the clay matrix, and the elemental mean values of five pottery samples forming the right branch B’R, in comparison with relevant mean values of seven samples of the left branch B’L (Table S8), according to the ratio values of mean amounts, the major analytes are distributed in the following sequence: P (ratio value of respective amounts is 1.87) > Ti (1.54) > Fe (1.20) > Al (1.16) > Ca, Mn (1.02–1.03) > Mg (0.96) > K (0.91) > Si (0.88) > Na (0.80).
More detailed geochemical analysis of groups of pottery, joined in an FLC at the linkage distance less than 10, highlights that:
  • Two samples of hunter-gatherer pottery, i.e., HG-L_B3 and HG-E_M5, joined in sub-branch B’L2a, have some of the highest mean amounts of Ti, and the biggest of K, and Na, whereas the amounts of Mn and Ca are regarded as the smallest. Despite the fact that Mg has the highest coefficient of variations (CV = 38%), its mean value is also one of the lowest.
  • Three samples of different cultures, i.e., HG-L_B2, CW-E_M4, and CW-L_S2, joined in sub-branch B’L2b, have the largest mean amounts of Mg, whereas amounts of Ti and Na are the lowest. The most variable amounts are found for Ca (CV = 22%).
  • Two samples of Corded Ware, i.e., CW-L_M4 and CW-E_M2, joined in sub-branch B’L1, have the largest mean amounts of Ca and Si. The amounts of Al, Fe, P, and K are the lowest, whereas Ti is among the lowest. All five analytes have the biggest CV values, respectively (%): 9, 17, 59, 13, and 11.
  • Two samples of different cultures, i.e., HG-L_B4 and CW-L_S1, found in sub-branch B’R1, have the largest mean amounts of Al, Fe, P, Ti, and Mn (even though their variability exceeds 100%), whereas amounts of Si and Mg are considered the lowest.
Of particular methodological importance is the fact that, in the case of bulk compositions, with the help of 11 trace elements along with 10 crustal major elements (Figure 9), the combinations of samples joined in an FLC do not change compared to an FLC determined solely on the basis of major analyte compositions (Figure 8b): {{HG-L_B4~HG-L_B3}~HG-L_B2}, {CW-L_S2~CW-L_S1}, {CW-E_M3~CW-E_M2}, {HG-L_B1~CW-L_M4 }, {HG-E_S3~{HG-E_M5~CW-E_M1}}. The group {{HG-L_B4~HG-L_B3}~HG-L_B2} remains the most isolated, and only the location of the connection {CW-L_S2~CW-L_S1} changes. The linkage distance for the FLC grouped samples more than doubled, but did not change the overall architecture of the dendrograms.
For the bulk composition, the elemental mean values of the three pottery samples forming the left branch C’L, compared to the nine samples forming the right branch C’R (Table S9), according to the ratio values of the respective mean amounts, have analytes distributed in the following descending sequence (major elements shown in bold): Zn (calculated ratio value of the mean amount is 1.60) > Mg (1.54) > Mn (1.56) > Ni, Cu (1.49–1.48) > Rb (1.38) > Fe, V (1.30–1.29) > Nb (1.24) > Al (1.21) > Cr, K, Ti (1.19–1.18) > Hf (1.01) > Si (0.94) > Zr (0.90) > Sr, S (0.78–0.74) > Ca (0.72) > P, Na (0.67–0.66).
Geochemical highlighting of the selected 21 characteristic analytes, for the groups of the pottery samples, forming an FLC at a linkage distance of less than 25 (Figure 9), revealed that:
  • The three samples of hunter-gatherer pottery, within the same period and location, i.e., HG-L_B4, HG-L_B3, and HG-L_B2, joined in sub-branch C’L, are characterized by high mean quantities of Al, Fe, Ti, Mg, K, and Mn, and lower amounts of Ca, Na, and Si, among the ten major elements. Higher than average amounts among the eleven trace elements are typical for V, Cr, Nb, Cu, Zn, Ni, and Rb, whereas Sr and Zr have two of the lower amounts.
  • Two samples of Corded Ware, within the same period and location, i.e., CW-L_S2 and CW-L_S1, joined in sub-branch C’R2, are characterized by high mean quantities of Na and K, whereas Al, Fe, and Ti occur in some of the lower quantities among the ten major elements. Sr has one of the higher average amounts among the trace elements set, whereas V, Cr, Nb, Cu, Zn, Ni, Zr, and Hf have some of the lower amounts.
  • Two samples from different cultural groups, i.e., HG-L_B1 and CW-L_M4, joined in sub-branch C’R1a’L, are characterized by higher mean amounts of Mn and Si, whereas Al and K occur in two of the lower quantities among the ten major elements. Among the eleven trace elements, Zr and Hf have two of the higher average amounts, whereas S has one of the lower amounts.
  • Two samples of Corded Ware, within the same period and location, i.e., CW-E_M3 and CW-E_M2, found in sub-branch C’R1a’R, are characterized by lower quantities of Mn, P, and Na among the ten major elements. Cr, Nb, and Hf have some of the higher average amounts of the trace elements set, whereas Sr has one of the lowest amounts;
  • Two samples of hunter-gatherer pottery, joined by the nearest chain, and one sample of cord-decorated pottery, within the same period ‘E’ (early) for all of them and the same location for two (‘M’—the Margiai settlement), i.e., HG-E_S3, HG-E_M5, and CW-E_M1, that are joined in sub-branch C’R1b, are characterized by one of the highest mean quantities of P and Ca, whereas Mg, K, and Si occur in some of the lowest quantities among the ten major elements. S and Sr have two of the highest average amounts among the eleven trace elements set, whereas Rb and Hf have two of the lower quantities.
These peculiarities of the clay matrix and bulk composition geochemical clustering allow us to hypothesize about the assumptions made in the previous subsection, stressing that:
  • The layers of raw clay used, although being quite sparse, may have been the same over the centuries and their locations may have been known to potters for both cultural groups, or may have even been exploited over a period of time. Such an assumption arises not only from the insignificant differences in the amounts of major analytes in the hunter-gatherer pottery and Corded Ware, but also from the differentiation of the relationship between the clay matrix samples, expressed in relatively larger linkage distances between closely joint samples. It is possible that the most important selection criterion was the plasticity of the raw clay.
  • Bulk geochemical compositions of pottery, due to the temper additives, are more variable than the clay matrix, reflecting the expected characteristic differences in the technological features occurring at different periods in the Late Neolithic (‘E’ and ‘L’, and early and late) and at different ceramic production locations (‘M’, ‘B’, and ‘S’—the Margiai, Barzdis, and Šakės settlements) and different cultural features (hunter-gatherers (HG) or Corded Ware Culture (CW)). However, although these geochemical features of ‘period’, ‘location’, and ‘culture’ are more easily distinguished by cluster methods due to the use of identical or different temper additives, we believe that the proportions of raw clay, which were chosen deliberately (by the potters of the day), could have helped to create such a division.
However, a comparison of the geochemical specificity of the applied technologies, either at inter-regional or inter-cultural levels, using the mean (or median) quantities describing the cluster groups published by other researchers, can be quite problematic because: (1) it is not common to use the same clustering methods or different linkage distances for sample grouping purposes [9,59,79,82,85]; and (2) in the groups selected on the basis of subjective voluntary decisions, some samples are left out and others are rejected as outliers [9,59]. Despite these inconsistencies, such quantitative indicators, which allow searching for common patterns using cluster groups extracted by different researchers, are desirable. This remains a challenge for the future.

3.5. Mineralogical Characterisation Using X-ray Diffraction (XRD)

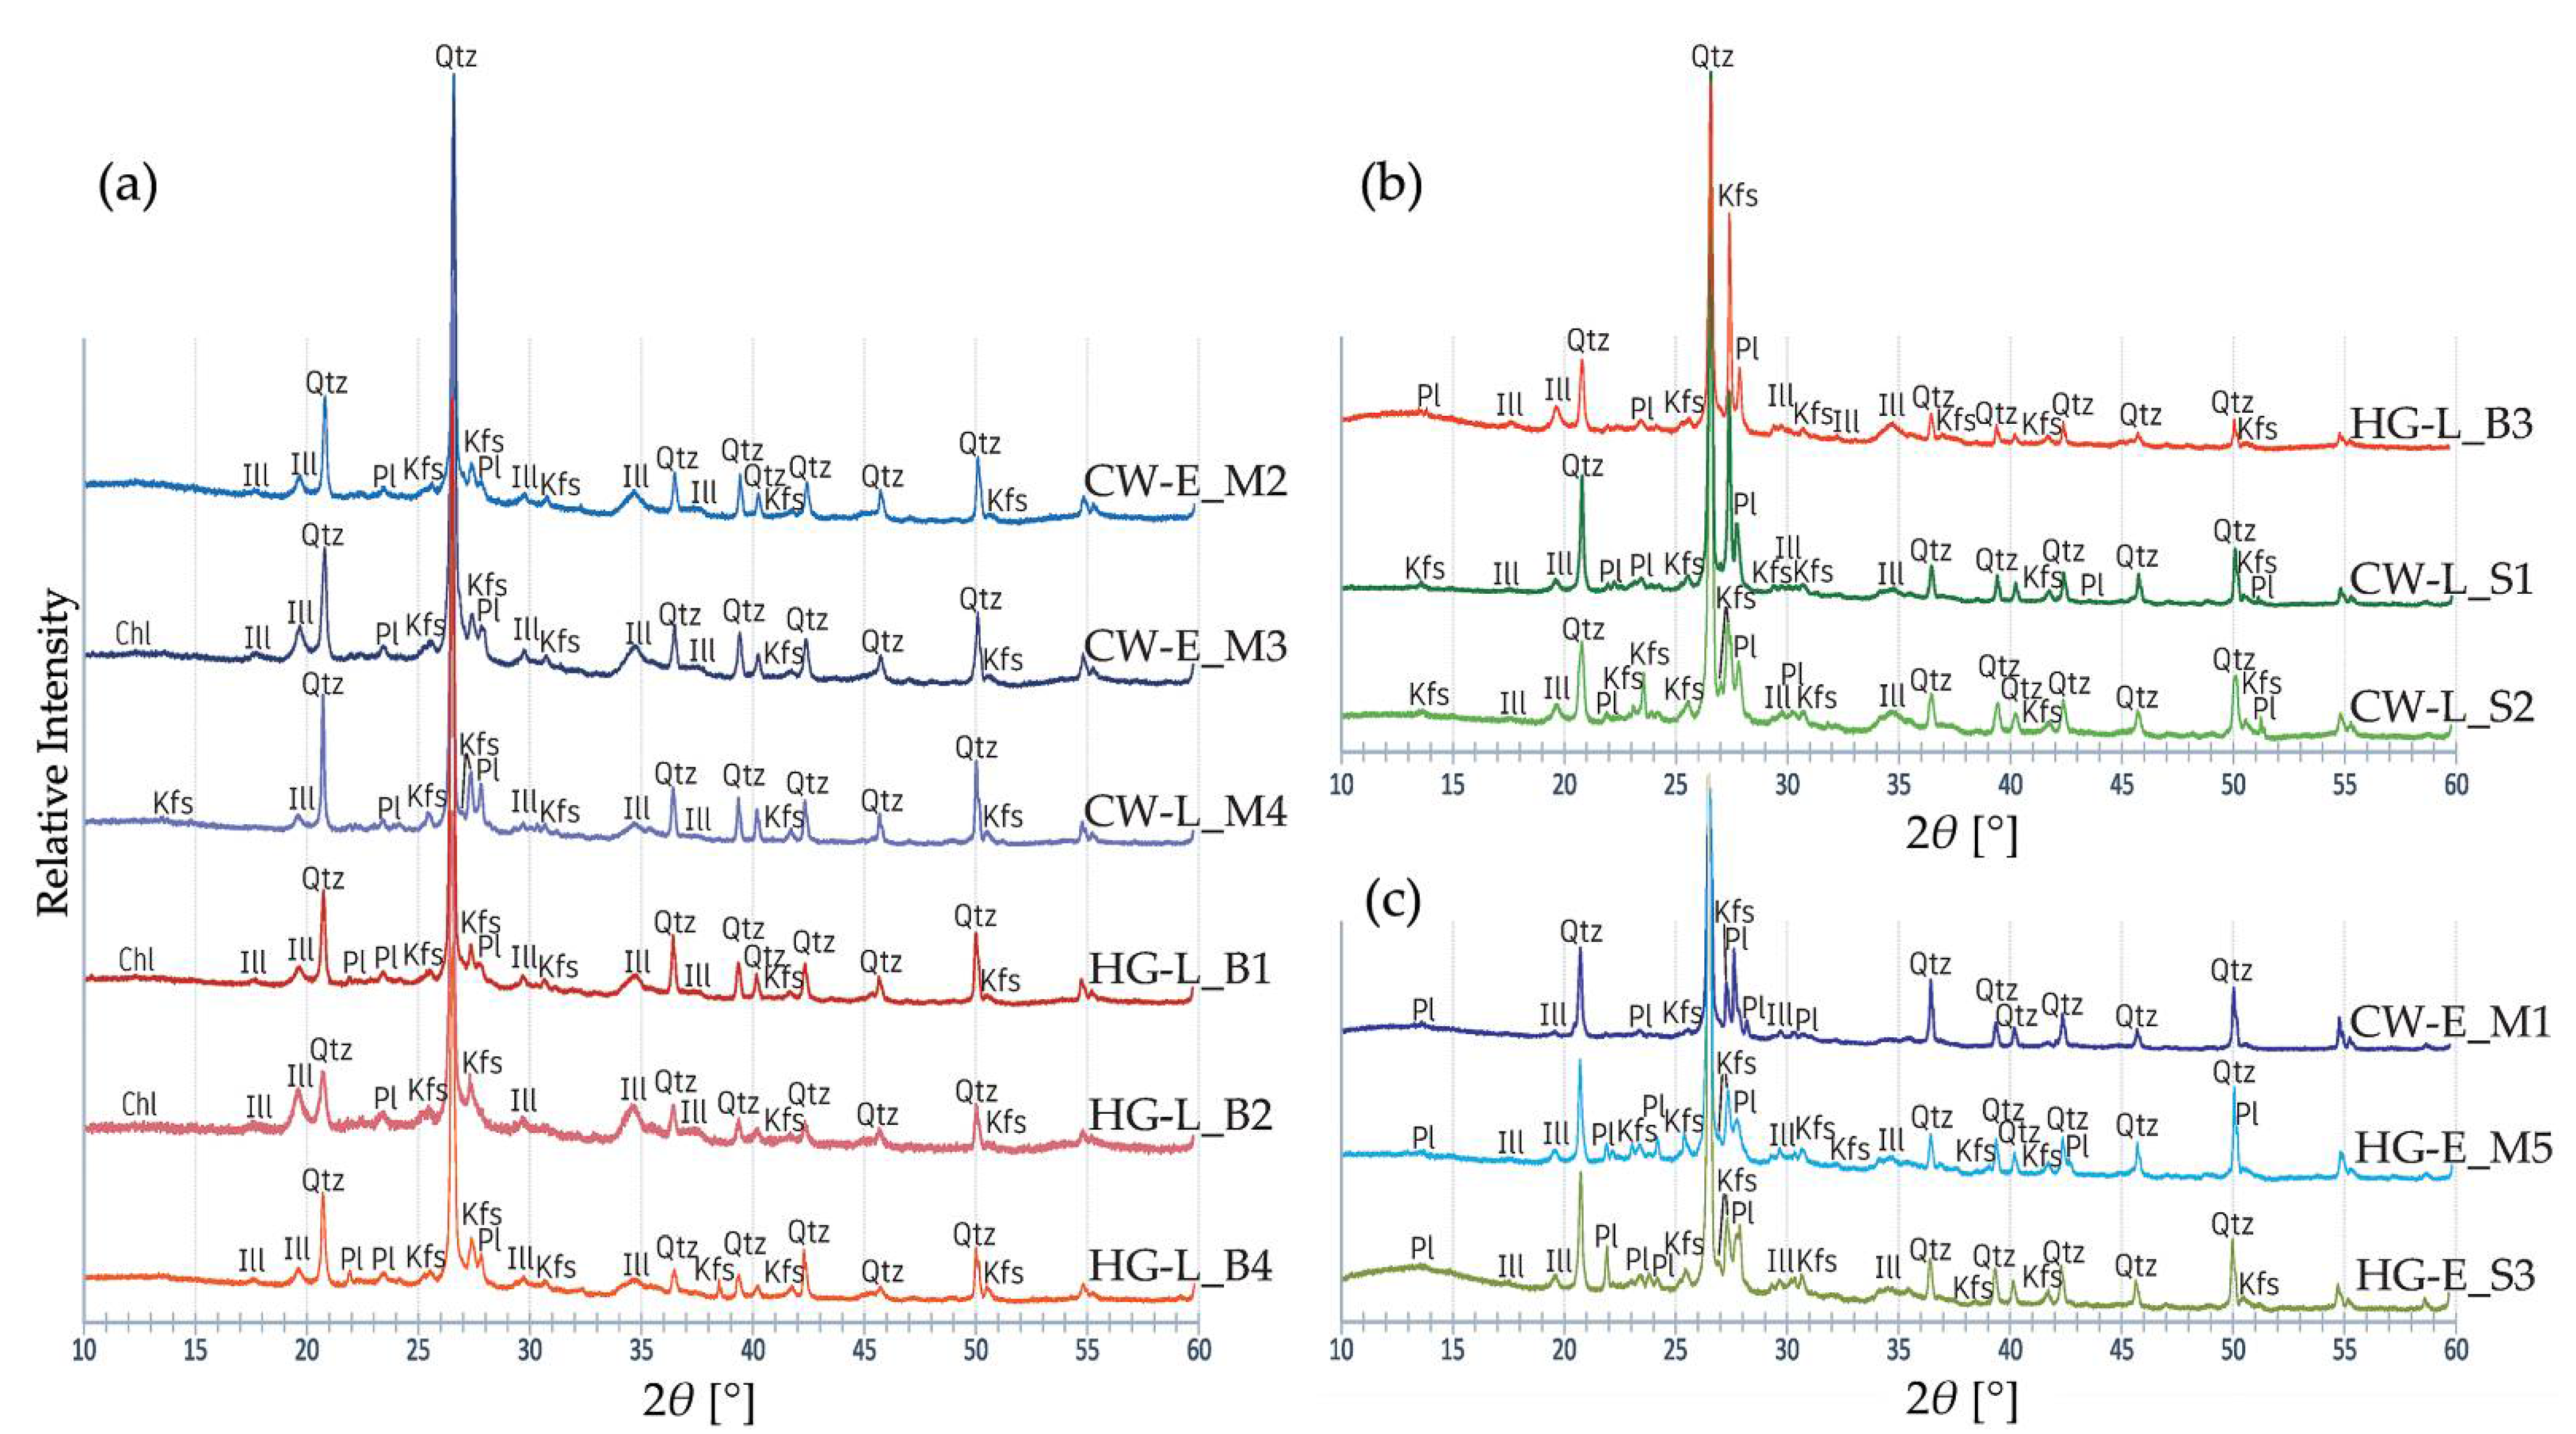
The analyzed samples displayed the major diffraction peaks of quartz, K-feldspar, plagioclase, and illite (mica and hydromica clay minerals) in the primary phase [39,40] (Figure 10a–c). No calcite was detected as a primary or secondary phase [31] in any sample. The diffractograms lacked any of the diffraction peaks of ‘firing’ mineral phases or amorphous matter formed during vitrification at a high firing temperature [46,87].
Quartz and feldspar diffraction peaks predominate in all the diffractograms and overlap some of the clay mineral peaks. K-feldspar is more common than plagioclase in the majority of the samples (Figure 10a,b). Greater amounts of plagioclase were found in three coarse pottery samples (CW-E_M1, HG-E_M5, HG-E_S3) (Figure 10c). The diffractograms for HG-L_B3, CW-L_S1, and CW-L_S2 displayed the greatest K-feldspar quantities, but they also had high quantities of plagioclase. Only CW-E_M2 and CW-E_M3, the representative samples of classic Corded Ware, and HG-L_B1 and HG-L_B2, sherds containing organic temper, were poor in feldspar but rich in clay minerals (Figure 10a).
The presence of several broadened diffraction peaks of K-dioctahedral 1M micas indicates a low firing temperature [88,89]. The diffractograms for HG-L_B1, HG-L_B2, and CW-E_M3 include not only illite/muscovite peaks, but also a weak chlorite or/and kaolinite overlapping diffraction peak [90,91] (Figure 10a). The crystal structure modification causing the illite dehydroxylation process appears at 550 °C [89], the chlorite one at 500 °C [43], and kaolinite at 450–500 °C [41]. At 550 °C, no peaks of kaolinite [39] and chlorite [92] can be seen in the diffractograms; thus, these samples were presumably fired below 550 °C. A very low firing temperature of 500–600 °C was reported for hunter-gatherer pottery in South Sweden [81].
Some overlapping clay mineral diffraction peaks may indicate not only an illite/muscovite but also an illite-montmorillonite mixed-layer [93,94] or montmorillonite-chlorite [91] clay minerals. In Lithuania, however, hydromica (illite) clays with muscovite and biotite micas predominate whereas other clay minerals (kaolinite, chlorite, montmorillonite) occur in only small quantities [95].
Despite the high quantities of iron oxide measured by XRF and SEM-EDS (Tables S1 and S2), only traces of natural magnetite and hematite [96] were detected in the diffractograms. The absence of intense iron oxide diffraction peaks can be explained by the poor crystallization that occurs during firing at low temperature [90,97,98].

3.6. Examination of Minerals and Firing Temperatures Using Fourier Transform Infrared Spectroscopy (FTIR) Data

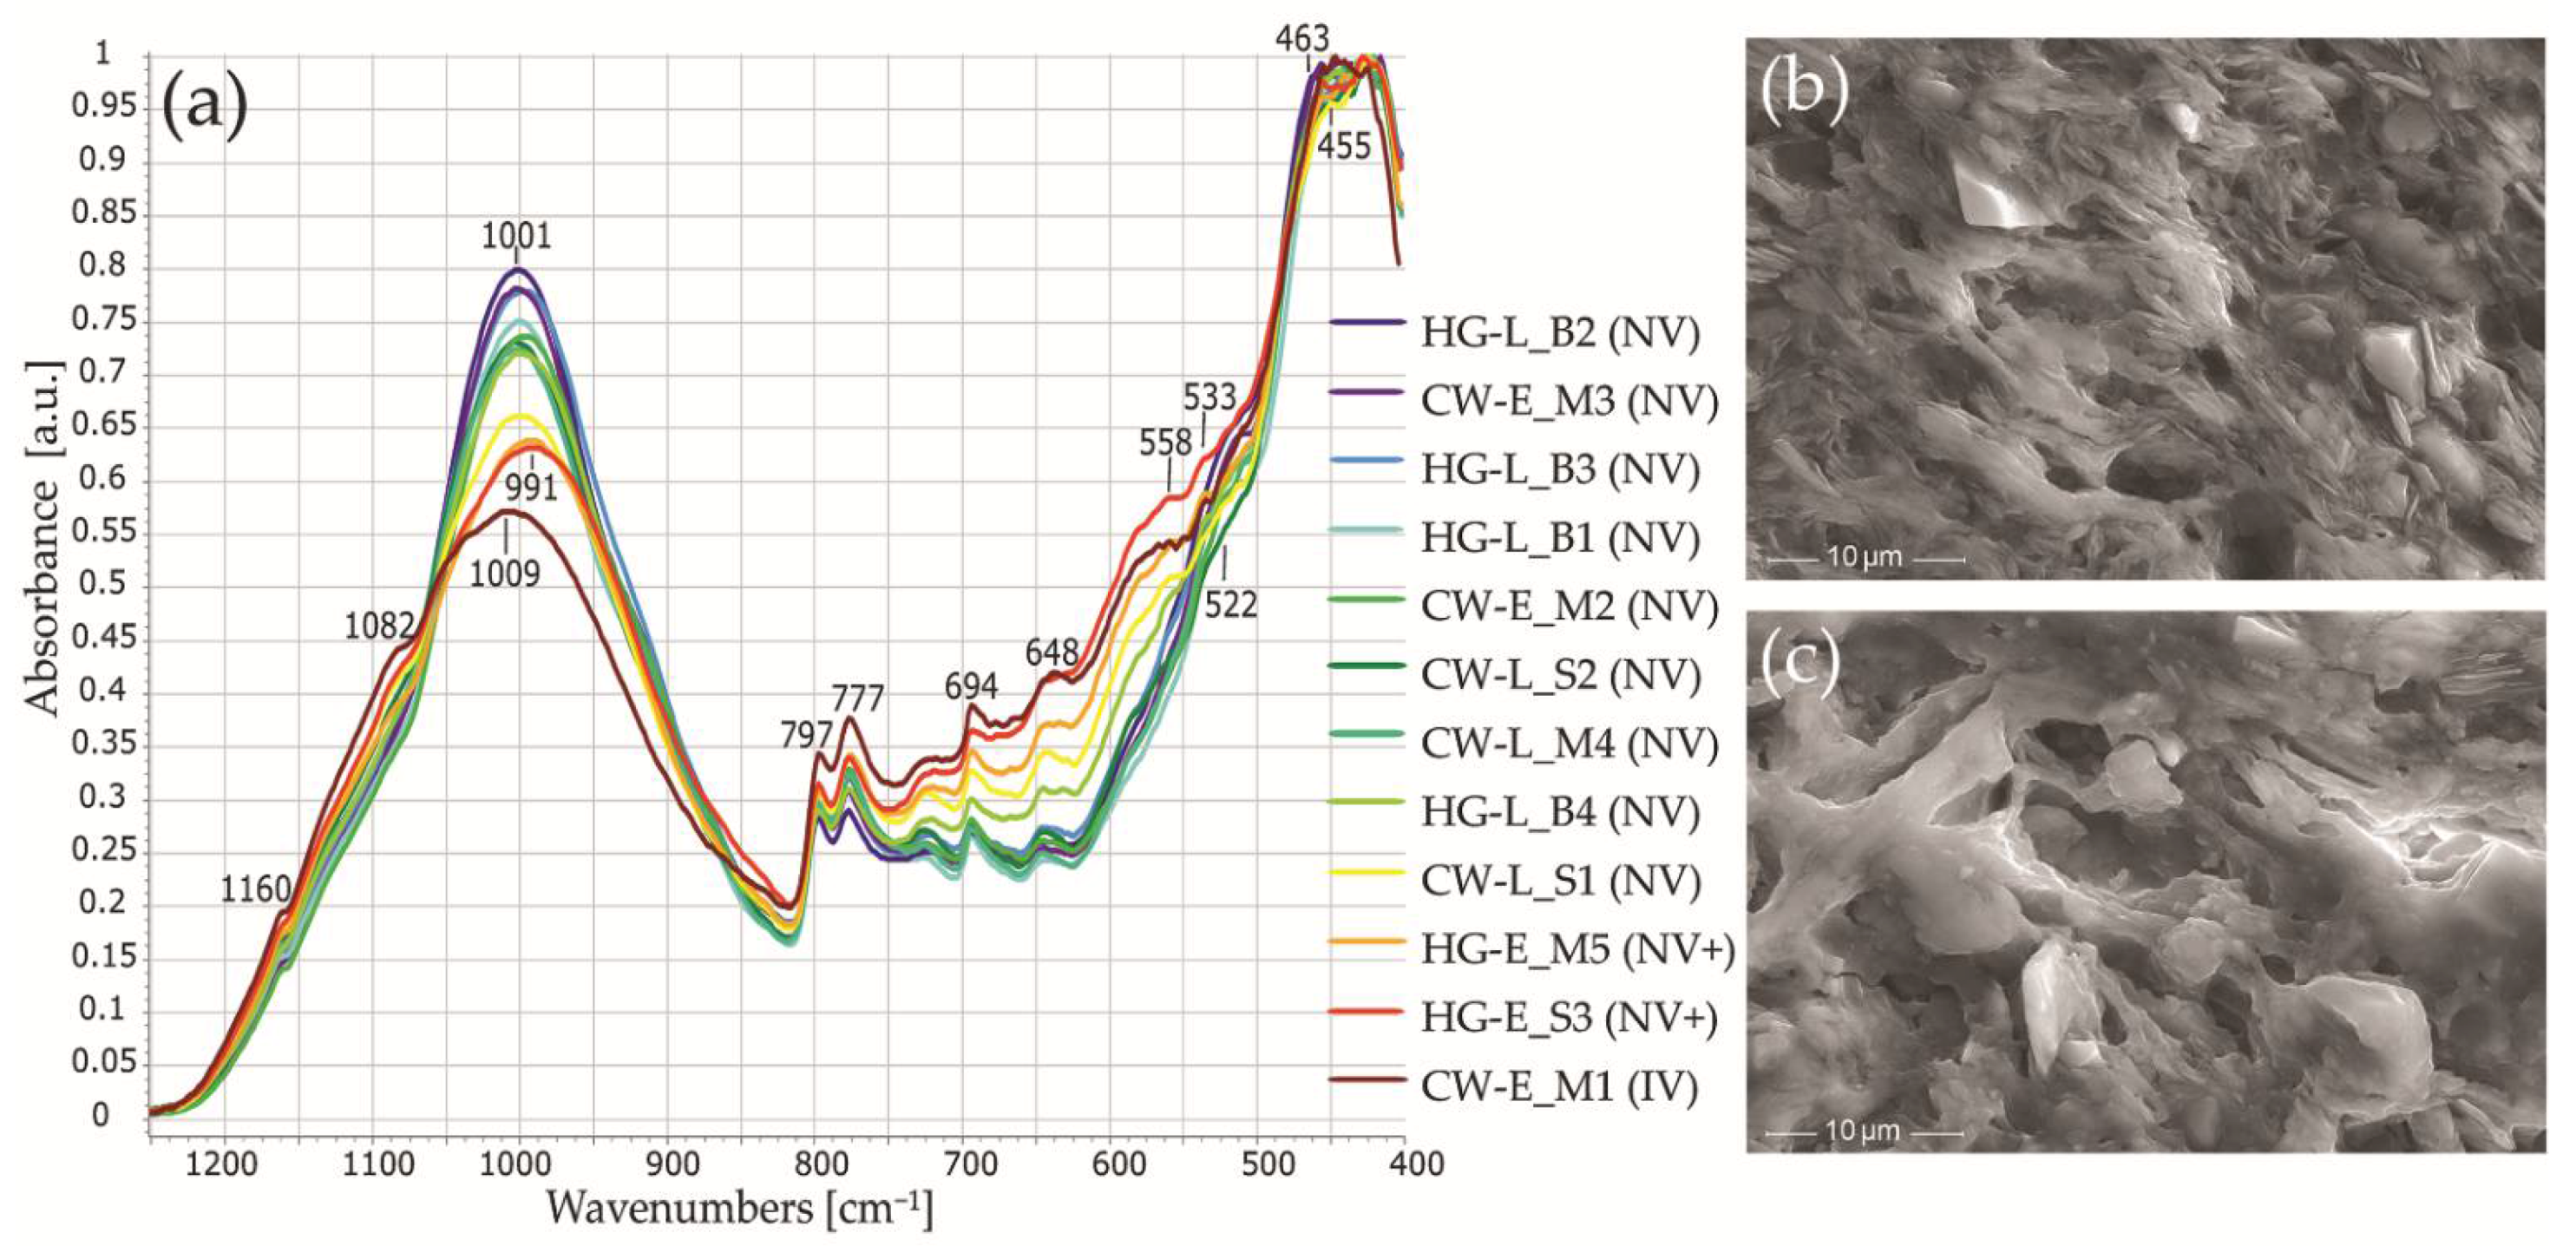
The FTIR spectra of all the samples are fairly similar to the high intensity Si–O absorbance bands (1160, 1082, 797, 777, 694, 512 cm−1) assigned to quartz (Figure 11a) [42]. In the range from 1200 to 900 cm−1, the main Si–O bands of feldspar and clay minerals also overlap [64,99]; only the intensity of the 797 and 777 cm−1 band doublet in relationship to the main Si–O stretching band of burnt clay expresses the real amount of quartz [44].
The advantage of FTIR spectra analysis lies in the ability to examine ceramic firing conditions using a shift in the main bands due to changes in the crystalline and amorphous phases. An increase in the firing temperature causes the main Si–O stretching band to shift to higher wavenumbers and, at around 800 °C, to split into a double peak [100]: the intensity of the asymmetric Si–O stretching band at around 1020 cm−1, which is assigned to phyllosilicate group minerals, decreases, and the band intensity at around 1080 cm−1, which is assigned to quartz, increases [46]. At 600/650–700/750 °C [45,101], the Si–O–Si and Si–O–Al bending bands shift between 480 and 460 cm−1 and between 517 and 554 cm−1 respectively [45,46] (Figure 11a).
The shifting of Si–O–Si and Si–O–Al bending bands from 463 to 455 cm−1, and from 522 to 533 cm−1, indicates thermal changes in the studied samples (Figure 11a). The FTIR spectra for four samples (CW-E_M1, HG-E_M5, HG-E_S3, CW-L_S1) revealed wavenumbers around 455 and 533 cm−1 that are characteristic of higher temperatures, and a Si–Oapical stretching shoulder at 1082 cm−1. The other samples were characterized by wavenumbers at around 463 and 522 cm−1, and a poorly expressed Si–Oapical band.
The FTIR spectra for all the studied samples show very low wavenumbers for the main Si–O stretching band, namely, 991–1003 cm−1 (1009 cm−1 in only CW-E_M1), which is unusual for burnt clay [44,45,46,47]. This can be explained by the presence of micaceous clay composed of Fe-rich illite [102,103] and biotite [104,105], rather than just a low firing temperature [101,106].
The O–Si(Al)–O bending vibrations at 648 cm−1 can be associated with microcline [107] or clay minerals (chlorite) [45] and the shoulder at 558 cm−1 with muscovite [105] (Figure 11a).
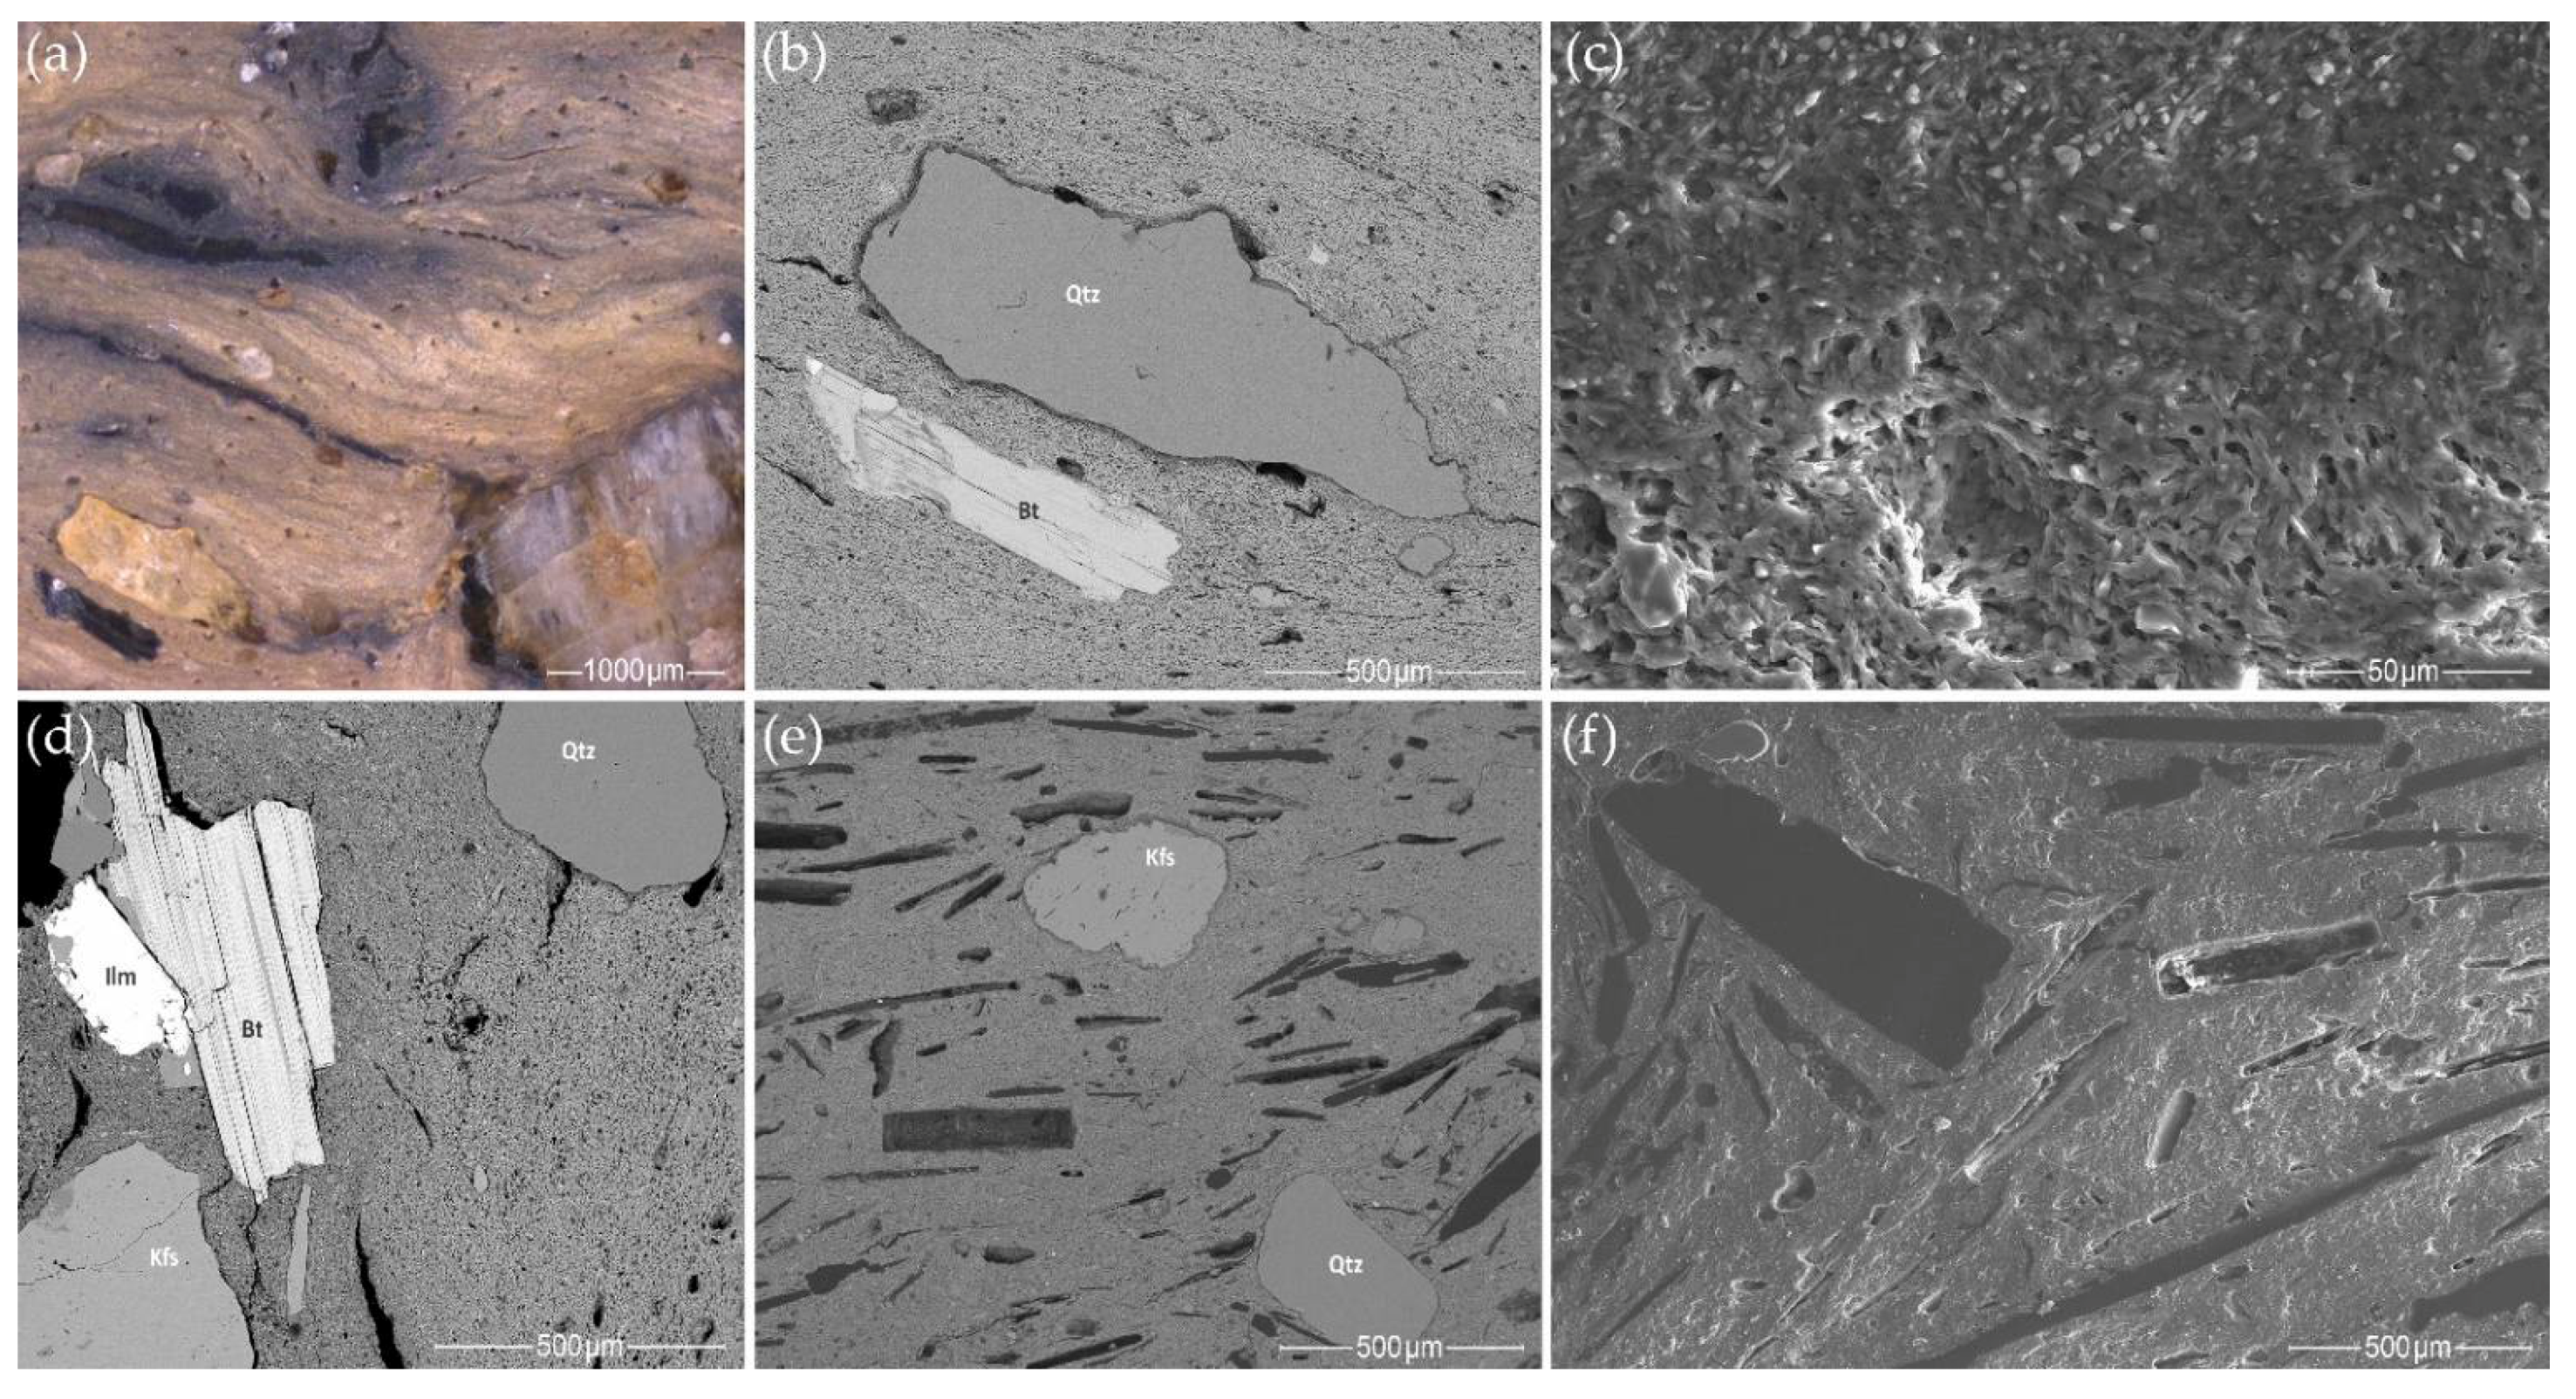
The FTIR spectra were analyzed using both wavenumbers and band intensities. A correlation between the firing temperature and the intensity of the main Si–O stretching band was reported, i.e., an increase in the firing temperature is accompanied by a decrease in the intensity of the main Si–O stretching band [46,47] and the formation of well-crystallized phases [44]. Normalized FTIR absorbance spectra for the studied samples were compared by measuring the intensity (height) of the main Si–O stretching band at around 1000 cm−1. The changes in the main band’s intensity clearly illustrate the variability of the studied pottery’s firing temperatures (Figure 11a). According to the low, broad FTIR band, CW-E_M1 should have been fired at a medium temperature of 750–800 °C [45,101]; HG-E_M5, HG-E_S3, and CW-L_S1 at a low temperature of 650–750 °C; and the remainder, which had a narrow, intense Si–O stretching band, at a very low temperature (below 650 °C) [108]. The examination of the ceramic microstructure using high magnification SEM SE images confirms the FTIR data (Figure 11b,c). The majority of the samples, especially those having the most intense main Si–O band (Figure 11a), have a non-vitrified (NV) [45,101], flaky or lath-like structure (Figure 11b) similar to that of unfired raw clay. HG-E_M5 and HG-E_S3 can be assigned to the intermediate stage (NV+) [108]. Their microstructure is not yet vitrified but some clay minerals look deformed and buckled [91]. CW-E_M1 has an initial vitrification (IV) texture [101,109] with fine glassy clay threads or filaments in some places (Figure 11c).

3.7. Mineralogical Analysis Using Scanning Electron Microscopy with Energy-Dispersive X-ray Spectroscopy (SEM-EDS)

3.7.1. Rock Fragments and Mineral Inclusions

Analysis of mineral inclusions using SEM-EDS with BSE imaging detected only fragments of intrusive igneous rocks, mainly granites. Most of the minerals and rock fragments are subhedral or anhedral, angular to subangular, affected by weathering and erosion. The same minerals are found in rock fragments, in addition to isolated grains of silt and fine sand.
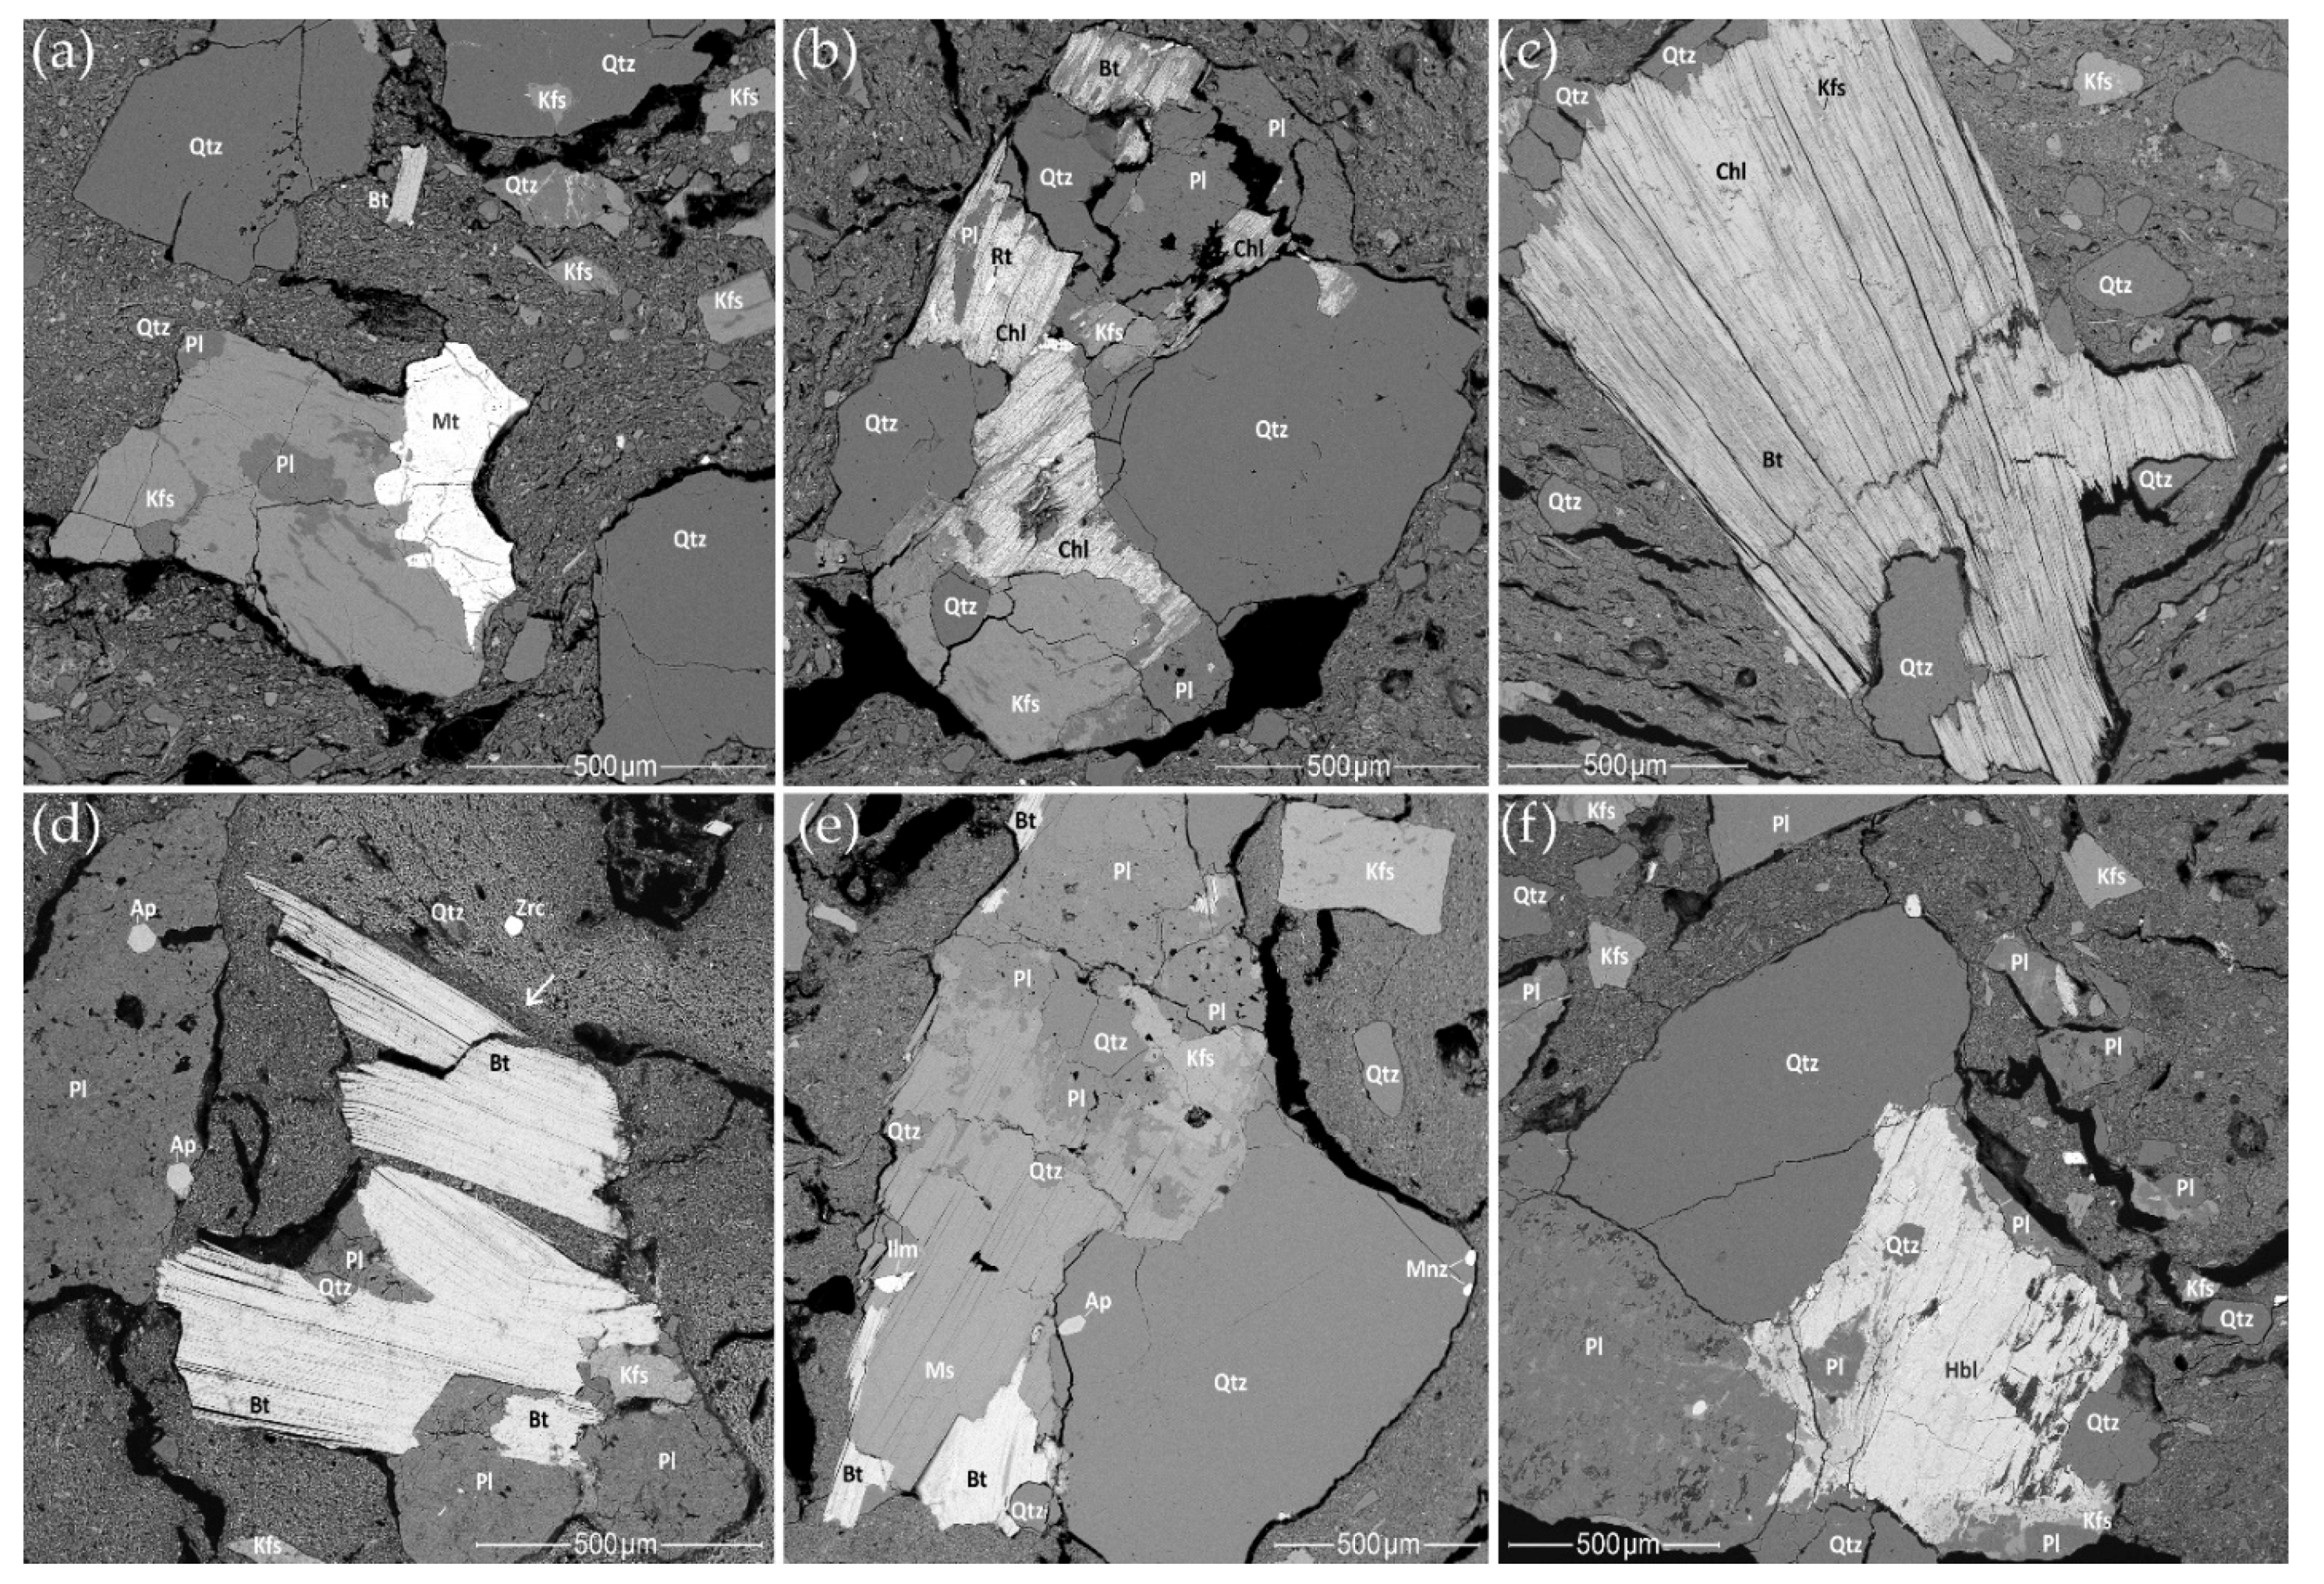
The most common granitoid fragments are those containing quartz (Figure 12a–f), feldspar (Figure 12a,b,d–f), and mica (biotite, chlorite, muscovite) (Figure 12b–e), in addition to magnetite (Figure 12a), ilmenite (Figure 12e), rutile, sphene, zircon, apatite (Figure 12d,e), and monazite (Figure 12e). Rare calcium amphibole fragments are also part of granitoids (Figure 12f).
The qualitative volume ratios of coarse silt and sand-sized mineral grains vary between samples (Figure S1): for quartz from 26% to 60%; for K-feldspar, from 8% to 39%; for plagioclase, from 3% to 38%; for micas, from less than 1% to 25%; amphibole was found only in three samples and had volume ratios of less than 1% to 18%. Iron oxide-hydroxides were found as silt-sized particles in most of the samples, which, together with other accompanying minerals (ilmenite, rutile, sphene, zircon, apatite, monazite), accounted for less than 1%, with only HG-E_M5 being a granitoid fragment having a coarse magnetite, and HG-L_B4 having a coarse ilmenite.
In all of the pottery samples, quartz was found as a clastic origin mineral, consisting of almost 100 wt.% SiO2. Minerals have clear boundaries marked by contraction voids. Quartz is abundant in the silt fraction, but coarse sand minerals or rock fragments (Figure 12a–f) are less frequent.
Feldspar is very common in rock fragments or as an isolated mineral and is even more common than quartz in the fine to coarse sand fraction. No thermally induced changes [75] were detected in either the feldspar or the quartz. Alkali feldspar (perthite and meso-perthite), which are composed of K-feldspar with lamellae of albite [110], have often been observed in SEM-EDS analyses. The chemical composition of K-feldspar varies from almost pure (98–100%) orthoclase to 8–16% albite incorporation (Table S10).
SEM-EDS analysis also indicated the presence of sodium-rich plagioclase, ranging from almost pure (98.6%) albite to oligoclase (with 18–31% anorthite) (Table S10). This is shown by not only a simple twinning texture but also by polysynthetic twinning. Usually, the plagioclase minerals were weathered (Figure 13a), with alteration to microcline [111] or even to micaceous clay [112]. At the edges of albite (Figure 13b), alteration to clay matrix was observed, resulting in a decrease in Na and an increase in K, Fe, and Mg. Kaolinite clay is not common in the studied pottery samples; however, in CW-E_M1, an oligoclase with areas of almost pure kaolinite [78] (Figure 13c) that were probably created by an earlier weathering process, was seen, unlike in the other samples.
The micas, with the exception of a few muscovites, are represented by biotite and its alteration products. Muscovite is enriched in Mg and Fe [110] (Table S11) and may be an alteration product of biotite [112] (Figure 14a). Muscovite has a homogenous Mg/(Mg + Fe) ratio of 47%–49%. The most common is Fe- and Ti-rich biotite, and its alteration product Fe-rich chlorite (chamosite) (Figure 14b–d). Biotite and chlorite have a similar Mg/(Mg + Fe) ratio of 26%–39%. Only a few minerals of Mg-rich biotite phlogopite (Mg/(Mg + Fe) ratio of 85%) and Mg-rich chlorite (Mg/(Mg + Fe) ratio of 54% and 76%) were detected. Gradual alteration of biotite to chlorite by depletion in K was observed [112] (Table S11) (Figure 14a,b). Most mica was found together with feldspar or/and quartz, in addition to accompanying minerals (Figure 12b–e and Figure 9b–d).
Calcium amphibole hornblende is rare in the studied material: in samples CW-L_M4 and HG-E_S3 it has been altered to chlorite (Figure 14c); in the clay pellets of sample CW-E_M2, very fine sand-sized grains of Mg- and Fe-rich hornblende [110] were found (Table S11). Only in sample HG-E_S3, were coarse grains of black Fe-rich hornblende (isolated and as part of granitoid fragments) detected (Figure 12f).
Accompanying minerals (Table S12) of silt and fine sand size, such as rutile (Figure 12b and Figure 14b,d), apatite (Figure 12d,e, Figure 13a and Figure 14b), monazite (Figure 12e and Figure 14b), zircon (Figure 12d and Figure 13c), are commonly found in rock fragments or as isolated grains, but only magnetite (Figure 12a) and ilmenite (Figure 14b) were found in the coarse sand fraction.

3.7.2. Mineralogical Composition of the Clay Matrix

The mineralogical composition of the clay matrix was investigated using SEM BSE imaging, and a high variability of micas, felsic, and heavy minerals in the clay–medium silt fraction was observed. The clay in the pottery samples can be divided into two types according to its texture and degree of weathering:
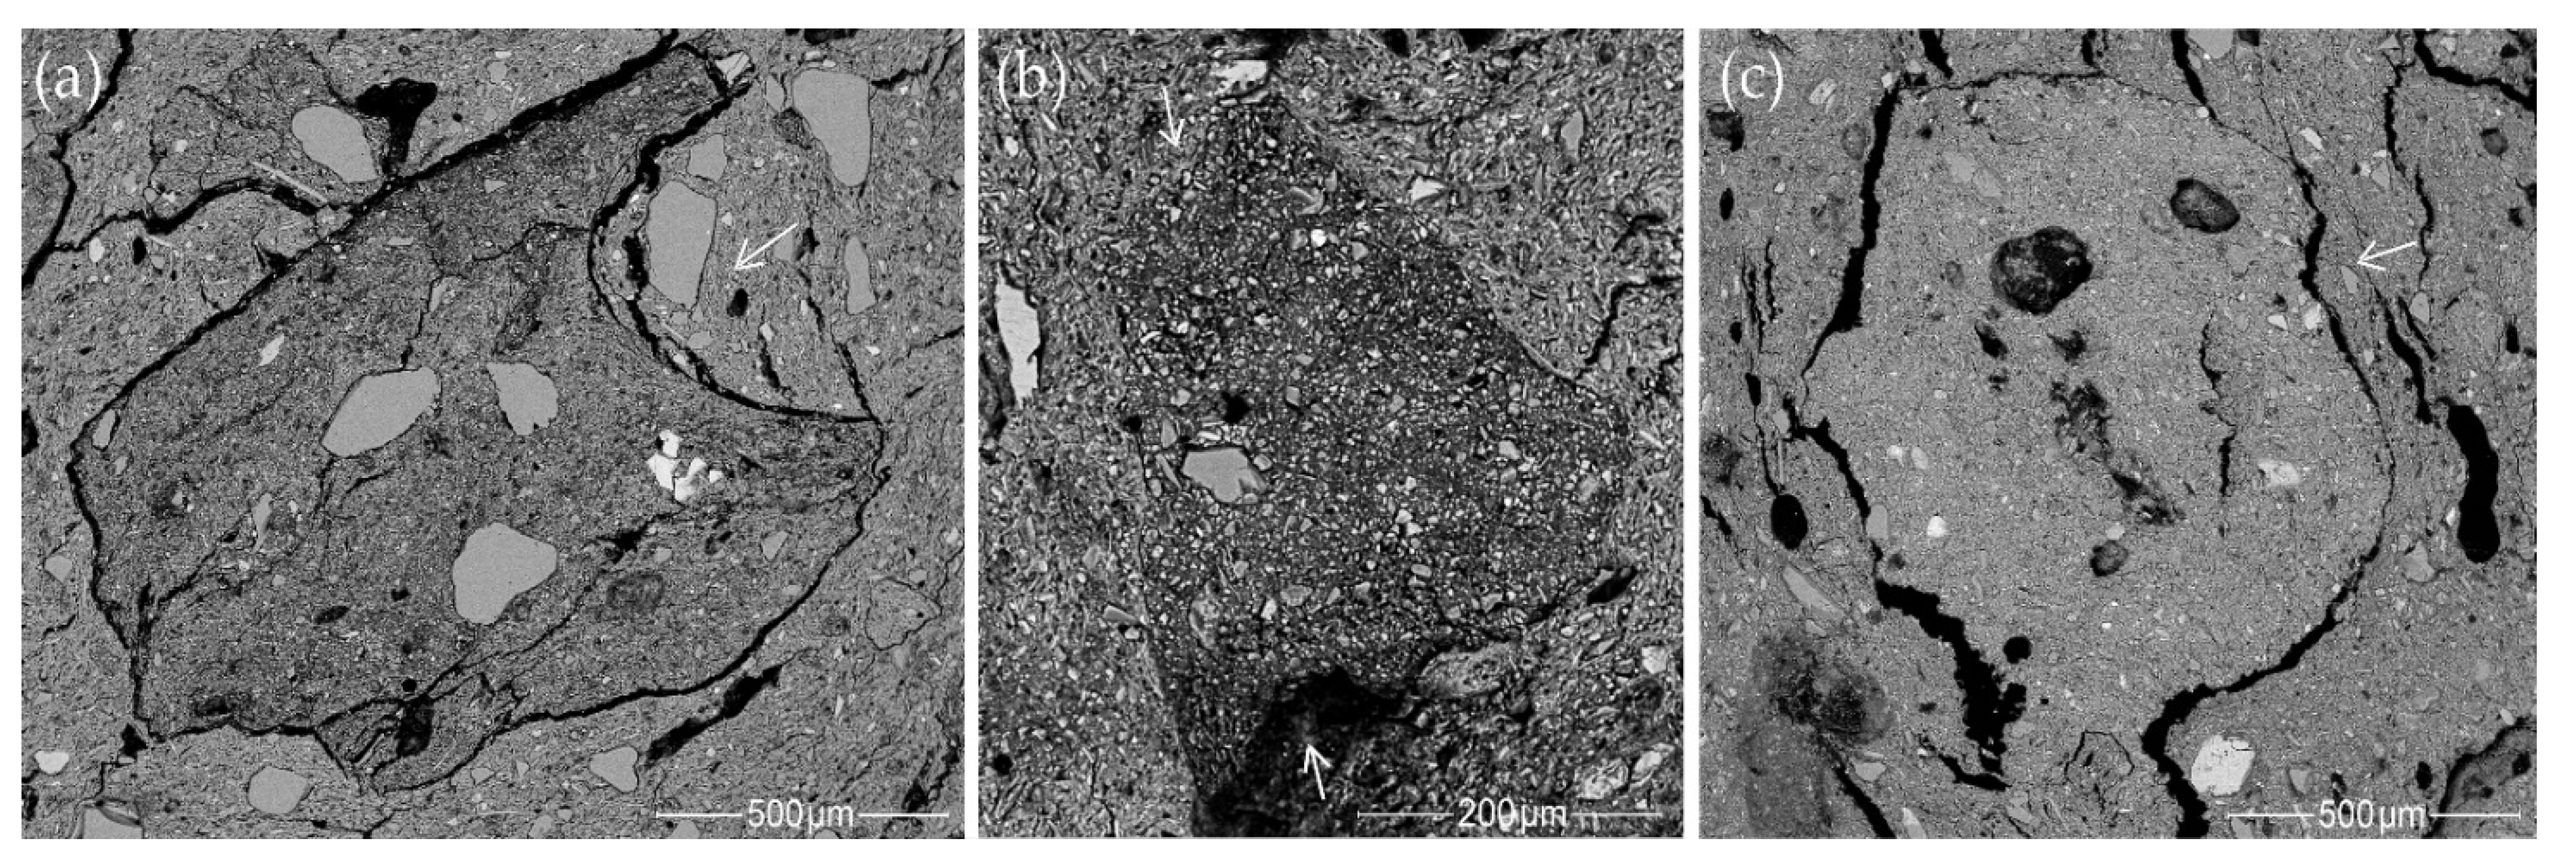
  • Most samples from the Margiai and Šakės settlements (CW-E_M1, CW-E_M2, CW-E_M3, HG-E_M5, CW-L_S1, CW-L_S2, HG-E_S3) consist of poorly weathered micaceous silty clay with abundant clay–silt size, mainly felsic and accompanying minerals (magnetite, zircon, ilmenite) (Figure 15a,b). The clay matrix is characterized by low to good adhesion and high variability of chemical composition. Such variegated residual clays [24] should be characteristic of glacial till sediments [113].
  • The samples from the Barzdis settlement (HG-L_B2, HG-L_B3, HG-L_B4) contain mature, highly weathered fine clay with a spongy texture of lath-like illite minerals [93] and show very good adhesion (Figure 15c). The chemical composition of the clay matrix is the closest to the typical illite (Tables S13 and S14) [78]. Such sedimentary clays [24] may be characteristic of glaciolacustrine sediments [114]. Despite the high proportion of silt and very fine sand-sized quartz grains, samples CW-L_M4 (Figure 15d) and HG-L_B1 may be assigned to the same type based on the spongy texture of the highly weathered mature clay. It is difficult to determine whether these water-worn quartz grains, probably from lacustrine or alluvial sediments, are of natural or intentional temper, but this homogenous distribution argues in favor of a natural origin for the quartz grains in the clay.
The chemical composition of the clay minerals was obtained by SEM-EDS analysis at several points in homogenous areas of the clay matrix. Only reasonable analyses showing not less than 75% totals were selected for statistical analysis. Due to the high compositional variability of the pottery samples, data from individual points [75] were analyzed instead of the average values of each sample [77]. Analyses show a wide compositional range: for SiO2 (23–62 wt.%), Al2O3 (16–36 wt.%), K2O (1–11 wt.%), FeO (1–23 wt.%), MgO (1–6 wt.%), P2O5 (0–7 wt.%), TiO2 (0–5 wt.%), and MnO (0–2 wt.%) (Tables S13 and S14). Only very low amounts of CaO (0–1.5 wt.%), with the exception of one point in HG-E_S3 of 3.8 wt.% (Table S14) and Na2O (0–0.5 wt.%), were present. Similar chemical compositions of clay minerals were determined for prehistoric pottery from Romania [75] and Bulgaria [77].
Only half of the analyses have structural formulae close to stoichiometry of illite minerals (Table S13). The other portion consists of structure-less Fe-rich micaceous-hydromicaceous clay matrix (Table S14). Both the illite minerals and the clay matrix have a lower K content and higher Fe content than typical illite [78], but some analyses of mature clay minerals and matrix show elevated K2O (7–11 wt.%) and Al2O3 (28–36 wt.%) contents (Tables S13 and S14). The Fe/(Fe + Mg) ratios vary significantly for the illite minerals and the Fe-rich micaceous clay matrix: from 54% to 70% for the former and from 69% to 94% for the latter.
In the clay matrix, the observed high variability of P is often explained by organic residues [62,63,64], silt-sized grains of apatite [75,115], or post-depositional transformations [31,59,74] and due to diffusion of P-altered illite with depletion in K [75,116]. Fine grains of apatite were detected in the studied material, but their content was very small and no positive correlation of P with Ca in clay matrix was observed. The Fe-enriched illite (Table S13) minerals and clay nodules with iron oxidation-hydroxidation (goethitisation) process (Table S14) show a positive correlation of P with Fe, which may be related to absorption of P- and Fe-enriched water [74]. However, the very high P2O5 content (>5 wt.%) observed in the matrix of discrete light reddish-brown plastic clay areas (Table S14) can hardly be explained by only the post-depositional effect and may be more related to organic residues.
The iron oxidation-hydroxidation (goethitisation) process is clearly visible as discrete nodules in the micaceous clay matrix (Figure 16a–d). Such ferruginous clay concretions with similar chemical composition (Tables S13 and S14) are mentioned in the literature as ‘iron pellets’ [115], ‘bohnerz’ [117], Fe-aggregate [67], Fe-rich pedogenic concretions [115], ‘soil concretion’ [76], ‘ferruginous nodules’ [59], or ‘iron-rich pedogenic nodules’ [24]. In high magnification BSE images, they show a mica structure (Figure 16a) and represent a chemical composition very close to that of Fe-rich chlorite (chamosite) [110] (Table S14). Higher than 15 wt.% content of FeO is accompanied by an insignificant increase in amounts of P2O5, MnO, MgO, and TiO2. The formation of such ferruginous clay nodules is explained by alteration of biotite to vermiculite with goethite [112] or alteration of biotite to chlorite/vermiculite [114], and alteration of chlorite to vermiculite/kaolinite with goethite [118].
Ferruginous nodules are characteristic of micaceous clay matrix fired at both very low and medium temperatures, differing only in their appearance. In very low-temperature-fired clay, the edges of the nodules appear diffuse (Figure 16b), while in the clay matrix fired at low to medium temperatures (due to the shrinkage of the clay) clear boundaries are visible, marked by contraction voids (Figure 16c,d).
In the mature, well-weathered clay, no ferruginous clay concretions are observed but another process, i.e., an iron diffusion from biotite to clay minerals, was detected (Figure 12d). It has been reported that a low-temperature-fired clay matrix with an open sponge-like structure is particularly prone to absorbing iron and phosphate from the environment [74].

3.8. Identification of Technological Styles through a Geochemical and Mineralogical Approach

Potters selected clay sources on the basis of their availability [119] and physical properties: plasticity, impurities, shrinkage of the clay paste, and hardness of the resulting ceramic material [120]. Raw materials must have been accessible locally in the Dubičiai-Rudnia microregion (Figure 1b), but mixed Quaternary sediments deposited by several glaciations complicate the study of provenance. However, a geochemical analysis of the clay matrix (by SEM-EDS) and the bulk composition (by XRF) (Figure 8 and Figure 9) shows that the ceramic paste preparation process made a significant contribution based on the chemical signatures of the pottery samples. Similar observations were made during geochemical study of the pottery from the postglacial lowlands in neighboring Poland [58].
Such ceramic paste preparation strategies and other technological choices that reflect the potter’s experiences, skills, and customs, which were influenced by cultural traditions, could be summarized as ‘technological style’ [121,122,123]. The geochemical and mineralogical analysis of the samples revealed five technological styles of local ceramic production based on raw material manipulation, shaping, surface treatment, and firing temperature.

3.8.1. Early Coarse Pottery

In the early 3rd millennium BCE, both the hunter-gatherer pottery (HG-E_M5, HG-E_S3) (Figure 2g,h) and the first cord-decorated pottery, which is associated with Globular Amphora Culture farmers (CW-E_M1) (Figure 2a), shared a similar technological style. This technological style is represented by coarse pottery and corresponds to the dendrogram’s C’R1b subbranch based on the XRF analysis of major and trace elemental amounts in the bulk composition of the pottery samples (Figure 9). The color of the cross-sections, ranging from light to dark brown or grey (Figure 2a,g,h), indicates firing in a bonfire or a pit under poorly controlled [70] or oxidizing [67] conditions. According to the FTIR analysis, the ceramics were fired at a low to medium temperature (650–800 °C) (Figure 11a). However, the dehydroxylation of the hydromicaceous minerals depends not only on the temperature but also on the soaking time [98]. Only clay minerals in CW-E_M1 show the beginning of the initial vitrification stage, which is visible in the high-magnification SEM SE image (Figure 11c).
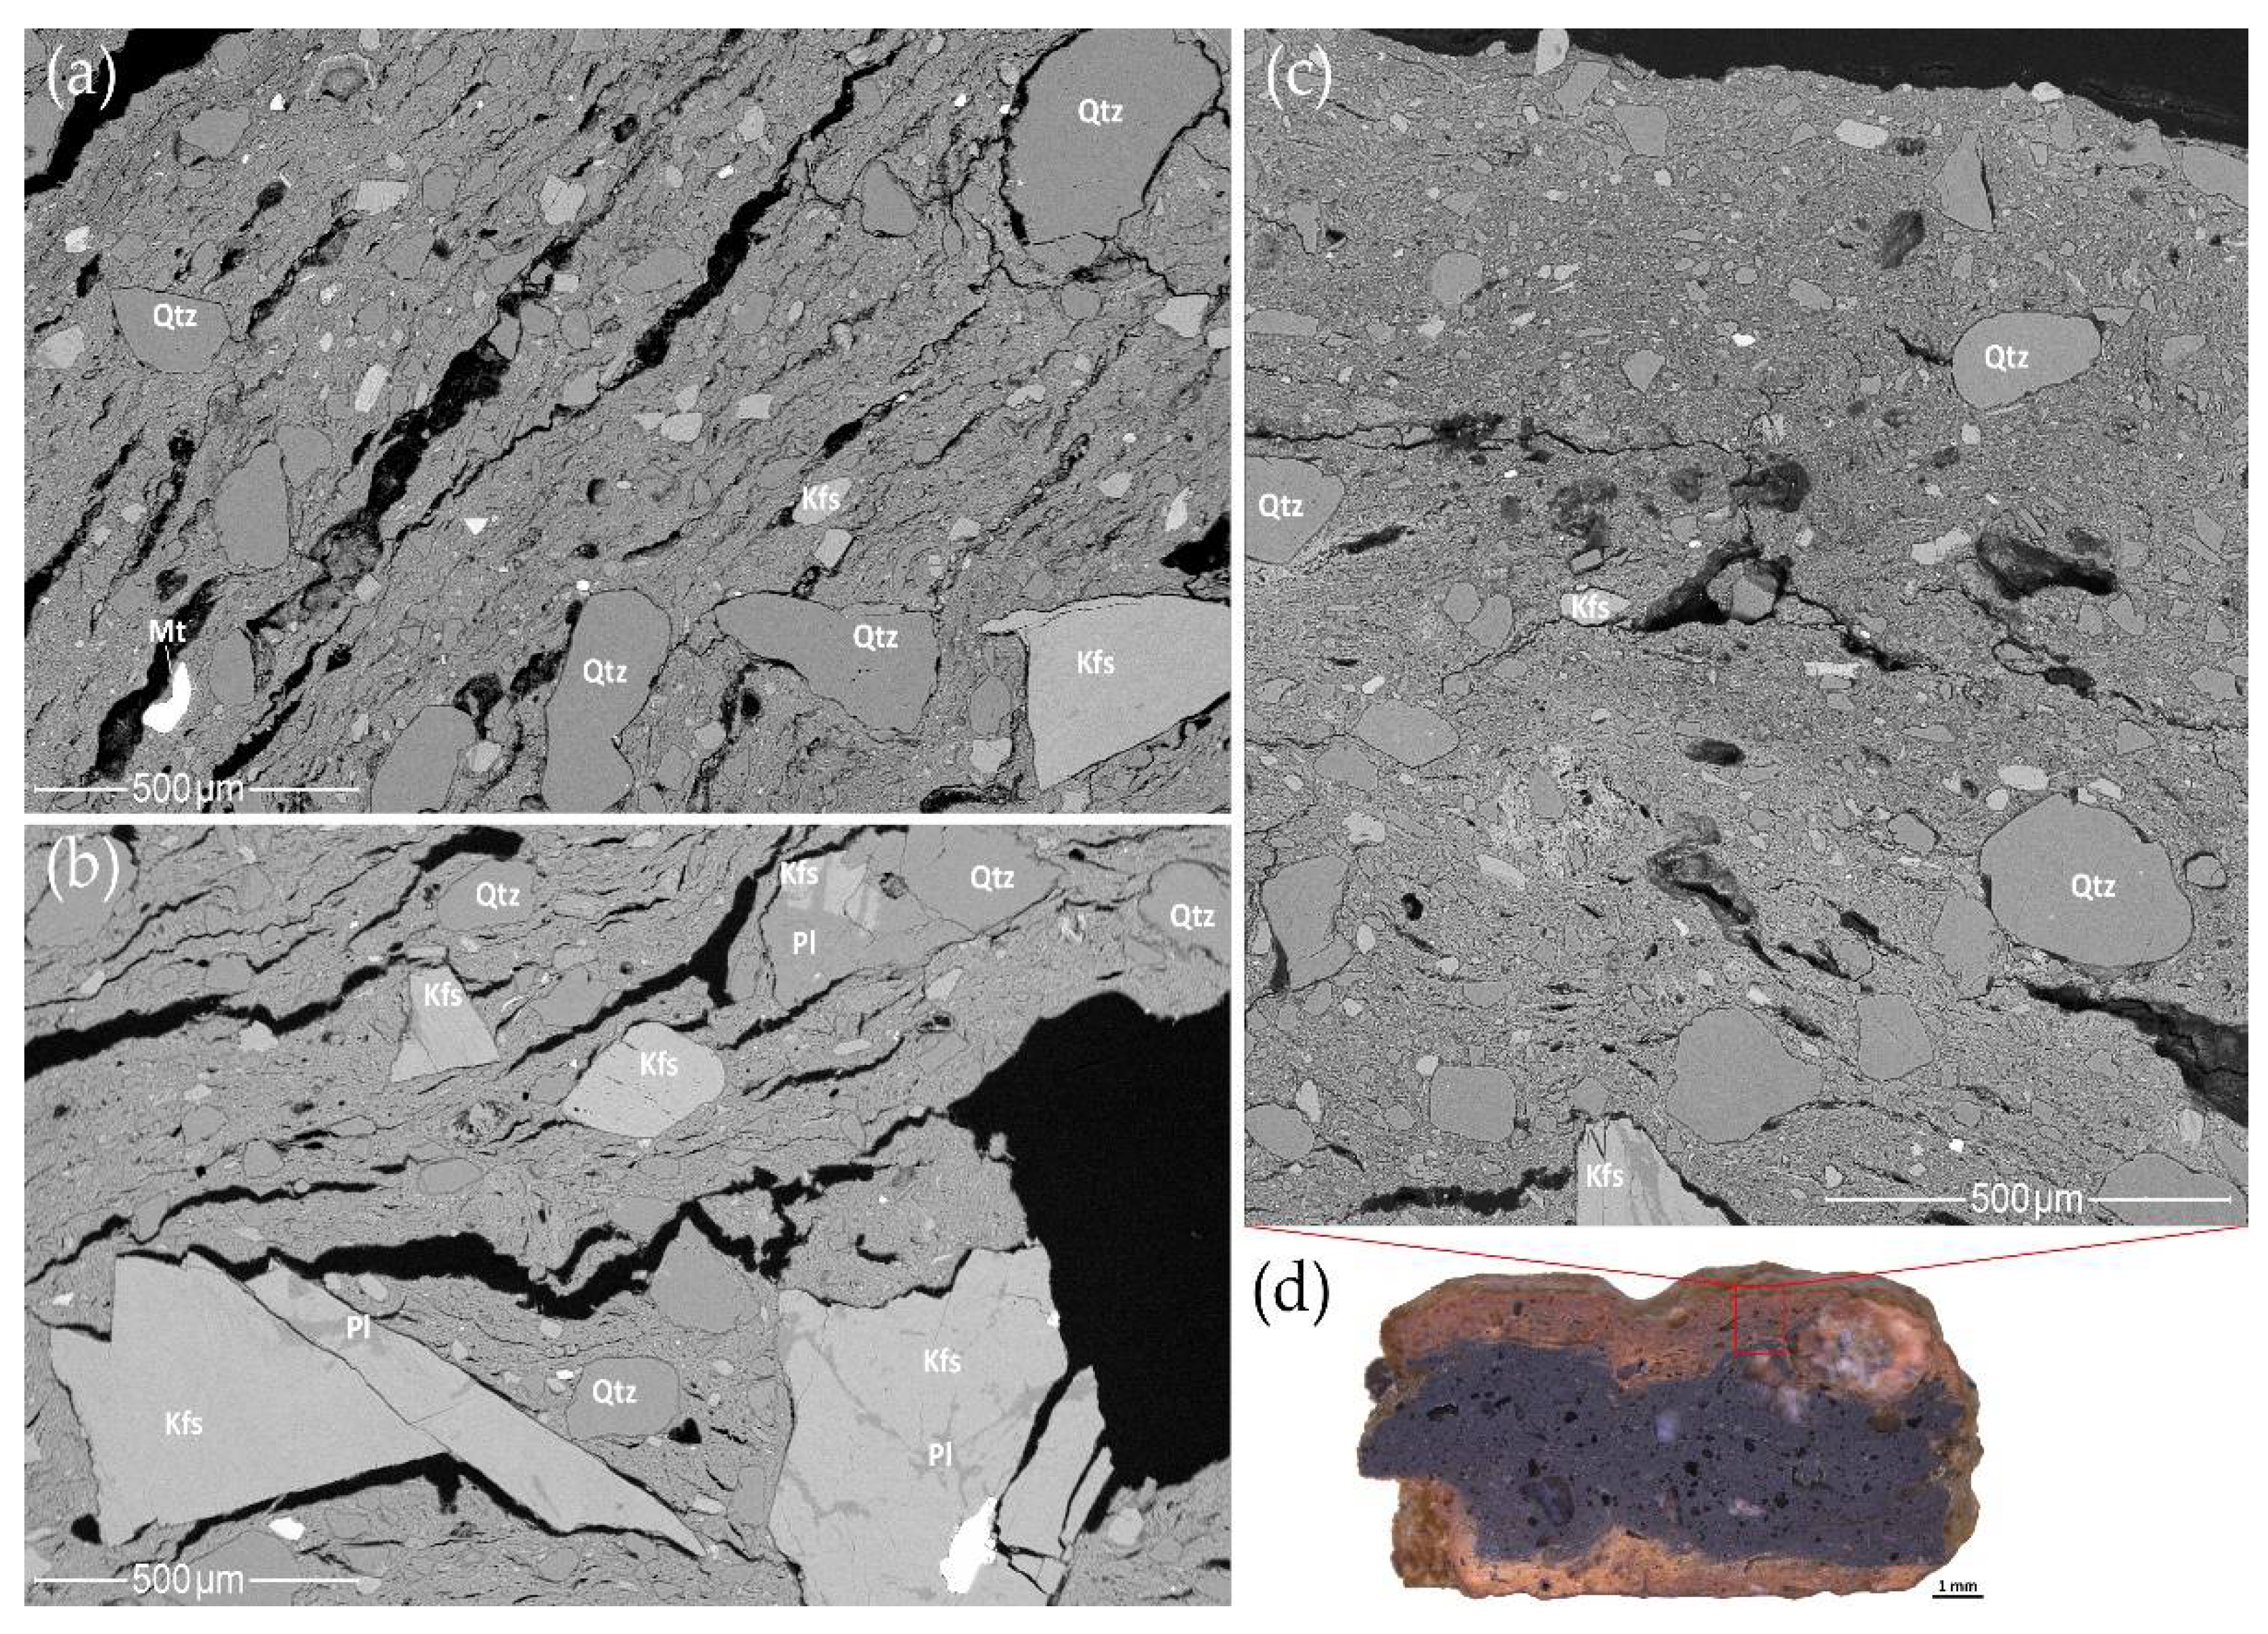
The pottery was made from variegated silty clay (55–60 vol.%) with abundant (29–33 vol.%) poorly sorted (0.04–2.6 mm size), angular–subangular minerals and rock fragments. This group is characterized by the highest ratio (11–12 vol.%) of macro-elongated voids, the result of shrinkage during the drying or firing process (Figure 17a–c). Such heterogeneous residual clay [24] with various clay layers and lenses, angular minerals, and rock fragments is characteristic of subglacial till [113]. Different clay areas can be seen in the cross-sections of the studied samples and might be explained by a poor homogenization [69] rather than an intentional mixing of the clay [71]. Angular particles are generally interpreted as an indicator of artificial temper, but can be natural in till sediments [39].
Despite the variety of minerals (quartz, feldspar (Figure 17a), mica, accessory minerals (Figure 12a and Figure 17b), and amphibole (Figure 12f and Figure 17c), the pottery samples belong to the same petrographic group, as the same granitoid fragments were used for the temper. Coarse rock fragments containing a combination of quartz, feldspars, micas, and hornblende found in the hunter-gatherer ceramics (Figure 12a,f and Figure 17b,c) suggest that well-weathered granite gravels and erratic boulders, which crumble easily during low energy mechanical treatment, were used as temper. In cord-decorated pottery sample CW-E_M1, coarse quartz minerals were observed to be isolated from feldspar and no coarse mica was detected (Figure 17a). This may be due to the thermal treatment of the rock fragments: at 573 °C, a transformation from α-quartz to β-quartz occurs with a significant change in volume [110]. Ancient potters were probably aware of quartz propensity to expand by more than 20%, making unburnt quartz undesirable in pottery [124], but important in the preparation of granitic temper.
According to the XRD analysis, this technological style has the highest content of plagioclase (Figure 10c). The XRF analysis of the samples also showed a higher Na2O and CaO content, which is typical of plagioclase (Figure 9). (The very high CaO content of HG-E_S3 is also related to the use of hornblende-bearing temper.) Experimental studies have shown that some feldspar proportions improve the properties of clay. K-feldspar increases clay’s workability and lowers the temperature of the vitrification process, which reduces porosity and permeability while increasing the fired pot’s hardness. Plagioclase, by comparison, increases pore size, thereby reducing clay shrinkage and improving thermal shock resistance [125].
All the pottery samples were made by coiling but the hydric state of the clay paste varied [26]. The pottery’s smooth, glossy external, and sometimes internal, surfaces might have been created by burnishing [23] or some other surface treatment, which archaeologists have long interpreted as slip [15]. Stereomicrographs, in addition to SEM SE and BSE images of HG-E_M5 (Figure S2a–c) and HG-E_S3 (Figure 17c), show a light, mature clay layer with a sponge-like texture on the surface. According to SEM-EDS data, the surface layer differs from the core matrix by a slightly higher aluminum and iron content and a significantly higher P2O5 content (>5 wt.%) (Table S14). Such differences can hardly be explained solely as the result of ceramic weathering or a post-depositional transformation process. Experimental archaeology suggests that the compact, glossy surface may have been obtained by burnishing [15,23], but the thick layer of P-rich mature clay may indicate an earlier stage of surface treatment. Coating the surface with a clay slurry, in addition to the smoothing and percussion carried out using a paddle soaked in some P-rich liquid or matter, result in a layer of clay slurry on the surface of pottery. Such a glossy surface not only has an aesthetic but also a functional purpose, i.e., to increase the thermal and mechanical shock resistance of cooking pots [26]. The higher P content, together with the Ca in connection with S, that was detected by XRF analysis in the early coarse pottery samples (CW-E_M1, HG-E_M5, HG-E_S3) (Figure 9), may indicate that these vessels not only had cooking pot properties but were also intensively used in food production [63,64].

3.8.2. Classic Corded Ware

The classic Corded Ware technological style is represented by a fine beaker (CW-E_M2) and a short-wave molded pot (CW-E_M3) with a black clay matrix containing light-colored clay inclusions (Figure 2b,c), which are usually interpreted as grog. This corresponds to the dendrogram’s C’R1a’R subbranch based on the bulk composition geochemistry (Figure 9).
The classic Corded Ware samples were made from micaceous clay (Figure 15b) that presumably originated in till sediments. The ceramic pastes contain fewer aplastic inclusions, and this residual clay was probably sieved and well homogenized. Sample CW-E_M2 was made from 90 vol.% clay matrix with 7 vol.% of very fine to fine, angular to subangular, quartz, alkali feldspar, and hornblende grains. CW-E_M3 consists of 76 vol.% clay with 16 vol.% of aplastic inclusions: very fine to fine, subround to subangular quartz, feldspar grains and a few 1.1–1.4 mm size granitoid fragments.
This study attempted a detailed investigation of the clay-based inclusions, commonly referred to as grog. The black clay matrix of a beaker (CW-E_M2) displayed light-colored clay pellets, which constitute about 4% of the clay matrix and are concentrated closer to the external surface (Figure 2b). The boundaries of the clay-based inclusions look diffuse and merging in the stereomicrographs and indetectable in the SEM SE images, but sharp to diffuse in the SEM BSE images (Figure 18a,b). Their microstructure and chemical composition differ only slightly from that of the main clay matrix. Some inclusions are higher in calcium due to the presence of hornblende (Figure 18a) (Table S11); others are lower in iron and higher in silicon with potassium due to the abundance of quartz, K-feldspar clay, and fine silt-sized grains (Figure 18b).
Despite the sharp boundaries seen in the SEM BSE images, the clay-based inclusions are similar in texture to the main clay matrix and were deformed by mechanical pressure during the clay body’s processing (Figure 18a–c). They thus represent the use of dried lumps of the same clay [71,85,126] rather than of aplastic argillaceous rock fragments [72] or grog [8,9,10,11,12]. A short-wave molded pot (CW-E_M3) contains very few clay pellets, which are neither structurally nor chemically distinct, with only contraction voids marking the boundaries (Figure 18c). No intentional use of dried clay lumps is observed in CW-E_M3, but the numerous ferruginous nodules (Figure 16b) and weathered minerals (Figure 13b) in the pottery sample could appear grog-like to the naked eye.
The potsherds’ black cores are usually interpreted as being the result of reduction firing conditions [67] or as incompletely oxidized organic matter trapped inside the clay paste [70]. Hematite (Fe2O3) forms during oxidizing firing conditions, which causes a reddish-brown pigment in pottery, but under reducing firing conditions, pottery turns grey to black due to the formation of iron oxide magnetite (Fe3O4) [109]. Iron oxyhydroxides transform into magnetite during firing in a reducing atmosphere above 750 °C [127]. No XRD diffraction peaks (Figure 10a) or FTIR bands (Figure 11a) associated with well-crystalized hematite or magnetite were detected in the studied samples, and the classic Corded Ware was determined to have been fired at a very low temperature (around 550 °C). In most of the investigated samples, hematite formation occurs only on the ceramic surfaces, the black interior of the sherds having been caused by charred organic matter, a very low firing temperature, and a short soaking time [98,126], rather than by specially designed reducing firing conditions. The black color of the clay matrix was highly important for Corded Ware traditions but it is still unclear how it was created. No voids characteristic of cattle dung or another organic matter were found. The deep black color can perhaps be explained by the addition of powdered charcoal to the wet clay matrix but further experiments are needed to confirm this theory.
Appearance of classic Corded Ware traditions in Southeast Lithuania circa 2800 BCE is marked by significant changes in the pottery manufacture strategies (especially the firing conditions), but it can hardly be associated with the work of highly skilled potters [9,11]. Corded Ware is usually characterized by tempering with grog and firing in a reducing atmosphere [8,9,10,11,12], but in Southeast Lithuania (based on published SEM BSE images [9]) and in the entire Baltic region, it is possible that the ceramic manufacturing traditions of South and Central Europe [45,77,108] were just imitated.

3.8.3. Late Fine Pottery

The thin-walled ceramics having a compact clay body match the dendrogram’s C’R1a’L subbranch (Figure 9). The pottery is characteristic of both hunter-gatherers and farmers at different settlements. The small cup (HG-L_B1) (Figure 2i) and cord-decorated beaker (CW-L_M4) (Figure 2d) are distinguished by their high SiO2 and the characteristic Zr and Hf content according to the XRF bulk composition chemistry. The ceramics show a specific, compact clay matrix with a sponge-like texture in SEM SE images (Figure 19a) and abundant silt, very fine sand-sized grains of quartz and feldspar visible in the SEM BSE images (Figure 19b). Any voids are rare and mostly associated with organic matter (Figure 19b,c).
Plastic, well-weathered sedimentary clay, presumably originating in glaciolacustrine deposits, was used to produce the pottery. Changes in the selection of clay raw material probably reflect an ability to adapt quickly and flexibly to the environment. In the second half of the 3rd millennium BCE, the water level of Lake Dūba [128], the shoreside location of the Margiai and Barzdis settlements, dropped significantly, possibly exposing layers of fine, homogenous, naturally levigated sedimentary clay with high plasticity that would require the use of temper in order to obtain a workable paste [24]. This probably led to the homogenous addition of roughly 20 vol.% of very fine sand-sized quartz grains from lacustrine or alluvial sediments. The potters then chose different strategies: the cord-decorated beaker was tempered with a few very coarse (0.9–1.5 mm) rock fragments (Figure 12b) and feldspar grains (Figure 19a,b), and the hunter-gatherers’ cup with roughly 12 vol.% of straw (Figure 19c).
FTIR (Figure 11a) and XRD analyses (Figure 10a) showed the pottery to have been fired at a very low temperature (HG-L_B1 below 550 °C), which was probably done intentionally due to the ability of quartz to significantly increase its volume above 573 °C, thereby shattering any thin-walled vessels [124]. Unlike most of the other potsherds, which have a variegated cross-section from being briefly fired in an poorly controlled environment, samples CW-L_M4 and HG-L_B1 display a light reddish-brown cross-section from the core to the margins (Figure 2d,i) and a homogenous microstructure characteristic of a slow heating gradient and a longer soaking time [45].

3.8.4. Late Corded Ware

Cord-decorated beakers (CW-L_S1 and CW-L_S2) from the Šakės settlement (Figure 2e,f) display Corded Ware ornamentation, a beaker shape, and a black core, in addition to a very coarse ceramic paste with poor adhesion, which is more typical of early hunter-gatherer pottery. The late Corded Ware style corresponds to the dendrogram’s C’R2 subbranch, which links the pottery with high values of K2O and Na2O, in addition to Rb and Sr (Figure 9). In this case, however, K2O and Na2O are more indicative of alkali feldspar than of fat clay and a high Sr content characterizes all of the ceramic samples from the Šakės site.
The beakers were made from lean micaceous silty clay that presumably originated in till deposits. The material consists of 60–62 vol.% clay matrix, with 30–32 vol.% poorly sorted, angular to subangular minerals and granitoid fragments (mainly quartz, feldspar, and chamosite) between 0.03 and 2.9 mm in size, and 8–9 vol.% micro-vughs, meso- or macro-elongated voids (Figure 20a,b). An abundance of microcline and perthite was found in the coarse silt to very coarse sand fraction (0.03–2 mm). The high-volume variability limits the ability to determine whether the alkali feldspar is natural to the till clay or comes from the temper. The XRD diffraction patterns of samples CW-L_S1 and CW-L_S2 also show the highest K-feldspar and albite content (Figure 10b).
Late Corded Ware likely demonstrates changes in the potters’ perception of the suitability of the resources through the intentional selection of very coarse alkali feldspar (perthite or meso-perthite) temper, alkali feldspar-rich granite being distinguishable by its red color. It is difficult to determine whether it was used for functional purposes (to increase the clay’s workability and decrease its permeability) [125] or aesthetic purposes. The potters seem to have studied the properties of the various minerals and deliberately chose red stones. Black minerals (biotite, chlorite, and hornblende) were also preferred, especially in a dark clay matrix. For example, 2 mm size black chamosite was found in CW-L_S2 (Figure 12c). It is still unclear whether the abundance of black iron-rich chlorites may have affected the matrix’s color.
Beakers probably represent two different shaping strategies for vessels. CW-L_S2 was made of entirely black, coarse clay paste with a thin reddish-brown layer forming on the surface under iron-oxidizing environmental conditions (Figure 2e). Furthermore, signs of black coils and a thick compact surface layer of reddish-brown clay may be seen in the cross-section of CW-L_S1 (Figure 20d). Coils with poor adhesion were probably coated with a plastic clay slurry to prevent them from separating during the drying process [26]. The light reddish-brown layer differs texturally (smaller mineral inclusions (<0.25 mm) and a compact microstructure with good adhesion) (Figure 20c) and chemically from the black core, having more characteristics of fat iron-rich illite clay (with a slightly higher Al2O3 and FeO content, and a significantly higher (from 0 to 6 wt.%) P2O5 content) (Table S14).
The vessels were fired in a pit or bonfire at low temperatures (around 650 °C) under poorly controlled or reducing conditions. The formation of a black core and a reddish-brown external surface is often interpreted as iron oxidation when the vessel, after being fired in a reducing atmosphere, is taken out while still hot and left to cool in the open air [11,129]. When compared to the other low fired samples, no differences were detected between the XRD diffraction peaks (Figure 10b) and the FTIR spectra bands (Figure 11a) of iron oxides. However, the differences in the chemical and mineralogical composition of the layers cast doubt on whether just the firing conditions affected the clay paste’s color.

3.8.5. Late Coarse Pottery

Late coarse pottery is represented by cooking and storage pots, which are characterized by a fine clay matrix with a very coarse temper of rock fragments (HG-L_B3, HG-L_B4) (Figure 2k,l) or straw (HG-L_B2) (Figure 2j). This technological style matches the dendrogram’s C’L branch, which shows a very high content of major elements: Al2O3, Fe2O3, TiO2, MgO, and K2O, in addition to trace elements: V, Nb, Cu, Zn, Ni, and Rb (Figure 9).
The chemical and mineralogical composition of the clay matrix is characterized by mature iron-rich illite (Table S13). The very plastic clay matrix of the samples looks naturally levigated and displays a sponge-like texture (Figure 21a–d). This sedimentary clay could probably have come from lakeshore glaciolacustrine deposits, but should be characterized by a higher CaO and a lower Fe2O3 content [24]. All the studied samples displayed very low CaO values. Some morainic tills are originally poor in calcium; moreover, calcium depletion might have been caused by the sherd’s post-depositional environment in acidic sandy soil. Iron migration in the Barzdis settlement samples differs from that of the other samples. An iron diffusion from biotite to clay minerals was observed in HG-L_B3 (Figure 12d). The few muscovite minerals, all found in samples from the Barzdis settlement, also appear to be alterations of iron-depleted biotite (Figure 12e, Figure 13a and Figure 14a). This is probably due to the specific properties of a sponge-textured clay matrix to absorb iron from micas and perhaps also the surrounding soil [74]. However, it should be noted that, despite the very high iron content, the clay matrix of the Barzdis samples having low to medium P2O5 content (0–1.3 wt.%) (Tables S13 and S14) shows no particular tendency to absorb phosphate from the environment.
Samples HG-L_B3 and HG-L_B4 consist of a very fine clay matrix (66–68 vol.%) with a bimodal distribution of mineral inclusions (28–30 vol.%): fine (rare, < 0.12 mm, weathered minerals) and coarse (abundant, 0.6–2.2 mm, angular to subangular minerals and rock fragments) (Figure 21a,b,d). Weathered, very coarse granitoid fragments are varied, containing quartz with feldspar (microcline and oligoclase), mica (biotite, muscovite, chamosite), and accompanying minerals (rutile, ilmenite, zircon, apatite, monazite) (Figure 12d,e and Figure 14b). About 4.5 vol.% of the ceramic material consists of meso- and macro-elongated voids and vughs, which differs from that of the previous groups. The vughs and elongated voids may be associated with decomposed organic matter and post-depositional transformations rather than with clay shrinkage during thermal treatment (Figure 21a,b,d).
The color of the clay matrix looks marbled in the cross-section probably because of a diffuse mixture of wet clay areas with various textures. The dark clay matrix is glossy, with meso- and macro-vughs, whereas the light matrix resembles a sponge-like texture with micro pores (Figure 21a–d). The texture of the dark clay matrix with fine-grained quartz that is visible in the high-magnification SEM SE images (Figure 21c) explains why the geochemistry of the dark clay shows a higher Si content than that of the light clay (Table S2).
The sample HG-L_B2 consists of the similar light-colored sponge-textured clay matrix (75 vol.%) with 3 vol.% of subangular and subround mineral grains in size from fine to medium sand. The ceramic paste differs in the type of temper: in this sample, the rock fragments have been replaced by 20 vol.% of straw (Figure 21e,f).
A temper of straw or very coarse weathered granite fragments was added to the high plasticity clay matrix, presumably to prevent the vessel from collapsing under its own weight. The typology of hunter-gatherer pottery is often based on the type of temper, but the chemical and mineralogical similarity of clay matrixes suggests that the same community could use vessels with different tempers for different purposes (cooking, storage, transportation).
According to the XRD (Figure 10a,b), FTIR (Figure 11a) analyses, and the variegated cross-sections of the samples, it can be concluded that the pottery was fired at very low temperatures (HG-L_B2 below 550 °C) under poorly controlled or oxidizing conditions. High-magnification SEM SE images of the clay matrix show the preserved lath-like texture characteristic of raw illite minerals (Figure 11c), proving that the firing temperature of the pottery was very low.

4. Conclusions

The need for a geochemical and mineralogical investigation of 3rd millennium BCE pottery from Southeast Lithuania is not only of national, but also inter-regional, archaeological interest. Ceramics discovered in a relatively small area were produced by two typological groups representing the Corded Ware Culture and local hunter-gatherer communities, which occurred widely across some European areas. SEM-EDS, XRF, XRD, and FTIR methods were employed to analyze the elemental, microstructural, and mineralogical composition of samples taken from this pottery.
  • A comparative analysis of the elemental amounts in the clay matrix (via SEM-EDS detection of ten major elements) and the bulk composition (via XRF of the same ten major elements and an additional eleven trace microelements) revealed the following geochemical features:
    (i)
    Compared to the mean content in the upper continental crust, the clay matrix and the bulk geochemical composition displays a marked enrichment of P. Slightly lower enrichment was observed for K, Ti, Fe, and Al. However, the ceramic samples are characterized by lower amounts of Ca, Na, and Si.
    (ii)
    A statistically strong difference (at a p < 0.01 significance level) was confirmed for the higher enrichment of Mg, Fe, Ti, Ca, Al, and K in the clay matrix compared to the bulk composition and lower amounts of Na, Si (p < 0.01), and Mn (0.01 < p < 0.05).
    (iii)
    No strong difference (p < 0.01) was found for any of the ten major elements, compared to their amounts in the composition of the lighter and darker material of the clay matrix. Only at the 0.01 < p < 0.05 significance level was it confirmed that the lighter clay matrix is richer in P but poorer in Si.
    (iv)
    No valid difference (p < 0.05) was observed for any elemental amounts in the clay matrix from the Corded Ware and hunter-gatherer pottery. However, the amount of Al, Fe, Mn, Cu, Ni, and Zn in the bulk composition of the hunter-gatherer pottery was found to be significantly higher than that in the Corded Ware pottery.
  • Cluster analysis showed different identification possibilities for using the results of the clay matrix and bulk composition geochemical research:
    (i)
    In the case of the clay matrix results, the clustering of samples belonging to the same culture is exceptionally rare. In the case of the bulk composition results, a completely different picture can be seen: the clustered pottery samples not only belong to the same culture, but are also similar in respect to their attribution to one period and location. Moreover, the clusters of the clay matrix results display greater linkage distances compared to the samples analyzed for bulk composition.
    (ii)
    Conditionally formatted color scaling is shown and proposed for further use as an effective tool for highlighting characteristic analytes. Clay and other accompanying minerals containing Al, Fe, Ti, and Mg can be additionally indicated by Cr, V, Nb, Cu, and Zn, while slightly different ceramic bulk compositions richer in K and Mn are also represented by Rb. Sr is important for identifying differences caused by the pottery sample’s location. The characteristic geochemical indicator of sand, Si, is linked to Zr and Hf. The organic component, mostly represented by P and accompanied by Ca, can in some cases also be successfully characterized by a link with S.
  • The geochemical data and its statistical treatment allowed us to hypothesize that:
    (i)
    The layers of raw clay, although sparse, may have been the same for centuries, and their locations may have been known to potters of both cultures. This is shown not only by the insignificant differences between the amounts of the major analytes in the clay matrix of the Corded Ware and the hunter-gatherer pottery, but also by the scattering of the relationships between the clustered clay matrix samples. It is probable that the most important selection criterion was the workability of the raw clay.
    (ii)
    Due to temper additives, the bulk composition, far better than the clay matrix, reflects the different technological choices, especially in relation to periods, more than places of manufacture and cultural traditions. The geochemical features of ‘periods’, ‘locations’, and ‘cultural traditions’ are more easily distinguished using cluster methods.
  • The XRD and FTIR analyses indicated a predominance of iron-rich illite clay, quartz, and alkali feldspar raw materials. Early coarse pottery was fired at low to medium temperatures. The studied ceramic samples show that the emergence of the classic Corded Ware traditions is accompanied by a decrease in the firing temperature of both the cord-decorated and hunter-gatherer pottery. Despite the black cores of the potsherds, FTIR and XRD results are not indicative of firing in a reducing atmosphere.
  • SEM-EDS with SE and BSE imaging were conducted to determine the detailed mineralogical and petrographic composition of the ceramic pastes. The SEM SE and BSE images showed textural differences in the clay matrix, some of which may be explained by intentionally mixing the clay or a specific pottery surface treatment. No grog temper characteristic of classic Corded Ware was detected, only clay pellets and weathered minerals, which may look like grog to the naked eye. The SEM-EDS point analysis allowed us to investigate the gradual changes in the chemical composition of the clay matrix. Both the Corded Ware and the local hunter-gatherer pottery were made from the same hydromicaceous variegated clay from the local Quaternary glacial sediments, which contain weathered granitoid fragments, but display different technological choices for the clay paste preparation, surface treatment, and firing strategies.
  • The main clusters of major and trace elements in the bulk compositions reflect the five technological styles identified by the ceramic raw material’s manipulation, shaping, and firing conditions. The combination of research methods not only allowed a bulk chemical and mineralogical characterization, but also the acquisition for the pottery samples of the microstructural composition and the variables that affect the pottery’s bulk chemical signature. The diversity of the pottery-making techniques reflects the potters’ decisions as influenced by environmental and cultural factors.

Supplementary Materials

The following supporting information can be downloaded at: https://www.mdpi.com/article/10.3390/min12081006/s1, Table S1. Selected statistical parameters of the bulk and clay matrix geochemical compositions of the pottery in the complete data set of twelve analyzed samples. *1 Clarke values (Cv) were taken from data provided in [56,57]. *2–4 Percentiles. *4 Median values. *5 Mean (average) values. *6 Coefficient of variations (%). *7 Constants indicating the ratios of the median amounts of analytes to corresponding Cv. —: not analyzed. Analytes are sorted according descending Cv values; Table S2. Elemental content of the light (LMC) and dark (DCM) clay matrix parts of the pottery samples (%, average values of the SEM-EDS analysis data for the sample’s clay matrix type). *1 Area occupied by a clay matrix type in a pottery sample (OA); Table S3. Selected statistical parameters of the elemental contents in the light and dark clay matrixes of the independent (not harmonized in matched pairs) pottery samples (%). *1–3 Percentiles. *3 Median values. *4 Mean (average) values. *5 Coefficient of variations (%). *6 Parameters for the results of 12 pottery samples with light shades. *7 Parameters for the results of 11 pottery samples with dark shade. *8 Constants indicating the ratios of median values of analytes for light to dark clay matrix and formula for their calculation. *9 Part of the area of the light or dark clay matrixes in the set of studied samples (%); Table S4. The Spearman rank order correlation coefficients calculated in eleven pottery samples between the ratios of the content in the lighter clay matrix to respective content in the darker clay matrix. The marked correlations are significant at p < 0.05; Table S5. Selected main statistical parameters of the geochemical bulk compositions in the hunter-gatherer and Corded Ware pottery. *1 50th percentile (median values). *2 Mean (average) value. *3 Coefficient of variations (%). *4 Number of analyzed samples. *5 p-level of the differences in the values between the hunter-gatherer and Corded Ware pottery data sets according to the Mann–Whitney U-test; Table S6. Selected main statistical parameters of the geochemical clay matrix compositions in the hunter-gatherer and Corded Ware pottery. *1 50th percentile (median value). *2 Mean (average) value. *3 Coefficient of variations (%). *4 Number of analyzed samples. *5 p-level of the differences in the values between the hunter-gatherer and Corded Ware pottery data sets according to the Mann–Whitney U-test; Table S7. The Spearman rank order correlation coefficients of the major analyte values in the clay matrix of the hunter-gatherer and Corded Ware pottery. The marked correlations are significant at p < 0.05. _HG: correlation coefficients linked to hunter-gatherer pottery. _CW: correlation coefficients linked to Corded Ware pottery; Table S8. Conditionally color-formatted ratios of the mean values and the coefficient of variations of the major crustal elements in the clay matrix of the pottery, which is clustered in dendrogram groups in accordance with Figure 8a panel. *1 ID of the tree branches. *2 Cultural assignment of the pottery samples to the hunter-gatherer (HG) and/or Corded Ware (CW) cultures. The number before the cultural group’s abbreviation indicates the quantity of samples. *3 The main clusters, named by the dendrogram branches. *4 The sample sub-branches joined in the first-level clusters or by chains of them (FLC). The samples in an FLC are joined at a linkage distance of less than 10; Table S9. Conditionally color-formatted ratios of the mean values and the coefficient of variations of the major and trace elements in the bulk composition of the pottery, which is clustered in dendrogram groups in accordance with Figure 9. *1 ID of the tree branches. *2 Cultural assignment of the pottery samples to the hunter-gatherer (HG) and/or Corded Ware (CW) cultures. The number before the cultural group’s abbreviation indicates the quantity of samples. *3 The main clusters, named by the dendrogram branches. *4 The sample sub-branches joined in the first-level clusters or by chains of them (FLC). The samples in an FLC are joined at a linkage distance of less than 25; Table S10. Representative SEM–EDS analyses of the feldspar minerals. Abbreviations: Ab—albite, An—anorthite, Mc—microcline, Olg—oligoclase, Or—orthoclase. * The number of ions in the chemical formulae for potassium feldspar and plagioclase were calculated on an 8-oxygen basis; Table S11. Representative SEM–EDS analyses of the mica and amphibole minerals. Abbreviations: Bt—biotite, Chl—chlorite, Hbl—hornblende, Ill—illite, Ms—muscovite, Phl—phlogopite, w—weathered. * The number of ions in the chemical formulae for muscovite, biotite, and chlorite were calculated on a 22-oxygen basis, for amphibole on a 23-oxygen basis, respectively; Table S12. Representative SEM–EDS analyses of the accessory minerals. Abbreviations: Mt—magnetite, Ilm—ilmenite, Rt—rutile, Ap—apatite, Zrc—zircon. * The number of ions in the chemical formulae for magnetite were calculated on a 4-oxygen basis, for ilmenite and zircon on a 3-oxygen basis, for rutile on a 2-oxygen basis, for apatite on a 25-O,OH,Cl,F basis, respectively; Table S13. Representative SEM–EDS analyses of the illite minerals. Abbreviations: Gth—goethite, Ill—illite. * The number of ions in the chemical formulae for the clay minerals were calculated on a 22-oxygen basis; Table S14. Representative SEM–EDS analyses of the clay matrix. The elevated Ti, Al, Fe, Ca, K, and P content is highlighted. Figure S1. The volume ratios of the major minerals in the samples, containing mineral temper. Abbreviations: Qtz—quartz, Kfs—K-feldspar, Pl—plagioclase, Bt—biotite, Chl—chlorite, Ms—muscovite, Hbl—hornblende, Ap—apatite, Ilm—ilmenite, Mnz—monazite, Mt—magnetite, Rt—rutile, Spn—sphene, Zrc—zircon; Figure S2. The boundary between the main dark clay matrix and the light upper layer of mature, sponge-textured clay in the sample HG-E_M5, as seen in: (a) a stereomicrograph (green square shows the location of Figure S2b, red square shows the location of Figure S2c; (b) SEM BSE image; (c) SEM SE image.

Author Contributions

Conceptualization, E.Š., G.S., and R.T.; methodology, E.Š., G.S., I.G.-P., A.K., A.S., S.S., G.Ž., and R.T.; software, E.Š., G.S., I.G.-P., and R.T.; formal analysis, E.Š., G.S., I.G.-P., A.S., S.S.; G.Ž., and R.T.; investigation, E.Š., G.S., and R.T.; resources, E.Š., G.S., A.S., A.K., and R.T.; data curation, E.Š., G.S., I.G.-P., A.S., S.S., and R.T.; writing—original draft preparation, E.Š., S.S., and R.T.; writing—review and editing, E.Š., G.S., I.G.-P., A.S., G.Ž., A.K., S.S., and R.T.; visualization, E.Š. and R.T.; supervision, G.S., A.K., and R.T.; project administration, E.Š.; funding acquisition, E.Š., G.S., I.G.-P., A.K., A.S., S.S., G.Ž., and R.T. All authors have read and agreed to the published version of the manuscript.

Funding

This research received no external funding.

Data Availability Statement

The data set is presented directly in the present study. Additional data (unpublished) are available upon request from the corresponding author (E.Š.).

Acknowledgments

The authors wish to thank R. Rimantienė and the National Museum of Lithuania for provision of the pottery samples; A. Merkevičius, D. Strazdas, and S. Širvydaitė-Šliupienė for methodological recommendations, and also R. Zinkutė for helping to improve the English language in the text related to geochemistry. The authors would also like to thank the anonymous reviewers for their useful comments that helped in the revision of this manuscript.

Conflicts of Interest

The authors declare no conflict of interest.

References

  1. Buchvaldek, M. Zum gemeineuropäischen Horizont der Schnurkeramik. Praehist. Z. 1986, 61, 129–151. [Google Scholar] [CrossRef]
  2. Furholt, M. Mobility and Social Change: Understanding the European Neolithic Period after the Archaeogenetic Revolution. J. Archaeol. Res. 2021, 29, 481–535. [Google Scholar] [CrossRef]
  3. Kristiansen, K.; Allentoft, M.E.; Frei, K.M.; Iversen, R.; Johannsen, N.N.; Kroonen, G.; Pospieszny, Ł.; Price, T.D.; Rasmussen, S.; Sjögren, K.-G.; et al. Re-theorising mobility and the formation of culture and language among the Corded Ware Culture in Europe. Antiquity 2017, 91, 334–347. [Google Scholar] [CrossRef] [Green Version]
  4. Gimbutas, M. The three waves of kurgan people into old Europe, 4500–2500 BC. Arch. Suisses D’Anthropol. Genérale 1979, 43, 113–137. [Google Scholar]
  5. Müller, J.; Seregély, T.; Becker, C.; Christensen, A.M.; Fuchs, M.; Kroll, H.; Mischka, D.; Schüssler, U. A Revision of Corded Ware settlement pattern–new results from the Central European Low Mountain Range. Proc. Prehist. Soc. 2009, 75, 125–142. [Google Scholar] [CrossRef]
  6. Robson, H.K.; Skipitytė, R.; Piličiauskienė, G.; Lucquin, A.; Heron, C.; Craig, O.E.; Piličiauskas, G. Diet, cuisine and consumption practices of the first farmers in the Southeastern Baltic. Archaeol. Anthropol. Sci. 2019, 11, 4011–4024. [Google Scholar] [CrossRef] [PubMed] [Green Version]
  7. Sjögren, K.G.; Price, T.D.; Kristiansen, K. Diet and mobility in the Corded Ware of Central Europe. PLoS ONE 2016, 11, e0155083. [Google Scholar] [CrossRef]
  8. Beckerman, S.M. Corded Ware Coastal Communities. Using Ceramic Analysis to Reconstruct Third Millennium BC Societies in the Netherlands. Ph.D. Thesis, University of Groningen, Groningen, The Netherlands, 2015. [Google Scholar]
  9. Holmqvist, E.; Larsson, Å.M.; Kriiska, A.; Palonen, V.; Pesonen, P.; Mizohata, K.; Kouki, P.; Räisänen, J. Tracing grog and pots to reveal Neolithic Corded Ware Culture contacts in the Baltic Sea region (SEM-EDS, PIXE). J. Archaeol. Sci. 2018, 91, 77–91. [Google Scholar] [CrossRef] [Green Version]
  10. Kroon, E.J.; Huisman, D.J.; Bourgeois, Q.P.J.; Braekmans, D.J.G.; Fokkens, H. The introduction of Corded Ware culture at a local level: An exploratory study of cultural change during the Late Neolithic of the Dutch west coast through ceramic technology. J. Archaeol. Sci. Rep. 2019, 26, 101873. [Google Scholar] [CrossRef]
  11. Larsson, Å.M. Making and Breaking Bodies and Pots. Material and Ritual Practices in Sweden in the Third Millennium BC; Department of Archaeology and Ancient History, Uppsala University: Uppsala, Sweden, 2009. [Google Scholar]
  12. Rauba-Bukowska, A. Microscopic analysis of pottery fragments from the Corded Ware Culture at Sites 11, 15 and 20 in Święte, Jarosław District. Balt.-Pontic Stud. 2018, 23, 163–177. [Google Scholar] [CrossRef] [Green Version]
  13. Kriiska, A.; Nordqvist, K. Estonian Corded Ware culture (2800–2000 cal. BC): Defining a regional group in the eastern Baltic. In Yamnaya Interactions: Proceedings of the International Workshop Held in Helsinki, 25–26 April 2019; Heyd, V., Kulcsár, G., Preda-Bălănică, B., Eds.; Archaeolingua: Budapest, Hungary, 2021; pp. 463–485. [Google Scholar]
  14. Rimantienė, R. The Neolithic of the eastern Baltic. J. World Prehist. 1992, 6, 97–143. [Google Scholar] [CrossRef]
  15. Šatavičė, E. Neolithic societies and their pottery in South-eastern Lithuania. Liet. Archeol. 2020, 46, 111–145. [Google Scholar] [CrossRef]
  16. Guobytė, R. Quaternary Geological Map of Lithuania, Scale 1: 200,000; Geol. Surv. Lithuania: Vilnius, Lithuania, 1999; Available online: https://www.lgt.lt/epaslaugos/elpaslauga.xhtml (accessed on 5 May 2022).
  17. Balakauskas, L.; Taminskas, J.; Mažeika, J.; Stančikaitė, M. Lateglacial and early-Holocene palaeohydrological changes in the upper reaches of the Ūla River: An example from southeastern Lithuania. Holocene 2013, 23, 117–126. [Google Scholar] [CrossRef]
  18. Stančikaitė, M.; Kabailienė, M.; Ostrauskas, T.; Guobytė, R. Environment and man around Lakes Dūba and Pelesa, SE Lithuania, during the Late Glacial and Holocene. Geol. Q. 2002, 46, 391–409. [Google Scholar]
  19. Rimantienė, R. Dūbos ežero apylinkės. In Stone Age in South Lithuania (According to Geological, Palaeogeographical and Archaeological Data); Baltrūnas, V., Ed.; Institute of geology: Vilnius, Lithuania, 2001; pp. 167–174. (In Lithuanian) [Google Scholar]
  20. Rimantienė, R. Margių 1-oji gyvenvietė. Liet. Archeol. 1999, 16, 109–170. (In Lithuanian) [Google Scholar]
  21. Rimantienė, R. Barzdžio miško gyvenvietė. Liet. Archeol. 1999, 16, 171–208. (In Lithuanian) [Google Scholar]
  22. Rimantienė, R. Šakės—Neolito gyvenvietė. Liet. Archeol. 1992, 8, 16–34. (In Lithuanian) [Google Scholar]
  23. Ionescu, C.; Hoeck, V. Ceramic technology. How to investigate surface finishing. Archaeol. Anthropol. Sci. 2020, 12, 204. [Google Scholar] [CrossRef]
  24. Quinn, P.S. Ceramic Petrography: The Interpretation of Archaeological Pottery and Related Artefacts in Thin Section; Archaeopress: Oxford, UK, 2013. [Google Scholar]
  25. Whitbread, I.K. Fabric Description of Archaeological Ceramics. In The Oxford Handbook of Archaeological Ceramic Analysis; Hunt, A., Ed.; Oxford University Press: Oxford, UK, 2016; pp. 199–216. [Google Scholar]
  26. Roux, V. Ceramics and Society. A Technological Approach to Archaeological Assemblages; Springer International: Cham, Switzerland, 2019. [Google Scholar]
  27. Thér, R. Ceramic technology. How to reconstruct and describe pottery-forming practices. Archaeol. Anthropol. Sci. 2020, 12, 172. [Google Scholar] [CrossRef]
  28. Arnold, D.E.; Neff, H.; Bishop, R.L. Compositional analysis and ‘sources’ of pottery: An ethnoarchaeological approach. Am. Anthropol. 1991, 93, 70–90. [Google Scholar] [CrossRef]
  29. Tite, M. Ceramic production, provenance and use: A review. Archaeometry 2008, 50, 216–231. [Google Scholar] [CrossRef]
  30. Buxeda i Garrigós, J. Alteration and Contamination of Archaeological Ceramics: The Perturbation Problem. J. Archaeol. Sci. 1999, 26, 295–313. [Google Scholar] [CrossRef] [Green Version]
  31. Maritan, L. Ceramic abandonment. How to recognise post-depositional transformations. Archaeol. Anthropol. Sci. 2020, 12, 199. [Google Scholar] [CrossRef]
  32. Hunt, A. On the origin of ceramics: Moving toward a common understanding on provenance. Archaeol. Rev. Camb. 2012, 27, 85–97. [Google Scholar]
  33. Schramm, R.; Heckel, J. Fast analysis of traces and major elements with ED(P)XRF using polarized X-rays: TURBOQUANT. J. Phys. IV 1998, 8, Pr5-335–Pr5-342. [Google Scholar] [CrossRef]
  34. Introducing a New Era in Analytical Performance. Available online: https://www.spectro.com/products/xrf-spectrometer/xepos-xrf-spectrometer (accessed on 17 May 2022).
  35. Analyzing Trace Elements in Pressed Pellets of Geological Materials Using ED-XRF. Available online: https://extranet.spectro.com/-/media/5C512E72-682D-45D8-AE56-6740529341BC.pdf (accessed on 17 May 2022).
  36. Van Dijk, D. Wageningen Evaluating Programmes for Analytical Laboratories (Wepal): A World of Experience. Commun. Soil Sci. Plant Anal. 2002, 33, 2457–2465. [Google Scholar] [CrossRef]
  37. Taraškevičius, R.; Zinkutė, R.; Stakėnienė, R.; Radavičius, M. Case Study of the Relationship between Aqua Regia and Real Total Contents of Harmful Trace Elements in Some European Soils. J. Chem. 2013, 2013, 678140. [Google Scholar] [CrossRef] [Green Version]
  38. Taraškevičius, R.; Kazakauskas, V.; Sarcevičius, S.; Zinkutė, R.; Suzdalev, S. Case study of geochemical clustering as a tool for tracing sources of clays for archaeological and modern bricks. Baltica 2019, 32, 139–155. [Google Scholar] [CrossRef]
  39. Maggetti, M. Phase analysis and its significance for technology and origin. In Archaeological Ceramics; Olin, J.S., Franklin, A.D., Eds.; Smithsonian Institution Press: Washington, DC, USA, 1982; pp. 121–133. [Google Scholar]
  40. Heimann, R.B.; Maggetti, M. Ancient and Historical Ceramics: Materials, Technology, Art and Culinary Traditions; Schweizerbart Science Publishers: Stuttgart, Germany, 2014. [Google Scholar]
  41. Quinn, P.S.; Benzonelli, A. X-ray diffraction and archaeological materials analysis. In The SAS Encyclopedia of Archaeological Sciences, 1st ed.; López Varela, S.L., Ed.; Wiley Blackwell: Hoboken, NJ, USA, 2018. [Google Scholar]
  42. Kareiva, A.; Kiuberis, J.; Merkevičius, A. Analytical characterization of Baltic amber and pottery. Archaeol. Litu. 2011, 12, 25–35. [Google Scholar] [CrossRef] [Green Version]
  43. Maritan, L.; Nodari, L.; Mazzoli, C.; Milano, A.; Russo, U. Influence of firing conditions on ceramic products: Experimental study on clay rich in organic matter. Appl. Clay Sci. 2006, 31, 1–15. [Google Scholar] [CrossRef]
  44. Shoval, S. Fourier transform infrared spectroscopy (FT-IR) in archaeological ceramic analysis. In The Oxford Handbook of Archaeological Ceramic Analysis; Hunt, A.M.W., Ed.; University Press: Oxford, UK, 2017; pp. 509–530. [Google Scholar]
  45. Mentesana, R.; Kilikoglou, V.; Todaro, S.; Day, P.M. Reconstructing change in firing technology during the Final Neolithic–Early Bronze Age transition in Phaistos, Crete. Just the tip of the iceberg? Archaeol. Anthropol. Sci. 2019, 11, 871–894. [Google Scholar] [CrossRef] [Green Version]
  46. Park, K.S.; Milke, R.; Efthimiopoulos, I.; Pausewein, R.R.; Reinhold, S. Pyrometamorphic process of ceramic composite materials in pottery production in the Bronze/Iron Age of the Northern Caucasus (Russia). Sci. Rep. 2019, 9, 10725. [Google Scholar] [CrossRef] [Green Version]
  47. Yan, B.; Liu, S.; Chastain, M.L.; Yang, S.; Chen, J. A new FTIR method for estimating the firing temperature of ceramic bronze-casting moulds from early China. Sci. Rep. 2021, 11, 3316. [Google Scholar] [CrossRef] [PubMed]
  48. Menges, F. Spectragryph—Optical Spectroscopy Software. Version 1.2.16. Available online: http://www.effemm2.de/spectragryph/ (accessed on 5 May 2022).
  49. GabbroSoft. 2011. Available online: http://www.gabbrosoft.org (accessed on 5 May 2022).
  50. Middleton, A.P.; Freestone, I.C.; Leese, M.N. Textural analysis of ceramic thin sections: Evaluation of grain sampling procedures. Archaeometry 1985, 27, 64–74. [Google Scholar] [CrossRef]
  51. Reedy, C.L. Review of Digital Image Analysis of Petrographic Thin Sections in Conservation Research. J. Am. Inst. Conserv. 2006, 45, 127–146. [Google Scholar] [CrossRef]
  52. Druc, I.C. Atlas of Ceramic Pastes: Components, Texture and Technology; Deep Education Press: Blue Mounds, WI, USA, 2015. [Google Scholar]
  53. Roduit, N. JMicroVision: Image Analysis Toolbox for Measuring and Quantifying Components of High-Definition Images. Version 1.3.4. Available online: https://jmicrovision.github.io (accessed on 5 May 2022).
  54. Wentworth, C.K. A scale of grade and class terms for clastic sediments. J. Geol. 1922, 30, 377–392. [Google Scholar] [CrossRef]
  55. Kretz, R. Symbols of rock-forming minerals. Am. Mineral. 1983, 68, 277–279. [Google Scholar]
  56. Clarke, F.W. The Relative Abundance of the Chemical Elements. Bull. Philos. Soc. Wash. 1889, 11, 135–143. [Google Scholar]
  57. Rudnick, R.L.; Gao, S. Composition of the Continental Crust. In Treatise on Geochemistry; Elsevier: Amsterdam, The Netherlands, 2003; pp. 1–64. [Google Scholar]
  58. Jasiewicz, J.; Niedzielski, P.; Krueger, M.; Hildebrandt-Radke, I.; Michałowski, A. Elemental variability of prehistoric ceramics from postglacial lowlands and its implications for emerging of pottery traditions—An example from the pre-Roman Iron Age. J. Archaeol. Sci. Rep. 2021, 39, 103177. [Google Scholar] [CrossRef]
  59. Borowski, M.P.; Golitko, M.; Furmanek, M.; Nowak, M.; Szczepara, N. Addressing the issue of the Early Neolithic pottery exchange through a combined petrographic and geochemical approach: A case study on LBK ware from Dzielnica (Upper Silesia, southern Poland). Archaeol. Anthropol. Sci. 2021, 13, 5. [Google Scholar] [CrossRef]
  60. Middleton, M.; Närhi, P.; Kuosmanen, V.; Sutinen, R. Quantification of glacial till chemical composition by reflectance spectroscopy. Appl. Geochem. 2011, 26, 2215–2225. [Google Scholar] [CrossRef]
  61. De Vos, W.; Tarvainen, T.; Salminen, R.; Reeder, S.; De Vivo, B.; Demetriades, A.; Pirc, S.; Batista, M.J.; Marsina, K.; Ottesen, R.T.; et al. Geochemical Atlas of Europe. Part 2. Interpretation of Geochemical Maps, Additional Tables, Figures, Maps, and Related Publications; Geological Survey of Finland: Espoo, Finland, 2006. [Google Scholar]
  62. Maggetti, M. Chemical Analyses of Ancient Ceramics: What for? Chimia 2001, 55, 923–930. [Google Scholar]
  63. Santos Rodrigues, S.F.; Lima da Costa, M. Phosphorus in archaeological ceramics as evidence of the use of pots for cooking food. Appl. Clay Sci. 2016, 123, 224–231. [Google Scholar] [CrossRef]
  64. Drob, A.; Vasilache, V.; Bolohan, N. The Interdisciplinary Approach of Some Middle Bronze Age Pottery from Eastern Romania. Appl. Sci. 2021, 11, 4885. [Google Scholar] [CrossRef]
  65. Taraškevičius, R.; Stančikaitė, M.; Bliujienė, A.; Stakėnienė, R.; Zinkutė, R.; Kusiak, J. Search for geochemical indicators of pre-urban habitation sites: Case study from the Skomantai hill-fort and settlement, western Lithuania. Geochem. Explor. Environ. Anal. 2012, 12, 265–275. [Google Scholar] [CrossRef]
  66. Taraškevičius, R.; Bliujienė, A.; Karmaza, B.; Merkevičius, A.; Nemickienė, R.; Račkevičius, G.; Sarcevičius, S.; Stakėnienė, R.; Strazdas, D.; Širvydaitė, S.; et al. Geocheminiai tyrimų metodai archeologijoje—Taikymo galimybės. In Metodai Lietuvos Archeologijoje. Mokslas ir Technologijos Praeičiai Pažinti; Merkevičius, A., Ed.; Vilniaus Universiteto Leidykla: Vilnius, Lithuania, 2013; pp. 249–304. (In Lithuanian) [Google Scholar]
  67. Eramo, G.; Mangone, A. Archaeometry of ceramic materials. Phys. Sci. Rev. 2019, 4, 20180014. [Google Scholar] [CrossRef]
  68. Mirti, P.; Davit, P. New developments in the study of ancient pottery by colour measurement. J. Archaeol. Sci. 2004, 31, 741–751. [Google Scholar] [CrossRef]
  69. Eramo, G. Ceramic technology: How to recognize ceramic processing. Archaeol Anthr. Sci. 2020, 12, 164. [Google Scholar] [CrossRef]
  70. Albero Santacreu, D. Materiality, Techniques and Society in Pottery Production: The Technological Study of Archaeological Ceramics through Paste Analysis; Walter de Gruyter GmbH & Co KG: Berlin, Germany; Boston, MA, USA, 2014. [Google Scholar]
  71. Ho, J.W.I.; Quinn, P.S. Intentional clay-mixing in the production of traditional and ancient ceramics and its identification in thin section. J. Archaeol. Sci. Rep. 2021, 37, 102945. [Google Scholar] [CrossRef]
  72. Whitbread, I.K. The characterisation of argillaceous inclusions in ceramic thin sections. Archaeometry 1986, 28, 79–88. [Google Scholar] [CrossRef]
  73. Sakalis, A.J.; Kazakis, N.A.; Merousis, N.; Tsirliganis, N.C. Study of Neolithic pottery from Polyplatanos (Imathia) using micro X-ray fluorescence spectroscopy, stereoscopic microscopy and multivariate statistical analysis. J. Cult. Herit. 2013, 14, 485–498. [Google Scholar] [CrossRef]
  74. Freestone, I.C.; Middleton, A.P.; Meeks, N.D. Significance of phosphate in ceramic bodies: Discussion of paper by Bollong et al. J. Archaeol. Sci. 1994, 21, 425–426. [Google Scholar] [CrossRef]
  75. Ionescu, C.; Hoeck, V.; Ghergari, L. Electron microprobe analysis of ancient ceramics: A case study from Romania. Appl. Clay Sci. 2011, 53, 466–475. [Google Scholar] [CrossRef]
  76. Giurgiu, A.; Ionescu, C.; Hoeck, V.; Tămaş, T.; Roman, C.; Crandell, O.N. Insights into the raw materials and technology used to produce Copper Age ceramics in the Southern Carpathians (Romania). Archaeol. Anthropol. Sci. 2017, 9, 1259–1273. [Google Scholar] [CrossRef]
  77. Kurosawa, M.; Semmoto, M.; Shibata, T. Mineralogical Characterization of Early Bronze Age Pottery from the Svilengrad-Brantiite Site, Southeastern Bulgaria. Minerals 2022, 12, 79. [Google Scholar] [CrossRef]
  78. Wilson, M.J. Sheet Silicates: Clay Minerals, Rock-Forming Minerals; The Geological Society of London: London, UK, 2013; Volume 3C. [Google Scholar]
  79. Brorsson, T.; Blank, M.; Bakunic Fridén, I. Mobility and exchange in the Middle Neolithic: Provenance studies of Pitted Ware and Funnel Beaker pottery from Jutland, Denmark and the west coast of Sweden. J. Archaeol. Sci. Rep. 2018, 20, 662–674. [Google Scholar] [CrossRef]
  80. Michałowski, A.; Niedzielski, P.; Kozak, L.; Teska, M.; Jakubowski, K.; Żółkiewski, M. Archaeometrical studies of prehistoric pottery using portable ED-XRF. Measurement 2020, 159, 107758. [Google Scholar] [CrossRef]
  81. Papakosta, V.; Lopez-Costas, O.; Isaksson, S. Multi-method (FTIR, XRD, PXRF) analysis of Ertebølle pottery ceramics from Scania, Southern Sweden. Archaeometry 2020, 62, 677–693. [Google Scholar] [CrossRef] [Green Version]
  82. Buxeda i Garrigós, J.; Kilikoglou, V. Total variation as a measure of variability in chemical data sets. In Patterns and Process; Van Zelst, L., Bishop, R.L., Henderson, J., Eds.; Smithsonian Institution Press: Washington, DC, USA, 2003; pp. 185–198. [Google Scholar]
  83. Quinn, P.; Day, P.; Kilikoglou, V.; Faber, E.; Katsarou-Tzeveleki, S.; Sampson, A. Keeping an eye on your pots: The provenance of Neolithic ceramics from the Cave of the Cyclops, Youra, Greece. J. Archaeol. Sci. 2010, 37, 1042–1052. [Google Scholar] [CrossRef]
  84. Hein, A.; Kilikoglou, V. Ceramic raw materials: How to recognize them and locate the supply basins: Chemistry. Archaeol. Anthropol. Sci. 2020, 12, 180. [Google Scholar] [CrossRef]
  85. Luneau, E.; Martínez Ferreras, V.; Abdykanova, A.; Tabaldiev, K.; Motuzaite Matuzeviciute, G. The first combined archaeological and archaeometric analyses on Bronze Age pottery from Kyrgyzstan (Uch Kurbu site). J. Archaeol. Sci. Rep. 2020, 31, 102302. [Google Scholar] [CrossRef]
  86. Kulkova, M.; Mazurkevich, A.; Dolbunova, E. Paste recipes and raw material sources for pottery-making in hunter-gatherer communities in the forest zone of Eastern Europe (Dnepr-Dvina region, 7–6th millennia BC). J. Archaeol. Sci. Rep. 2018, 21, 962–972. [Google Scholar] [CrossRef]
  87. Šegvić, B.; Ugarković, M.; Süssenberger, A.; Mählmann, R.F.; Moscariello, A. Compositional Properties and Provenance of Hellenistic Pottery from the Necropolis of Issa with Evidences on the Cross-Adriatic and the Mediterranean-scale Trade. Mediterr. Archaeol. Archaeom. 2016, 16, 23–52. [Google Scholar]
  88. Gualtieri, A.F.; Ferrari, S.; Leoni, M.; Grathoff, G.; Hugo, R.; Shatnawi, M.; Paglia, G.; Billinge, S. Structural characterization of the clay mineral illite-1M. J. Appl. Crystallogr. 2008, 41, 402–415. [Google Scholar] [CrossRef]
  89. Wang, G.; Wang, H.; Zhang, N. In situ high temperature X-ray diffraction study of illite. Appl. Clay Sci. 2017, 146, 254–263. [Google Scholar] [CrossRef]
  90. Ionescu, C.; Höck, V.; Simon, V. Effect of the temperature and the heating time on the composition of an illite-rich clay: An XRPD study. Babes-Bolyai Phys. 2011, 56, 69–70. [Google Scholar]
  91. Amicone, S.; Forte, V.; Solard, B.; Berthold, C.; Memmesheimer, A.; Mirković-Marić, N. Playing with fire: Exploring ceramic pyrotechnology in the Late Neolithic Balkans through an archaeometric and experimental approach. J. Archaeol. Sci. Rep. 2021, 37, 102878. [Google Scholar] [CrossRef]
  92. Contani Barbaro, C.; Forte, V.; Muntoni, I.M.; Eramo, G. A Multidisciplinary Approach to the Study of Early Neolithic Pyrotechnological Structures. The Case Study of Portonovo (Marche, Italy). Open Archaeol. 2021, 7, 1160–1175. [Google Scholar] [CrossRef]
  93. Drits, V.A.; Beson, G.; Muller, F. An improved model for structural transformations of heat-treated aluminous dioctahedral 2:1 layer silicates. Clays Clay Miner. 1995, 43, 718–731. [Google Scholar] [CrossRef]
  94. Marsh, A.; Heath, A.; Patureau, P.; Evernden, M.; Walker, P. Alkali activation behaviour of un-calcined montmorillonite and illite clay minerals. Appl. Clay Sci. 2018, 166, 250–261. [Google Scholar] [CrossRef]
  95. Giraitis, R.; Bliujienė, A.; Selskienė, A.; Pakštas, V. Investigations of potsherds of miniature cups and household pots from the first millennium AD (the case study on the Western Lithuanian ceramics). Chemija 2019, 30, 154–167. [Google Scholar] [CrossRef]
  96. Moon, D.-H.; Kim, S.-J.; Nam, S.-W.; Cho, H.-G. X-ray Diffraction Analysis of Clay Particles in Ancient Baekje Black Pottery: Indicator of the Firing Parameters. Minerals 2021, 11, 1239. [Google Scholar] [CrossRef]
  97. Maniatis, Y.; Simopoulos, A.; Kostikas, A.; Perdikatsis, V. Effect of Reducing Atmosphere on Minerals and Iron Oxides Developed in Fired Clays: The Role of Ca. J. Am. Ceram. Soc. 1983, 66, 773–781. [Google Scholar] [CrossRef]
  98. Maggetti, M.; Neururer, C.; Ramseyer, D. Temperature evolution inside a pot during experimental surface (bonfire) firing. Appl. Clay Sci. 2011, 53, 500–508. [Google Scholar] [CrossRef] [Green Version]
  99. Müller, C.; Pejcic, B.; Esteban, L.; Piane, C.D.; Raven, M.; Mizaikoff, B. Infrared Attenuated Total Reflectance Spectroscopy: An Innovative Strategy for Analyzing Mineral Components in Energy Relevant Systems. Sci. Rep. 2014, 4, 6764. [Google Scholar] [CrossRef] [PubMed] [Green Version]
  100. Shoval, S.; Beck, P. Thermo-FTIR spectroscopy analysis as a method of characterizing ancient ceramic technology. J. Therm. Anal. Calorim. 2005, 82, 609–616. [Google Scholar] [CrossRef]
  101. Maniatis, Y.; Katsanos, A.; Caskey, M.E. Technological examination of low-fired Terra cotta statues from Ayia Irene Keos. Archaeometry 1982, 24, 191–198. [Google Scholar] [CrossRef]
  102. Murad, E.; Wagner, U. The thermal behaviour of an Fe-rich illite. Clay Miner. 1996, 31, 45–52. [Google Scholar] [CrossRef]
  103. Zviagina, B.B.; Drits, V.A.; Dorzhieva, O.V. Distinguishing Features and Identification Criteria for K-Dioctahedral 1M Micas (Illite-Aluminoceladonite and Illite-Glauconite-Celadonite Series) from Middle-Infrared Spectroscopy Data. Minerals 2020, 10, 153. [Google Scholar] [CrossRef] [Green Version]
  104. Oancea, A.V.; Bodi, G.; Nica, V.; Ursu, L.E.; Drobota, M.; Cotofana, C.; Vasiliu, A.L.; Simionescu, B.C.; Olaru, M. Multi-analytical characterization of Cucuteni pottery. J. Eur. Ceram. Soc. 2017, 37, 5079–5098. [Google Scholar] [CrossRef]
  105. Šontevska, V.; Jovanovski, G.; Makreski, P.; Raškovska, A.; Šoptrajanova, B. Minerals from Macedonia. XXI. Vibrational spectroscopy as identificational tool for some phyllosilicate minerals. Acta Chim. Slov. 2008, 55, 757–766. [Google Scholar]
  106. Stevenson, C.M.; Gurnick, M. Structural collapse in kaolinite, montmorillonite and illite clay and its role in the ceramic rehydroxylation dating of low-fired earthenware. J. Archaeol. Sci. 2016, 69, 54–63. [Google Scholar] [CrossRef] [Green Version]
  107. Theodosoglou, E.; Koroneos, A.; Soldatos, T.; Zorba, T.; Paraskevopoulos, K.M. Comparative Fourier transform infrared and X-ray powder diffraction analysis of naturally occurred K-feldspars. Bull. Geol. Soc. Greece 2010, 43, 2752–2761. [Google Scholar] [CrossRef] [Green Version]
  108. Maniatis, Y.; Tite, M.S. Technological Examination of Neolithic-Bronze Age Pottery from Central and Southeast Europe and from the Near East. J. Archaeol. Sci. 1981, 8, 59–76. [Google Scholar] [CrossRef]
  109. Amicone, S.; Radivojević, M.; Quinn, P.S.; Berthold, C.; Rehren, T. Pyrotechnological connections? Re-investigating the link between pottery firing technology and the origins of metallurgy in the Vinča Culture, Serbia. J. Archaeol. Sci. 2020, 11, 105123. [Google Scholar] [CrossRef]
  110. Deer, W.A.; Howie, R.A.; Zussman, J. An Introduction to the Rock-Forming Minerals, 3rd ed.; Mineralogical Society of Great Britain and Ireland: London, UK, 2013. [Google Scholar]
  111. Smith, J.V.; Brown, W.L. Feldspar Minerals. Crystal Structures, Physical, Chemical, and Microtextural Properties, 2nd ed.; Springer: Berlin Heidelberg, Germany, 1988; Volume 1. [Google Scholar]
  112. Wilson, M.J. Weathering of the primary rock-forming minerals: Processes, products and rates. Clay Miner. 2004, 39, 233–266. [Google Scholar] [CrossRef] [Green Version]
  113. Menzies, J.; Meer, J.J.M. Past Glacial Environments, 2nd ed.; Elsevier: Amsterdam, The Netherlands, 2018. [Google Scholar]
  114. Długosz, J.; Orzechowski, M.; Kobierski, M.; Smólczyński, S.; Zamorski, R. Clay minerals from Weichselian glaciolimnic sediments of the Sępopolska Plain (NE Poland). Geol. Carpath. 2009, 60, 263–267. [Google Scholar] [CrossRef] [Green Version]
  115. Enea-Giurgiu, A.; Ionescu, C.; Hoeck, V.; Tămaş, T.; Roman, C. An archaeometric study of early Copper Age pottery from a cave in Romania. Clay Miner. 2019, 54, 255–268. [Google Scholar] [CrossRef] [Green Version]
  116. Zhou, J.M.; Huang, P.M. Kinetics of potassium release from illite as influenced by different phosphates. Geoderma 2007, 138, 221–228. [Google Scholar] [CrossRef]
  117. Maggetti, M. Mineralogisch-petrographische Untersuchung des Scherbenmaterials der urnenfelderzeitlichen Siedlung Elchinger Kreuz, Ldkr. Neu-Ulm/Donau. Kat. Prähistorische Staatssamml. München 1979, 19, 141–172. [Google Scholar]
  118. Aspandiar, M.F.; Eggleton, R.A. Weathering of Chlorite: I. Reactions and Products in Microsystems Controlled by the Primary Mineral. Clays Clay Miner. 2002, 50, 685–698. [Google Scholar] [CrossRef]
  119. Arnold, D.E. Linking Society with the Compositional Analyses of Pottery: A Model from Comparative Ethnography. In Pottery Manufacturing Processes: Reconstitution and Interpretation; Smith, A.L., Bosquet, D., Martineau, R., Eds.; Archaeopress: Oxford, UK, 2005; pp. 15–21. [Google Scholar]
  120. Rice, P.M. Pottery Analysis: A Sourcebook, 1st ed.; The University of Chicago Press: Chicago, IL, USA, 1987. [Google Scholar]
  121. Lechtman, H. Style in technology: Some early thoughts. In Material Culture: Style, Organization and Dynamics of Technology; Lechtman, H., Merrill, R.S., Eds.; West Publishing Company: St. Paul, MN, USA, 1977; pp. 3–20. [Google Scholar]
  122. Gosselain, O.P. Social and technical identity in a clay crystal ball. In The Archaeology of Social Boundaries; Stark, M.T., Ed.; Smithsonian Institution Press: Washington, DC, USA, 1998; pp. 78–100. [Google Scholar]
  123. Sillar, B.; Tite, M.S. The Challenge of ‘Technological Choices’ for Materials Science Approaches in Archaeology. Archaeometry 2000, 42, 2–20. [Google Scholar] [CrossRef]
  124. Rye, O.S. Keeping your temper under control: Materials and manufacture of Papuan pottery. Archeol. Phys. Anthropol. Ocean. 1976, 11, 106–137. [Google Scholar]
  125. McReynolds, T.E.; Skaggs, S.A.; Schroeder, P.A. Feldspar and clay mineralogy. In Woodland Pottery Sourcing in the Carolina Sandhills. Research Report 29; Herbert, J.M., McReynolds, T.E., Eds.; University of North Carolina at Chapel Hill: Chapel Hill, NC, USA, 2008; pp. 108–121. [Google Scholar]
  126. Kudelić, A. Preparation and Composition of Clay Paste in Bronze Age Pottery from North-Western Croatia: The Role of Experiments. Old Potter’s Alm. 2017, 22, 2–14. [Google Scholar]
  127. Daszkiewicz, M.; Maritan, L. Experimental Firing and Re-firing. In The Oxford Handbook of Archaeological Ceramic Analysis; Hunt, A., Ed.; Oxford University Press: Oxford, UK, 2016; pp. 487–508. [Google Scholar]
  128. Kabailienė, M. Ežerų bei pelkių sandara ir raida. In Stone Age in South Lithuania (According to Geological, Palaeogeographical and Archaeological Data; Baltrūnas, V., Ed.; Institute of geology: Vilnius, Lithuania, 2001; pp. 121–125. (In Lithuanian) [Google Scholar]
  129. Rye, O.S. Pottery Technology, Principles and Reconstruction (Manuals on Archaeology); Taraxacum: Washington, WA, USA, 1981. [Google Scholar]
Figure 1. Study area: (a) a distribution map of the Corded Ware Culture (pink color) (after [5]) (redrawn from [7], Figure 1), and the location of the study area (red square); (b) a geomorphological map of the Dubičiai-Rudnia microregion (Reprinted with permission from [16], © 2022 Lithuanian Geological Survey under Ministry of Environment), and the studied Neolithic settlements.
Minerals 12 01006 g001
Figure 2. The pottery samples and their cross-sections: (af) cord-decorated pottery; (gl) hunter-gatherer pottery.
Minerals 12 01006 g002
Figure 3. Cluster analysis (Ward’s method, Spearman distance matrix): (a) panel–dendrogram of the major elements in the bulk compositions of the pottery samples; (b) panel–dendrogram of the major elements in the clay matrix; (c) panel–dendrogram of the major and trace elements in the bulk composition.
Minerals 12 01006 g003
Figure 4. Elemental ratios of matched pairs of SEM-EDS analysis results for lighter and darker clay matrixes of pottery samples. (a) Box and whisker plot. For calculation of ratios, the content in the lighter shade of matrix was in the numerator, while that in the darker one was in the denominator. (b) Elemental ratios of individual matched pairs are conditionally formatted in color scales. 50th MP–median values of ratios for eleven matched pairs. MP’ test—p-values of Wilcoxon Matched Pairs test. 50th IND—ratio of median values in differently colored clay types in samples (Table S3). U’ test—p-values of Mann–Whitney U test for independent sets. Analytes are given in ascending sequence of mean elemental ratios values.
Minerals 12 01006 g004
Figure 5. Elemental ratios of matched pairs of SEM-EDS and XRF analysis results for clay matrix and bulk compositions of twelve pottery samples. (a) Box and whisker plot. For calculation of ratios, the content in the clay matrix was in the numerator, whereas in bulk compositions, it was in the denominator. (b) Elemental ratios of individual matched pairs are conditionally formatted in color scales. 50th MP—median values of ratios for twelve matched pairs. MP’ test—p-values of Wilcoxon Matched Pairs test. 50th IND—ratio of median values of twelve samples (Table S1). U’ test—p-values of Mann–Whitney U test for independent sets. Analytes are given in ascending sequence of mean elemental ratios values.
Minerals 12 01006 g005
Figure 6. Elemental ratio values of hunter-gatherer pottery (HG) and Corded Ware (CW) in bulk and clay matrix compositions. For calculation ratio values, the median amount of analyte in HG was used as a numerator, whereas the median amount of analyte in CW was as used as the denominator. Analytes are given in ascending sequences of median values of ratios of bulk compositions separately for major analytes (Ca, …, Mn), and separately for trace elements (Zr, …, Zn). If the level of significance of the p-value is between 0.01 and 0.05 (0.01 < p < 0.05), the ratio median value of the corresponding analyte is shown as a number.
Minerals 12 01006 g006
Figure 7. Elemental ratios values of median amounts between clay matrix and bulk compositions of hunter-gatherer pottery (HG) and Corded Ware (CW). *1 Ratios values of median quantity of analytes in clay matrix (CM) and bulk composition (BC) of six pottery samples. Amounts in CM were used as the numerator, whereas that in BC was used as the denominator. *2 p-values calculated using the Mann–Whitney U Test for the independent variables. Ratios values significant at p < 0.01 level are given in light brown, at 0.01 < p < 0.05 in yellow, at 0.05 < p < 0.1 in light yellow.
Minerals 12 01006 g007
Figure 8. Dendrograms of the pottery samples (clustering using Ward’s method by calculating the Manhattan (City Block linkage distances), compiled using the content of the major elements: (a) panel—in the clay matrix; (b) panel—in the bulk composition. The bottom of both panels presents conditionally formatted color scales, the individual content of the major analytes, recalculated by stoichiometry as oxides (%). The sequences in the analyte groups correspond to the elemental cluster diagrams for the Figure 3a,b panels.
Minerals 12 01006 g008
Figure 9. Dendrograms of the pottery samples (clustering using Ward’s method by calculating the Manhattan (City Block) linkage distances), compiled using the content of the major and trace elements in the bulk composition. At the bottom of the panel, using in conditionally formatted color scales, the individual elemental content is presented: %—for major analytes, recalculated by stoichiometry as oxides; µg g−1—for trace elements. The sequences in the analyte groups correspond to the elemental cluster tree diagram for the Figure 3c panel.
Minerals 12 01006 g009
Figure 10. Diffractograms for the ceramic materials in the studied samples: (a) illite-rich; (b) alkali feldspar-rich; (c) plagioclase-rich. Blue diffractograms–samples from the Margiai settlement; green–samples from the Šakės settlement; red-orange–samples from the Barzdis settlement.
Minerals 12 01006 g010
Figure 11. Firing temperature-related microstructural differences in the studied samples. (a) Normalized FTIR absorbance spectra for the studied samples in the 1250–400 cm−1 range. The intensity of the main Si–O stretching band decreases and microstructural vitrification changes appear as the firing temperature increases. (b) SEM SE image of a non-vitrified structure in HG-L_B2. (c) SEM SE image of an initial vitrification structure in CW-E_M1. Abbreviations: NV—no vitrification; NV+—the intermediate stage between NV and IV; IV—initial vitrification.
Minerals 12 01006 g011
Figure 12. SEM BSE images of rock fragments in the samples: (a) HG-E_M5; (b) CW-L_M4; (c) CW-L_S2; (d) HG-L_B3, due to the diffusion of Fe from biotite, a Fe-enriched clay matrix is marked with a white arrow; (e) HG-L_B4; (f) HG-E_S3. Abbreviations: Ap—apatite, Bt—biotite, Chl—chlorite, Hbl—hornblende, Ilm—ilmenite, Kfs—K-feldspar, Mnz—monazite, Ms—muscovite, Mt—magnetite, Pl—plagioclase, Qtz—quartz, Rt—rutile, Zrc—zircon.
Minerals 12 01006 g012
Figure 13. SEM BSE images of plagioclase in the samples: (a) HG-L_B4, different weathering stages of minerals seen in the rock fragment—muscovite, quartz, K-feldspar have clear boundaries but plagioclase turns to clay; (b) CW-E_M3, a round grain of weathered plagioclase turns into clay; (c) CW-E_M1, weathered plagioclase with areas of kaolinite.
Minerals 12 01006 g013
Figure 14. SEM BSE images of micas in the samples: (a) HG-L_B3, an alteration of biotite to muscovite and chlorite; (b) HG-L_B4, an altered biotite in a coarse rock fragment; (c) HG-E_S3, a weathered hornblende that turned into chlorite; (d) CW-L_S2, a coarse fragment of a weathered chlorite.
Minerals 12 01006 g014
Figure 15. SEM BSE images of the clay matrix: (a,b) micaceous poorly weathered clay: (a) HG-E_M5, (b) CW-E_M2; (c,d) mature, well-weathered illite clay: (c) HG-L_B3, (d) CW-L_M4.
Minerals 12 01006 g015
Figure 16. SEM BSE images of ferruginous nodules: (a) mica structure seen at 1000× magnification (CW-E_M1); (b) the matrix of very low-temperature-fired clay (CW-E_M3); (c) the matrix of low-temperature-fired clay (HG-E_M5); (d) the matrix of medium-temperature-fired clay (CW-E_M1).
Minerals 12 01006 g016
Figure 17. SEM BSE images of the early coarse ceramic pastes with meso-vughs and macro-elongated voids (seen as black areas): (a) CW-E_M1 ceramic paste with isolated quartz and feldspar grains; (b) HG-E_M5 ceramic paste with a ferruginous nodule (Ill + Gth–goethite enriched illite) and coarse granite fragments; (c) HG-E_S3 ceramic paste with granite fragments, a dashed line in the upper left corner indicates the boundary between the main clay matrix and the upper phosphorus-enriched clay layer.
Minerals 12 01006 g017
Figure 18. SEM BSE images of the dark clay matrix containing light-colored clay pellets. Arrows show a direction mechanical deformation made in processing the clay body: (a) CW-E_M2, a clay pellet with Mg and Fe rich hornblende (white fragments); (b) CW-E_M2, diffused boundaries of the clay pellet rich in quartz and K-feldspar grains; (c) CW-E_M3, only contraction voids mark boundaries of the clay pellet.
Minerals 12 01006 g018
Figure 19. Late fine pottery: (a) CW-L_M4, SEM SE image of the sponge-textured clay matrix with alkali feldspar inclusion; (b) CW-L_M4, SEM BSE image of the quartz-rich clay matrix with alkali feldspar inclusion; (c) HG-L_B1, SEM SE image of the clay matrix with voids of straw.
Minerals 12 01006 g019
Figure 20. SEM BSE images of late Corded Ware ceramic pastes: (a) the CW-L_S1 core; (b) the CW-L_S2 core; (c) the upper layer of CW-L_S1; (d) the CW-L_S1 cross-section showing the location of Figure 20c.
Minerals 12 01006 g020
Figure 21. Late coarse pottery: (a) HG-L_B3, stereomicrograph of the plastic fine clay matrix with coarse mineral inclusions; (b) HG-L_B3, SEM BSE image of the same ceramic paste; (c) HG-L_B3, 1000× magnification SEM SE image of the same ceramic paste with a visible boundary between the dark clay matrix (the top of the image) and the light-colored sponge-textured clay; (d) HG-L_B4, SEM BSE image; (e) HG-L_B2, SEM BSE image; and (f) SEM SE image of the clay matrix with straw voids and the few grains of fine to medium sand-sized K-feldspar and quartz.
Minerals 12 01006 g021
Table 1. A description of the studied pottery samples. The samples are labeled as early (or late) cord-decorated pottery—CW-E… (or CW-L…) or as early (or late) 3rd millennium BCE hunter-gatherer pottery—HG-E… (or HG-L…) plus the site initial (M, S, or B) and the sample number.
Sample IDSettlementTypological
Classification
Vessel,
Fragment
Thickness,
mm
Weight,
g
Temper
CW-E_M1Margiai3000–2700 BCE,
Globular Amphora Culture
Pot, body7.306.46Crushed granite
CW-E_M2Margiai2800–2500 BCE,
Corded Ware Culture
Beaker, neck5.182.62Sand, grog (?)
CW-E_M3Margiai2800–2500 BCE,
Corded Ware Culture
Short-wave molded pot, rim7.616.85Crushed granite, grog (?)
CW-L_M4Margiai2500–2000 BCE,
Late Corded Ware Culture
Beaker, rim6.022.92Sand, crushed granite
HG-E_M5Margiai3000–2500 BCE,
Neman Hunter-Gatherer
Pot, body9.1114.98Crushed granite
CW-L_S1Šakės2500–2000 BCE,
Late Corded Ware Culture
Beaker, body6.366.28Crushed granite
CW-L_S2Šakės2500–2000 BCE,
Late Corded Ware Culture
Beaker, body6.184.01Crushed granite
HG-E_S3Šakės3000–2500 BCE,
Neman Hunter-Gatherer
Pot, body7.703.90Crushed granite
HG-L_B1Barzdis2500–2000 BCE,
Narva Hunter-Gatherer
Cup, rim5.081.56Straw, sand
HG-L_B2Barzdis2500–2000 BCE,
Narva Hunter-Gatherer
Pot, neck7.202.38Straw
HG-L_B3Barzdis2500–2000 BCE,
Neman Hunter-Gatherer
Pot, body8.359.54Crushed granite
HG-L_B4Barzdis2500–2000 BCE,
Neman Hunter-Gatherer
Pot, body11.738.60Crushed granite
Publisher’s Note: MDPI stays neutral with regard to jurisdictional claims in published maps and institutional affiliations.