Article

A New Image Processing Workflow for the Detection of Quartz Types in Shales: Implications for Shale Gas Reservoir Quality Prediction

1
Coalbed Methane Resources and Reservoir Formation Process Key Laboratory of Ministry of Education, China University of Mining and Technology, Xuzhou 221008, China
2
School of Resources and Geoscience, China University of Mining and Technology, Xuzhou 221116, China
3
Chair of Petroleum Geology, Montanuniversitaet Leoben, A-8700 Leoben, Austria
4
School of Civil Engineering, Chongqing Three Gorges University, Chongqing 404100, China
5
Energy Geology Co., Ltd. of Liaoning Geological Exploration and Mining Group, Shenyang 110013, China
*
Authors to whom correspondence should be addressed.
Minerals 2022, 12(8), 1027; https://doi.org/10.3390/min12081027
Submission received: 30 June 2022 / Revised: 8 August 2022 / Accepted: 14 August 2022 / Published: 16 August 2022

Abstract

:
A shale lithofacies scheme is commonly used to characterize source rock reservoirs of the Lower Cambrian Niutitang Formation. However, this classification ignores that individual components such as quartz may have different origins, potentially affecting reservoir quality. The main objective of this article is, therefore, to present a refined scheme for lithofacies and an image processing workflow for the detection of quartz types in the Niutitang Formation shales from the Jiumen outcrop in the Guizhou Province (Upper Yangtze Basin, SW China). In order to do so, a combination of bulk density, optical and scanning electron microscopy and image analysis was used. The shale lithology was macroscopically classified into seven major categories and nineteen subcategories. Subsequently, the shales were investigated at the microscopic level, mainly focusing on quartz types and microstructural variations. Afterwards, the workflow to calculate the weight per unit volume (1 cm3) of the quartz types was presented, i.e., firstly, by calculating the weight of mineral matter by subtraction of the measured weight of organic matter from the bulk shale; secondly, by calculating the weight of total quartz in bulk shale from the weight of mineral matter and its proportion calculated from X-ray diffraction data; thirdly, by calculating the weight of detrital quartz and non-detrital quartz with energy dispersive X-ray mapping, image processing and quartz density; finally, by calculating the weight of clay-sized quartz by subtracting of the weight of detrital and non-detrital quartz from the weight of the total quartz. The bulk quartz content was found to be dominated by clay-sized quartz, which may mainly control the mesopore volume available for gas storage and, hence, the shale gas reservoir development.

1. Introduction

The United States was the first and also the most successful country in the world to commercially develop shale gas, subsequently evolving source rock reservoirs into a key factor in the global energy landscape [1,2]. Following the concepts of carbon neutrality and carbon emission constraints, increasing the share of natural gas versus oil and coal in the energy mix may be an effective way to reduce carbon emissions [3]. Thus, the importance of shale gas as a supplementary source of natural gas will likely become even more prominent for years to come. Furthermore, global exploration efforts may foreseeably pick up again, as renewable energy sources will not suffice to meet the ever-rising energy demands, particularly in less developed regions. China has good prospects for shale gas, for which breakthroughs have been achieved in some regions such as the Jiaoshiba, Changning-Weiyuan, and Zhaotong areas [4,5,6]. The increasing scientific interest in the evaluation of source rock reservoirs has also led to a significant knowledge gain in the field of shale geology, including method development for a better understanding of primary and diagenetic controlling factors on reservoir quality [7,8,9,10].
A general problem related to the initial nomenclature of fine-grained sedimentary rocks is that the definition of shale is mainly based on the grain size distribution and present fissility, largely ignoring mineralogical variation as well as other important factors such as the potential input of biogenic vs. terrigenous detrital components [11,12]. However, as shale research progresses, scholars are increasingly aware of the complexity of shale genesis [13,14,15] and the influence of mineral composition and mineral–organic matter interactions on the shale reservoirs [16]. Recent classification approaches therefore increasingly acknowledge compositional variability [17,18]. Nevertheless, the numerous and partly incompatible definition schemes for shale lithofacies types reflect a still existing knowledge gap and a lack of common understanding in shale petrology [19,20].
Quartz is one of the most dominant constituents of most shales, and considered crucial for production success due to its brittle character being favorable for both fracturing behavior and matrix pore preservation [21,22,23]. However, besides its significance for physical reservoir properties, the identification of different quartz sources may also help in understanding the primary depositional environment and diagenetic history of a shale formation [24,25]. In general, detrital quartz is considered to impede compaction and preserve matrix porosity, whereas authigenic quartz (often formed in lithotypes rich in biogenic silica) may form shale cements [24,26,27]. Still, this fact is not fully acknowledged and often, bulk quartz contents are used as a brittleness indicator without a detailed investigation of quartz types, e.g., [21].
The identification of quartz types could be carried out via various methods, such as microscopic morphological observation, and characteristics of cathodoluminescence and its spectrum [28]. However, there are relatively few quantitative studies on quartz types, even the bulk quartz content is frequently measured. An Al-normalization method has been widely used to calculate the content of detrital Si and “excess Si” [29]. Some scholars also used a physical crushing-chemical dissolution-settling separation method to obtain and measure quartz in various intervals of grain size [30]. These methods are usually not straightforward enough, or are prone to large errors due to complex processing steps. In contrast, methods based on lithological in situ observations could avoid these problems.
This study aims at addressing this deficit by using a combination of X-ray diffraction (XRD) and optical as well as scanning electron microscopy (SEM)-based petrology with subsequent statistical processing to derive information mainly on both silt- and clay-sized quartz in shales from the Cambrian Niutitang Formation (Fm) exposed at the Jiumen outcrop in the Guizhou Province (southeastern margin of the Upper Yangtze Basin, Qiannan Depression, SW China; Figure 1). From this information, the implications for the regional reservoir setting were drawn. However, the most important task of this paper is to develop a workflow to (semi-)quantify the abundance of different quartz-types in shale lithologies.

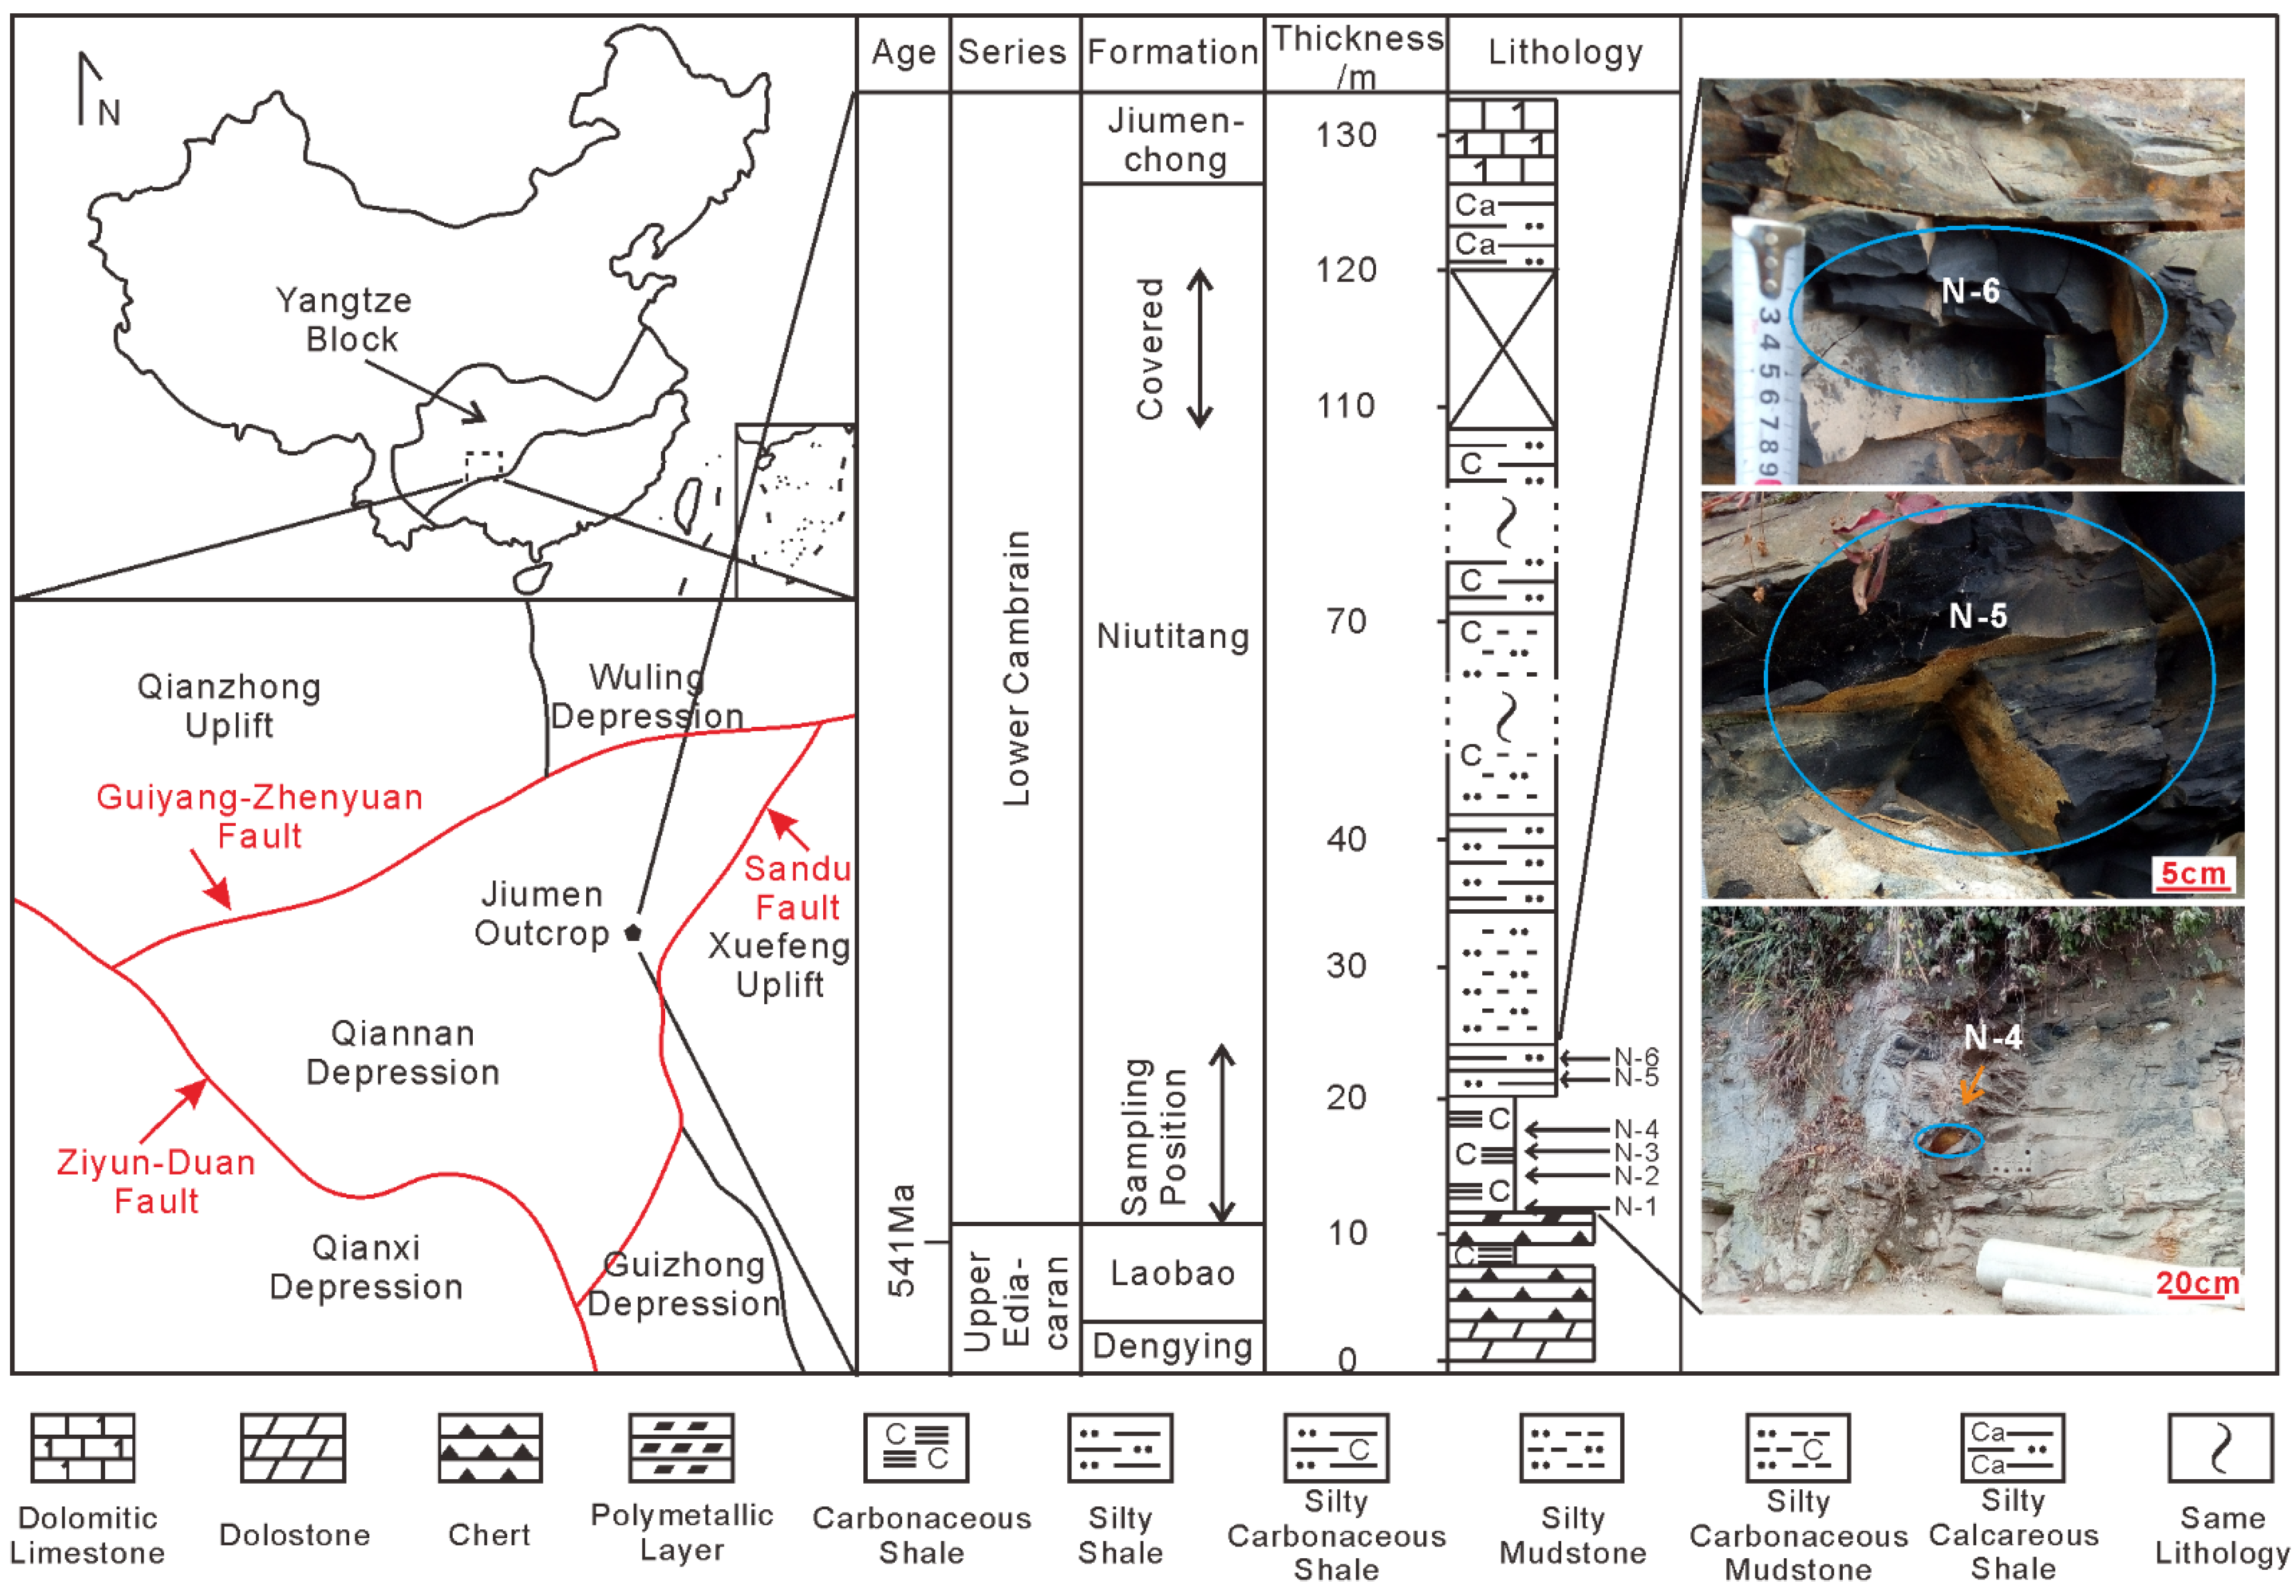
2. Geological Setting

The Cambrian period was dominated by the breakup of the Rodinia and the formation of the Gondwana supercontinent [32,33]. It was characterized by warm climate and generally rising sea levels [34,35,36]. Furthermore, the biological evolution from soft-bodied to hard-bodied organisms represented a major global change [37,38]. During the Early Cambrian, the Yangtze Block was located near the equator [39,40], where organic-rich shales were extensively accumulated on a global level [41]. These shales are often high-quality hydrocarbon source rocks and partly host polymetallic deposits (e.g., manganese), as well as phosphorite or sapropelitic layers [42,43,44].
According to [45], the studied part of the Niutitang Fm (Figure 1) was deposited at the outer continental shelf. After deposition, the burial depth of the studied Niutitang shales slowly increased during formation of the Qiannan Depression, until a period of slight uplift commenced at the onset of the Caledonian orogeny during the Middle Ordovician to the Late Silurian. Subsequently, the burial depth continued to increase and reached its maximum of about 7000 m during the Late Jurassic. Finally, the Niutitang Fm was uplifted and exposed to the surface in the Early Cretaceous as a result of the Yanshan orogenic episode [46]. The significant paleo-burial depth led to an advanced thermal maturity beyond the dry gas window (vitrinite reflectance values of 2–4% Rr) [47].
In the course of deep burial and uplift, the Niutitang Fm underwent complex diagenetic changes including compaction, mineral dissolution and replacement, recrystallization, etc. [48]. The quartz content of the Niutitang shales in this depression ranges from 23 to 72% and implied that the main types may be radiolarians and sponges [49,50]. The Niutitang Fm shales have higher total organic carbon (TOC) contents and thermal maturity than the Longmaxi Formation shale, the main shale gas-producing formation in China, and are therefore of promising potential of shale gas [50,51].

3. Samples

The studied outcrop is located at Jiumen village, near the town of Nangao and 127 km east of the city of Guiyang in the southeastern Guizhou Province (Figure 1). The GPS coordinates are 26°22′51.29″ N and 107°52′51.03″ E. At the studied location, the Niutitang Fm crops out in its full thickness. The lithology is heterogeneous, covering a layer of polymetallic enrichment overlain by carbonaceous shale, silty shale, silty carbonaceous shale, silty mudstone, silty carbonaceous mudstone, and silty calcareous shale layers within the formation.
The samples included in this study represent the lower part of the profile (Figure 1), where the highest TOC contents were found in this interval of 14 m [49]. The samples are labeled from base to top as N-1 to N-6. The porosity characteristics of these samples were reported by [48], from which the TOC content, the bulk mineralogical composition, as well as porosity data have been adopted for this study (Table 1).

4. Methods

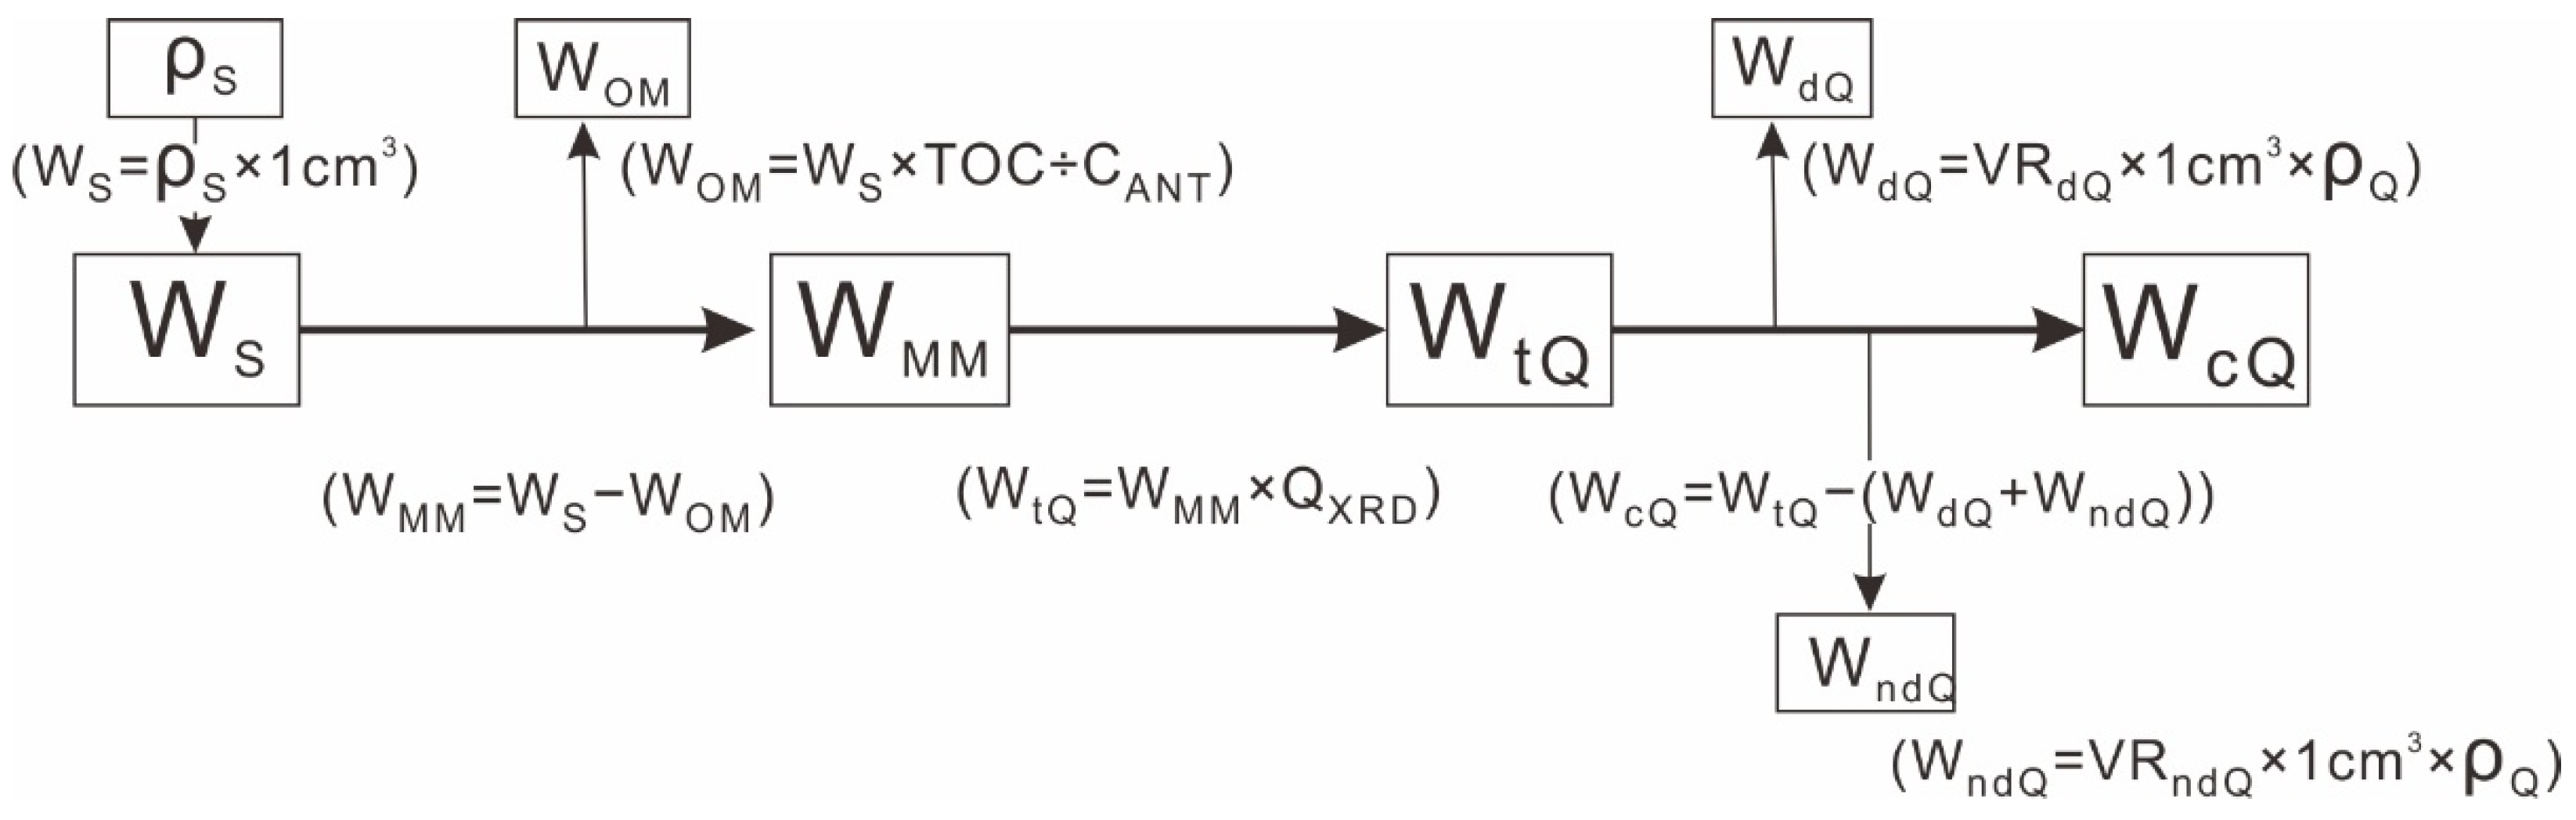
4.1. Bulk Density, Optical and Scanning Electron Microscopy-Based Petrography

This study combines previously published bulk compositional with newly acquired bulk density and petrographical data. Based on post-processing of SEM images, grain size statistical studies were conducted.
Bulk density measurements on crushed shale samples (3–6 mm pieces with a total weight of 25 g) were performed at Jiangsu Design and Research Institute of Geology and Mineral Resources (JDRIGMR) according to the China Coal Industry Standard MT/T 1027-2006 (results shown in Table 1).
Optical petrography was performed at the Key Laboratory of Coalbed Methane Resources and Reservoir Formation Process of the Ministry of Education (at China University of Mining and Technology) using a Nikon LV100NPOL microscope, made in Shanghai, China, and equipped with a Nikon NIS-Element 4.0 capture system, which allows adjustment of exposure intensity, exposure time, and other recording parameters.
SEM petrography was carried out at the JDRIGMR using a ZEISS SIGMA microscope equipped with an OXFORD X-Max 20 energy dispersive spectrometer. In this paper, large scanning areas of about 300 × 200 μm2 were used in order to capture the heterogenies in shale lithotypes as well as possible, thereby sacrificing the maximum achievable resolution of SEM-based studies which are more relevant to pore scale studies [15,52].

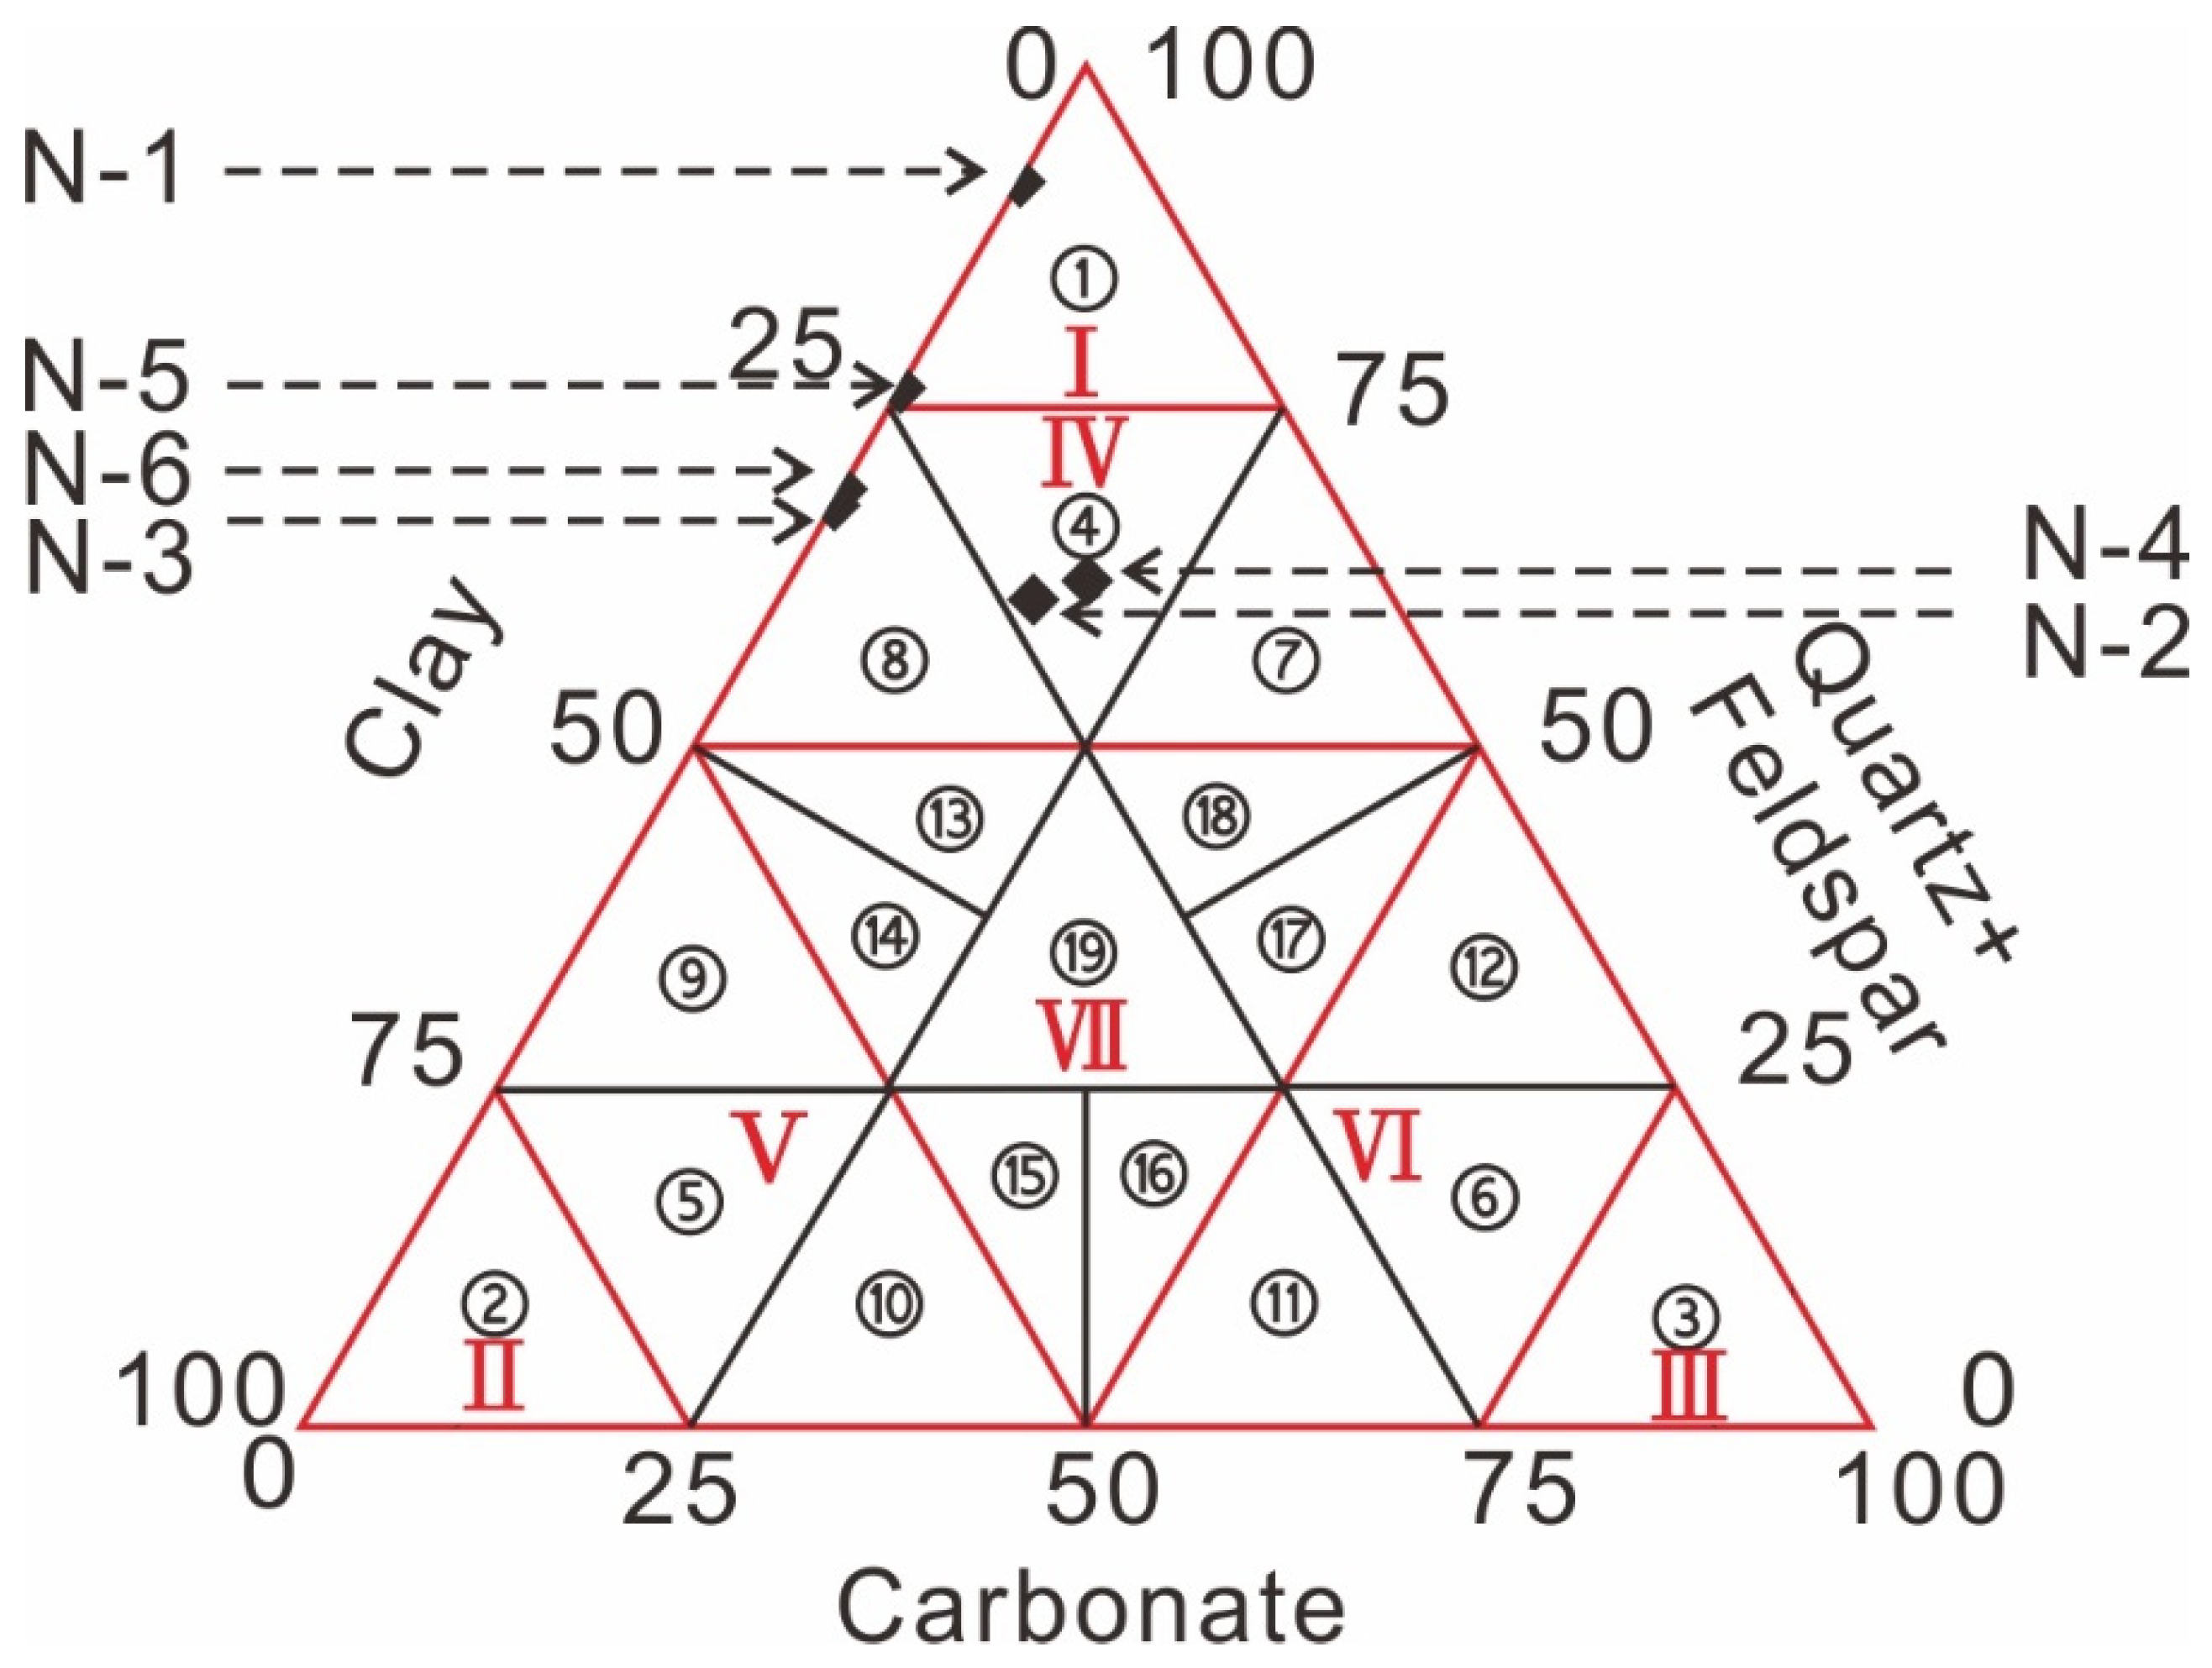
4.2. Shale Lithofacies Classification

Considering the macroscopic texture and structure of the present shale samples, which are relatively homogeneous and difficult to identify, the shale lithofacies classification scheme in this study was achieved based on the material composition obtained from XRD data, and refined from [53].
As shown in Figure 2, the ternary diagram categorizes shale lithofacies in detail, mainly considering the relative weight content of silicate minerals (quartz + feldspar), clay minerals, and carbonate minerals (calcite + dolomite) in shales, as shown below:
If the most dominant part, i.e., quartz + feldspar, clay minerals or carbonate, is more than 75%, the lithofacies is named siliceous rock, claystone or carbonate rock/dolostone respectively. However, it should be noted that the name of siliceous rock is narrowly defined and applied only to the present classification scheme in fine-grained sediments without considering the content of clasts and cementation, unlike the conventional definition of rocks formed by chemical, biological, or volcanic action and rich in siliceous minerals [54].
If the most dominant part is between 50 and 75%, the lithofacies is named siliceous/argillaceous/calcareous shale; if the content of each part is less than 50%, the lithofacies is named (X-X) mixed shale, where X is argillaceous/siliceous/calcareous. In addition, as the sum content of quartz and feldspar is considered as one variable, the category of siliceous shale is further divided into two subcategories based on the content of feldspar and quartz (feldspar siliceous shale and quartz siliceous shale).
However, if the case of a mineral content between 10 and 25% is considered strictly, there will be more than sixty types of lithofacies, which is too complex to apply. For simplicity, minerals with content in 10–25% range are not considered. Ultimately, the final classification of seven lithofacies categories (Roman numbers) and nineteen lithofacies subcategories (Arabic numbers) was determined (Figure 2).

4.3. Quartz Type Classification
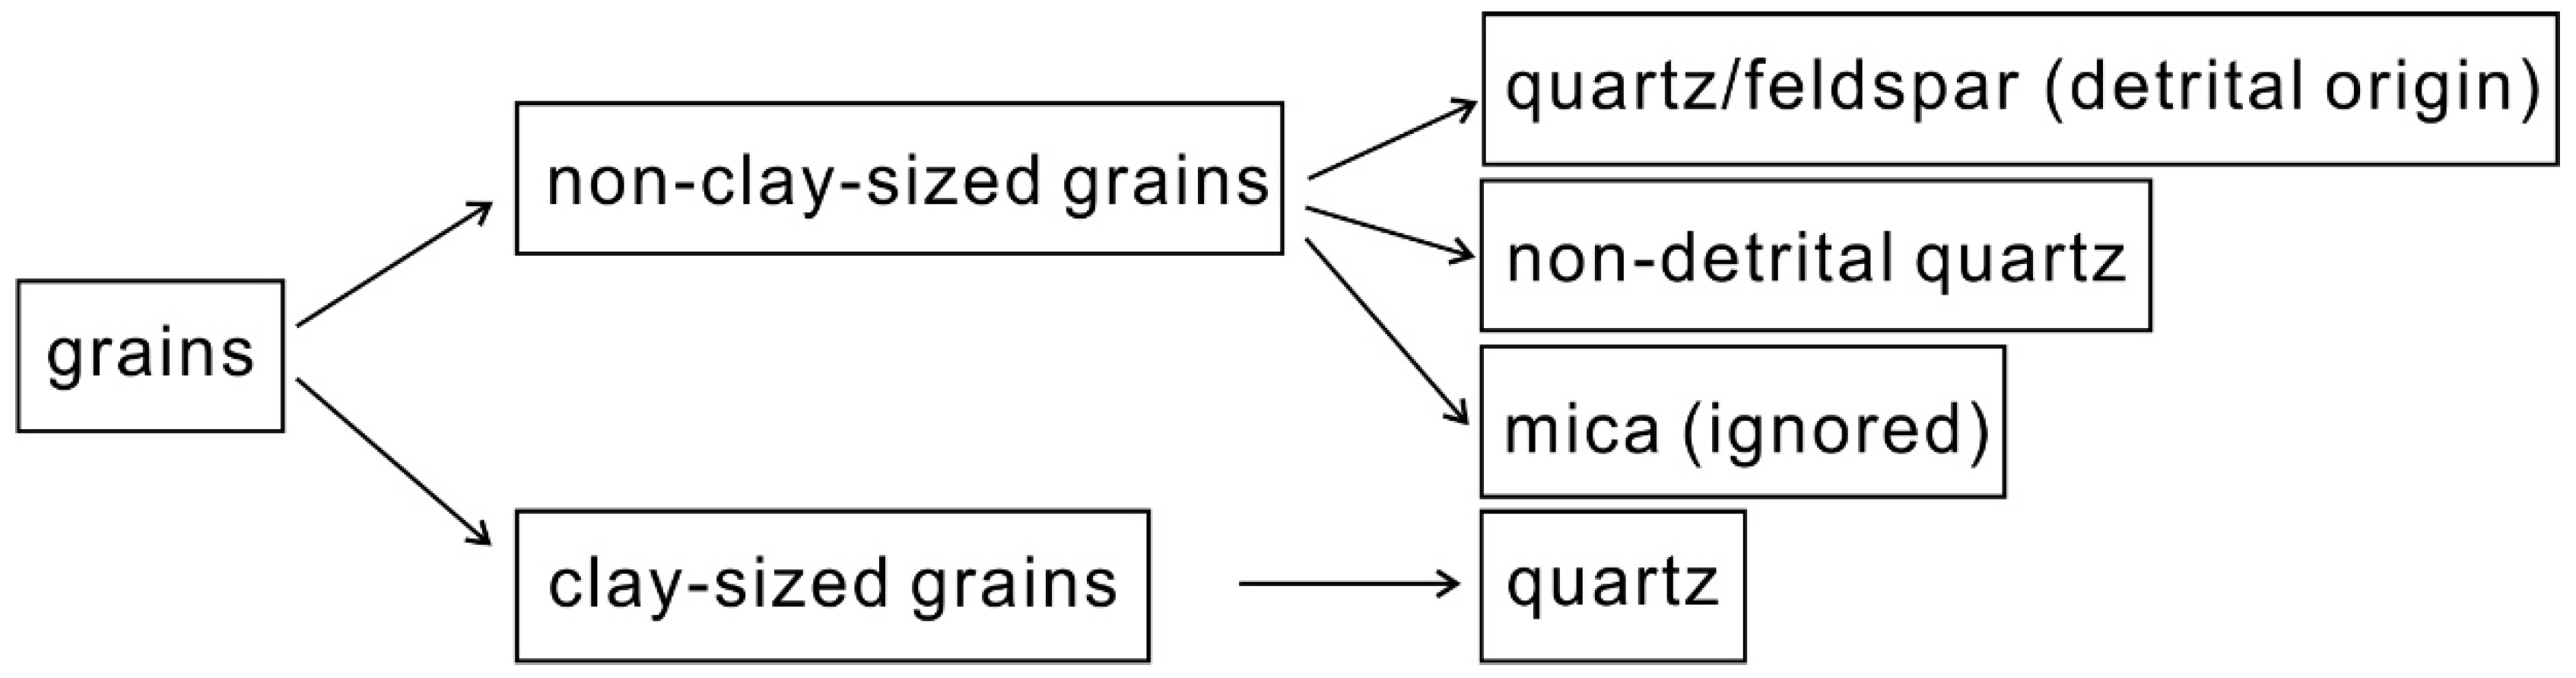
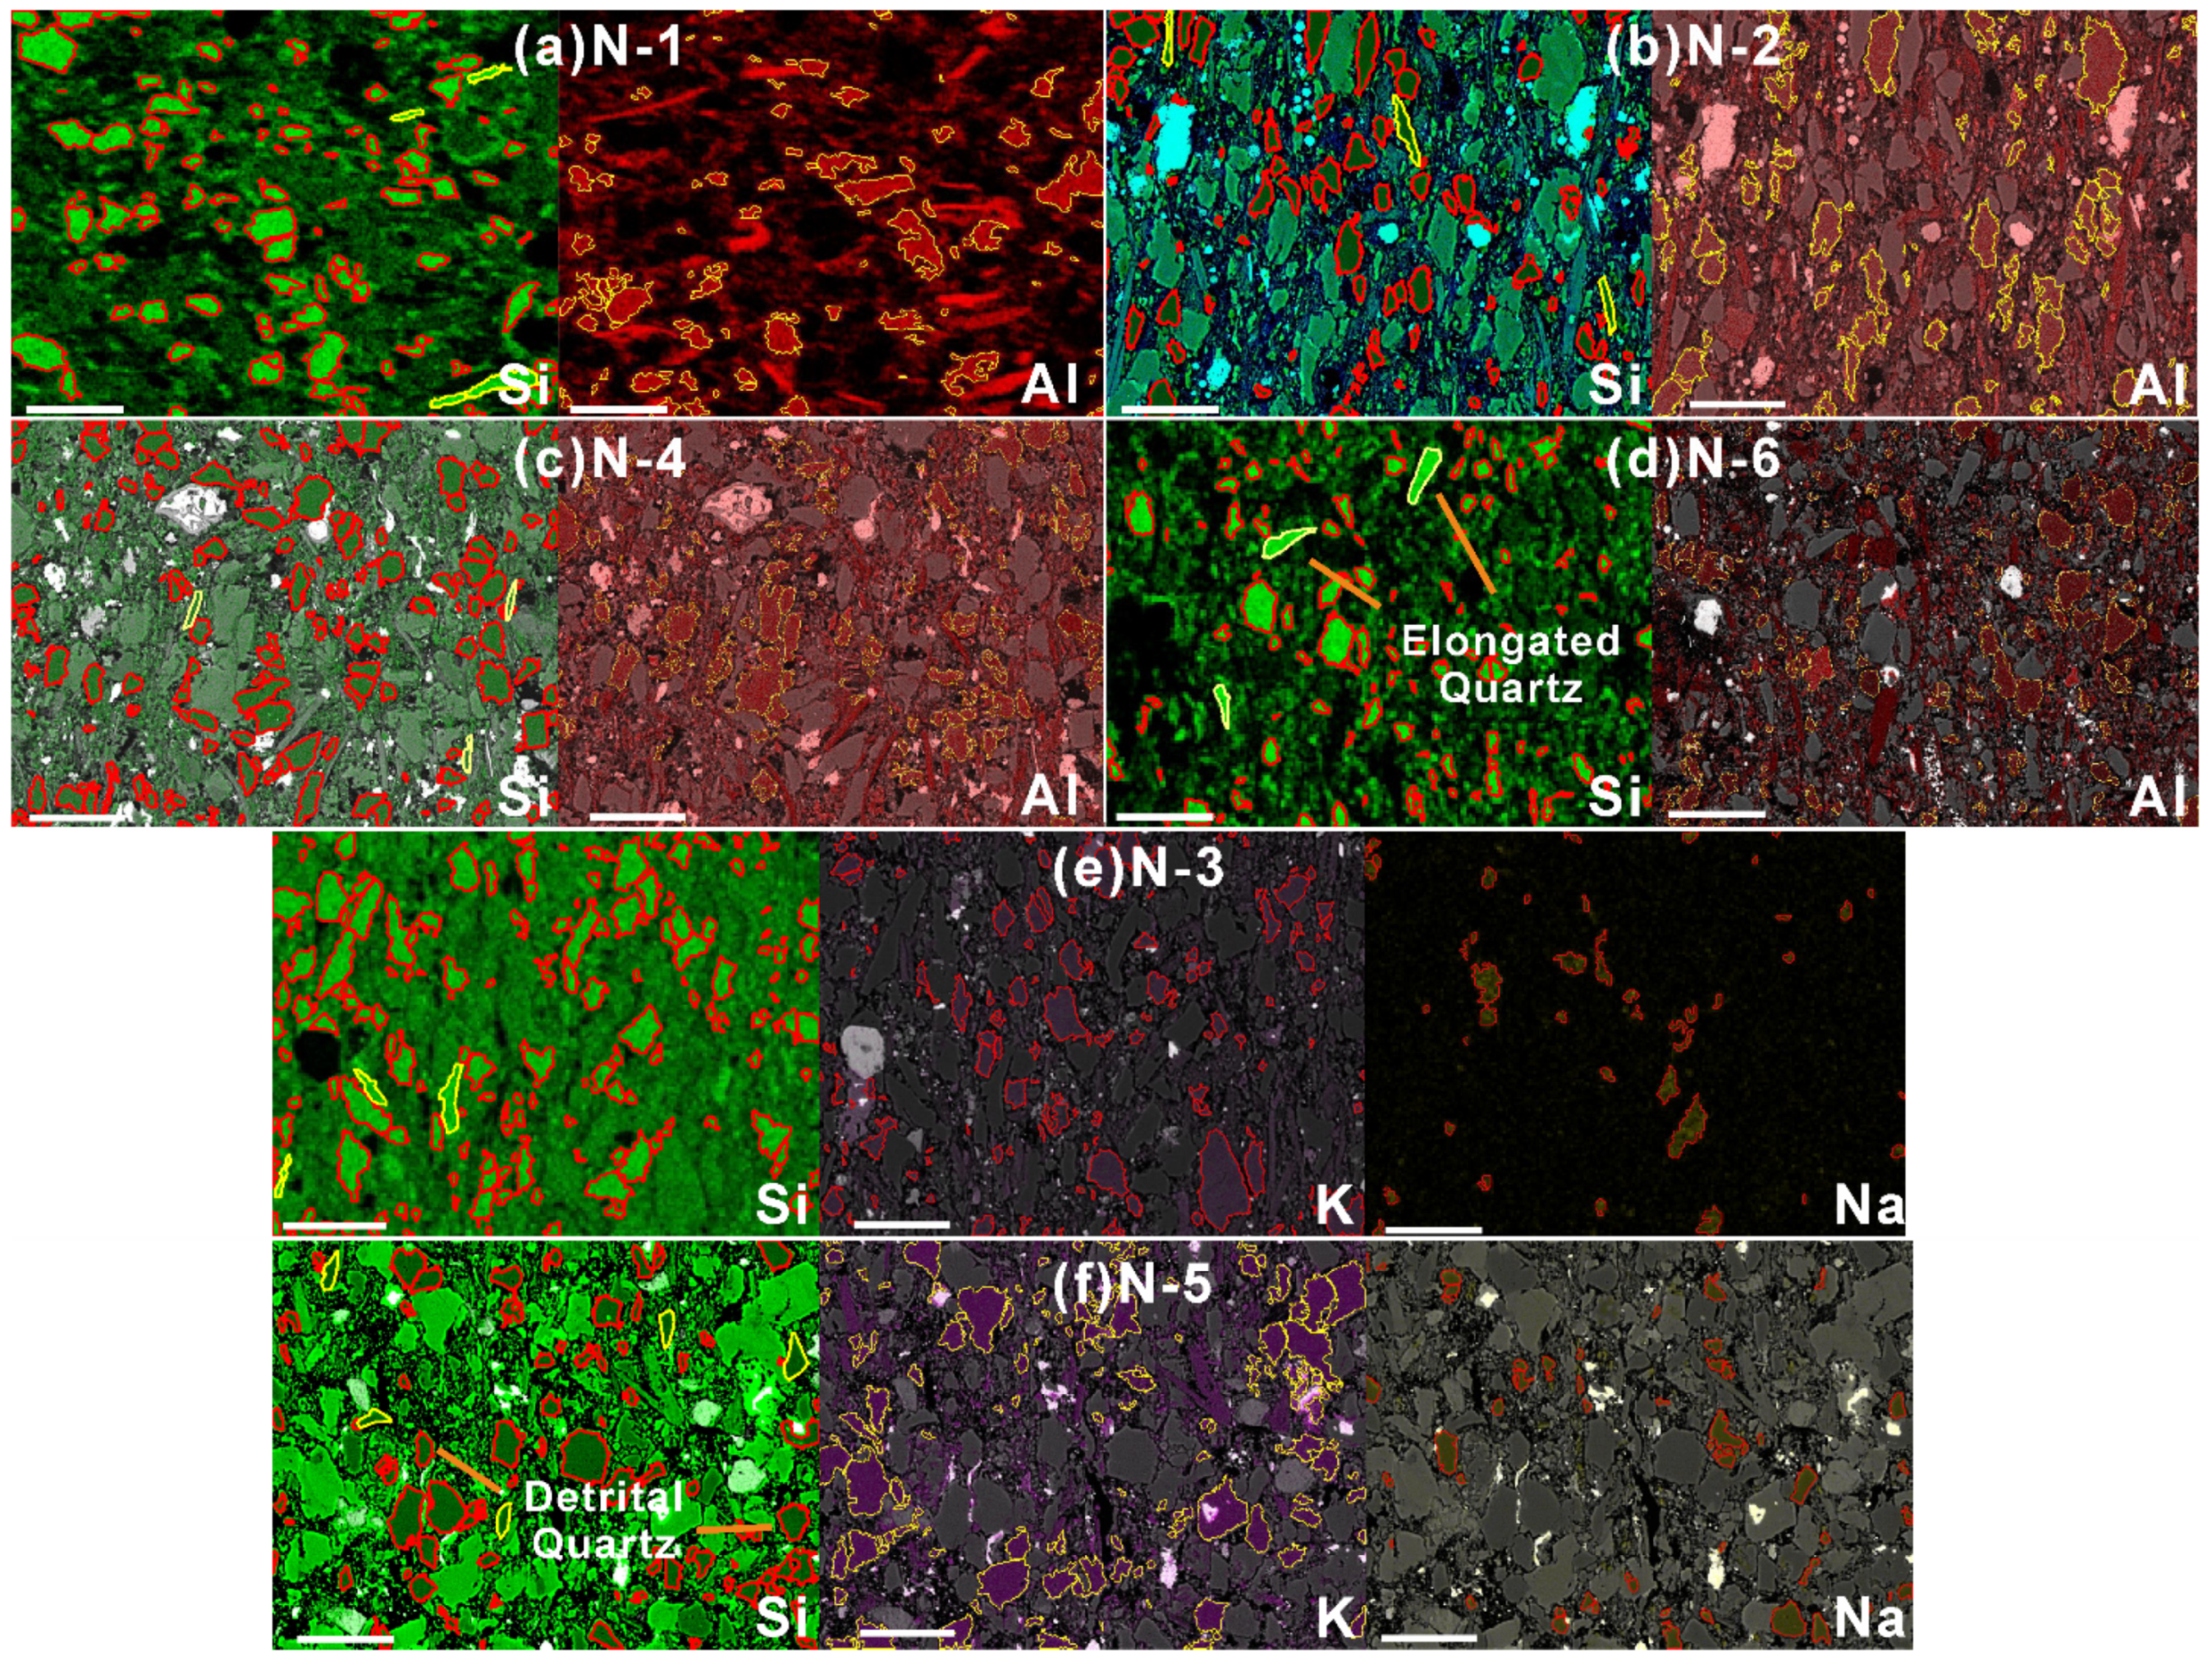
The quartz in shale is of diverse origin and has been modified by complex diagenesis. In the early stage of diagenesis, especially in the case of biogenic quartz and volcanic quartz input, there is frequent dissolution and devitrification of amorphous quartz, e.g., transformations from opal-A to opal-CT (18–56 °C), from opal-CT to quartz (31–165 °C) [55,56,57,58]. Furthermore, in the presence of clay minerals (e.g., illite), quartz also undergoes pressure dissolution (>100 °C) [59,60]. Moreover, the degree of clastic quartz modification varies between different shale formations, as seen in [61,62]. Additionally, the dissolution of feldspar and clay mineral transformation are common in shales [63]. All these processes could form or promote the formation of authigenic quartz. In conclusion, the types of quartz in the Niutitang shales could be clastic origin, biogenic origin, hydrothermal origin, volcanogenic origin, and authigenic origin (Figure 3).
In this study, optical microscopy with transmitted and reflected light, and SEM were mainly used to identify diverse quartz types.

4.4. Image Analysis

The image processing focused on non-clay-sized quartz and feldspar particles based on energy dispersive X-ray (EDX) mapping. The grain classification approach is schematically shown in Figure 4.
In the first step, areal quartz and feldspar percentages were calculated based on the abundance of Si vs. Al, Na and K in large and isolated grains (the clay-sized matrix below the threshold value of 4 µm was ignored). Particles with the highest Si were counted as quartz, whereas particles with second highest Al or significant signals for Na or K were counted as feldspar. Additionally, when signals of Na and K were used to calculate feldspar, the effect of pyroxene needed to be taken into account, because pyroxene minerals could contain Na. Therefore, the volume share of pyroxene needed to be calculated from XRD results and reduced from the share of feldspar.
Grain boundaries seen in the elemental images but blurred out were recovered as well as possible by comparing with secondary electron maps. The obtained areal percentages roughly correspond to the volume percentage of the respective phase in the bulk sample. It is important to note that since the TOC content of the studied section is up to 12% and strongly variable between samples, the impact of lighter-weight organic compounds to the weight percent distribution within each sample cannot be ignored when comparing image-derived with bulk mineralogical data (e.g., XRD data). Therefore, the image-derived data was converted to the weight percent share within a unit volume of 1 cm3, taking the individual TOC content and resulting bulk density (Table 1) of each sample into consideration (see equations in Figure 5). The weight of (i) total quartz (WtQ), (ii) detrital silt-sized quartz (WdQ), (iii) non-detrital quartz (WndQ), which is very different from common detrital particle morphology, and (iv) clay-sized quartz of detrital and non-detrital origin (WcQ) were distinguished based on the weight calculated for 1 cm3 of shale (WS) with a given percentage or weight of organic matter (WOM) which was estimated using the carbon content of anthracite (CANT).
Apart from the weight percentages of quartz types, the mean size values of detrital quartz and feldspar, standard deviations, the weight proportions of detrital quartz and feldspar to the bulk shale, and the detrital quartz/feldspar ratios based on area percentages were calculated for each sample.

5. Results

5.1. Bulk Density

The measured bulk density values ranged from 2.19 to 2.46 g/cm³ for the six investigated Niutitang Fm shale samples (Table 1). There were weak correlations between bulk densities and TOC contents (R2 = 0.4), bulk densities and quartz contents (R2 = 0.1), bulk densities and feldspar contents (R2 = 0.1), bulk densities and K-feldspar contents (R2 = 0.2), bulk densities and illite contents (R2 = 0.4), bulk densities and barite contents (R2 = 0.02).

5.2. Optical Microscopy

According to transmitted and reflected light microscopy, the grains in the investigated shales were mainly composed of quartz and feldspar, with a smaller amount of mica (Figure 6a,b). However, no pyroxene minerals could be observed in the investigated thin sections, so as barite and carbonate minerals (Table 1). Since pyroxene minerals would be dealt with the method mentioned above, carbonate and barite minerals could not affect the later image processing and phase quantification, it did not matter if these minerals could not be observed by optical microscopy, and therefore were ignored.
The detrital grains in the investigated samples were mainly angular to sub-rounded. No major layering was visible at thin section scale, although larger mica platelets were relatively uniformly orientated, indicating the bedding direction (Figure 6a,b).
Several types of quartz were observed in the studied shales: besides angular to sub-rounded detrital quartz grains (Figure 6a), non-detrital quartz such as spiral-like quartz, siliceous sponge spicules, polycrystalline quartz, and vein quartz (Figure 6c–g and Figure 7a,b):
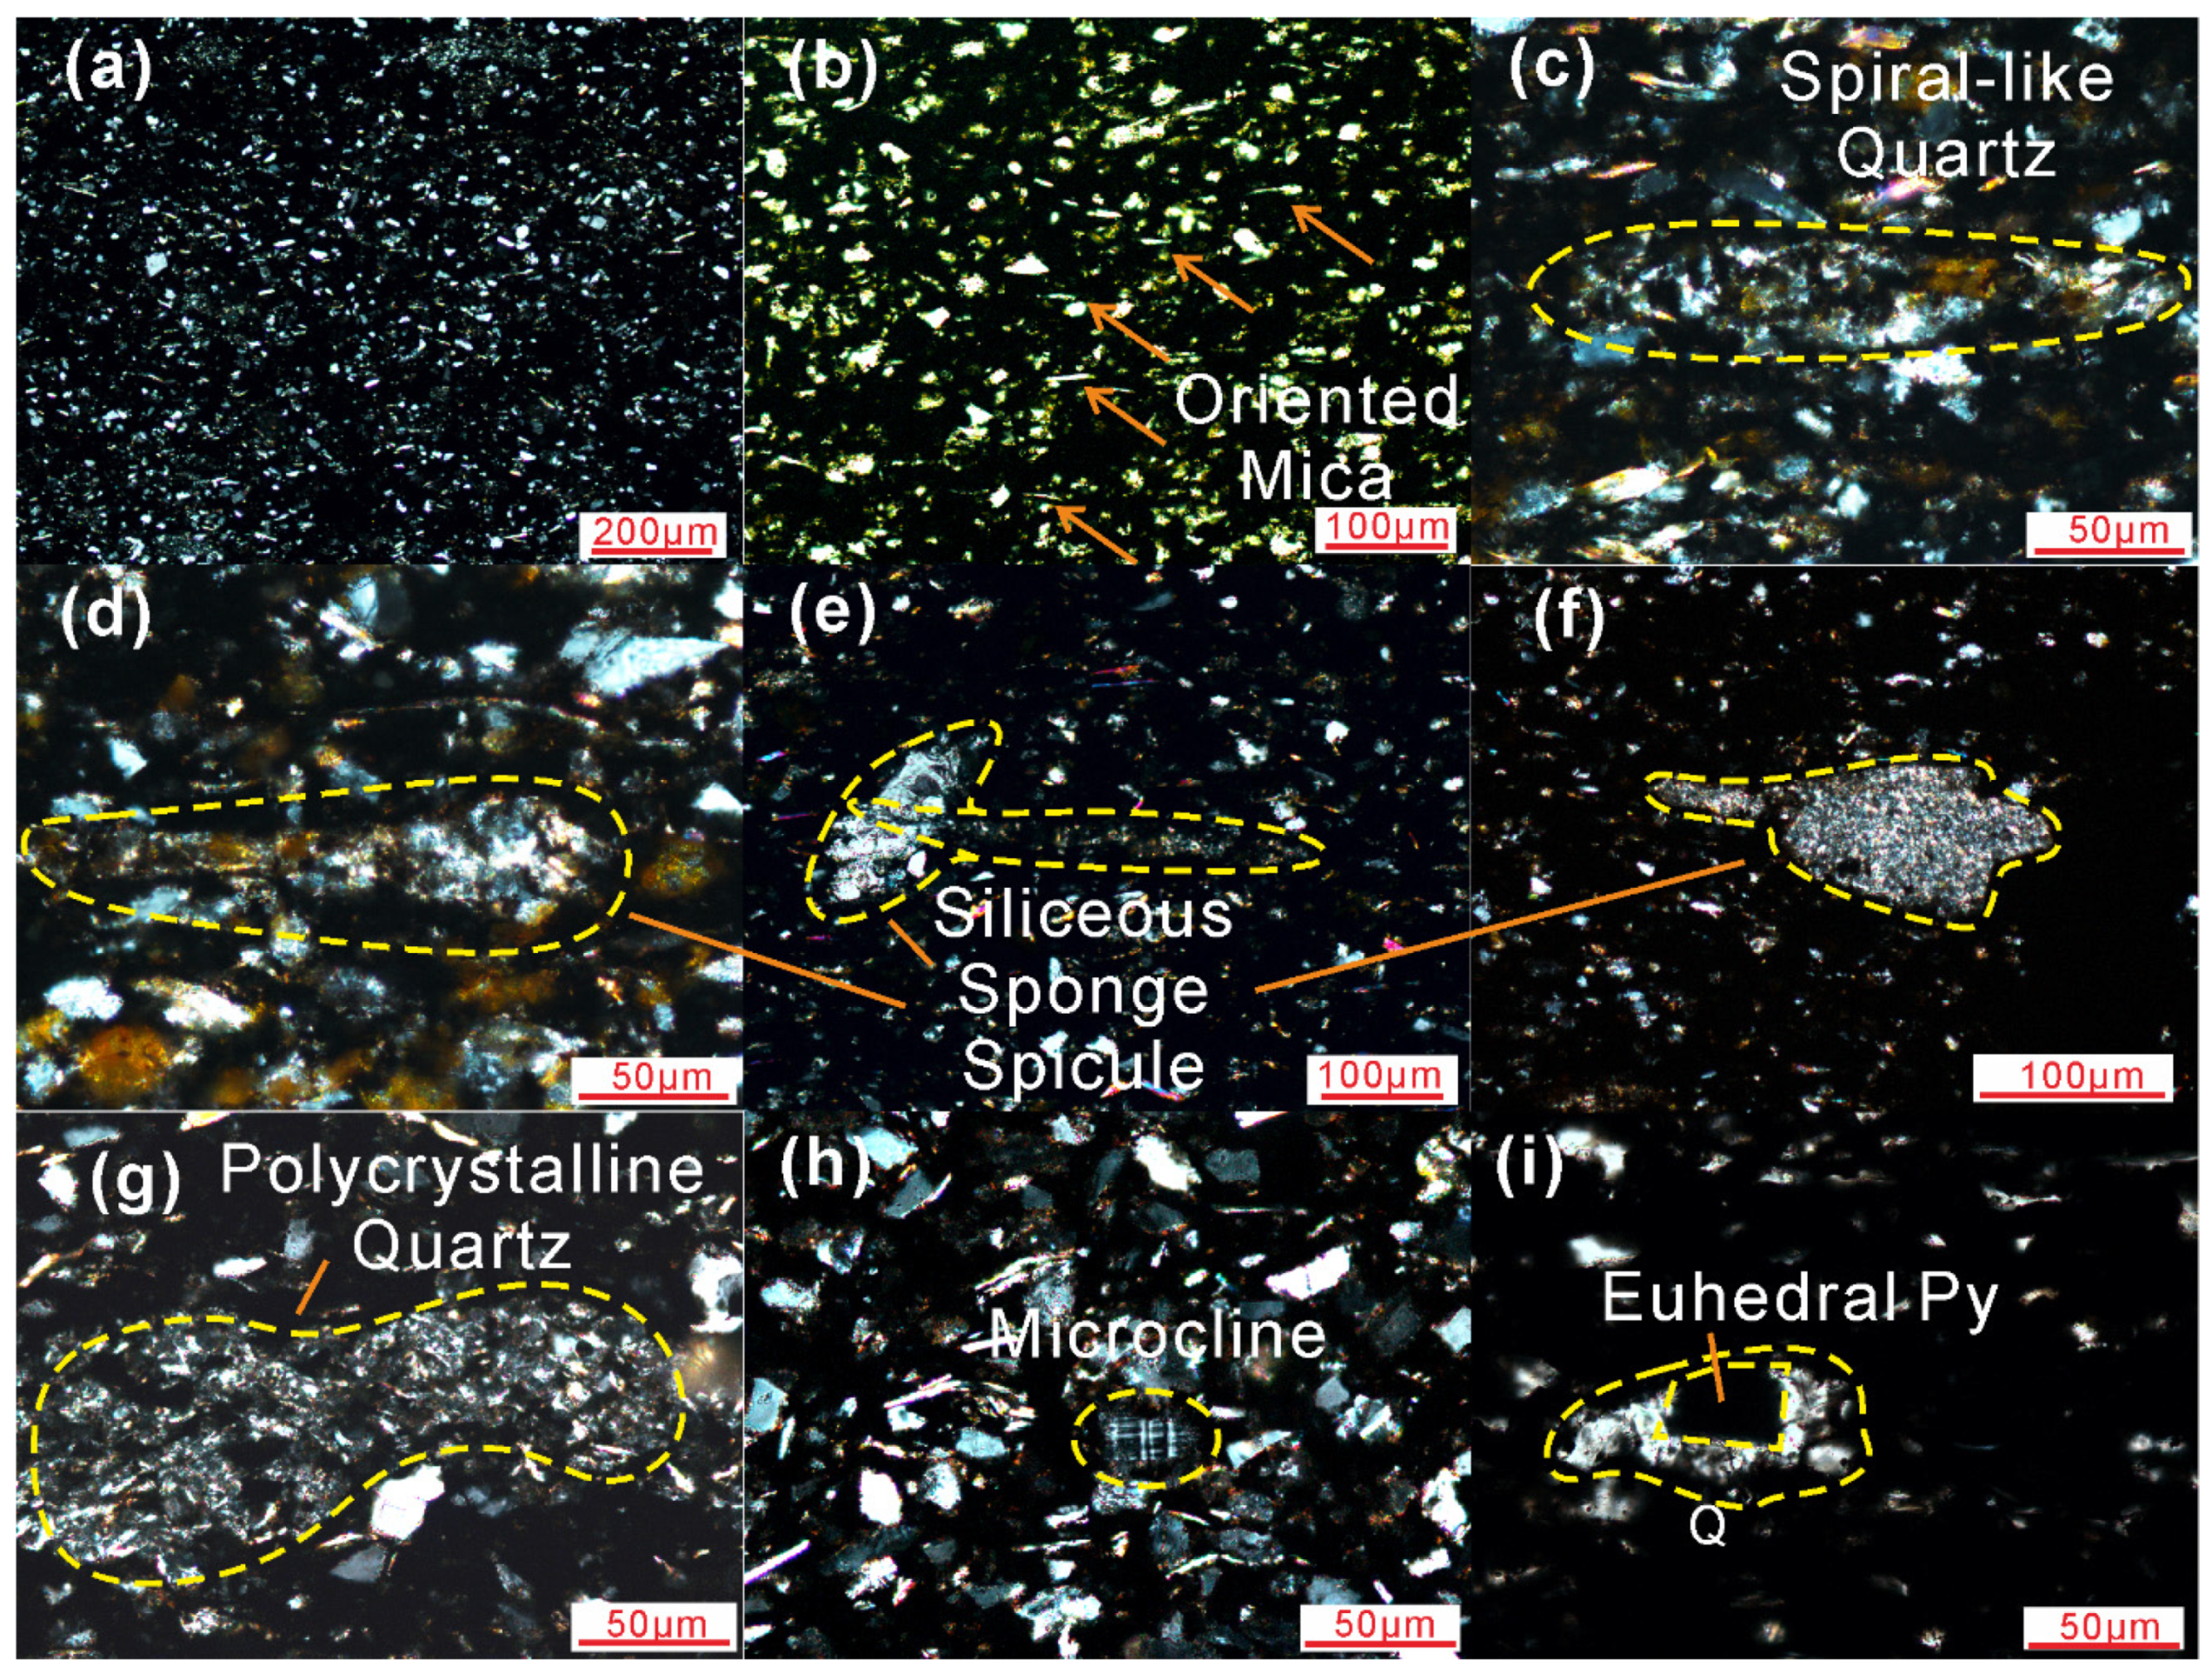
  • Spiral-like quartz (Figure 6c) is rarely observed. It has a columnar outline and is longer than the surrounding detrital minerals. When the microscope focus was slightly adjusted, an internal three-dimensional spiral-like microstructure could be observed, which can be used to differentiate it with sponge spicules.
  • Siliceous sponge spicules often show up as needle-like, or with a massive debris attached (Figure 6d–f). In some cases, when observed with the crossed polarizers under microscopy and by rotating the object stage, the structure of the needle-like object embedded in the massive debris could be found (Figure 6e). However, in some cases, the embedded structure could not be found (Figure 6f).
  • Polycrystalline quartz (Figure 6g) tends to exceed or approach the size of the largest detrital grains and shows up a variety of morphologies, such as elliptical and elongated. It was common in the N-6, but relatively rare in the other samples.
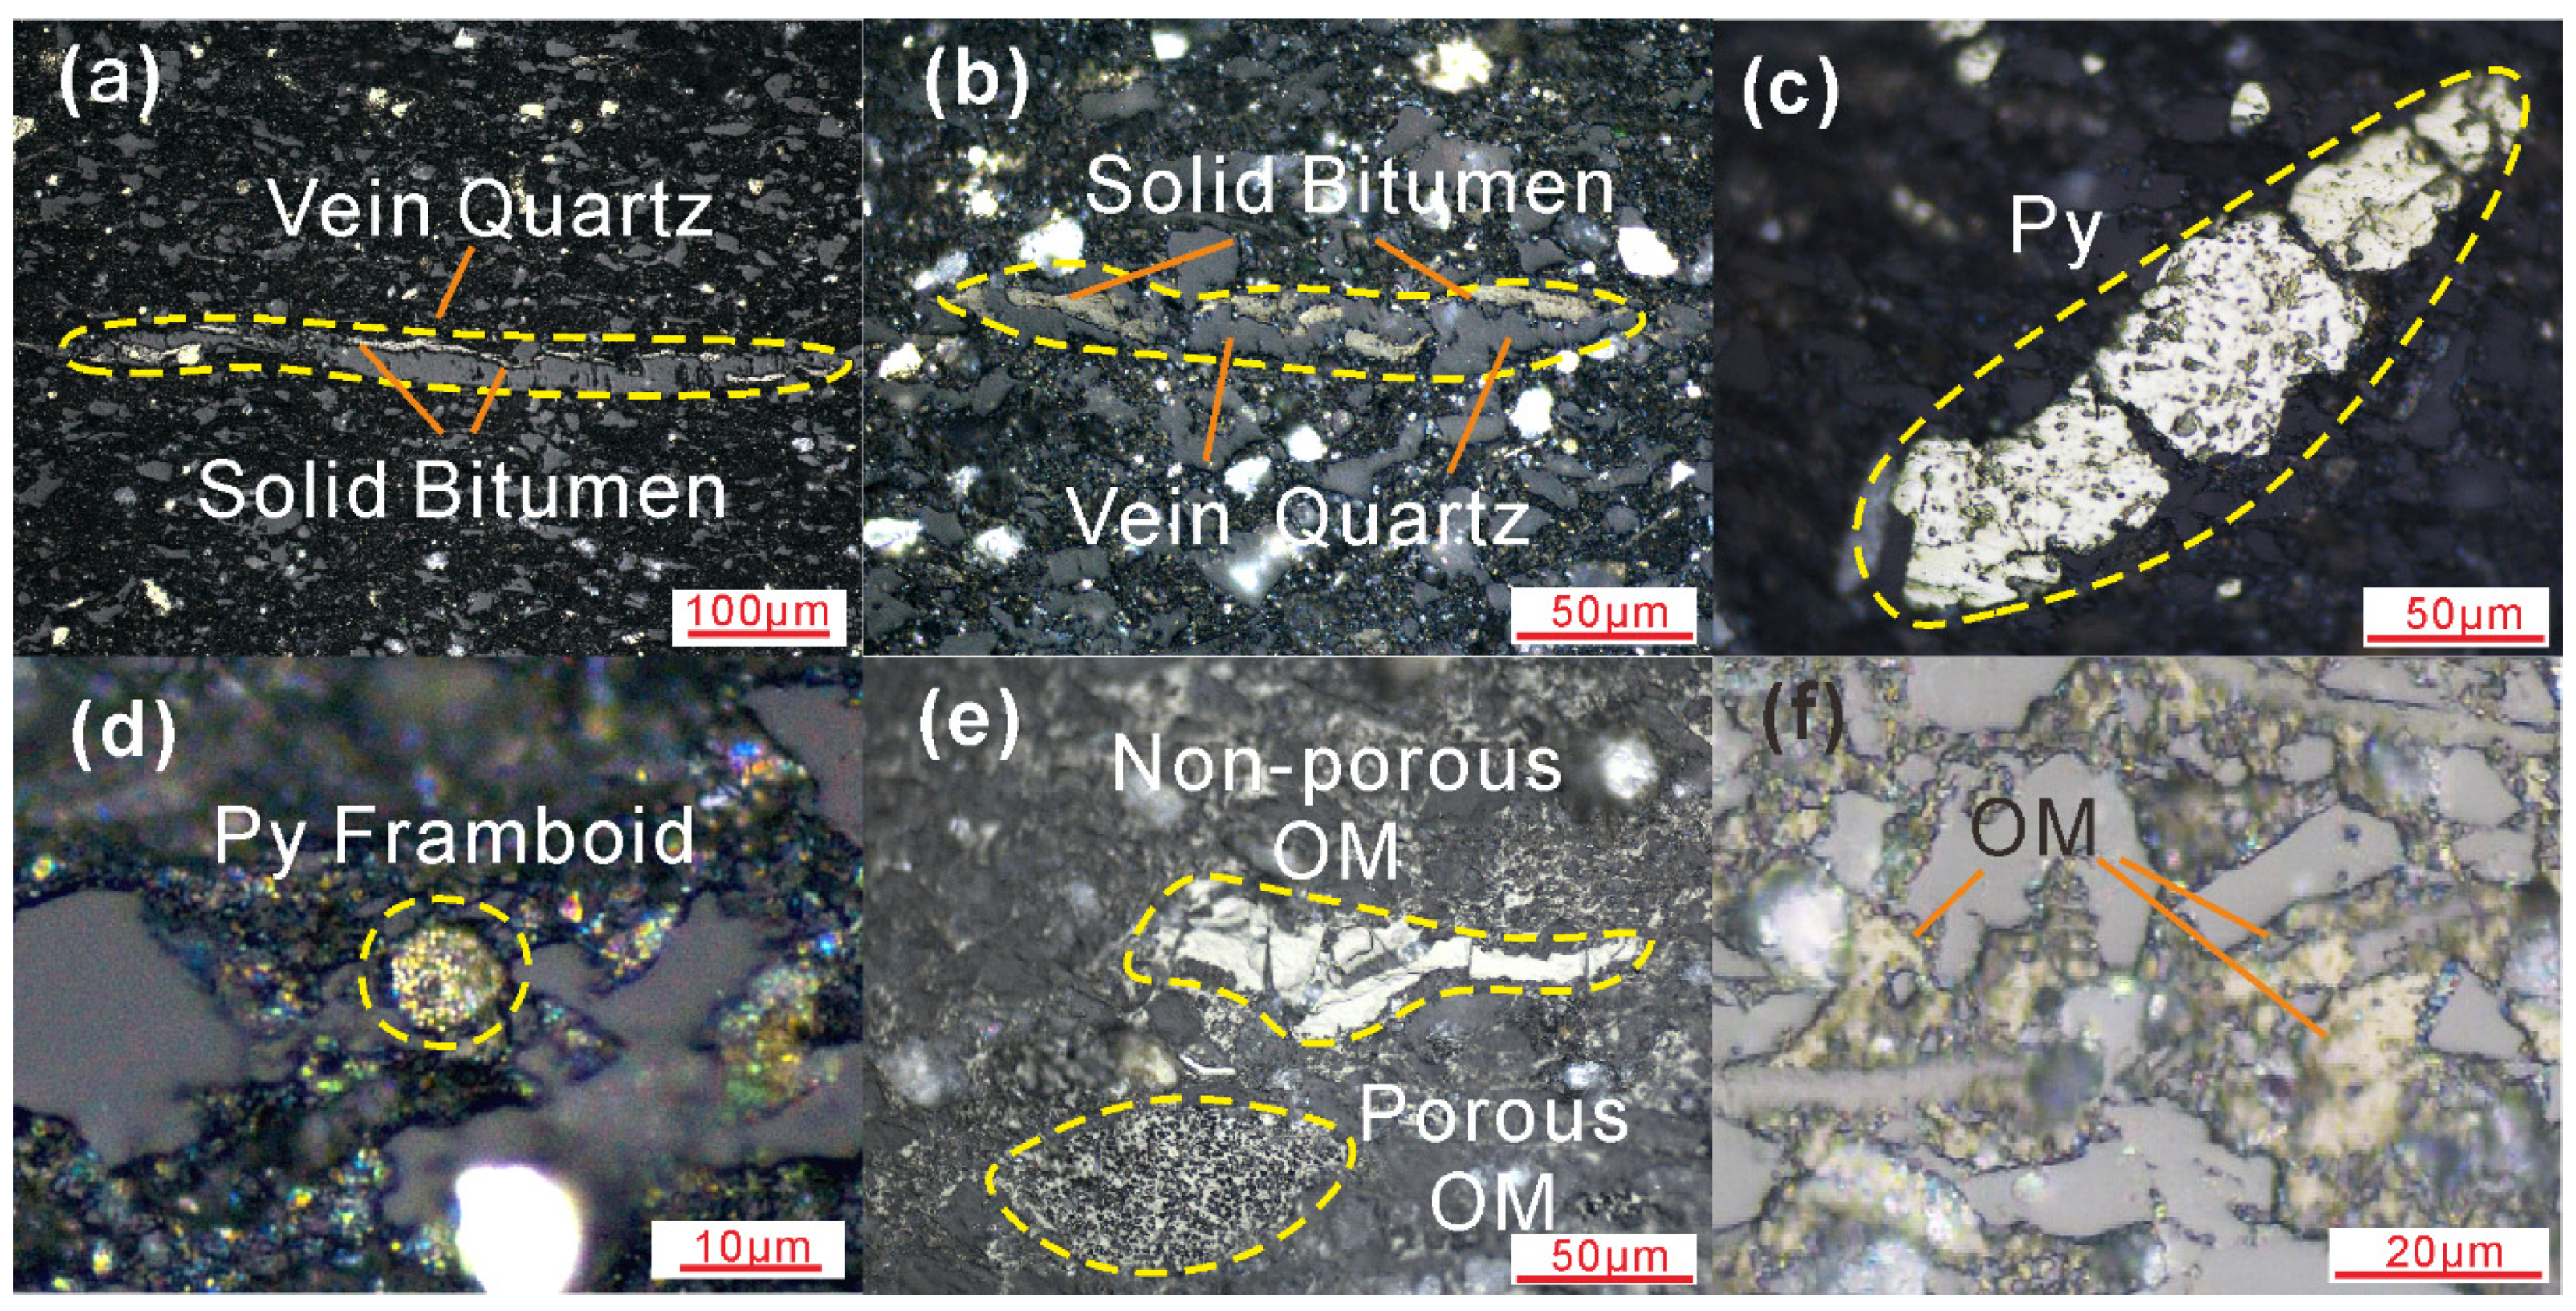
  • Quartz veins are bedding-parallel and have a very high length to width ratio. They are of variable size (normally around several hundred micrometers, Figure 7a,b; unlike fault veins cutting through the sample), and contain vertically fibrous crystals [48]. Moreover quartz veins typically contain solid bitumen [8], either along their margins or within the veins.
These features could be used to identify these quartz types from each other. A more detailed description of quartz types based on optical and scanning electron microscopy will be provided in a later section.
Additionally, the shales contained some microcline feldspars (Figure 6h), meaning feldspars could also be an important detrital mineral in the shales.
Pyrite was present in trace amounts in some samples (Table 1); the observed pyrite occurred as authigenic, well-defined crystals, as massive pyrites filling fossil cavities, as well as in the form of preserved early diagenetic pyrite framboid (Figure 6i and Figure 7c,d).
Due to the advanced thermal maturity, organic matter particles showed generally high reflectance values and often well-defined shapes (Figure 7e,f). However, the morphology and pore characteristics of organic matter particles may vary between such isolated, partly elongated organic matter aggregates with defined outlines, which may exceed or approach the size of the largest detrital mineral grains. Normally, the organic matter aggregates shown in Figure 7e (the upper one) usually show up as a group consisting of several parts which are separated by nearly vertical boundaries, so as the solid bitumen companioning with vein quartz (Figure 7a,b).

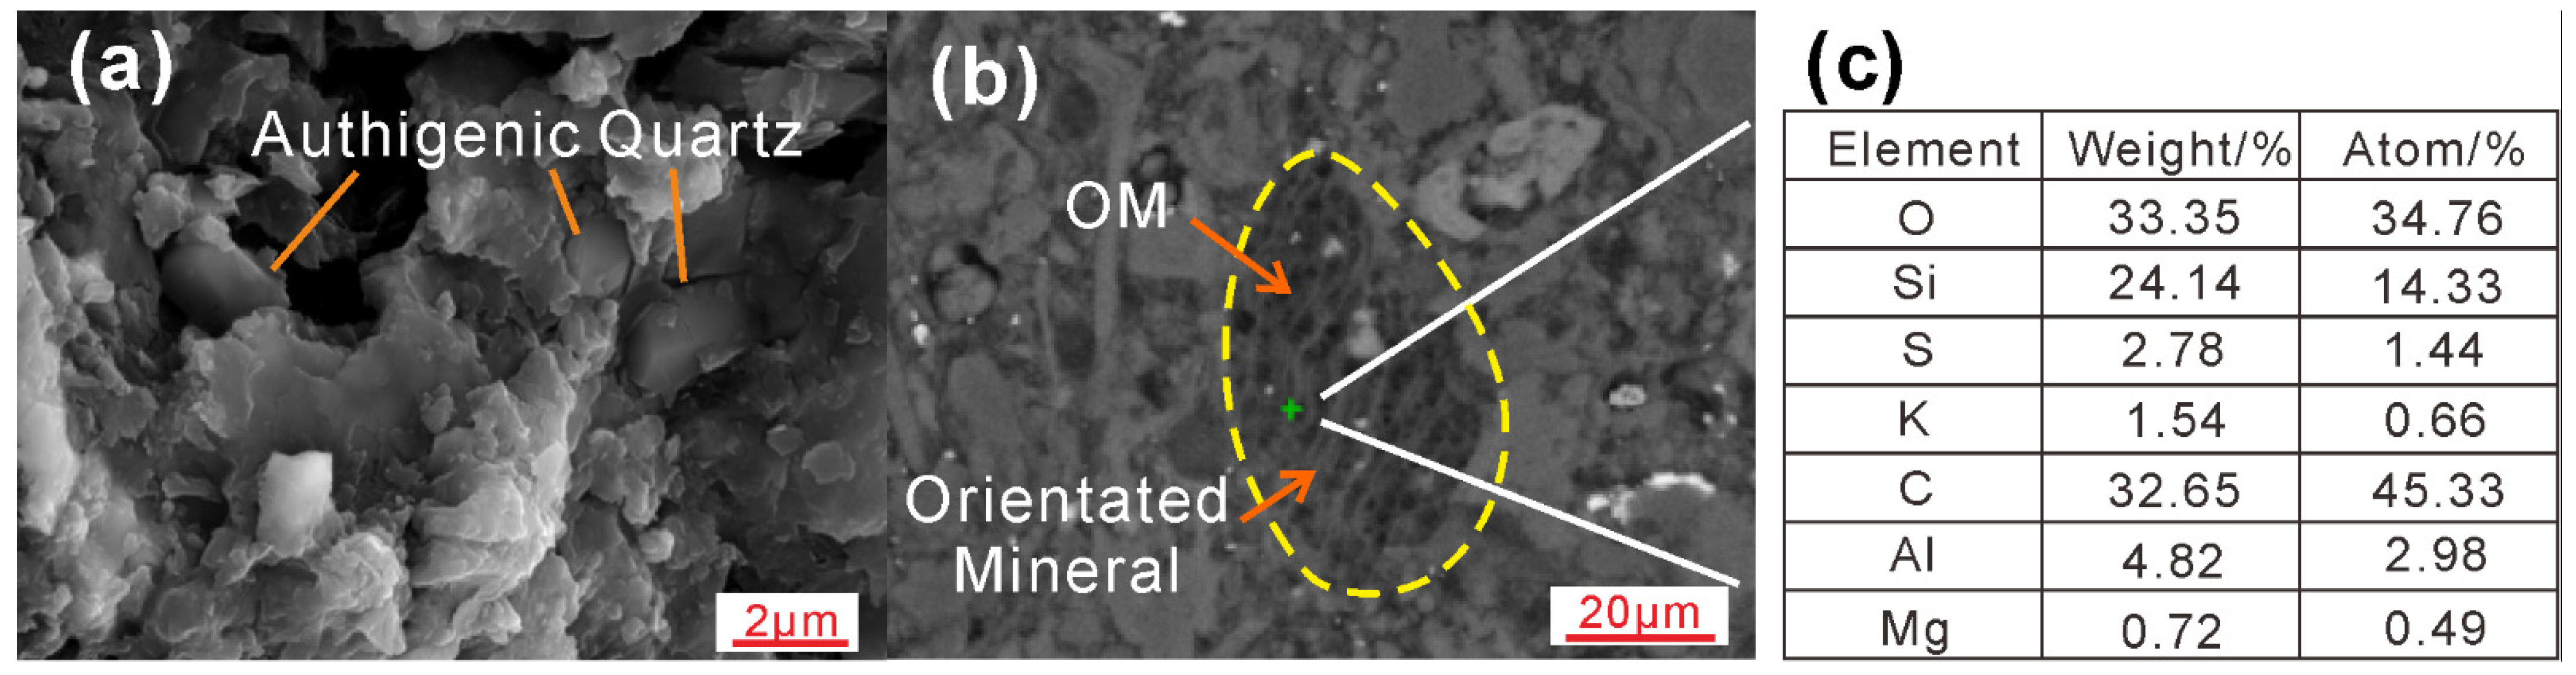
5.3. Scanning Electron Microscopy

SEM investigations were performed both on freshly broken rock surfaces as well as on the thin sections used for optical petrography (Figure 8 and Figure 9). The main focus was to identify quartz types and feldspar by an overlay of electron images and EDX maps (Figure 9).
Well-crystallized authigenic quartz, around 2 µm long, was observed (Figure 8a). Furthermore, mapped particles with intergrowth of organic matter and orientated minerals often show Si enrichment besides the main constituents C and O, pointing to a certain content of quartz in these aggregates (Figure 8b,c).
EDX maps of the elements Si, Al, K, and Na were used to differentiate between quartz (Si-rich domains) and feldspar (Al-rich, or Na- and K-rich domains). Si enrichments occurring as “elongated” particles were counted separately (Figure 9). The Al scanning results of N-3 and N-5 were poor; therefore, K and Na were used as feldspar indicators particularly in these samples (Figure 9e,f).

5.4. Quartz Types Based on Optical and Electron Microscopy

Clay-sized quartz types: Clay-sized quartz types may include authigenic quartz, detrital quartz and biogenic quartz. Authigenic quartz is often microcrystalline or grows in pores or is embedded in clay minerals, which can be identified by its crystalline shape (Figure 8a, with size ~2 μm; [64]). The distinction of the different types is often difficult and, therefore, not further discussed here.
Silt-sized detrital quartz: The roundness of silt-sized detrital quartz is angular to sub-rounded (Figure 6a,b and Figure 9f). The grain size of silt grade is the main basis for identification.
Biogenic quartz types: Biogenic quartz tends to have larger sizes, as well as more regular geometric features than detrital grains, such as circular and linear, which could be used to identify it from other quartz types. Spiral-like quartz (Figure 6c), needle-shaped sponge spicules together with a massive debris (Figure 6d–f) and quartz intergrowth in particles with organic matter (Figure 8b) were considered of biogenic origin. In contrast to sponge spicules, the origin of spiral-like quartz and of quartz-organic matter intergrowths cannot be identified. In addition, the variable morphology and particle-size characteristics between biogenic and detrital quartz indicate different transport mechanisms. Furthermore, the biogenic quartz compositions of the Niutitang Fm shales in different regions are quite different, controlled by the sedimentary environment and the stratigraphic position within the formation [49,65,66].
Vein quartz (Figure 7a,b) is supposed to be formed from silica-rich pore fluids after fracture generation, and the dilatation rate of wall rock was lower than the growth rate of quartz crystal [67,68]. The timing of vein formation remains unclear. Both opening during hydrocarbon generation or during uplift seem possible.
Quartz types of uncertain genesis: irregularly shaped polycrystalline quartz (Figure 6g) and “elongated” quartz were classified into quartz of uncertain origin and non-detrital quartz in Figure 4 and Figure 5.
The morphology of “elongated” quartz (Figure 9) is similar to that of sponge spicule [56]. However, it is also similar to the lobate-to-pointed projection, which means it has a possible authigenic origin [69]. The “elongated” shape could also be detrital.
Although the vein quartz and “elongated” quartz are morphologically similar, they can still be differentiated by grain size and the presence or absence of accompanied elongated solid bitumen, i.e., the former generally shows a larger scale, lower frequency and is accompanied with elongated solid bitumen.
Even the origins of some quartz are uncertain; they were categorized into non-detrital quartz (WndQ) and subtracted from the total quartz (WtQ) in the calculation of clay-sized quartz (WcQ, Figure 5). Thus, the final results of clay-sized quartz will not be affected.

5.5. Shale Lithofacies
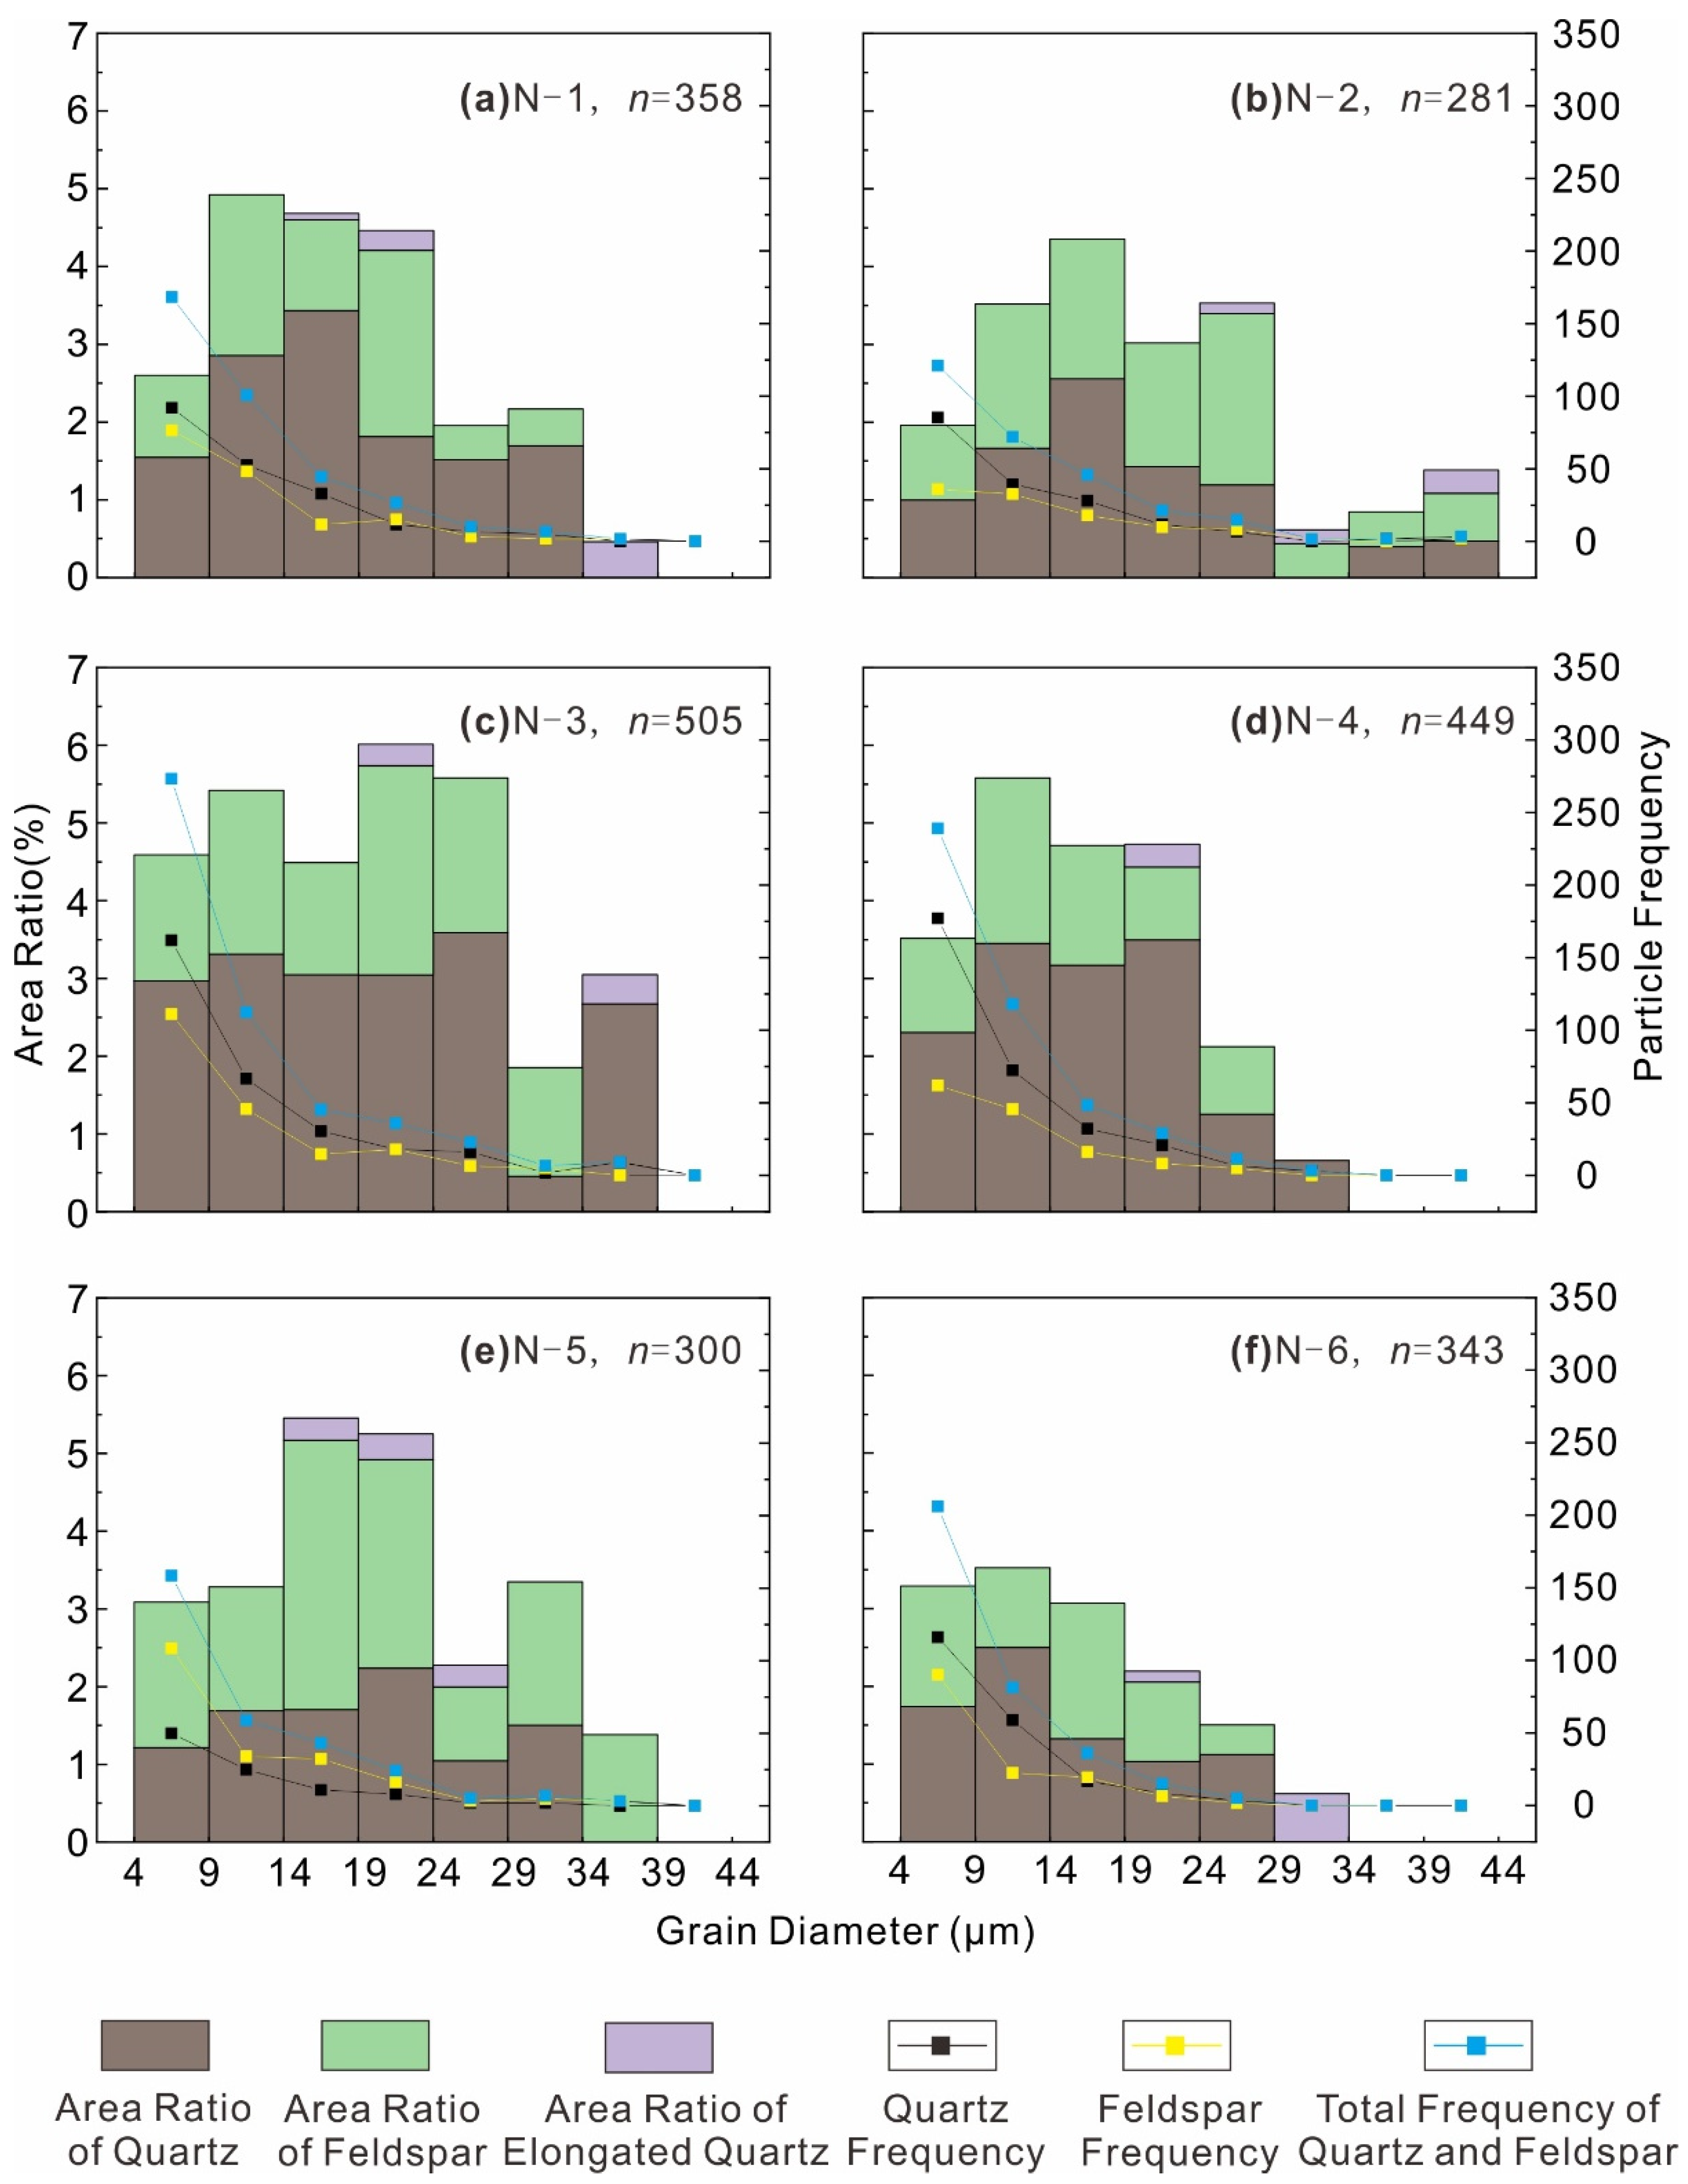
Based on the classification method mentioned in Section 4.2 (Figure 2), a total of three lithofacies types in the studied Niutitang Fm shales was recognized, including siliceous rock, quartz siliceous shale and argillaceous quartz siliceous shale.
Siliceous rock: representative samples were N-1, N-5. Sample N-1 was immediately above a polymetallic layer and can stain hands easily. It shows a well-developed lamination (Figure 1). Furthermore, organic matter as shown in Figure 7e,f was observed. Sample N-5 was characterized as thin-moderate thick-bedded carbonaceous shale. Detrital grains in N-5 were more abundant than in N-1. Moreover, non-porous organic matter aggregates similar to Figure 7e were also found in N-5.
Quartz siliceous shale: representative samples were N-2, N-4. Macroscopic characteristics of both samples showed moderate-thick bedded organic rich shales without laminations. Sample N-2 had the highest organic matter content. Organic matter aggregates shown in Figure 7e were also found in N-2. In N-4, a small amount of detrital feldspar could be identified, including microcline (with crossed twinning, Figure 6h) and plagioclase (with albite twin). A huge amount of detrital grains were also found in N-4.
Argillaceous quartz siliceous shale: representative samples were N-3, N-6, with lower TOC contents than the other lithofacies. Microscopically, N-3 had a high content of detrital minerals, no lamination, little mica content, pyrite with good crystalline shape, pyrites filling fossil cavities, and pyrite framboids (Figure 7c,d). Some quartz of biogenic origin was also found (Figure 6c–f). In addition, N-6 included quartz vein associated with solid bitumen (Figure 7a,b). Polycrystalline quartz was frequently found in N-6 (Figure 6g).

5.6. Image Analysis

The first step in image analyses was to detect the distribution of particle size of all samples. In order to do so, uniform size intervals were chosen as follows:
(i)
4–9 µm,
(ii)
9–14 µm,
(iii)
14–19 µm,
(iv)
19–24 µm,
(v)
24–29 µm,
(vi)
35–39 µm, and
(vii)
39–44 µm.
The detailed results of the statistical analyses of particle size, and related parameters, including area ratio in a specific size interval, average grain size, standard deviation, and ratio of detrital quartz and feldspar, were calculated (shown in Table 2 and Figure 10).
The area shares of the sum of total detrital quartz and feldspar within the image maps ranged from 13% (N-6) to 24% (N-3). The areas occupied by detrital quartz ranged between 8% (N-6) and 19% (N-3), while the areas occupied by detrital feldspar, area ratios of pyroxene subtracted for N-3 and N-5, ranged between 5% (N-3) and 10% (N-2). The detrital quartz vs. feldspar ratio was greater than 1 for samples N-1, N-3, N-4 and N-6 (1.7, 3.6, 2.1 and 1.4, respectively), while it was lower than 1 for samples N-2 and N-5 (0.9 and 0.98, respectively). The dominant grain size interval of detrital quartz was 9–24 μm (49 to 71%, Table 2). The area ratios of “elongated” quartz on total area ranged from 0.3 to 0.9%, as shown in Table 3 and Figure 10.
The mineral weights calculated for a unit volume of 1 cm3 are shown in Table 4. In 1 cm3 of shale, the content of quartz ranged from 0.89 g (N-2) to 1.42 g (N-1); the content of feldspar ranged from 0.13 g (N-2) to 0.28 g (N-1); the content of pyroxene in N-3, N-4 and N-5 was 0.2, 0.14 and 0.14 g, respectively.
The intermediate and final results of the quartz fraction calculations, using the method schematically outlined in Figure 5, are shown in Table 5. The mass shares of clay-sized quartz versus bulk mineral matter (WRcQ-MM) ranged from 25% (N-3) to 53% (N-1), with a mean value of 37%. Furthermore, the volume ratios of pyroxene (VRP) are shown in Table 5, ranging from 4.2% to 6%.
For all samples, the particle frequency decreased with increasing particle size (Figure 10). The total frequency of measured quartz and feldspar varied between samples, with N-3 containing the highest amount of clast (n = 505), and N-2 containing the lowest amount of clast (n = 281, Figure 10). The area ratio decreased as the grain size increased or decreased from the grain size interval corresponding to the highest area ratio, with a number that could not be ignored in 4–9 µm (Figure 10). It means that the interval less than 4 µm may contain few detrital particles.

6. Discussion

6.1. Advantages and Disadvantages of This Workflow

The workflow proposed by this paper aimed to calculate the content of silt-sized quartz and clay-sized quartz in gas shales in respect of petrology, using a combination of some relatively low-cost and easy-to-operate methods. Although both are for the study of refined quartz types, this workflow is more specific and straightforward than the method of calculating “excess Si” [72]. In contrast to the workflow of physical crushing-chemical dissolution-grain size separation [30], the present workflow reduced the interference of the physical crushing process on the results of quartz size analysis, by in situ measuring.
However, the observation of transmitted light microscopy does not correspond perfectly to that of the reflected light microscopy and SEM. For example, three-dimensional microstructures observed with the transmitted light did not show up with the reflected light and SEM. This led to a limited in-depth discussion of the origins of quartz types.

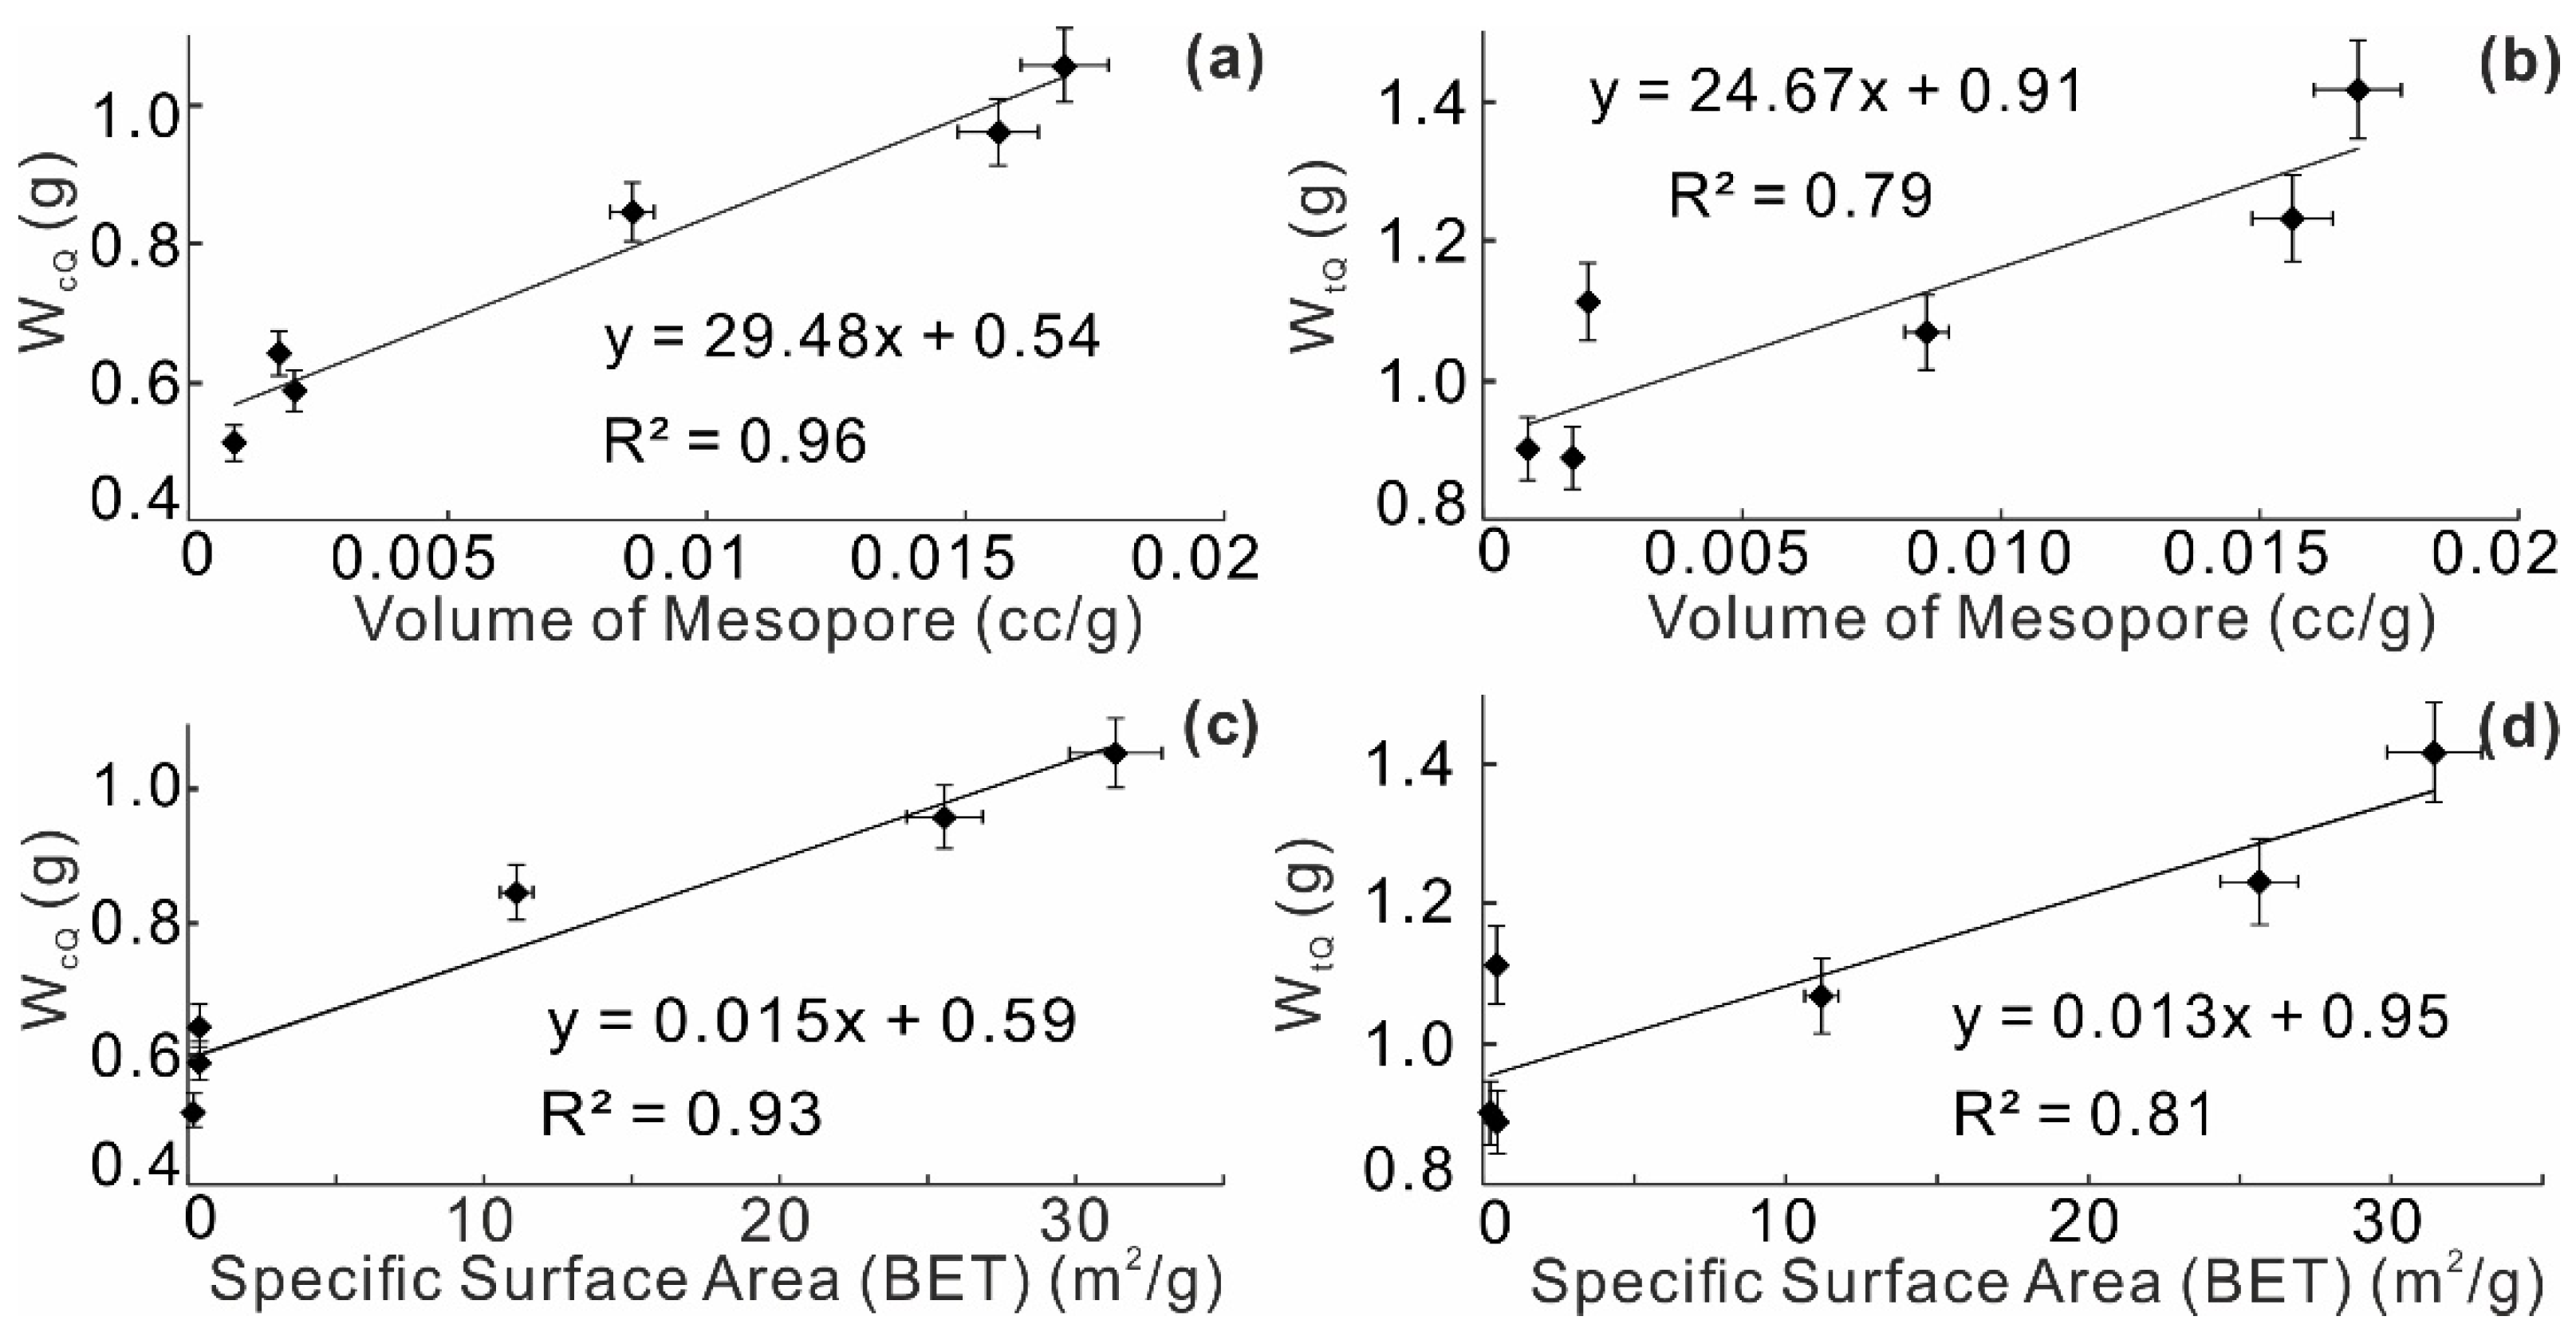
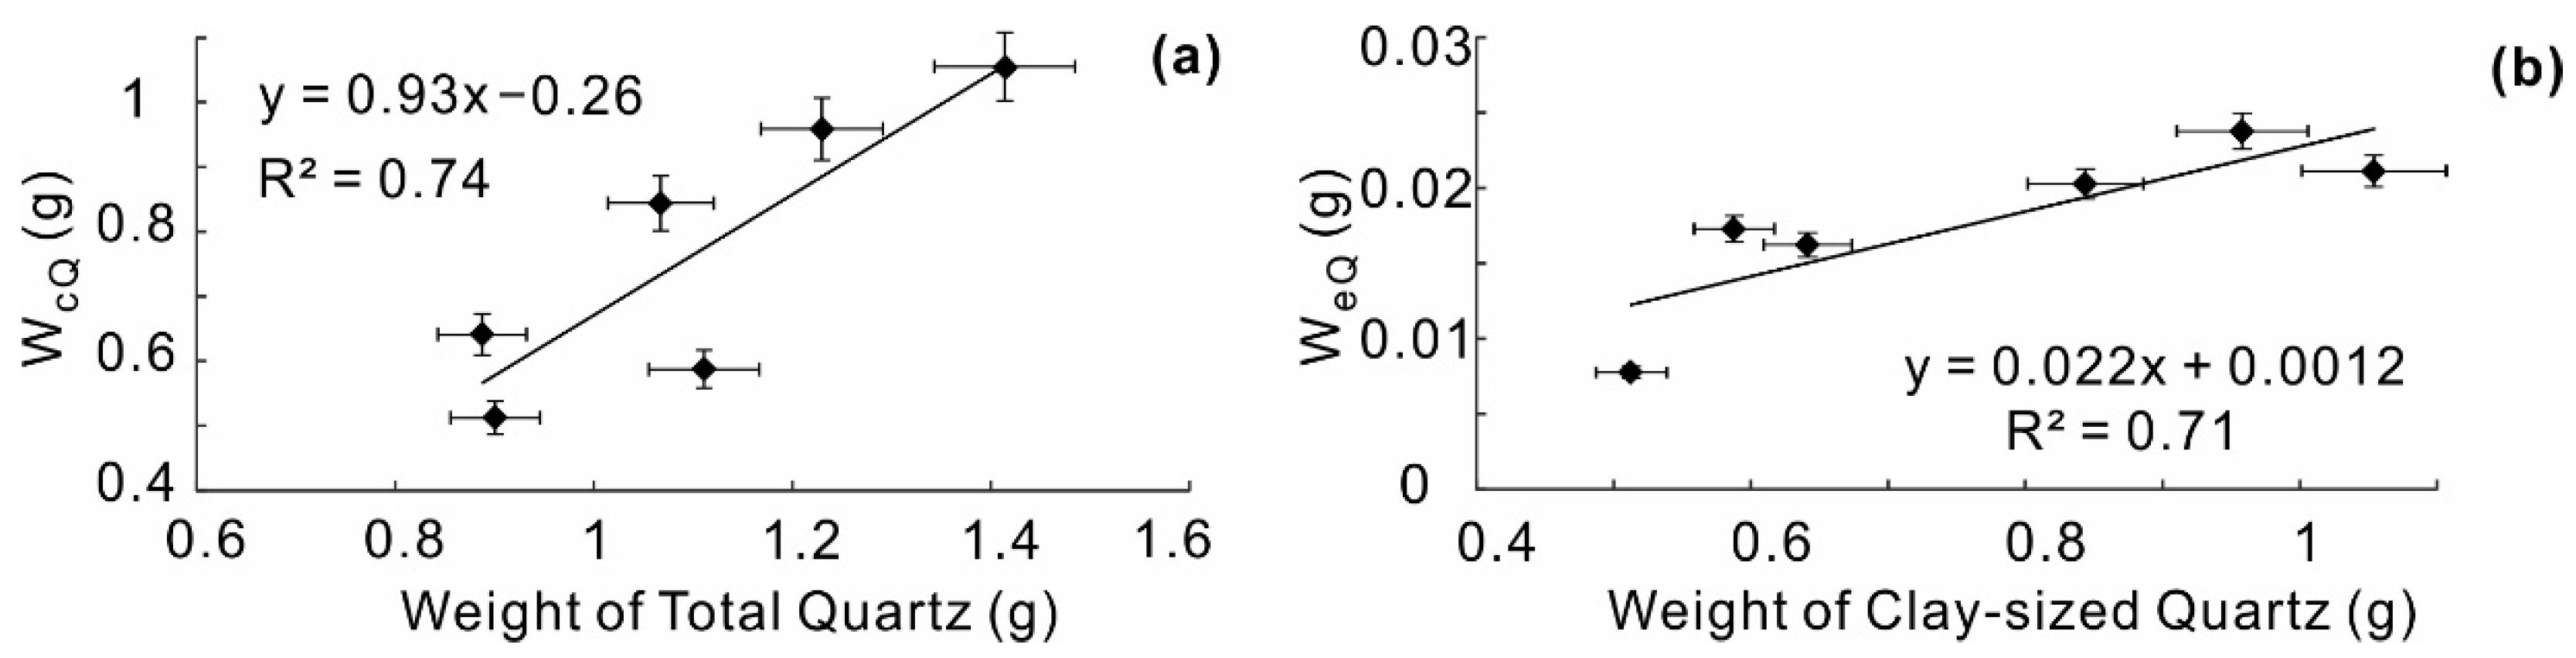
6.2. Influence of Clay-Sized Quartz on Shale Gas Reservoir

Pore evolution during depositional processes and diagenesis is strongly controlled by mineral composition [73]. The same samples were studied by [48], and the mesopore size distribution and the BET specific surface area (based on Brunauer–Emmett–Teller theory for N2-sorption) of the samples were measured. It was concluded that a higher quartz content can contribute to relatively high porosity as the pore space development correlates well with the quartz content [48]. Following the study by [48], the present study found that the porosity development was not only a function of bulk quartz content, but furthermore, of the clay-sized quartz. The evidence was given by the better correlations between the clay-sized quartz weight and pore data (Figure 11):
The correlation between the clay-sized quartz weight and mesopore volume (R2 = 0.96, Figure 11a) was much stronger than that between the total quartz weight and mesopore volume (R2 = 0.79, Figure 11b). Furthermore, the BET specific surface area was also better correlated with the clay-sized quartz weight (R2 = 0.93, Figure 11c) than with the total quartz weight (R2 = 0.81, Figure 11d). Additionally, the poor correlations between pore data and detrital quartz/feldspar weight (not shown here), and the clay-sized quartz being the most abundant phase (except N-3, Table 3, Table 4 and Table 5) both suggest that clay-sized quartz may play the most important role in mesopore development compared to other types of quartz or feldspar. However, it remains to be explored whether clay-sized quartz in organic matter or clay-sized quartz in mineral plays a more essential role.
The rigid matrix minerals and siliceous matrix framework can limit the compaction of pores and significantly favor the development of mesopores [74,75]. The clay-sized quartz in the Niutitang Fm shales may play the same role and contribute to the preservation of mesopores. Moreover, the enrichment of brittle minerals such as quartz and feldspar benefits the fracture tendency of shales [76]. Although mesopores for gas storage are less developed in the Niutigang Fm than, e.g., in the Longmaxi Fm, from which most shale gas in China is produced [77], the Niutitang Fm shales may benefit from the high clay-sized quartz content for hydraulic fracturing behavior, pore connectivity, and resulting shale gas storage and production potential.

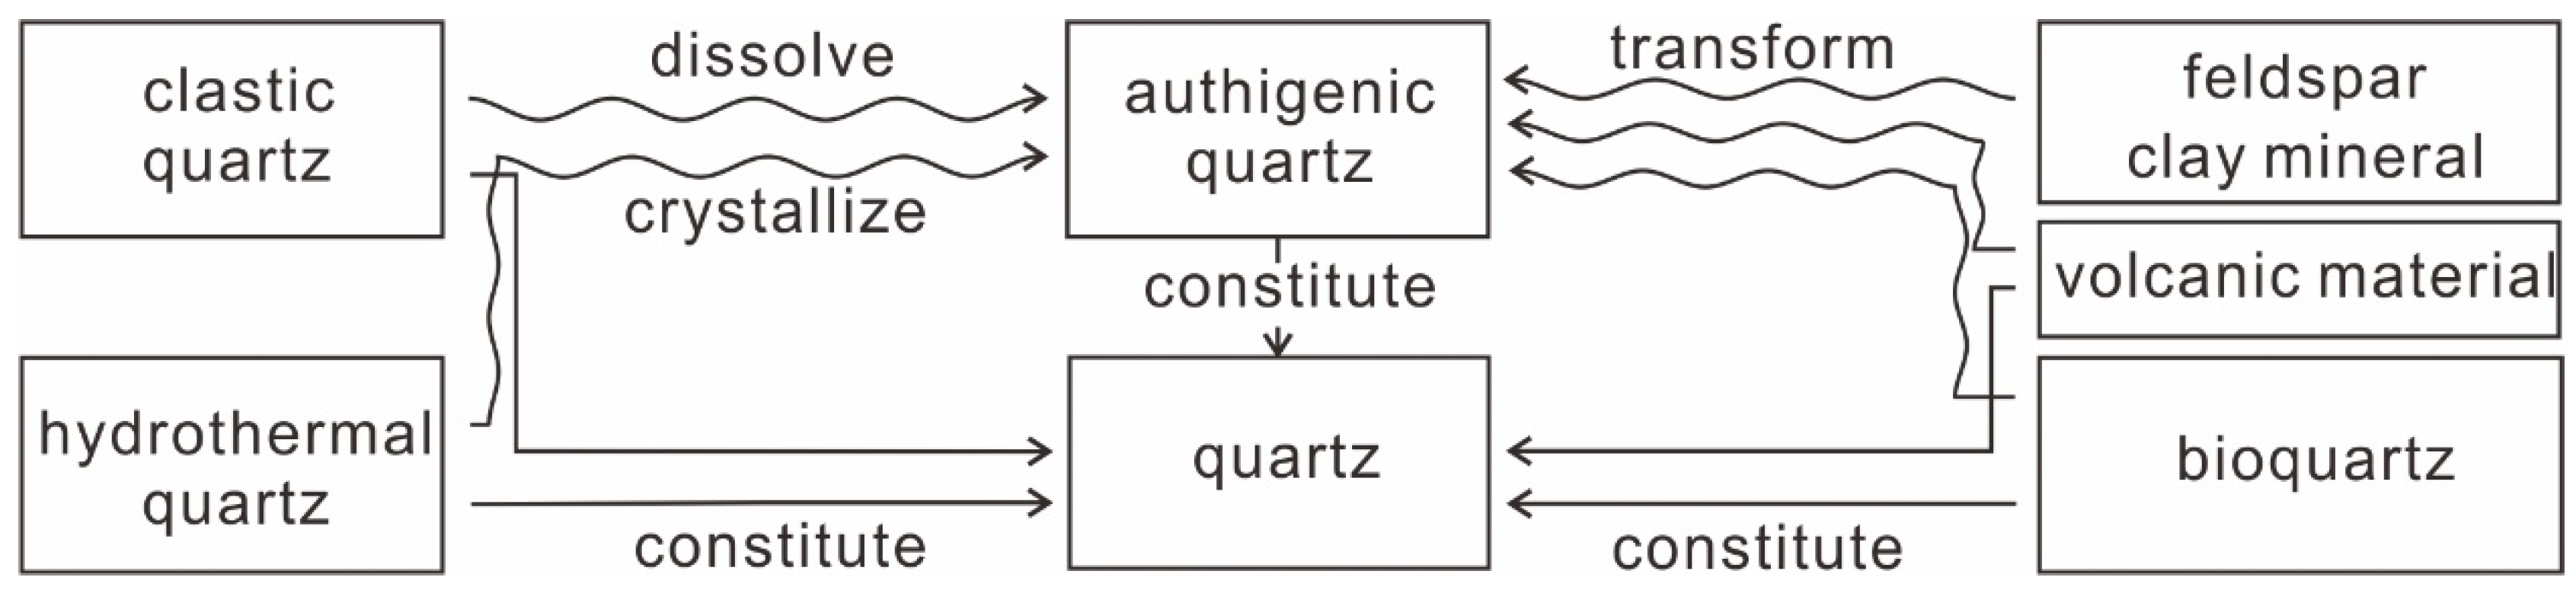
6.3. Origin of Clay-Sized Quartz

The origin of the clay-sized quartz is complex as mentioned in the Section 4.3, and was investigated by comparing clay-sized quartz weight with the weights of other components, e.g., detrital quartz and feldspar, clay minerals and “elongated” quartz. These parameters were obtained with various measurements, or the same measurements but based on different information (e.g., different image processing areas for detrital quartz and “elongated” quartz). Although one parameter was derived from another, new data were involved in the process (e.g., weight of detrital quartz and weight of clay-sized quartz). Thus these parameters are comparable.
Overall, the clay-sized quartz weight increases with increasing total quartz content (R2 = 0.74, Figure 12a). There is also a good positive correlation between “elongated” quartz and clay-sized quartz (R2 = 0.71, Figure 12b). Nevertheless, the origin of the clay-sized quartz remains unclear and probably includes several (detrital, authigenic and biogenic) sources. In addition, authigenic quartz formed from clay transformation, and quartz and feldspar dissolution is common in shales [78,79], and was observed in the studied shales [48]. However, the correlations between clay-sized quartz contents with detrital quartz, detrital feldspar and clay mineral contents were weak and not shown here. Ultimately, the source of clay-sized quartz could be clay transformation, quartz and feldspar dissolution, and biogenic quartz transformation, consistent with [80].

7. Conclusions

  • A workflow was proposed in this paper to calculate the content of clay-sized quartz in gas shales, by using a combination of microscopies, image analysis, and data of TOC content, bulk density, XRD.
  • A refined shale lithofacies classification with seven major categories and nineteen subcategories was conducted. Based on it, three lithofacies of the Niutitang Fm shales were identified.
  • A variety of quartz types in shale were observed and described in detail, including the detrital quartz, vein quartz, “elongated” quartz, needle-like quartz, and spiral-like quartz. Furthermore, the intergrowth of organic matter with oriented minerals was also considered as a type of quartz.
  • The contents of various components, e.g., detrital quartz, clay-sized quartz and detrital feldspar, were semi-quantitatively calculated. Clay-sized quartz may be the main factor affecting mesopore volume and BET specific surface area. It is believed that clay-sized quartz accounts for most of the bulk quartz content in the Niutitang Fm shales and could origin from feldspar and quartz dissolution, clay transformation, and biogenic quartz transformation.

Author Contributions

Conceptualization, S.G. and Y.Z.; methodology, S.G.; software, X.T. and W.B.; validation, D.M. and R.F.S.; formal analysis, S.G.; investigation, S.G.; resources, Y.Z.; data curation, S.G. and Y.Z.; writing—original draft preparation, S.G.; writing—review and editing, S.G., D.M. and R.F.S.; visualization, S.G.; supervision, D.M. and R.F.S.; project administration, Y.Z.; funding acquisition, S.G. and Y.Z. All authors have read and agreed to the published version of the manuscript.

Funding

This research was funded by the Science Research Foundation of Coalbed Methane Resources and Reservoir Formation Process Key Laboratory of the Ministry of Education, China University of Mining and Technology (Grant Number 2020-010, by Sen Guo), The National Natural Science Foundation of China (Grant Number 42172156, by Yang Wang), The Fundamental Research Funds for the Central Universities (grant number 2022YCPY0201, by Yang Wang), and scholarship of the China Scholarship Council (grant number 202006420093, by Sen Guo). The APC was funded by David Misch.

Data Availability Statement

Not applicable.

Acknowledgments

We acknowledge Li Zhuangfu (China University of Mining and Technology, CUMT, Xuzhou, China) for the discussion of the origin of vein quartz, and acknowledge Wen Mingzhong for the SEM operation. Many thanks to Brenda Kerr for her assistance.

Conflicts of Interest

The authors declare no conflict of interest. The funders had no role in the design of the study, in the collection, analyses, or interpretation of data, in the writing of the manuscript, or in the decision to publish the results.

References

  1. Curtis, J.B. Fractured Shale-Gas Systems. AAPG Bull. 2002, 86, 1921–1938. [Google Scholar]
  2. EIA U.S. Natural Gas Gross Withdrawals from Shale Gas (Million Cubic Feet). Available online: https://www.eia.gov/dnav/ng/hist/ngm_epg0_fgs_nus_mmcfa.htm (accessed on 6 June 2022).
  3. Yu, H.; Liu, Q.; Yu, G. Analysis on the Strategic Target of Net Zero Carbon Emission of European Oil and Gas Companies in 2050. Int. Pet. Econ. 2020, 28, 31–36. [Google Scholar]
  4. Ma, Y.; Cai, X.; Zhao, P. China’s Shale Gas Exploration and Development: Understanding and Practice. Pet. Explor. Dev. 2018, 45, 561–574. [Google Scholar] [CrossRef]
  5. Zou, C.; Dong, D.; Yang, H.; Wang, Y.; Huang, J.; Wang, S.; Fu, C. Conditions of Shale Gas Accumulation and Exploration Practices in China. Nat. Gas Ind. 2011, 31, 26–39. [Google Scholar]
  6. Zou, C.; Dong, D.; Wang, S.; Li, J.; Li, X.; Wang, Y.; Li, D.; Cheng, K. Geological Characteristics and Resource Potential of Shale Gas in China. Pet. Explor. Dev. 2010, 37, 641–653. [Google Scholar]
  7. Misch, D.; Riedl, F.; Liu, B.; Horsfield, B.; Ziegs, V.; Mendez-Martin, F.; Vranjes-Wessely, S.; Sachsenhofer, R.F. Petrographic and Sorption-Based Characterization of Bituminous Organic Matter in the Mandal Formation, Central Graben (Norway). Int. J. Coal Geol. 2019, 211, 103229. [Google Scholar] [CrossRef]
  8. Misch, D.; Gross, D.; Hawranek, G.; Horsfield, B.; Klaver, J.; Mendez-Martin, F.; Urai, J.L.; Vranjes-Wessely, S.; Sachsenhofer, R.F.; Schmatz, J.; et al. Solid Bitumen in Shales: Petrographic Characteristics and Implications for Reservoir Characterization. Int. J. Coal Geol. 2019, 205, 14–31. [Google Scholar] [CrossRef]
  9. Misch, D.; Klaver, J.; Gross, D.; Mayer-Kiener, V.; Mendez-Martin, F.; Schmatz, J.; Sachsenhofer, R.F. Factors Controlling Shale Microstructure and Porosity: A Case Study on Upper Visean Rudov Beds from the Ukrainian Dneiper–Donets Basin. AAPG Bull. 2018, 102, 2629–2654. [Google Scholar] [CrossRef]
  10. Zhang, P.; Misch, D.; Meng, Q.; Bechtel, A.; Sachsenhofer, R.F.; Liu, Z.; Gao, F.; Hu, F.; Zhang, S.; Tang, B. Comprehensive Thermal Maturity Assessment in Shales: A Case Study on the Upper Cretaceous Qingshankou Formation (Songliao Basin, NE China). Int. J. Earth Sci. 2021, 110, 943–962. [Google Scholar] [CrossRef]
  11. Dowey, P.J.; Taylor, K.G. Diagenetic Mineral Development within the Upper Jurassic Haynesville-Bossier Shale, USA. Sedimentology 2020, 67, 47–77. [Google Scholar] [CrossRef]
  12. Cai, Q.; Hu, M.; Zhang, B.; Ngia, N.; Liu, A.; Liao, R.; Kane, O.; Li, H.; Hu, Z.; Deng, Q.; et al. Source of Silica and Its Implications for Organic Matter Enrichment in the Upper Ordovician-Lower Silurian Black Shale in Western Hubei Province, China: Insights from Geochemical and Petrological Analysis. Pet. Sci. 2022, 19, 74–90. [Google Scholar] [CrossRef]
  13. Loucks, R.G.; Reed, R.M.; Ruppel, S.C.; Hammes, U. Spectrum of Pore Types and Networks in Mudrocks and a Descriptive Classification for Matrix-Related Mudrock Pores. AAPG Bull. 2012, 96, 1071–1098. [Google Scholar] [CrossRef]
  14. Milliken, K.L.; McCarty, D.K.; Derkowski, A. Grain Assemblages and Diagenesis in the Tarl-Dominated Lower Silurian Mudrock Succession of the Western Margin of the East European Craton in Poland and Lithuania. Sediment. Geol. 2018, 374, 115–133. [Google Scholar] [CrossRef]
  15. Misch, D.; Wegerer, E.; Gross, D.; Sachsenhofer, R.F.; Rachetti, A.; Gratzer, R. Mineralogy and Facies Variations of Devonian and Carboniferous Shales in the Ukrainian Dniepr-Donets Basin. Austrian J. Earth Sci. 2018, 111, 15–25. [Google Scholar] [CrossRef]
  16. Chen, S.; Han, Y.; Fu, C.; Zhang, H.; Zhu, Y.; Zuo, Z. Micro and Nano-Size Pores of Clay Minerals in Shale Reservoirs: Implication for the Accumulation of Shale Gas. Sediment. Geol. 2016, 342, 180–190. [Google Scholar] [CrossRef]
  17. Raidla, V.; Kirsimäe, K.; Bityukova, L.; Jõeleht, A.; Shogenova, A.; Sliaupa, S. Lithology and Diagenesis of the Poorly Consolidated Cambrian Siliciclastic Sediments in the Northern Baltic Sedimentary Basin. Geol. Q. 2006, 50, 395–406. [Google Scholar]
  18. Wang, P.; Jiang, Z.; Yin, L.; Chen, L.; Li, Z.; Zhang, C.; Li, T.; Huang, P. Lithofacies Classification and Its Effect on Pore Structure of the Cambrian Marine Shale in the Upper Yangtze Platform, South China: Evidence from FE-SEM and Gas Adsorption Analysis. J. Pet. Sci. Eng. 2017, 156, 307–321. [Google Scholar] [CrossRef]
  19. Dong, C.; Ma, C.; Lin, C.; Sun, X.; Yuan, M. A method of classification of shale set. J. China Univ. Pet. Ed. Nat. Sci. 2015, 39, 1–7. [Google Scholar]
  20. Jiang, Y.; Song, Y.; Qi, L.; Chen, L.; Tao, Y.; Gan, H.; Wu, P.; Ye, Z. Fine Lithofacies of China’s Marine Shale and Its Logging Prediction: A Case Study of the Lower Silurian Longmaxi Marine Shale in Weiyuan Area, Southern Sichuan Basin, China. Earth Sci. Front. 2016, 23, 107–118. [Google Scholar]
  21. Jarvie, D.M.; Hill, R.J.; Ruble, T.E.; Pollastro, R.M. Unconventional Shale-Gas Systems: The Mississippian Barnett Shale of North-Central Texas as One Model for Thermogenic Shale-Gas Assessment. AAPG Bull. 2007, 91, 475–499. [Google Scholar] [CrossRef]
  22. Yao, J.; Sun, H.; Huang, C.; Zhang, L.; Zeng, Q.; Sui, H.; Fan, D. Key Mechanical Problems in the Developmentof Shale Gas Reservoirs. Sci. Sinca 2013, 43, 1527–1547. [Google Scholar]
  23. Misch, D.; Mendez-Martin, F.; Hawranek, G.; Onuk, P.; Gross, D.; Sachsenhofer, R.F. SEM and FIB-SEM Investigations on Potential Gas Shales in the Dniepr-Donets Basin (Ukraine): Pore Space Evolution in Organic Matter during Thermal Maturation. IOP Conf. Ser. Mater. Sci. Eng. 2016, 109, 012010. [Google Scholar] [CrossRef]
  24. Dong, T.; He, S.; Chen, M.; Hou, Y.; Guo, X.; Wei, C.; Han, Y.; Yang, R. Quartz Types and Origins in the Paleozoic Wufeng-Longmaxi Formations, Eastern Sichuan Basin, China: Implications for Porosity Preservation in Shale Reservoirs. Mar. Pet. Geol. 2019, 106, 62–73. [Google Scholar] [CrossRef]
  25. Milliken, K.L. SEM-Based Cathodoluminescence Imaging for Discriminating Quartz Types in Mudrocks. In Proceedings of the Unconventional Resources Technology Conference, Society of Exploration Geophysicists, American Association of Petroleum Geologists, Denver, CO, USA, 14 August 2013; Society of Petroleum Engineers: Richardson, TX, USA, 2013; pp. 2286–2294. [Google Scholar]
  26. Guo, X.; Hu, D.; Huang, R.; Wei, Z.; Duan, J.; Wei, X.; Fan, X.; Miu, Z. Deep and Ultra-Deep Natural Gas Exploration in the Sichuan Basin: Progress and Prospect. Nat. Gas Ind. 2020, 40, 419–432. [Google Scholar] [CrossRef]
  27. Hu, Z.; Du, W.; Peng, Y.; Zhao, J. Shale Micro-Pore Characteristics and Source-Reservoir Relationship: Taking Wufeng Formation-Longmaxi Formation in Southeast Sichuan as an Example. Oil Gas Geol. 2015, 36, 1001–1008. [Google Scholar]
  28. Milliken, K.L.; Ergene, S.M.; Ozkan, A. Quartz Types, Authigenic and Detrital, in the Upper Cretaceous Eagle Ford Formation, South Texas, USA. Sediment. Geol. 2016, 339, 273–288. [Google Scholar] [CrossRef]
  29. Xu, H.; Zhou, W.; Hu, Q.; Yi, T.; Ke, J.; Zhao, A.; Lei, Z.; Yu, Y. Quartz Types, Silica Sources and Their Implications for Porosity Evolution and Rock Mechanics in the Paleozoic Longmaxi Formation Shale, Sichuan Basin. Mar. Pet. Geol. 2021, 128, 105036. [Google Scholar] [CrossRef]
  30. Liu, Y.; Wang, K.; Hu, P.; Li, W. A Discussion on Measuring Methods of Shale Mineral Components. Nat. Gas Geosci. 2015, 26, 1737–1743. [Google Scholar]
  31. Guo, S.; Misch, D.; Zhu, Y. A Semi-Quantitative Method to Quantify Clay-Sized Quartz in Gas Shale; European Association of Geoscientists & Engineers: Bunnik, The Netherlands, 2022; Volume 2022, pp. 1–5. [Google Scholar]
  32. Li, Z.; Bogdanova, S.V.; Collins, A.S.; Davidson, A.; De Waele, B.; Ernst, R.E.; Fitzsimons, I.C.W.; Fuck, R.A.; Gladkochub, D.P.; Jacobs, J.; et al. Assembly, Configuration, and Break-up History of Rodinia: A Synthesis. Precambrian Res. 2008, 160, 179–210. [Google Scholar] [CrossRef]
  33. Meert, J.G.; Van Der Voo, R. The Assembly of Gondwana 800–550 Ma. J. Geodyn. 1997, 23, 223–235. [Google Scholar] [CrossRef]
  34. Hoffman, P.F.; Kaufman, A.J.; Halverson, G.P.; Schrag, D.P. A Neoproterozoic Snowball Earth. Science 1998, 281, 1342–1346. [Google Scholar] [CrossRef] [PubMed]
  35. Vail, P.R.; Mitchum, R.M.; Thompson, S. Seismic Stratigraphy and Global Changes of Sea Level, Part 4: Global Cycles of Relative Changes of Sea Level. In Seismic Stratigraphy-Applications to Hydrocarbon Exploration; American Association of Petroleum Geologists: Tulsa, OK, USA, 1977; pp. 63–81. [Google Scholar]
  36. Woodcock, N.H. The Cambrian and Earliest Ordovician Quiescent Margin of Gondwana. In Geological History of Britain and Ireland; Woodcock, N.H., Strachan, R.A., Eds.; John Wiley and Sons: New York, NY, USA, 2012; pp. 150–161. [Google Scholar]
  37. Mángano, M.G.; Buatois, L.A. The Cambrian Explosion. In The Trace-Fossil Record of Major Evolutionary Events: Volume 1: Precambrian and Paleozoic; Mángano, M.G., Buatois, L.A., Eds.; Topics in Geobiology; Springer Netherlands: Dordrecht, The Netherlands, 2016; pp. 73–126. [Google Scholar]
  38. Shu, D. Cambrian Explosion: Birth of Tree of Animals. Gondwana Res. 2008, 14, 219–240. [Google Scholar] [CrossRef]
  39. Torsvik, T.H.; Cocks, L.R.M. Cambrian. In Earth History and Palaeogeography; Cambridge University Press: Cambridge, UK, 2016; pp. 85–100. [Google Scholar]
  40. Huang, B.; Zhu, R.; Otofuji, Y.; Yang, Z. The Early Paleozoic Paleogeography of the North China Block and the Other Major Blocks of China. Chin. Sci. Bull. 2000, 45, 1057–1065. [Google Scholar] [CrossRef]
  41. Guan, S.; Zhang, C.; Ren, R.; Zhang, S.; Wu, L.; Wang, L.; Ma, P.; Han, C. Early Cambrian Syndepositional Structure of the Northern Tarim Basin and a Discussion of Cambrian Subsalt and Deep Exploration. Pet. Explor. Dev. 2019, 46, 1141–1152. [Google Scholar] [CrossRef]
  42. Shi, C.; Cao, J.; Han, S.; Hu, K.; Bian, L.; Yao, S. A Review of Polymetallic Mineralization in Lower Cambrian Black Shales in South China: Combined Effects of Seawater, Hydrothermal Fluids, and Biological Activity. Palaeogeogr. Palaeoclimatol. Palaeoecol. 2021, 561, 110073. [Google Scholar] [CrossRef]
  43. Zhang, S.; Gao, Z.; Li, J.; Zhang, B.; Gu, Q.; Lu, Y. Identification and Distribution of Marine Hydrocarbon Source Rocks in the Ordovician and Cambrian of the Tarim Basin. Pet. Explor. Dev. 2012, 39, 305–314. [Google Scholar] [CrossRef]
  44. Zhu, G.; Chen, F.; Wang, M.; Zhang, Z.; Ren, R.; Wu, L. Discovery of the Lower Cambrian High-Quality Source Rocks and Deep Oil and Gas Exploration Potential in the Tarim Basin, China. AAPG Bull. 2018, 102, 2123–2151. [Google Scholar] [CrossRef]
  45. Wu, K.; Zhang, T.; Yang, Y.; Sun, Y.; Yuan, D. Contribution of Oxygenic Photosynthesis to Palaeo-Oceanic Organic Carbon Sink Fluxes in Early Cambrian Upper Yangtze Shallow Sea: Evidence from Black Shale Record. J. Earth Sci. 2016, 27, 211–224. [Google Scholar] [CrossRef]
  46. Han, S.; Wang, S. An Approach on Stages of Oil Generation and Evolution of Lower Paleozoic in the Eastern part of South Guizhou. Exp. Pet. Geol. 1983, 5, 1–8. [Google Scholar]
  47. Chen, F.; Ding, X.; Lu, S.; He, X.; Xing, H. Gas Generation Characteristics of the Lower Cambrian Niutitang Shale in Qiannan Depression, China. Pet. Sci. Technol. 2017, 35, 1209–1216. [Google Scholar] [CrossRef]
  48. Guo, S.; Zhu, Y.; Liu, Y.; Tang, X. Characteristics and Controlling Factors of Nanopores of the Niutitang Formation Shale from Jiumen Outcrop, Guizhou Province. J. Nanosci. Nanotechnol. 2021, 21, 284–295. [Google Scholar] [CrossRef] [PubMed]
  49. Luo, C.; Liu, S.; Sun, W.; Ran, B.; Yong, Z.; Yang, D.; Zhang, X.; Wang, S.; Ye, Y.; Deng, B. Basic Characteristics of Shale Gas in the Lower Cambrian Niutitang Formation in the Upper Yangtze Region: Taking Nangao Section in Danzhai as an Example. Nat. Gas Geosci. 2014, 25, 453–470. [Google Scholar]
  50. Tian, H.; Pan, L.; Zhang, T.; Xiao, X.; Meng, Z.; Huang, B. Pore Characterization of Organic-Rich Lower Cambrian Shales in Qiannan Depression of Guizhou Province, Southwestern China. Mar. Pet. Geol. 2015, 62, 28–43. [Google Scholar] [CrossRef]
  51. Liu, Z.; Zhuang, X.; Teng, G.E.; Xie, X.; Yin, L.; Bian, L.; Feng, Q.; Algeo, T. The Lower Cambrian Niutitang Formation at Yangtiao (Guizhou, SW China): Organic Matter Enrichment, Source Rock Potential, and Hydrothermal Influences. J. Pet. Geol. 2015, 38, 411–432. [Google Scholar] [CrossRef]
  52. Klaver, J.; Desbois, G.; Urai, J.L.; Littke, R. BIB-SEM Study of the Pore Space Morphology in Early Mature Posidonia Shale from the Hils Area, Germany. Int. J. Coal Geol. 2012, 103, 12–25. [Google Scholar] [CrossRef]
  53. Wang, Y.; Wang, S.; Dong, D.; Li, X.; Huang, J.; Zhang, C.; Guan, Q. Lithofacies Characterization of Longmaxi Formation of the Lower Silurian, Southern Sichuan. Earth Sci. Front. 2016, 23, 119–223. [Google Scholar]
  54. Lu, L.; Xu, W. Endogenetic Sedimentary Rock. In Petrology; Li, K., Ed.; Geological Publishing House: Beijing, China, 2011; pp. 204–216. [Google Scholar]
  55. Loucks, R.G.; Reed, R.M.; Ruppel, S.C.; Jarvie, D.M. Morphology, Genesis, and Distribution of Nanometer-Scale Pores in Siliceous Mudstones of the Mississippian Barnett Shale. J. Sediment. Res. 2009, 79, 848–861. [Google Scholar] [CrossRef]
  56. Peng, J.; Milliken, K.L.; Fu, Q. Quartz Types in the Upper Pennsylvanian Organic-Rich Cline Shale (Wolfcamp D), Midland Basin, Texas: Implications for Silica Diagenesis, Porosity Evolution and Rock Mechanical Properties. Sedimentology 2020, 67, 2040–2064. [Google Scholar] [CrossRef]
  57. Yue, L.; Kang, Y.; Chen, Q.; Shang, Y.; She, Z.; Chen, L. Analysis of Shale Gas Potential of Niutitang Formation of Lower Cambrian in Guizhou, China. Xinjiang Pet. Geol. 2013, 34, 123–128. [Google Scholar]
  58. Williams, L.A.; Crerar, D.A. Silica Diagenesis; II, General Mechanisms. J. Sediment. Res. 1985, 55, 312–321. [Google Scholar]
  59. de Melo, M.S.; Guimarães, G.B.; Chinelatto, A.L.; Giannini, P.C.F.; Pontes, H.S.; Chinelatto, A.S.A.; Atencio, D. Kaolinite, Illite and Quartz Dissolution in the Karstification of Paleozoic Sandstones of the Furnas Formation, Paraná Basin, Southern Brazil. J. South Am. Earth Sci. 2015, 63, 20–35. [Google Scholar] [CrossRef]
  60. Harris, N.B. Burial Diagenesis of Brent Sandstones: A Study of Statfjord, Hutton and Lyell Fields. Geol. Soc. Lond. Spec. Publ. 1992, 61, 351–375. [Google Scholar] [CrossRef]
  61. Bloch, J.; Hutcheon, I.E. Shale Diagenesis: A Case Study from the Albian Harmon Member (Peace River Formation), Western Canada. Clays Clay Miner. 1992, 40, 682–699. [Google Scholar] [CrossRef]
  62. Milliken, K.L.; Choh, S.J.; Papazis, P.; Schieber, J. “Cherty” Stringers in the Barnett Shale Are Agglutinated Foraminifera. Sediment. Geol. 2007, 198, 221–232. [Google Scholar] [CrossRef]
  63. van de Kamp, P.C. Smectite-Illite-Muscovite Transformations, Quartz Dissolution, and Silica Release in Shales. Clays Clay Miner. 2008, 56, 66–81. [Google Scholar] [CrossRef]
  64. Zhao, J.; Jin, Z.; Jin, Z.; Wen, X.; Geng, Y.; Yan, C. The Genesis of Quartz in Wufeng-Longmaxi Gas Shales, Sichuan Basin. Nat. Gas Geosci. 2016, 27, 377–386. [Google Scholar]
  65. Loucks, R.G.; Ruppel, S.C. Mississippian Barnett Shale: Lithofacies and Depositional Setting of a Deep-Water Shale-Gas Succession in the Fort Worth Basin, Texas. AAPG Bull. 2007, 91, 579–601. [Google Scholar] [CrossRef]
  66. Zhang, K.; Feng, Q. Early Cambrian Radiolarians and Sponge Spicules from the Niujiaohe Formation in South China. Palaeoworld 2019, 28, 234–242. [Google Scholar] [CrossRef]
  67. Hendry, J.P.; Trewin, N.H. Authigenic Quartz Microfabrics in Cretaceous Turbidites; Evidence for Silica Transformation Processes in Sandstones. J. Sediment. Res. 1995, 65, 380–392. [Google Scholar]
  68. Köhn, D. Kinematics of Fibrous Aggregates. Ph.D. Thesis, Johannes Gutenberg-Universität Mainz, Mainz, Germany, 2000. [Google Scholar]
  69. Schieber, J.; Krinsley, D.; Riciputi, L. Diagenetic Origin of Quartz Silt in Mudstones and Implications for Silica Cycling. Nature 2000, 406, 981–985. [Google Scholar] [CrossRef]
  70. Li, S.; Xu, H.; Shen, J.; Li, G. Oxide and Hydroxide Minerals Main Category. In Crystallography and Mineralogy; Wang, P., Chen, L., Eds.; Geological Publishing House: Beijing, China, 2008; pp. 180–201. [Google Scholar]
  71. Chen, J.; Shao, Z.; Qin, Y. Sedimentary Organic Matter Composition. In Energy Geology; Song, D., Ed.; China University of Mining and Technology Press: Xuzhou, China, 2004; pp. 31–85. [Google Scholar]
  72. Tribovillard, N.; Algeo, T.J.; Lyons, T.; Riboulleau, A. Trace Metals as Paleoredox and Paleoproductivity Proxies: An Update. Chem. Geol. 2006, 21, 12–32. [Google Scholar] [CrossRef]
  73. Nie, H.; He, Z.; Liu, G.; Du, W.; Wang, R.; Zhang, G. Genetic Mechanism of High-Quality Shale Gas Reservoirs in the Wufeng–LongmaxiFms in the Sichuan Basin. Nat. Gas Ind. B 2021, 8, 24–34. [Google Scholar] [CrossRef]
  74. Knapp, L.J.; Ardakani, O.H.; Uchida, S.; Nanjo, T.; Otomo, C.; Hattori, T. The Influence of Rigid Matrix Minerals on Organic Porosity and Pore Size in Shale Reservoirs: Upper Devonian Duvernay Formation, Alberta, Canada. Int. J. Coal Geol. 2020, 227, 103525. [Google Scholar] [CrossRef]
  75. Wu, L.; Lu, Y.; Jiang, S.; Lu, Y.; Liu, X.; Hu, H. Pore Structure Characterization of Different Lithofacies in Marine Shale: A Case Study of the Upper Ordovician Wufeng-Lower Silurian Longmaxi Formation in the Sichuan Basin, SW China. J. Nat. Gas Sci. Eng. 2018, 57, 203–215. [Google Scholar] [CrossRef]
  76. Rybacki, E.; Reinicke, A.; Meier, T.; Makasi, M.; Dresen, G. What Controls the Mechanical Properties of Shale Rocks—Part I: Strength and Young’s Modulus. J. Pet. Sci. Eng. 2015, 135, 702–722. [Google Scholar] [CrossRef]
  77. Chen, S.; Qin, Y.; Wang, Y.; Zhang, H.; Zuo, Z. Pore Structure and Heterogeneity of Marine Shales in the Middle-Upper Yangtze. Nat. Gas Geosci. 2015, 26, 1455–1463. [Google Scholar]
  78. Metwally, Y.M.; Chesnokov, E.M. Clay Mineral Transformation as a Major Source for Authigenic Quartz in Thermo-Mature Gas Shale. Appl. Clay Sci. 2012, 55, 138–150. [Google Scholar] [CrossRef]
  79. Zhu, H.; Ju, Y.; Yang, M.; Huang, C.; Feng, H.; Qiao, P.; Ma, C.; Su, X.; Lu, Y.; Shi, E.; et al. Grain-Scale Petrographic Evidence for Distinguishing Detrital and Authigenic Quartz in Shale: How Much of a Role Do They Play for Reservoir Property and Mechanical Characteristic? Energy 2022, 239, 122176. [Google Scholar] [CrossRef]
  80. Liu, J.; Ding, W.; Wang, R.; Wu, Z.; Gong, D.; Wang, X.; Yin, S.; Jiao, B. Quartz Types in Shale and Their Effect on Geomechanical Properties: An Example from the Lower Cambrian Niutitang Formation in the Cen’gong Block, South China. Appl. Clay Sci. 2018, 163, 100–107. [Google Scholar] [CrossRef]
Figure 1. Outcrop position and lithology, modified after [31].
Minerals 12 01027 g001
Figure 2. Scheme of shale lithofacies (modified after [53]) and the plotted results of studied samples. Ⅰ siliceous rock, Ⅱ claystone, Ⅲ carbonate rock/dolostone, Ⅳ siliceous shale, Ⅴ argillaceous shale, Ⅵ calcareous shale, Ⅶ mixed shale. ① siliceous rock, ② claystone, ③ carbonate rock/dolostone, ④ feldspar/quartz siliceous shale, ⑤ argillaceous shale, ⑥ calcareous shale, ⑦ calcareous feldspar/quartz siliceous shale, ⑧ argillaceous feldspar/quartz siliceous shale, ⑨ siliceous argillaceous shale, ⑩ calcareous argillaceous shale, ⑪ argillaceous calcareous shale, ⑫ siliceous calcareous shale, ⑬ argillaceous-siliceous mixed shale, ⑭ siliceous-argillaceous mixed shale, ⑮ calcareous-argillaceous mixed shale, ⑯ argillaceous-calcareous mixed shale, ⑰ siliceous-calcareous mixed shale, ⑱ calcareous-siliceous mixed shale, ⑲ mixed shale.
Minerals 12 01027 g002
Figure 3. Quartz main composition and transformation relationships in shale.
Minerals 12 01027 g003
Figure 4. Flowchart of grain classification, modified after [31].
Minerals 12 01027 g004
Figure 5. Calculation process of weight of clay-sized quartz in 1 cm3, modified after [31]. ρS, ρQ: shale density, quartz density (g/cm3); WS: weight of 1 cm³ of shale (g); WOM: weight of organic matter (g); CANT: carbon content of anthracite (%); WMM: weight of mineral matter (g); QXRD: quartz content from XRD (%); WtQ: weight of total quartz in bulk shale (g); WdQ: weight of detrital quartz (g); VRdQ: volume ratio of detrital quartz (%); WndQ: weight of non-detrital quartz (g); VRndQ: volume ratio of non-detrital quartz (%); WcQ: weight of clay-sized quartz (g).
Minerals 12 01027 g005
Figure 6. Thin section photographs of shale samples (with the exception of (b,i), all photos with crossed polarizers). (a) Sample N-5 containing high amounts of detrital quartz and feldspar. Lamination is not developed; (b) N-3 showing oriented mica; (c) spiral-like quartz, N-3; (df) siliceous sponge spicules, all from N-3; (g) polycrystalline quartz, N-6 (h) microcline, N-4; (i) replacement of large scale quartz by pyrite, N-2. Q: quartz.
Minerals 12 01027 g006
Figure 7. Reflected light microphotographs. (a,b) Vein quartz and elongated solid bitumen, both from N-6; (c) pyrites filling fossil cavities, N-3; (d) pyrite framboid, N-3. Py: pyrite; (e) organic matter aggregates with different pore features and size exceeding detrital grains, N-1. OM: organic matter; (f) isolated organic matter with size approaching to detrital grains, N-1.
Minerals 12 01027 g007
Figure 8. Quartz under SEM. (a) Authigenic quartz (N-2, secondary electron image, SE); (b) particle intergrowth of organic matter and orientated mineral (N-1, backscattered scanning electron microscope image, BSD).; (c) elemental composition of the green point in Figure 8b.
Minerals 12 01027 g008
Figure 9. EDX maps (Si, Al, K, and Na) collected from Niutitang samples. (af) EDX maps of N-1, N-2, N-4, N-6, N-3 and N-5, respectively. Yellow outlines in the Si maps mark “elongated” quartz. The scales are 50 μm.
Minerals 12 01027 g009
Figure 10. Area fractions and quantity distributions for detrital quartz and feldspar. (af) Statistical results of N-1, N-2, N-3, N-4, N-5 and N-6, respectively. The frequency is the corresponding result of unifying the measurement area to 100,000 µm2, and the total frequency is rounded.
Minerals 12 01027 g010
Figure 11. Cross-plots of the mesopore volume versus (a) weight of clay-sized quartz (WcQ); (b) weight of total quartz in bulk shale (WtQ). Cross-plots of the specific surface area (BET) versus (c) weight of clay-sized quartz (WcQ); (d) weight of total quartz in bulk shale (WtQ). Pore data from [48]. Error bars show a 5 % variation in each data point.
Minerals 12 01027 g011
Figure 12. Cross-plots of weight of clay-sized quartz (WcQ) versus (a) weight of total quartz in bulk shale (WtQ), (b) weight of “elongated” quartz (WeQ). Note: weight in 1 cm3 shale. Error bars show a 5 % variation in each data point.
Minerals 12 01027 g012
Table 1. Bulk mineralogical, TOC, and bulk density data for the studied sample set [48].
SampleBulk Mineralogical Composition (wt.%). 1TOC
(%). 1
Bulk
Density (g/cm3)
QK-FeldsparPlagioclaseDolomitePyroxeneIlliteKaolinitePyriteBarite
N-171.1104.1 8 6.810.02.24
N-244.46.3 13.5 11.28.110.85.712.7 22.33
N-347.75.64.3 8.527.5 6.4 4.82.46
N-446.26.52.816.97.317 3.39.92.19
N-560.27.9 6.821.2 3.910.02.30
N-650.643.7 27 10.44.38.82.34
1 data from [48]; 2: retested sample from [48].
Table 2. Image processing results of detrital quartz and feldspar.
AR, (%)N-1N-2N-3N-4N-5N-6
dQdFdQ + FdQdFdQ + FdQdFdQ + FdQdFdQ + FdQdFdQ + FdQdFdQ + F
Particle Size Interval, (μm)(4–9)1.61.12.611231.64.62.31.23.51.21.93.11.71.63.3
(9–14)2.92.14.91.71.93.53.32.15.43.52.15.61.71.63.32.51.03.5
(14–19)3.41.24.62.61.84.43.11.44.53.21.54.71.73.55.21.31.73.1
(19–24)1.82.44.21.41.633.12.75.73.50.94.42.22.74.9112.1
(24–29)1.50.421.22.23.43.62.05.61.30.92.11.1121.10.41.5
(29–34)1.70.52.200.40.40.51.41.90.700.71.51.83.4000
(34–39)0000.40.50.92.702.700001.41.4000
(39–44)0000.50.61.1000000000000
dQ/dF/dQ + F12.87.620.58.79.918.619.15.324.314.36.7219.49.6197.75.713.4
(9–24)dQ8.15.79.410.15.64.9
(9–24)dQ–dQ636549716062.9
(9–24)dQ + F13.710.915.614.713.48.7
(9–24)dQ + F-dQ + F67.158.551.67057.764.3
Average dQ + F Size, (μm)11.1121110.2119.4
Standard deviation of dQ + F Size6.57.17.15.76.74.9
RdQ-dF1.70.93.62.10.981.4
Note: the effect of pyroxene has been reduced in ARdF, ARdQ+F and RdQ-dF for N-3 and N-5, with data in Table 5; ARdQ: area ratio of detrital quartz; ARdF: area ratio of detrital feldspar; ARdQ/dF/dQ+F: area ratio of bulk detrital quartz or detrital feldspar or detrital quartz and feldspar; AR(9–24)dQ-dQ: area ratio of detrital quartz in (9–24) to bulk detrital quartz; AR(9–24)dQ+F: area ratio of detrital quartz and feldspar in (9–24); AR(9–24)dQ+F-dQ+F: area ratio of detrital quartz and feldspar in (9–24) to bulk detrital quartz and feldspar; ARdQ+F: area ratio of bulk detrital quartz and feldspar; RdQ-dF: ratio of bulk detrital quartz to bulk detrital feldspar.
Table 3. Image-based quantification of “elongated” quartz (unit: %; on the bulk area).
SampleN-1N-2N-3N-4N-5N-6
Particle Size Interval, (μm)(4, 9)
(9, 14)
(14, 19)0.08 0.29
(19, 24)0.25 0.280.290.330.14
(24, 29) 0.14 0.28
(29, 34) 0.18 0.62
(34, 39)0.46 0.38
(39, 44) 0.3
Table 4. Mineral weight calculated for a unit sample volume of 1 cm3 (see descriptions in the text).
SampleWeight of Mineral Matter in 1 cm3 (g)
QuartzK-FeldsparPlagioclaseFeldsparDolomitePyroxeneClay MineralPyriteBarite
N-11.420.20.080.28000.1600.14
N-20.890.1300.130.2700.390.220.11
N-31.110.130.10.2300.200.640.150
N-40.90.130.050.180.330.140.3300.06
N-51.230.1600.1600.140.4300.08
N-61.070.080.080.16000.570.220.09
Note: all mineral weight fractions are normalized to a unit volume of 1 cm3; weight of individual mineral phase = weight ratio from XRD × total weight of mineral matter calculated from the respective bulk density.
Table 5. Content calculation results for clay-sized, “elongated” quartz and volume ratio of pyroxene (see text descriptions).
ParameterN-1N-2N-3N-4N-5N-6
ρQ, ρF (g/cm3)2.65
TOC (%)1012.74.89.9108.8
WOM (g/cm3)0.250.330.130.240.260.23
WMM (g/cm3)222.3222.1
VRdQ (%)12.98.719.114.39.47.7
WdQ (g/cm3)0.340.230.510.380.250.2
WRdQ-MM (%)17.111.621.719.512.29.7
WRdQ-S (%)15.29.920.617.410.88.7
ρS (g/cm3)2.242.332.462.192.32.34
WRtQ-MM (%)71.144.447.746.260.250.6
WcQ (g/cm3)1.050.640.590.510.960.84
WRcQ-tQ (%)747253577879
WRcQ-S (%)472824234236
WRcQ-MM (%)533225264740
VReQ (%)0.80.610.650.290.90.76
WeQ (g/cm3)0.0210.0160.0170.0080.0240.02
WReQ-tQ (%)1.51.81.60.91.91.9
WReQ-S (%)0.940.690.70.351.030.86
WReQ-MM (%)1.060.810.740.41.160.96
VRP (%)--64.34.2-
Note: all mineral weight fractions were normalized to a unit volume of 1 cm3; quartz density was taken for α quartz [70]; the carbon content of anthracite (CANT) was considered to be 90% [71]; pyroxene density was taken as 3.3 g/cm3;.ρQ, ρF, ρS: quartz density, feldspar density, shale density; WOM: weight of organic matter; WMM: weight of mineral matter; VRdQ: volume ratio of detrital quartz; WdQ: weight of detrital quartz; WRdQ-MM: weight ratio of detrital quartz to the mineral matter; WRdQ-S: weight ratio of detrital quartz to the shale; WRtQ-MM: weight ratio of total quartz to the mineral matter; WtQ: weight of total quartz in bulk shale; WcQ: weight of clay-sized quartz; WRcQ-tQ: weight ratio of clay-sized quartz to the total quartz; WRcQ-S: weight ratio of clay-sized quartz to the shale; WRcQ-MM: weight ratio of clay-sized quartz to the mineral matter; VReQ: volume ratio of “elongated” quartz; WeQ: weight of “elongated” quartz; WReQ-tQ: weight ratio of “elongated” quartz to the total quartz; WReQ-S: weight ratio of “elongated” quartz to the shale; WReQ-MM: weight ratio of “elongated” quartz to the mineral matter; VRP: volume ratio of pyroxene.
Publisher’s Note: MDPI stays neutral with regard to jurisdictional claims in published maps and institutional affiliations.

