Article

The Numerical Simulation and Characterization of Complex Fracture Network Propagation in Multistage Fracturing with Fractal Theory

1
School of Petroleum Engineering, China University of Petroleum (East China), Qingdao 266580, China
2
Key Laboratory of Unconventional Oil & Gas Development, China University of Petroleum (East China), Ministry of Education, Qingdao 266580, China
3
College of Mechanical and Electronic Engineering, China University of Petroleum (East China), Qingdao 266580, China
4
Yanchang Oilfield Co., Ltd., Yan’an 716000, China
*
Author to whom correspondence should be addressed.
Minerals 2022, 12(8), 955; https://doi.org/10.3390/min12080955
Submission received: 7 June 2022 / Revised: 21 July 2022 / Accepted: 26 July 2022 / Published: 28 July 2022
(This article belongs to the Special Issue Fracturing of Coal and Rock Mass)

Abstract

:
To investigate complex fracturing and the influencing factors of simultaneous fracture propagation in horizontal wells, a three-cluster fracture propagation model that is controlled by fracture surface displacement parameters is established. When performing multistage fracturing on reservoirs with a relatively high development degree of natural fractures, staged multicluster fracturing in horizontal wells is one of the commonly used technical methods for volume fracturing. Two frequently encountered problems are multifracture extension and interfracture stress interference between fractures. The characteristics of the coal mechanics parameters of coalbed methane (CBM) blocks in northwestern China are analyzed by probability statistics to obtain the elastic modulus and Poisson’s ratio. With the interactive development environment of the MATLAB-PYTHON-FEM platform, a numerical model of fracture network expansion under the staged fracturing of horizontal wells is constructed. The stress interference level between fractures and the fractal expansion mechanism of fracture networks are analyzed under different influencing factors, including the fractal dimensions of natural joints, fracturing fluid pumping rate, and inhomogeneity coefficient of the in situ stress.

1. Introduction

Hydraulic fracturing technology is an important technique for the production of oil and gas wells. The successful development of unconventional resources in North America has shown that increasing the reservoir volume can significantly enhance oil and gas production. However, the creation of a complex fracture network is closely related to natural fractures, in situ stress, reservoir geomechanical properties, and even treatment parameters. Thus, the adequate characterization of the complex hydraulic network is challenging in multistage horizontal fracturing design.
On fracture propagation in naturally fractured reservoirs, many experts in the field of reservoir reformation have performed considerable research work. One key problem is to determine the interaction mechanism between hydraulic fractures and natural fractures. Blanton [1] studied the interaction mechanism between hydraulic fractures and natural fractures through hydraulic fracturing tests in which fluid loss was not considered. Blanton further found that the maximum and minimum horizontal principal stress difference and the fracture approach angle are the main factors that determine the criteria for the scenarios of hydraulic fractures after encountering natural fractures. When hydraulic fractures encounter natural fractures, there are three scenarios: opening, passing through, and capturing. Warpinski and Teufel [2] posited that when hydraulic fractures intersect with natural fractures, hydraulic fracture slip and penetration behaviors occur. Olson et al. [3,4,5] proposed a fracture network model for predicting the propagation of hydraulic fractures. Although the model considers the interaction between hydraulic fractures and natural fractures, the flow of fracturing fluid and the migration of proppants could not be simulated. Zhang et al. [6] also established a model for simulating complex fracture network propagation. In addition, they applied a determined fracture crossing criterion in the simulation. Most previous studies used predetermined analytical models to justify the hydraulic fracture path when a hydraulic fracture interacts with a natural fracture. Moreover, only the in situ stress and approach angle between hydraulic fractures and natural fractures were considered. Natural fractures were generally assumed to be frictional interfaces without conductivity. However, these models may fail to satisfy hydraulic fracture crossing criteria when natural fracture properties should be taken into account.
Compared to triaxial fracturing experiments, numerical simulation is a convenient and time-saving method in complex fracture propagation studies in multistage horizontal wells. In recent years, the discrete element method (DEM), the extended finite element method (XFEM), and the boundary element method (BEM) have been used. Olson et al. [4] studied the mechanical mechanism of fracture propagation by the displacement discontinuity method. A study by Cipolla et al. [7] showed that it was necessary to properly control the number of perforation clusters when the conductivity of the main fracture reached a threshold level. Increasing or decreasing the cluster spacing had little effect on the final stimulation result. Peirce et al. [8] and Gordeliy et al. [9] established a new fully coupled, parallel plane three-dimensional hydraulic fracture model that considers the interfracture stress interference and studied the propagation process of multiple perforated hydraulic fractures in a single fracturing section. When the perforation clusters were uniformly arranged, the model confirmed the occurrence of stress shadowing, which would hinder the extension of internal fractures and would cause the fracture extension to be focused mainly on the lateral fractures. However, in the case of uneven placement of the perforation clusters, the negative effects of interfracture stress interference were significantly improved, and the fracture extension was more uniform. Kresse et al. [10,11] proposed a method for calculating the stress shadow in a complex hydraulic fracture network based on an enhanced plane unconventional fracture model, which corrects the finite fracture height. The method can approximately calculate the interaction between different fracture branches in a complex fracture network. The calculation results showed that due to the influence of stress shadows, the length and width of internal fractures in multiple parallel fractures might be reduced, and the size of the anisotropy of the formation would affect the interaction between fractures. Morrill and Miskimins [12] studied the stress field at the tip of a hydraulic fracture in a numerical model, predicted the development form of the hydraulic fracture and the conductivity of tight sandstone, and determined the optimal perforation spacing that could eliminate the interaction of the stress field. Neal et al. [13] conducted a numerical simulation study on the interfracture stress interference in shale formations and proposed that the fracture spacing, shale mechanical properties, and ratio of the horizontal principal stress all had an impact on the inner fracture stress interference. Based on the composite analysis method of fracture mechanics and the energy balance principle, Yan and Li [14] built a fracturing optimization design model that considers an induced fracture network with stress interference. The mechanism of fracture propagation mechanics and the variable-density proppant migration rule of interfracture stress interference for staged fracturing of horizontal wells were studied. The reliability of the model and software were verified by comparison with microseismic monitoring data. Li et al. [15,16,17] studied the mechanism of rupture and propagation of hydraulic fractures in coal rock and evaluated coal brittleness. Cong et al. [18,19] proposed a new method to predict the direction of fracture propagation based on a displacement discontinuity method, and the influence of CO2 foam fracturing was studied by multiple methods. Considering the interaction between hydraulic fractures and natural fractures, current numerical models can provide insights into multistage fracturing in natural fractured reservoirs. However, few studies have focused on fracture network characterization.
The fractal theory is a powerful tool for describing subsurface fracture networks. Several reports indicate that the number of natural fractures relates to the fracture length [20,21]. Xie and Chen [22] first conducted tensile and three-point bending fracture failure tests on rock. Through the fractal estimation and measurement of the rock fracture, they found that the irregularity of the fracture surface that formed after the rock fracture reflects the energy of the rock damage and fracture. The irregularity of the rock fracture surface can be described by fractals. Zhao and Wang [23] further proposed a metasurface segmentation method for calculating the fractal dimension of complex fracture color images. This method greatly improves the efficiency of calculating the fractal dimension. In the process of calculating the fractal dimension by using the box dimension calculation method, the smaller the box size is, the higher the settlement accuracy of the fractal dimension and the larger the amount of calculation [24]. Korvin [25] conducted a systematic study and statistical analysis of the joints and fracture surfaces of rock outcrops in which the fractal characteristics of the rock fracture distributions were studied. Wang et al. [26] used an improved box-counting method to study the propagation process of hydraulic fractures in tight formations. Liu et al. [27] used tracer flowback tests to analyze the fractal-like fracture network in the horizontal wells of tight formations. The results were confirmed with the microseismic events. However, few studies have been conducted on complex fracture networks in multistage fracturing.
Therefore, a numerical model of fracture network propagation is constructed by using the interactive development environment of the MATLAB-PYTHON-FEM platform. Furthermore, the fractal dimensions of natural joints are used to represent the complexity of natural joints, and the fractal dimension of the fracture network is used to represent the complexity of the complex fracture network after hydraulic fracturing. The fractal expansion law of the fracture network under the influence of the fractal dimensions of natural joints, pumping rate of the fracturing fluid, inhomogeneity coefficient of the in situ stress, and spacing of fracturing stages are also investigated. This research provides a workflow for complex fracture network simulation and characterization.

2. Description of Natural Joints with Fractal Theory

In a coalbed methane reservoir, the rock has obvious heterogeneity and anisotropy, and the size of the crystal particles of the rock is different. In the process of hydraulic fracturing, considering the anisotropy of reservoir rock, the direction of fracture propagation and fracture opening are random. Fractal theory is an important method to quantitatively study the irregular fracture characteristics and fracture morphology characteristics of reservoir rock surfaces. The coal rock debris sampled in the field has good self-similarity and scale invariance, therefore fractal theory can be used to study the law of hydraulic fracture propagation [26,27].
The mercury intrusion method can be used to test the relationship between the rock’s wetting phase saturation and mercury injection pressure. During the injection of mercury, the capillary pressure of the rock rises from minimum to maximum. The wetting phase saturation decreases from 100% to the minimum, while the non-wetting phase saturation increases from the minimum to the maximum. When the capillary pressure is certain, the wetting phase saturation of rock can be described in the fractal geometry formula, which is shown in Equation (1):
S w = ( p c p m i n ) D 3
where p m i n is the capillary pressure when the rock pore diameter is at its maximum (MPa), p c is the capillary pressure, S w is the wetting phase saturation of rock when the capillary pressure is p c , and D is the fractal dimension.
By taking the logarithm of Equation (1) at both ends of the fractal formula, Equation (2) is obtained:
l g   S w = ( D 3 ) l g p m i n + ( D 3 ) l g p c
As Equation (2) shows, there is a linear relation between l g   S w and l g p c if the rock has fractal characteristics. By the mercury intrusion analysis of three coal rock samples obtained from the CBM reservoirs, the natural fractures from the sampled coal rock conform to the fractal characteristics, which is shown in Figure 1.
Different from the initiation and propagation of fractures in conventional reservoirs, fractured reservoirs (CBM reservoirs) are affected by natural fractures (natural joints). In the process of hydraulic fracturing, hydraulic fractures are connected to natural occurrences. The geometric characteristics of the natural joints are critical to the fracture distribution during the interaction of natural fractures and hydraulic fractures.
As natural joints are the product of complex geological structures, the geometric characteristics and distribution of joints in rock masses are generally random. The random distribution is the assumption we made in the simulation, as the true distribution may show some degrees of non-randomness. The Monte Carlo method is used to simulate the distribution of natural joints. Random number generation is the most basic method in a Monte Carlo simulation. Random numbers that are evenly distributed between [0, 1] are usually called truly random numbers. However, the geometric parameters of joints and fractures in a rock mass do not follow a uniform distribution. The random numbers that follow the field-measured distribution are called random variables, which are obtained using the following distribution function:
ϵ n = L n   f ( t ) ,   f ( t ) r n   n = 1 , 2 l
where r 1 , r 2 r l are a series of random numbers. The cumulative probability distribution of f ( t ) is:
F ( x ) = x f ( t ) d t
If the inverse function of F ( x ) exists, pseudorandom numbers can be generated by the inverse function:
ϵ F = F 1 ( x )  
As this study considers a two-dimensional plane problem, the geometric parameters of the joints mainly include the trace length, inclination angle, and fracture interval. Given the probability distribution functions of these geometric parameters, the corresponding geometric shapes can be simulated. The normal distribution function is used to simulate the trace length and spacing of natural joints. The distribution function and random variables are expressed in Equations (6) and (7), respectively:
f ( x ) = 1 2 π σ e x p [ 1 2 ( x μ σ ) 2 ]
x = ( i = 1 12 r i 6 ) σ + μ
Based on the fractal theory above, natural joints are generated in a two-dimensional plane by the Monte Carlo method as follows:
The binarization is conducted for the two groups of natural joint distributions in Figure 2, and the results are shown in Figure 3. To calculate the fractal dimension of the natural joint distribution of the two groups of joints, the box number method is used, and the fractal dimension of the natural joint distribution is 1.52.
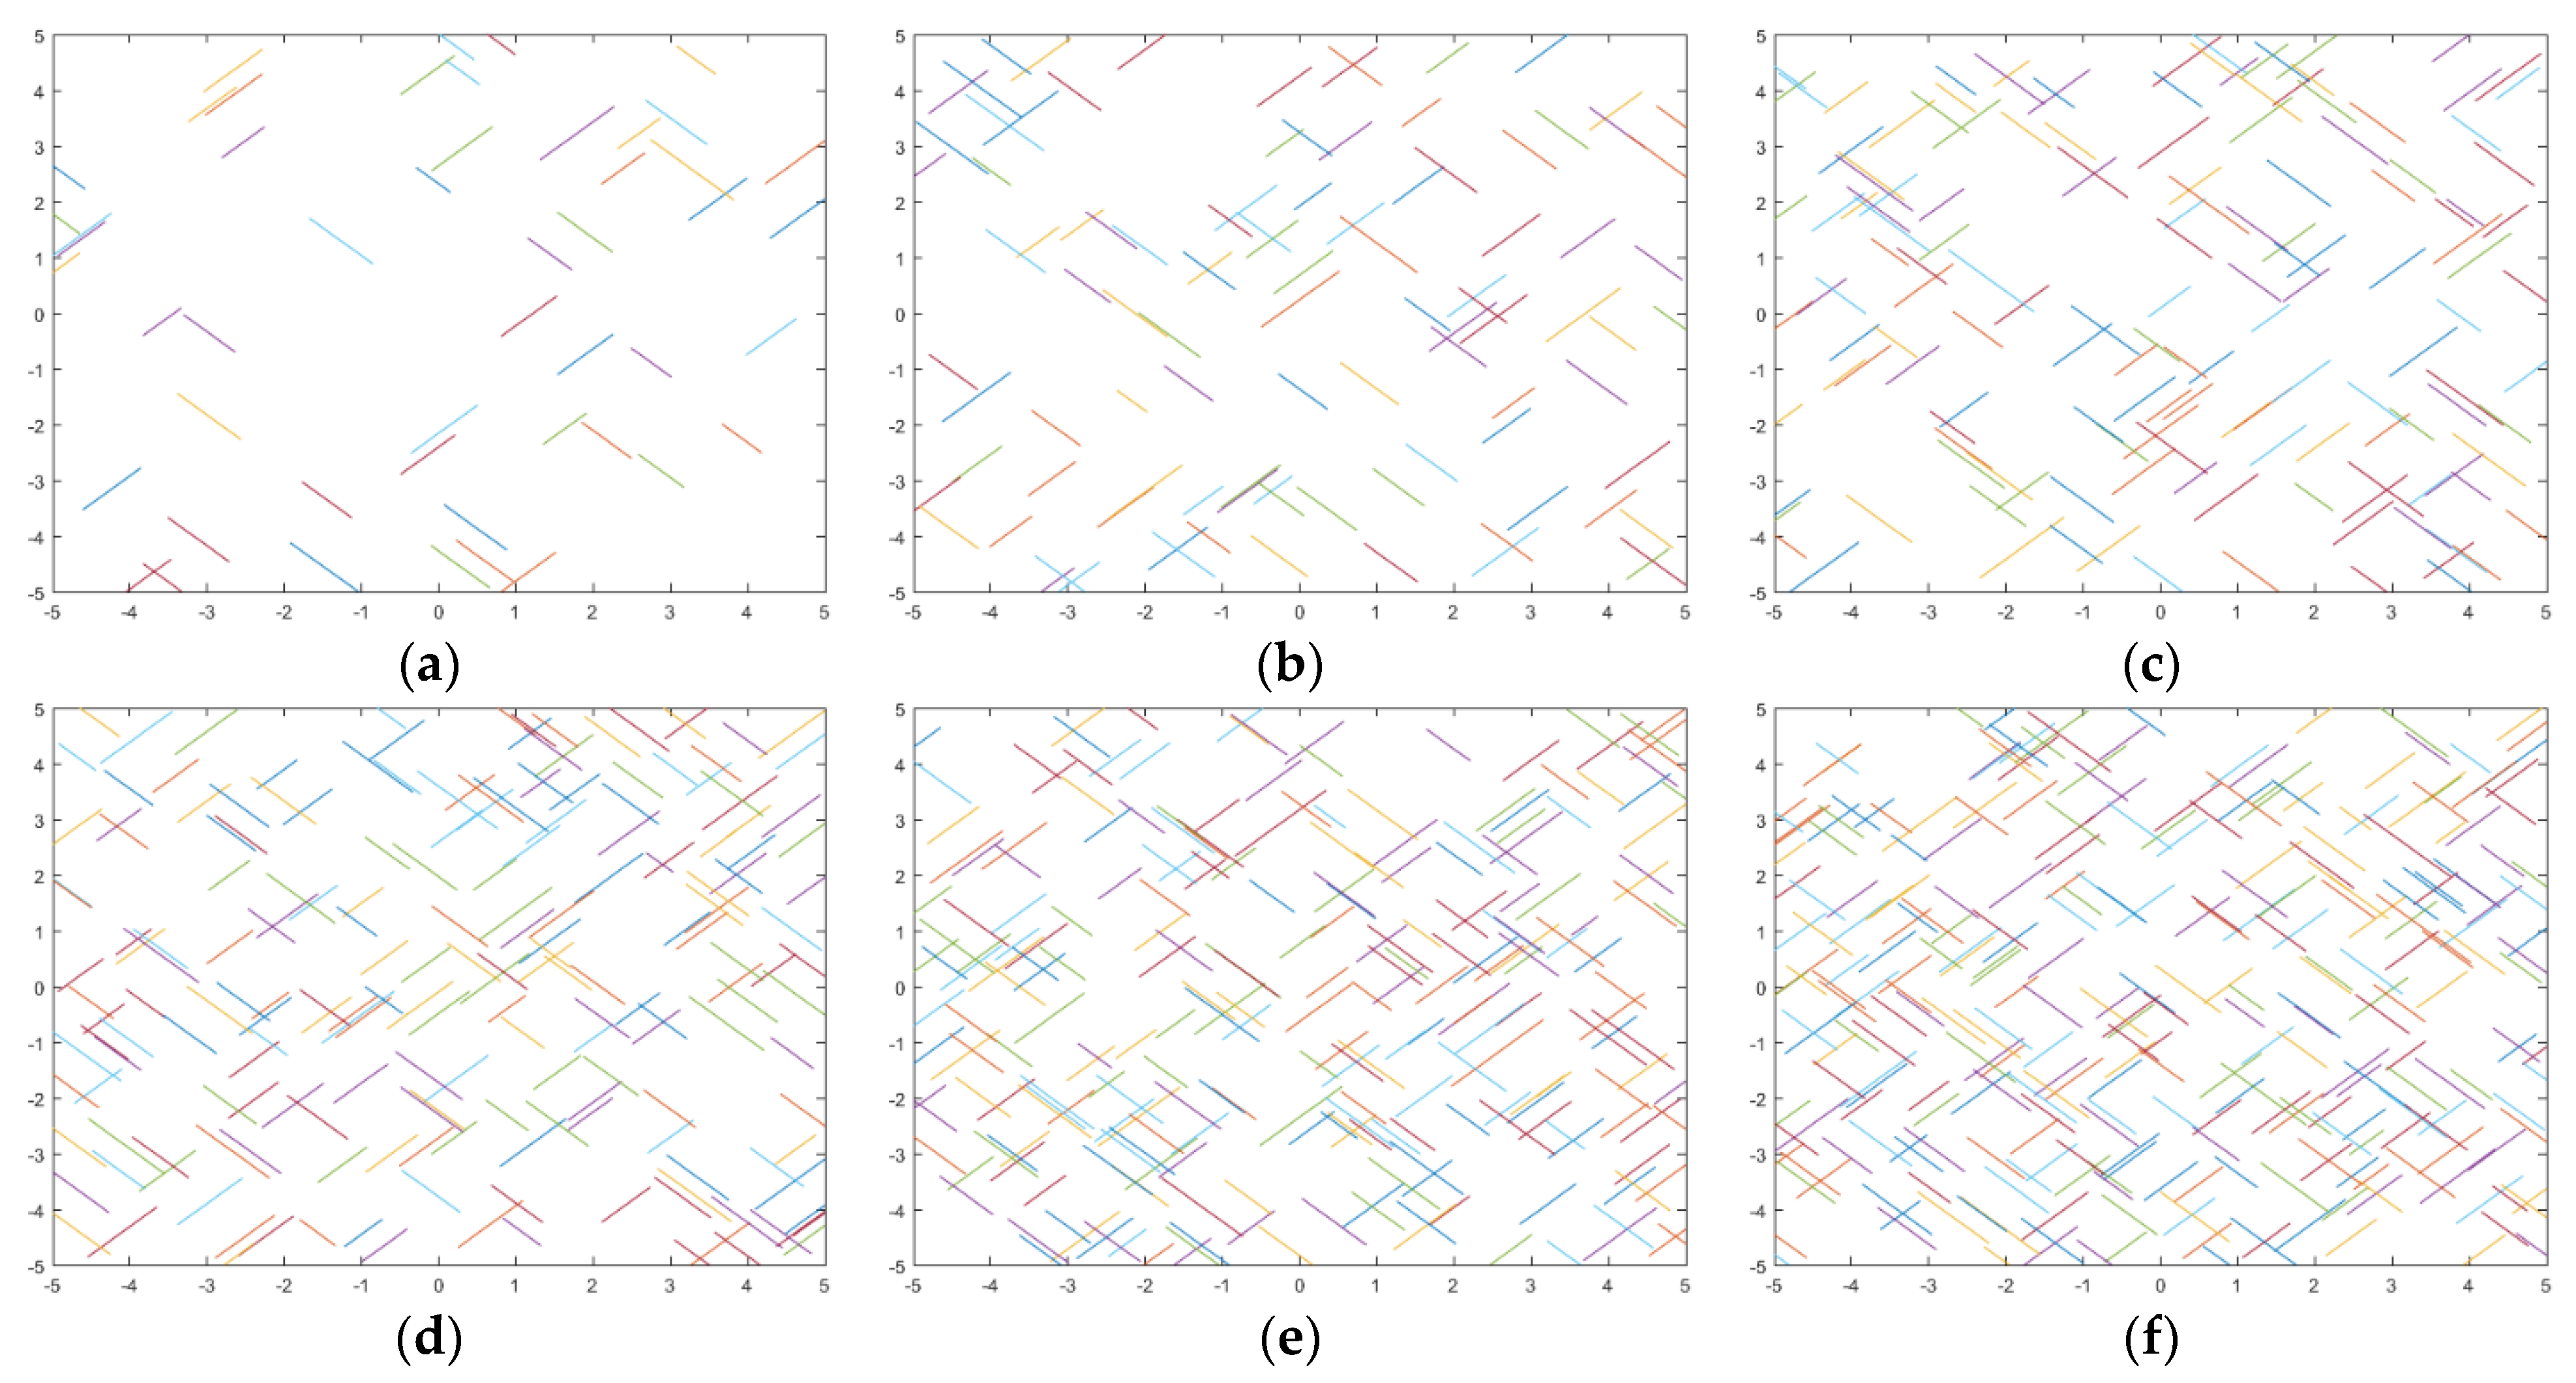
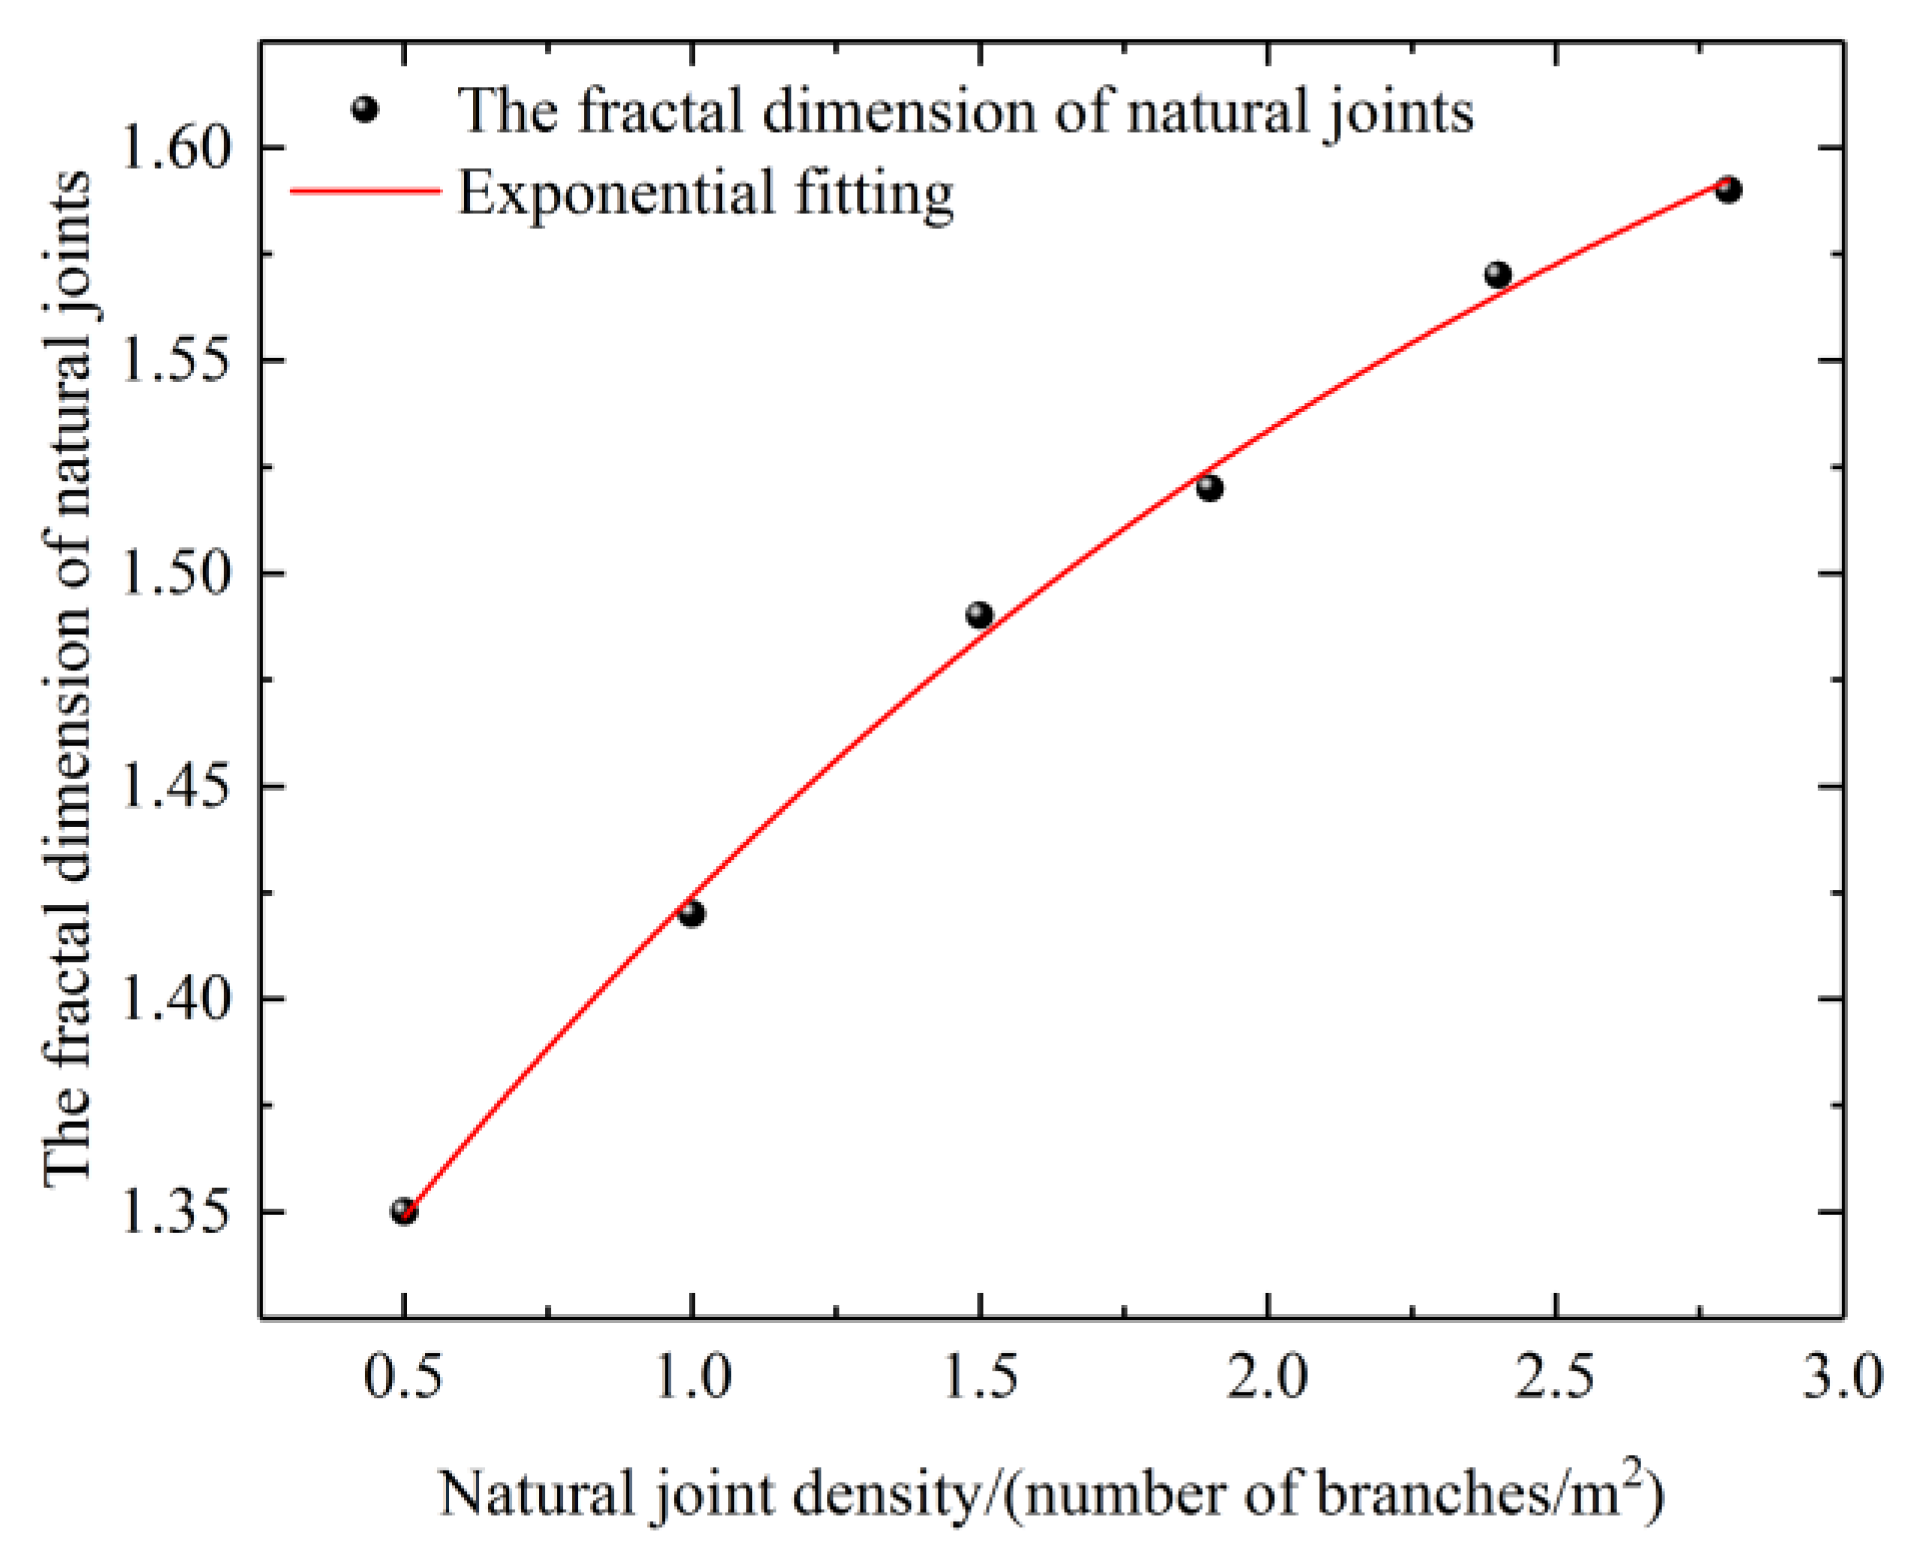
The natural joint distributions with different joint densities are shown in Figure 4, and the fractal dimensions are calculated after the binarization processing. The relation between the fractal dimensions of natural joints and the joint density is shown in Figure 5. Its corresponding polynomial fitting curve is generated in Equation (8), and the goodness of fit is 0.99777. With increasing natural joint density, the fractal dimension of the natural joint distribution shows positive exponential growth, which indicates that the complexity of the natural joint distribution also increases.
D f = 0.47812 × e ( n f 2.2872 ) + 1.73291
where n f is the natural joint density in units of curve/m2.

3. The Fracture Propagation Model of Fracture Network Expansion in Fractured Reservoirs

Hydraulic fracturing is a complex fluid–solid coupling problem, and its implementation requires comprehensive consideration of fracture mechanics, elastoplastic mechanics, fluid mechanics, and seepage mechanics. The study focuses on CBM reservoirs with natural joints and the irregular fractal propagation of fractures that are induced by hydraulic fracturing. Considering the development of natural joints in CBM reservoirs, hydraulic fractures intersect with natural joints during the expansion process. Meanwhile, interfracture stress interference also influences propagation. It is necessary to establish a corresponding fracture penetration criterion [28,29]. Fracture initiation and propagation in hydraulic fracturing are modeled by the cohesive zone model (CZM), which is proven to be a powerful and effective technique for computational fracture mechanics.

3.1. The Fluid–Structure Interaction and Global Cohesive Zone Model

The cohesive zone model (CZM) is an effective model for nonlinear fracture mechanics and was first proposed by Barenblatt [30] to investigate perfectly brittle materials. Currently, the CZM is used to model hydraulic fracture propagation in unconventional reservoirs [31,32].
Fluid flow in hydraulic fractures can be analyzed by lubrication theory when fluid flows through a zone where one dimension is much smaller than the other, namely, the fracture width is much smaller than the fracture height and length [33]. Carter’s leak-off model can be used to model fracturing fluid leak-off, which is expressed as [34]:
w t + q + ξ = 0
In Equation (9), q is the flow rate, w is the fracture width, and the leak-off can be described by using Carter’s model as follows:
ξ ( x , t ) = 2 C t t 0 ( x )
In Equation (10), C is the leak-off coefficient, t is the time, and t 0 is the fracture tip arrival time.
The cohesive zone model is introduced to remove the stress singularity in the classical continuum fracture propagation model. To make the calculation easier, the crack evolution model is simplified by assuming that the cohesive zone localizes to a narrow zone in front of the visible crack.
In traditional single fracture propagation models, one zero-thickness cohesive zone is commonly applied and represents the fracture path. To simulate the complex fracture network, zero-thickness cohesive zones are embedded along element boundaries and represent natural fractures in the whole research domain. Thus, hydraulic fractures can randomly initiate and propagate along all boundaries. Moreover, the interaction between hydraulic fractures and natural fractures can be captured by the activation of zero-thickness cohesive zones. The tensile strength, shear strength, and critical fracture energy of natural fractures can be predetermined, which represent natural fracture properties. In this scenario, both the local stress state and natural fracture properties determine the hydraulic fracture propagation orientation.
In the study, the traction–separation model is used to describe the fracture propagation behavior, which means the critical initial displacement of the rock is δ I C when the traction force reaches the cohesive strength. The total work to create the whole crack is the fracture energy G I C , which is related to the rock fracture toughness K I C through the following equation [29,35]:
G I C = K I C 2 ( 1 υ 2 ) E
where E is the Young’s modulus and υ is Poisson’s ratio.
When the normal or shear strength of the rock is reached, damage is assumed to occur. The critical stress value σ C is expressed as:
σ C = ( 1 D ) σ t
where σ t is the tensile strength of the rock. The damage variable D can be described by an exponential model as follows:
D = 1 e β [ ( δ δ I C ) ( δ I C δ m a x ) ] 1 e β
where β is a parameter that represents the curvature of the softening equation in the model and δ I C and δ m a x are the critical displacement and the maximum displacement, respectively, of the crack. δ I C is related to the rock fracture toughness and tensile strength by:
δ I C = 2 G I C σ t
Once the cohesive zone breaks, the fracture propagation can be determined by the Benzeggagh–Kenane fracture criterion, which is defined as:
G n c + ( G s c G n c ) [ G s h G T ] η = G c
where   G n , G s , and G t are the work done by the traction and its conjugate relative displacement in the normal, first shear, and second shear directions, respectively, and G n c , G s c , and G t c represent the fracture energies in the normal l, first shear, and second shear directions, respectively. G s h = G s c + G t c   and   G T = G s h + G n c [28].

3.2. Model Construction

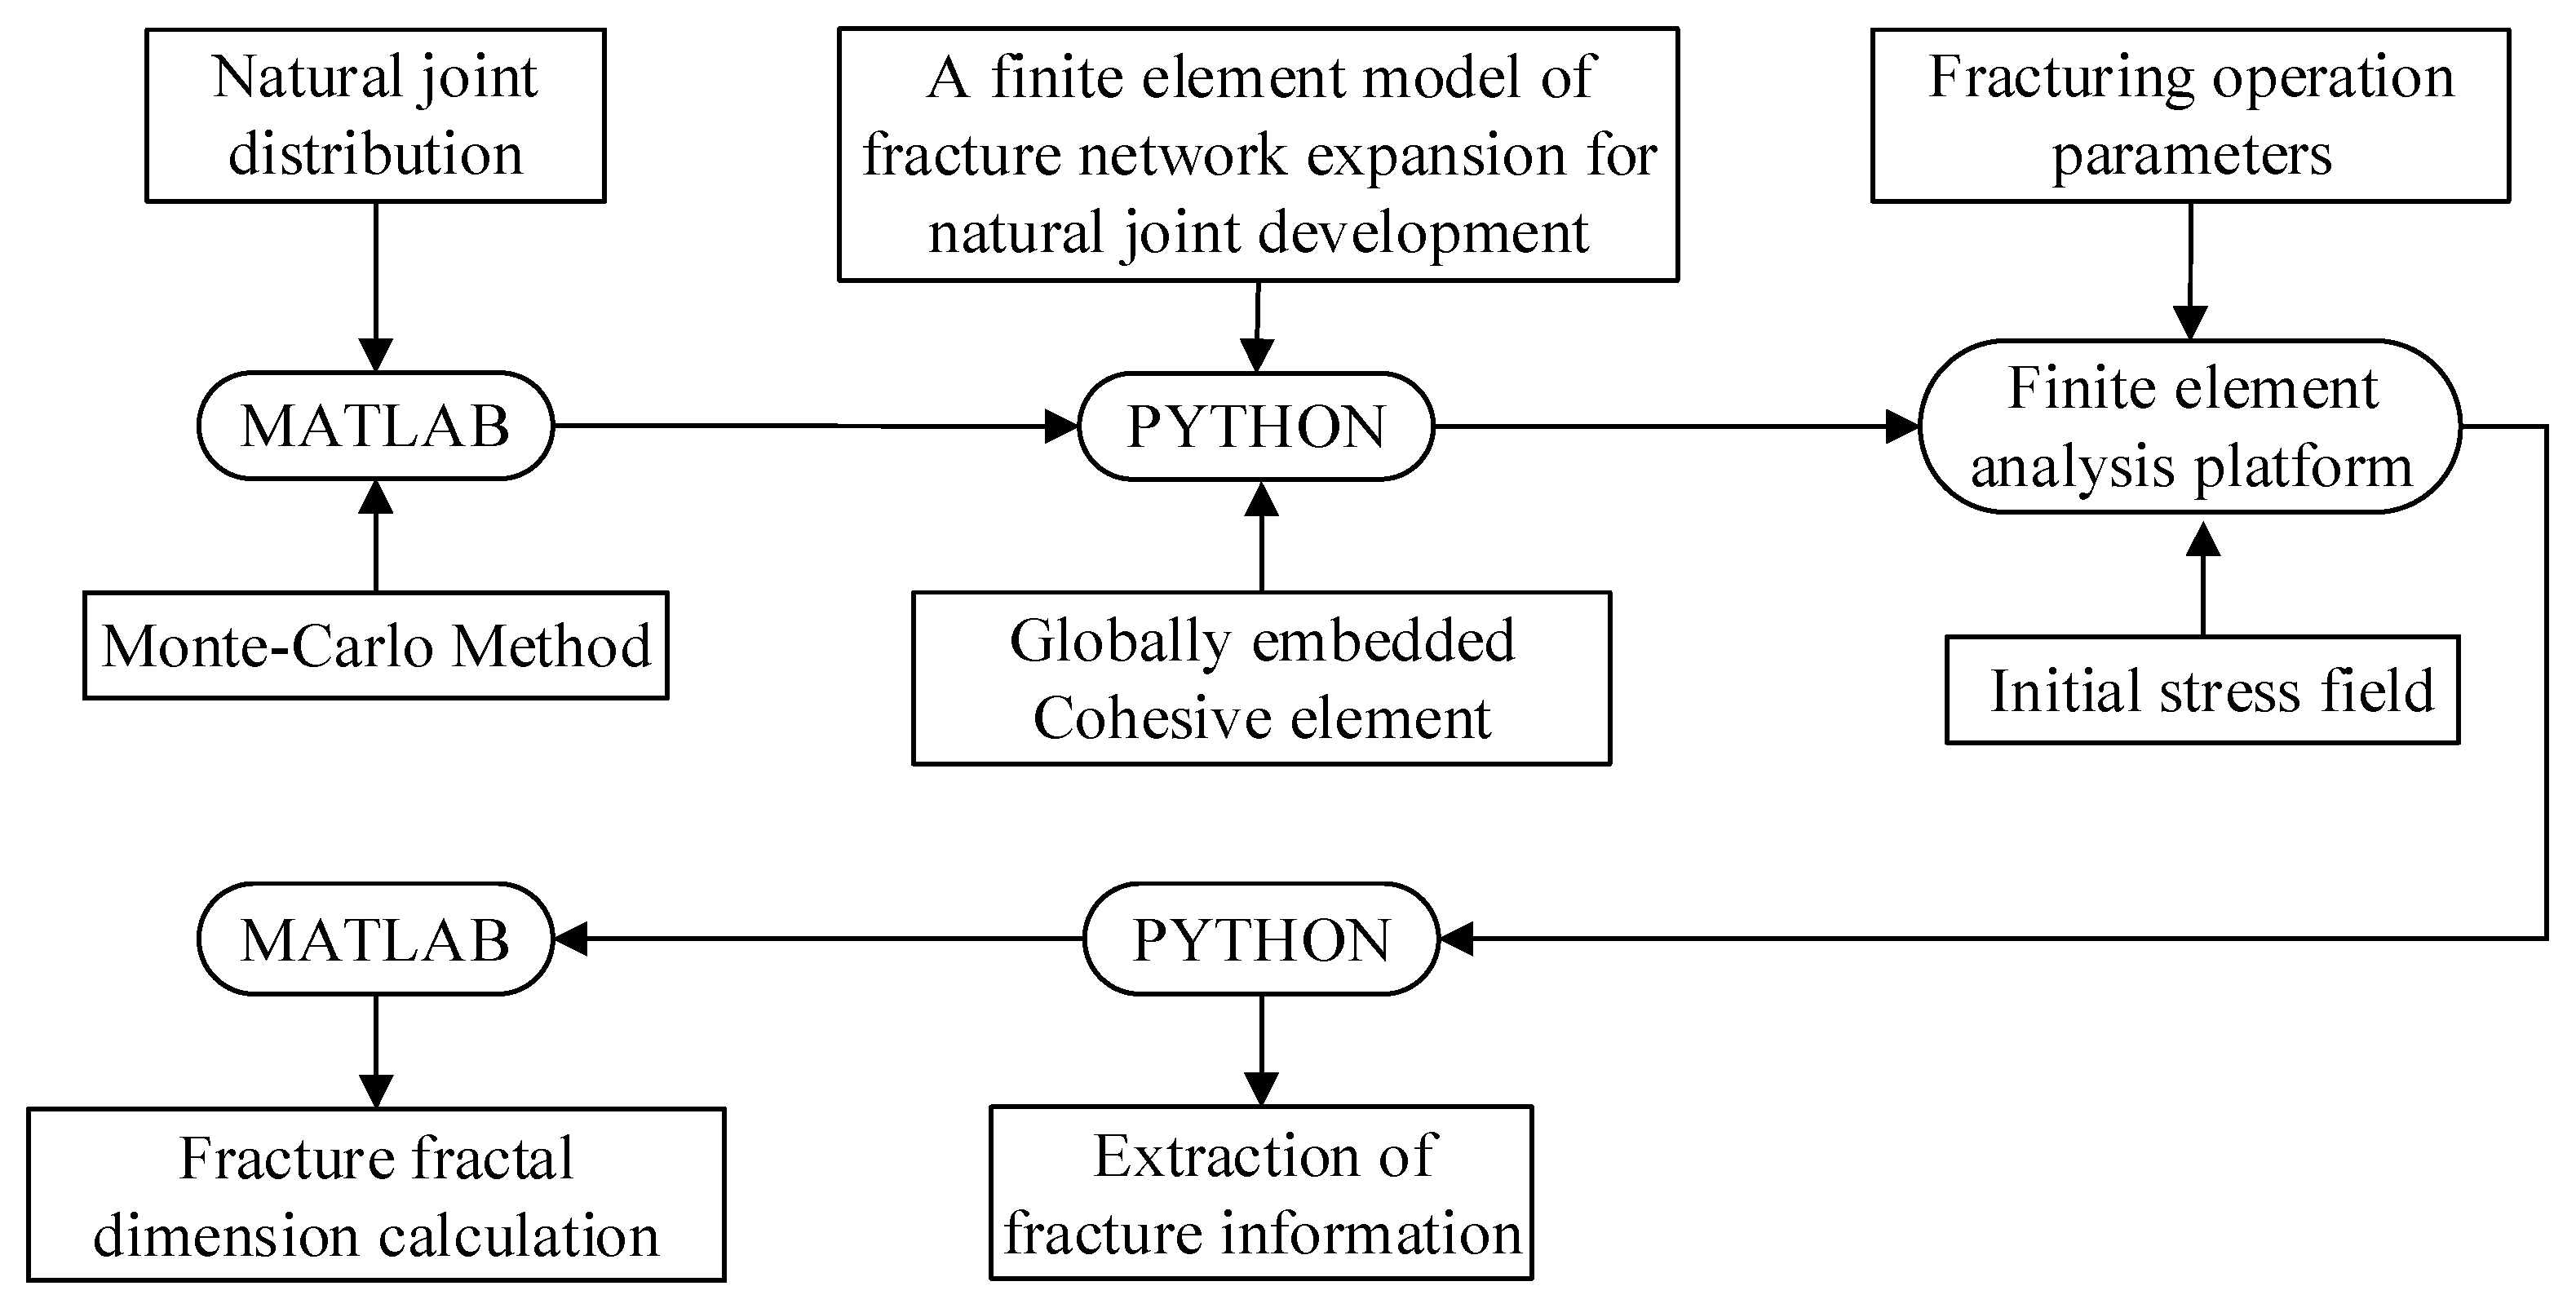
An interactive development environment of the MATLAB-PYTHON-FEM platform is used for the construction, calculation, and postprocessing operation of the fracture propagation model in the CBM reservoir. First, the Monte Carlo method is used to construct natural joints with fractal structure characteristics based on the MATLAB development environment. Second, the natural joints with fractal structure characteristics that were constructed in MATLAB are imported into the PYTHON development environment, and a cohesive element is embedded globally into the construction of CBM reservoirs with natural joints. Then, the CBM reservoir model that was constructed in the PYTHON development environment is imported into the FEM platform to complete the construction and calculation of the fracture propagation model in CBM reservoirs with fractal structure characteristics. Then, the calculated results in the FEM platform are post processed using the PYTHON development environment. The fracture information and fracture parameters are extracted. Finally, MATLAB is used to binarize the fracture map that was extracted from PYTHON. The fractal dimension of the fracture is calculated by the box dimension method. The basic modeling process is illustrated in Figure 6.
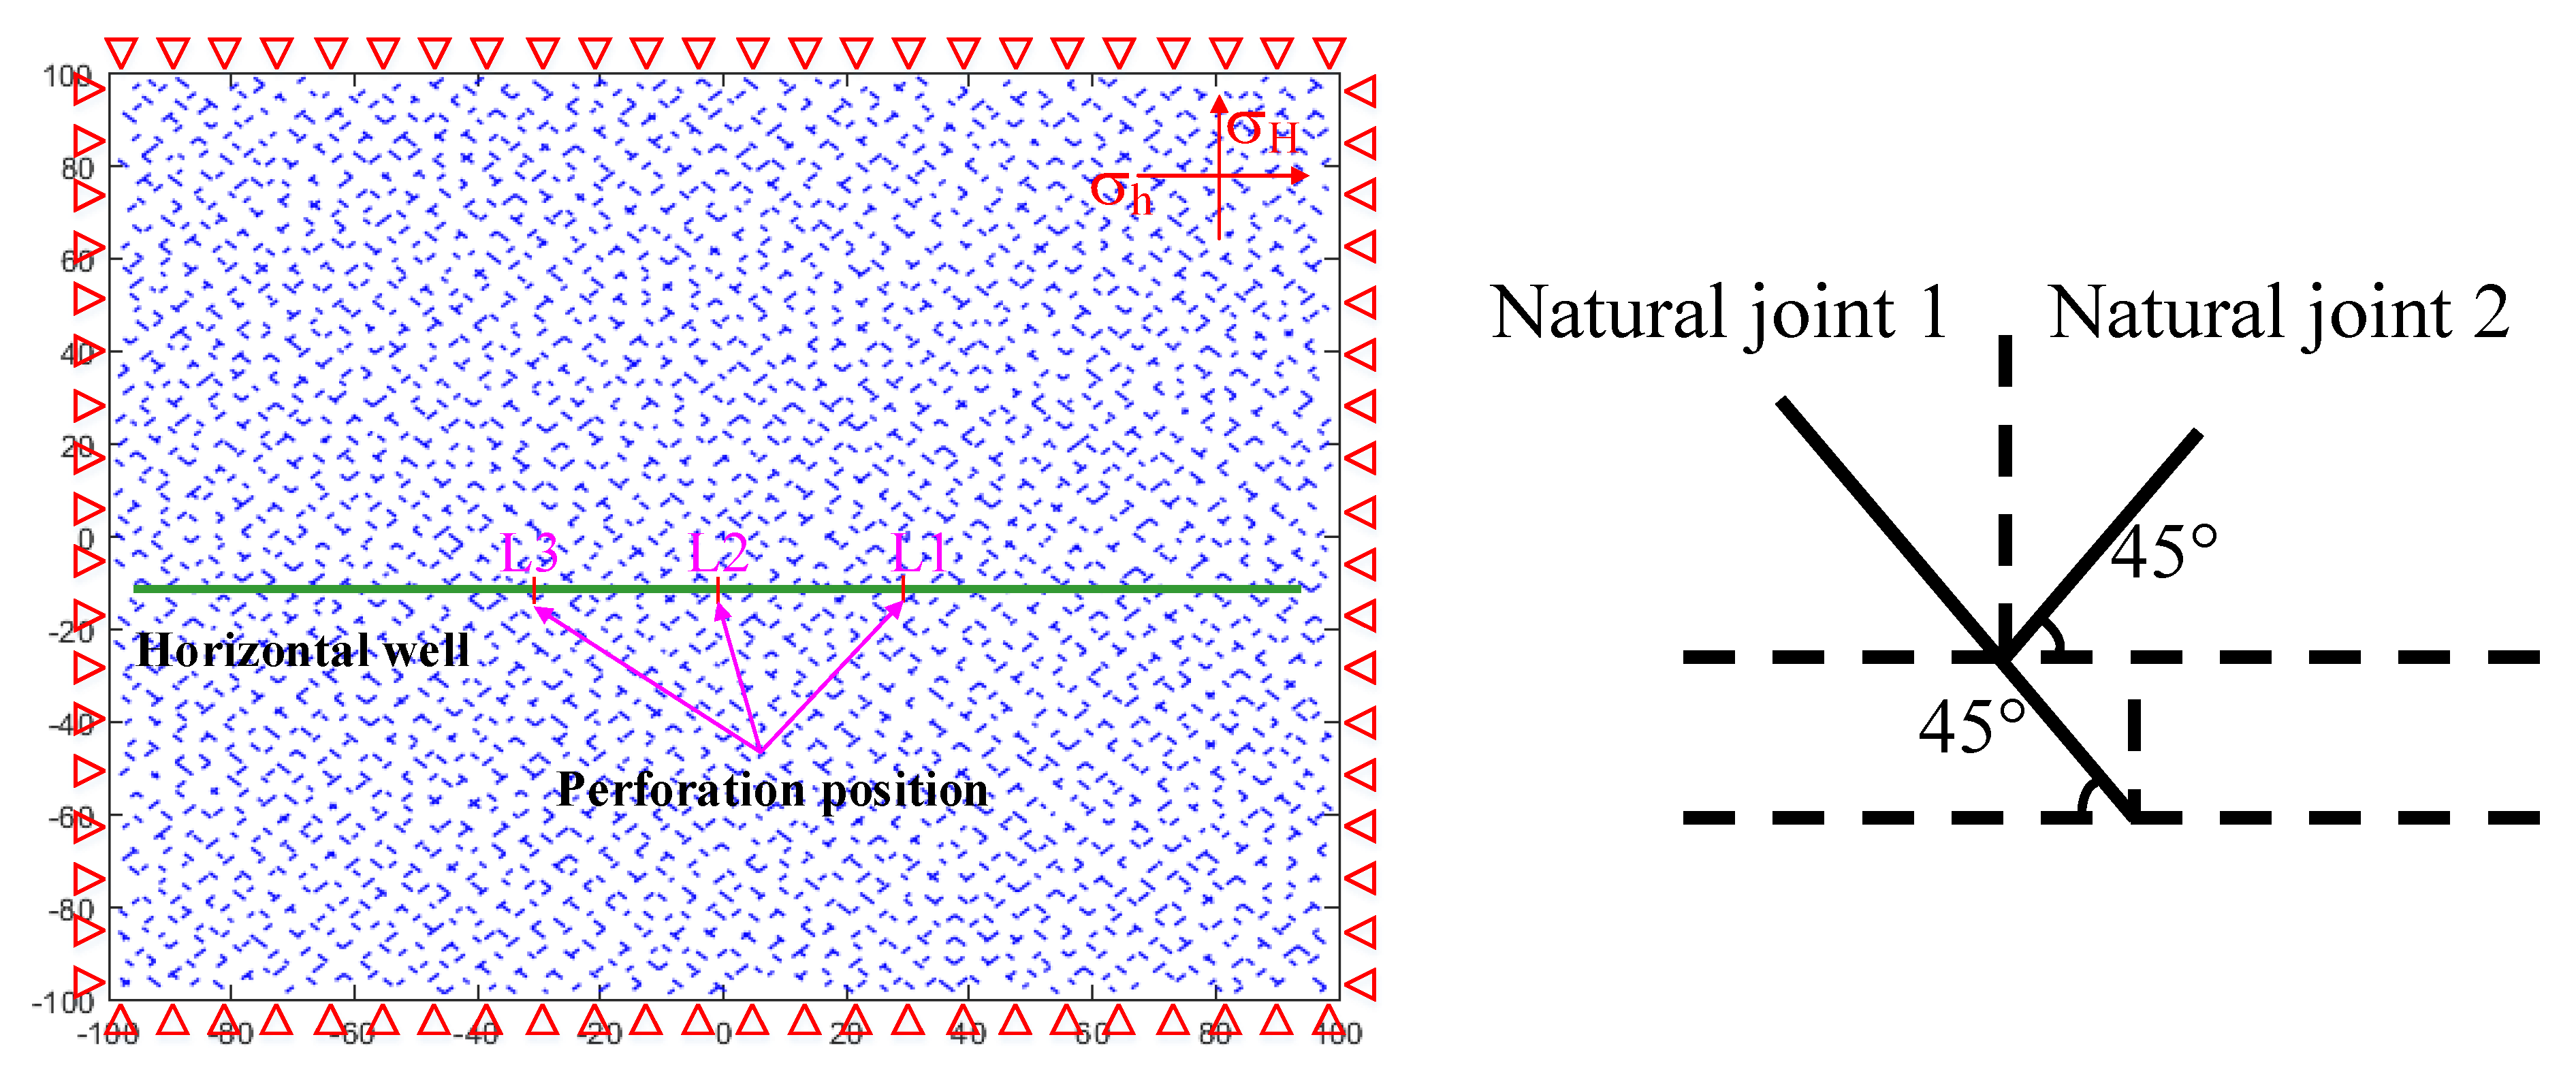
According to the modeling process in Figure 6, a fracture propagation model of the CBM reservoir with a size of 200 m × 200 m under various joint densities is constructed. A schematic diagram of the model is shown in Figure 7. There are three fracturing sections, which are named L1, L2, and L3 in the model. The maximum stress criterion is used as the fracture initiation criterion in this section. The influences of the natural joint density, fracturing fluid pumping rate, and inhomogeneity coefficient of the in situ stress on fracture propagation are analyzed.

3.3. Characteristic Analysis of Rock Mechanics Parameters

To study the fracture propagation network, the in situ rock mechanics parameters need to be determined in advance. In accordance with the mechanical parameters of coalbed methane (CBM) reservoirs, a statistical analysis of the coal in the Qinshui Basin of China was carried out.
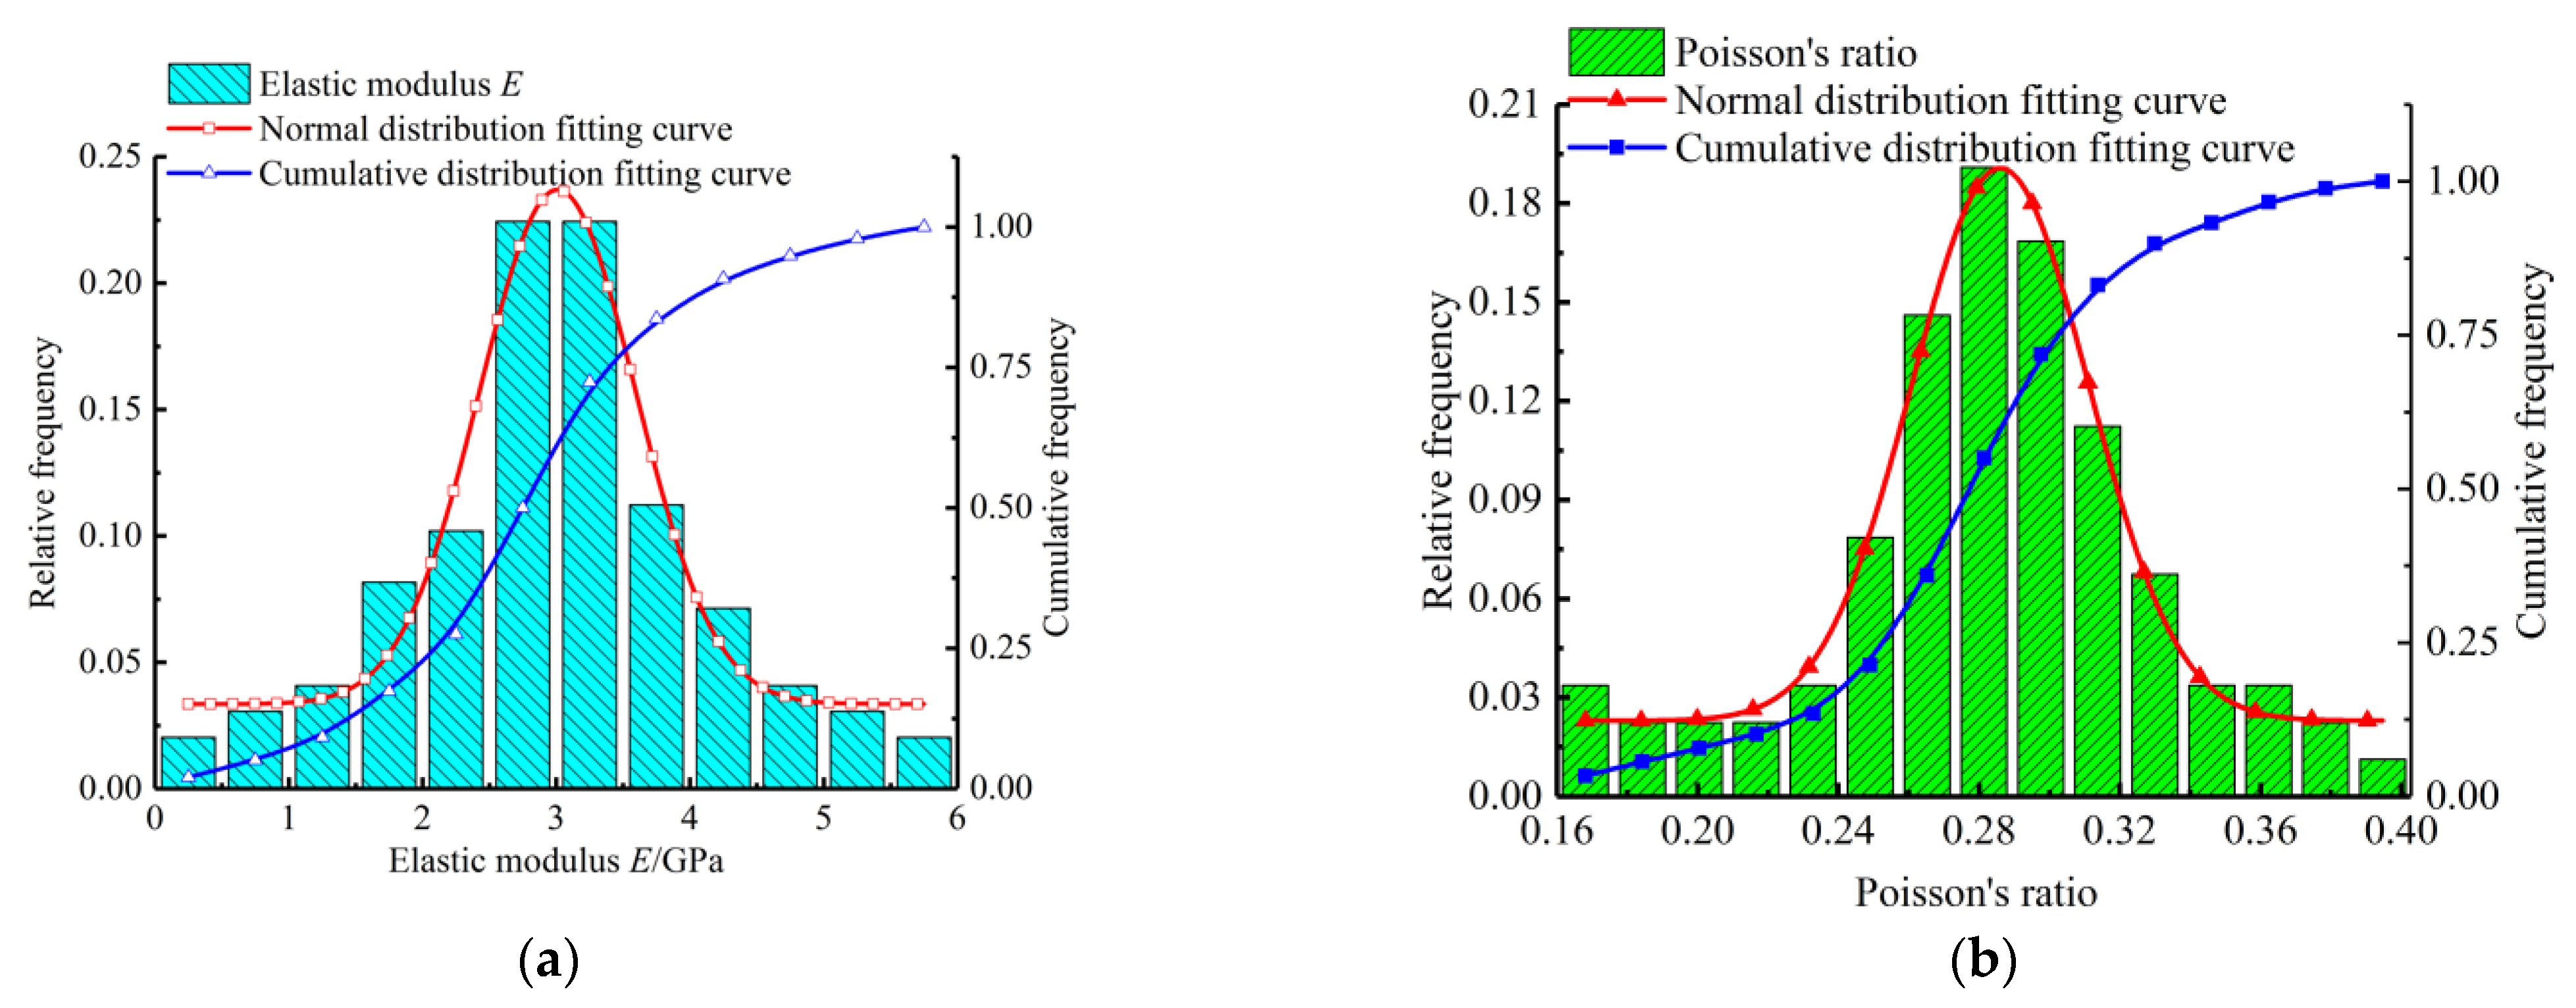
For the elastic modulus and Poisson’s ratio in the unconventional reservoirs, the in situ data in the Qinshui Basin were statistically analyzed, and the results are presented in Table 1 and Figure 8. Compared with tight sandstone and shale in unconventional reservoirs, coal has a relatively small elastic modulus and a relatively high Poisson’s ratio, which indicates that the elasticity and brittleness of coal are relatively low. The other calculation parameters are presented in Table 2.

4. Numerical Simulation Results

4.1. Influence of the Fractal Dimensions of Natural Joints on the Fractal Propagation of Fractures

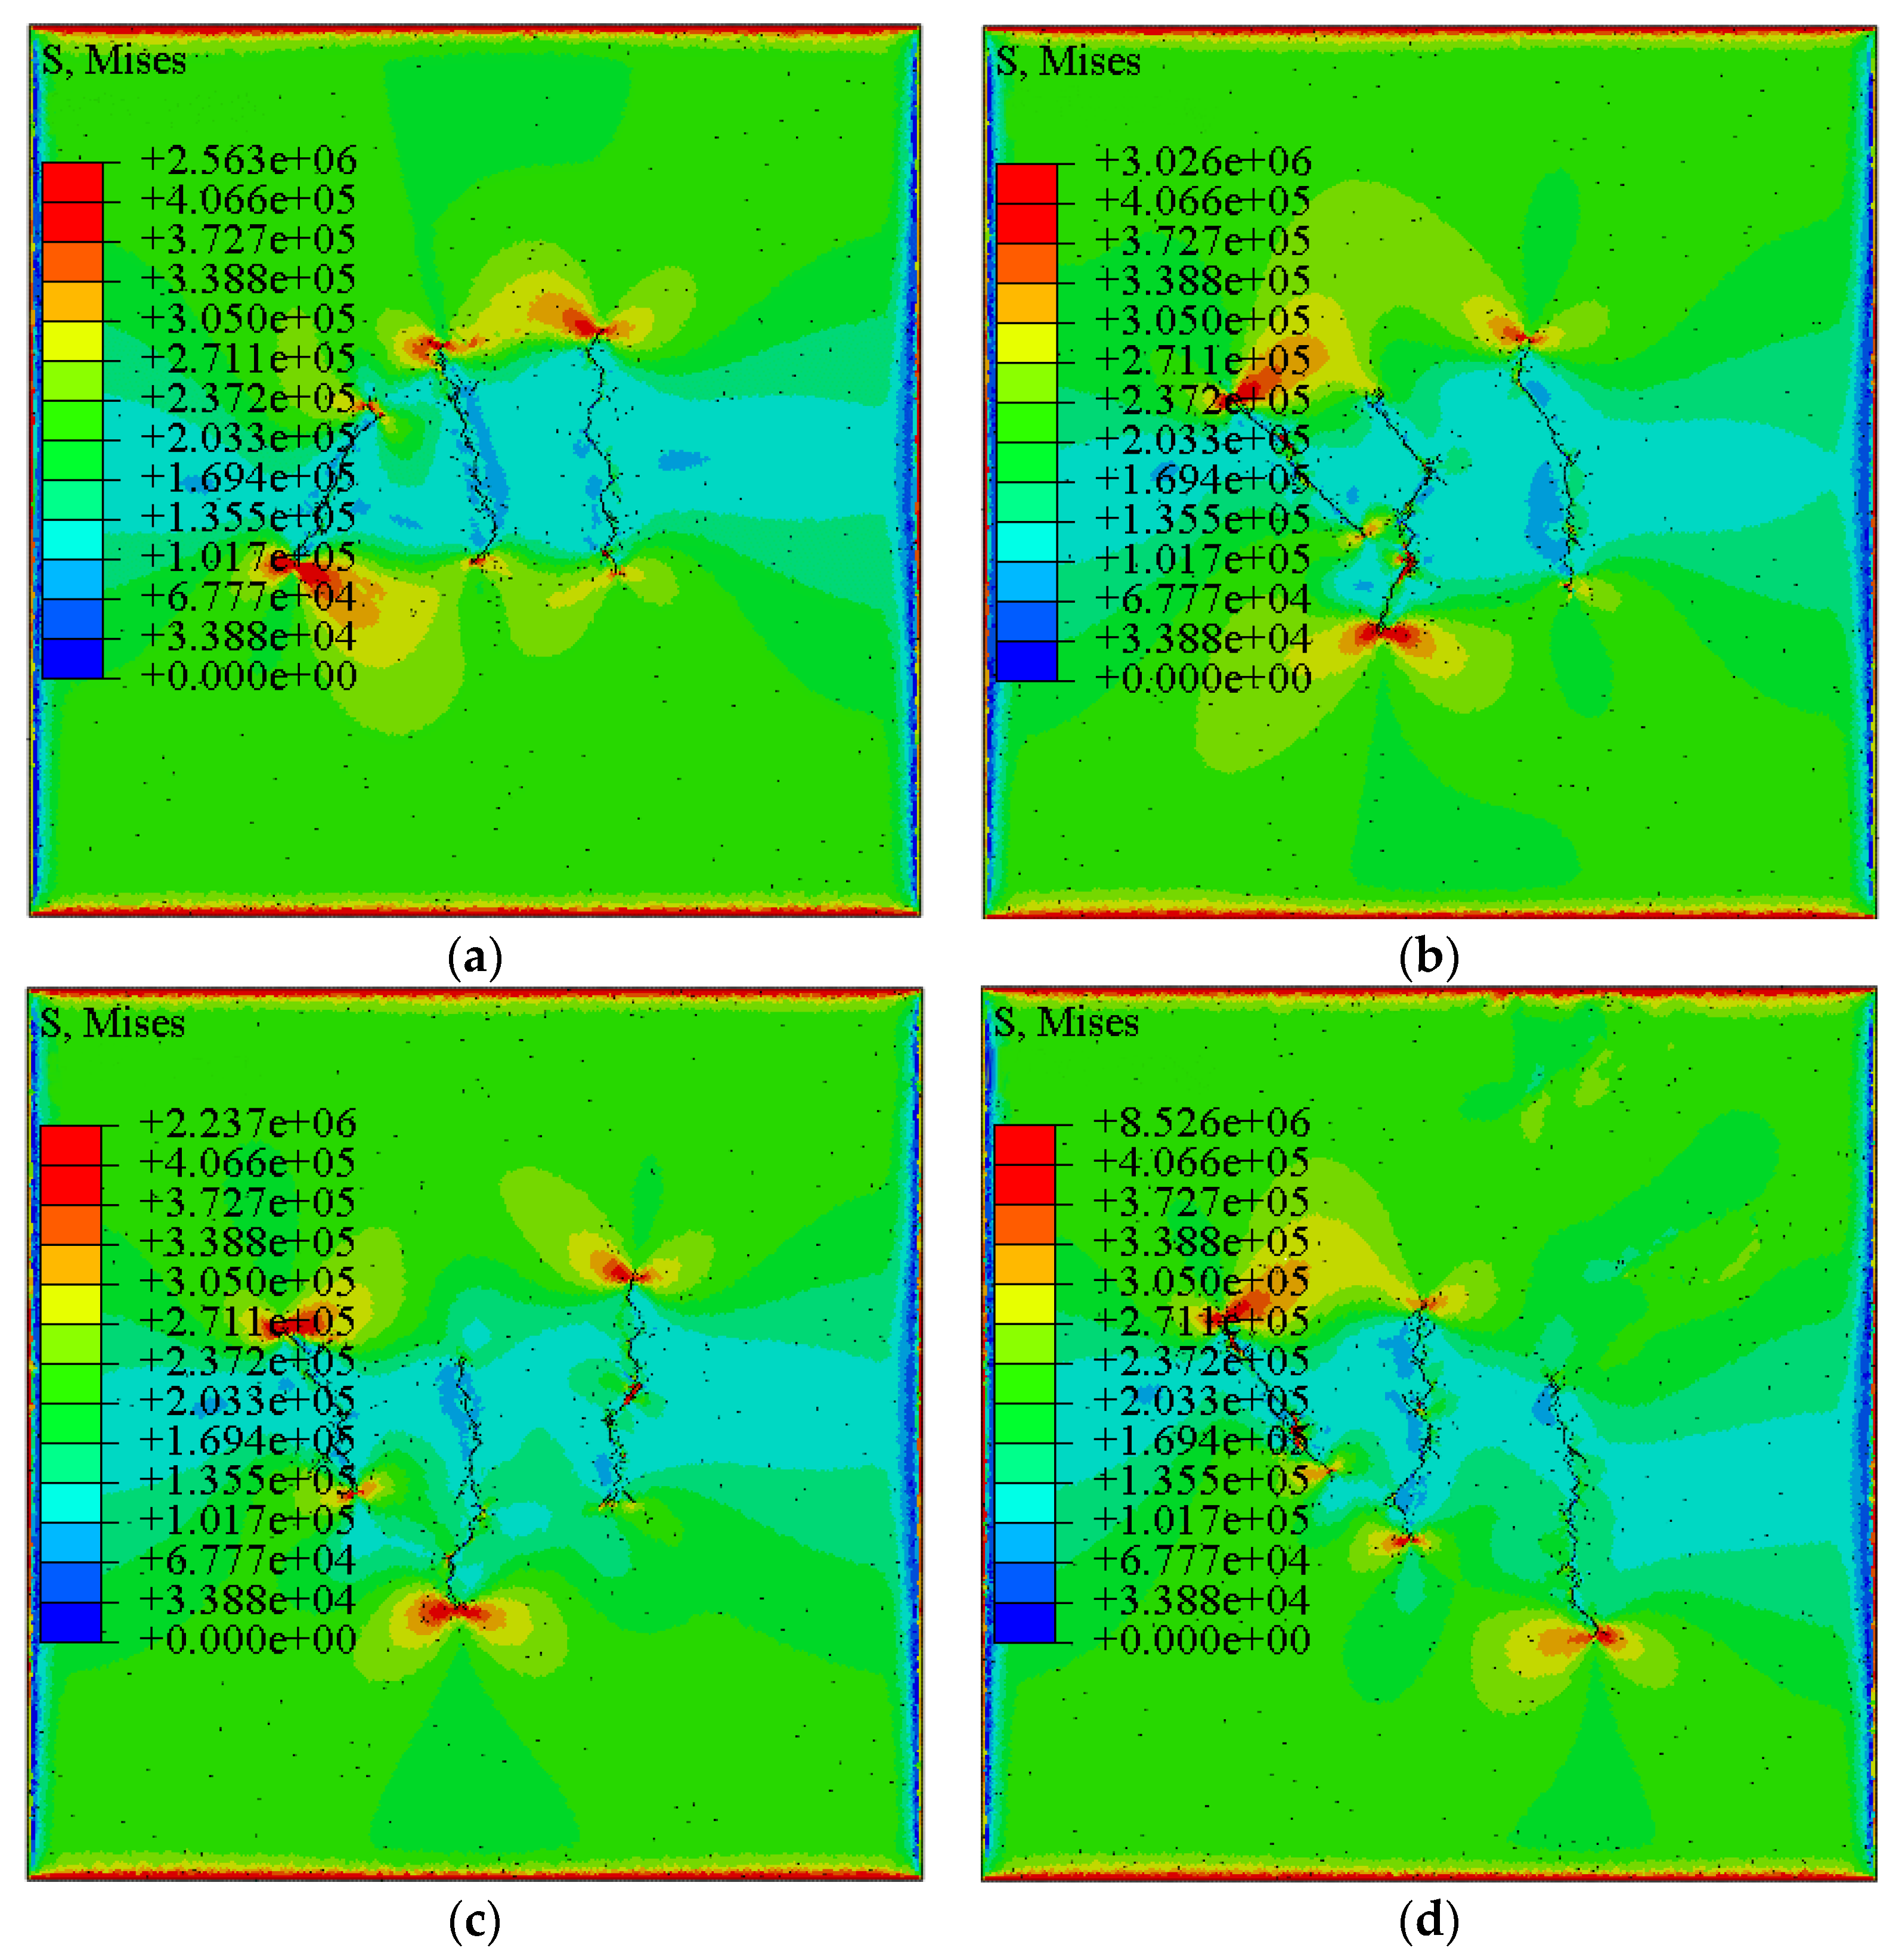
The direction of the reservoir joints and the maximum and minimum horizontal in situ stresses are maintained at 45°. The fracturing fluid pumping rate is 0.24 m3·min−1. The inhomogeneity coefficient of the in situ stress is 1.16. The central path length of the natural joints is 2 m. The center spacing of the joints is 2 m. The center spacing of the fracturing stages is 30 m. The fracture propagation laws of natural joints with fractal dimensions of 1.2662, 1.2716, 1.2806, and 1.2998 are calculated.
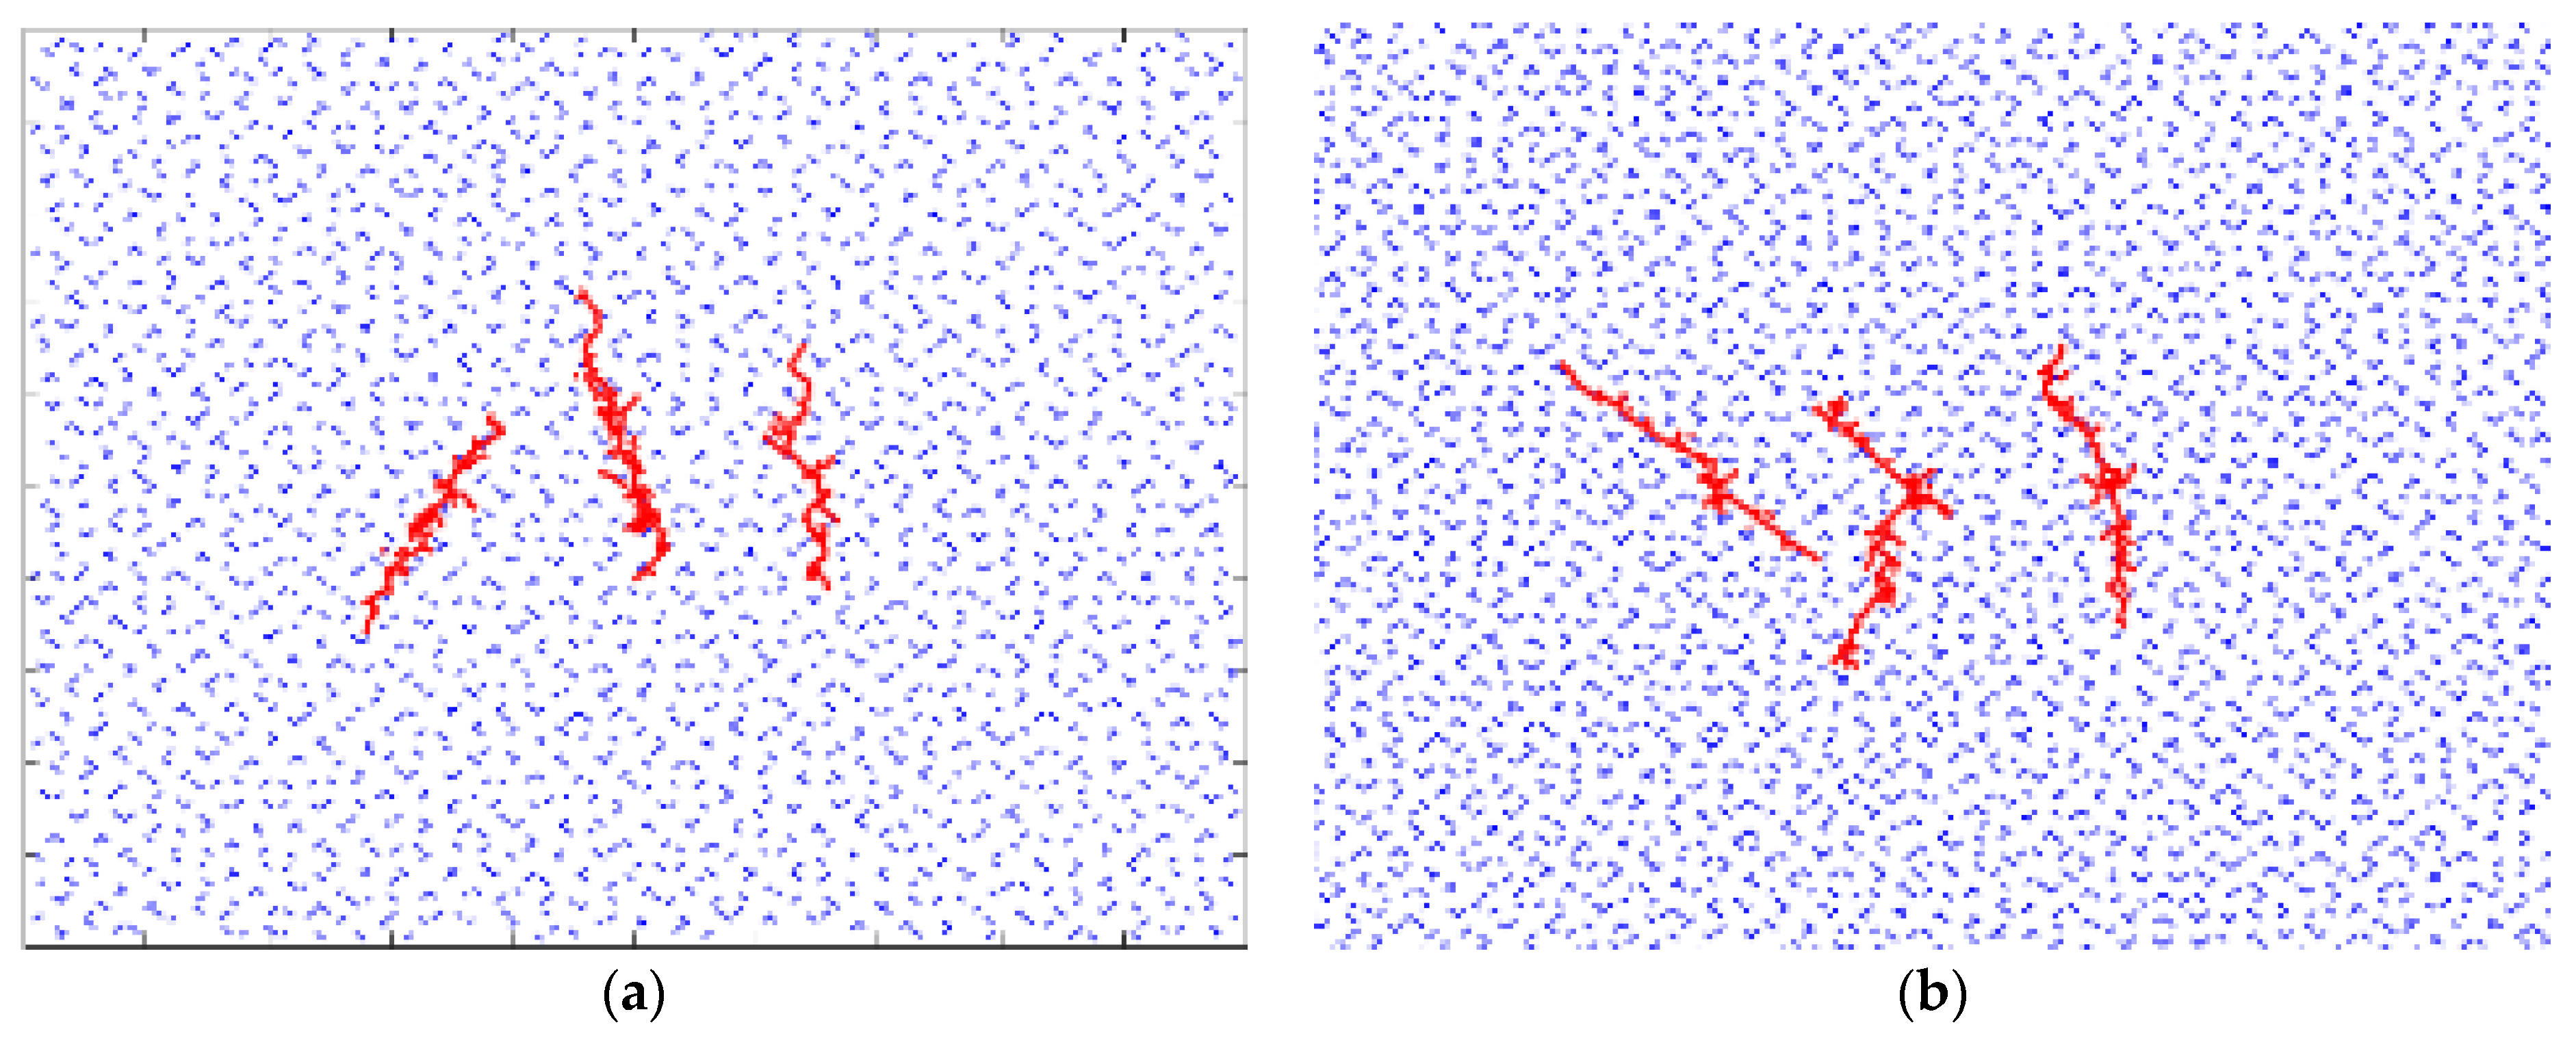
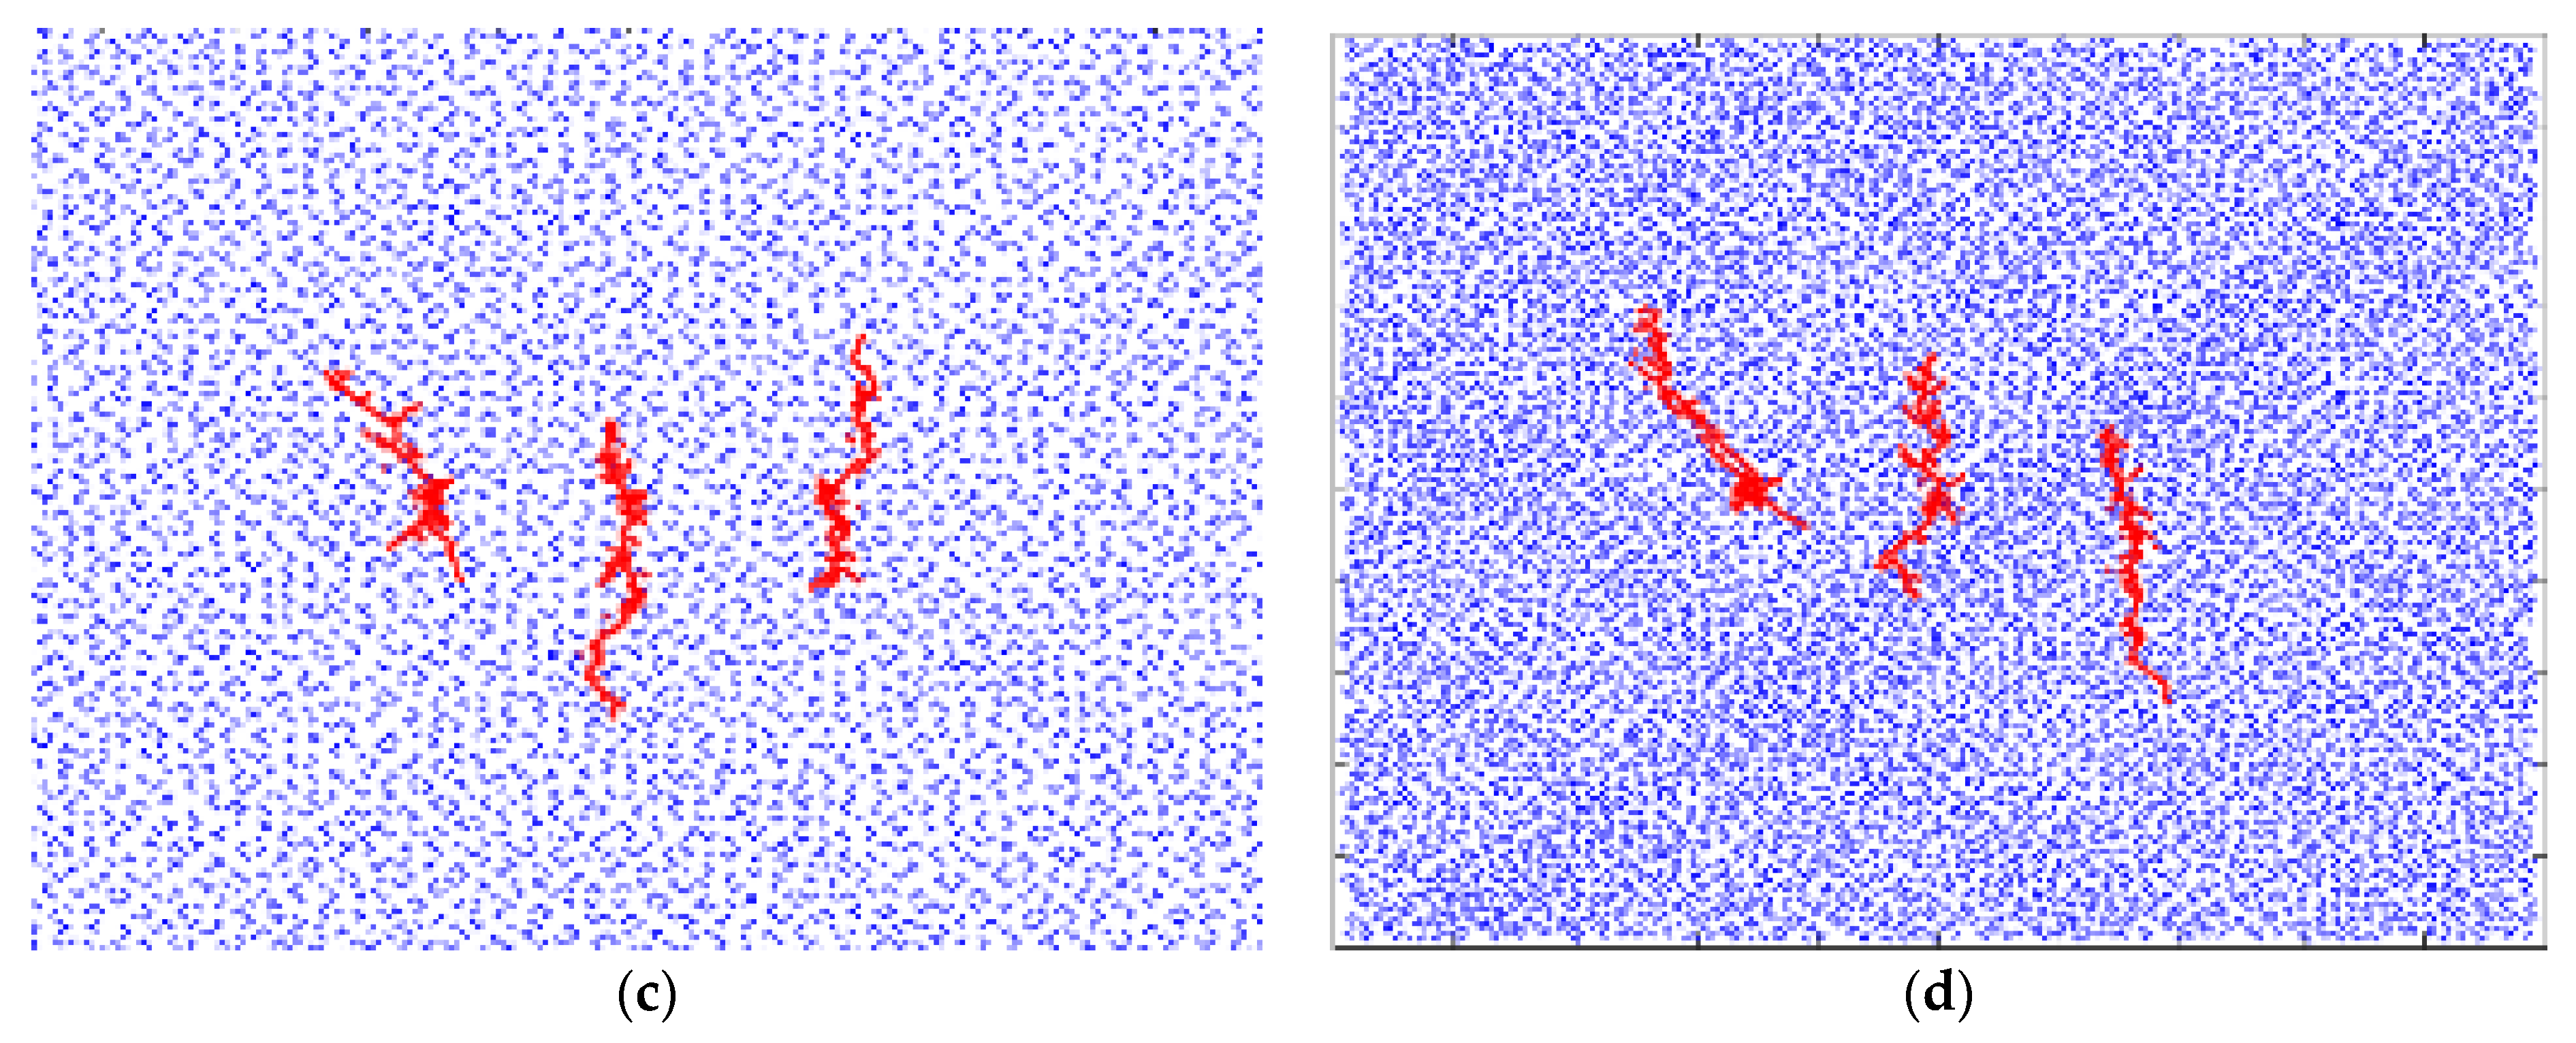
Using the FEM platform, the stress distribution of the three-stage fracture propagation is calculated as shown in Figure 9. PYTHON is used to extract the fracture information and the fracture configuration distribution, which is shown in Figure 10.
Figure 9 and Figure 10 show that the staged fracturing natural reservoir has distinct interfracture stress interference in the development of joint fractures in the extension process. Due to the interaction between hydraulic fractures and natural joints, the propagation mode of the fractures is modified. The fractures penetrate or change direction when they intersect with the natural joints.
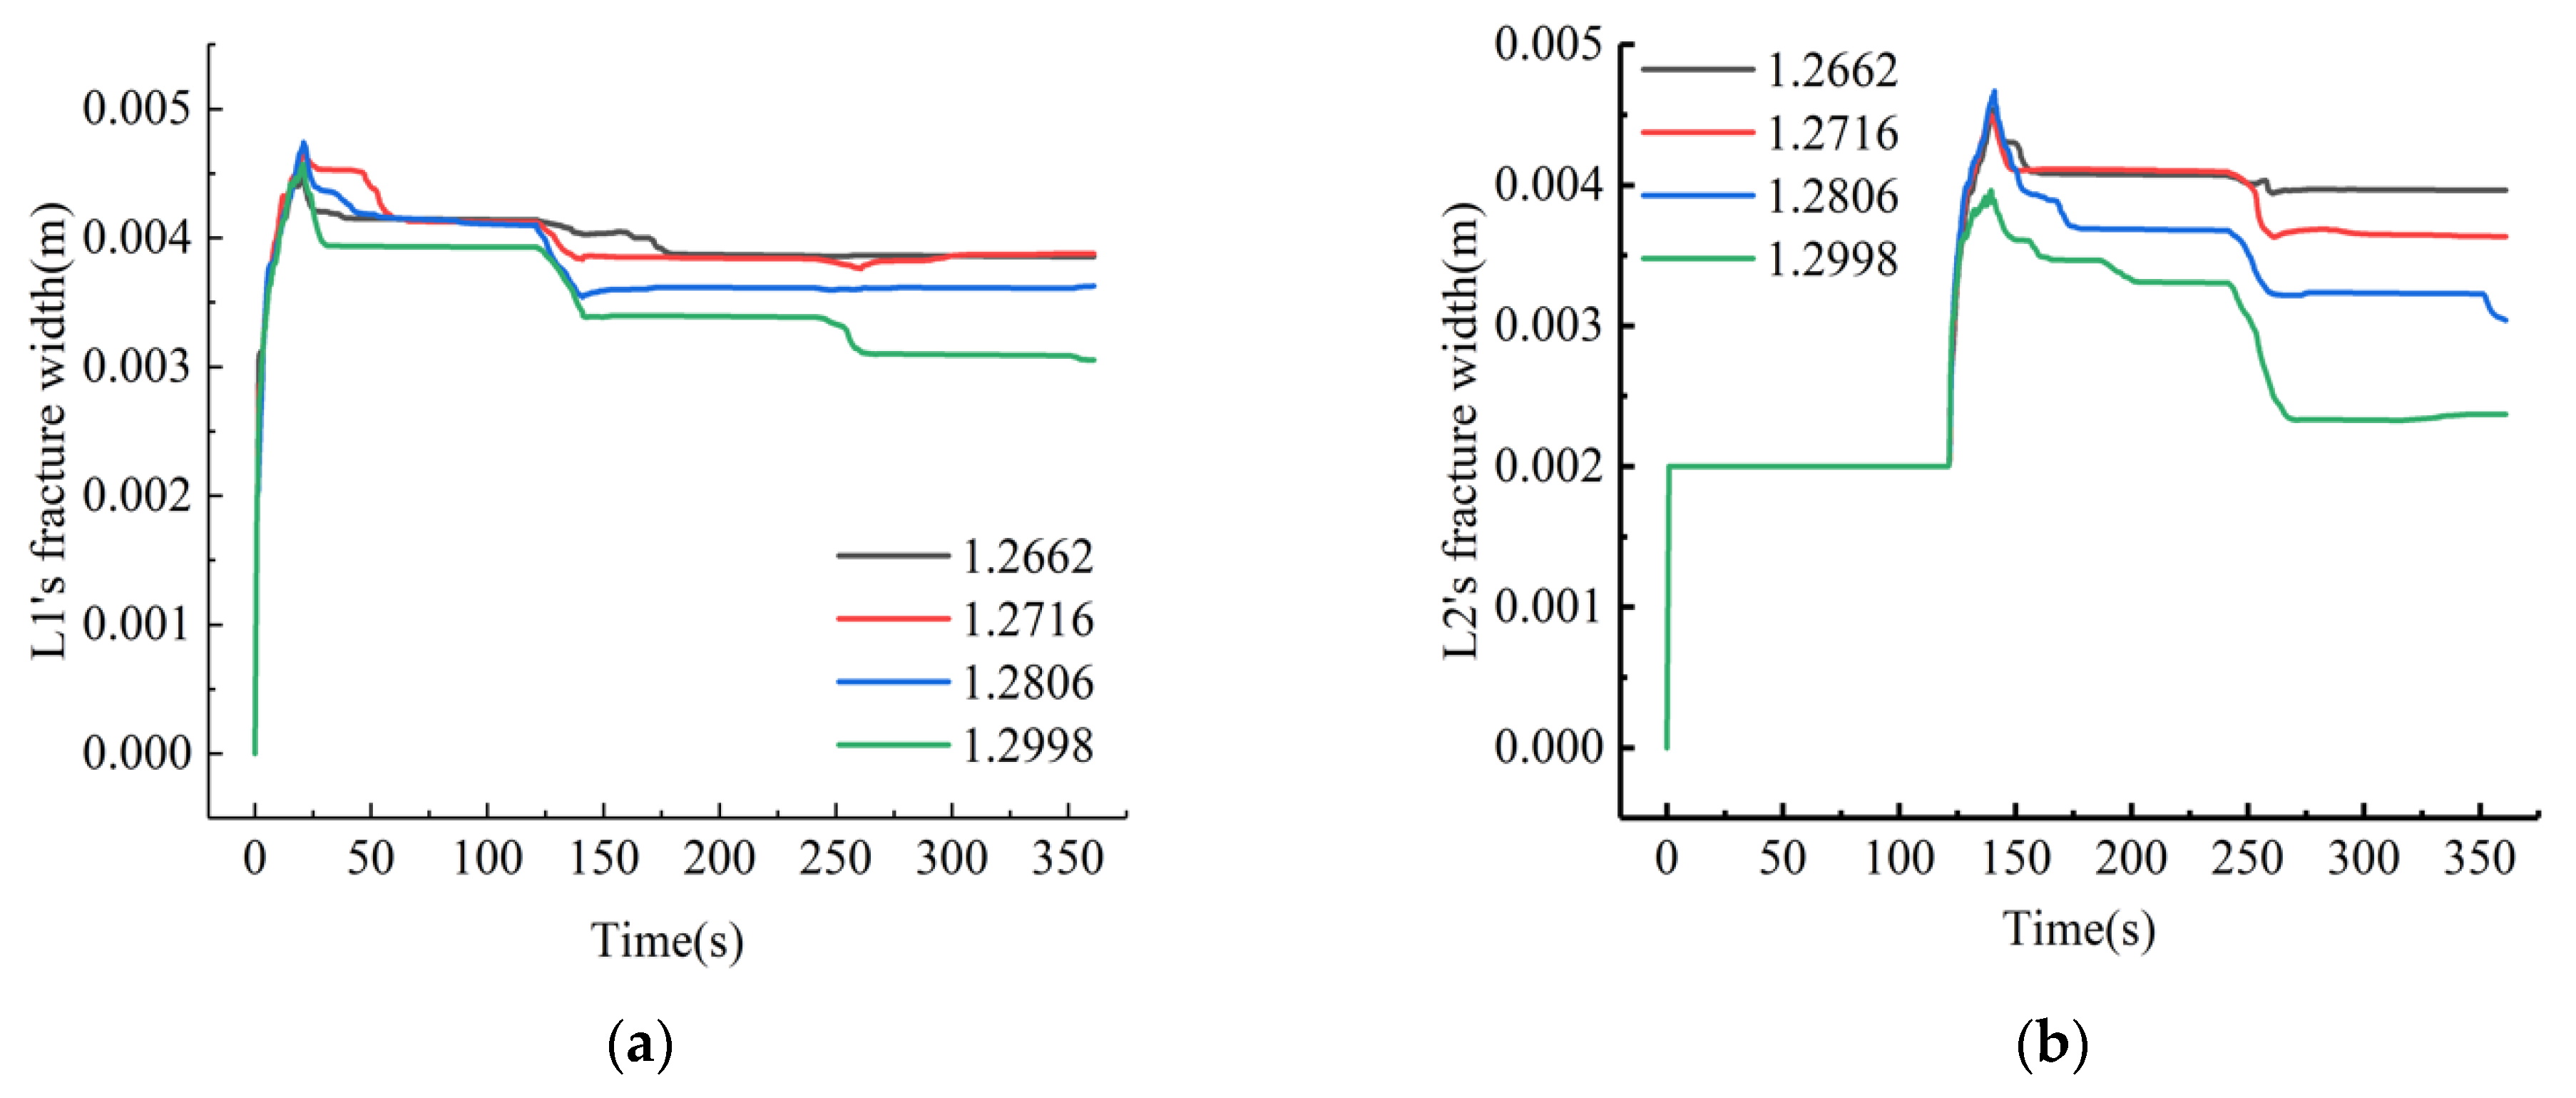
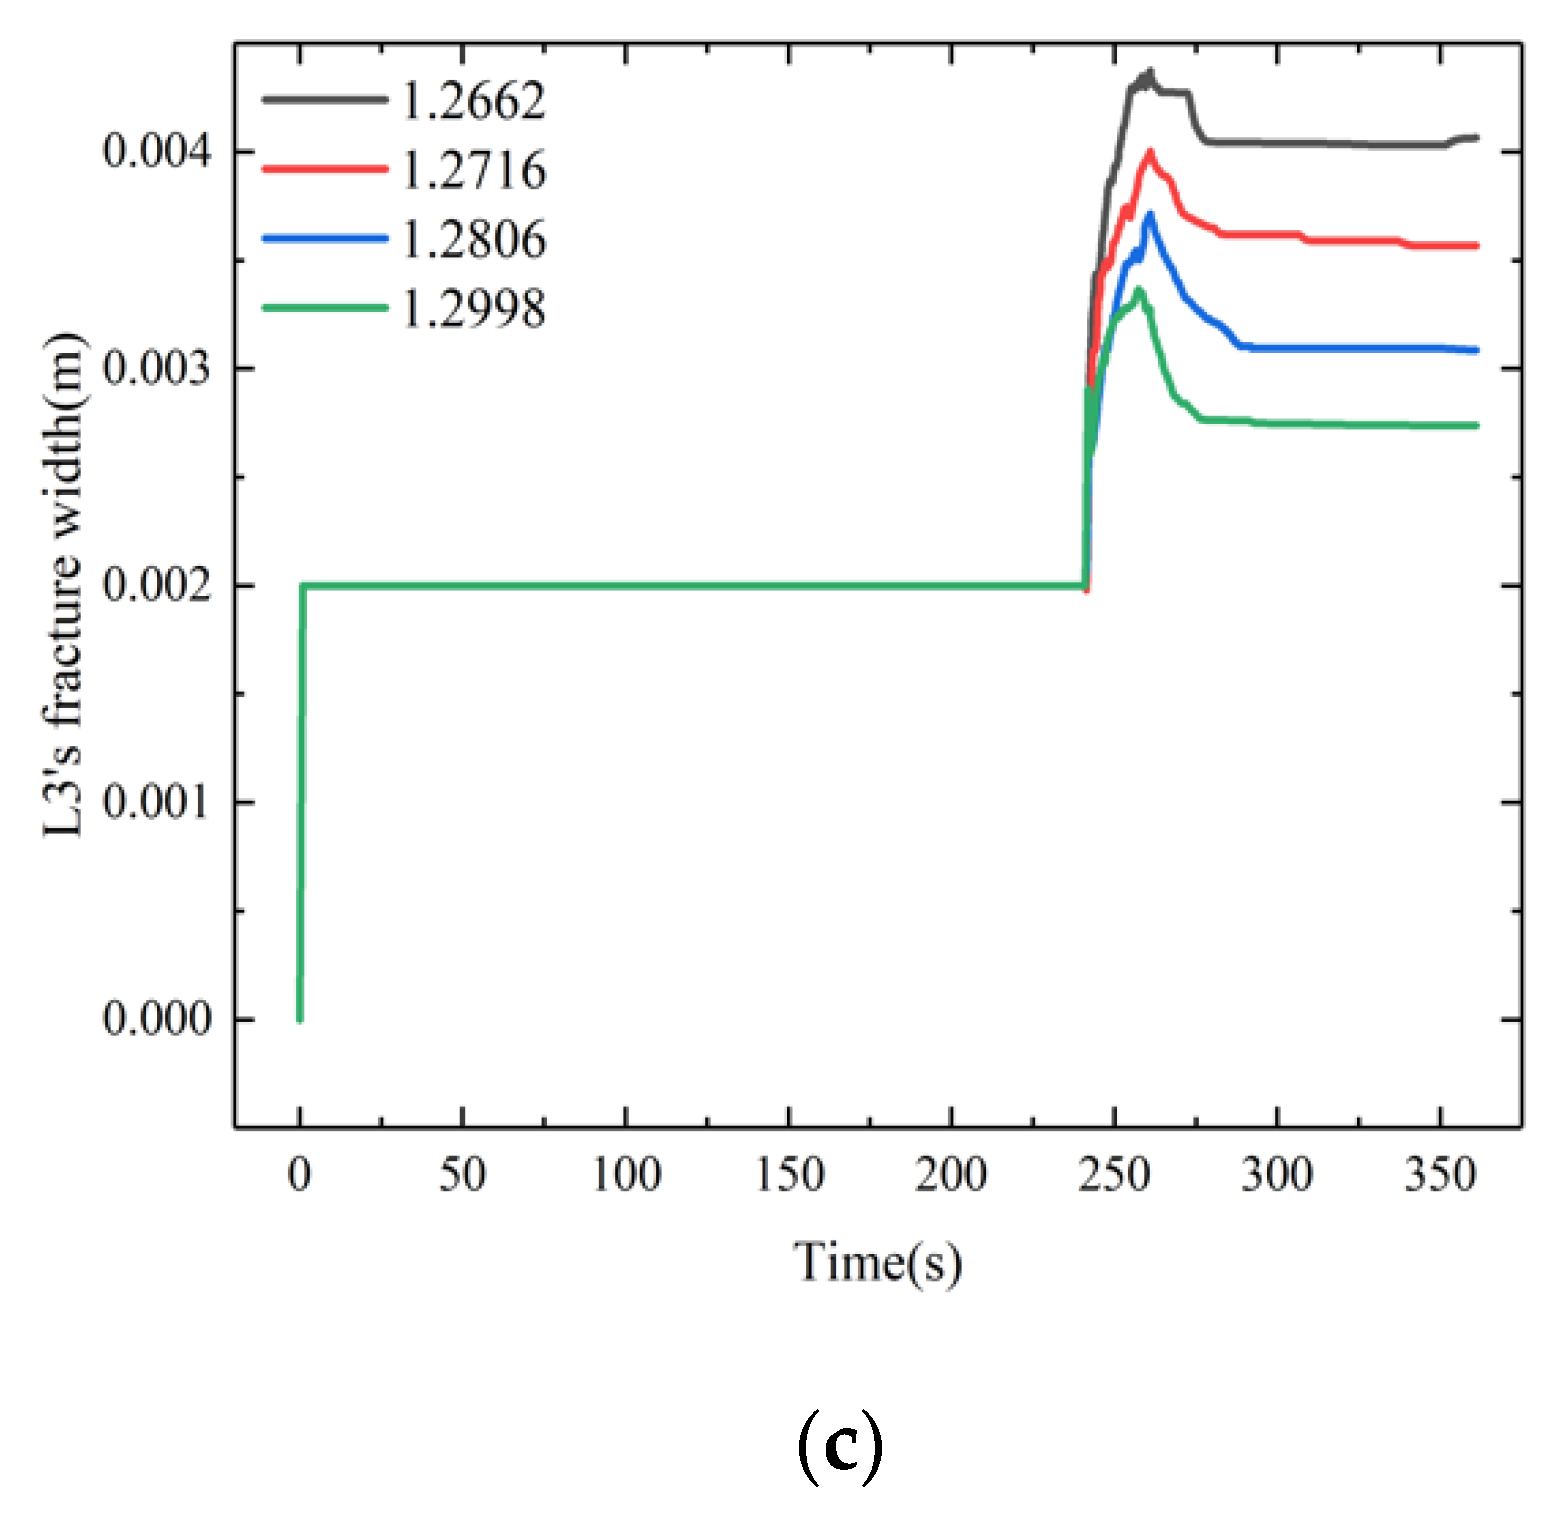
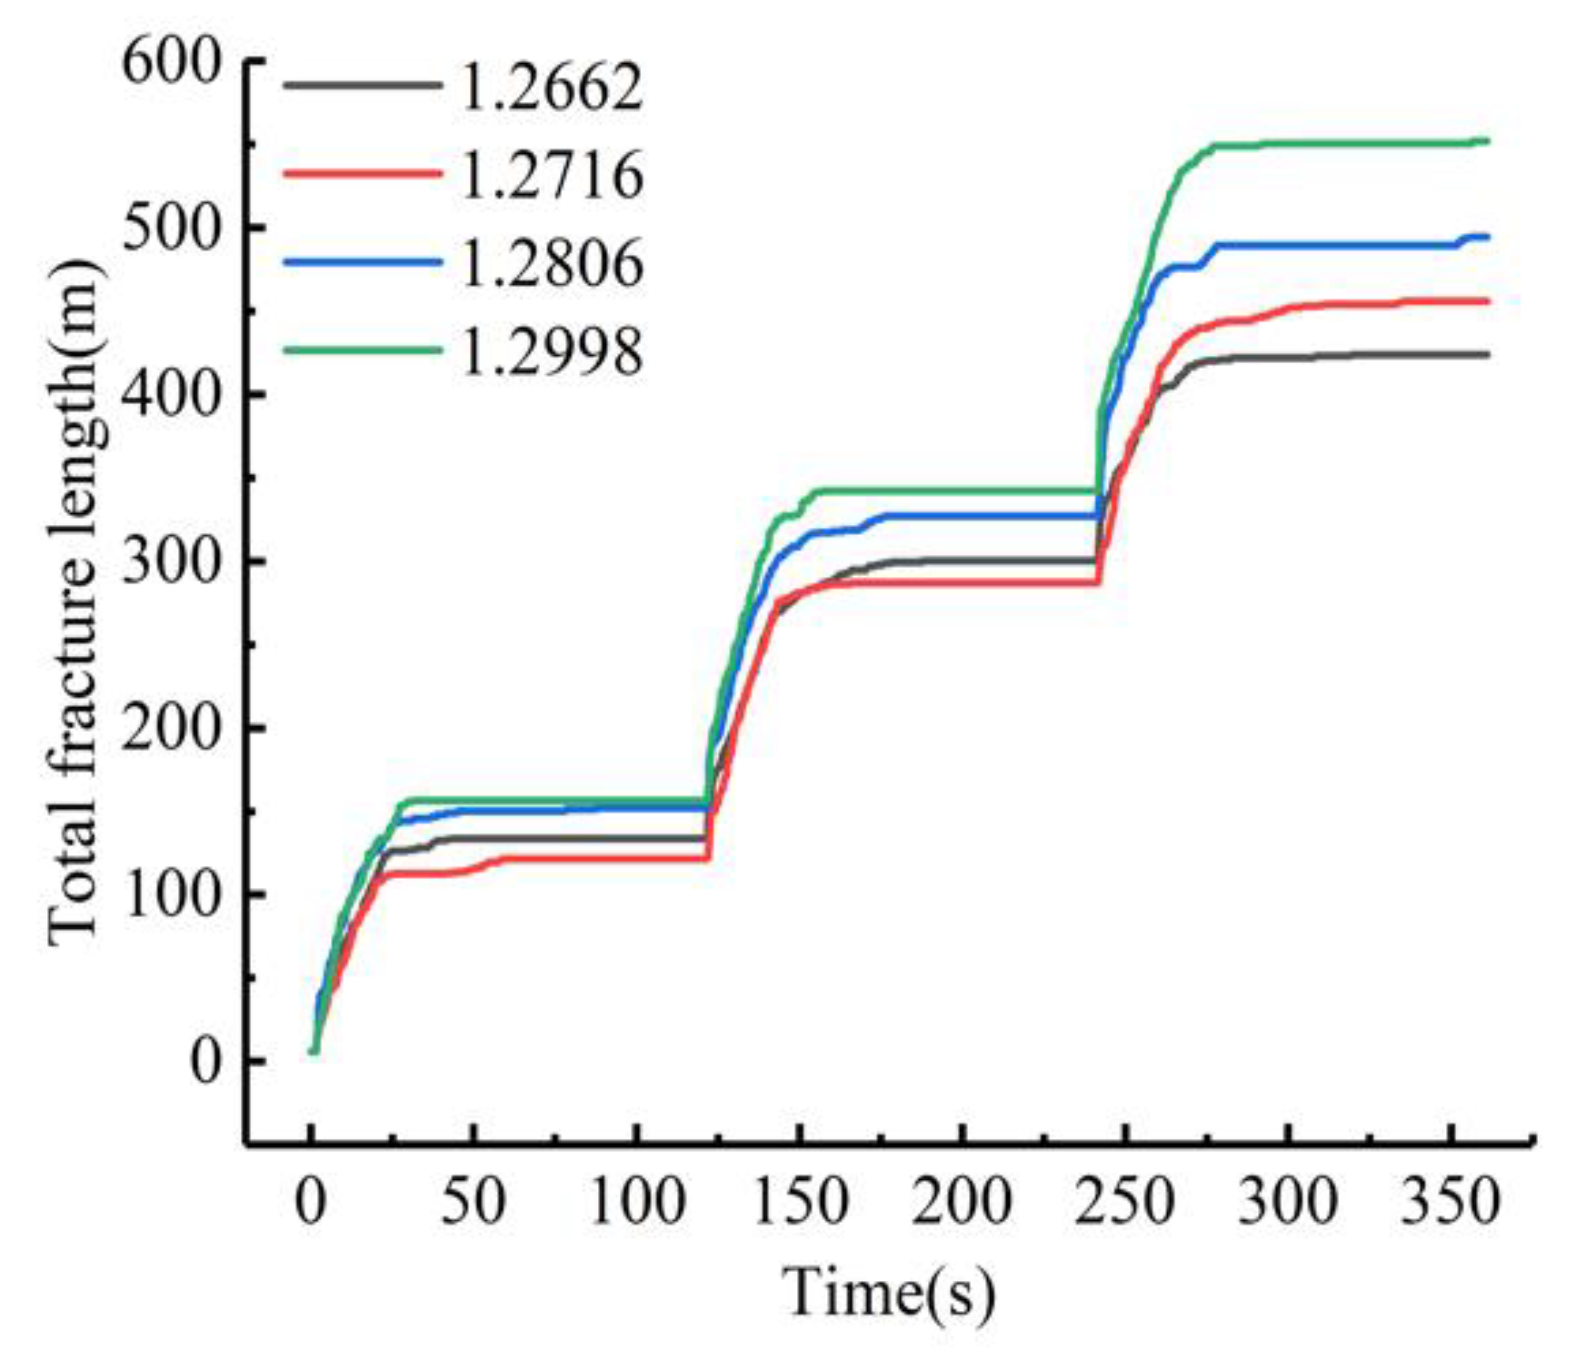
PYTHON is utilized to extract the fracture width and length, which are shown in Figure 11 and Figure 12, respectively. The fractures in the first and second stages of the fracturing pump injection stage are close, as shown in Figure 11. The fracture in the second fracturing section is closed in the third period of fracturing pump injection. The degree of closure of the fracture width in the first and second stages increases with an increasing fractal dimension. This result indicates that the larger the fractal dimension of the natural joints is, the higher the fractal joint density, the closer the communication between hydraulic fractures and natural joints, and the stronger the stress interference between fractures in the process of hydraulic fracture expansion.
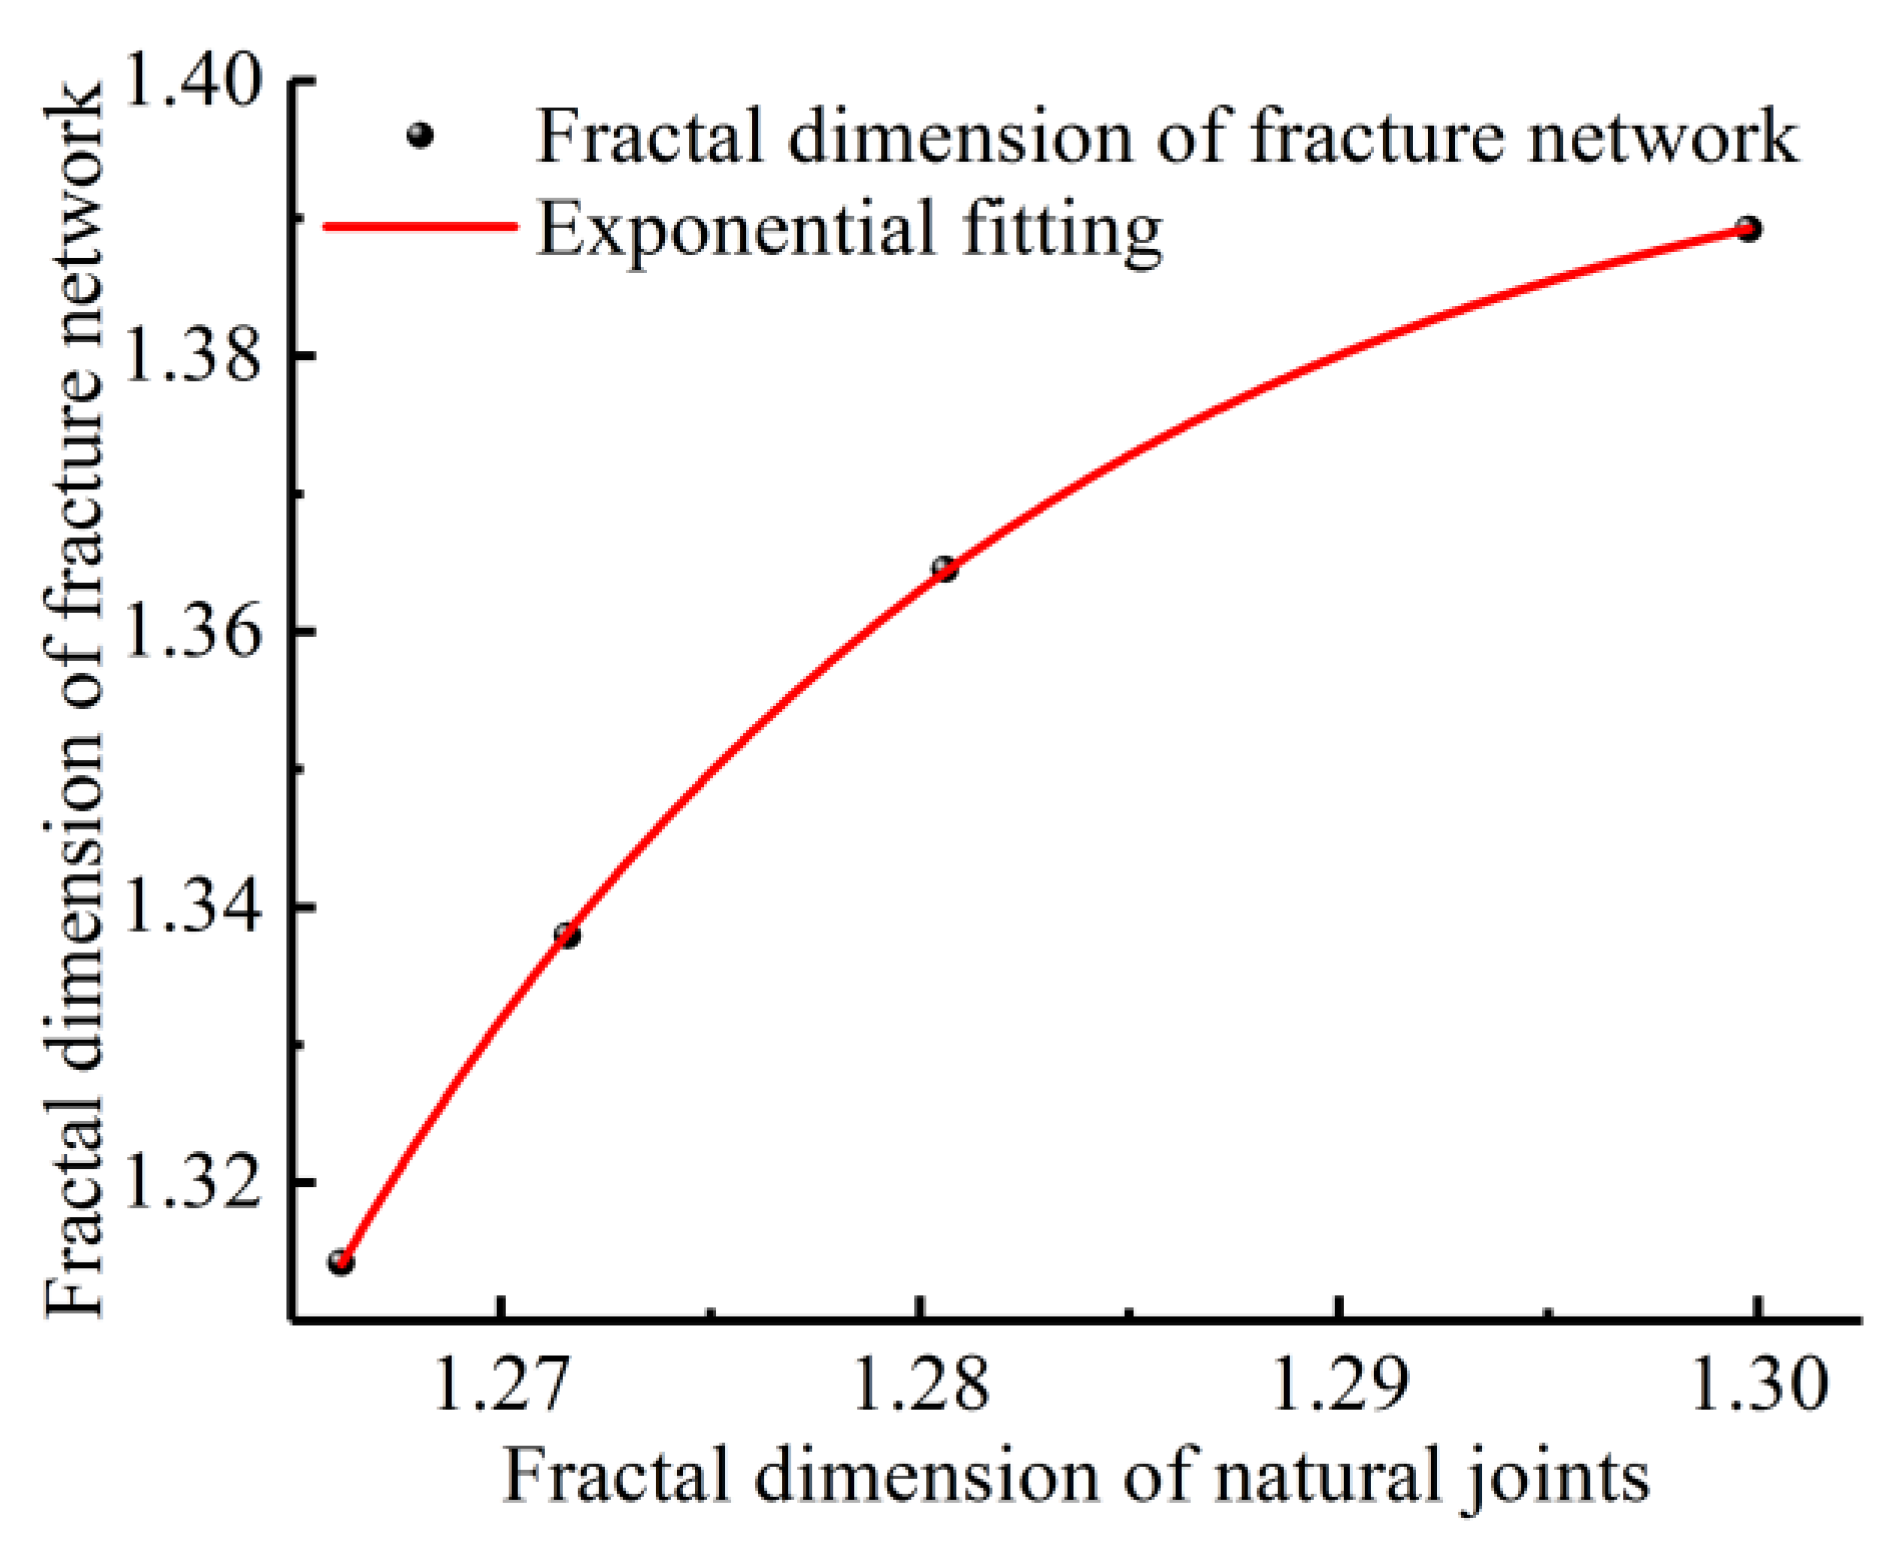
MATLAB is used to binarize the fracture configuration map in Figure 10 and calculate the fractal dimension. The fracture fractal dimension variation curve of the CBM reservoir under various fractal dimensions of the natural joints is obtained, as shown in Figure 13. For the staged fracturing model of CBM reservoirs, the higher the fractal dimensions of the natural joints are, the stronger the interfracture stress interference, the higher the complexity of hydraulic fracture formation, and the higher the fractal dimension of fractures. The relationship between the fractal dimension of the fracture network and the fractal dimensions of the natural joints satisfies the law of negative exponential increase.

4.2. Influence of the Fracturing Fluid Pumping Rate on Fracture Fractal Propagation

When the natural joints and the maximum and minimum horizontal in situ stress are maintained at 45°, the inhomogeneity coefficient of the in situ stress is 1.16. The center trace length of each natural joint is 2 m. The distance between the centers of each joint is 2 m. The fractal dimension of each natural joint is 1.2806. The fracture interval is 30 m. The calculated fracturing fluid pumping rates are 0.18 m3·min−1, 0.24 m3·min−1, 0.3 m3·min−1, and 0.36 m3·min−1.
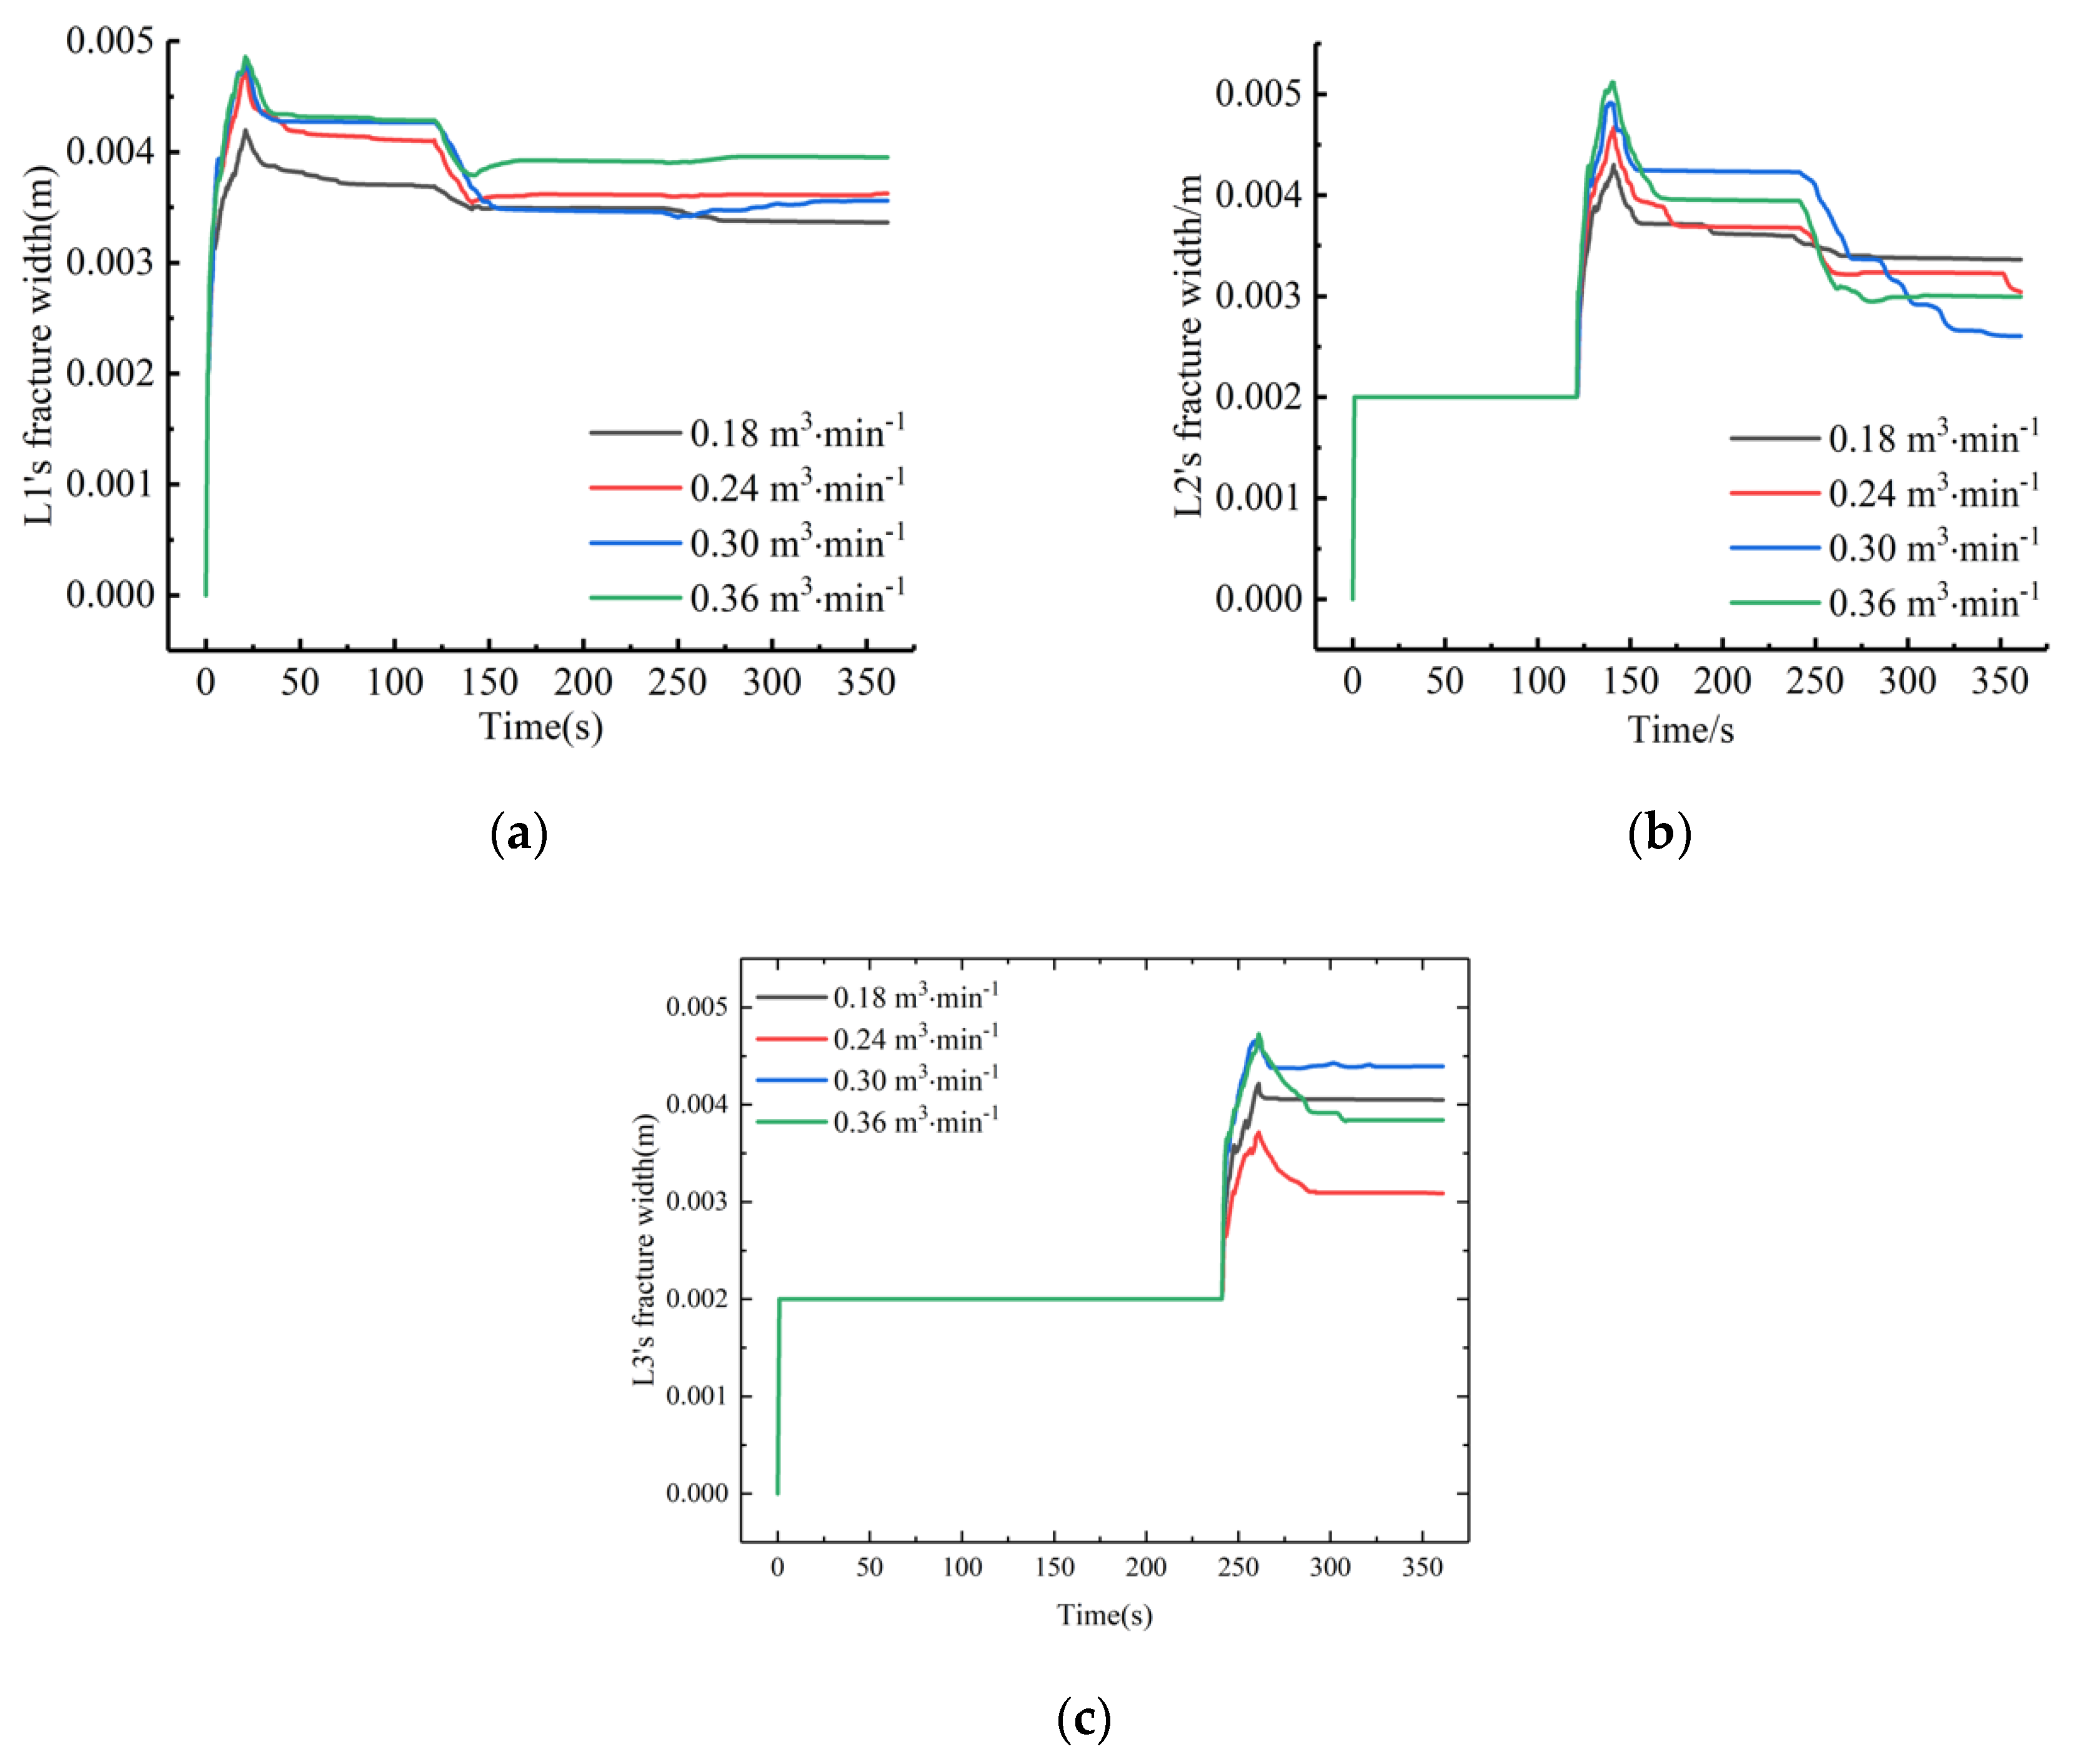
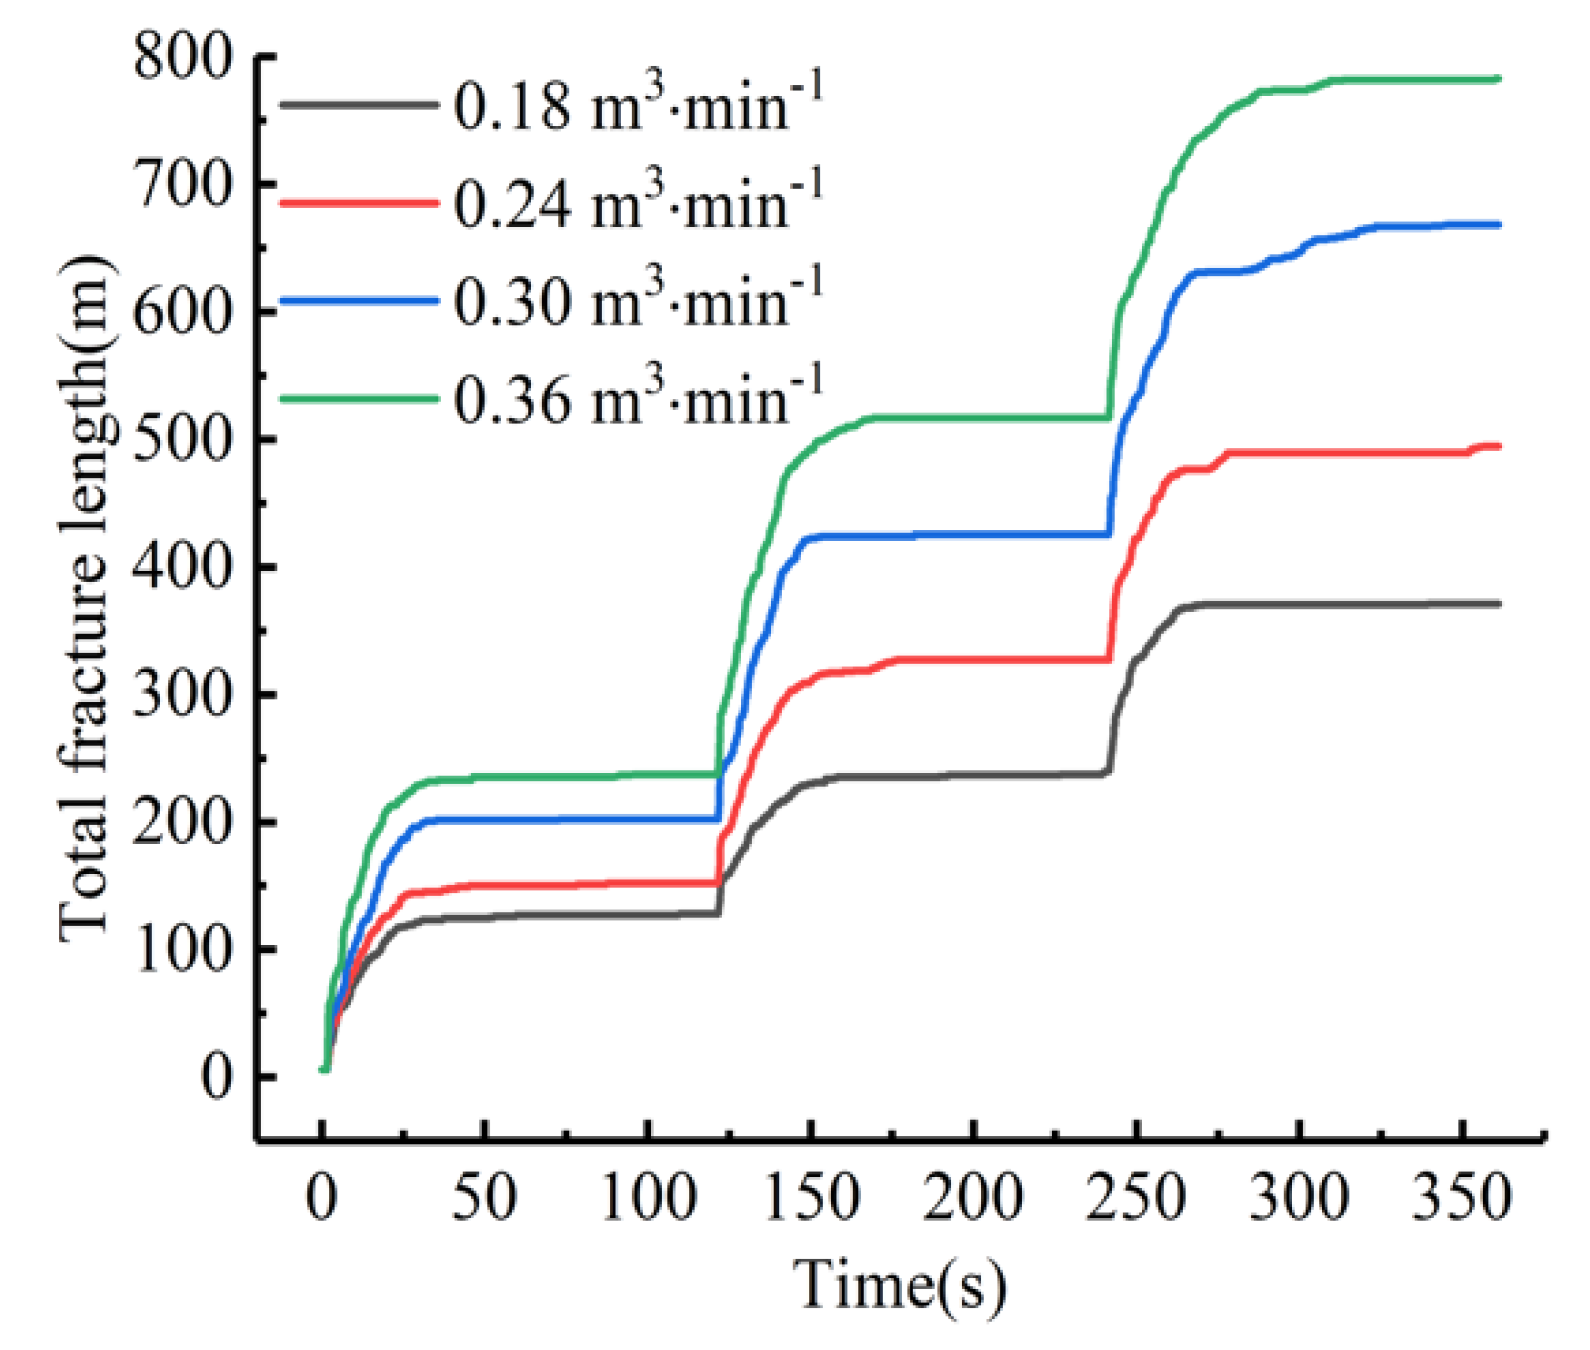
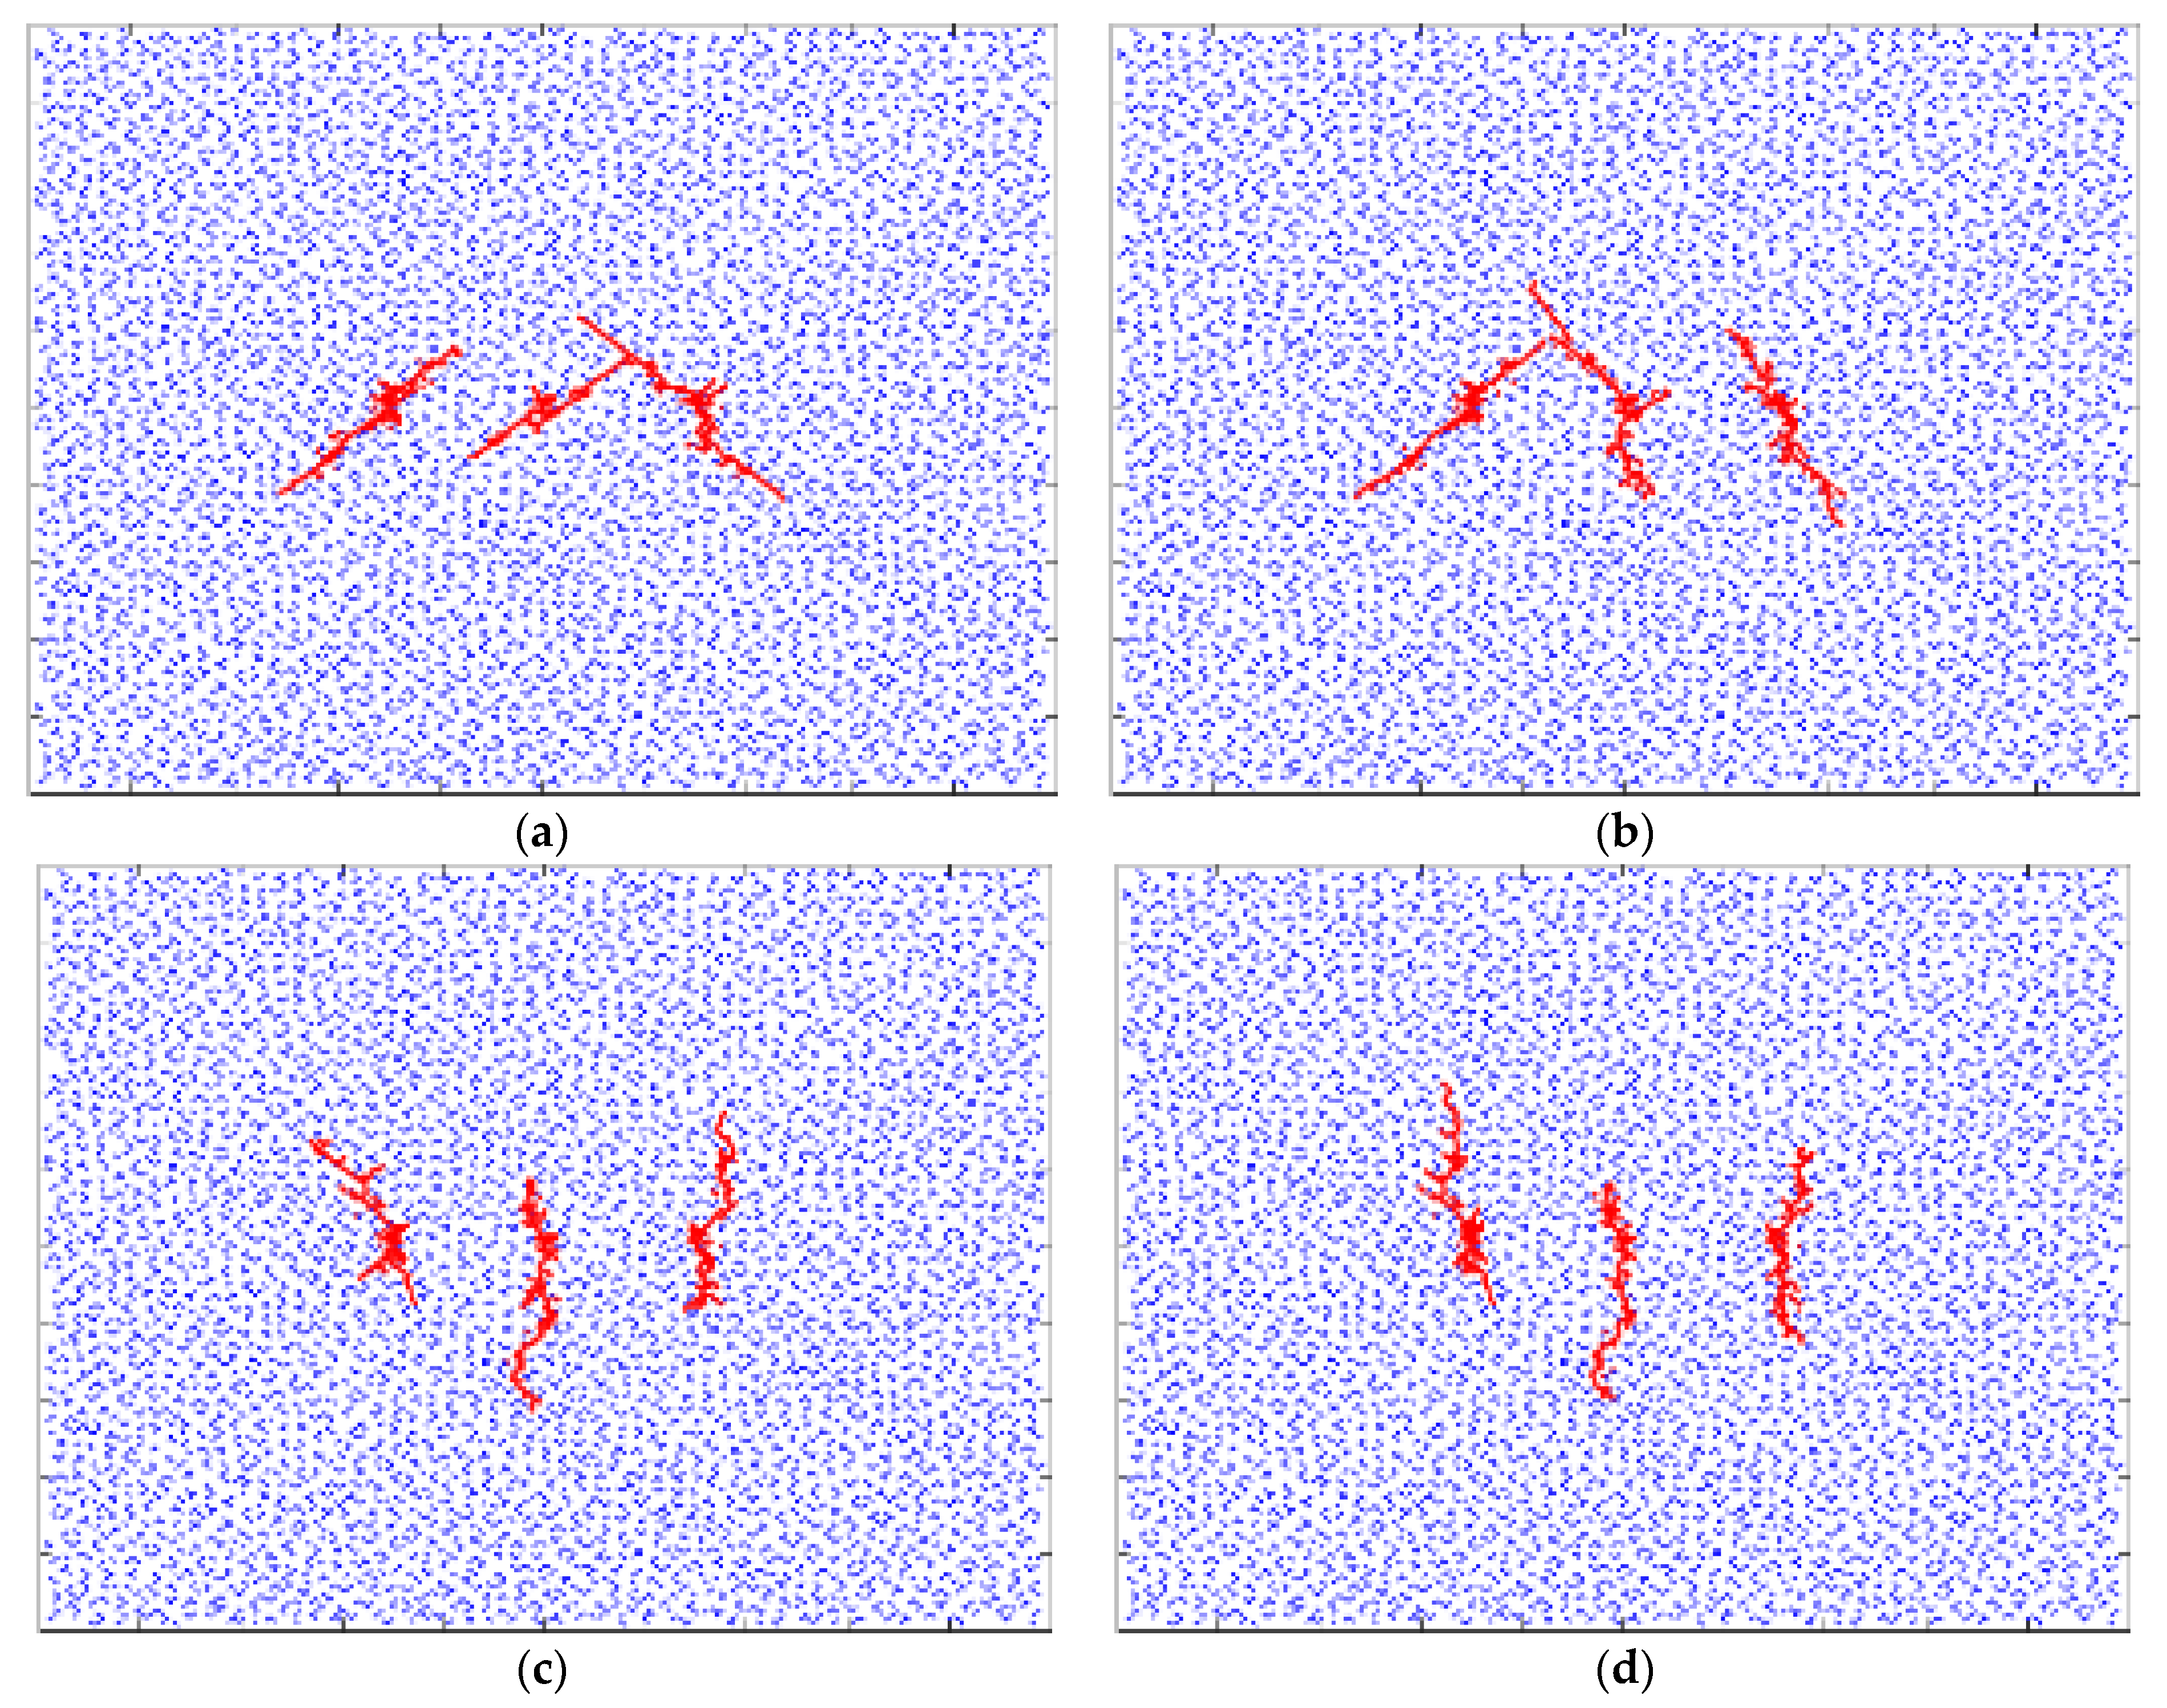
Using the FEM platform to calculate the fracture information during the fracture propagation process and postprocessing the data using PYTHON, the fracture configuration distribution pattern is obtained, as shown in Figure 14, along with the influences of the fracture width, length, and displacement, which are shown in Figure 15 and Figure 16.
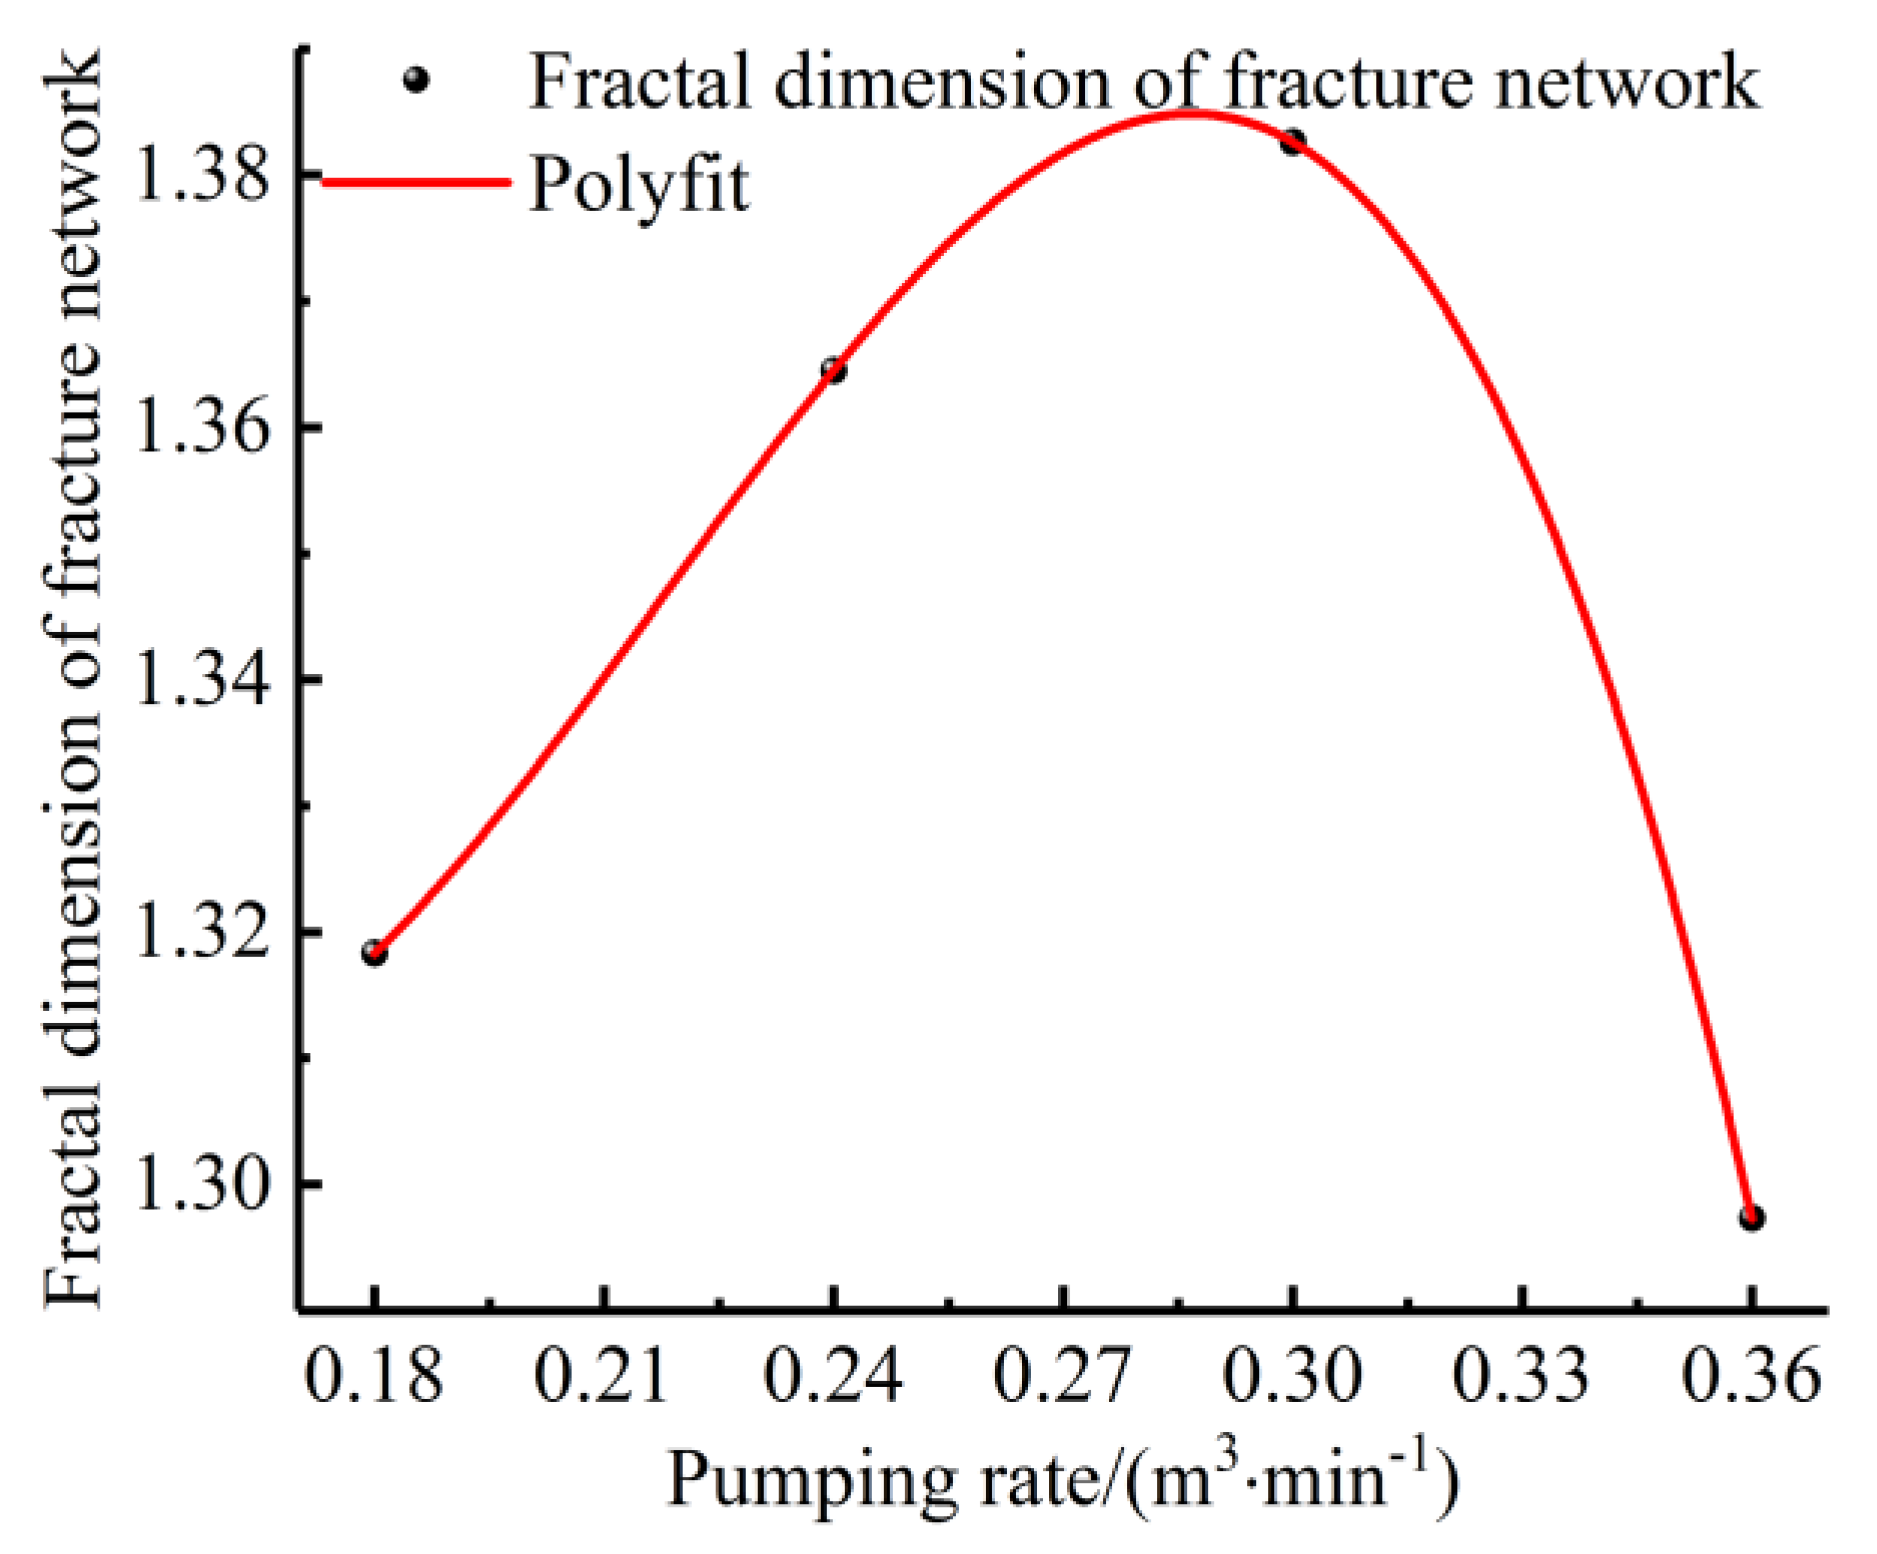
Figure 13 shows that at fracturing fluid pumping rates of 0.18–0.3 m3·min−1, as the pumping rate increases, the total fracture length and complexity of the fracture also increase accordingly. When the pumping rate increases to 0.36 m3·min−1, the total fracture length further increases, while the complexity of the fracture decreases. This result shows that relatively high pumping rates make it easier for fractures to expand along the direction of the dominant fracture, while the interaction between fractures and natural joints in the near-well area and the development of secondary fractures are relatively reduced.
As shown in Figure 15, the fracture width of the first fracturing section closes in the pumping stage of the second fracturing section and the third fracturing section. The fracture width of the second fracturing section closes at the pumping stage of the third fracturing section. The closure degree of the fracture width of the first and second fracturing sections increases with increasing fracturing fluid pumping rate. The decreasing trend shows that within a range of fracturing fluid pumping rates, with increasing fracturing fluid pumping rate, the intensity of interfracture stress interference continues to increase. However, if the fracturing fluid pumping rate continues to increase, as in the section from 0.3 m3·min−1 to 0.36 m3·min−1, the closure degree of fracture widths in the pumping stage of the first and second fracturing sections does not increase, but rather, it decreases in the following fracturing section. This is because the relatively high fracturing fluid pumping rate makes it easier for fractures to expand along the expansion direction of the dominant fracture length, which leads to weakening of the interfracture stress interference between fractures.
The total fracture length of staged hydraulic fractures in CBM reservoirs increases with an increasing fracturing fluid pumping rate (Figure 16).
Using MATLAB for binary processing, the fracture configuration map is shown in Figure 14. The fractal dimension is calculated, and the fracture fractal dimension variation curve of segmented CBM reservoirs is obtained under various fracturing fluid pumping rates, as shown in Figure 17. For the staged fracturing model of CBM reservoirs, within the fracturing fluid pumping rate range of 0.18–0.3 m3·min−1, the fractal dimension of the fracture network increases as the fracturing fluid pumping rate increases. When the fracturing fluid pumping rate increases to 0.36 m3·min−1, the fractal dimension of the fracture network drops to 1.297. The data in Figure 17 are fitted by polynomial regression.

4.3. Influence of the Inhomogeneity Coefficient of the In Situ Stress on Fracture Fractal Propagation

When the intersection angle between the natural joint and the horizontal in situ stress is maintained at 45°, the pumping rate is 0.24 m3·min−1, the natural joint fractal dimension is 1.2806, and the fracturing interval is 30 m, and the fracture propagation patterns are calculated under in situ stress inhomogeneity coefficients of 1.0, 1.08, 1.16, and 1.24.
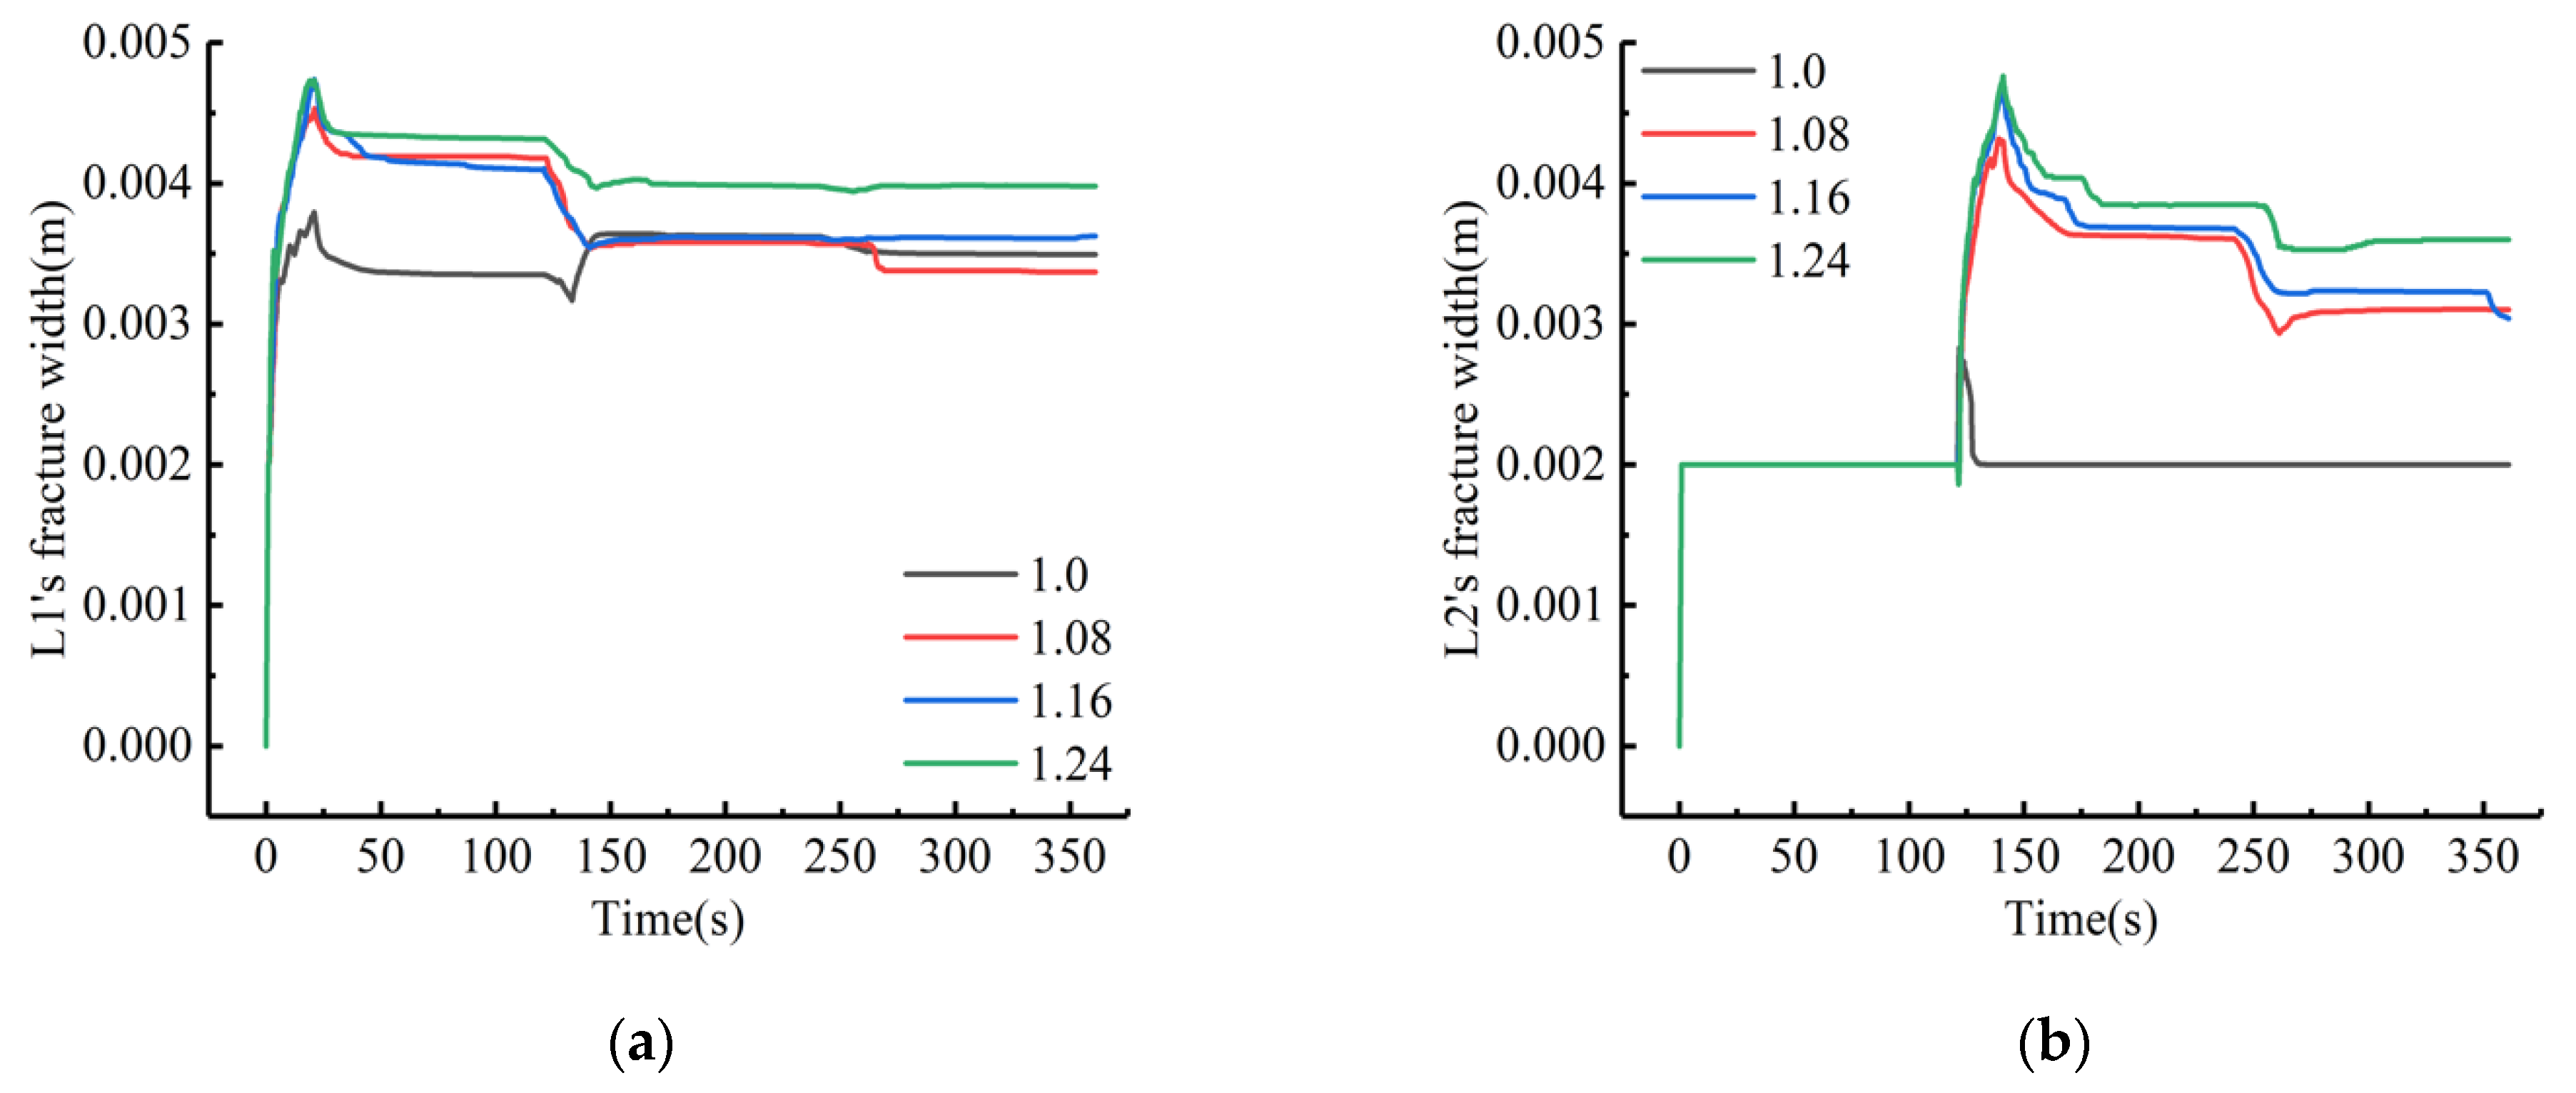
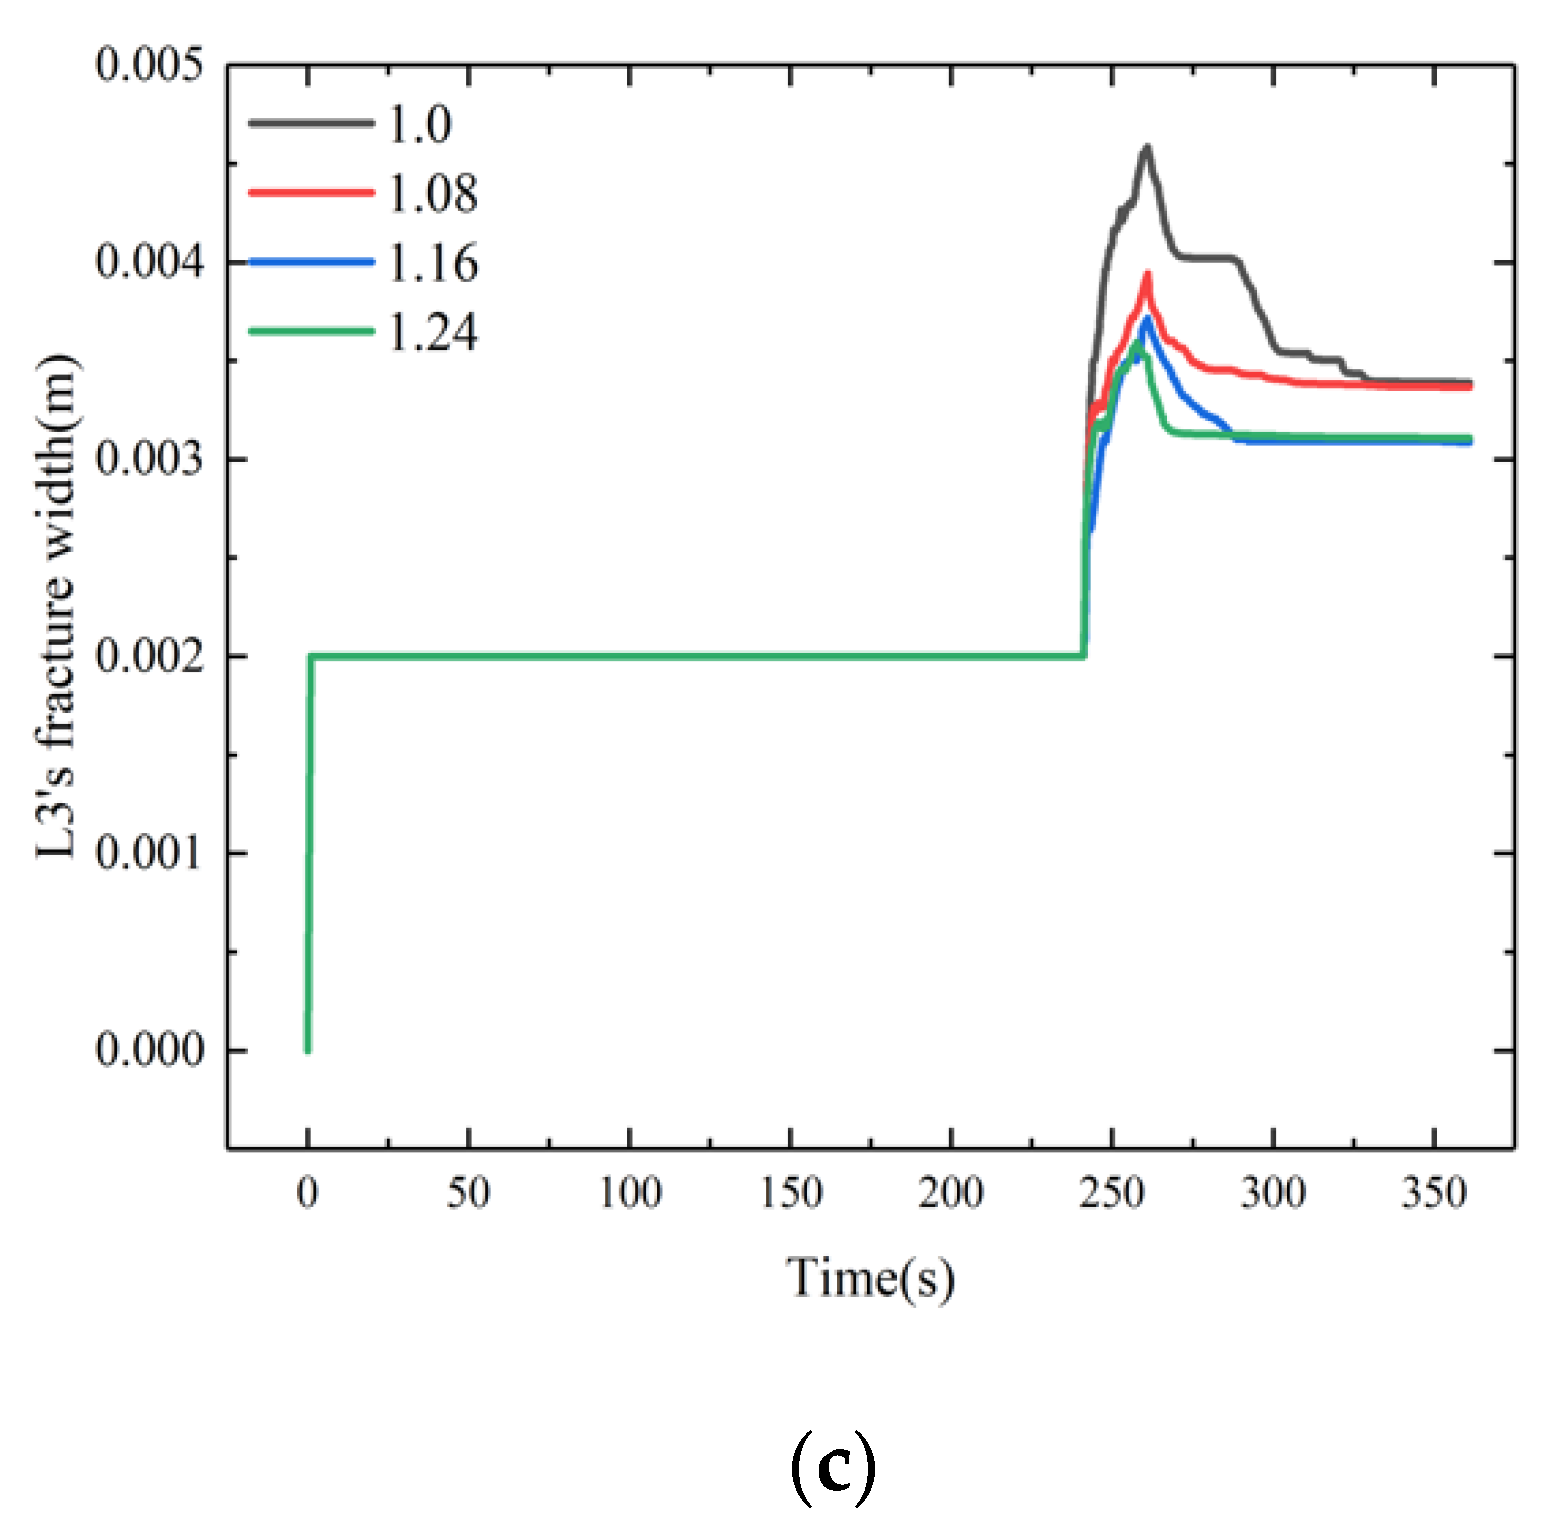
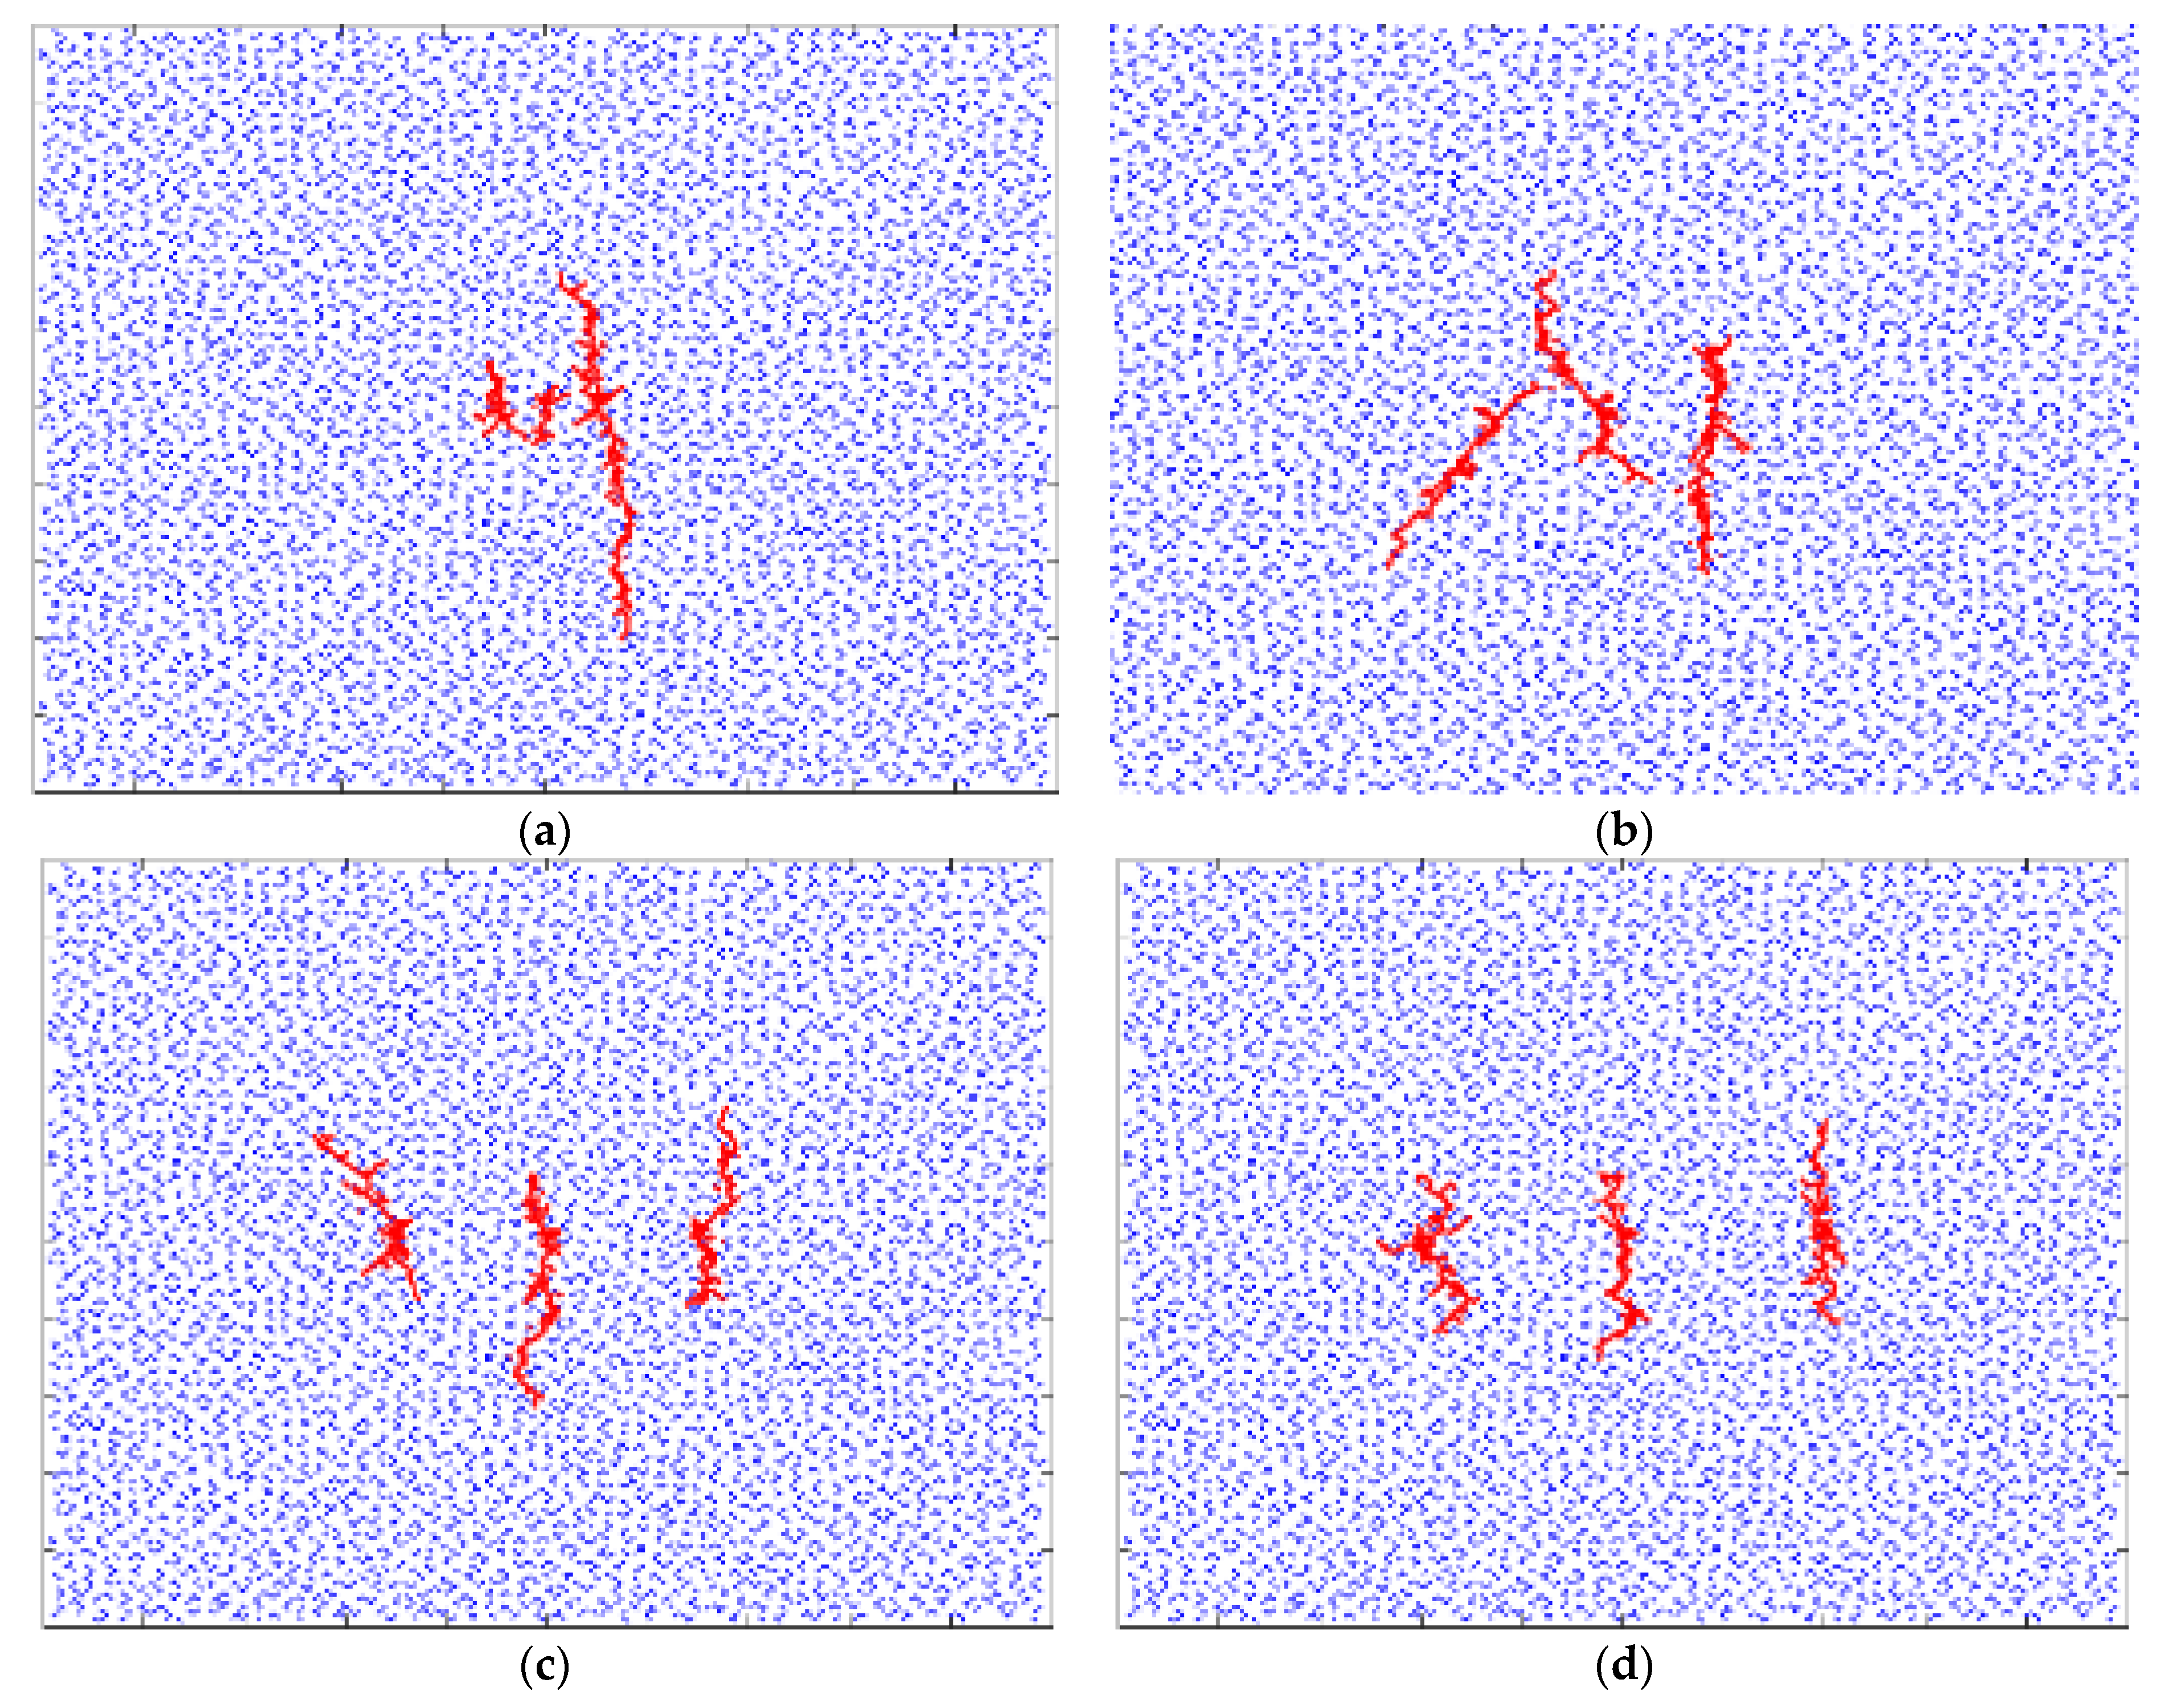
The FEM platform is used to calculate the fracture during the fracture propagation process. PYTHON is used for postprocessing. Then, the fracture configuration pattern is as shown in Figure 18. The variation trends of the fracture width and length with different inhomogeneity coefficients of the in situ stress are shown in Figure 19 and Figure 20, respectively.
Figure 19 shows that consistent with the parameters that were discussed in the previous section, the fracture width of the first fracturing section is closed to different degrees in the pumping stage of the second fracturing section and the third fracturing section. The fracture width of the second fracturing section is closed during the pumping stage of the third fracturing section. Under the condition of a uniform in situ stress field (the inhomogeneity coefficient of the in situ stress is 1.0), the hydraulic fracture of the second fracturing stage communicates with the hydraulic fracture that formed in the first fracturing stage, and they form an interconnected fracture. Therefore, the fracture width of the first fracturing section is closed by interfracture stress interference during the pumping stage of the second fracturing section and increases again when an interconnected fracture is formed. Since the second fracturing section and the first fracturing section formed an interconnected fracture network, during the pumping stoppage stage of the second fracturing section, the pressure is relieved quickly and completely. The fracture width of the second fracturing section is completely closed. There is no further closed space for the fracture width of the second stage of the fracturing section due to the interconnected fracture stress interference of the pumping stage of the third fracturing section. Except for the formation of a connected fracture network in the uniform in situ stress field, the degree of fracture closure in the first and second fracturing sections decreases with the increasing value of the inhomogeneity coefficient of the in situ stress. This result shows that the higher the inhomogeneity coefficient of the in situ stress is, the weaker the interconnected fracture stress interference between fractures, and the easier it is for the fractures to expand along the direction of the maximum principal stress.
Figure 20 shows that, except for the reduction in the total fracture length that is caused by the formation of interconnected fractures in the uniform in situ stress field, with the increasing value of the inhomogeneity coefficient of the in situ stress, the total fracture length remains unchanged.
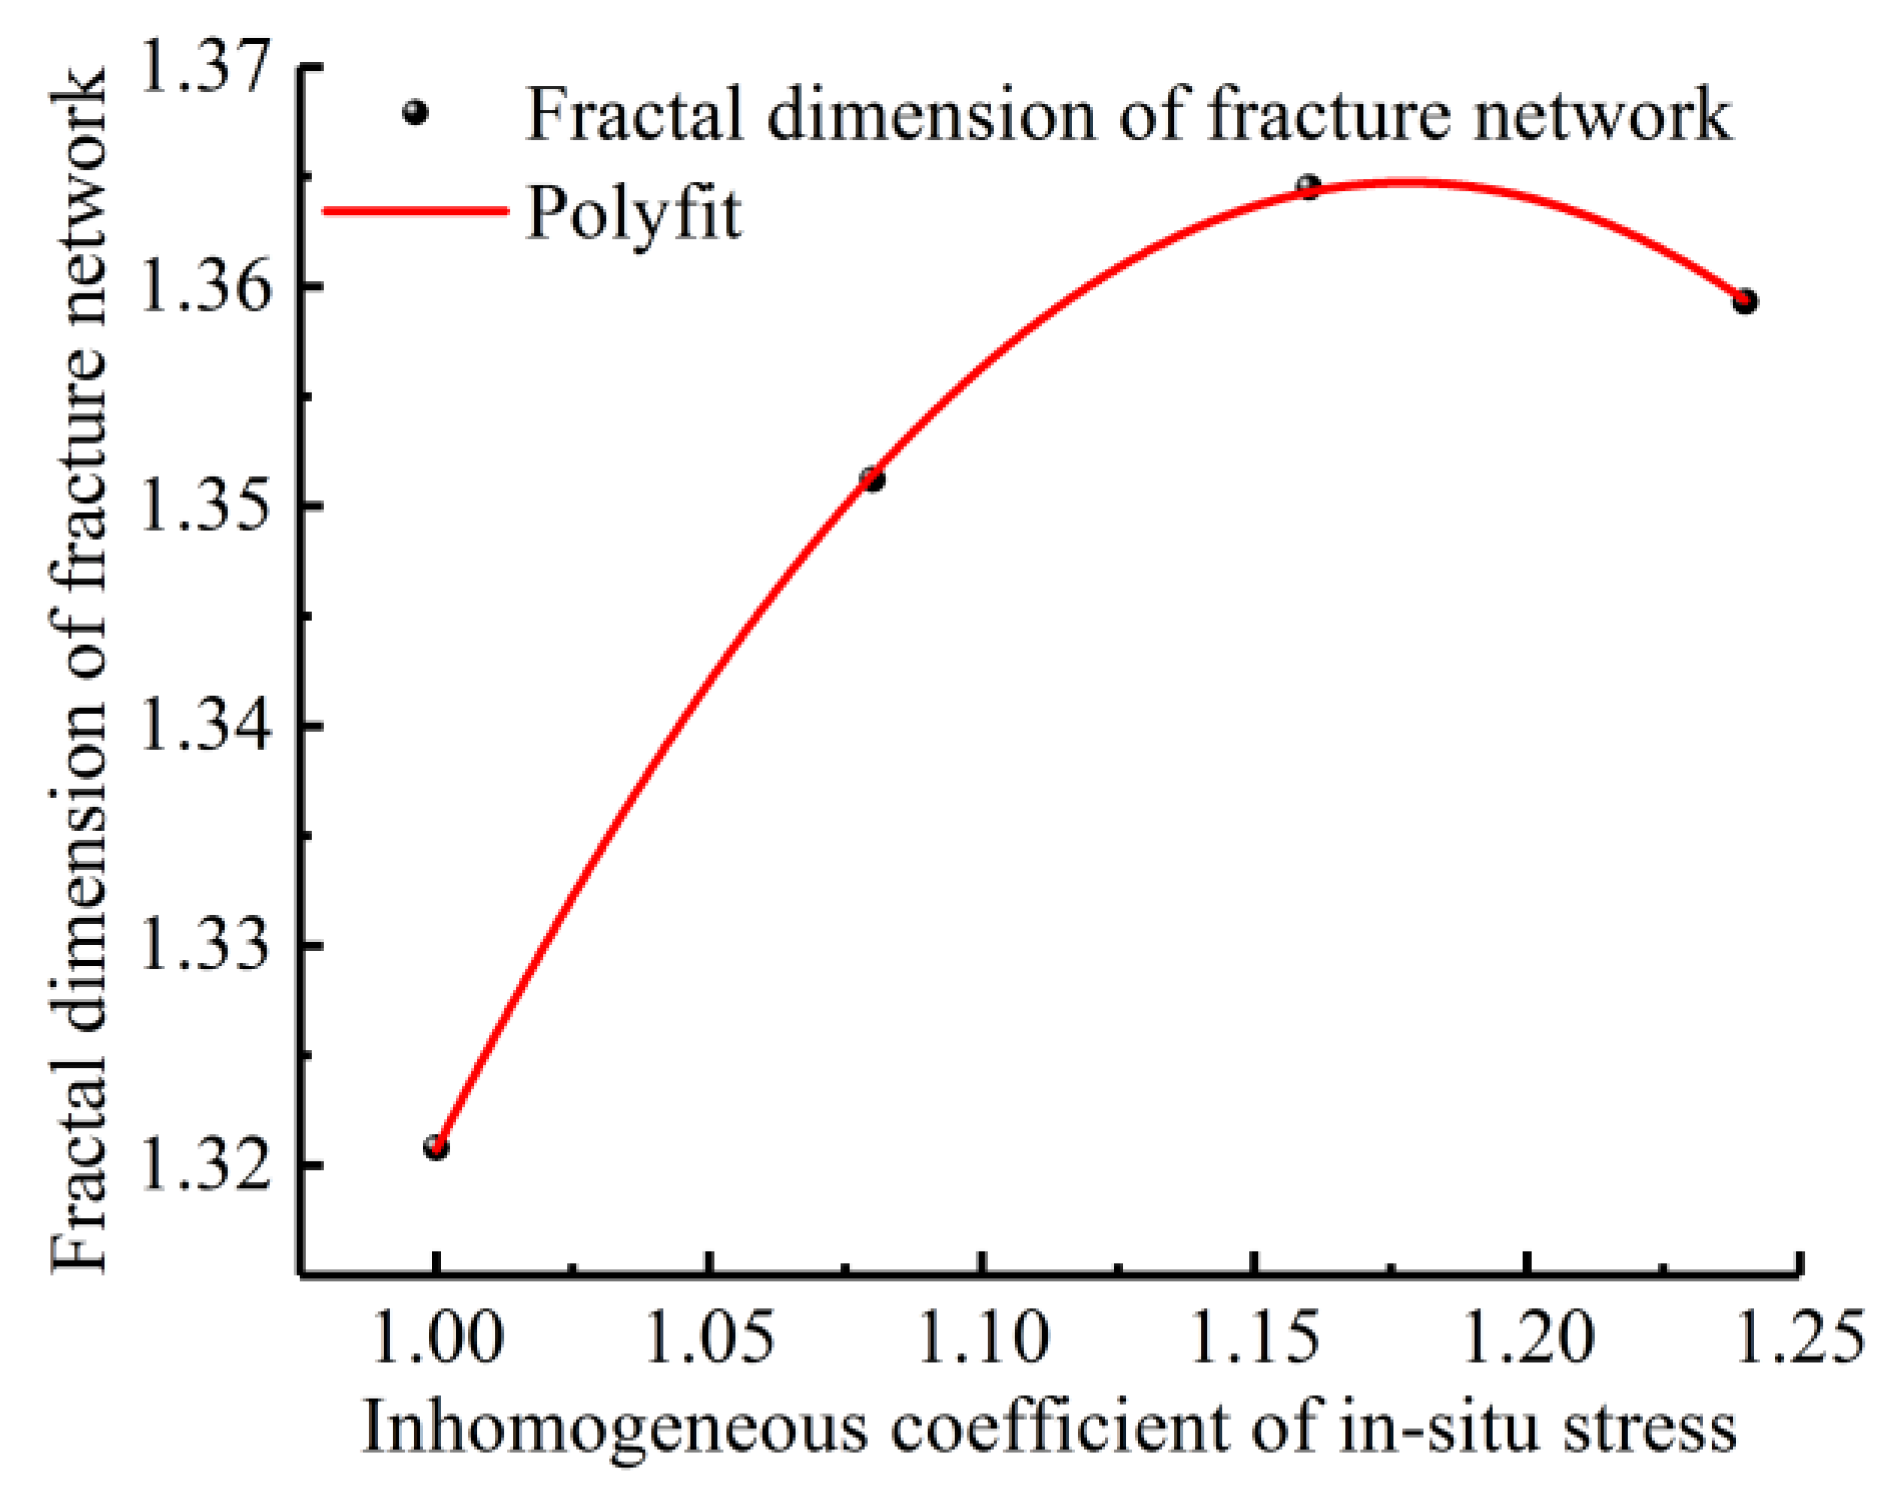
MATLAB is used to binarize the fracture configuration map, as shown in Figure 18, and to calculate the fractal dimension to obtain the fracture fractal dimension variation curve of CBM reservoir segmented fracturing under various values of the inhomogeneity coefficient of the in situ stress, as shown in Figure 21.
For the staged fracturing model of CBM reservoirs, the values of the inhomogeneity coefficient of the in situ stress are in the range of 1.0–1.16, and the fractal dimension of the formed fracture network increases with the increasing inhomogeneity coefficient of the in the situ stress field.
This is because when the inhomogeneity coefficient of the in situ stress field is small, especially under the condition of a uniform in situ stress field (the approximation angles of the fractures in this model are the same as those of the two groups of natural joints because the natural joints in this section are generated by the Monte Carlo stochastic method and have the characteristics of a fractal distribution). The two preferred joint directions for fracture propagation are random, and the fractures easily expand along the direction of the dominant joint. With the increase in the inhomogeneity coefficient of the in situ stress, the fractures expand along the joints while gradually approaching the direction of the maximum principal stress. In this process, the degree of development of branch fractures gradually increases, which results in a gradual increase in the fractal dimension of the fractures, as shown in Figure 18. When the inhomogeneity coefficient of the in situ stress increases to a high value, the fractures mainly expand along the direction of the maximum principal stress and form “narrow and long fractures”. The development of branch fractures is reduced. The fractal dimension of the fractures is also reduced. Thus, the fractal dimension of the formed fracture network initially increases and then subsequently decreases with the increase in the inhomogeneity coefficient of the in situ stress.

4.4. The Influence of Fracturing Interval Spacing on Fracture Fractal Propagation

When the intersection angle between the natural joint in the CBM reservoir and the minimum horizontal in situ stress is maintained at 45°, the numerical model is utilized with a pumping rate of 0.24 m3·min−1, a natural joint fractal dimension of 1.2806, and an in situ stress nonuniformity coefficient of 1.16. Then, the fracture propagation rules at fracturing intervals of 10 m, 20 m, 30 m, and 40 m are calculated.
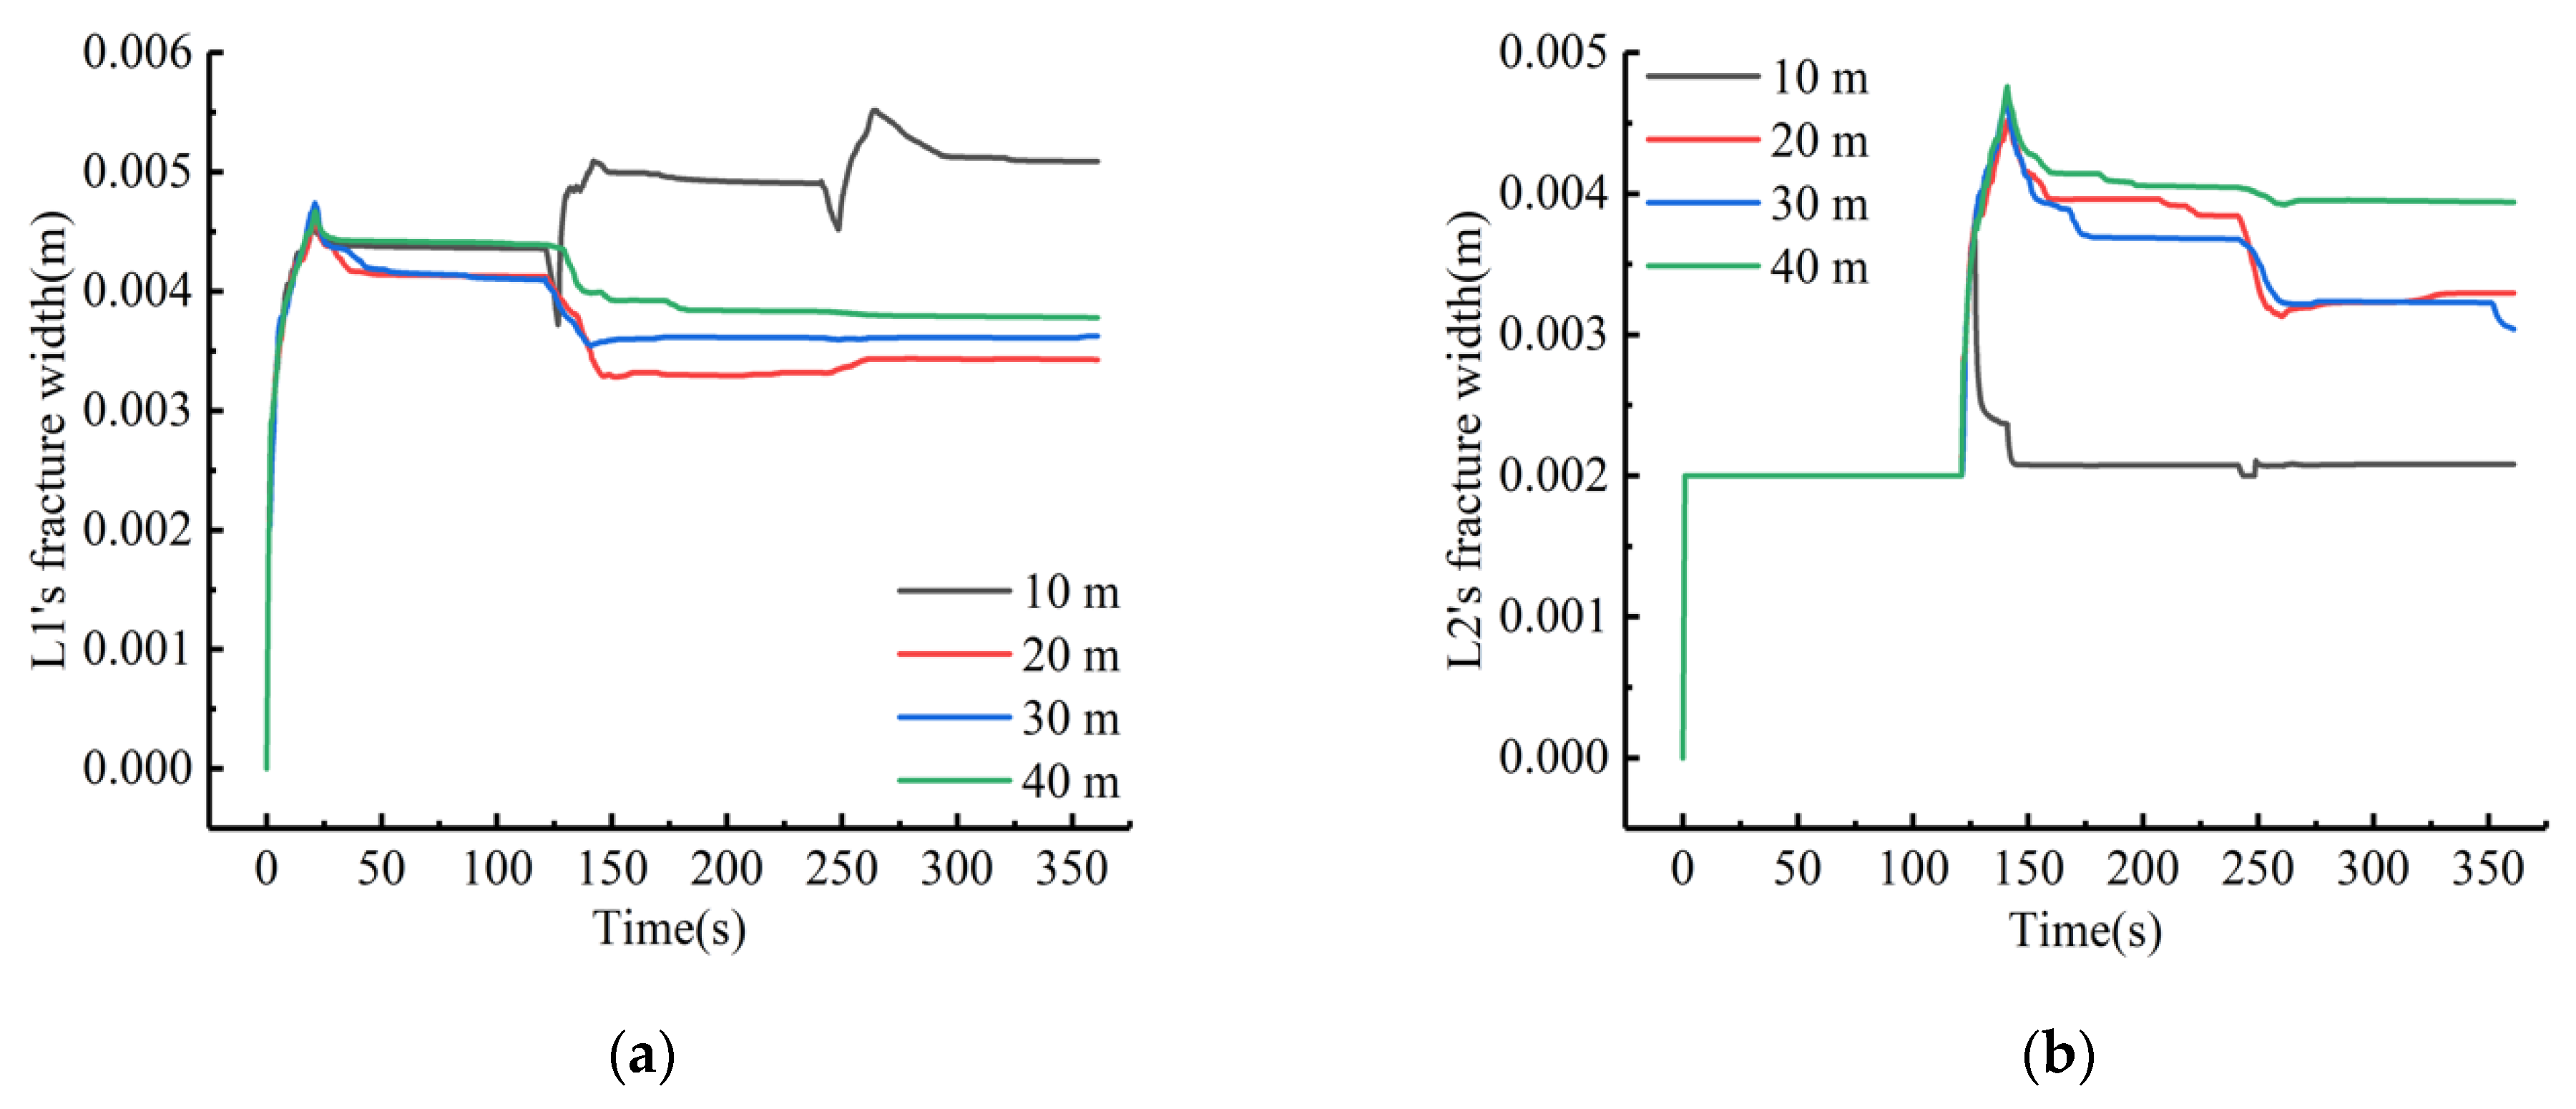
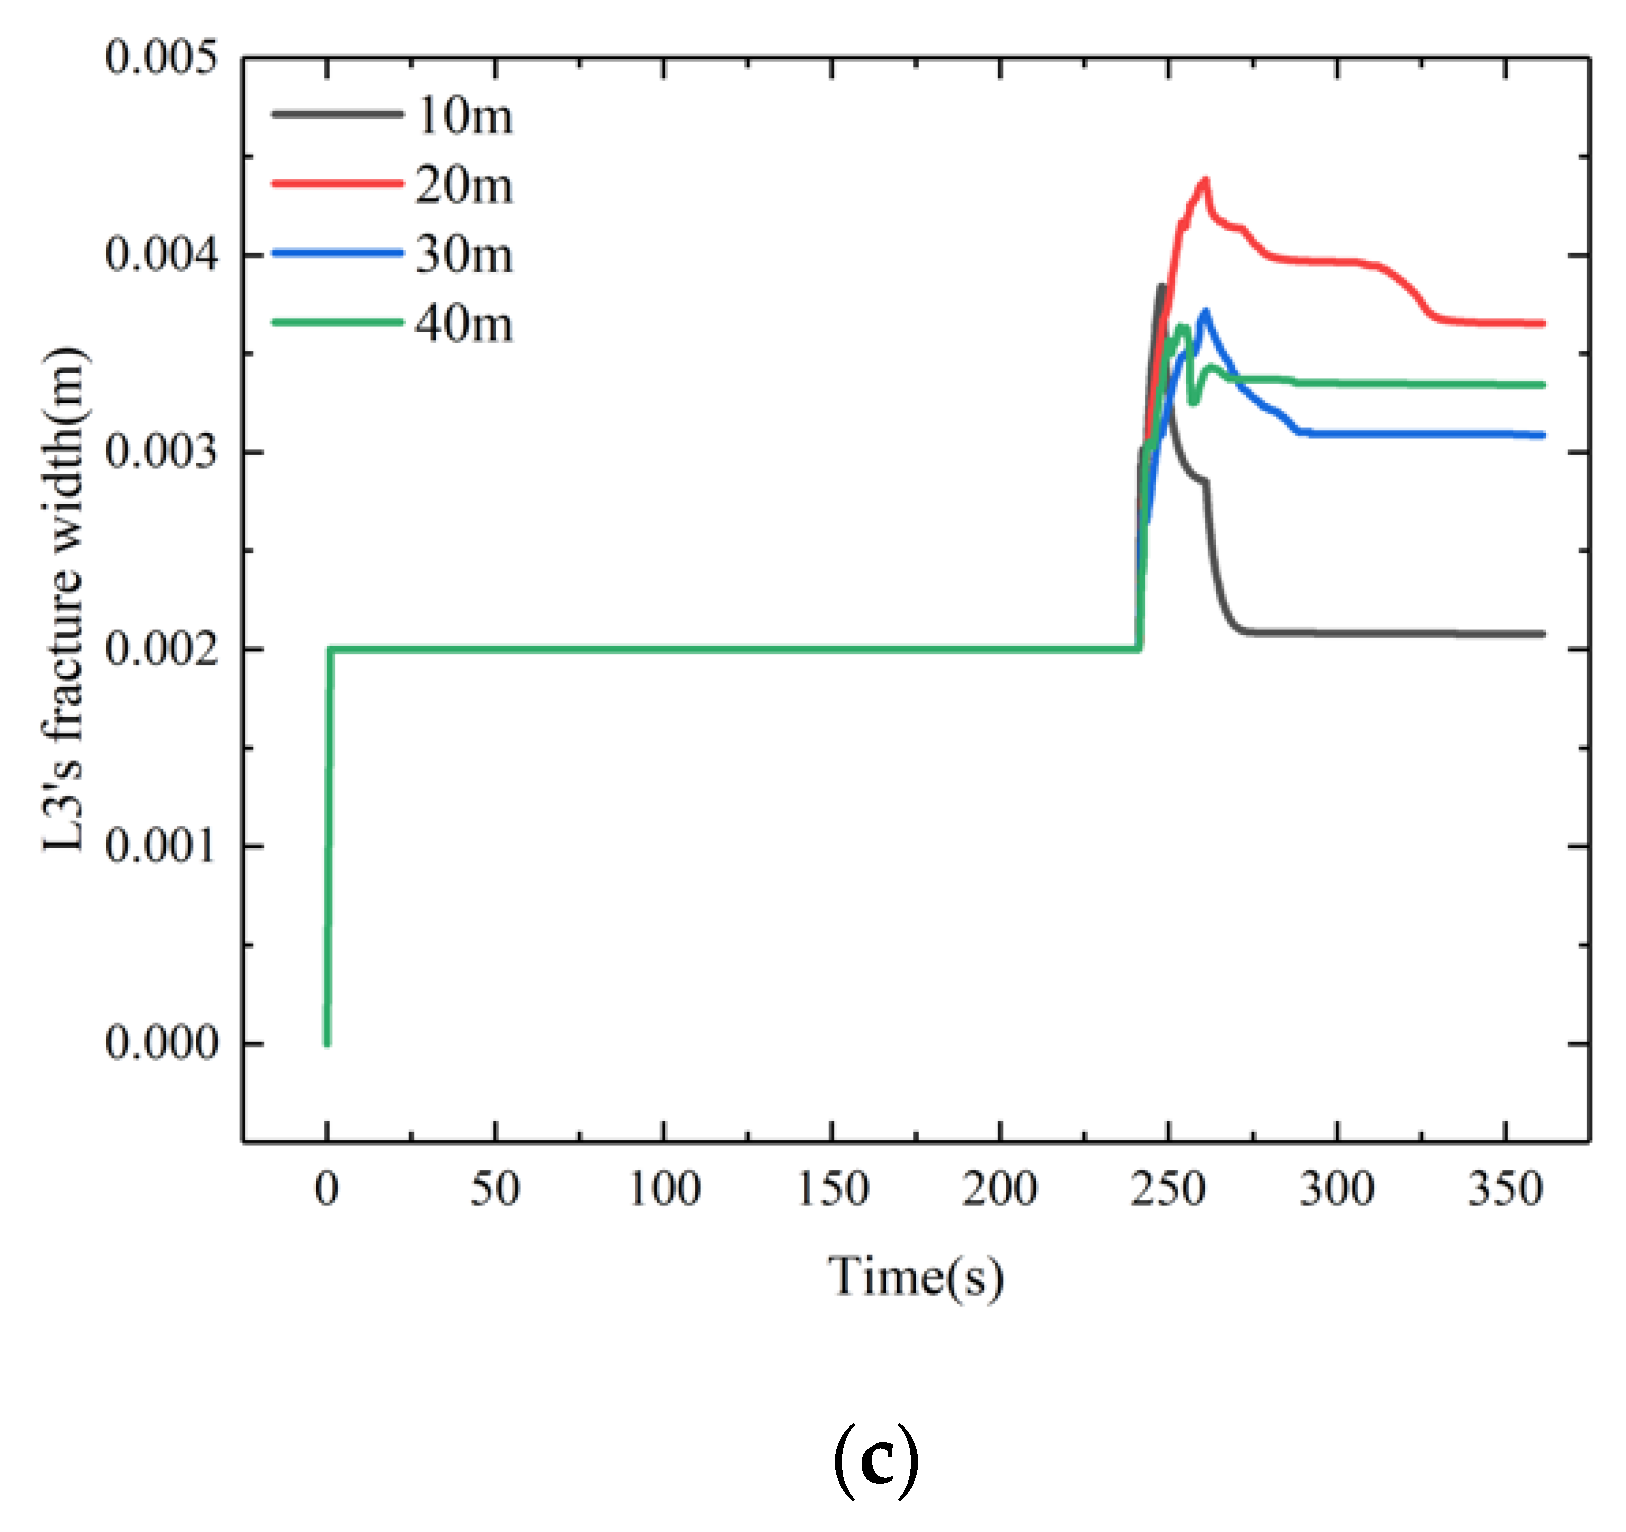
Using the FEM platform to calculate the fracture information during the fracture propagation process and using PYTHON for postprocessing, the fracture configuration distribution patterns are obtained, as shown in Figure 22, and the variation rules of fracture width, fracture length, and fracture interval spacing are determined, as shown in Figure 23, Figure 24 and Figure 25.
Figure 23 shows that the fracture width of the first fracturing section shuts down partially at the pumping stage of the second fracturing section and the third fracturing section. The fracture width of the second fracturing section shuts down partially at the pumping stage of the second fracturing section and the third fracturing section. However, under the condition of a small fracturing section spacing (the fracturing section spacing is 10 m), the fractures of the second fracturing section form with the first fracturing section during the expansion process. The fractures in the third fracturing section interact with the fractures that formed in the second fracturing section during the expansion process, forming a connected fracture network. Thus, a connected fracture network of the natural joint—the first hydraulic fracture, the second hydraulic fracture, and the third hydraulic fracture—is formed. The connected fracture network greatly increases the degree of interaction between natural joints and hydraulic fractures, and the degree of stress interference between fractures is higher. During the fracturing process, once the connection of different hydraulic fractures is formed, the fracturing fluid directly enters the hydraulic fractures of the previous section, which causes the hydraulic fractures of the previous section to expand again. As the fracture network is formed, the first fracturing section expands in the pumping stage of the second fracturing section. During the pumping stage of the third fracturing section, the first fracturing section expands again. Therefore, on the curve of fracture width versus fracturing time, due to the pumping stage of the second and third fracturing sections, the fracture width of the first fracturing section is disturbed by the interfracture stress interference. When the connected fracture network is formed, the fracture width of the first fracturing section is increased again (the interval between the fracturing sections in Figure 23 is 10 m). Since the connected fracture network is formed by the third fracturing section, the second fracturing section, and the first fracturing section, the pressure in the fractures is released quickly and completely during the pumping fluid shut-in stage in the second and third fracturing sections. The fracture is completely closed (the initial damage unit thickness is 0.002 m), which results in no further closed space for the fracture width due to the interfracture stress interference in the second fracturing section during the pumping stage of the third fracturing section, which is shown in Figure 24. Except for the formation of a connected fracture network when the fracturing interval is 10 m, the degree of closure of the fracture width of the first and second fracturing sections decreases with increasing fracturing fluid pumping rate. This shows that the higher the fracturing fluid pumping rate is, the weaker the interfracture stress interference is, and the easier it is for fractures to expand along the direction of maximum principal stress, which is shown in Figure 22.
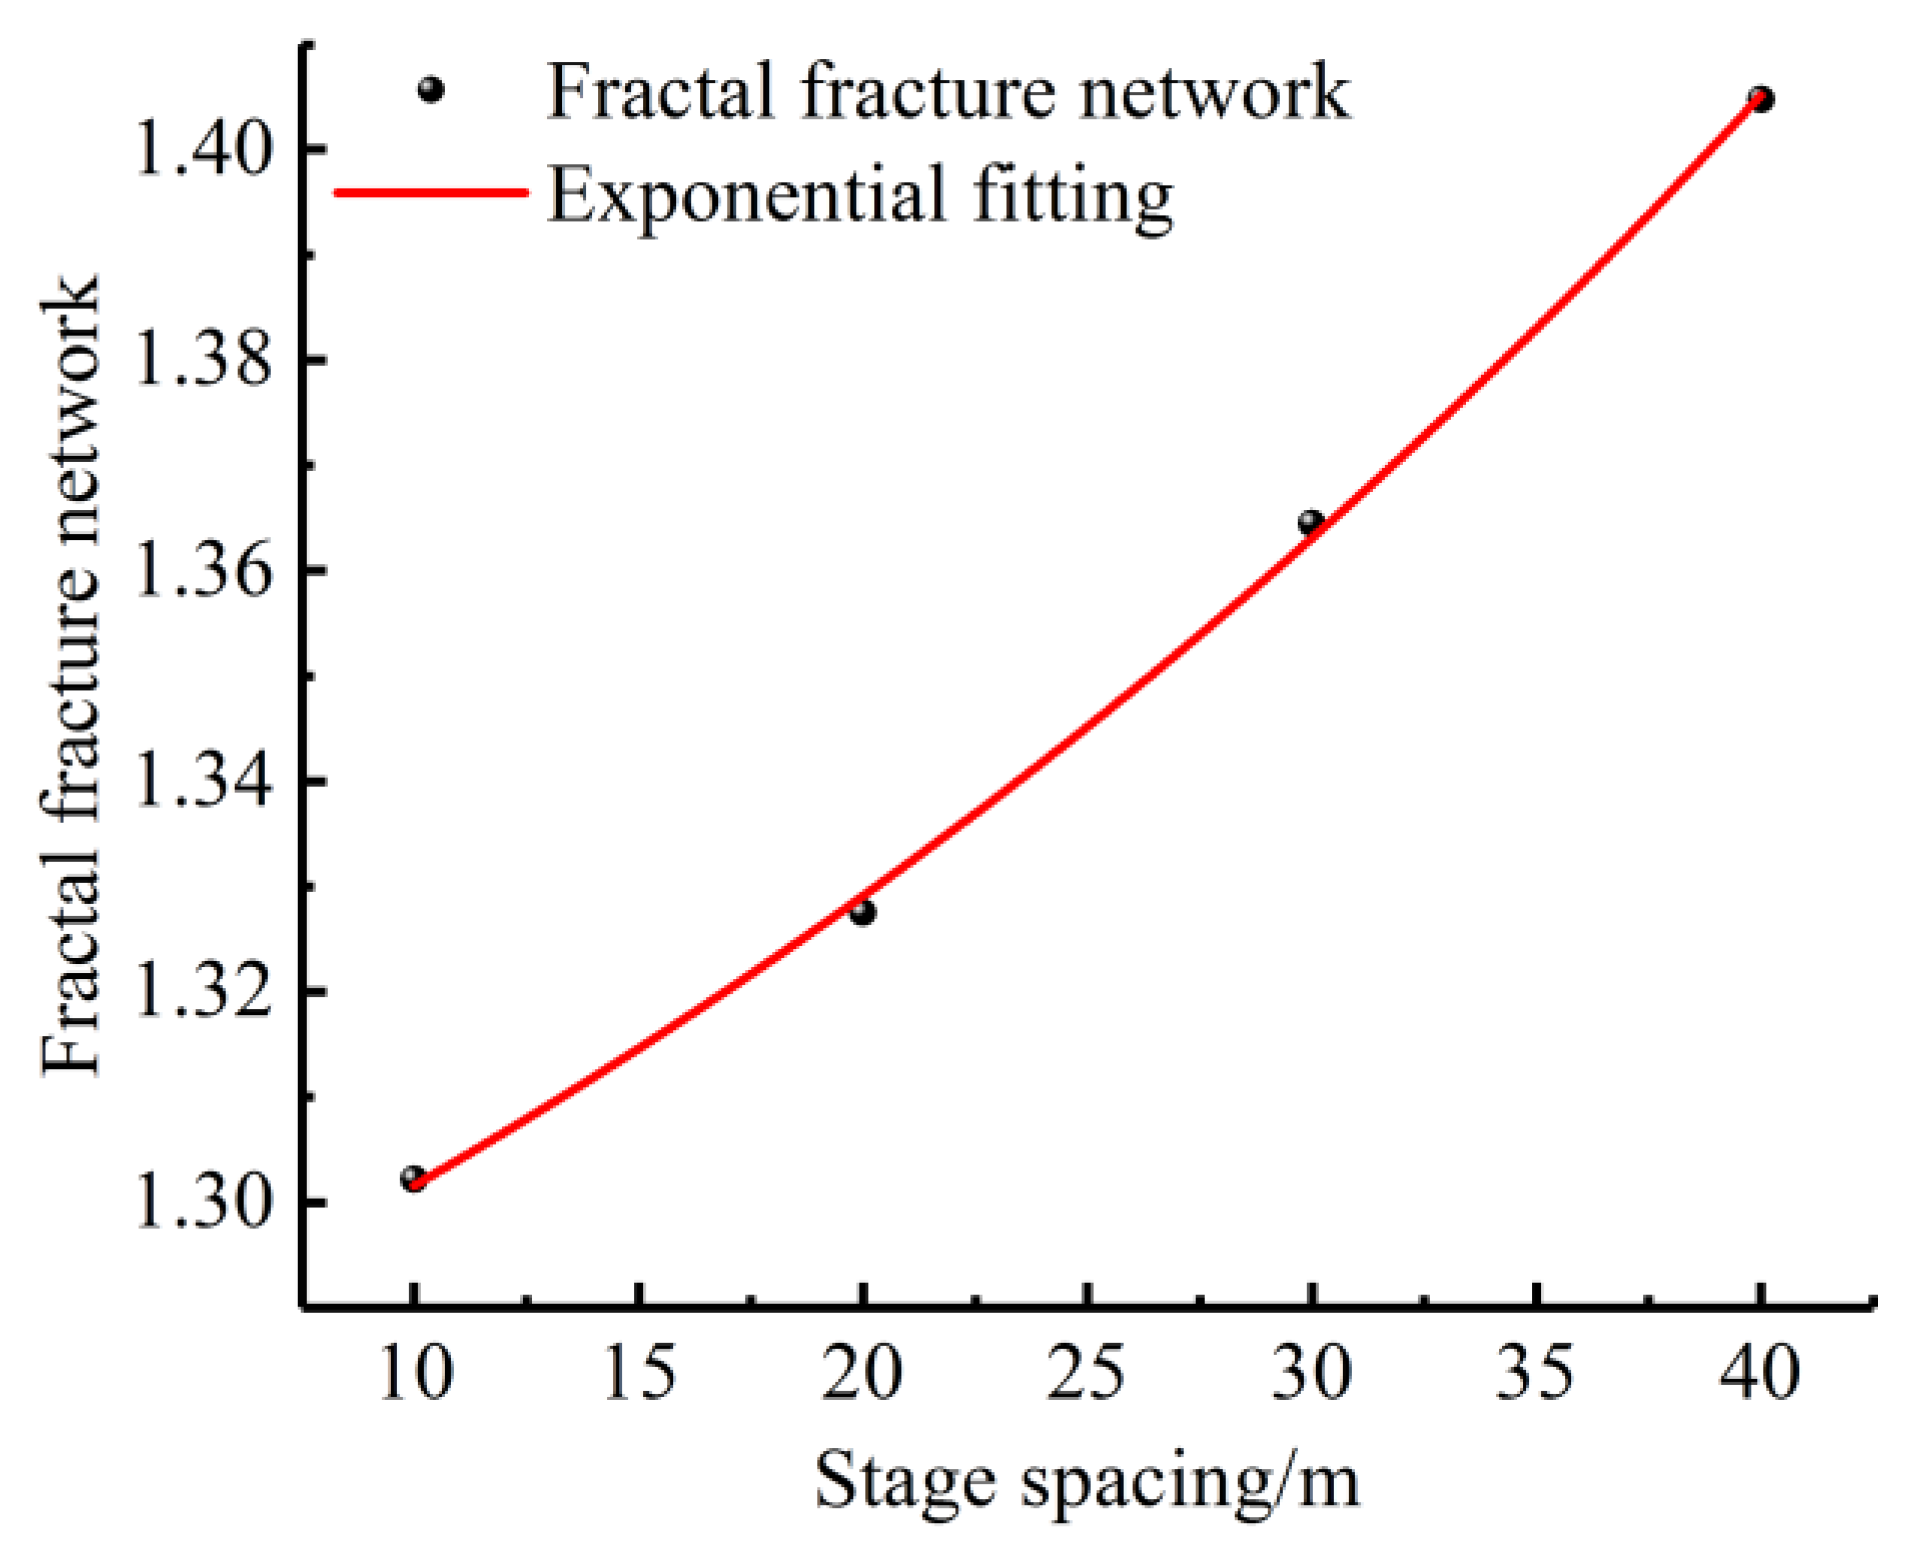
MATLAB is used to binarize the fracture configuration map in Figure 22 and calculate the fractal dimension to obtain the fracture fractal dimension variation curves of CBM reservoirs under various fracturing intervals, which are shown in Figure 25. For the staged fracturing model of CBM reservoirs, the interval between the fracturing sections is within the range of 20–40 m, and the fractal dimension of the formed fracture network increases with the increase in the interval between the fracturing sections. This is because the more the interval between the fracturing sections increases, the weaker the stress interference between fractures becomes. While the fractures propagate along the direction of the maximum principal stress, the stronger the interaction between hydraulic fractures and natural joints is, the higher the degree of development of branching fractures, which leads to the final formation of a fracture network with a higher complexity. Hence, the fractal dimension of the fracture network also increases with increasing intervals between the fracturing sections.
Through the above analysis, before CBM well fracturing, the fractured interval can be cored, and the development degree of the natural joints of the target interval can be analyzed first. According to the complexity of the fracture network, fracturing fluid pumping rate, in situ stress nonuniformity coefficient, natural joint fractal dimension, and fracturing interval spacing, the design of fracturing construction parameters can be optimized.

5. Conclusions

(1)
The two fracture surfaces were considered the dislocation boundary surfaces in the formation, and a displacement parameter control model of fracture propagation was established. The displacement and stress expressions of fracture propagation of the model were obtained. The numerical solution of fracture propagation of the horizontal well was established, which provides a more accurate theoretical and numerical model for subsequent analysis.
(2)
Using the calculation formula of stress interference for reference and derivation, the composite stress field under homologous stress interference was established, and the interactive development environment of the MATLAB-PYTHON-FEM platform was used to complete the construction and calculation of the model of the fracture network expansion in fractured reservoirs under homologous stress interference conditions with staged fracturing. The complexity of the fracture network was characterized by the fractal dimension, with the assumption of a random distribution of natural joints. The factors that affected the fractal expansion of the fracture were analyzed.
(3)
The interfracture stress interference effect in CBM reservoirs with developed natural joints was more obvious, and the intensity of the interfracture stress interference effect was positively correlated with the fractal dimensions of natural joints and negatively correlated with the in situ stress nonuniformity coefficient and fracture interval spacing. The intensity of stress interference between fractures first increased and then decreased with an increasing fracturing fluid pumping rate.
(4)
The fractal dimension of the fracture network that was formed by fracturing reconstruction satisfied the negative exponential increase rule with an increasing fractal dimension of the natural joints, and it first increased and then decreased with an increasing fracturing fluid pumping rate and in situ stress heterogeneity. With the increase in the interval between fracturing sections, the rule of positive exponential increase was satisfied.

Author Contributions

Conceptualization, P.Z.; validation, C.P.; formal analysis and investigation, X.S.; data curation, P.Z., Z.X. and Z.Y.; writing—original draft preparation, P.Z.; writing—review and editing, C.P. and Z.X.; supervision, C.P. All authors have read and agreed to the published version of the manuscript.

Funding

This research was funded by [National Natural Science Foundation of China] grant number [No. 51875579].

Acknowledgments

This project was supported by the National Natural Science Foundation of China (No. 51875579).

Conflicts of Interest

The authors declare no conflict of interest.

References

  1. Blanton, T.L. An experimental study of interaction between hydraulically induced and pre-existing fractures. In Proceedings of the SPE Unconventional Gas Recovery Symposium, Pittsburgh, PA, USA, 16–18 May 1982. [Google Scholar]
  2. Warpinski, N.R.; Teufel, L.W. Influence of geologic discontinuities on hydraulic fracture propagation. J. Pet. Technol. 1987, 39, 209–220. [Google Scholar] [CrossRef]
  3. Olson, J.E. Multi-fracture propagation modeling: Applications to hydraulic in shales and tight gas sands. In Proceedings of the 42nd U.S. Rock Mechanics Symposium (USRMS), San Francisco, CA, USA, 29 June–2 July 2008. [Google Scholar]
  4. Olson, J.E.; Taleghani, A.D. Modeling simultaneous growth of multiple hydraulic fractures and their interaction with natural fractures. In Proceedings of the SPE Hydraulic Fracturing Technology Conference, The Woodlands, TX, USA, 19–21 January 2009. [Google Scholar]
  5. Olson, J.E. Predicting fracture swarms—The influence of subcritical crack growth and the crack-tip process zone on joint spacing in rock. Geol. Soc. Lond. Spec. Publ. 2004, 231, 73–88. [Google Scholar] [CrossRef]
  6. Zhang, J.; Li, Y.-W.; Li, W.; Chen, Z.-J.; Zhao, Y.; Yu, F.-H.; Zheng, Y. Study on Propagation Behaviors of Hydraulic Fracture Network in Tight Sandstone Formation with Closed Cemented Natural Fractures. Geofluids 2020, 2020, 8833324. [Google Scholar] [CrossRef]
  7. Cipolla, C.L.; Williams, M.J.; Weng, X.; Mack, M.; Maxwell, S. Hydraulic fracture monitoring to reservoir simulation: Maximizing value. In Proceedings of the Second EAGE Middle East Tight Gas Reservoirs Workshop, Manama, Bahrain, 12–15 December 2010. [Google Scholar]
  8. Peirce, A.P.; Bunger, A.P. Interference fracturing: Nonuniform distributions of perforation clusters that promote simultaneous growth of multiple hydraulic fractures. SPE J. 2013, 20, 384–395. [Google Scholar] [CrossRef] [Green Version]
  9. Gordeliy, E.; Peirce, A. Coupling schemes for modeling hydraulic fracture propagation using the XFEM. Comput. Methods Appl. Mech. Eng. 2013, 253, 305–322. [Google Scholar] [CrossRef]
  10. Kresse, O.; Weng, X.; Wu, R.; Gu, H. Numerical modeling of hydraulic fractures interaction in complex naturally fractured formations. Rock Mech. Rock Eng. 2013, 46, 555–568. [Google Scholar] [CrossRef]
  11. Kresse, O.; Cohen, C.; Weng, X.; Wu, R.; Gu, H. Numerical modeling of hydraulic fracturing in naturally fractured formations. Rock Mech. 2011, 15, 516–535. [Google Scholar]
  12. Morrill, J.; Miskimins, J.L. Optimization of hydraulic fracture spacing in unconventional shales. In Proceedings of the SPE Hydraulic Fracturing Technology Conference, The Woodlands, TX, USA, 6–8 February 2012. [Google Scholar]
  13. Nagel, N.B.; Sanchez-Nagel, M. Stress shadowing and microseismic events: A numerical evaluation. In Proceedings of the SPE Annual Technical Conference and Exhibition, Denver, CO, USA, 30 October–2 November 2011. [Google Scholar]
  14. Yan, X.Z.; Li, X.Y. Development and application of unconventional oil and gas well fracturing optimization design software based on fracture interference model. J. China Univ. Pet. Ed. Nat. Sci. 2013, 37, 120–128. (In Chinese) [Google Scholar]
  15. Li, Y.; Jia, D.; Liu, J.; Fu, C.; Ai, C. The calculation method based on the equivalent continuum for the fracture initiation pressure of fracturing of coalbed methane well. J. Pet. Sci. Eng. 2016, 146, 909–920. [Google Scholar] [CrossRef]
  16. Li, Y.; Long, M.; Zuo, L.; Li, W.; Zhao, W. Brittleness evaluation of coal based on statistical damage and energy evolution theory. J. Pet. Sci. Eng. 2019, 172, 753–763. [Google Scholar] [CrossRef]
  17. Li, Y.; Rui, Z.; Zhao, W.; Bo, Y.; Fu, C.; Chen, G.; Patil, S. Study on the mechanism of rupture and propagation of T-type fractures in coal fracturing. J. Nat. Gas Sci. Eng. 2018, 52, 379–389. [Google Scholar] [CrossRef]
  18. Cong, Z.; Li, Y.; Liu, Y.; Xiao, Y. A new method for calculating the direction of fracture propagation by stress numerical search based on the displacement discontinuity method. Comput. Geotech. 2021, 140, 104482. [Google Scholar] [CrossRef]
  19. Cong, Z.; Li, Y.; Pan, Y.; Liu, B.; Shi, Y.; Wei, J.; Li, W. Study on CO2 foam fracturing model and fracture propagation simulation. Energy 2022, 238, 121778. [Google Scholar] [CrossRef]
  20. Mandelbrot, B.B.; Wheeler, J.A. The Fractal Geometry of Nature; Gulf Professional Publishing House: Houston, TX, USA, 1982. [Google Scholar]
  21. Sarkar, N.; Chaudhuri, B.B. An efficient differential box-counting approach to compute fractal dimension of image. IEEE Trans. Syst. Man Cybern. 1994, 24, 115–120. [Google Scholar] [CrossRef] [Green Version]
  22. Xie, H.P.; Chen, Z.D. Fractal geometry and rock fracture. Acta Mech. Sin. 1988, 20, 264–271, 290. (In Chinese) [Google Scholar]
  23. Zhao, X.; Wang, X.Y. An approach to compute fractal dimension of color images Fractals-complex. Geom. Patt. Scal. Nat. Soc. 2017, 25, 149–163. [Google Scholar]
  24. Farhidzadeh, A.; Dehghan-Niri, E.; Moustafa, A.; Salamone, S.; Whittaker, A. Damage assessment of reinforced concrete structures using fractal analysis of residual crack patterns. Exp. Mech. 2013, 53, 1607–1619. [Google Scholar] [CrossRef]
  25. Korvin, G. Fraetal Modeling the Earth Seience; Elsevier Publishing: Amsterdam, The Netherlands, 1992. [Google Scholar]
  26. Wang, S.; Wang, X.; Bao, L.; Feng, Q.; Wang, X.; Xu, S. Characterization of hydraulic fracture propagation in tight formations: A fractal perspective. J. Pet. Sci. Eng. 2020, 195, 107871. [Google Scholar] [CrossRef]
  27. Liu, J.; Jiang, L.; Liu, T.; Yang, D. Characterization of Fractal-like Fracture Network Using Tracer Flowback Tests for a Multifractured Horizontal Well in a Tight Formation. Fractals 2022. [Google Scholar] [CrossRef]
  28. Li, Y.M.; Chen, X.Y.; Zhao, J.Z.; Shen, F.; Qiao, H.J. Interference between segmented multi-clustered fractures in horizontal wells. J. Southwest Pet. Univ. 2016, 38, 76–83. (In Chinese) [Google Scholar]
  29. Shojaei, A.K.; Shao, J.F. Porous Rock Fracture Mechanics with Application to Hydraulic Fracturing, Drilling and Structural Engineering; Woodhead Publishing Series in Civil and Structural Engineering: Cambridgeshire, UK, 2017. [Google Scholar]
  30. Barenblatt, G.I. The mathematical theory of equilibrium cracks in Brittle fracture. Adv. Appl. Mech. 1962, 7, 55–129. [Google Scholar]
  31. Shi, X.; Qin, Y.; Xu, H.; Feng, Q.; Wang, S.; Xu, P.; Han, S. Numerical simulation of hydraulic fracture propagation in conglomerate reservoirs. Eng. Fract. Mech. 2021, 248, 107738. [Google Scholar] [CrossRef]
  32. Zhang, H.; Sheng, J.J. Numerical simulation and optimization study of the complex fracture network in naturally fractured reservoirs. J. Pet. Sci. Eng. 2020, 195, 107726. [Google Scholar] [CrossRef]
  33. Wang, H.Y. Hydraulic fracture propagation in naturally fractured reservoirs: Complex fracture or fracture networks. J. Nat. Gas Sci. Eng. 2019, 68, 102911. [Google Scholar] [CrossRef] [Green Version]
  34. Belyadi, H.; Fathi, E.; Belyadi, F. Hydraulic Fracturing in Unconventional Reservoirs; Elsevier Publishing: Amsterdam, The Netherlands, 2017. [Google Scholar]
  35. Kanninen, M.F.; Popelar, C.H. Advanced Fracture Mechanics: Oxford Engineering Science Series; Oxford University Press: Oxford, UK, 1985. [Google Scholar]
Figure 1. Linear regression of the experimental data of the coal rock samples. (a) rock sample #1, (b) rock sample #2, (c) rock sample #3.
Minerals 12 00955 g001
Figure 2. Natural joints that were generated by the Monte Carlo method (x-axis and y-axis are the horizontal and vertical dimensions (m); fracture trace length: 1.0/0.2; fracture spacing: 2.0/0.5; Group 1 fracture dip angle: 45°/0.1°; Group 2 fracture dip angle: 135°/0.1°). (a) Group 1 fracture, (b) Group 2 fracture.
Minerals 12 00955 g002
Figure 3. The binarization processing of the natural joint distribution (x-axis and y-axis are the horizontal and vertical dimensions (m)).
Minerals 12 00955 g003
Figure 4. Natural joint distributions with various joint densities (x-axis and y-axis are the horizontal and vertical dimensions (m)). (a) 0.5 curve/m2, (b) 1.0 curve/m2, (c) 1.5 curve/m2, (d) 1.9 curve/m2, (e) 2.4 curve/m2, (f) 2.8 curve/m2.
Minerals 12 00955 g004
Figure 5. Relation curve between the fractal dimensions of natural joints and the natural joint density.
Minerals 12 00955 g005
Figure 6. Modeling process of the fracture fractal propagation model of the developed CBM reservoir based on fractal natural joints.
Minerals 12 00955 g006
Figure 7. Schematic diagrams of the staged fracturing model for horizontal wells in CBM reservoirs (x-axis and y-axis are the horizontal and vertical dimensions (m)).
Minerals 12 00955 g007
Figure 8. Probability distribution and fitting curve of the rock mechanics parameters in the coalbed methane. (a) Elastic modulus, (b) Poisson’s ratio.
Minerals 12 00955 g008
Figure 9. Von Mises stress distribution during staged fracture propagation in CBM reservoirs under various fractal dimensions of natural joints. (a) 1.2662, (b) 1.2716, (c) 1.2806, (d) 1.2998.
Minerals 12 00955 g009
Figure 10. Fracture configuration distribution patterns during staged fracture propagation in CBM reservoirs under various fractal dimensions of natural joints. (a) 1.2662, (b) 1.2716, (c) 1.2806, (d) 1.2998.
Minerals 12 00955 g010aMinerals 12 00955 g010b
Figure 11. Fracture width variations of CBM reservoirs under various fractal dimensions of natural joints. (a) L1, (b) L2, (c) L3.
Minerals 12 00955 g011aMinerals 12 00955 g011b
Figure 12. The total fracture length variation under different fractal dimensions of natural joints in CBM reservoirs with segmented hydraulic fractures.
Minerals 12 00955 g012
Figure 13. The fractal dimension variation of fractured fracture in CBM reservoir under different fractal dimensions of natural joints.
Minerals 12 00955 g013
Figure 14. Fracture configuration distribution law during staged hydraulic fracture propagation in CBM reservoirs under various fracturing fluid pumping rates. (a) 0.18 m3·min−1, (b) 0.24 m3·min−1, (c) 0.3 m3·min−1, (d) 0.36 m3·min−1.
Minerals 12 00955 g014
Figure 15. Variation curves of the fracture width of CBM reservoirs under various fracturing fluid pumping rates. (a) L1, (b) L2, (c) L3.
Minerals 12 00955 g015
Figure 16. Variation curves of the total fracture length of CBM reservoirs under various fracturing fluid pumping rates.
Minerals 12 00955 g016
Figure 17. Variation curve of the fractal dimensions of segmental hydraulic fractures in CBM reservoirs under various pumping displacements of fracturing fluids.
Minerals 12 00955 g017
Figure 18. Fracture configuration distribution patterns during staged fracture propagation of CBM reservoirs under various values of the inhomogeneity coefficient of the in situ stress. (a) 1.0, (b) 1.08, (c) 1.16, (d) 1.24.
Minerals 12 00955 g018
Figure 19. Variation curves of the fracture width in staged fracturing of CBM reservoirs under various values of the inhomogeneity coefficient of the in situ stress. (a) L1, (b) L2, (c) L3.
Minerals 12 00955 g019aMinerals 12 00955 g019b
Figure 20. Variation curves of the total fracture length of segmental hydraulic fractures in CBM reservoirs under various values of the inhomogeneity coefficient of the in situ stress.
Minerals 12 00955 g020
Figure 21. Variation curve of the fractal dimension of segmental hydraulic fractures in CBM reservoirs under various values of the inhomogeneity coefficient of the in situ stress.
Minerals 12 00955 g021
Figure 22. Fracture configuration distribution patterns during staged hydraulic fracture propagation in CBM reservoirs under various fracturing intervals. (a) 10 m, (b) 20 m, (c) 30 m, (d) 40 m.
Minerals 12 00955 g022
Figure 23. Variation curves of the fracture width of CBM reservoirs under various fracturing intervals. (a) L1, (b) L2, (c) L3.
Minerals 12 00955 g023aMinerals 12 00955 g023b
Figure 24. Variation curves of the total fracture length of segmented fractures in CBM reservoirs with various fracturing intervals.
Minerals 12 00955 g024
Figure 25. Variation curve of the fractal dimension of segmental hydraulic fractures in CBM reservoirs with various fracturing intervals.
Minerals 12 00955 g025
Table 1. Statistical table of the elastic modulus and Poisson’s ratio data of coal.
Rock ParameterMin (GPa)Max (GPa)Average (GPa)Standard Deviation (GPa)Lower 95% Confidence Interval of the Mean (GPa)Upper 95% Confidence Interval of the Mean (GPa)
Elastic modulus0.245.72.981.1262.753.20
Poisson’s ratio0.160.430.290.06580.2760.303
Table 2. Staged fracturing geometric model parameters of CBM reservoirs.
Model ParameterNumerical Value
Young’s modulus (GPa)4.36
Poisson’s ratio/dimensionless0.28
Rock permeability coefficient (m·s−1)3.89 × 10⁻⁸
Rock tensile strength (MPa)0.43
Rock fracture toughness (J·m−2)215
Joint tensile strength (MPa)0.22
Joint fracture toughness (J·m−2)55
Fracturing fluid viscosity (Pa·s)0.001
Filtration coefficient (m3·Pa−1·s−1)1 × 10⁻¹³
Fracturing fluid pumping rate (m3·min−1)0.24
Pumping injection time (s)20
Length of perforation section (m)1
Minimum horizontal in situ stress (MPa)18
In situ stress inhomogeneity coefficients1.0, 1.08, 1.16, and 1.24
Publisher’s Note: MDPI stays neutral with regard to jurisdictional claims in published maps and institutional affiliations.