
Study on the Basic Characteristics of Iron Ore Powder with Different Particle Sizes

 ,
,
Abstract
:1. Introduction
2. Materials and Methods
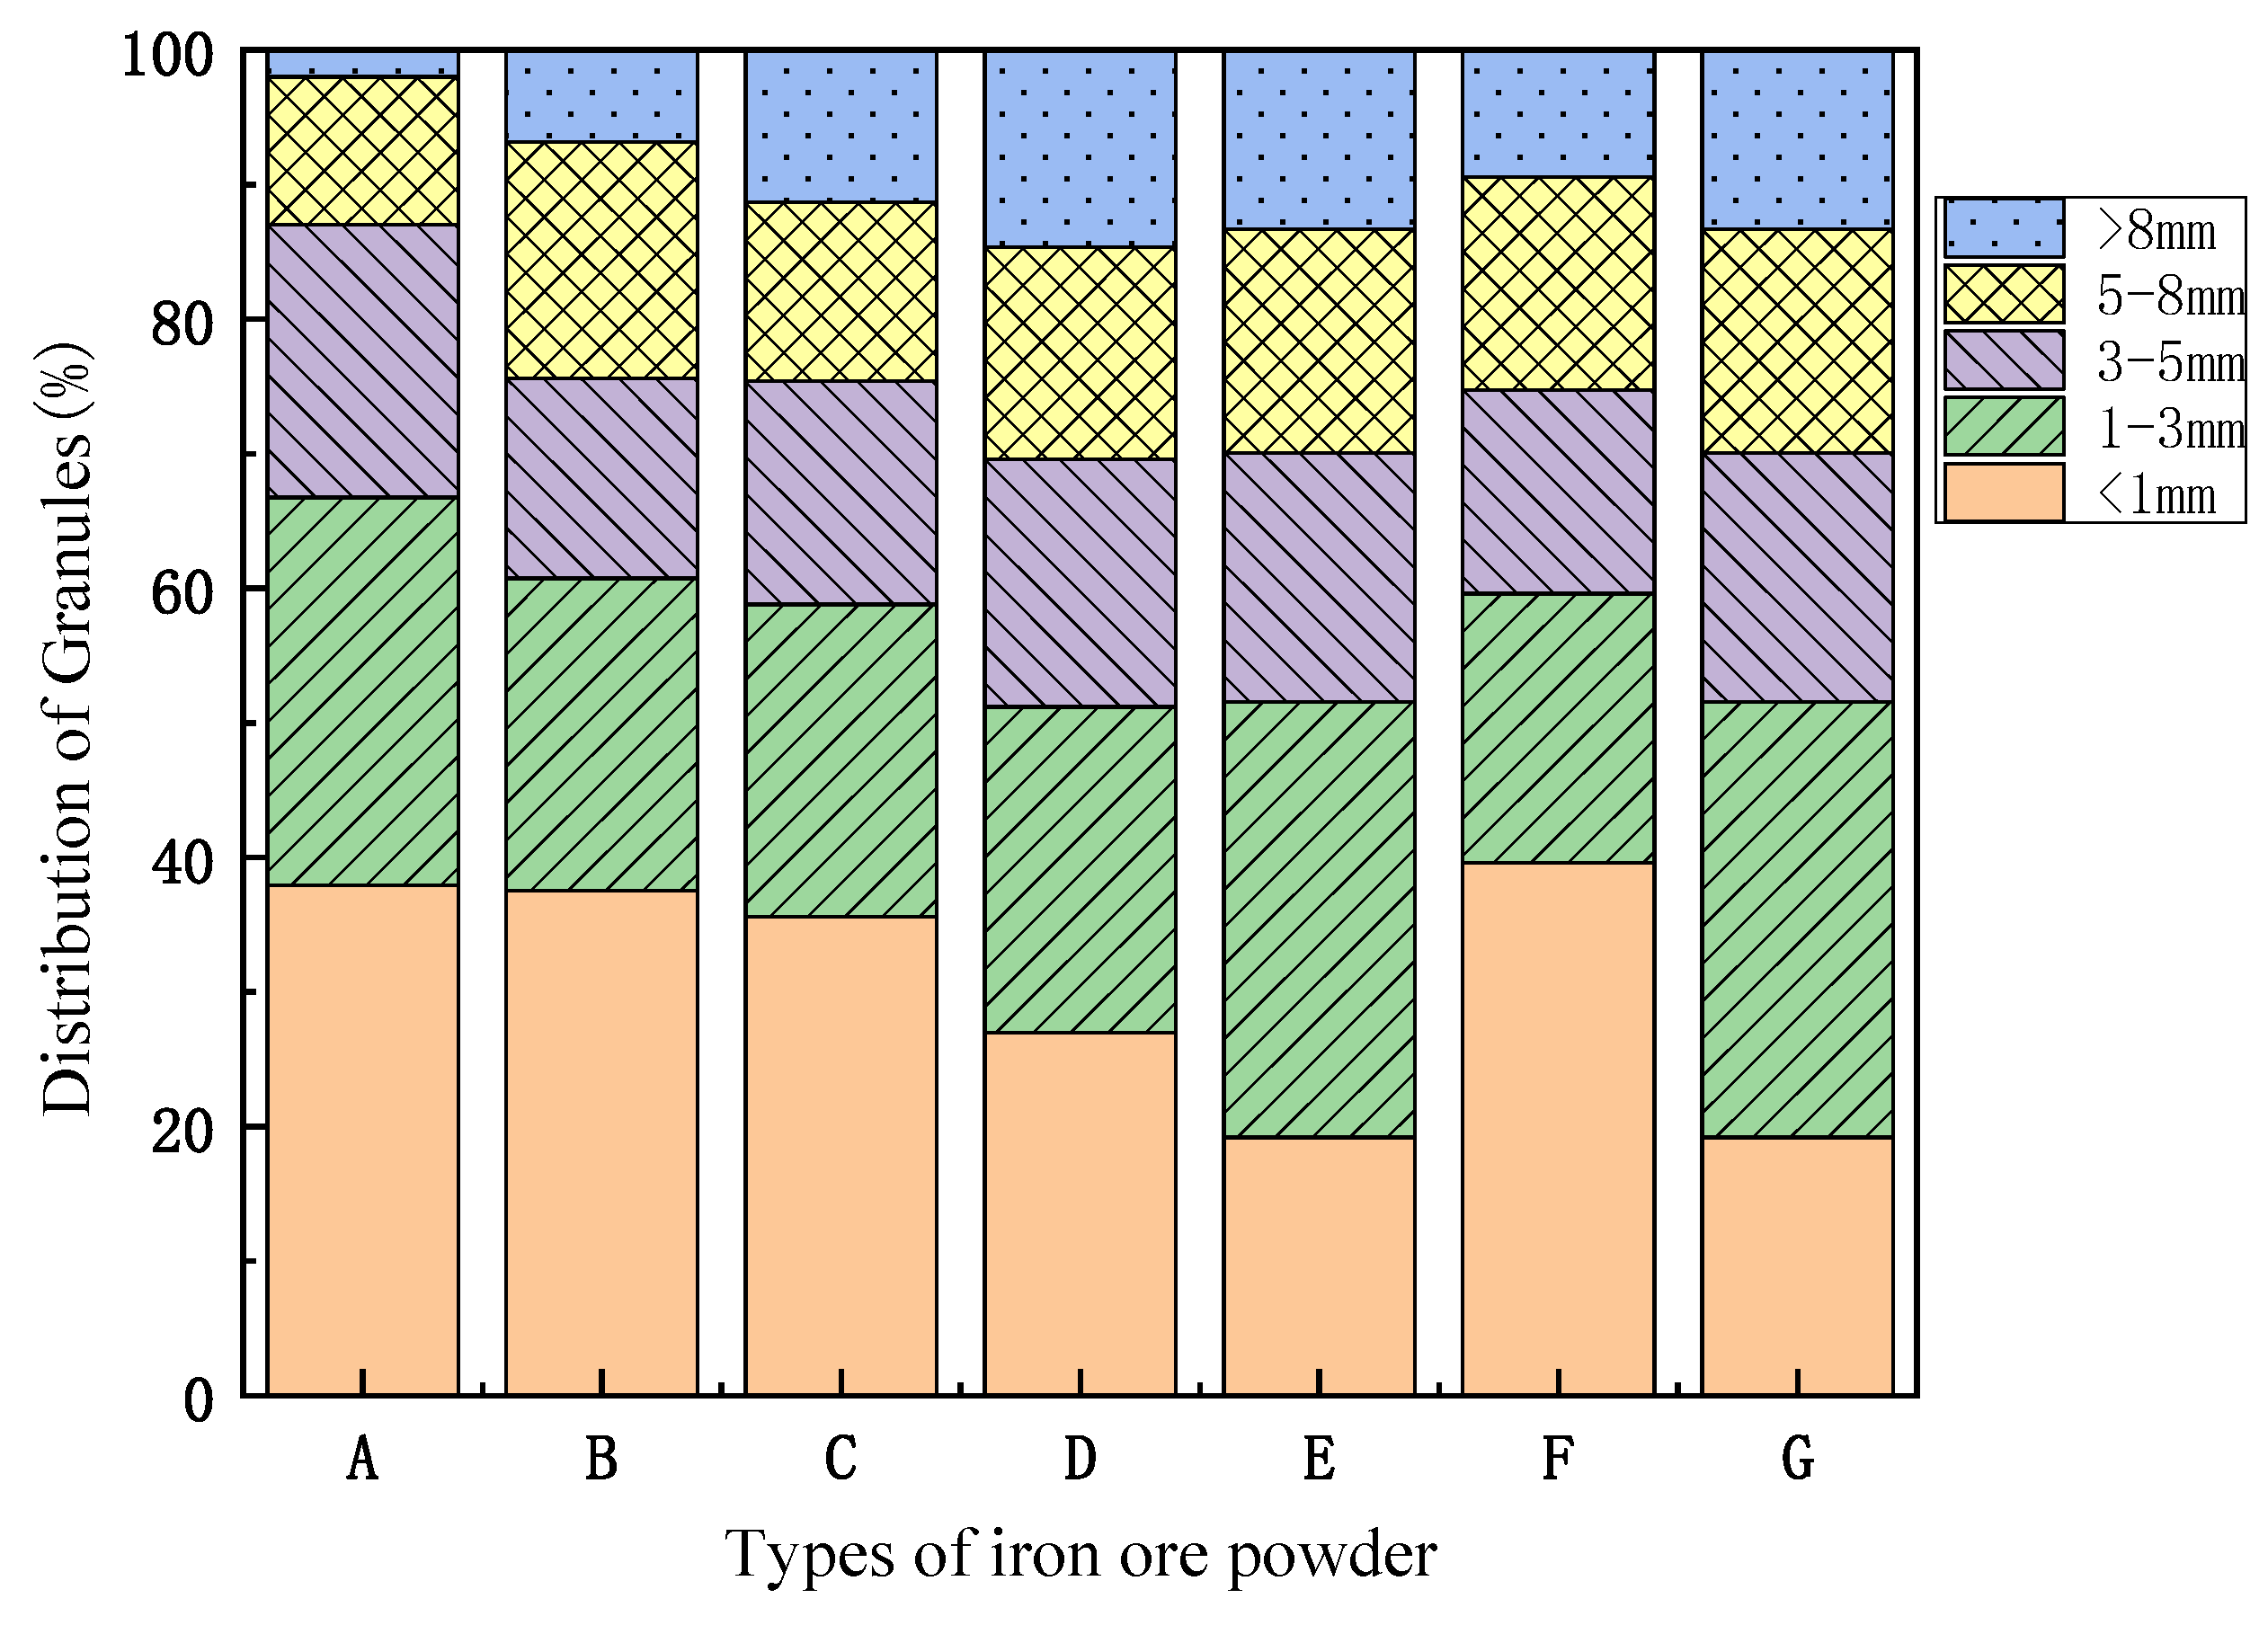
2.1. Materials Properties
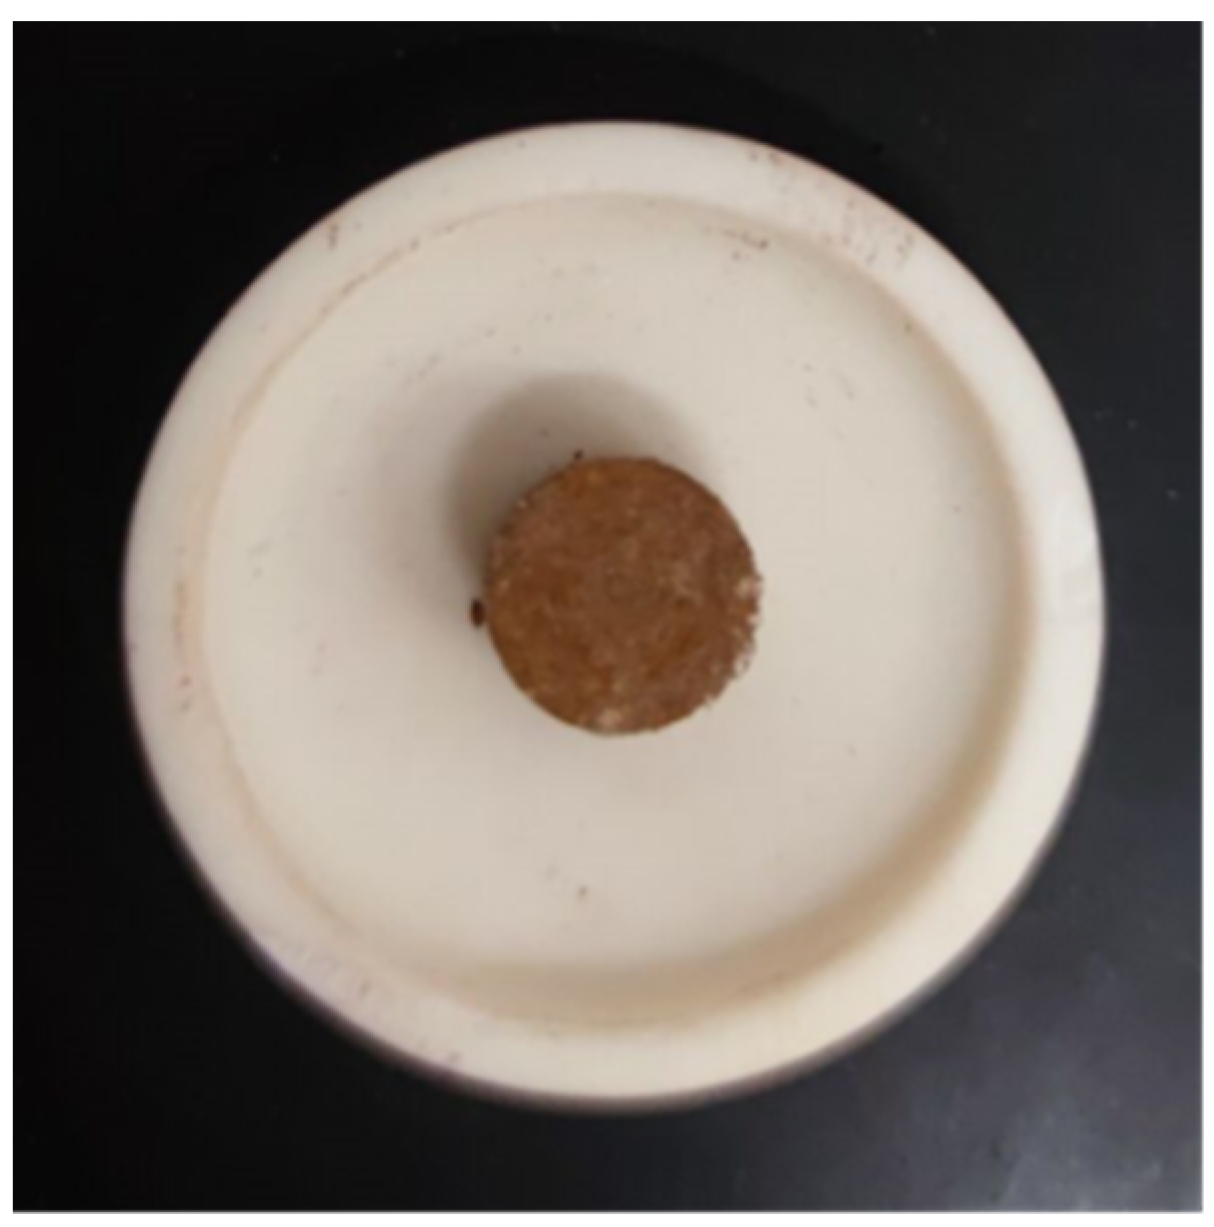
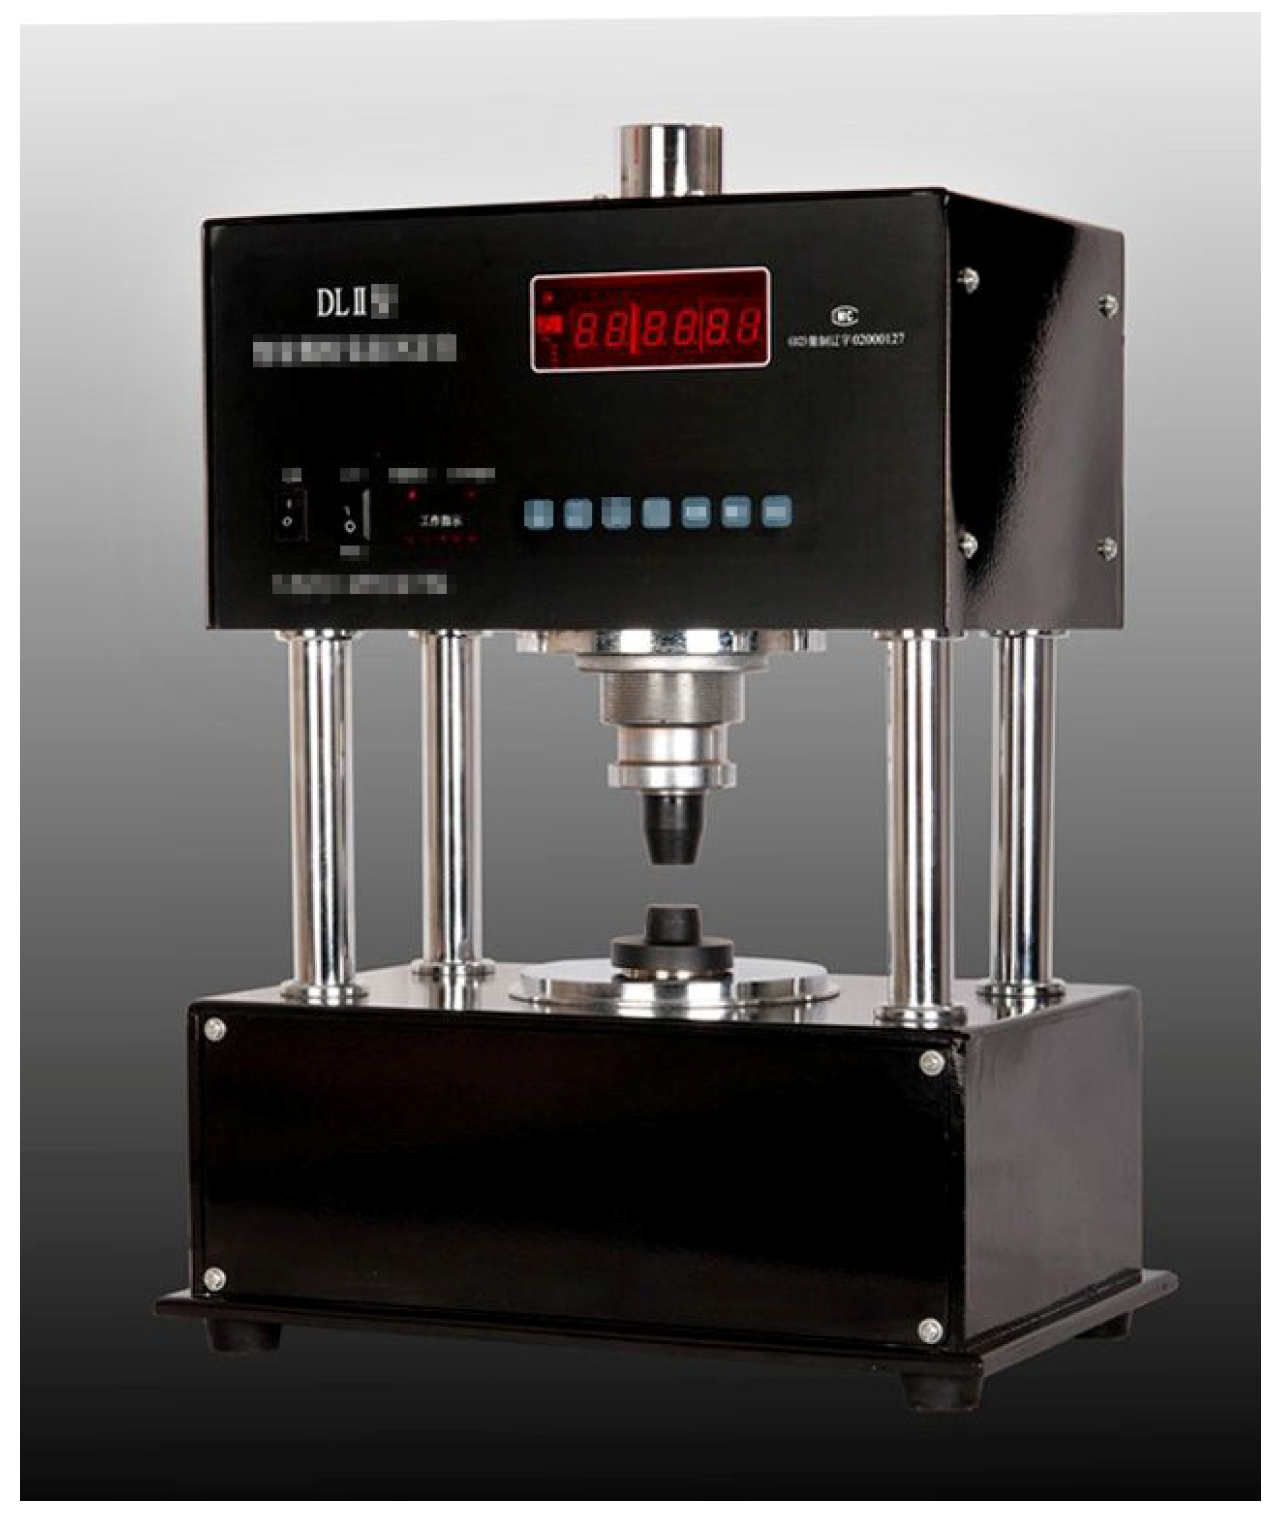
2.2. Experiment Method
3. Results
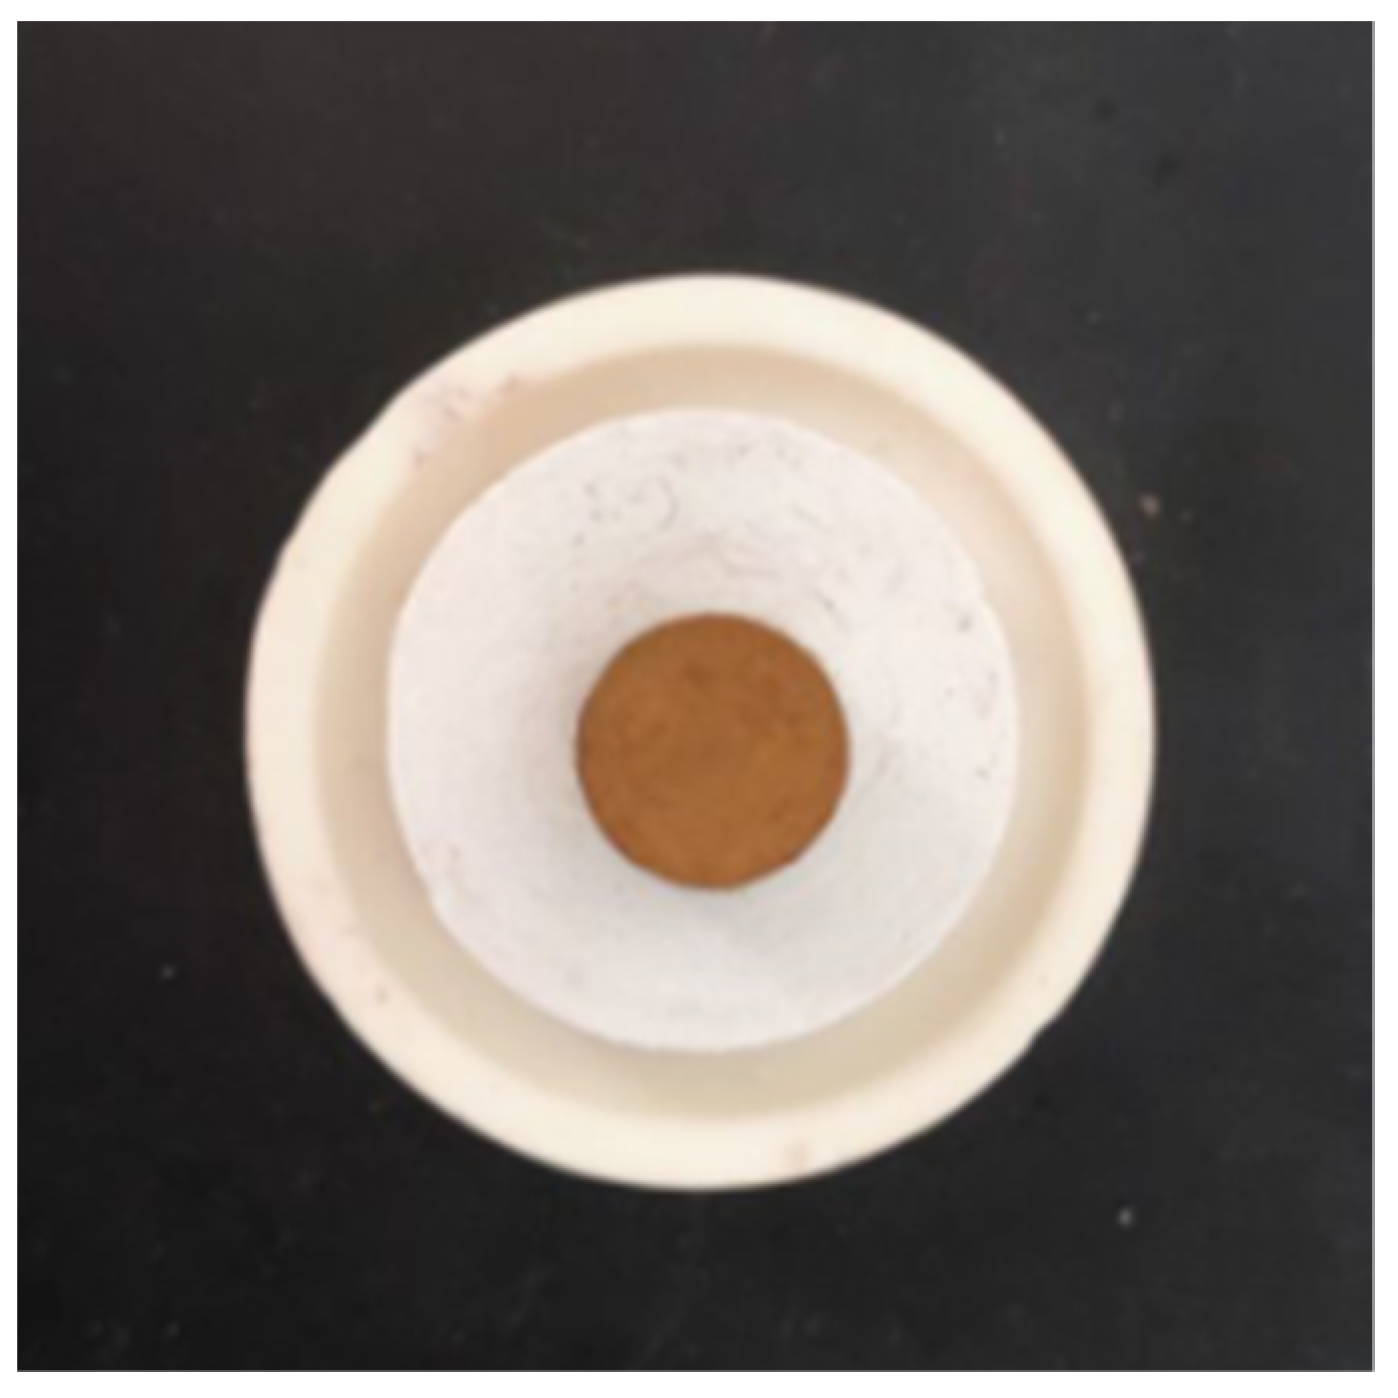
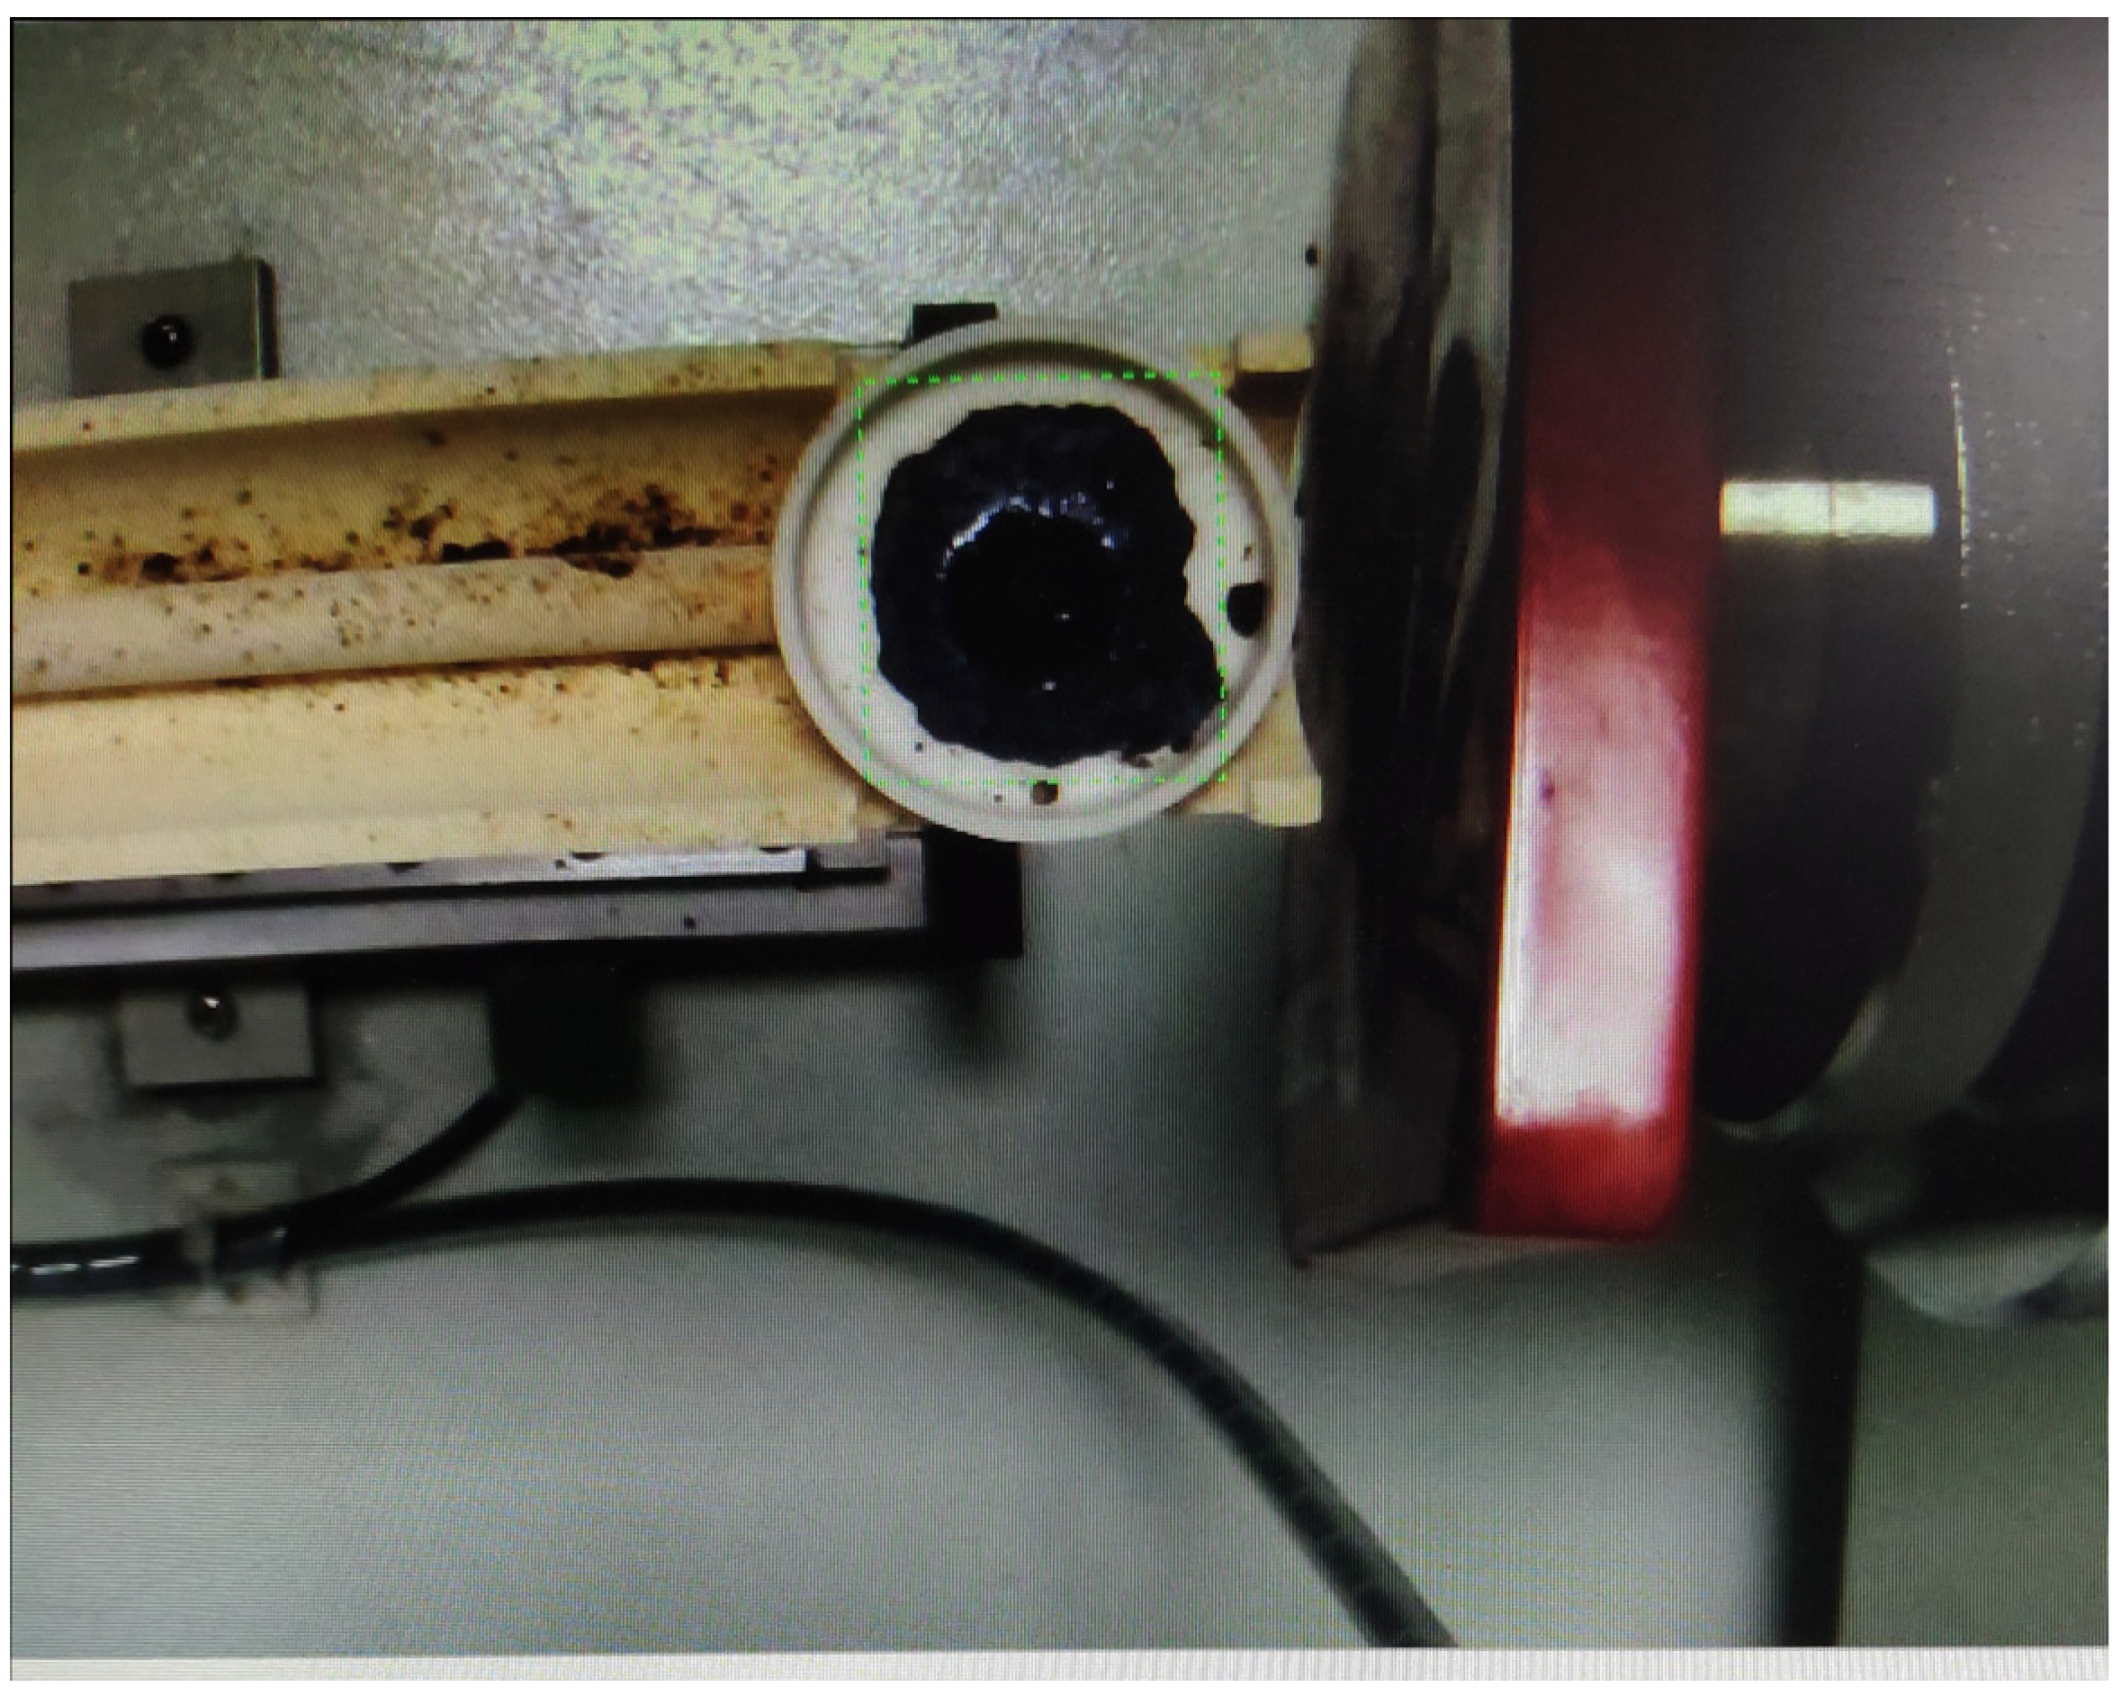
3.1. Assimilation
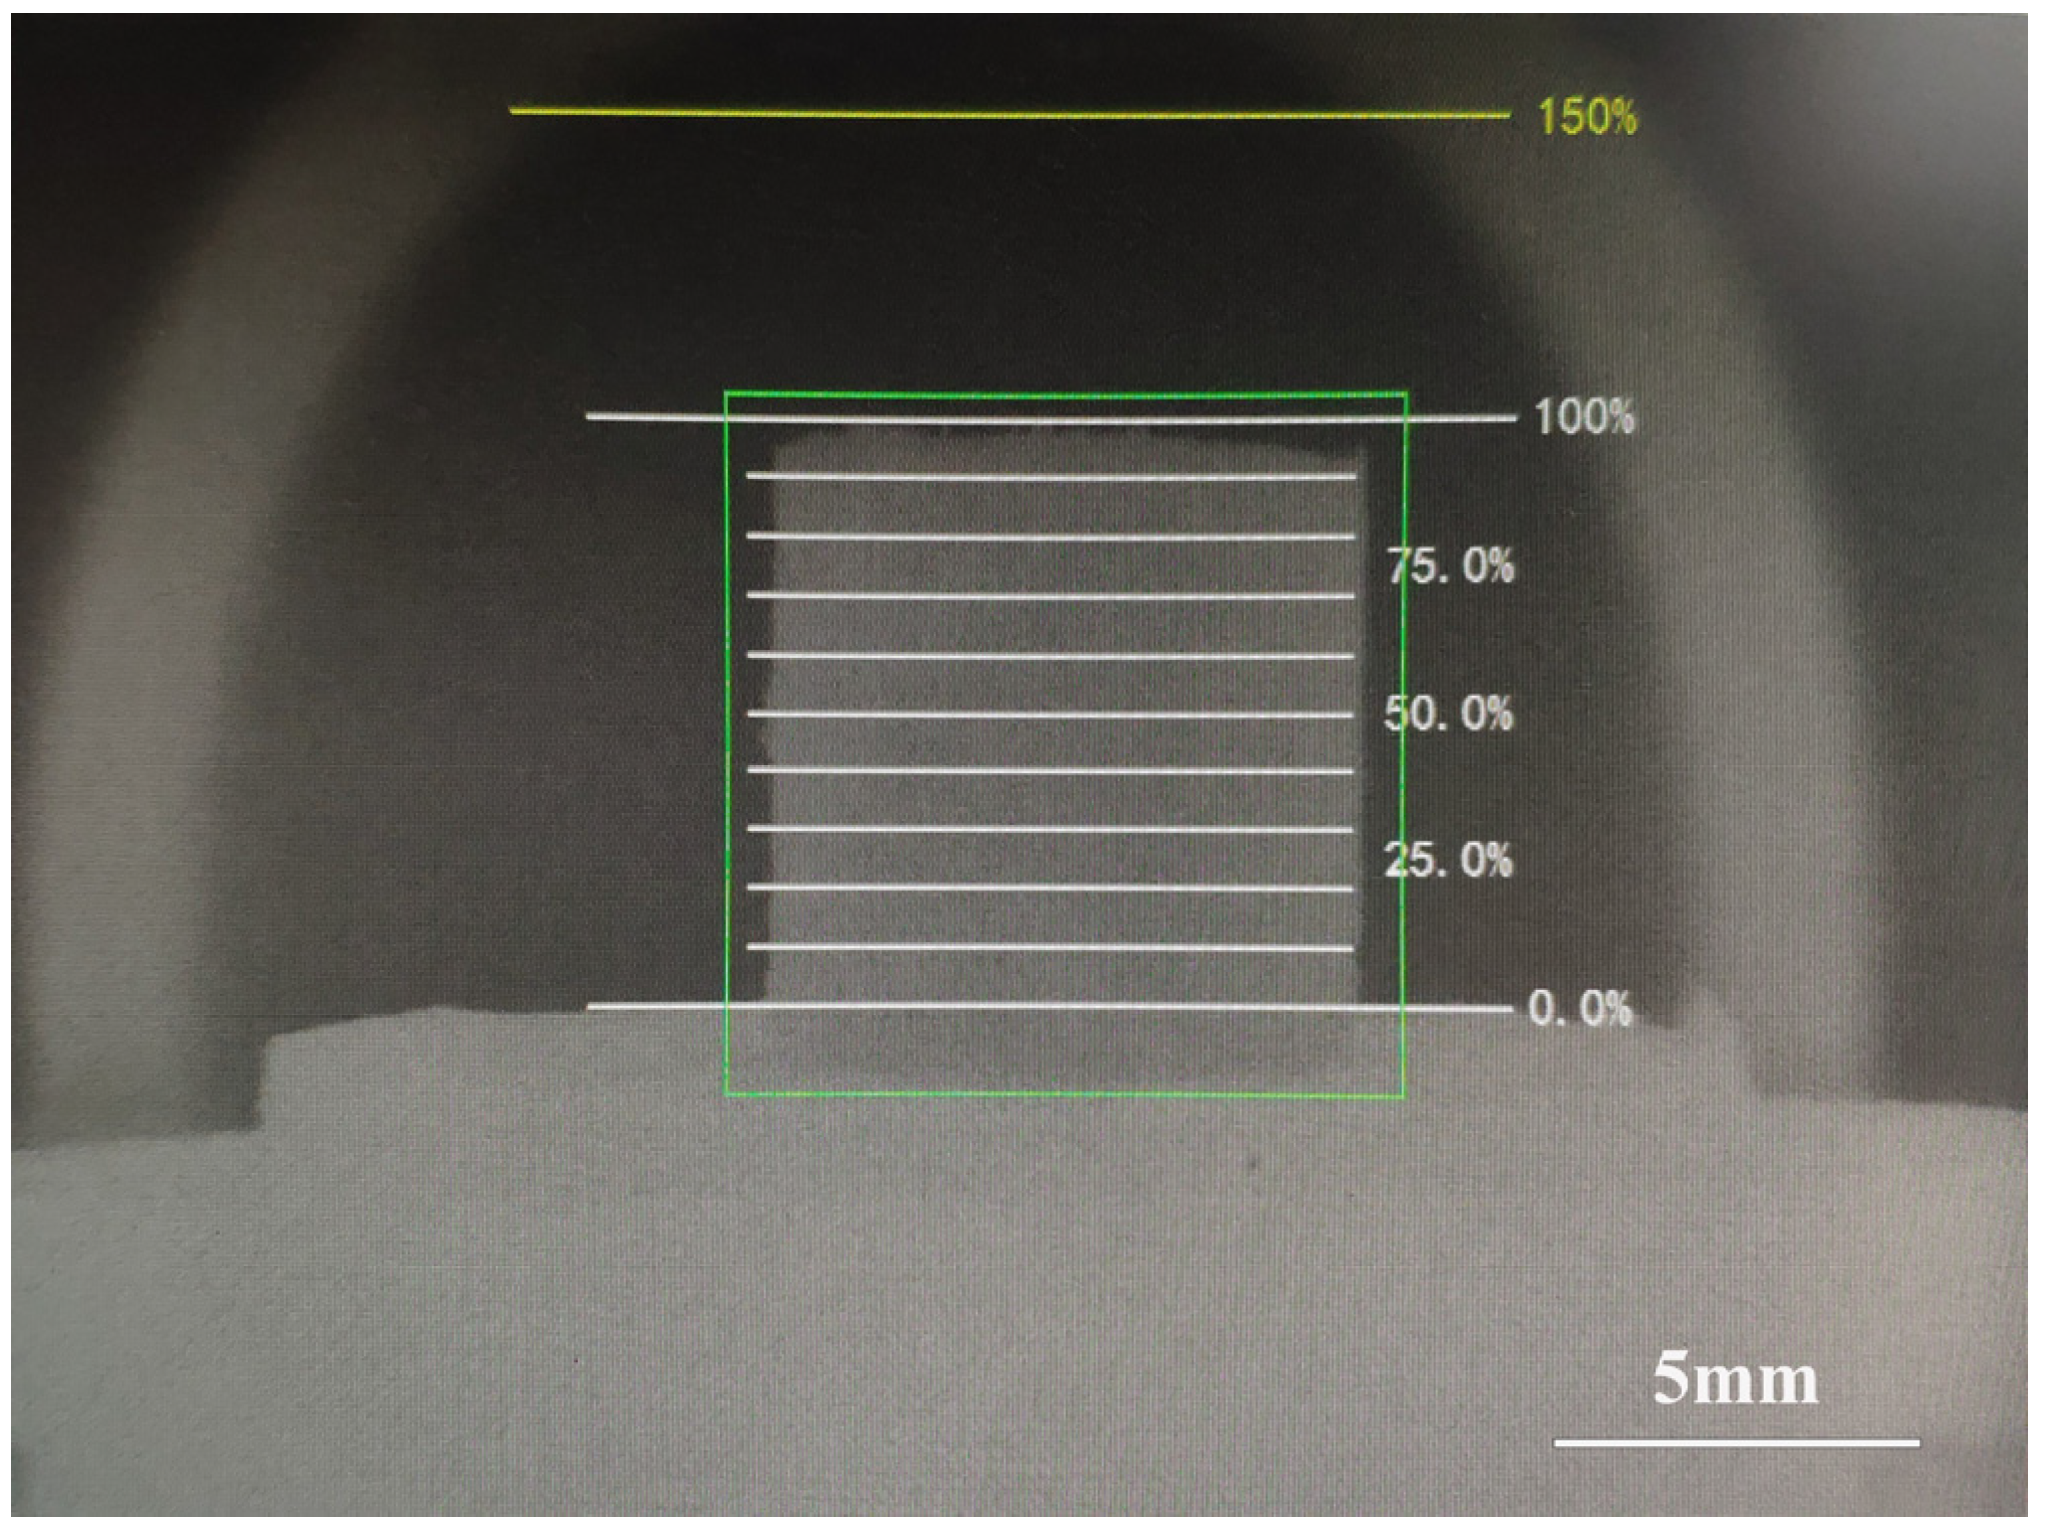
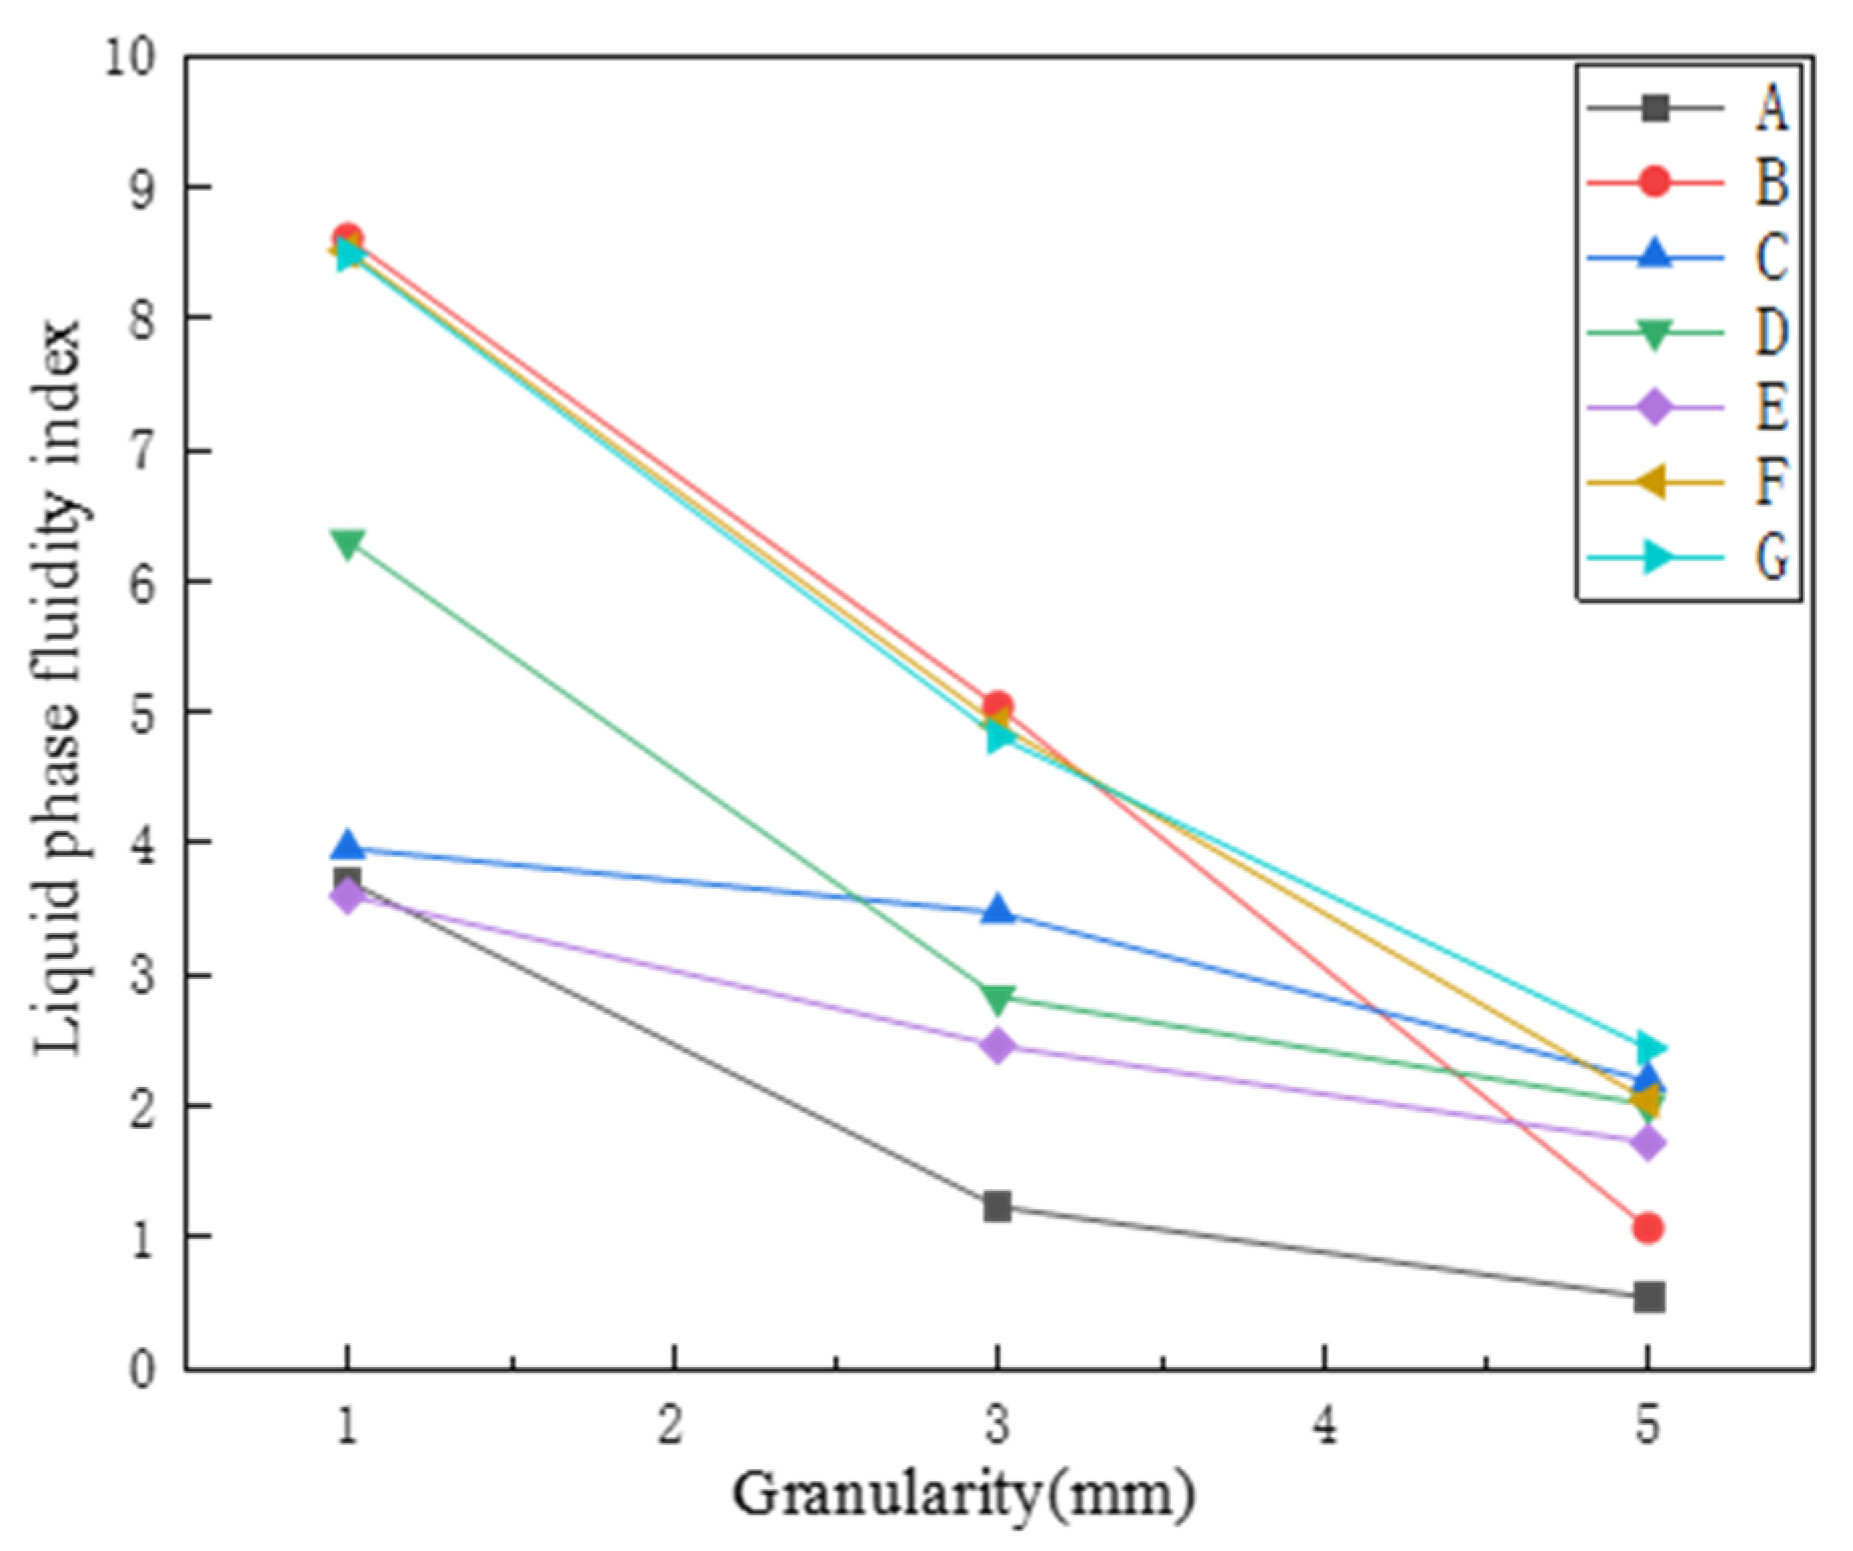
3.2. Liquid Phase Fluidity
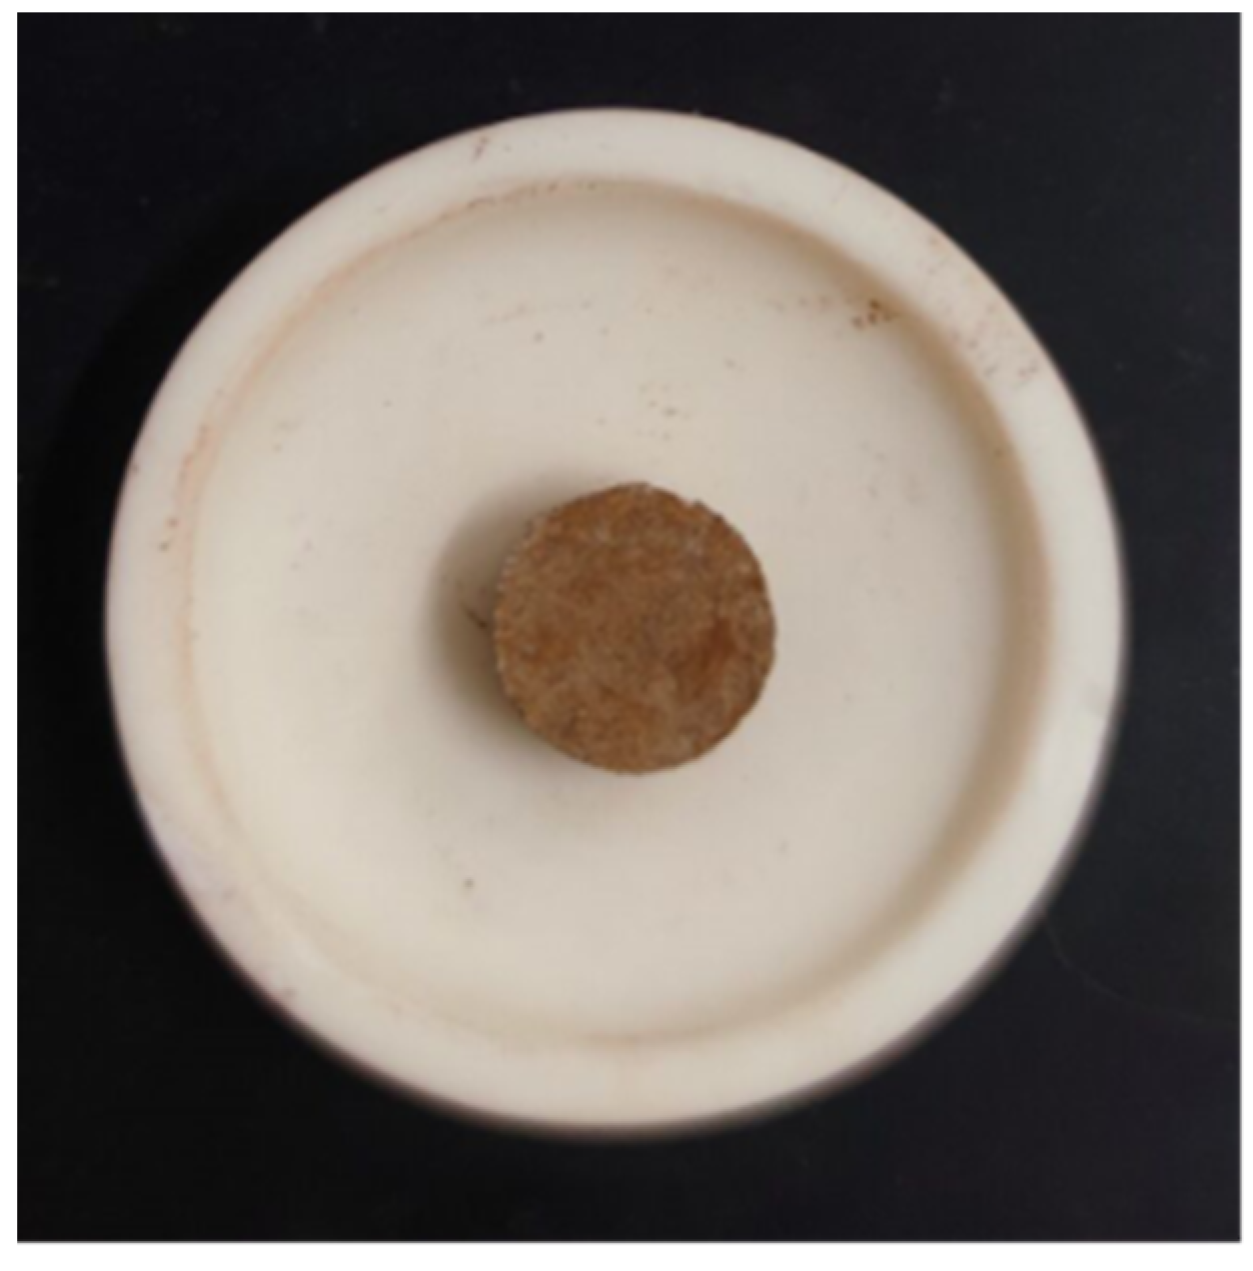
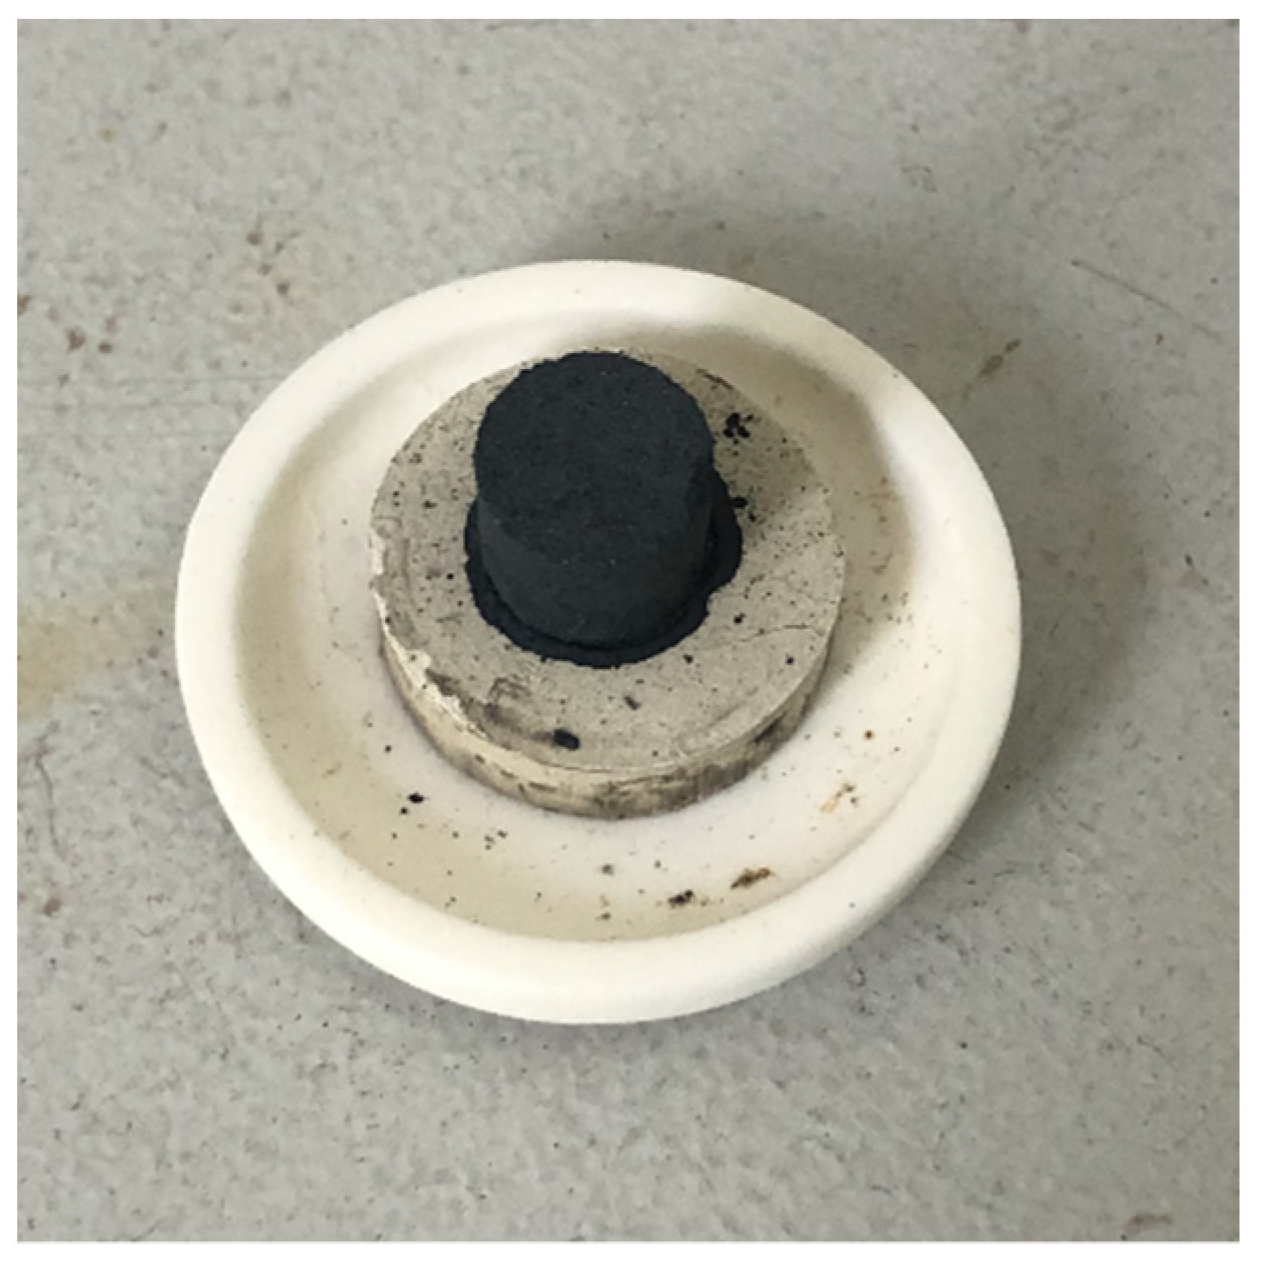
3.3. Binding Phase Strength
4. Conclusions
- (1)
- Through the experimental research on the basic characteristics of seven kinds of iron ore powder, the content of MgO, SiO2, Al2O3, and other substances in the iron ore powder and its own microscopic morphology affected the basic characteristics of the iron ore powder.
- (2)
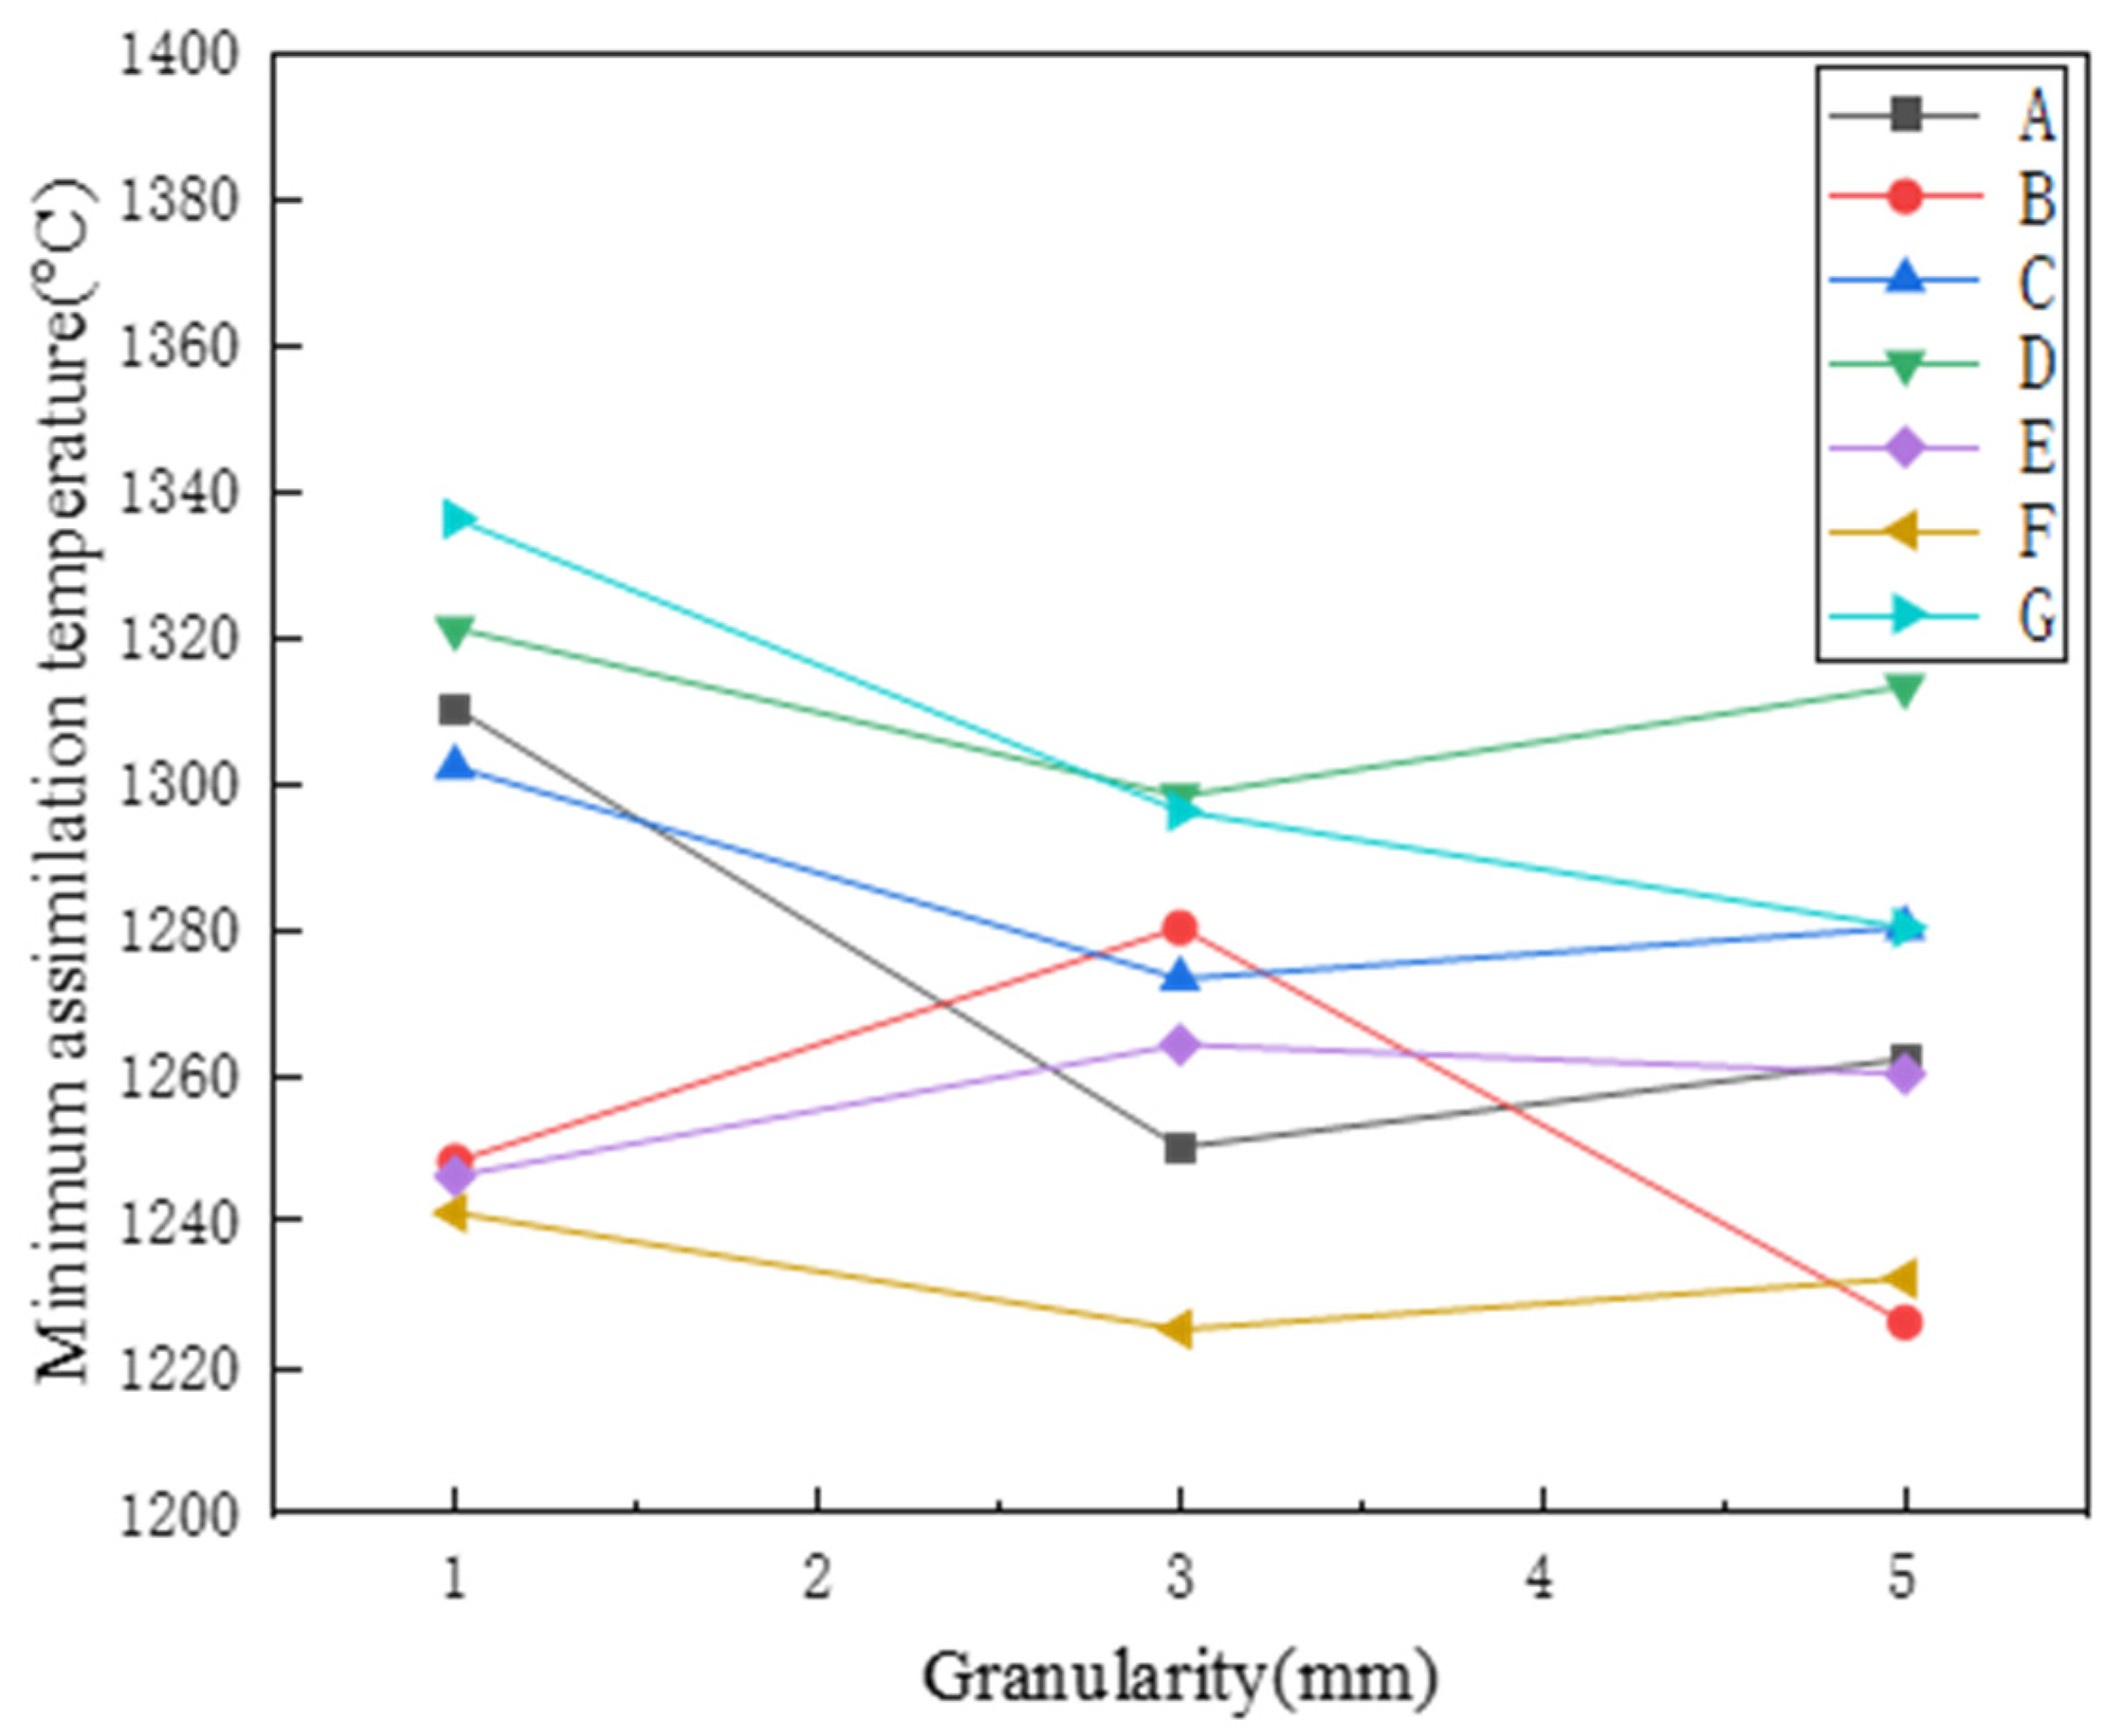
- The basic characteristics experiment based on the original particle size of ore powder was mainly divided into three particle sizes for comparative analysis. As for the assimilation temperature, with the gradual increase of particle size, the assimilation temperature showed a decreasing trend as a whole. However, due to the large particle size in the process of sample preparation and the positional relationship between the particles, the morphologies of the samples could not be generally unified, so there was a force majeure factor in the assimilation temperature measurement process. Therefore, the assimilation temperature alone cannot determine the performance of the mineral powder.
- (3)
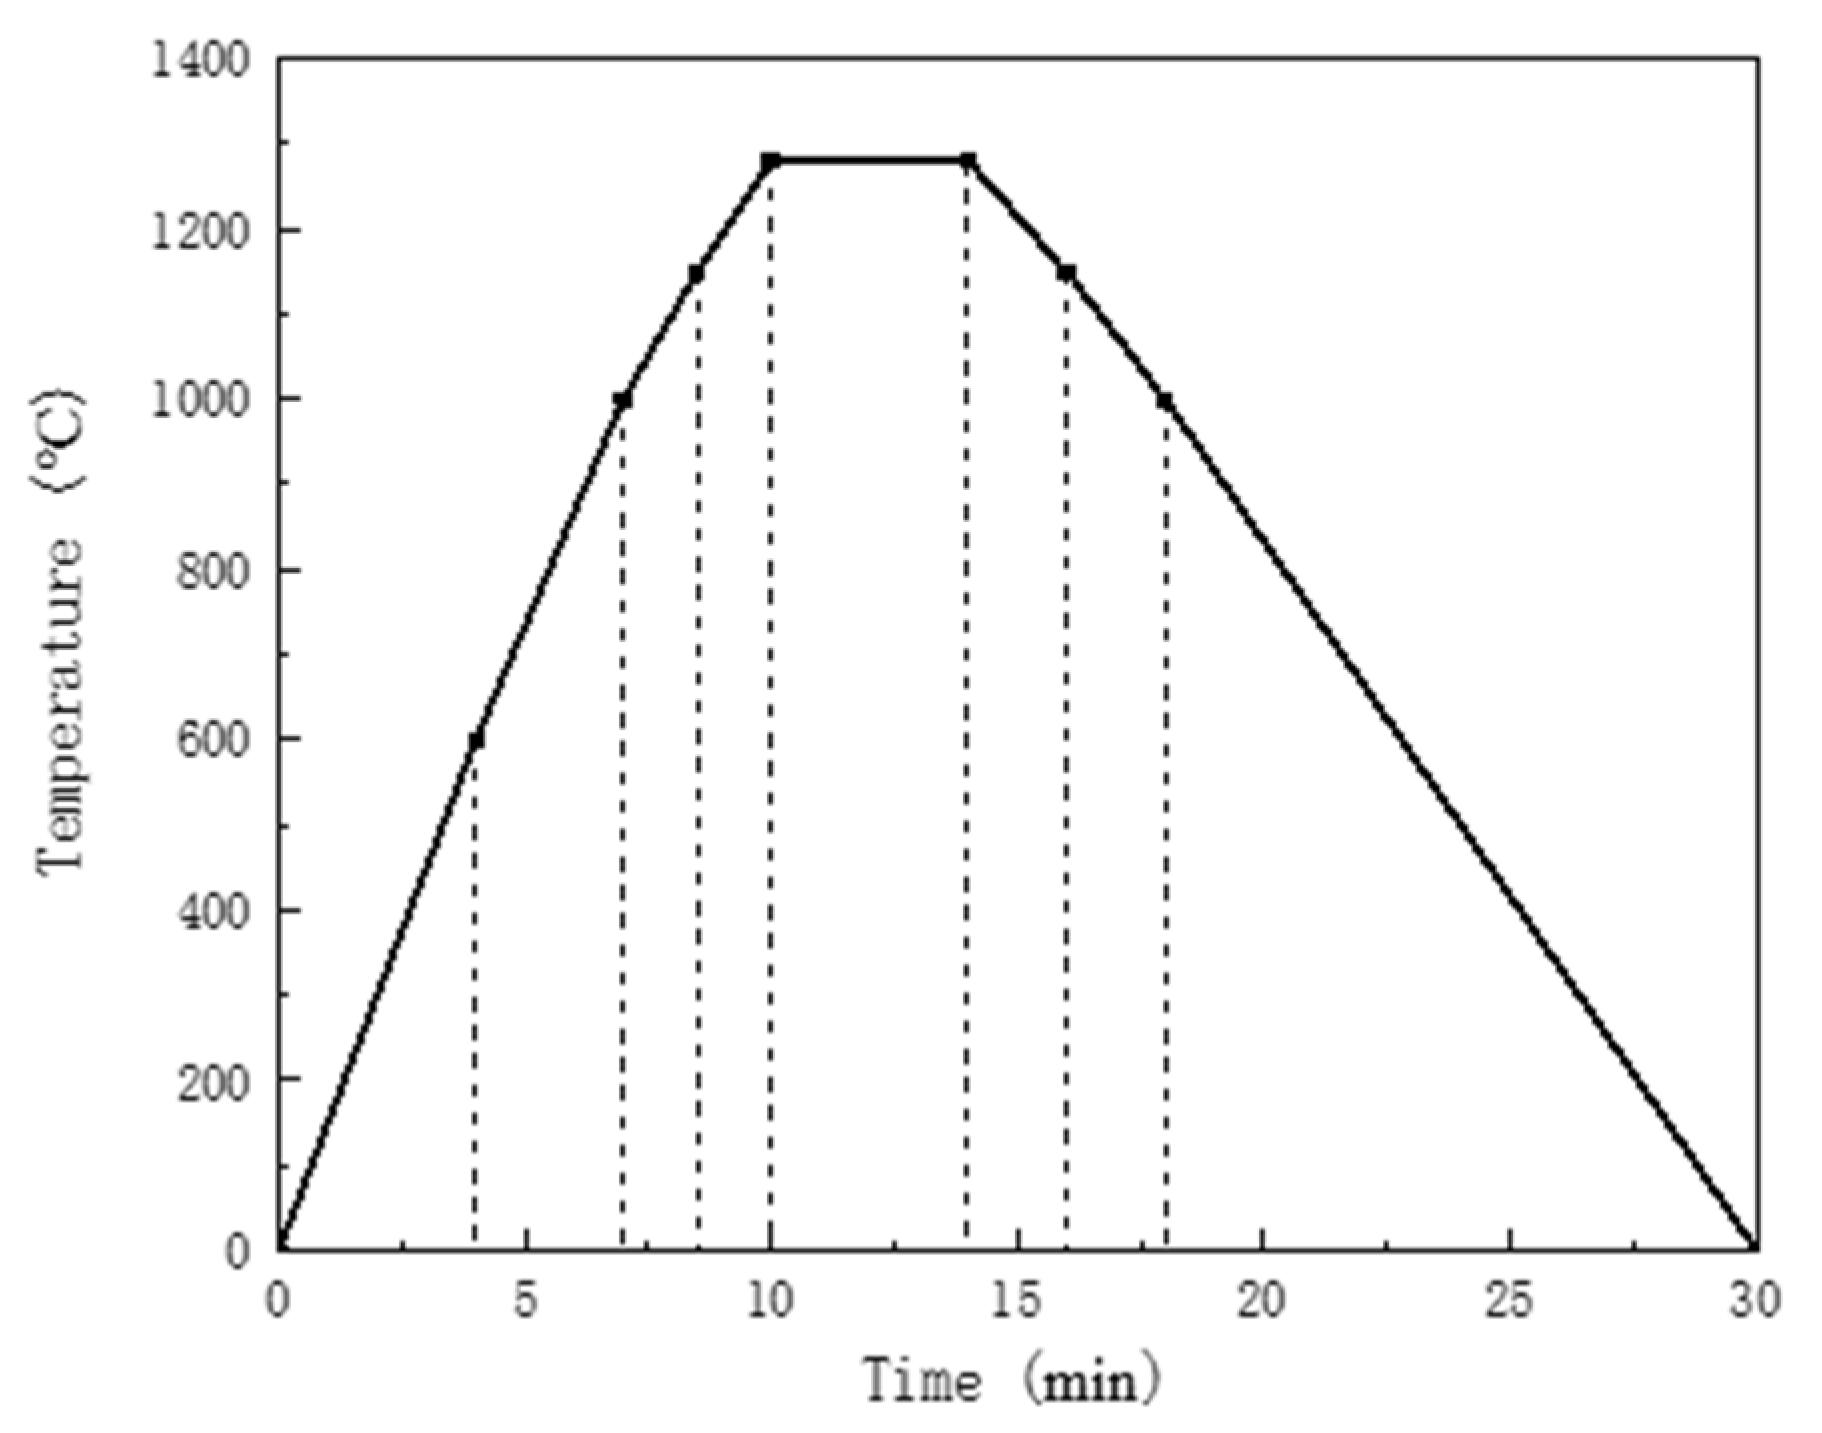
- Next, the system temperature was set to 1350 °C in the fluidity index determination. In order to show the flow characteristics of each mineral powder more intuitively, with the increase of particle size, the flow index from large to small, it was also observed that the fluidity indices of iron ore powders B, F, and G showed a polarized arrangement, while iron ore powder A showed the smallest fluidity index under each particle size of iron ore powder, similar to iron ore powder E. Therefore, the proportions of these ore powders should be appropriately reduced in the sintering to ensure that the final index of the sintered ore conforms to the actual production on site.
- (4)
- The final bonding phase strength was the best feature of the data visualization of each mineral powder. The strength of each ore powder varied significantly, and the binder phase strength of each grade of iron ore powders C and F was the best among all the ore powders. The SiO2 content of C was lower than that of F. If the low-silicon scheme is used for ore blending, the quality of sinter can be guaranteed by increasing the addition ratio of C iron ore powder. Iron ore powder B and iron ore powder E had the worst strength among all the ore powders. Such a binding phase strength cannot guarantee the quality of sintered ore, and it is recommended to reduce the amount used in the subsequent production. It needs to be used with iron ore powder with better basic properties.
Author Contributions
Funding
Data Availability Statement
Acknowledgments
Conflicts of Interest
References
- Shengli, W.; Yu, L.; Jianxin, D.; Kun, M.; Hong, L. New Concept of Iron Ores Sintering Basic Characteristics. J. Univ. Sci Technol B 2002, 24, 254–257. [Google Scholar]
- Lifen, L.; Shuhui, Z.; Qing, L.; Nahui, Z. Present Situation and Prospect of Ore Blending for Sinter Process. J. Iron Steel Res. 2013, 25, 1–5. [Google Scholar]
- Shengli, W.; Yu, L.; Jianxin, D.; Kun, M.; Hong, L. Experiment Study of Assimilation Ability between Iron Ores and CaO. J. Univ. Sci. Technol. B 2002, 24, 258–261. [Google Scholar]
- Shengli, W.; Yuandong, P.; Hui, C.; Peng, P.; Fan, Y. Evaluation on liquid phase fluidity of iron ore in sintering. J. Univ. Sci. Technol. B 2008, 30, 1095–1100. [Google Scholar]
- Hongxing, Z.; Jianliang, Z.; Zhengjian, L.; Yapeng, Z.; Zhiwu, Y. Discussion on ore-blending principle based on sintering foundational properties of iron ore fines of Qinggang. Chin. Metall. 2017, 27, 7–13. [Google Scholar]
- Donghui, L.; Qing, L.; Yanqin, S.; Leilei, Z.; Ran, L. Effect of Basic Characteristics of Iron Ores on Properties of Sinter. J. Iron Steel Res. 2013, 25, 29–34. [Google Scholar]
- Junshan, W.; Mingshun, Z.; Liwei, Z.; Jiu, L. Experimental Study on Basic Sintering Characteristics of Iron Ore inAnSteel. Min. Metall. Eng. 2013, 33, 94–97. [Google Scholar]
- Xiaohui, F.; Min, G.; Wenqi, L.; Qiang, W.; Luben, X.; Lin, H.; Xuling, C.; Lishun, Y. Prediction of suitable water content on the granulation of a sintering mixture. J. Univ. Sci. Technol. B 2012, 34, 373–377. [Google Scholar]
- Weiqing, H.; Xuxiao, Z.; Yangxia, L.; Zhiwang, Z. High effective utilization technology of limonite in sintering. J. Iron Steel Res. 2016, 28, 13–19. [Google Scholar]
- Yunqiang, X.; Zhongzhong, Z.; Zihong, Z.; Tiejun, C. Sintering basic characteristics of iron ores used in an iron and plant and optimum proportioning ores. Chin. Metall. 2018, 28, 9–15. [Google Scholar]
- Shengli, W.; Jianxin, D.; Hongbin, M.; YunQing, T.; Haifa, X. Fluidity of liquid phase in iron ores during sintering. J. Univ. Sci. Technol. B 2005, 27, 291–293, 320. [Google Scholar]
- Kai, Z.; Jie, L.; Yuzhu, Z.; Weixing, L.; Yue, L.; Yujiang, L. Experimental Study on Basic Characteristics and Ore-blending Optimization of Xingtai Steel Raw Materials for Sintering. Min. Metall. Eng. 2016, 36, 88–92. [Google Scholar]
- Guocheng, Z.; Guoping, L.; Wei, S.; Yifan, C. Effect of MgO on liquid phase formation properties and microstructure of sinter. Chin. Metall. 2021, 31, 8–16. [Google Scholar]
- Shuo, T.; Yici, W.; Luo, G.; Qiang, R.; Yifan, C.; Wei, S. Basic characteristics of four iron ore fines commonly used in steel plants. Chin. Metall. 2020, 30, 12–17. [Google Scholar]
- Changqing, H.; Tao, H.; Xuefeng, S. Formation behavior of calcium ferrite containing aluminum. Iron Steel 2020, 55, 70–74. [Google Scholar]
- Shengli, W.; Guoliang, Z.; Shaoguo, C.; Bo, S. Influencing Factors and Effects of Assimilation Characteristic of Iron Ores in Sintering Process. ISIJ Int. 2014, 54, 582–588. [Google Scholar]
- Lu, Y.; Shan, R.; Xiaoqing, W.; Qingcai, L.; Jianliang, Z.; Buxin, S. Study on liquid phase formation and fluidity of iron ores. Metall. Res. Technol. 2017, 114, 204. [Google Scholar]
- Jian, K.; Xiaojun, N.; Jiangliang, Z.; Yaozu, W.; Guilin, W.; Zhengjian, L. Effect of liquid phase generation behavior of sintering mixture on sinter quality. J. Iron Steel Res. 2020, 32, 860–867. [Google Scholar]
- Heping, L.; Shengli, W.; Zhibin, H.; Weili, Z.; Heng, Z.; Mingyin, K. The Mechanism of the Effect of Al2O3 Content on the Liquid Phase Fluidity of Iron Ore Fines. Processes 2019, 7, 931. [Google Scholar]
- Fang, Z.; Shengli, A.; Guoping, L.; Yici, W. Influencing Factors in Formation Characteristics of SFCA for Low Silica Sinters of Baogang. J. Iron Steel Res. 2012, 24, 24–28. [Google Scholar]


| Sample | TFe | SiO2 | CaO | MgO | Al2O3 | P | S | LOI |
|---|---|---|---|---|---|---|---|---|
| A | 58.19 | 5.55 | 0.06 | 0.13 | 3.95 | 0.135 | 0.039 | 7.2 |
| B | 58.64 | 5.64 | 0.03 | 0.09 | 2.70 | 0.079 | 0.034 | 6.8 |
| C | 62.95 | 5.04 | 0.02 | 0.08 | 1.45 | 0.070 | 0.016 | 4.5 |
| D | 57.39 | 5.04 | 0.02 | 0.08 | 6.45 | 0.060 | 0.073 | 6.0 |
| E | 60.50 | 4.66 | 0 | 0.09 | 2.52 | 0.079 | 0.031 | 5.5 |
| F | 56.79 | 6.33 | 0.04 | 0.10 | 3.34 | 0.080 | 0.030 | 9.0 |
| G | 59.20 | 5.72 | 0.05 | 0.12 | 3.26 | 0.046 | 0.038 | 5.5 |
Publisher’s Note: MDPI stays neutral with regard to jurisdictional claims in published maps and institutional affiliations. |
© 2022 by the authors. Licensee MDPI, Basel, Switzerland. This article is an open access article distributed under the terms and conditions of the Creative Commons Attribution (CC BY) license (https://creativecommons.org/licenses/by/4.0/).
Share and Cite
Li, Z.; Li, Y.; Duan, Y.; Yang, A.; Xu, Z.; Zhi, J. Study on the Basic Characteristics of Iron Ore Powder with Different Particle Sizes. Minerals 2022, 12, 973. https://doi.org/10.3390/min12080973
Li Z, Li Y, Duan Y, Yang A, Xu Z, Zhi J. Study on the Basic Characteristics of Iron Ore Powder with Different Particle Sizes. Minerals. 2022; 12(8):973. https://doi.org/10.3390/min12080973
Chicago/Turabian StyleLi, Zezheng, Yifan Li, Yuanshuai Duan, Aimin Yang, Zhenghan Xu, and Jianming Zhi. 2022. "Study on the Basic Characteristics of Iron Ore Powder with Different Particle Sizes" Minerals 12, no. 8: 973. https://doi.org/10.3390/min12080973