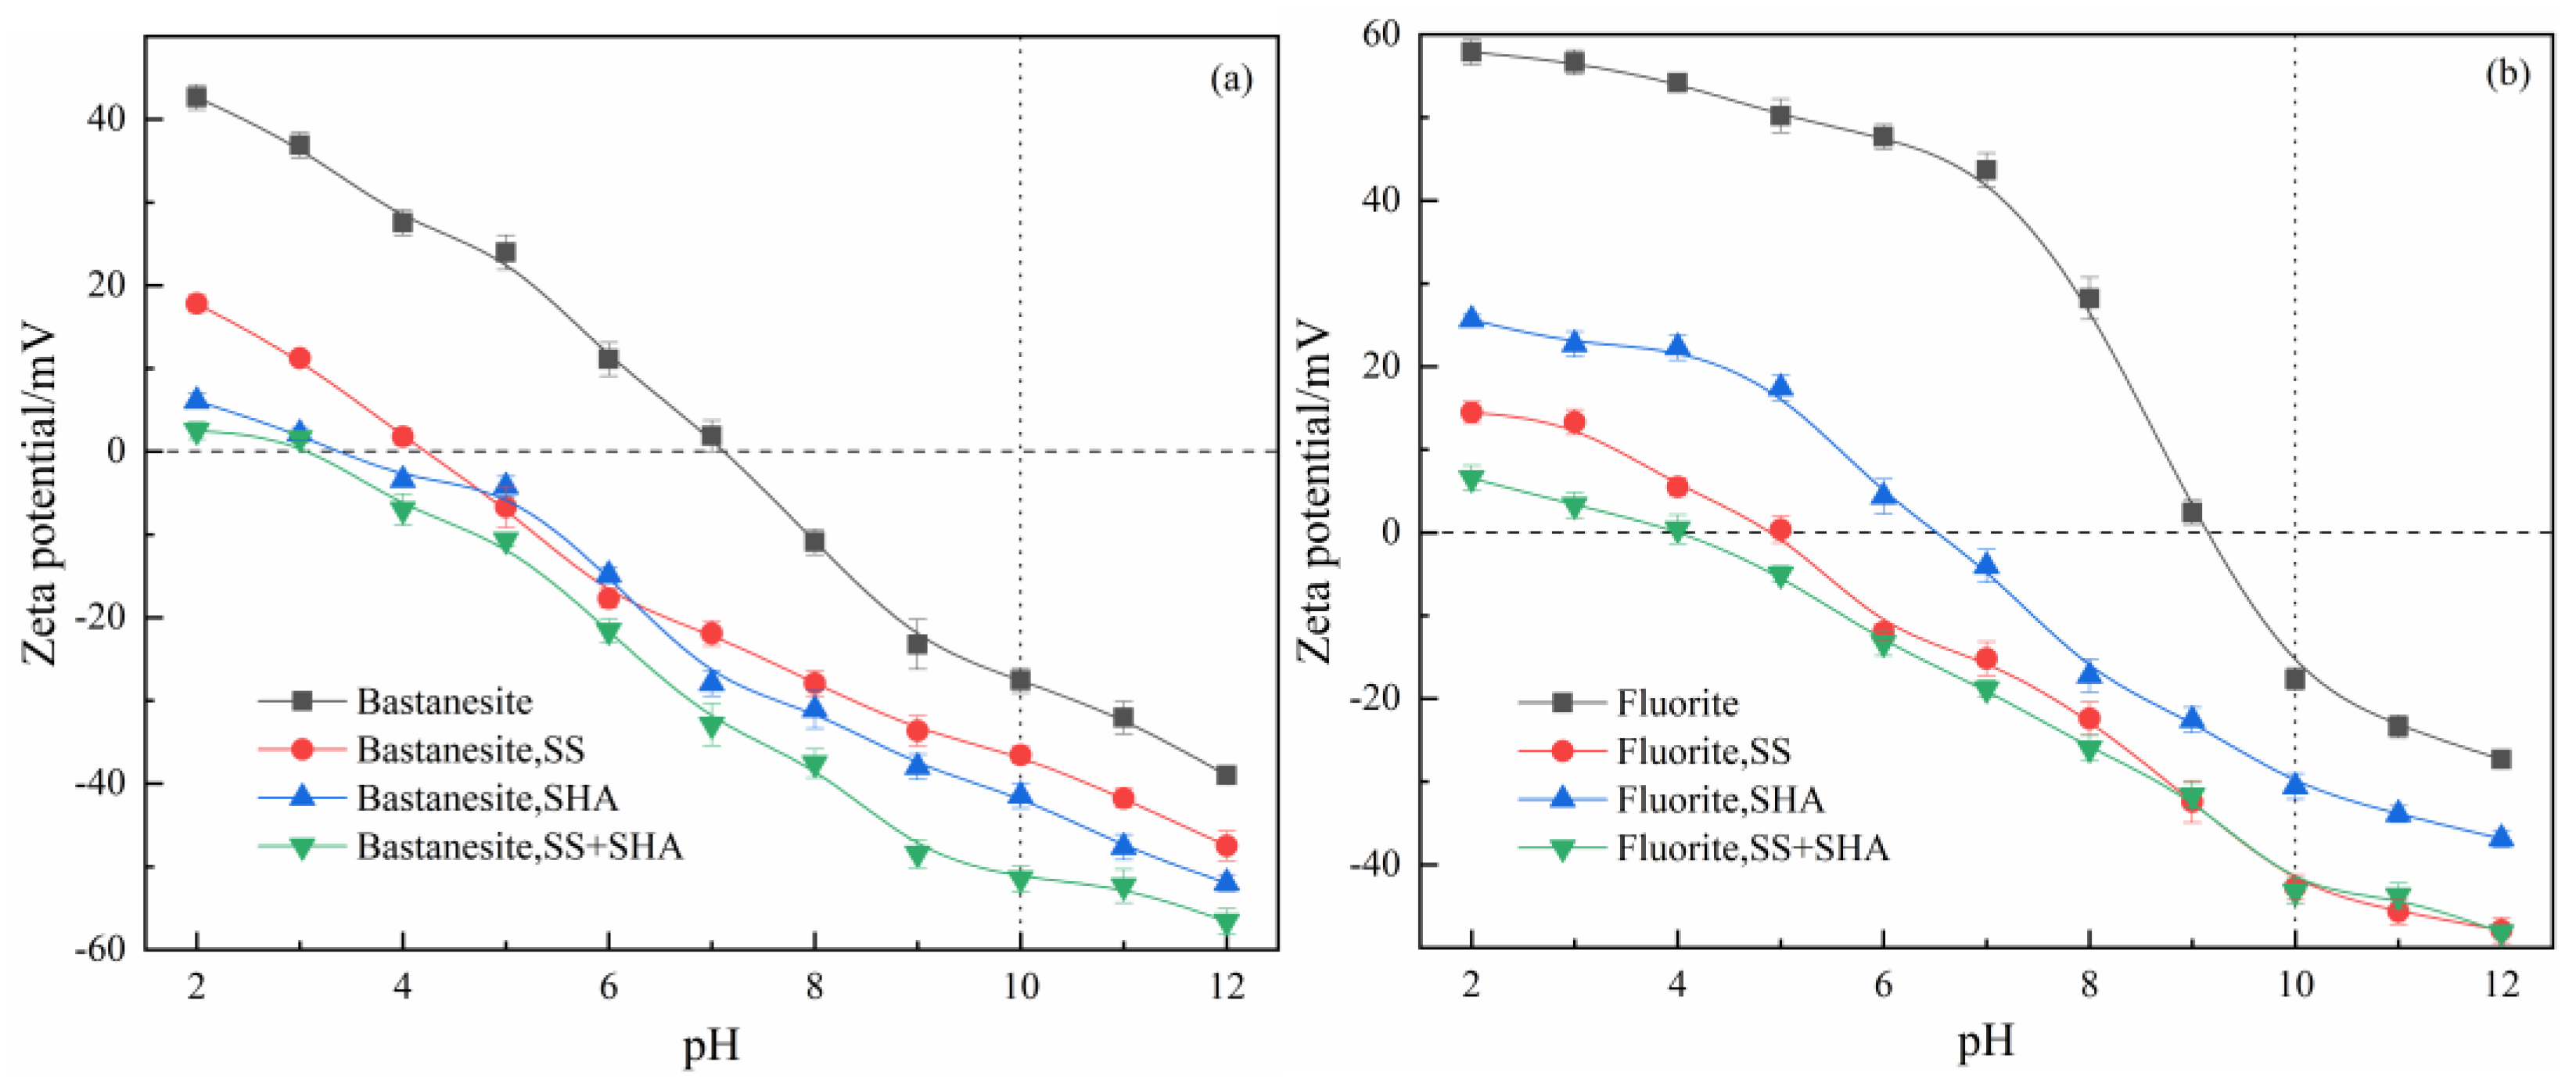
3.2. Potentiodynamic Measurements
The change of the Zeta potential on the mineral surface can indirectly represent the adsorption of flotation agents on the mineral surface under different pH conditions [
28,
29].
Figure 5 shows that the isoelectric points of bastnaesite and fluorite are 7.21 and 9.12, respectively, demonstrating the Zeta potentials of bastnaesite and fluorite before and after interaction with different reagents [
28,
30]. When SHA was used as the sole treatment, the Zeta potentials of bastnaesite and fluorite were negatively shifted as a result of adsorption between SHA and the mineral. After the zero point, the Zeta potentials of bastnaesite and fluorite were still negatively shifted, indicating chemisorption between SHA and the mineral [
26,
31].
When SS was added alone, the Zeta potential of bastnaesite shifted slightly in a negative direction, indicating an interaction between the SS components and bastnaesite. The negative shift of the Zeta potential of fluorite over the whole pH range indicates that the interaction between the SS and fluorite is stronger, and there is also chemisorption, in addition to electrostatic adsorption [
32]. More precisely, at pH 10, the Zeta potential of the bastnaesite shifts by −6.43 mV (from −29.23 mV to −35.66 mV), and the Zeta potential of the fluorite shifts by −25.48 mV (from −18.91 mV to −44.39 mV).
When adding SS and SHA, the Zeta potential of the bastnaesite still shows a significant negative shift at pH 10 from −29.23 mV to −53.11 mV. These results show that SHA can adsorb on the surface of bastnaesite, even in the presence of SS, and the Zeta potential shift of bastnaesite is more obvious under the action of SHA, which indicates that the adsorption capacity of SS on the surface of bastnaesite is weaker than SHA, which is the reason for the good floatability of bastnaesite at a low SS concentration [
33,
34]. However, the Zeta potential after both SS and SHA treatment of the fluorite was almost the same as that of the fluorite interacting with SS alone, indicating that adsorption on the SS fluorite surface was stronger than that on SHA. The results show that the presence of SS hinders the further adsorption of SHA on the fluorite surface. Therefore, SS has a stronger inhibitory effect on fluorite than bastnaesite.
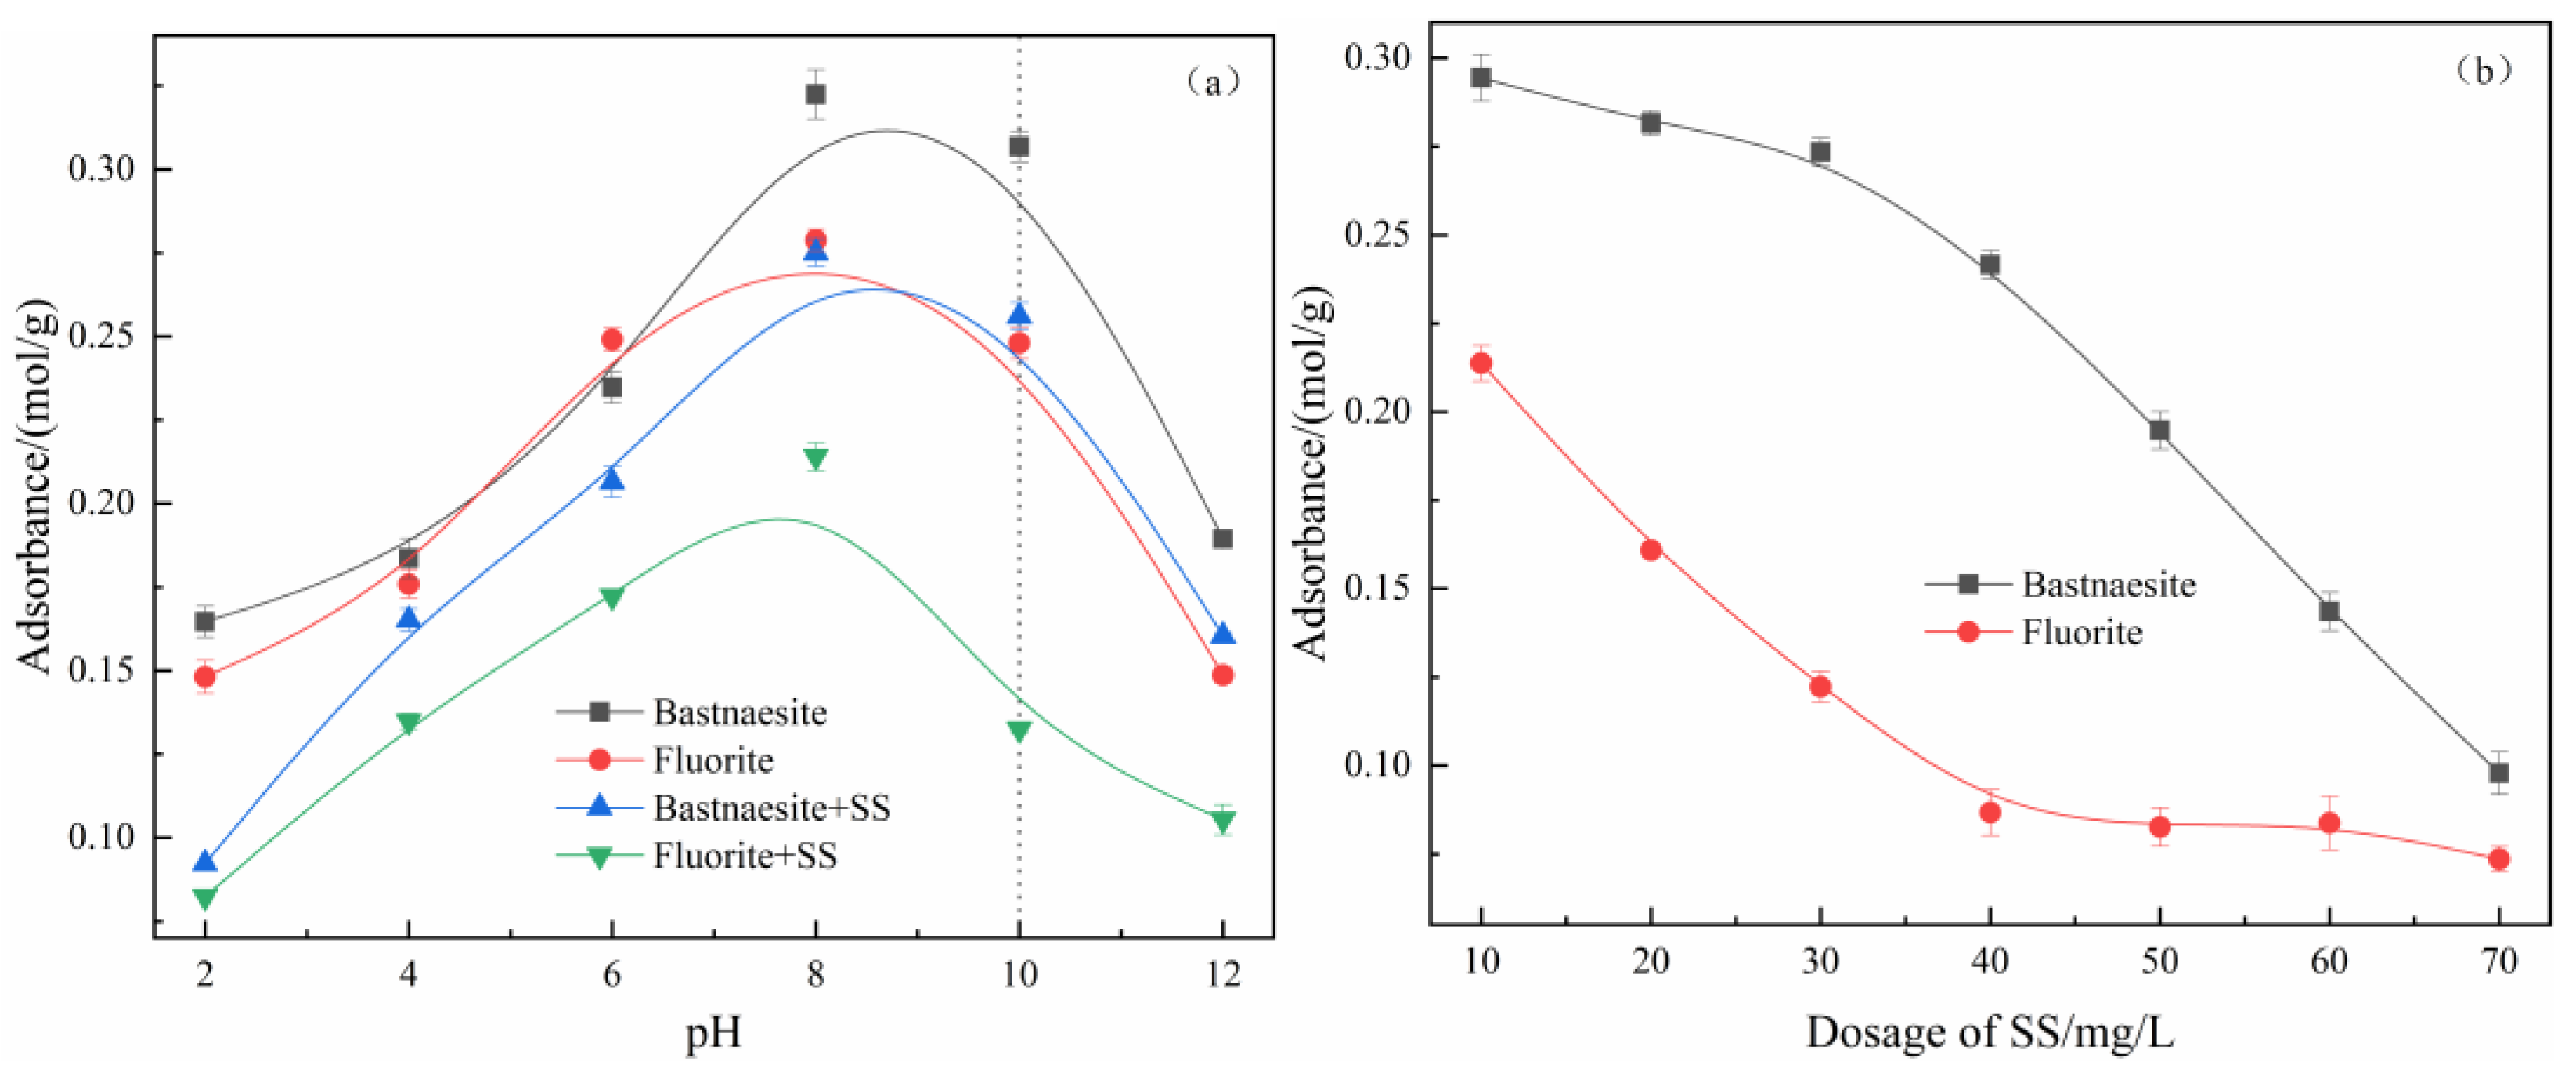
3.3. Adsorption Capacity and Solution Chemistry
Figure 6 shows the experimental results of SHA adsorption on the bastnaesite and fluorite surfaces with/without SS.
Figure 6a shows that without SS, the maximum adsorption amount of fluorite is at pH 7–8, and the maximum adsorption amount of bastnaesite is at pH 8–10. When adding SS and pH > 9.5, the presence of SS leads to a significant decrease in the adsorption amount of SHA on the fluorite surface. The adsorption experiments shown in
Figure 6b investigate the effect of SS dose on SHA adsorption at pH 10. When the dose of SS is low, SHA adsorption on the surface of the bastnaesite is slightly reduced, while SHA adsorption on the surface of the fluorite is greatly reduced. The inhibition of SHA adsorption on the fluorite surface by SS indicates that SS has a stronger adsorption capacity on fluorite than SHA, which may also explain the results of the single mineral flotation experiments. This phenomenon may be due to the chemical reaction between SS and the fluorite surface, resulting in more stable substances.
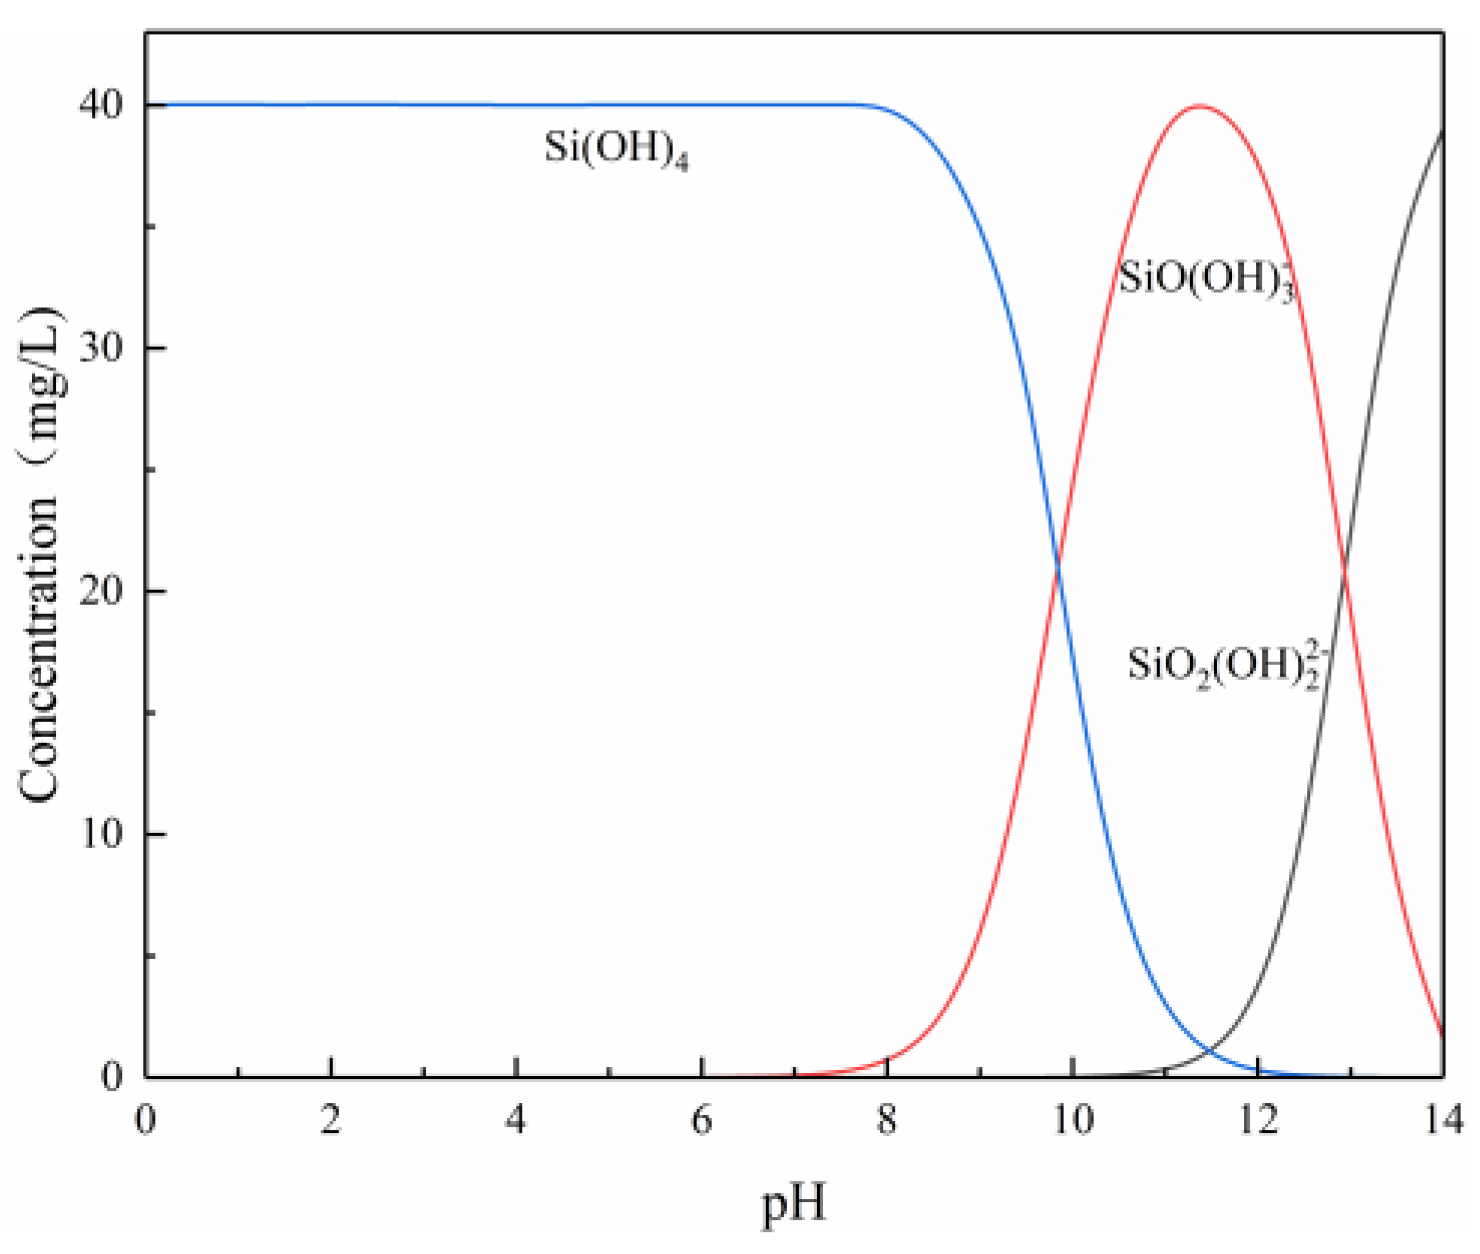
In the flotation process, the inhibitor in pulp shows various shapes under different pH conditions, and the form of the inhibitor has a certain influence on the flotation performance [
29,
31,
35]. The solution chemistry of SS can be analyzed to obtain the distribution coefficients of each component at different pH values.
Figure 7 shows the functional relationship between the hydrolysis components of SS and pH. When the pH < 9.5, the main component of SS in the solution is Si(OH)
4; when the pH is 9.5–12.4, the main component of SS in the solution is
at pH 9.5–12.5; and when pH ≥ 12.5, the main component of SS in the solution is
[
36,
37]. When SS acts, the pH of the slurry is 9.5–12, and the main component in the solution is
. Silicate particles adsorb on the fluorite surface with high solid strength and a large adsorption capacity, which reduces fluorite recovery. In contrast, the adsorption capacity of bastnaesite is small, and the fixation strength is weak. Thus, SS has good selectivity [
35,
38]. At pH 9.5–12.5, SS has the strongest adsorption capacity on the fluorite surface, which explains why SHA adsorbed on the fluorite surface decreases significantly in this pH range and further verifies the results of the single mineral flotation test.
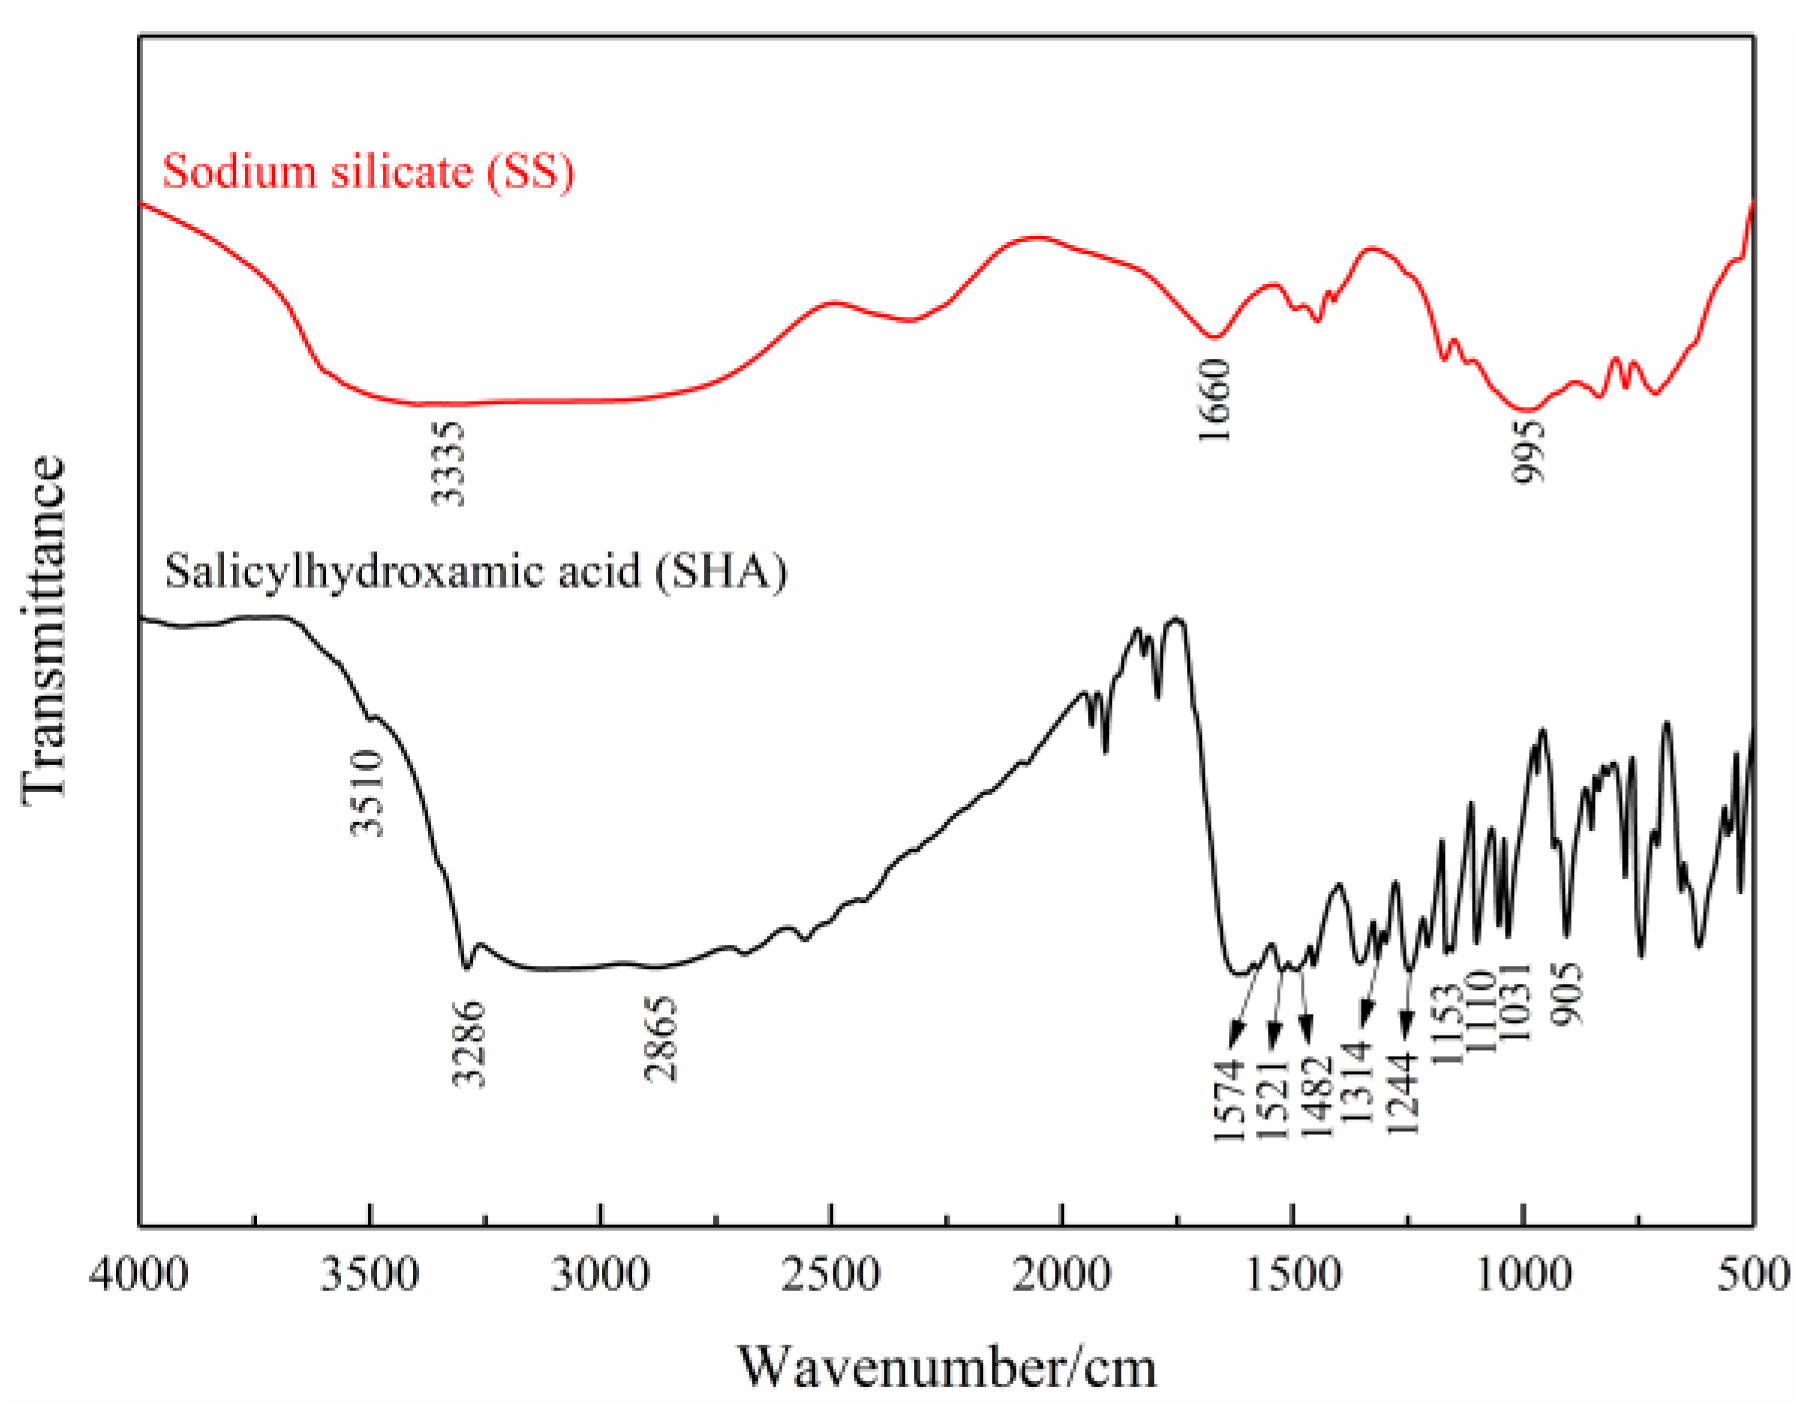
3.4. Infrared Spectroscopy Analysis
The interference of SS adsorption on bastnaesite and fluorite on SHA was studied by infrared spectrum analysis of SS, SHA and treated bastnaesite and fluorite. The spectra of SHA and SS are shown in
Figure 8.
Table 4 shows the main bands corresponding to the relevant chemical bonds. In the FTIR spectra of SHA, 3283 cm
−1 and 3050 cm
−1 are the stretching vibrations of -OH with CH
3 on the benzene ring [
38,
39]; the spectra of 1521 cm
−1 and 1153 cm
−1 correspond to the stretching vibrations of benzene rings C=C and C=O, respectively. The spectra at 903 cm
−1 and 1031 cm
−1 are the asymmetrical and symmetrical tensile vibrations of -C-N and =N-O, respectively, which are major functional groups of SHA [
39]. In the infrared spectrum of SS, the absorption peaks of 3335 cm
−1 and 1660 cm
−1 are the -OH stretching vibration and bending vibration absorption peaks of SS, and the absorption peaks of 995 cm
−1 are the Si-O stretching vibration absorption peaks of SS at 995 cm
−1 [
40].
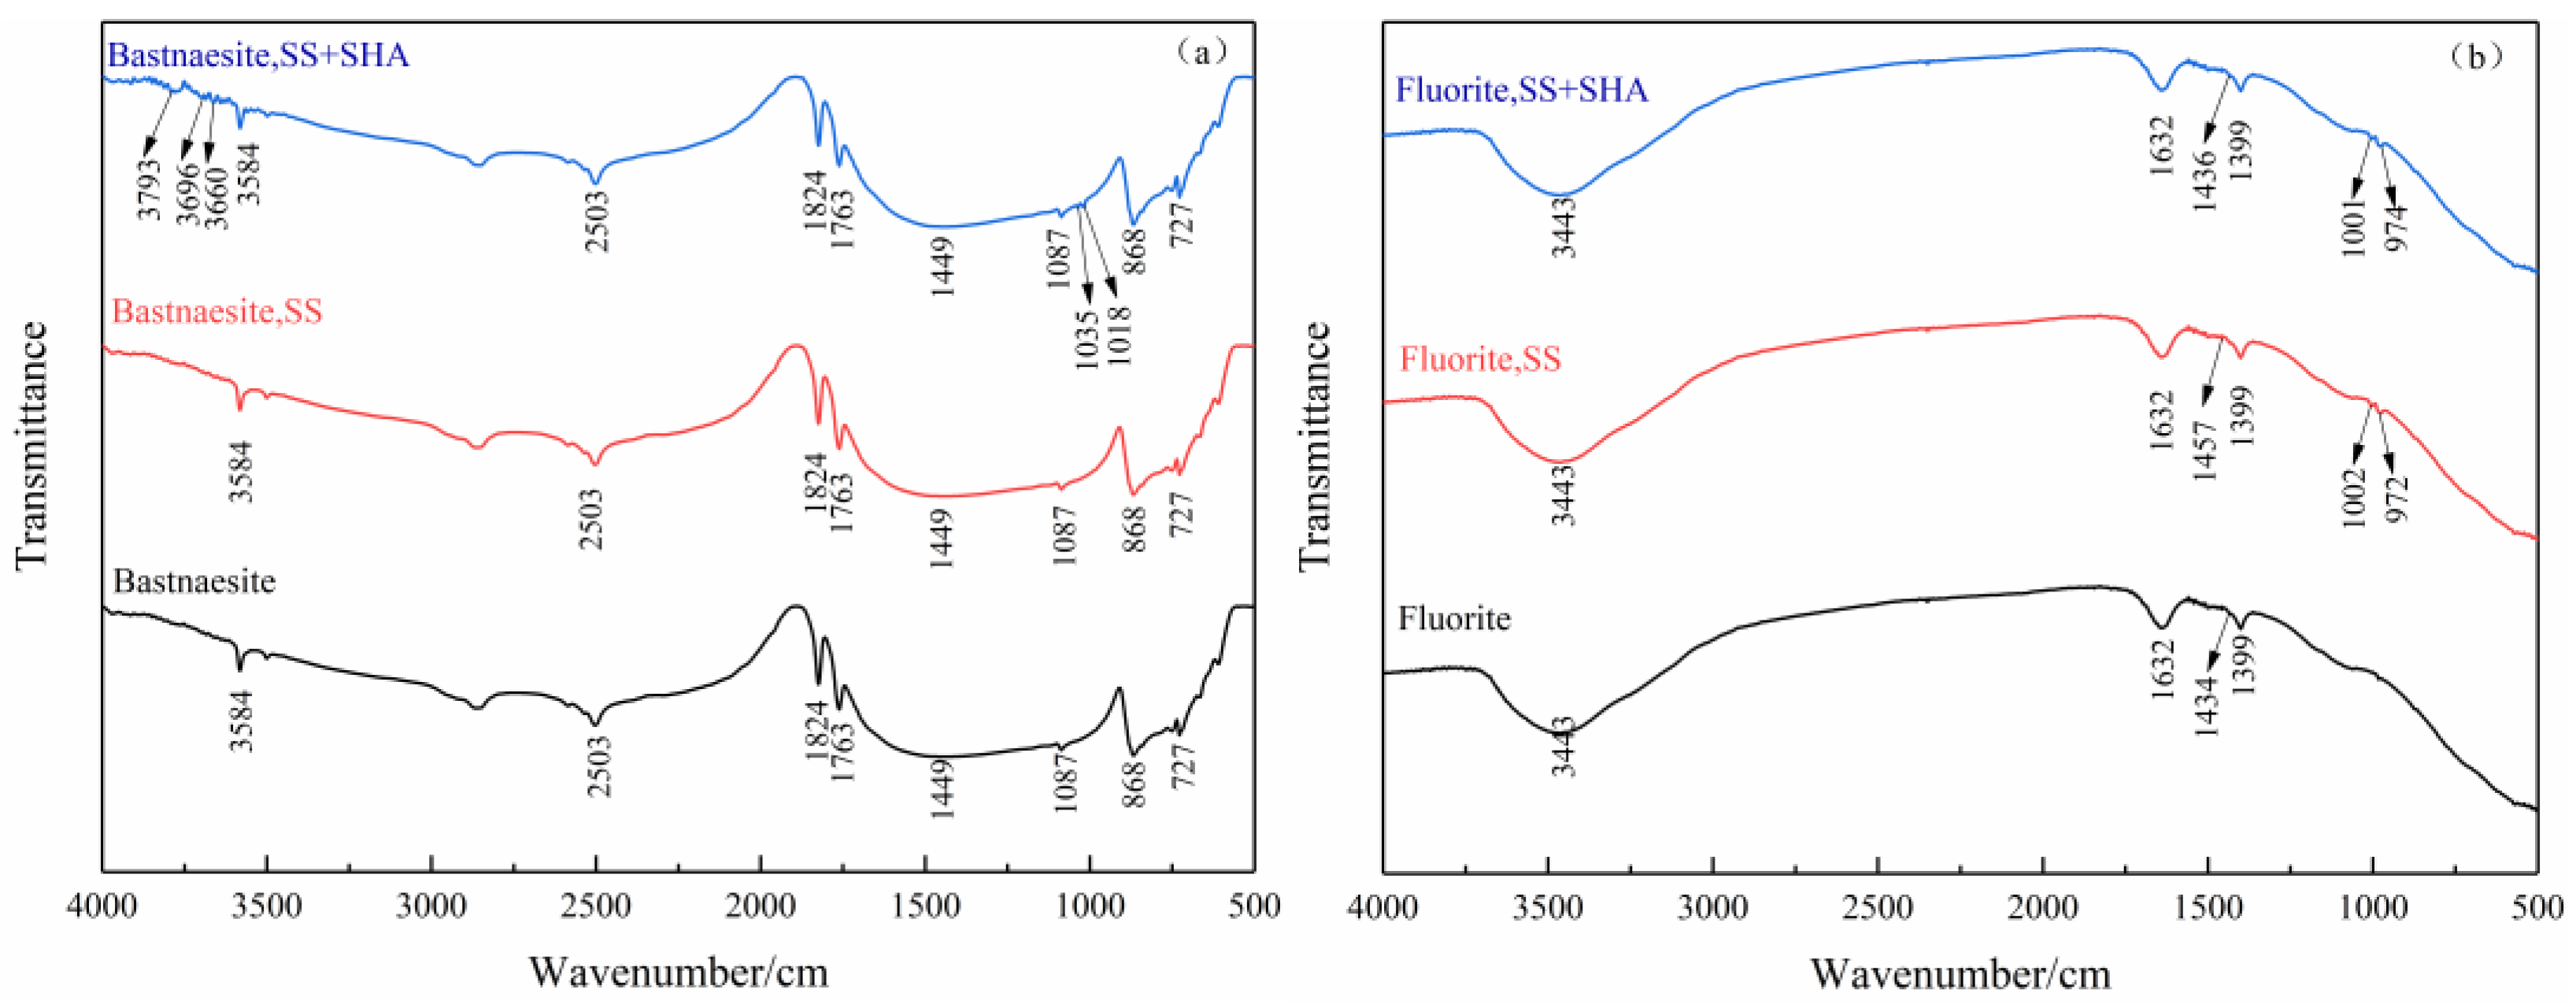
Figure 9a shows the infrared spectra of SHA- and SS-treated bastnaesite. The characteristic peak at 3584 cm
−1 in the pure bastnaesite is due to the -OH stretching vibration from water in the air or on the surface of the sample, which indicates that the ions are hydroxylated at pH 10 and that the planar bending vibration and asymmetric stretching vibration of 2503 cm
−1 in bastnaesite occur [
41]. The peaks at 1824 cm
−1 and 1763 cm
−1 are attributed to stretching caused by the coordination between the C=O bond and rare-earth element cations [
39]. The bands at 1445 cm
−1 and 1085 cm
−1 are attributed to the asymmetric stretching of carbonate. The bands at 867 cm
−1 and 723 cm
−1 are the out-of-plane and in-plane bending of carbonate [
39,
42]. After the ore is treated with SS alone, there is no SS band, indicating that SS is not obviously adsorbed on the bastnaesite surface. After SS and SHA treatment, the spectrum of bastnaesite shows the characteristic peaks of tensile vibration of C-O and N-H at 3793 cm
−1, 3696 cm
−1, 3660 cm
−1 and 3584 cm
−1, and the characteristic peaks of out-of-plane bending of =N-O are at 1035 cm
−1 and 1018 cm
−1 [
39,
41,
42]. The results show that the presence of SS does not affect the adsorption of SHA on the bastnaesite surface.
Figure 9b shows the infrared spectrum of fluorite before and after SS and SHA treatment. For fluorite, the broad peaks near 3443 cm
−1 and 1632 cm
−1 are attributed to adsorbed water molecules, and the characteristic peaks at 1434 cm
−1 and 1399 cm
−1 are attributed to fluorite [
43,
44]. After SS treatment, there are new characteristic peaks at 1002 cm
−1 and 974 cm
−1 on the fluorite surface, which may be caused by the tensile vibration of Si-O, indicating that there are
groups on the fluorite surface [
45]. Moreover, the characteristic peak of fluorite at 1434 cm
−1 moves to 1457 cm
−1, indicating that SS is adsorbed on the fluorite surface [
45,
46]. There are no new characteristic peaks on the fluorite surface treated with SHA and SS, unlike that of the surface treated with SS alone. FTIR analysis showed that the surface of the bastnaesite treated with SS did not affect the further adsorption of SHA. When SS and SHA are both used as treatments, the IR spectra of the fluorite are very similar to those of the SS alone. SS can hinder SHA adsorption behavior on the fluorite surface, which further confirms that SS selectively inhibits the fluorite surface, thereby reducing fluorite floatability.
3.5. XPS Measurement Results
Table 5 shows the change of the relative atomic concentration before and after the interaction of the flotation reagent with bastnaesite and fluorite. After SS treatment, the atomic concentrations of C, Ce, La and F decreased slightly, while the atomic concentrations of O and Si only slightly increase [
47,
48]. After SS and SHA treatment, the C and N atomic concentrations increase by 7.43% and 2.12%, respectively; the Si atomic concentration increases slightly; the O, Ce and La atomic concentrations decrease by 7.28%, 1.00% and 1.36%, respectively; and the F atomic concentration decreases slightly. When compared with bastnaesite, the relative atomic concentration of the fluorite surface treated with SS changes significantly. The atomic concentrations of F, Ca and C decrease by 3.59%, 1.56% and 0.7%, respectively, and the atomic concentrations of O and Si increase by 3.83% and 2.02%, respectively. Especially, significant changes in the Si content suggest that a lot of SS is adsorbed on the fluorite surface. Consequently, the adsorption behavior of the flotation reagents on the mineral surface was further studied.
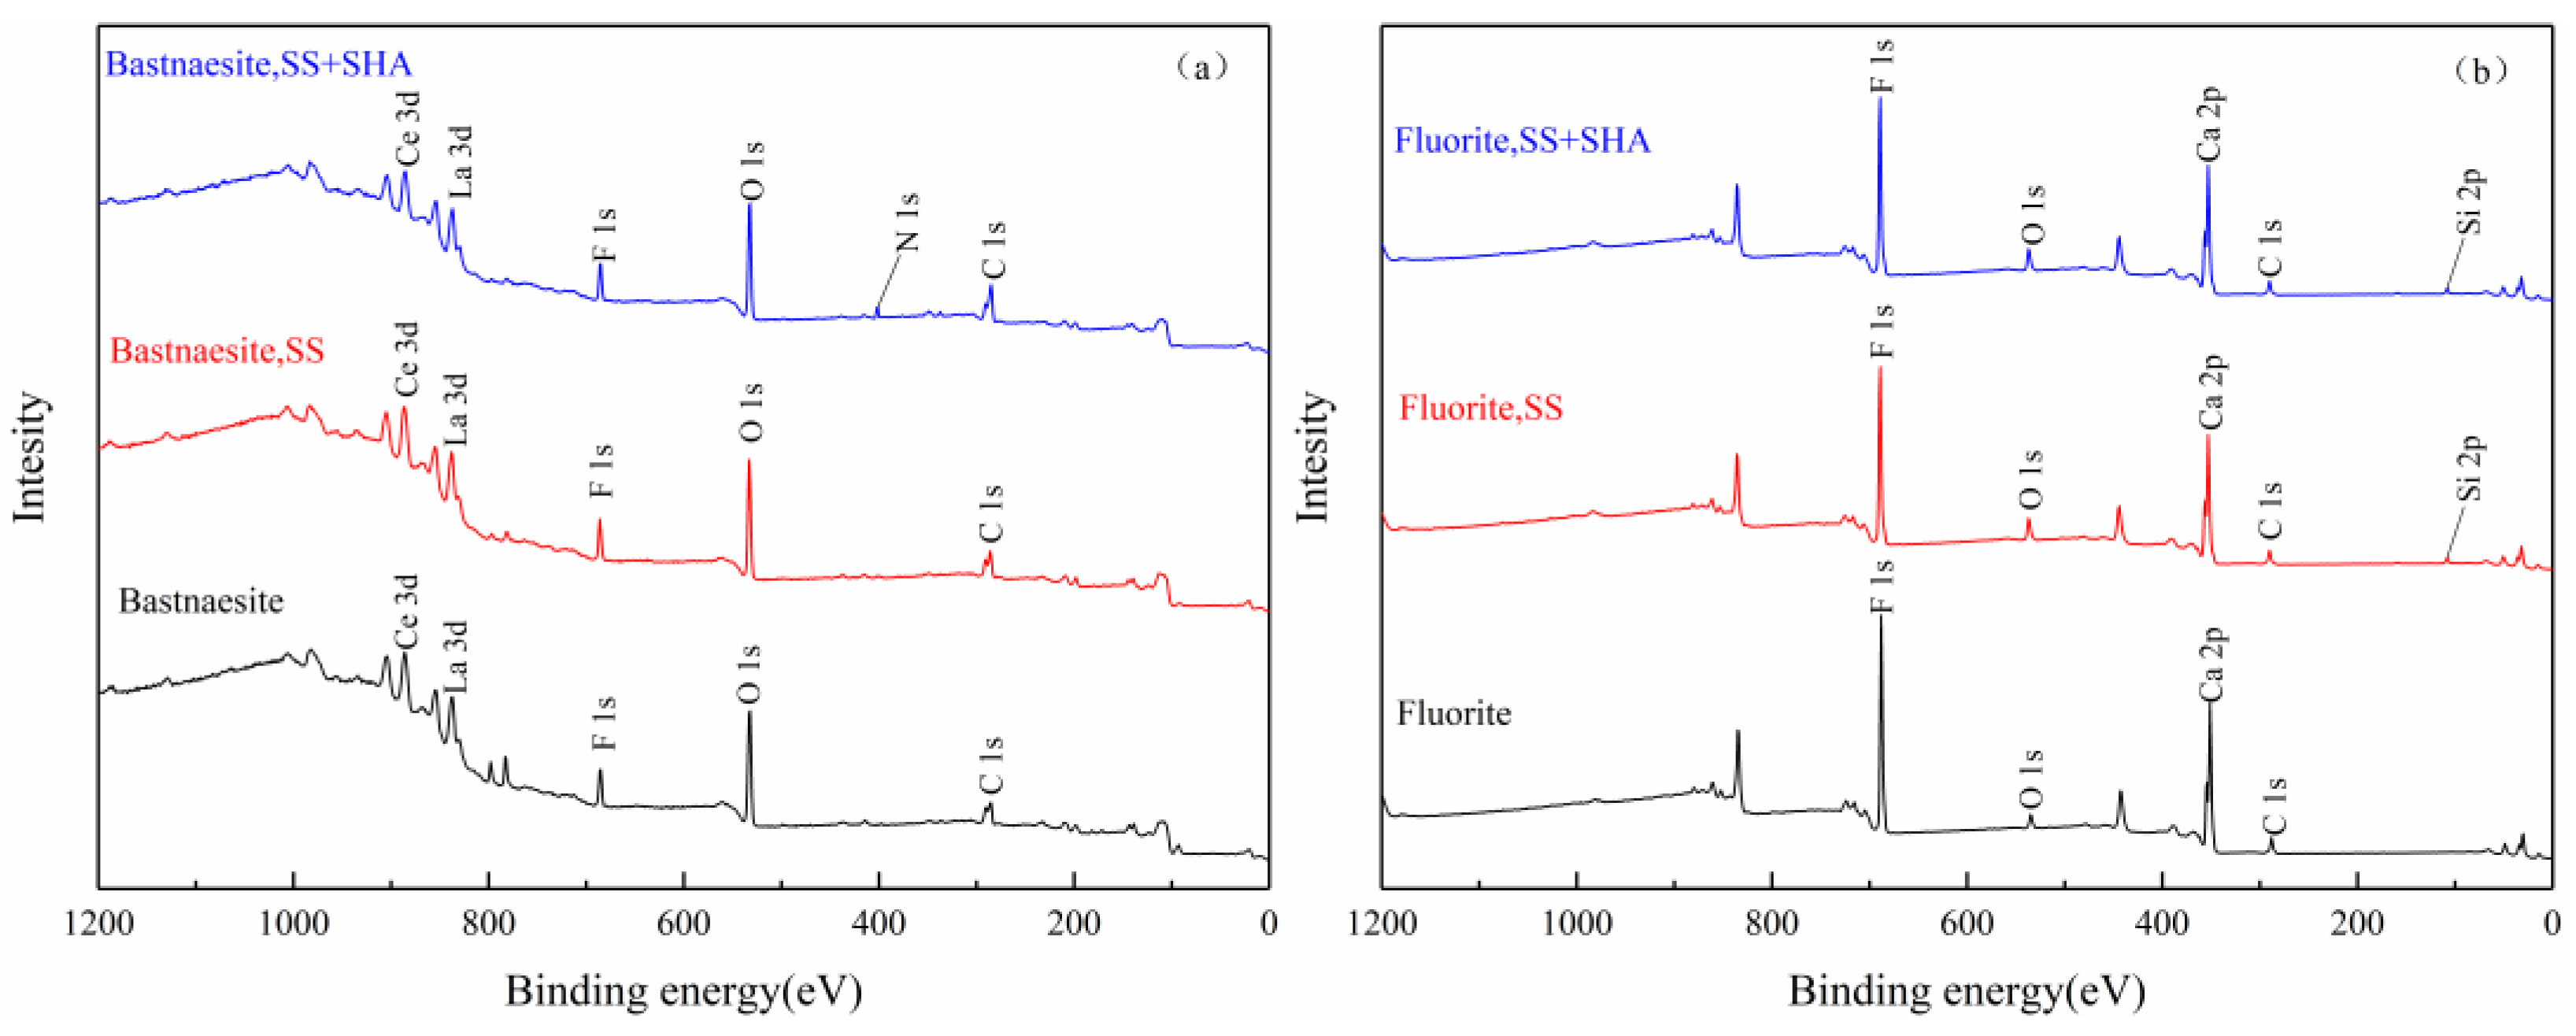
Figure 10 shows the XPS spectra of minerals treated with/without flotation reagents.
Figure 10a shows that after adding SS alone, there is no obvious change in the spectrum of the bastnaesite. After the interaction between SS and SHA, a new N 1s peak appears on the surface of the bastnaesite, and SS does not affect the adsorption of SHA on the surface of the bastnaesite.
Figure 10b shows that after adding SS alone, the spectrum of the fluorite shows a new peak at Si 2p, and there are no new peaks where SS and SHA coexist, indicating that a large amount of SS covers the surface of the fluorite, and the presence of SS hinders the adsorption of SHA on the fluorite.
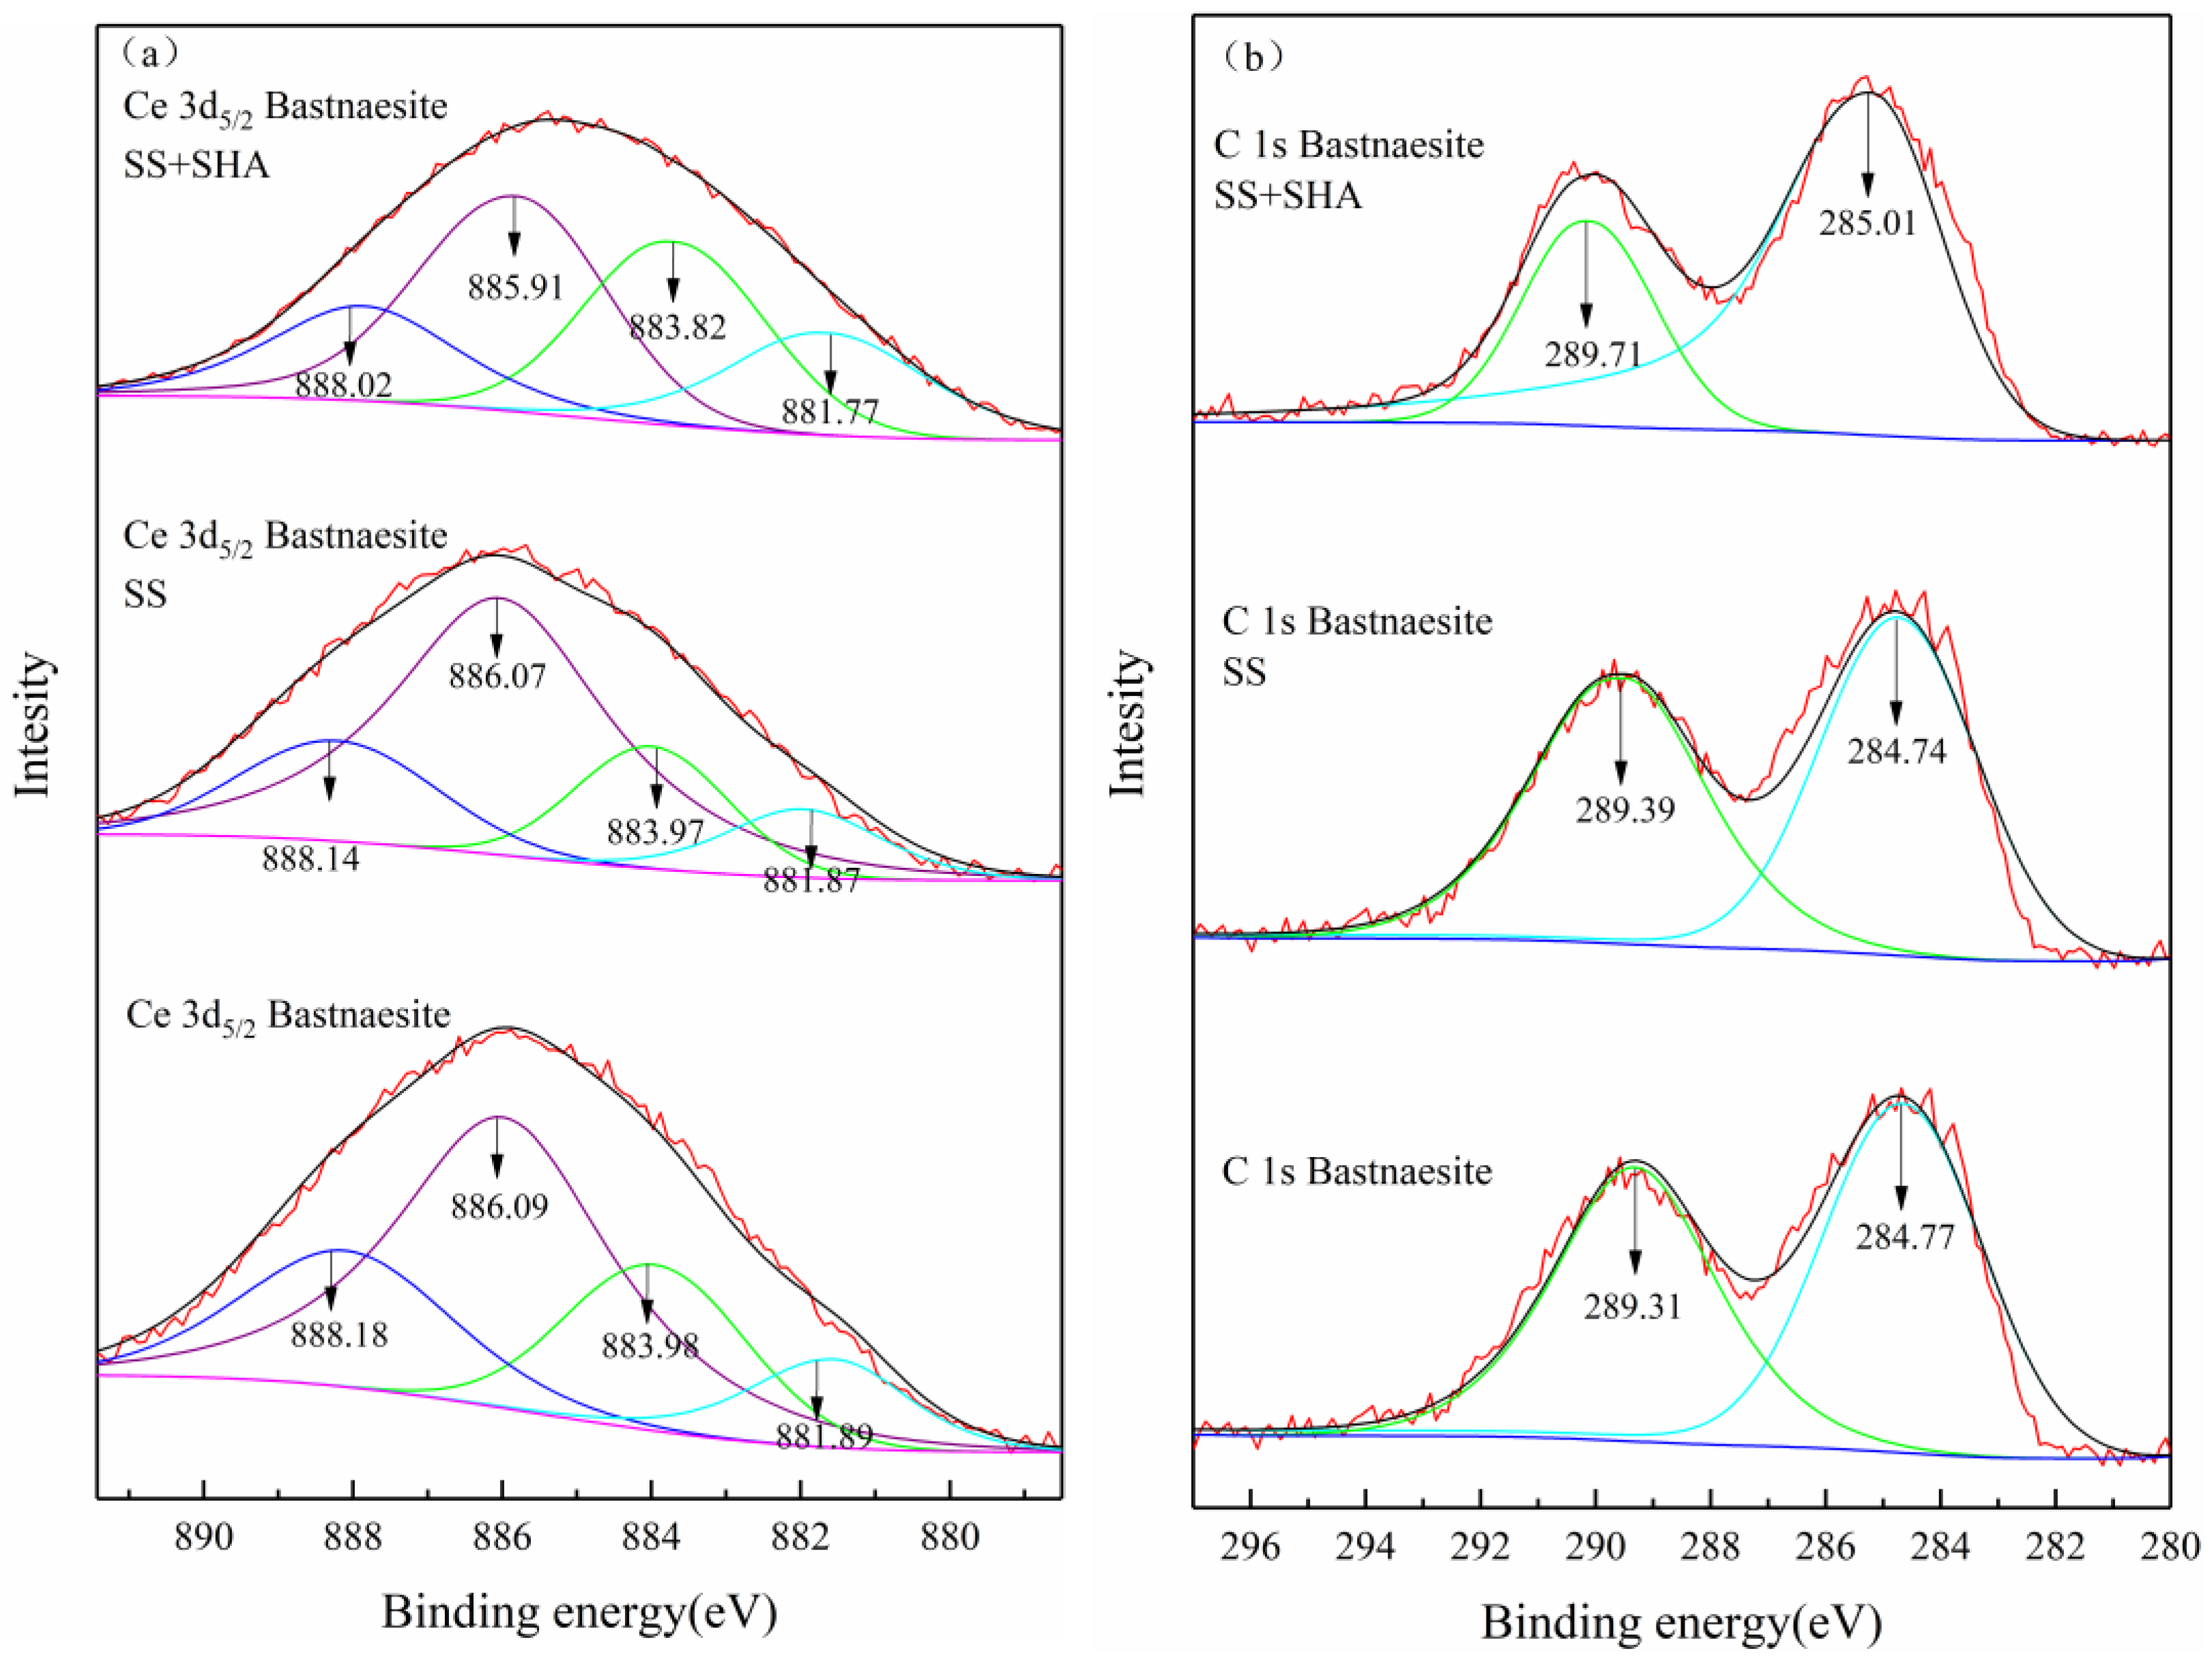
Figure 11a shows the high-definition Ce 3d
5/2 XPS spectra of the pure and flotation reagent-treated bastnaesite samples, and the detailed analysis results of the Ce 3d
5/2 XPS spectra are shown in
Table 6. In the pure bastnaesite spectra, the three-dimensional Ce spectrum consists of spin-orbital split 3d
5/2 and 3d
3/2 nuclear pores, and 3d
5/2 is closely linked to the 3d
3/2 spectrum. In general, the binding energy of 3d
3/2 is 18–19 eV higher than that of 3d
5/2, and the intensity ratio between 3d
5/2 and 3d
3/2 is 1.5 [
49,
50]. For the sake of clarity, only the Ce 3d
5/2 spectrum is analyzed and displayed in this study. The peaks of 888.18 eV and 888.18eV are more likely to be related to Ce (III), which may be due to the complex electron configuration of Ce atoms and the effect of F atoms on the crystal structure of bastnaesite [
50,
51]. The Ce 3d
5/2 slightly shifted (<0.10) after adding SS alone, all within the instrument error range [
52]. When SS and SHA were added together, the Ce 3d
5/2 peak near 531.55 eV decreased by 0.16 ± 0.02 eV. The decrease in binding energy indicates that the SHA is chemically adsorbed on the Ce ions on the surface of the bastnaesite.
Figure 11b shows the high-resolution C 1s XPS spectra of the pure and flotation reagent-treated bastnaesite samples, and the detailed analysis results of the C 1s XPS spectra are shown in
Table 7. The results show that the C 1s XPS spectra of pure bastnaesite have two peaks at the binding energies of C-C and
of 284.77 eV and 289.31 eV, respectively. The results show that the C 1s XPS spectra of pure bastnaesite can have two component peaks at binding energies of 284.77 eV and 289.31 eV from C-C and
, respectively [
53,
54]. In the C 1s XPS spectra of the bastnaesite treated by SS alone, there is no obvious shift of the C 1s peak, while the peaks at 284.77 eV and 289.31 eV move forward by 0.24 eV and 0.40 eV, respectively, after SS and SHA treatment. This shift may be due to the superposition of the SHA C=O group with
on the surface of the bastnaesite [
55].
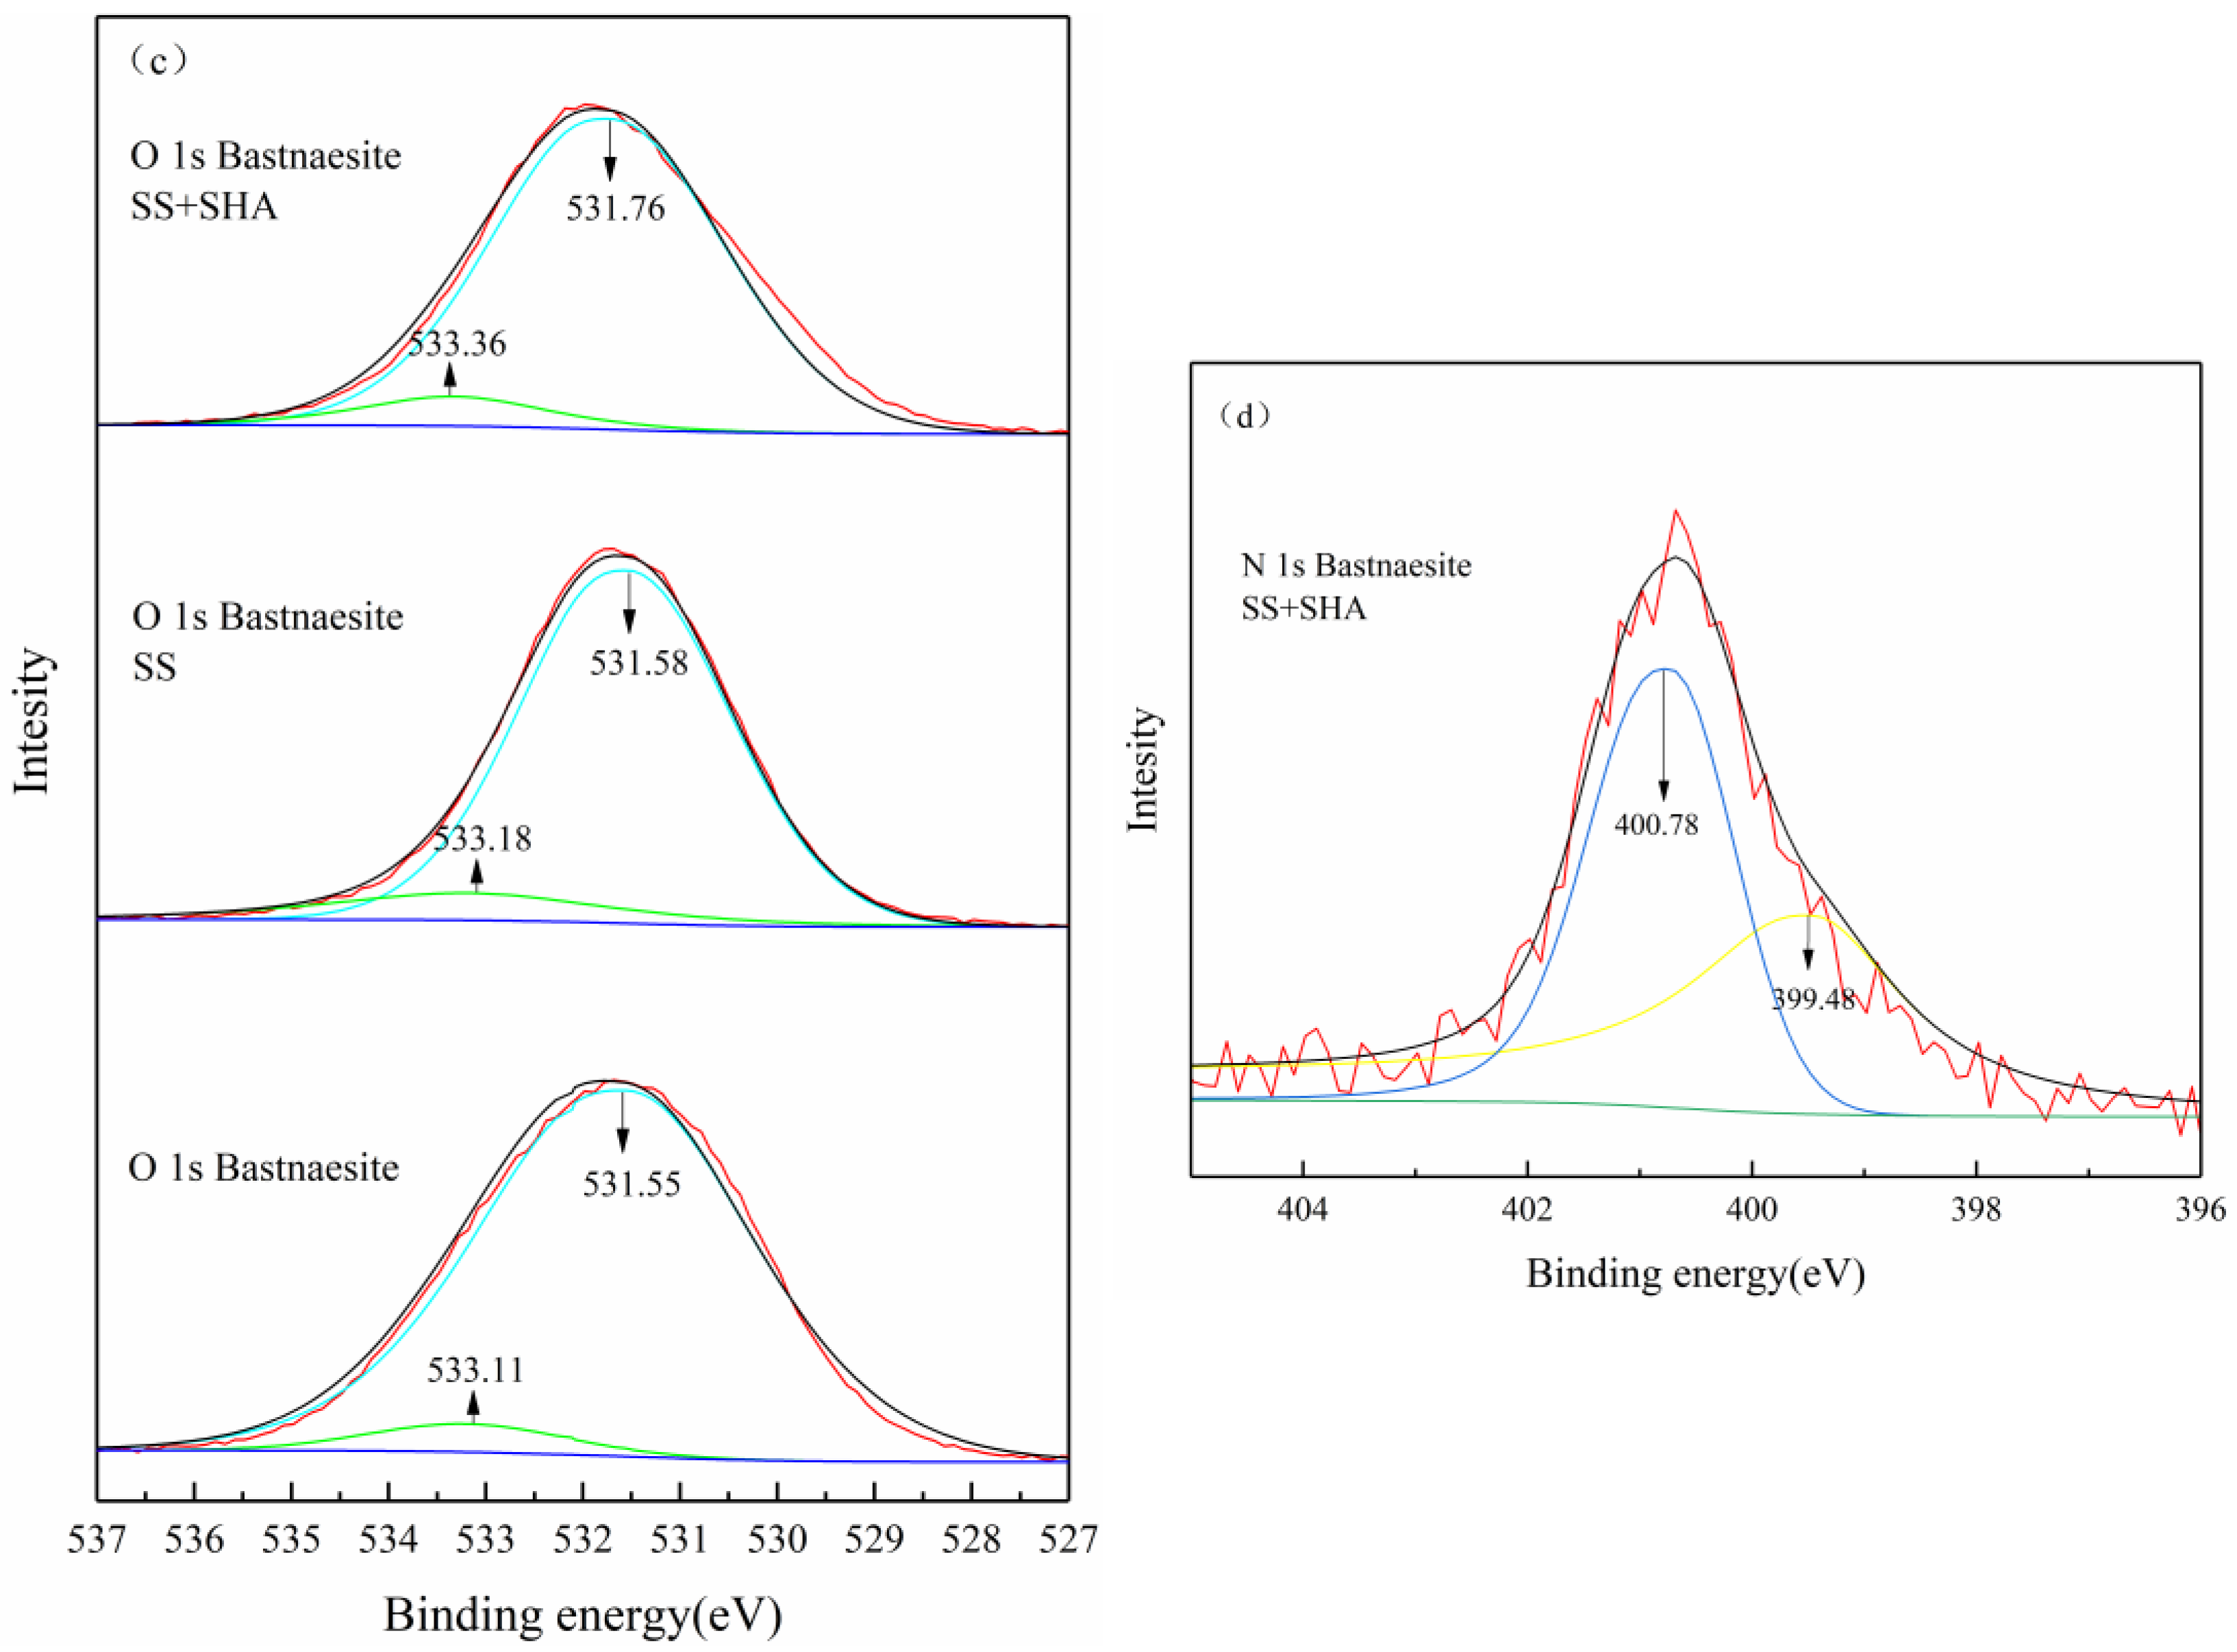
Figure 11c shows the high-definition O 1s XPS spectra of the pure and flotation reagent-treated bastnaesite samples, and the detailed analysis results of the O 1s XPS spectra are shown in
Table 8. The results show that the O 1s region of the bastnaesite can be fitted to two central peaks of binding energy of 531.55 eV and 533.11 eV in the XPS spectra, respectively, from
and Ce-OH [
55,
56]. In the O 1s XPS spectrum of the bastnaesite treated by SS alone, the O 1s XPS peak of
moves 0.10 in the positive direction. In the O 1s XPS spectrum of SS- and SHA-treated bastnaesite, the O 1s XPS peak of
shifted to the positive direction by 0.24 eV, which is due to the benzene-ring-binding -OH group in SHA [
55]. The O 1s XPS peak in the Ce-OH shifts 0.20 eV in the positive direction due to the reaction of the C=O group of the SHA with the surface of the bastnaesite [
57].
In addition,
Figure 11d shows the high-definition N 1s XPS spectra of the flotation reagent-treated bastnaesite samples, and the detailed analysis results of N 1s XPS spectra are shown in
Table 9. It is further confirmed that NHA is adsorbed on the bastnaesite surface. This adsorption may be attributed to the N atom in the =N-OH forming a new saturated chelate with the surface of the bastnaesite [
24,
58].
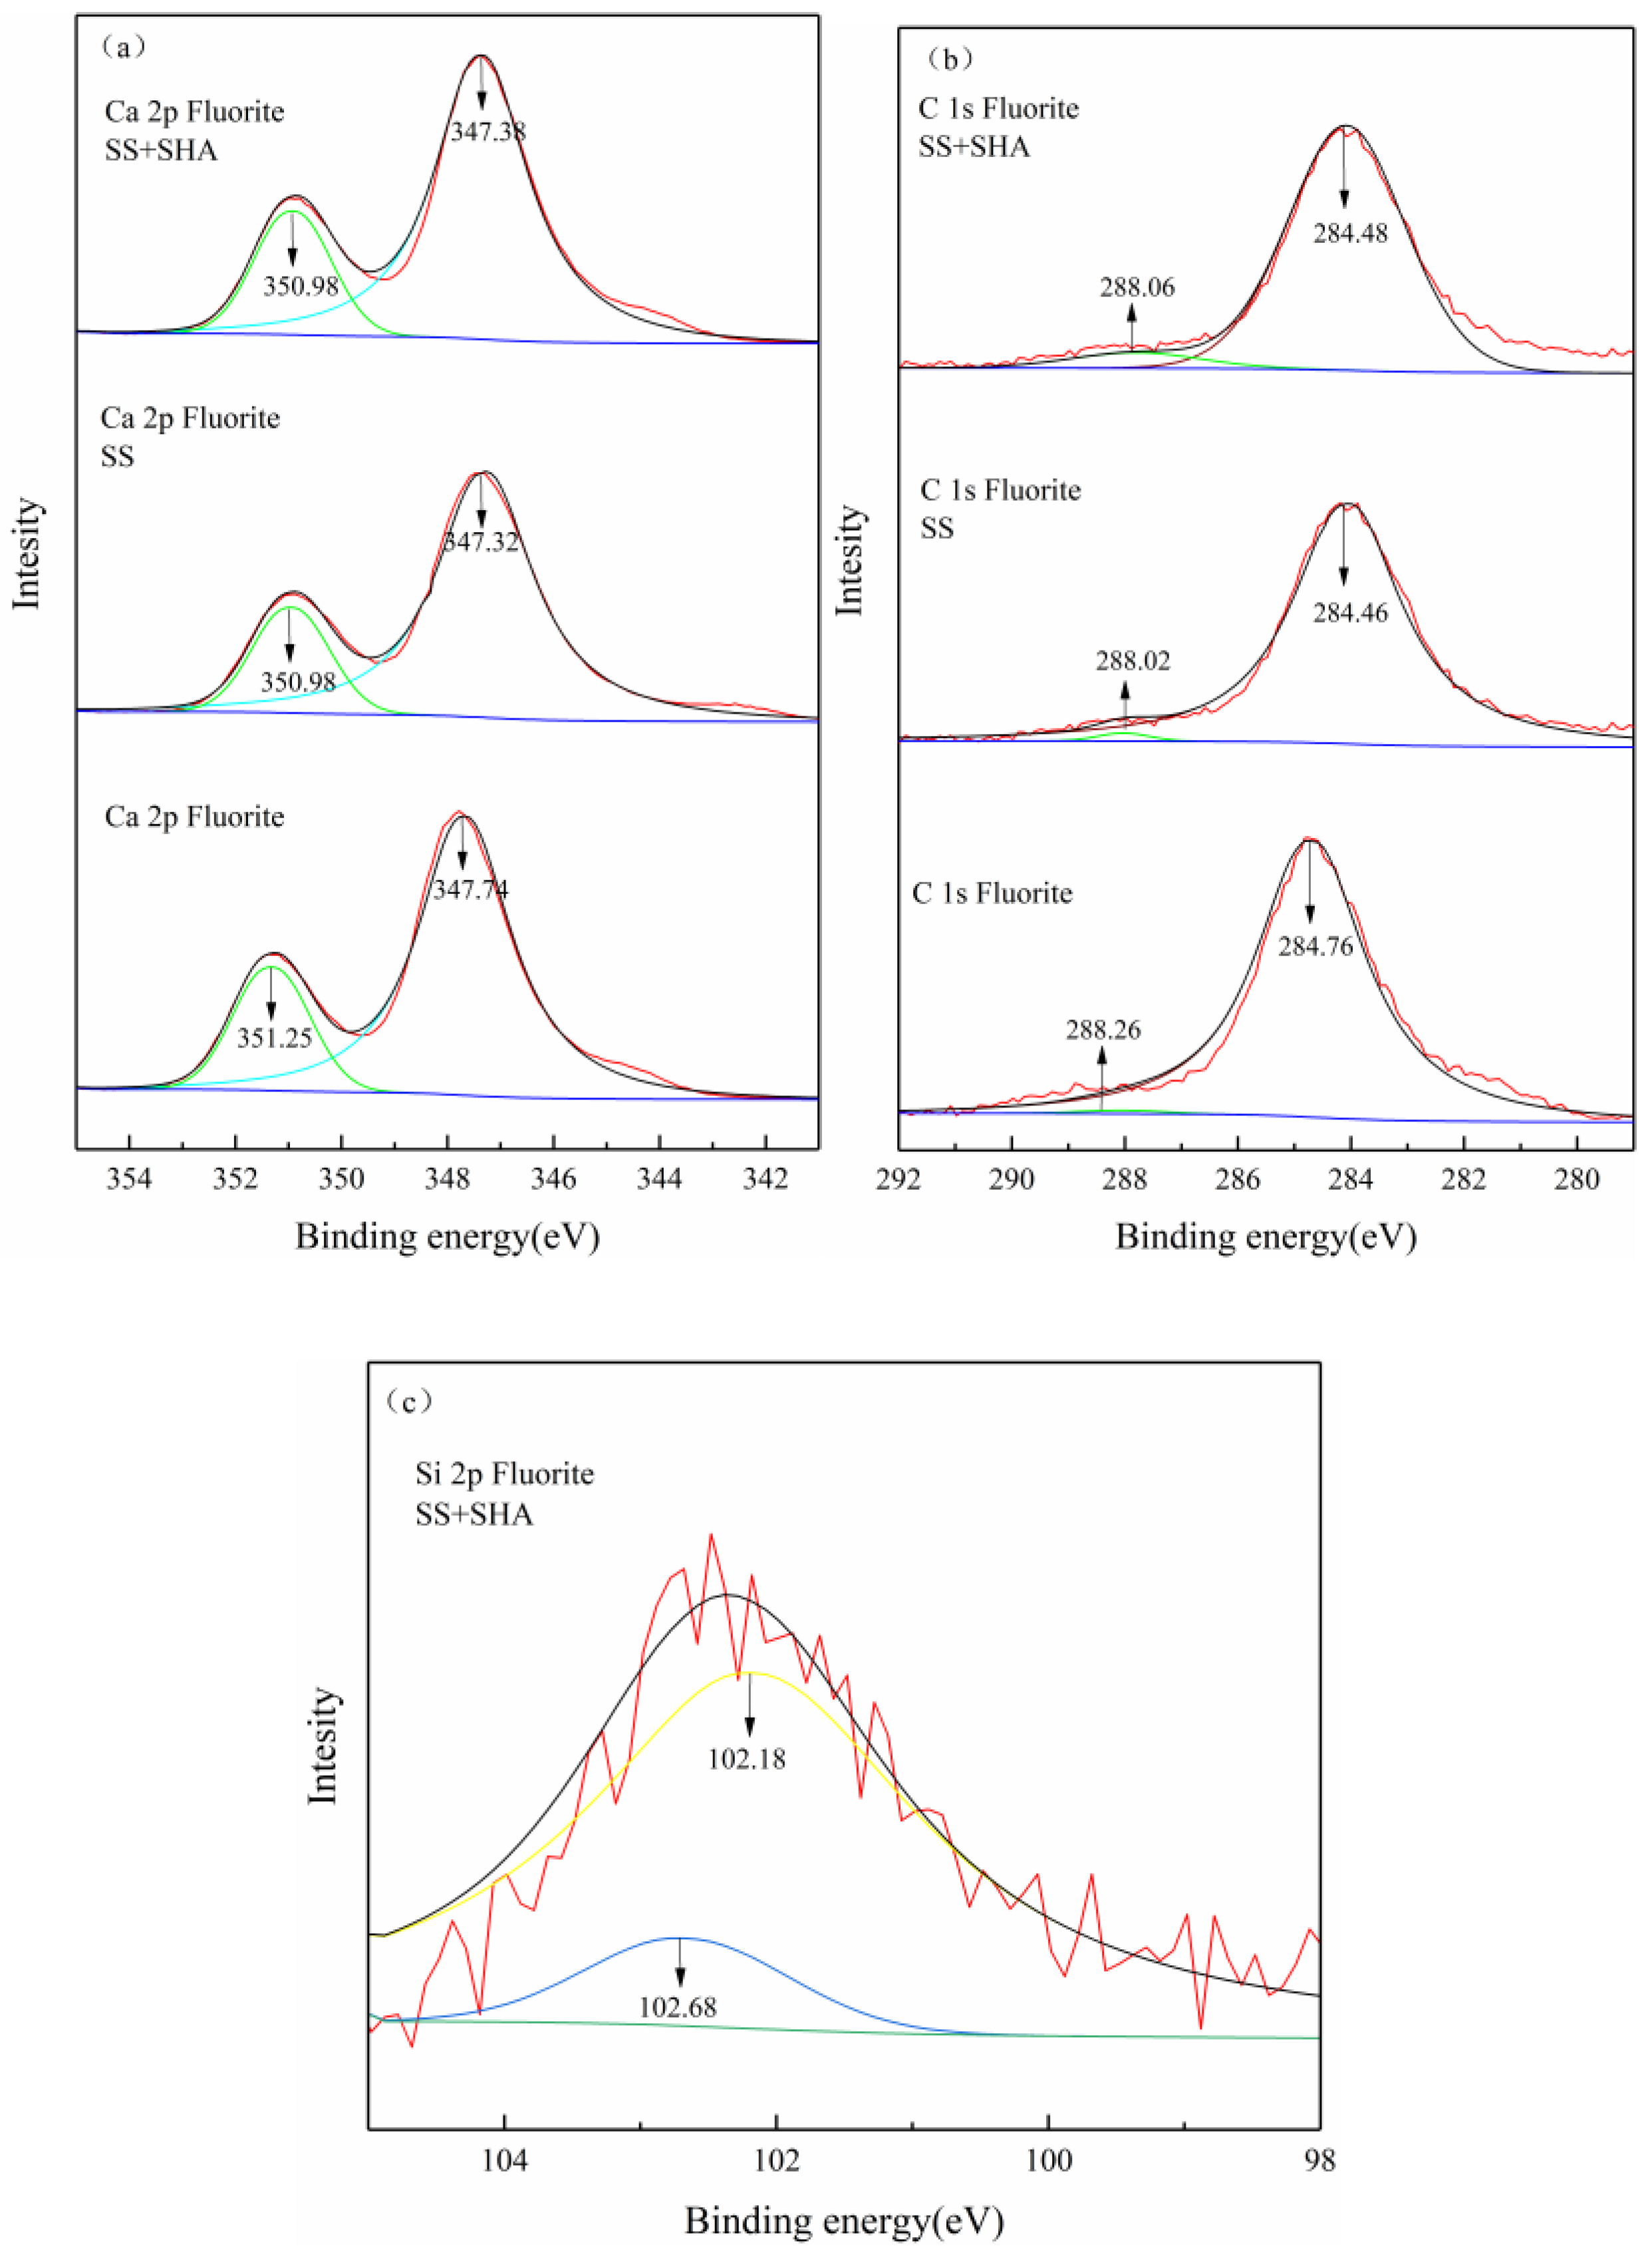
Figure 12a shows the high-definition Ca 2p XPS spectra of the pure and flotation reagent-treated fluorite samples, and the detailed analysis results of the N 1s XPS spectra are shown in
Table 10. In the spectra of the pure fluorite samples, the binding energies at 347.74 eV and 351.25 eV are the peaks of Ca 2p
3/2 and Ca 2p
1/2, respectively. In the XPS spectra of the fluorite samples treated by SS alone, the binding energy offsets of the Ca 2p
3/2 and Ca 2p
1/2 peaks are 0.39 eV and 0.27 eV (>0.20 eV), respectively. The obvious shift of the Ca 2p energy spectrum on the fluorite surface indicates that the interaction between the fluorite and the SS is chemical bonding rather than simple physical bonding. This observation shows the chemical surroundings of the fluorite surface has changed. However, the Ca 2p peak of the SS- and SHA-treated fluorite shows no significant change compared with the SS alone [
59].
Figure 12b shows the high-definition C 1s XPS spectra of the pure and flotation reagent-treated fluorite samples, and the detailed analysis results of the C 1s XPS spectra are shown in
Table 11. In the spectra of the pure fluorite samples, the C 1s peak is attributed to
[
24]. In the XPS spectra of the fluorite samples treated with SS alone, the binding energy of the C 1s peak shifts to 0.30 eV and 0.24 eV [
24,
59]. The fluorite samples treated with SS and SHA did not show the characteristic peaks of the carbonyl groups and the benzene ring of SHA. The binding energy offset of the C 1s peak is less than 0.10 eV, which is within the range of instrument error.
Figure 12c shows the high-definition Si 2p XPS spectra of the flotation reagent-treated fluorite samples, and the detailed analysis results of the Si 2p XPS spectra are shown in
Table 12. At 102.16 ev and 102.69 ev, the Si 2p peak of the fluorite was fitted by double peaks [
35,
37,
45]. Because the binding energy of the Si-C bond does not exceed 102 eV near 100.5 eV, it is possible that the SS interacts with the Ca
2+ on the surface of the fluorite to form a new chemical bond [
37,
45,
60], indicating that the SS is adsorbed on the fluorite. The results show that the SS has chemisorption on the fluorite surface, and the adsorption capacity is higher than that of the bastnaesite.

 ,
, 


