Article

Synergistic Effect of Frequently Found Ions in the Flotation of Pb-Zn Sulfide Ores on Air/Water Interface

1
Mining Engineering Department, Engineering Faculty, Istanbul University-Cerrahpasa, 34500 Istanbul, Türkiye
2
Mineral Processing Engineering Department, Faculty of Mines, Istanbul Technical University,34469 Istanbul, Türkiye
*
Author to whom correspondence should be addressed.
Minerals 2023, 13(10), 1236; https://doi.org/10.3390/min13101236
Submission received: 10 August 2023 / Revised: 13 September 2023 / Accepted: 20 September 2023 / Published: 22 September 2023
(This article belongs to the Special Issue Industrial Minerals Flotation–Fundamentals and Applications)

Abstract

:
The aqueous ions influence the properties of air bubbles and, therefore, the recovery of flotation. This study aims to reveal the synergistic effect of frequently found ions in the flotation of Pb-Zn sulfide ores. In this context, dynamic surface tension measurements, bubble coalescence time, Sauter mean diameter (SMD), bubble size distribution (BSD), and dynamic foam stability (DFS) measurements were carried out using artificial process waters (APWs). APW with the minimum ion concentration is expressed as “APW1” with the ionic strength (I) of 0.03 mol/dm3. The concentration of the ions in APW1 was increased by 3, 5, and 10 times, and thus APW3 (I = 0.08 mol/dm3), APW5 (I = 0.13 mol/dm3), and APW10 (I = 0.26 mol/dm3) were prepared, respectively. The results of this study indicated that the surface tension increased slightly in the presence of APW related to the ion concentration. Potassium ethyl xanthate (KEX) at high concentrations was effective in the reduction of surface tension. As the APW concentration increased, finer bubbles were obtained with a narrower size range. The stability of the foam increased with butyl glycol (BG) and APW concentration. There was no need to use a frother (BG) for the flotation experiments in the presence of APW1 or APWs with higher ionic strength.
Keywords:
flotation; Pb-Zn; ions; APW; SMD; DFS

1. Introduction

The properties of air bubbles and the relation between them play a key role in flotation efficiency and selectivity. To obtain an acceptable recovery and concentration grade during flotation, the flotation bubbles must have a proper size distribution (bubble size distribution, BSD) considering the size of the particles to be floated [1]. The diameter of a group of spherical objects of different sizes, such as particles, droplets, or bubbles can be expressed as a single value, which is called the mean diameter. Sauter mean diameter (SMD, d32) is one of the leading methods used to calculate the mean diameter [2,3].
The size of the air bubbles formed in flotation depends on the air flow rate as well as the characteristics of the air distribution system, such as geometry and pore size. However, bubbles formed in water are not stable. When two bubbles get too close to each other, they tend to coalesce to lower the interfacial area, and the total interfacial/surface energy. In this process, the liquid film between two bubbles thins and eventually ruptures [4,5,6,7]. As a result, the two bubbles coalesce to form a single larger bubble. This phenomenon is called bubble coalescence and adversely affects the flotation efficiency by making bubble–particle collision and attachment difficult [8] as well as causing the detachment of attached particles [9,10].
In flotation, the air–water interface tension, and hence bubble coalescence and, eventually, bubble size, is usually controlled by surfactants called frothers. Because of their amphiphilic character, the frother molecules are adsorbed on the air–water interface, thereby reducing the surface tension. Adsorbed surfactants including frothers decrease the surface tension of bubbles and thus decrease the overall surface energy of a system for the same surface area. Importantly, adsorbed surfactants also act as steric stabilizers, providing a barrier to the close contact of bubbles and altering the dynamics of the thin-film drainage process [11]. Thus, the coalescence of the bubbles is prevented and it is ensured that the bubbles remain at smaller sizes [12]. For this reason, the surface tension of a frother solution is an important indicator of the surface activity of the frother molecules.
Another structure in which bubble coalescence and bursting are controlled in flotation is the froth. The stability of the froth plays an important role in the flotation efficiency and the grade of concentrate [13,14]. Froth stability can be defined as the resistance of bubbles in the froth to coalescence. A more stable froth consists of smaller bubbles and less bubble coalescence and bursting occurs in the froth. Froth is a structure that consists of solids (mineral particles), liquid (water), and gas (air) phases, and the presence of mineral particles contributes to the stability of the froth. Efficient recovery of hydrophobic particles is not possible with an unstable froth. However, an extremely stable froth also increases the mechanical transport of hydrophilic particles, causing a decrease in the grade of the concentrate. Therefore, there is optimum froth stability for each flotation cell and condition in terms of flotation recovery and concentrate grade [15].
Meanwhile, in the absence of particles, this structure is called foam and the stability is provided by the surfactants (frothers). Although frothers are the main chemicals used to control bubble coalescence, and thus bubble size and foam stability, studies have shown that some dissolved ions also inhibit bubble coalescence above a concentration called the transition concentration [16].
Due to the scarcity of freshwater resources and increasing environmental sensitivity, low-quality water resources such as seawater and bore water can be used in industrial processes [17,18]. Another preferred method is the recycling and reuse of the water used in the plant [19]. However, there are many dissolved ions in these low-quality waters and the presence of these ions affects the size and the relation between bubbles by changing the properties of the air/water interface. While some of these ions affect the flotation process positively, some of them have a negative effect. Therefore, consistent and controllable water quality is essential to keep flotation efficiency at an acceptable level.
The effect of dissolved ions in flotation was mostly studied in the flotation of soluble salt minerals such as potash, trona, and borax [20,21,22,23,24]. However, there are also studies on nonsoluble ores [25,26,27,28,29] and coal [16].
The effect of aqueous ions on the air/water interface is ion-specific. Therefore, experiments are usually performed in the presence of a particular cation/anion pair using a single salt. However, the water used in industry contains many ions dissolved from the earth’s crust, the ore, and the chemicals used in the beneficiation processes. Therefore, it is important to observe the synergistic effect of these ions with each other and with the flotation reagents. For this purpose, there are studies in the literature on water resources containing multiple ions and flotation reagents [30,31].
This study aimed to investigate the synergistic effect of frequently found ions in the flotation of Pb-Zn sulfide ores on the air/water interface. For this purpose, dynamic surface tension, bubble coalescence time, Sauter mean diameter (SMD), bubble size distribution (BSD), and dynamic foam stability (DFS) measurements were carried out using artificial process waters (APWs).

2. Materials and Methods

In this study, APWs were prepared to contain Na+, Ca2+, and Mg2+ cations, which are frequently encountered in industrial process waters, as well as Pb2+, Zn2+, Cu2+, and Fe3+ metal cations found in flotation waters of sulfide Pb-Zn ores. The analytical-quality salts of these cations (NaCl (>99.5%), CaCO3 (>98.0%), MgSO4∙7H2O (>98.0%), Pb(NO3)2 (>98.0%), ZnCl2 (>98.0%), CuCl2 (>98.0%), and Fe(NO3)3∙9H2O (>99.0%)) were used to provide anion diversity. The salts were provided by Tekkim Chemical Company, Türkiye.
APW with the minimum ion concentration is expressed as “APW1” and the concentrations of Na+, Ca2+, and Mg2+ cations in APW1 were determined from the literature [32,33]. Meanwhile, the concentrations of Pb2+, Zn2+, Cu2+, and Fe3+ cations were accepted as 1 ppm. The ion concentrations in APW1 were increased 3, 5, and 10 times, and thus APW3, APW5, and APW10 were prepared, respectively. The ion content of the APWs used in this study is given in Table 1.
The pH of the flotation medium can reach up to 10–11 in Pb-Zn flotation facilities, and in this case, the ions in the metal medium precipitate in the form of Mx(OH)y(s). Meanwhile, the pH of the APWs was close to the pH of pure water, and therefore the experiments in this study were carried out at the natural pH of 6–7, as seen in Table 1. It is seen from the literature that at these pH values, most of this medium exists in the form of ions [34,35,36,37,38,39,40].
The glassware used in the experiments was cleaned with analytical ethanol (>99%), then rinsed with pure water (total dissolved solids (TDS) = 0–3 ppm), and finally dried in a drying oven (105 °C) before each use. In the experiments, potassium ethyl xanthate (KEX) (>96%, Sigma-Aldrich, St. Louis, MO, USA) and ethylene glycol mono butyl ether, also known as butyl glycol (BG), (>99.9% C4H9OCH2CH2OH, Tekkim, Türkiye), which are frequently preferred collectors and frothers, respectively, for the flotation of sulfide Pb-Zn ores, were used. The required solutions were freshly prepared before each experimental study via dispersion with a magnetic stirrer at a stirring speed of 500 rpm for 4 min at room temperature (23 ± 1 °C).

2.1. Dynamic Surface Tension Measurements

Dynamic surface tension measurements were carried out according to the pendant drop method using Attension Theta Lite (Biolin Scientific, Göteborg, Sweden) optical tensiometer. The volume of the droplets for pure water was 12.0 ± 0.5 cm3 at 23 ± 1 °C. In this method, the changes in the shape of the drop at the tip of a backlit needle in the relevant solution were observed with the CCD (charge-coupled device) camera of the device. The surface tension of the solutions was calculated automatically by taking measurements at regular time intervals [30]. The measurements were started immediately after the formation of the drops and continued for 180 s. The surface tension values at 180 s were deemed as the equilibrium surface tension by observing the surface tension changes in time. The measurements were repeated three times and the average values were calculated.

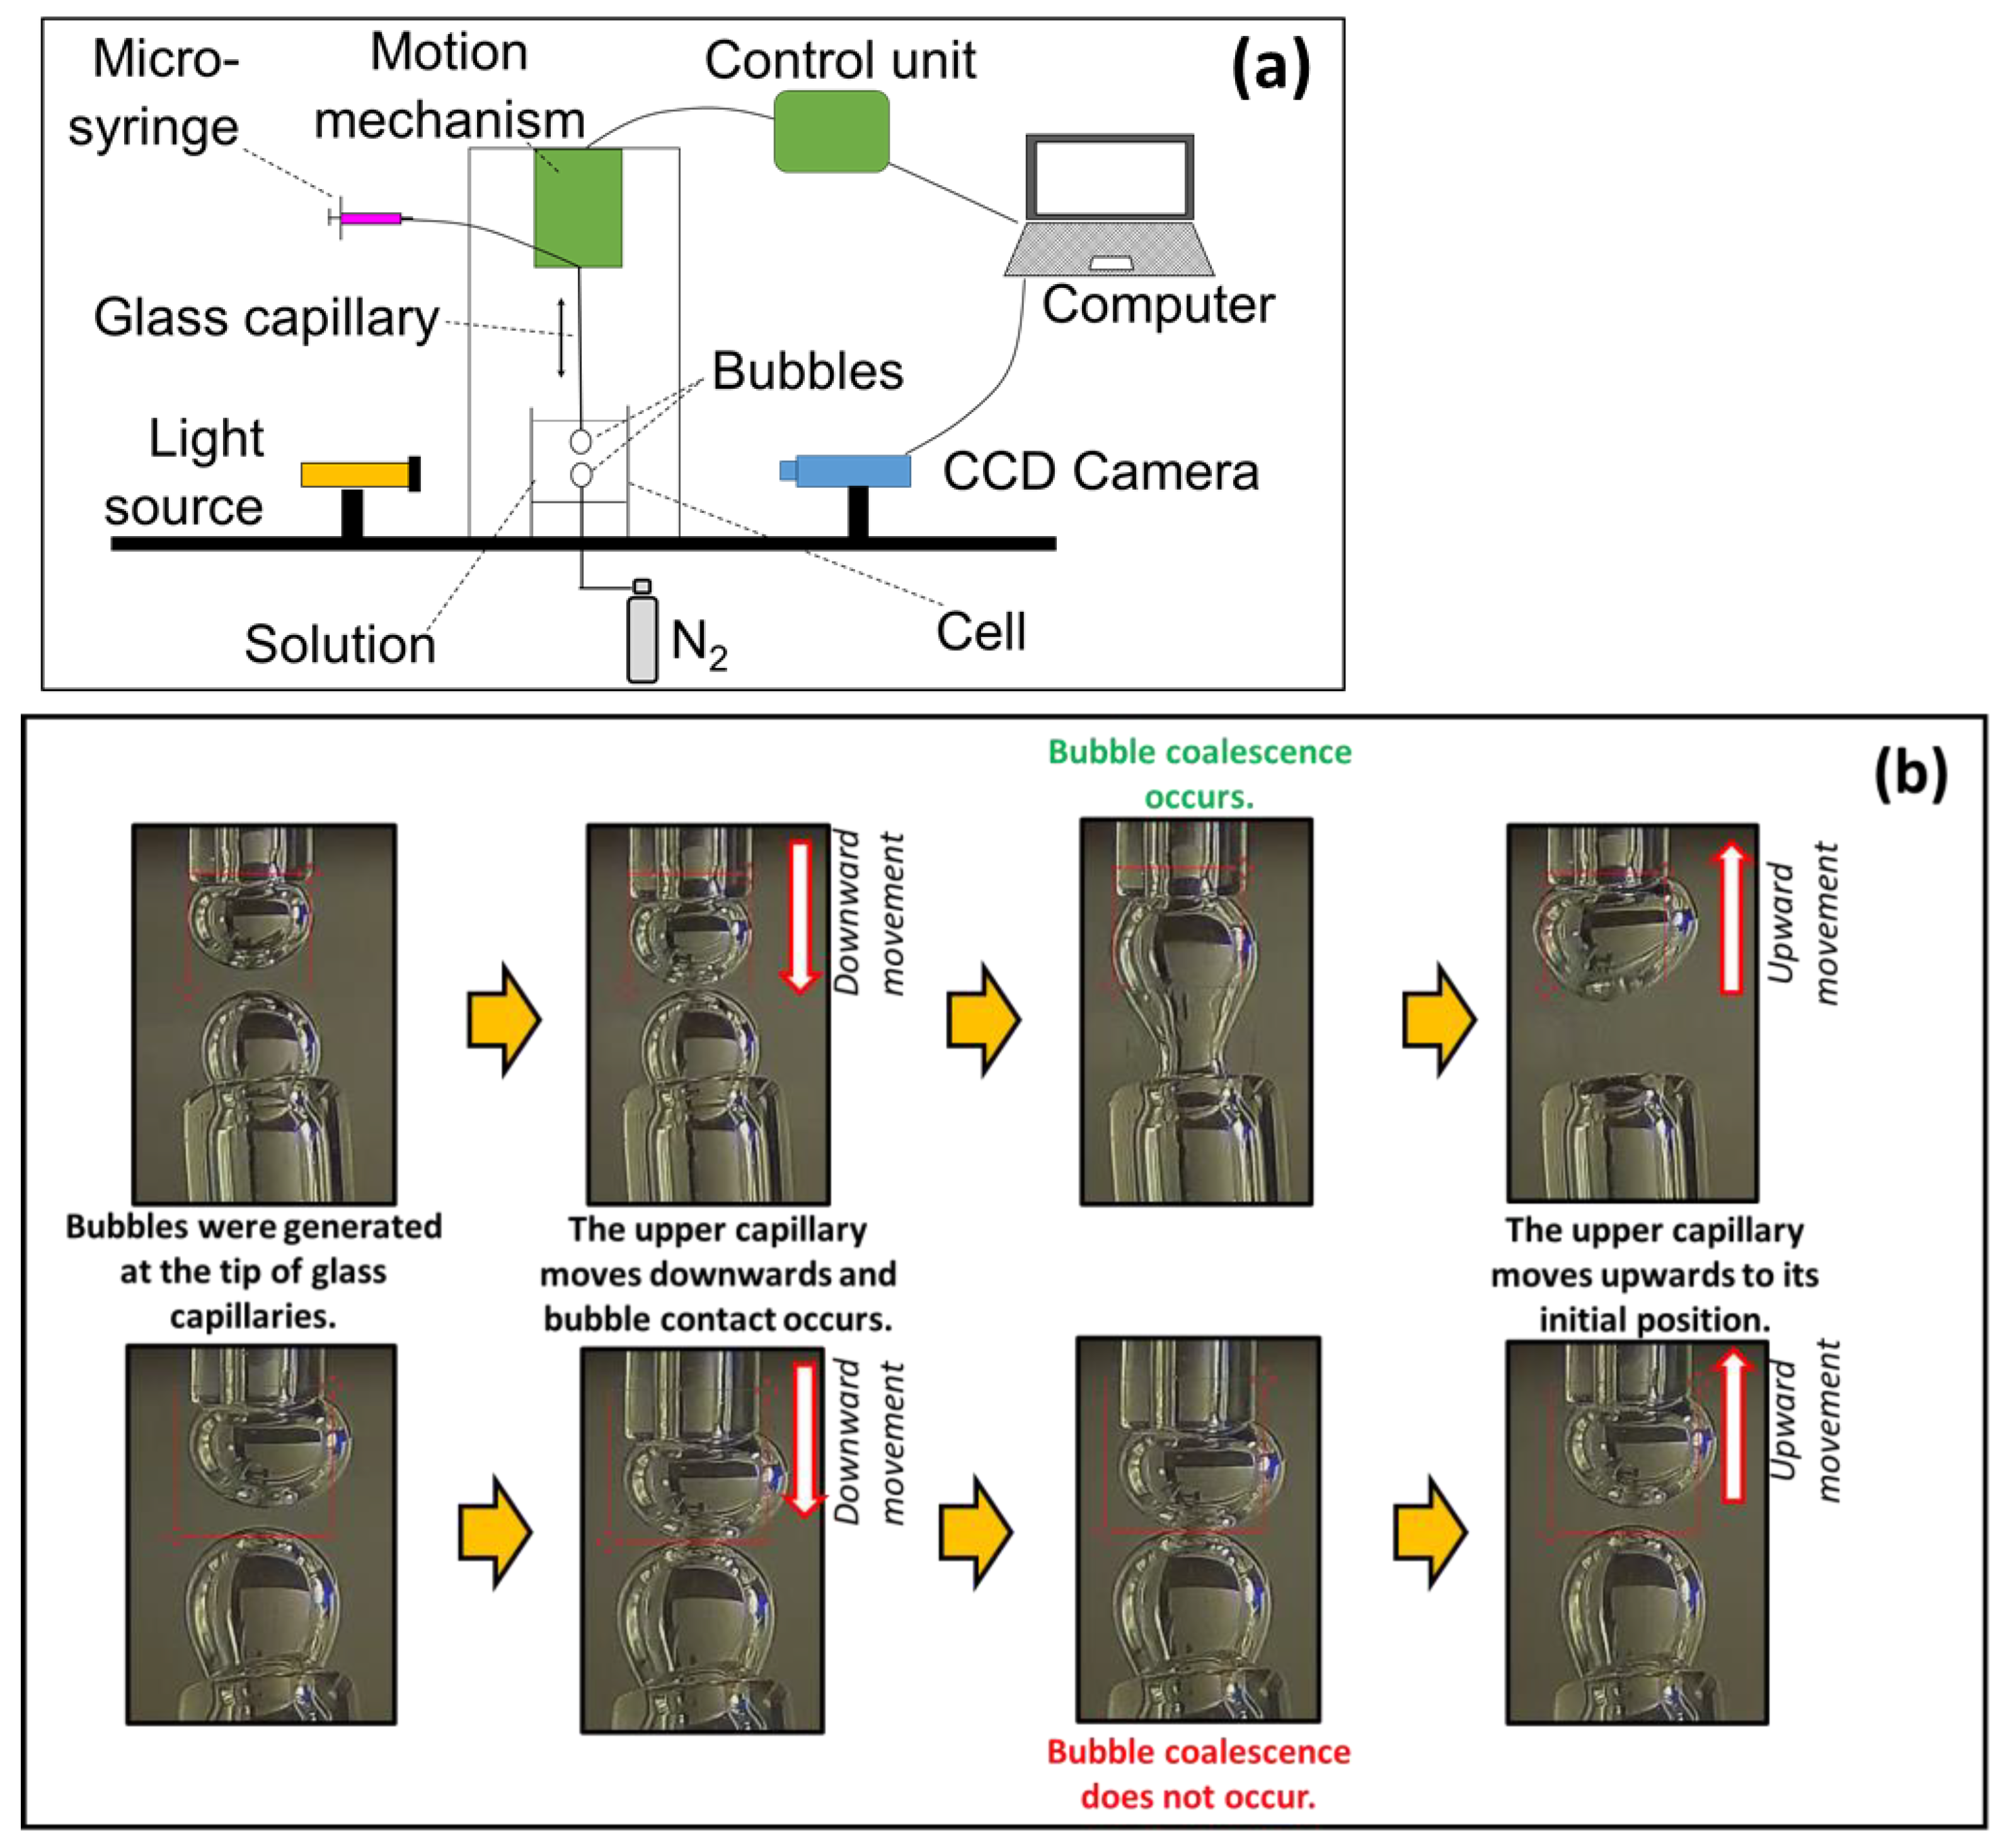
2.2. Bubble Coalescence Time Measurements

In this study, bubble coalescence time measurements were performed with an induction time test unit (BKT-100, Bratton Engineering, Littleton, MA, USA) [41]. In the experiments, a glass container with a glass capillary tube was filled with the desired solution and placed under the glass capillary tube of the measurement device. Two bubbles of similar size (~2 mm) were formed at the ends of the glass tubes via a micro-syringe. The contact time was set in milliseconds via the computer software. When the device was started, the upper capillary tube moved downwards at 100 mm/s velocity and the two bubbles remained in contact for the specified time. Then, the upper capillary tube returned to its original position. The experimental setup and the sequential processes that occur in bubble coalescence time measurements are shown in Figure 1. The bubble coalescence experiments were carried out with twenty repetitions.

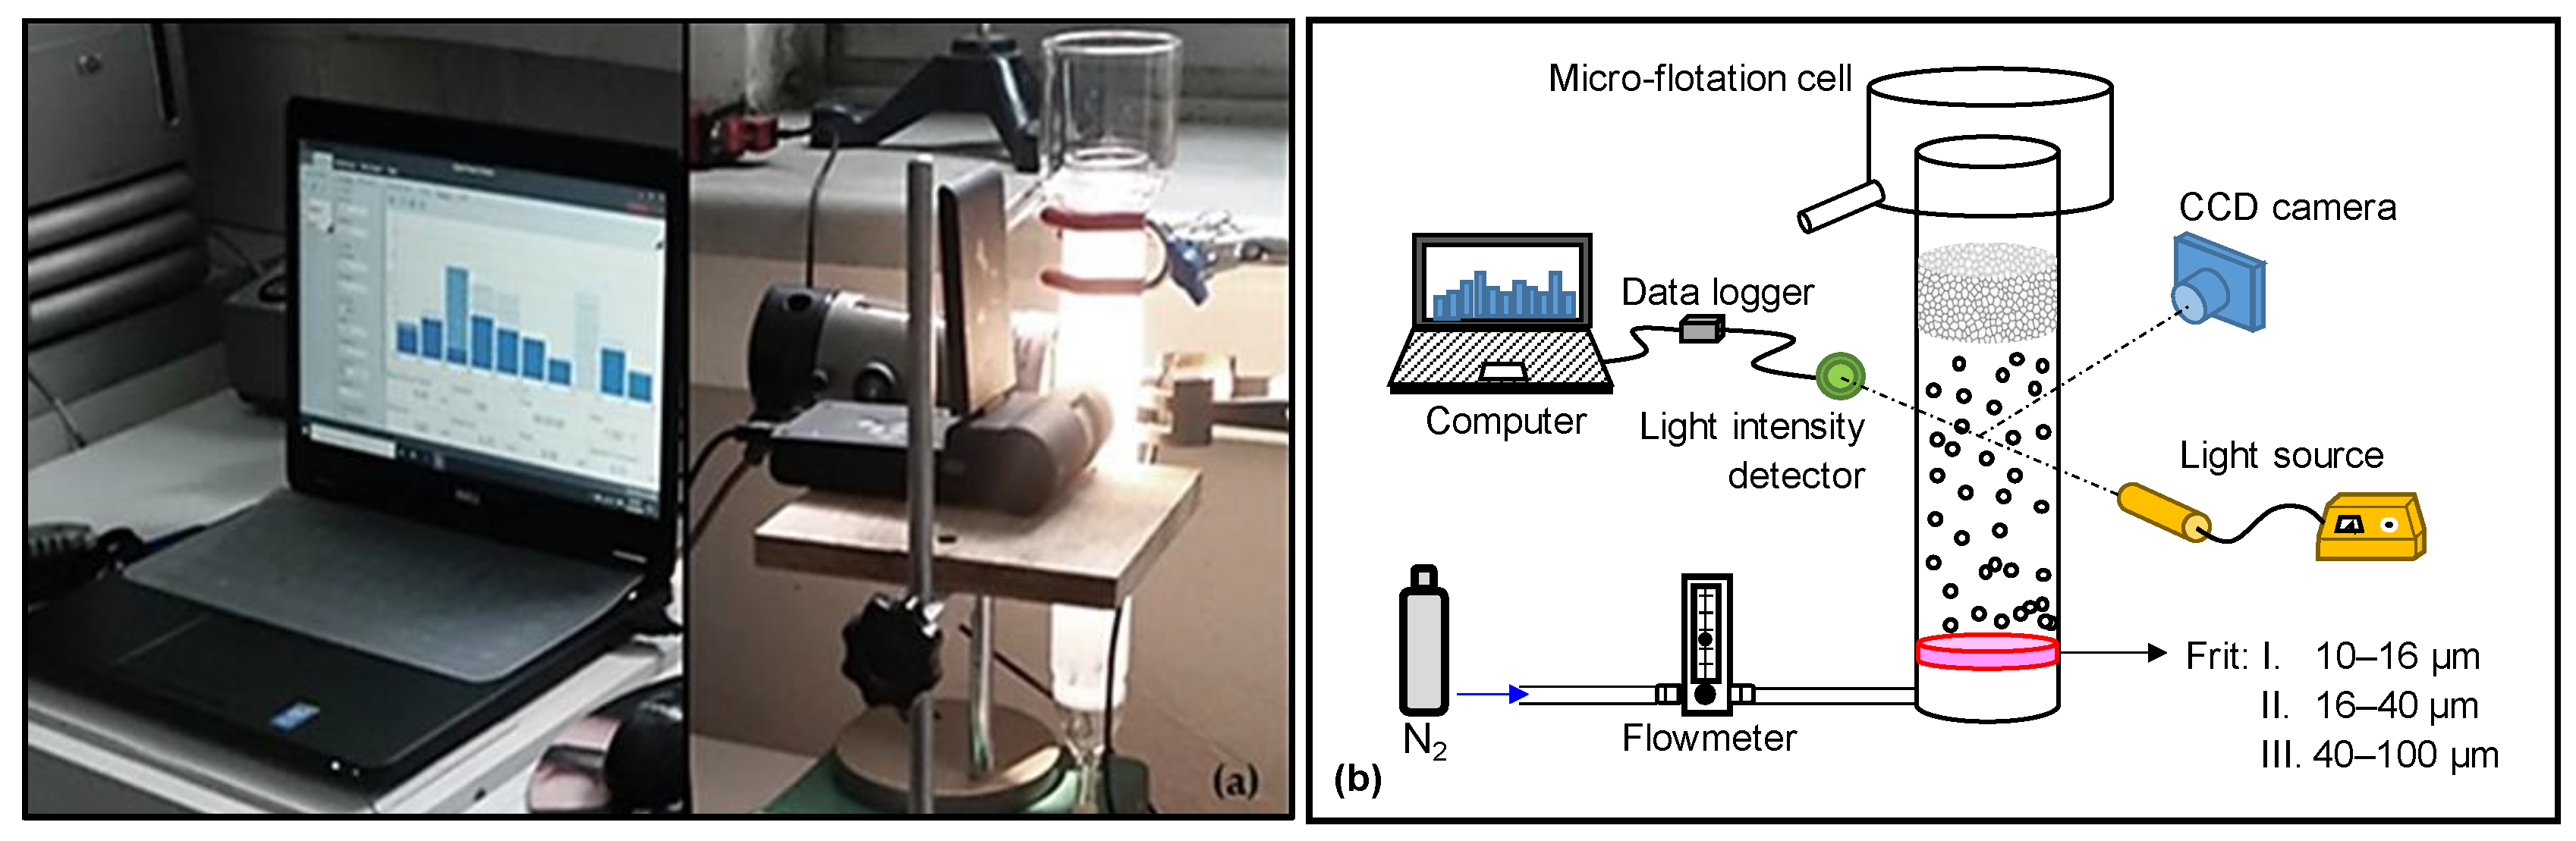
2.3. Measurements of Sauter Mean Diameter (SMD) and Bubbles Size Distribution (BSD)

SMD and BSD measurements were carried out using micro-flotation cells with a diameter of 30 mm, a length of 220 mm, and a volume of 155 cm3. The effect of ion (APW) concentration on bubble size was investigated using various frit pore sizes (10–16, 16–40, and 40–100 μm) and nitrogen (N2) at various flow rates (30 cm3/min, 50 cm3/min, and 70 cm3/min).
In the measurements, the micro-flotation cell was filled with an aqueous solution of the desired chemical to the appropriate height, and representative images of the bubbles (photo and video) during the experiments were taken using a CCD camera (30 fps) with the appropriate lens (Bushman CMOS 8 Led Microscope, Bushman Equipment Inc., Menomonee Falls, WI, USA) at 50:1 magnification rate (Figure 2). For each concentration, at least ten images taken from the same position were analyzed. SMDs were determined using ImageJ open-source image processing software. The perimeter of the bubbles was measured automatically by the software. Using the perimeter values, the volume (Vb), the area (Ab), and thus the SMD (d32) of the bubbles were calculated (d32 = 6Vb/Ab) [42].

2.4. Determination of the Critical Coalescence Concentration (CCC) of Butyl Glycol

The critical coalescence concentration (CCC) is the minimum concentration of a frother that effectively prevents bubbles from coalescing. By determining the CCC value, the optimum concentration of a frother can be selected for a flotation process [43]. In the experiments, the micro-flotation cell was filled with the frother (BG) solution. Then, a light beam was sent through the cell using a cold light source (5100-L, SOIF, Shanghai, China). In this method, while some of the light passing through the column is absorbed by the solution, the intensity (mW) of the light passing through the column was measured by the light intensity detector (S121C, Thorlabs, Newton, NJ, USA) related to the coalescence of the bubbles in the presence of the frother at a constant concentration. Therefore, the CCC of the frother was determined. The experimental setup used in SMD and BSD measurements as well as for the determination of CCC is shown in Figure 2.

2.5. Dynamic Foam Stability (DFS) Measurements

The foaming ability of dissolved ions in the absence and presence of frother (BG) and their effect on DFS was investigated using a dynamic foam analyzer (DFA-100, Krüss, Hamburg, Germany). For the measurements, the required solutions (100 cm3) were placed into the cylindrical glass measurement cell of the device (inner diameter: 40 mm, height: 250 mm). The foam formation is provided by dispersing the compressed air (200 cm3/min, 250 cm3/min, or 300 cm3/min) through a filter plate located under the measurement cell.
The height of the solution and foam and, thus, their volumes were determined by the Krüss Advance Foam Analysis Software DFA100 by measuring the time-dependent light transmission utilizing an LED panel and a light detector positioned on the opposite sides of the measurement cell (Figure 3). At the end of the foaming period, the airflow was automatically stopped by the device. The height of the foam was measured for 60 s and the maximum foam height (Hmax) was determined.

3. Results and Discussion

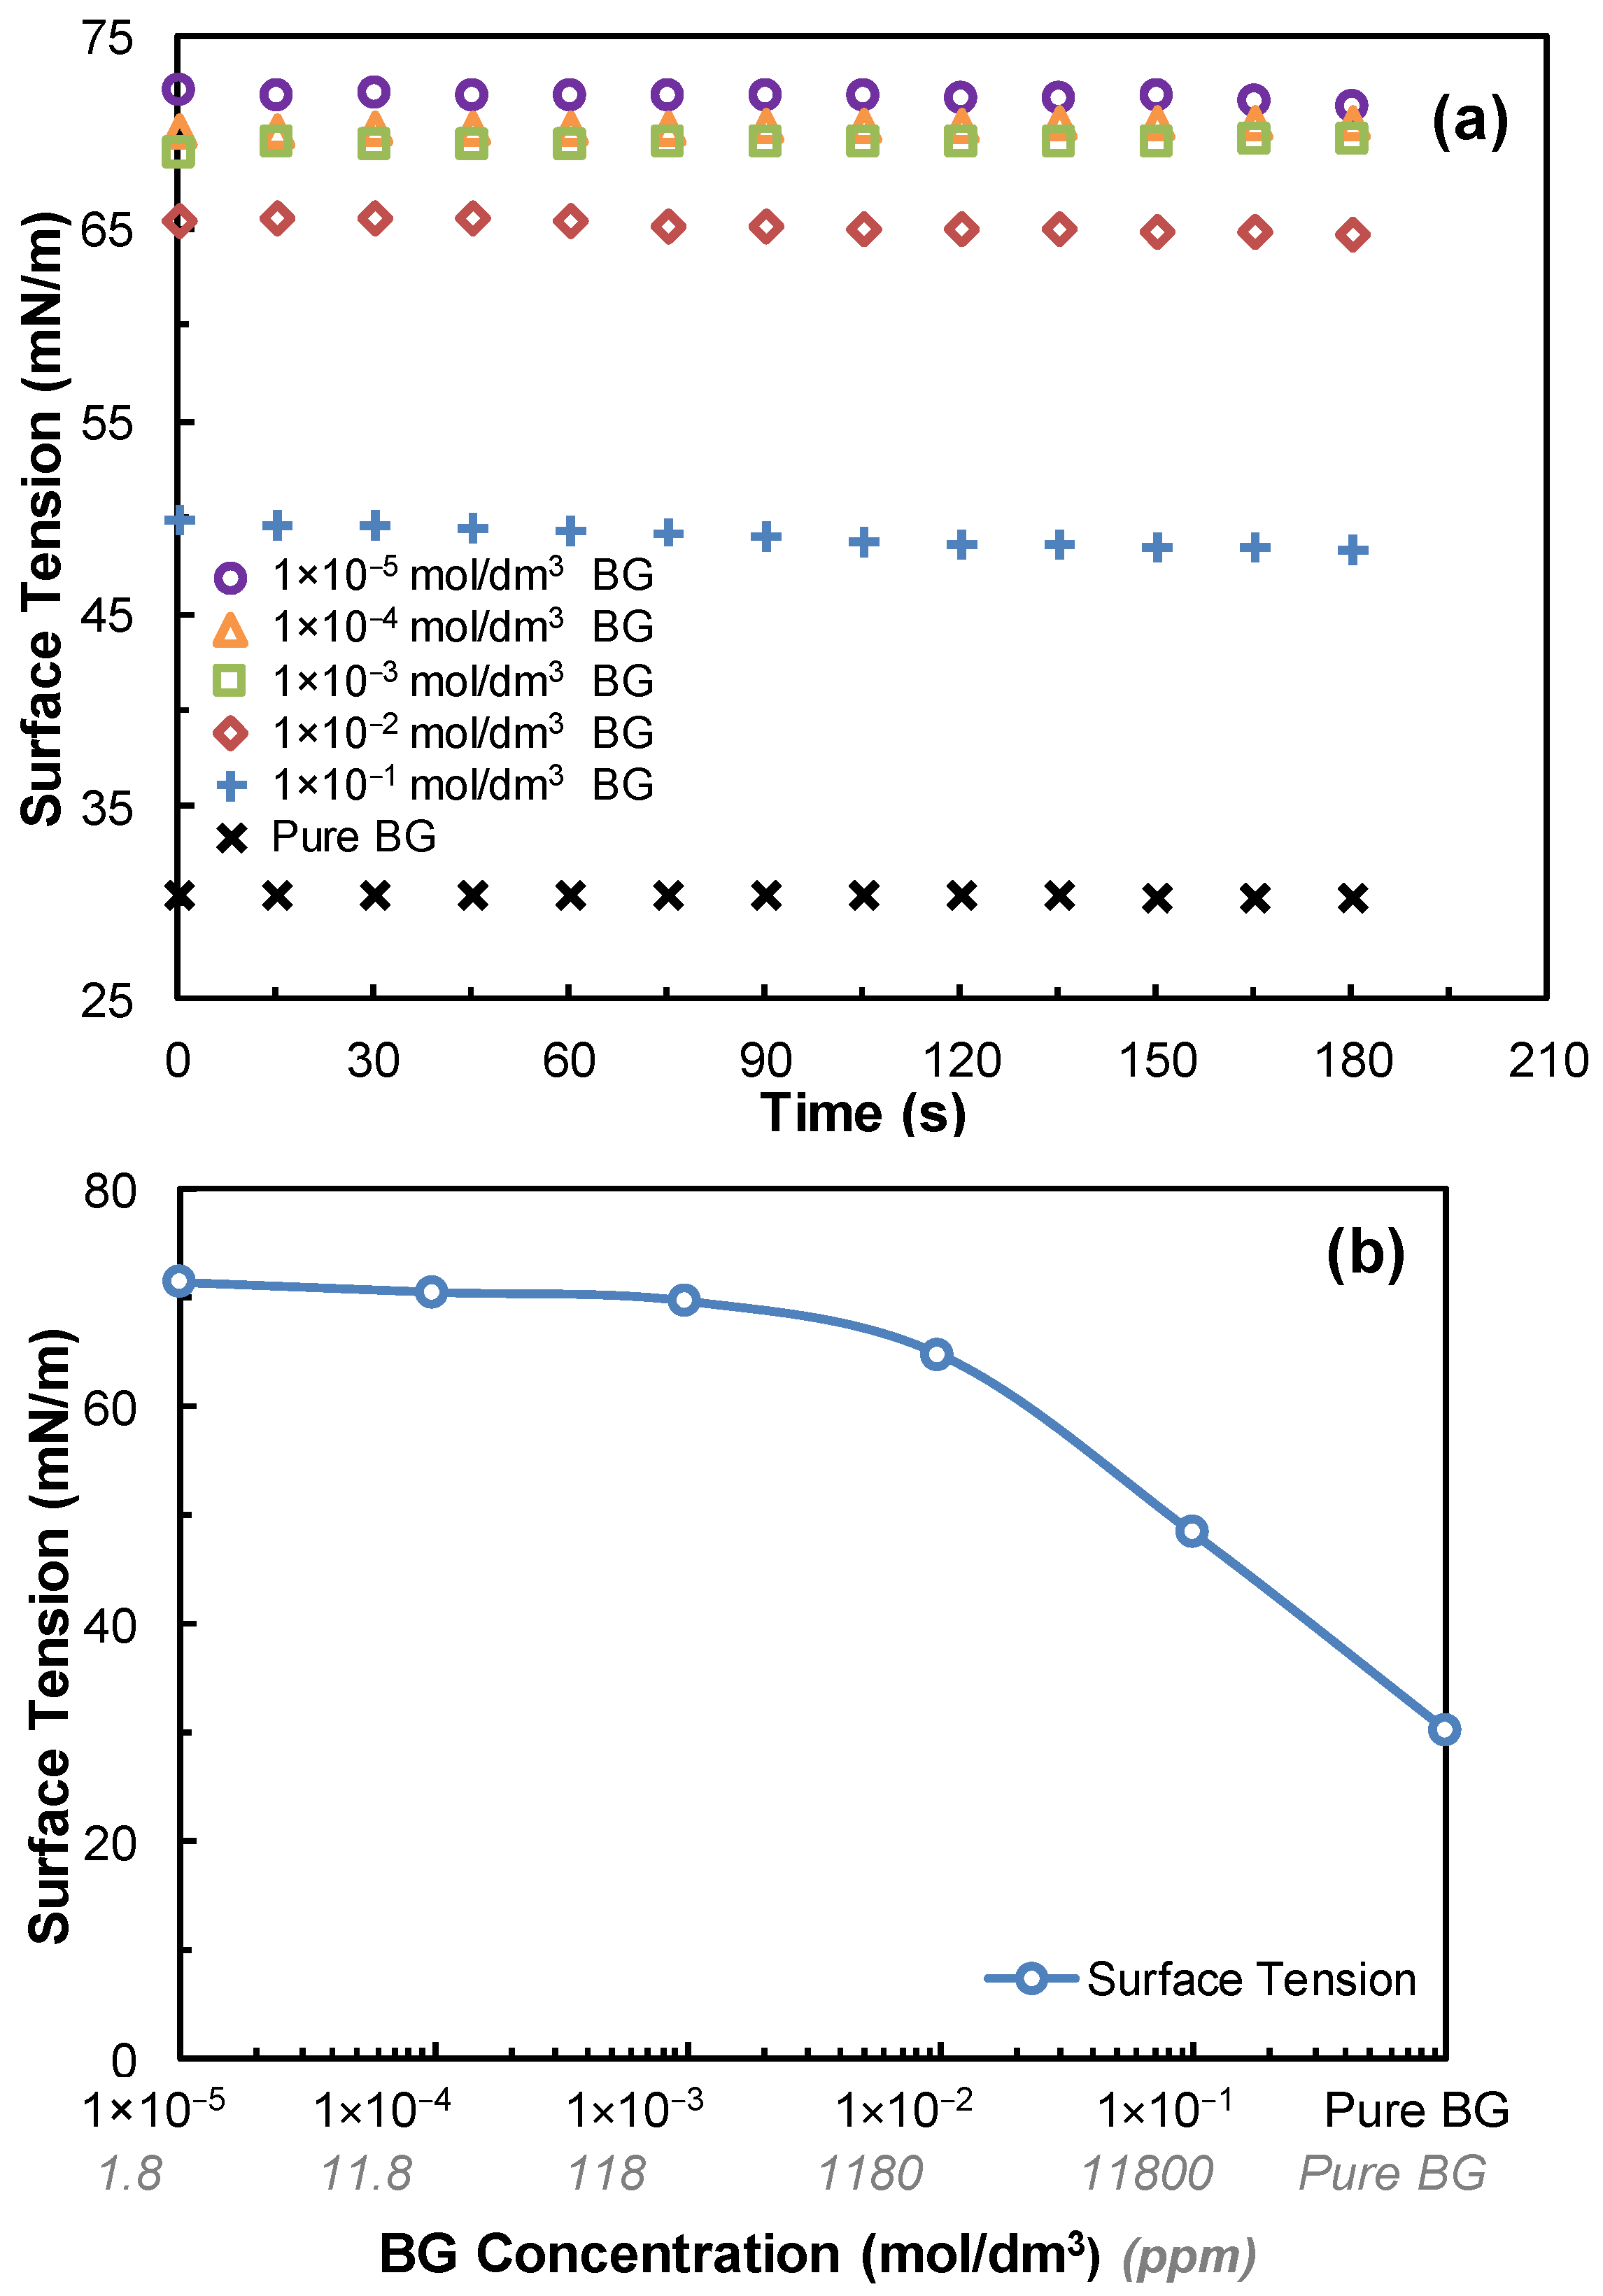
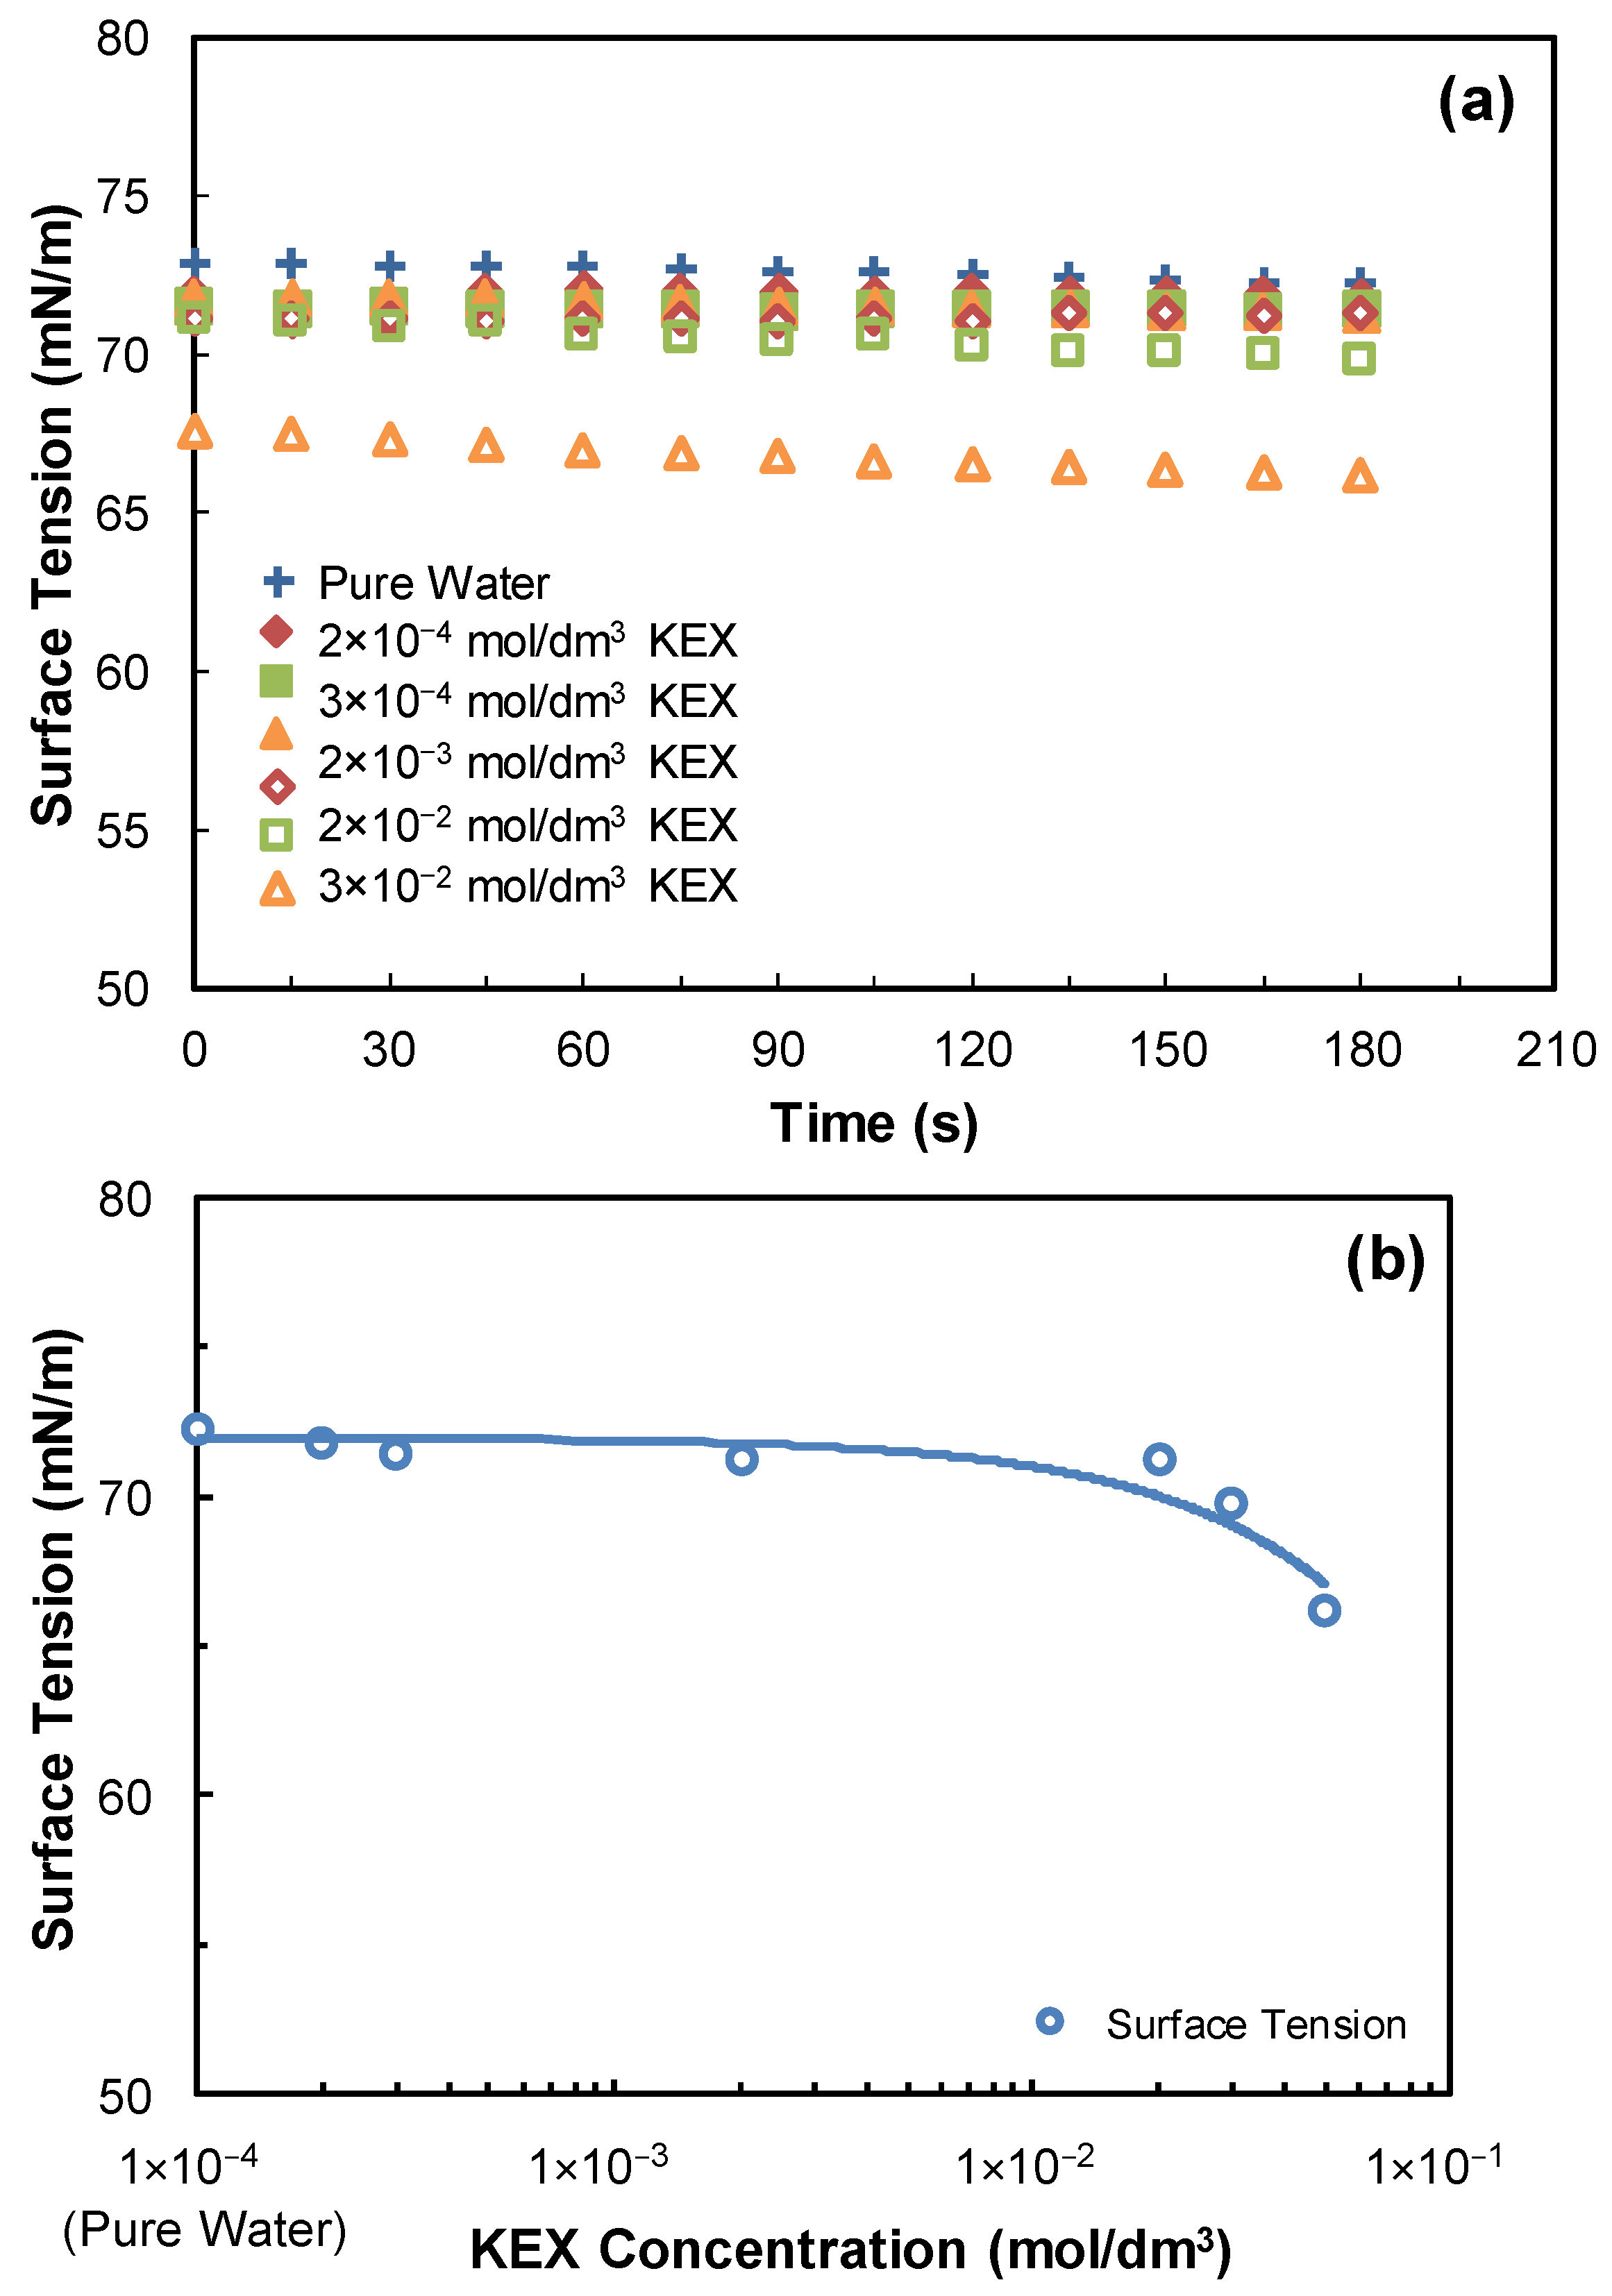
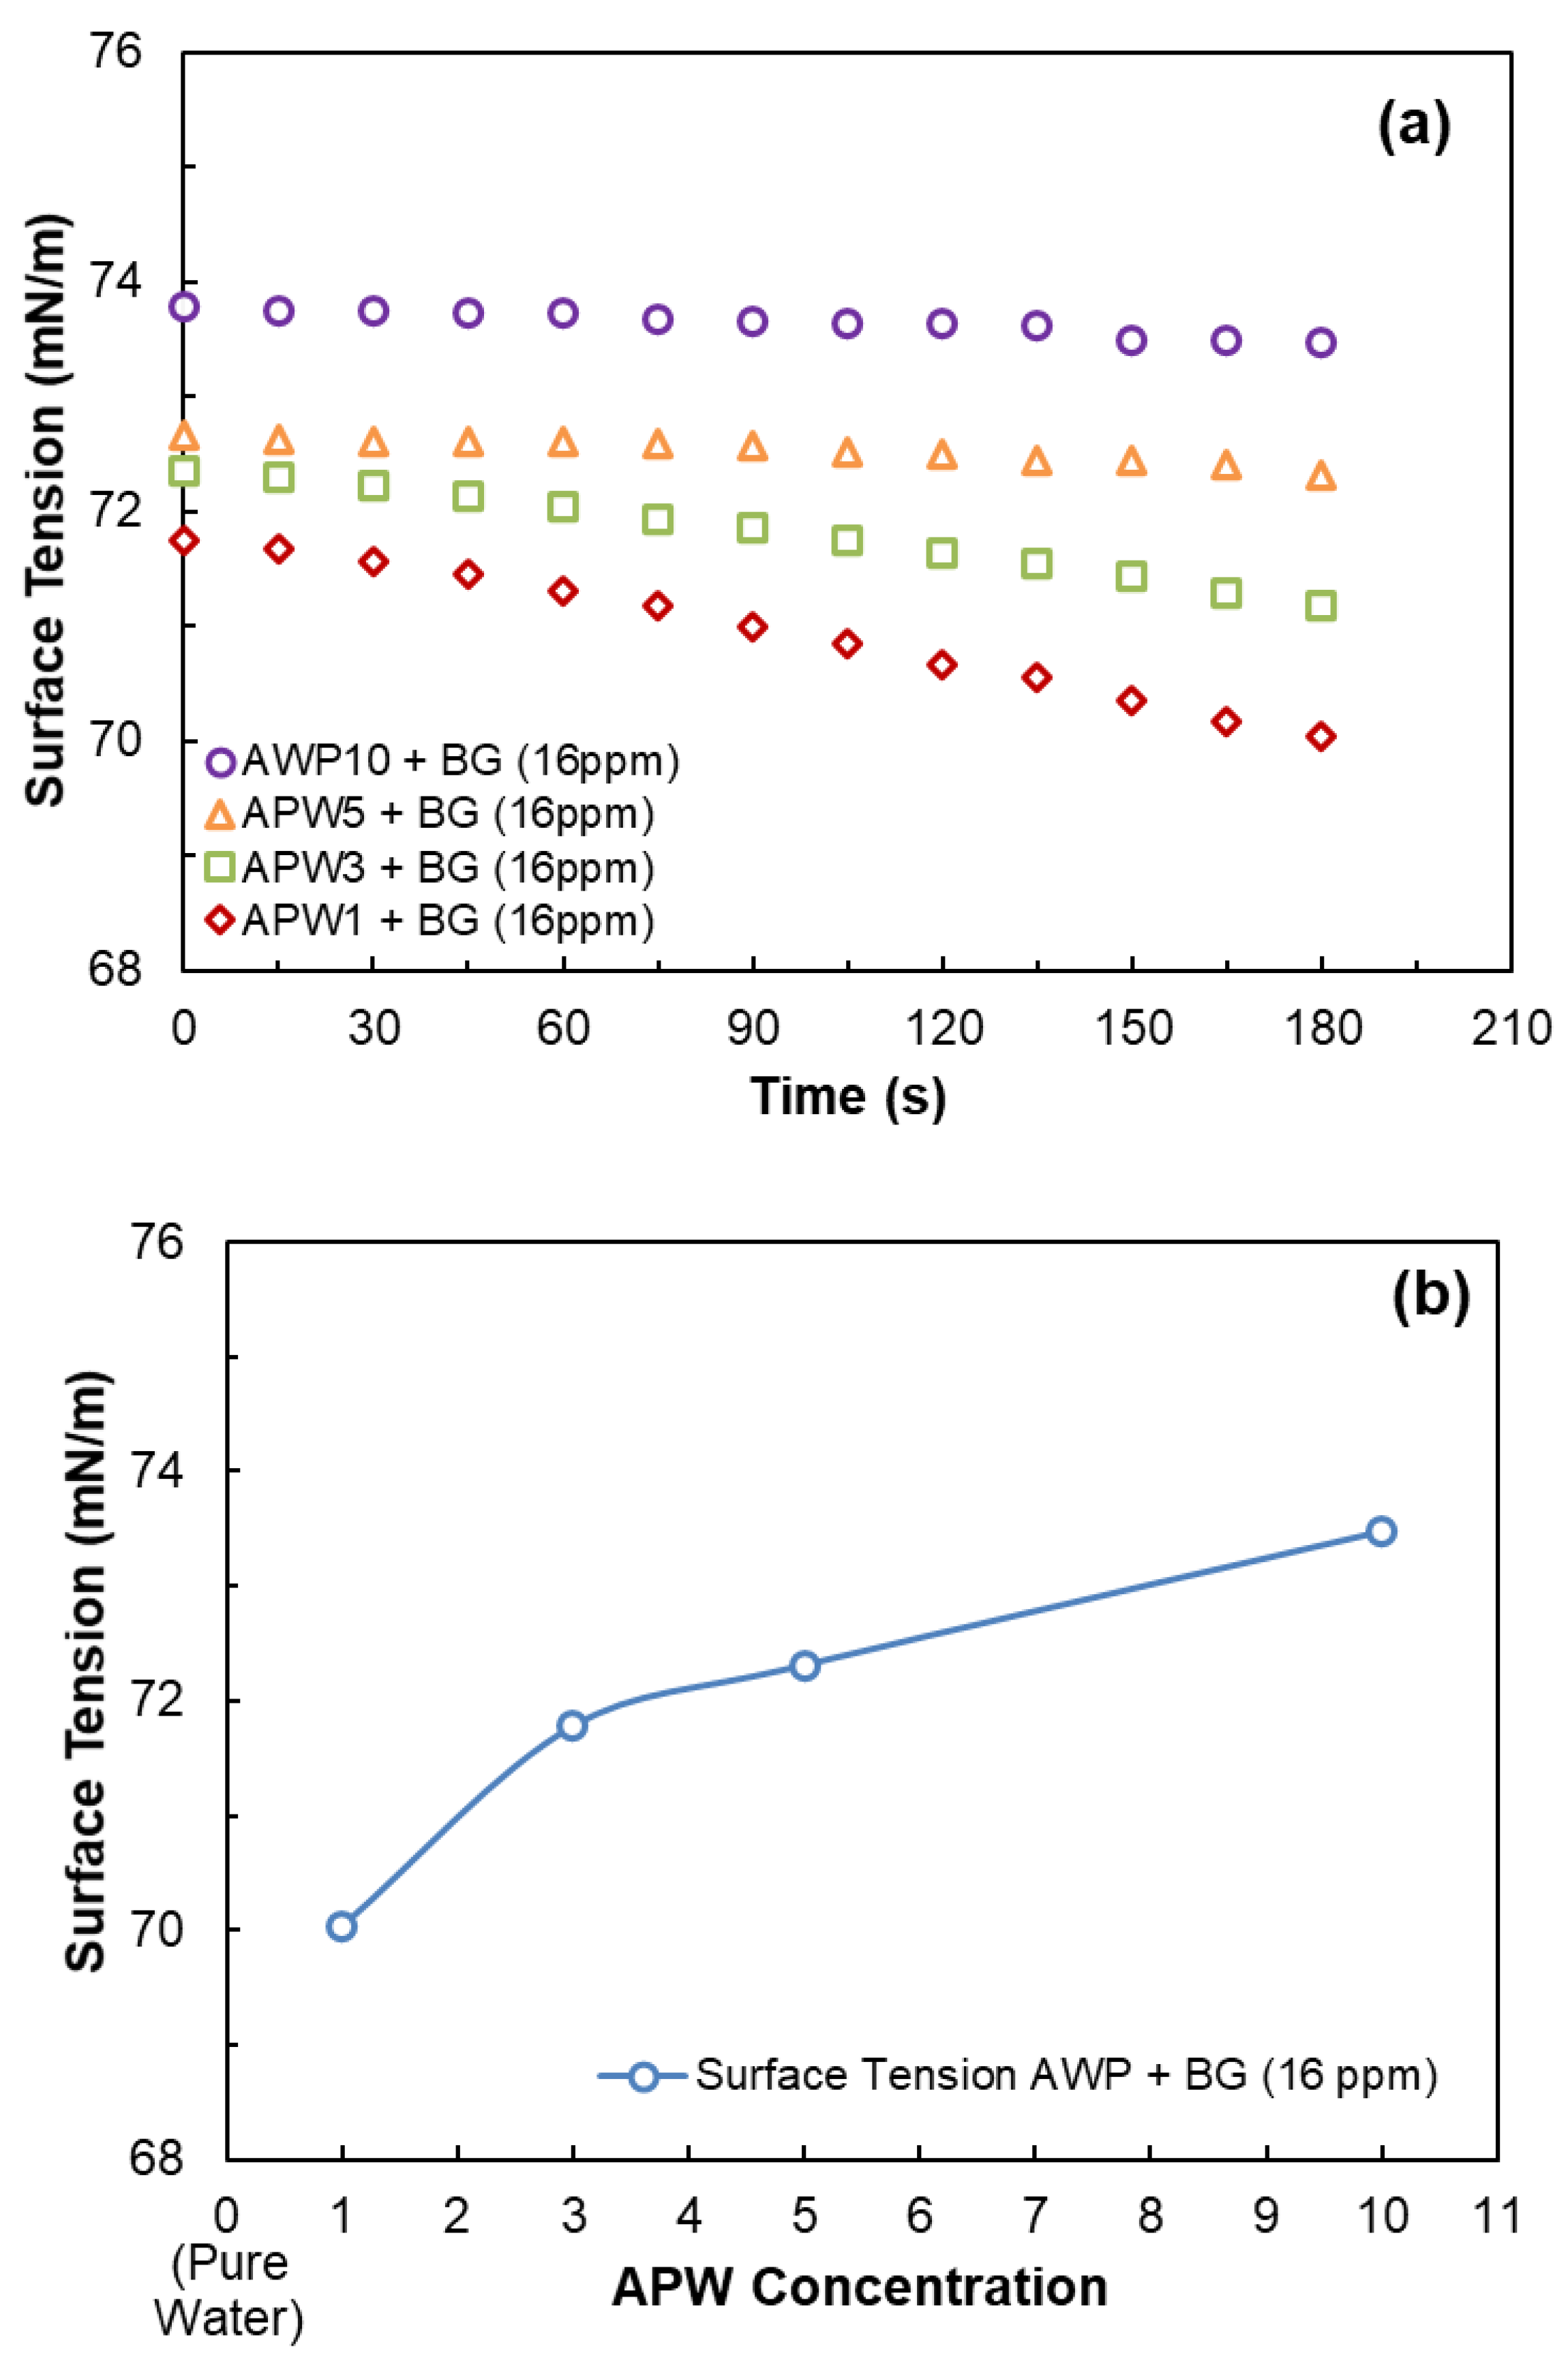
3.1. Dynamic Surface Tension Measurements

The dynamic surface tensions of aqueous BG solutions (in pure water) were measured for 180 s. Since there was no significant change in surface tension at low BG concentrations, measurements were carried out at higher BG concentrations (1 × 10⁻⁵, 1 × 10⁻⁴, 1 × 10⁻³, 1 × 10⁻², 1 × 10⁻¹ mol/dm3, and pure BG). The results of the measurements are given in Figure 4 with the equilibrium surface tension profile of BG solutions at 180 s. In Figure 4b, BG concentrations are given both in “ppm” and “mol/dm3” units to compare the results with the other experiments carried out within this study.
Figure 4a shows that the surface tension of aqueous solutions of BG did not change significantly as a function of time. This shows that BG molecules reached the air/water interface immediately and the adsorption was completed in a short time. However, the surface tension decreased considerably in relation to the BG concentration. As seen in Figure 4b, while the surface tension is 71.3 mN/m at 1 × 10⁻⁵ M BG concentration, it decreased to 70.4 mN/m, 69.6 mN/m, 64.7 mN/m, and 48.3 at 1 × 10⁻⁴, 1 × 10⁻³, 1 × 10⁻², and 1 × 10⁻¹ mol/dm3 BG concentrations, respectively. Meanwhile, in the presence of pure BG, the surface tension was measured as 30.2 mN/m. This value is close to the results of previous studies by Smallwood [44] and Velasco-Medina and Gracia-Fadrique [45] (27.4–27.7 mN/m at 20 °C).
The dynamic surface tension measurement results with respect to KEX concentration and the equilibrium surface tension values at 180 s are given in Figure 5a,b, respectively. In the measurements, as there was no significant change was observed in surface tension in measurements made at dosages up to 100 g/t KEX, higher concentrations in mol/dm3 were studied.
As seen in Figure 5a, the surface tension of aqueous KEX solutions showed a slight decrease over time at higher KEX concentrations. This shows that it takes time for KEX molecules to reach the air/water interface, especially at high concentrations. The selectivity of KEX pertains to the mineral/water interface. Furthermore, three carbon atoms exist in the hydrocarbon chain structure of KEX, which is not a sufficient chain length to rapidly lower the surface tension. However, when the KEX concentration increases to very high values, KEX molecules can penetrate the air/water interface and reduce the surface tension slightly. We obtained 66.1 mN/m surface tension at 5 × 10⁻² mol/dm3 KEX.
The results of dynamic surface tension measurements at various APW concentrations are given in Figure 6a and the equilibrium surface tension values at 180 s are shown in Figure 6b.
Figure 6a shows that the surface tension of APWs increased slightly with time. Meanwhile, the surface tension also increased with APW concentration, as seen in Figure 6b. While the surface tension is 73.5 mN/m in the presence of APW 1, it increased to 74.4 mN/m in the presence of APW3 and reached a plateau.
Several parameters are responsible for the change in the surface tension in the presence of ions, including the long-range electrostatic interactions, the valance, radius, and polarizability of the ion. These parameters affect the relationship of an ion with water molecules. Some ions are hydrated and remain in the bulk water phase, thus increasing the surface tension. These ions are called kosmotropic ions. On the other hand, chaotropic ions move to the air/water interface and decrease the surface tension. If there are surfactants adsorbed at the interface, the chaotropic ions penetrate them.
The chaotrophy/kosmotrophy property of an ion can be determined based on how long the water molecule is present near that ion. If a water molecule stays near an ion for longer on average than it does around another water molecule in bulk water, then this ion is called a kosmothropic ion. On the contrary, if a water molecule resides around an ion for a shorter average time than it resides around another water molecule in bulk water, it is called a chaothropic ion. Smaller monovalent ions usually have large electric fields on their surfaces and are kosmothropes [46,47,48,49,50].
Ions are ordered by Hofmeister [51] according to the strength of such relationships with water molecules. As is also known from the literature, dissolved ions generally increase the surface tension of a solution related to their concentration, except for several ions such as HCl, HClO4, and HNO3 [52,53]. In the studies conducted by Marcus [54] and Marcus [52], ionic surface tension changes (ki) at ~25 °C of aqueous ions used in this study were reported except for Fe3+ and their data justify the ~2 mN/m increase in surface tension seen in Figure 5.
The results of the surface tension measurements in the presence of APW and BG are given in Figure 7.
In a system where both ions (APW) and BG are present at the same time, ions tend to increase the surface tension, whereas BG molecules tend to decrease it.
As seen in Figure 7a, although it takes time for BG molecules to reach the interface at low ion concentrations, BG can decrease the surface tension. In the presence of APW1 and BG at 16 ppm, the surface tension decreased from 71.7 mN/m to 70.0 mN/m after 180 s. However, this effect of BG decreased with the ion concentration. In the presence of APW10 and BG (16 ppm), the change in surface tension was only 0.5 mN/m.
Meanwhile, Figure 7b shows that surface tension increased with the APW concentration in the presence of BG (16 ppm). This indicates that ions are the dominant chemicals in the determination of surface tension.

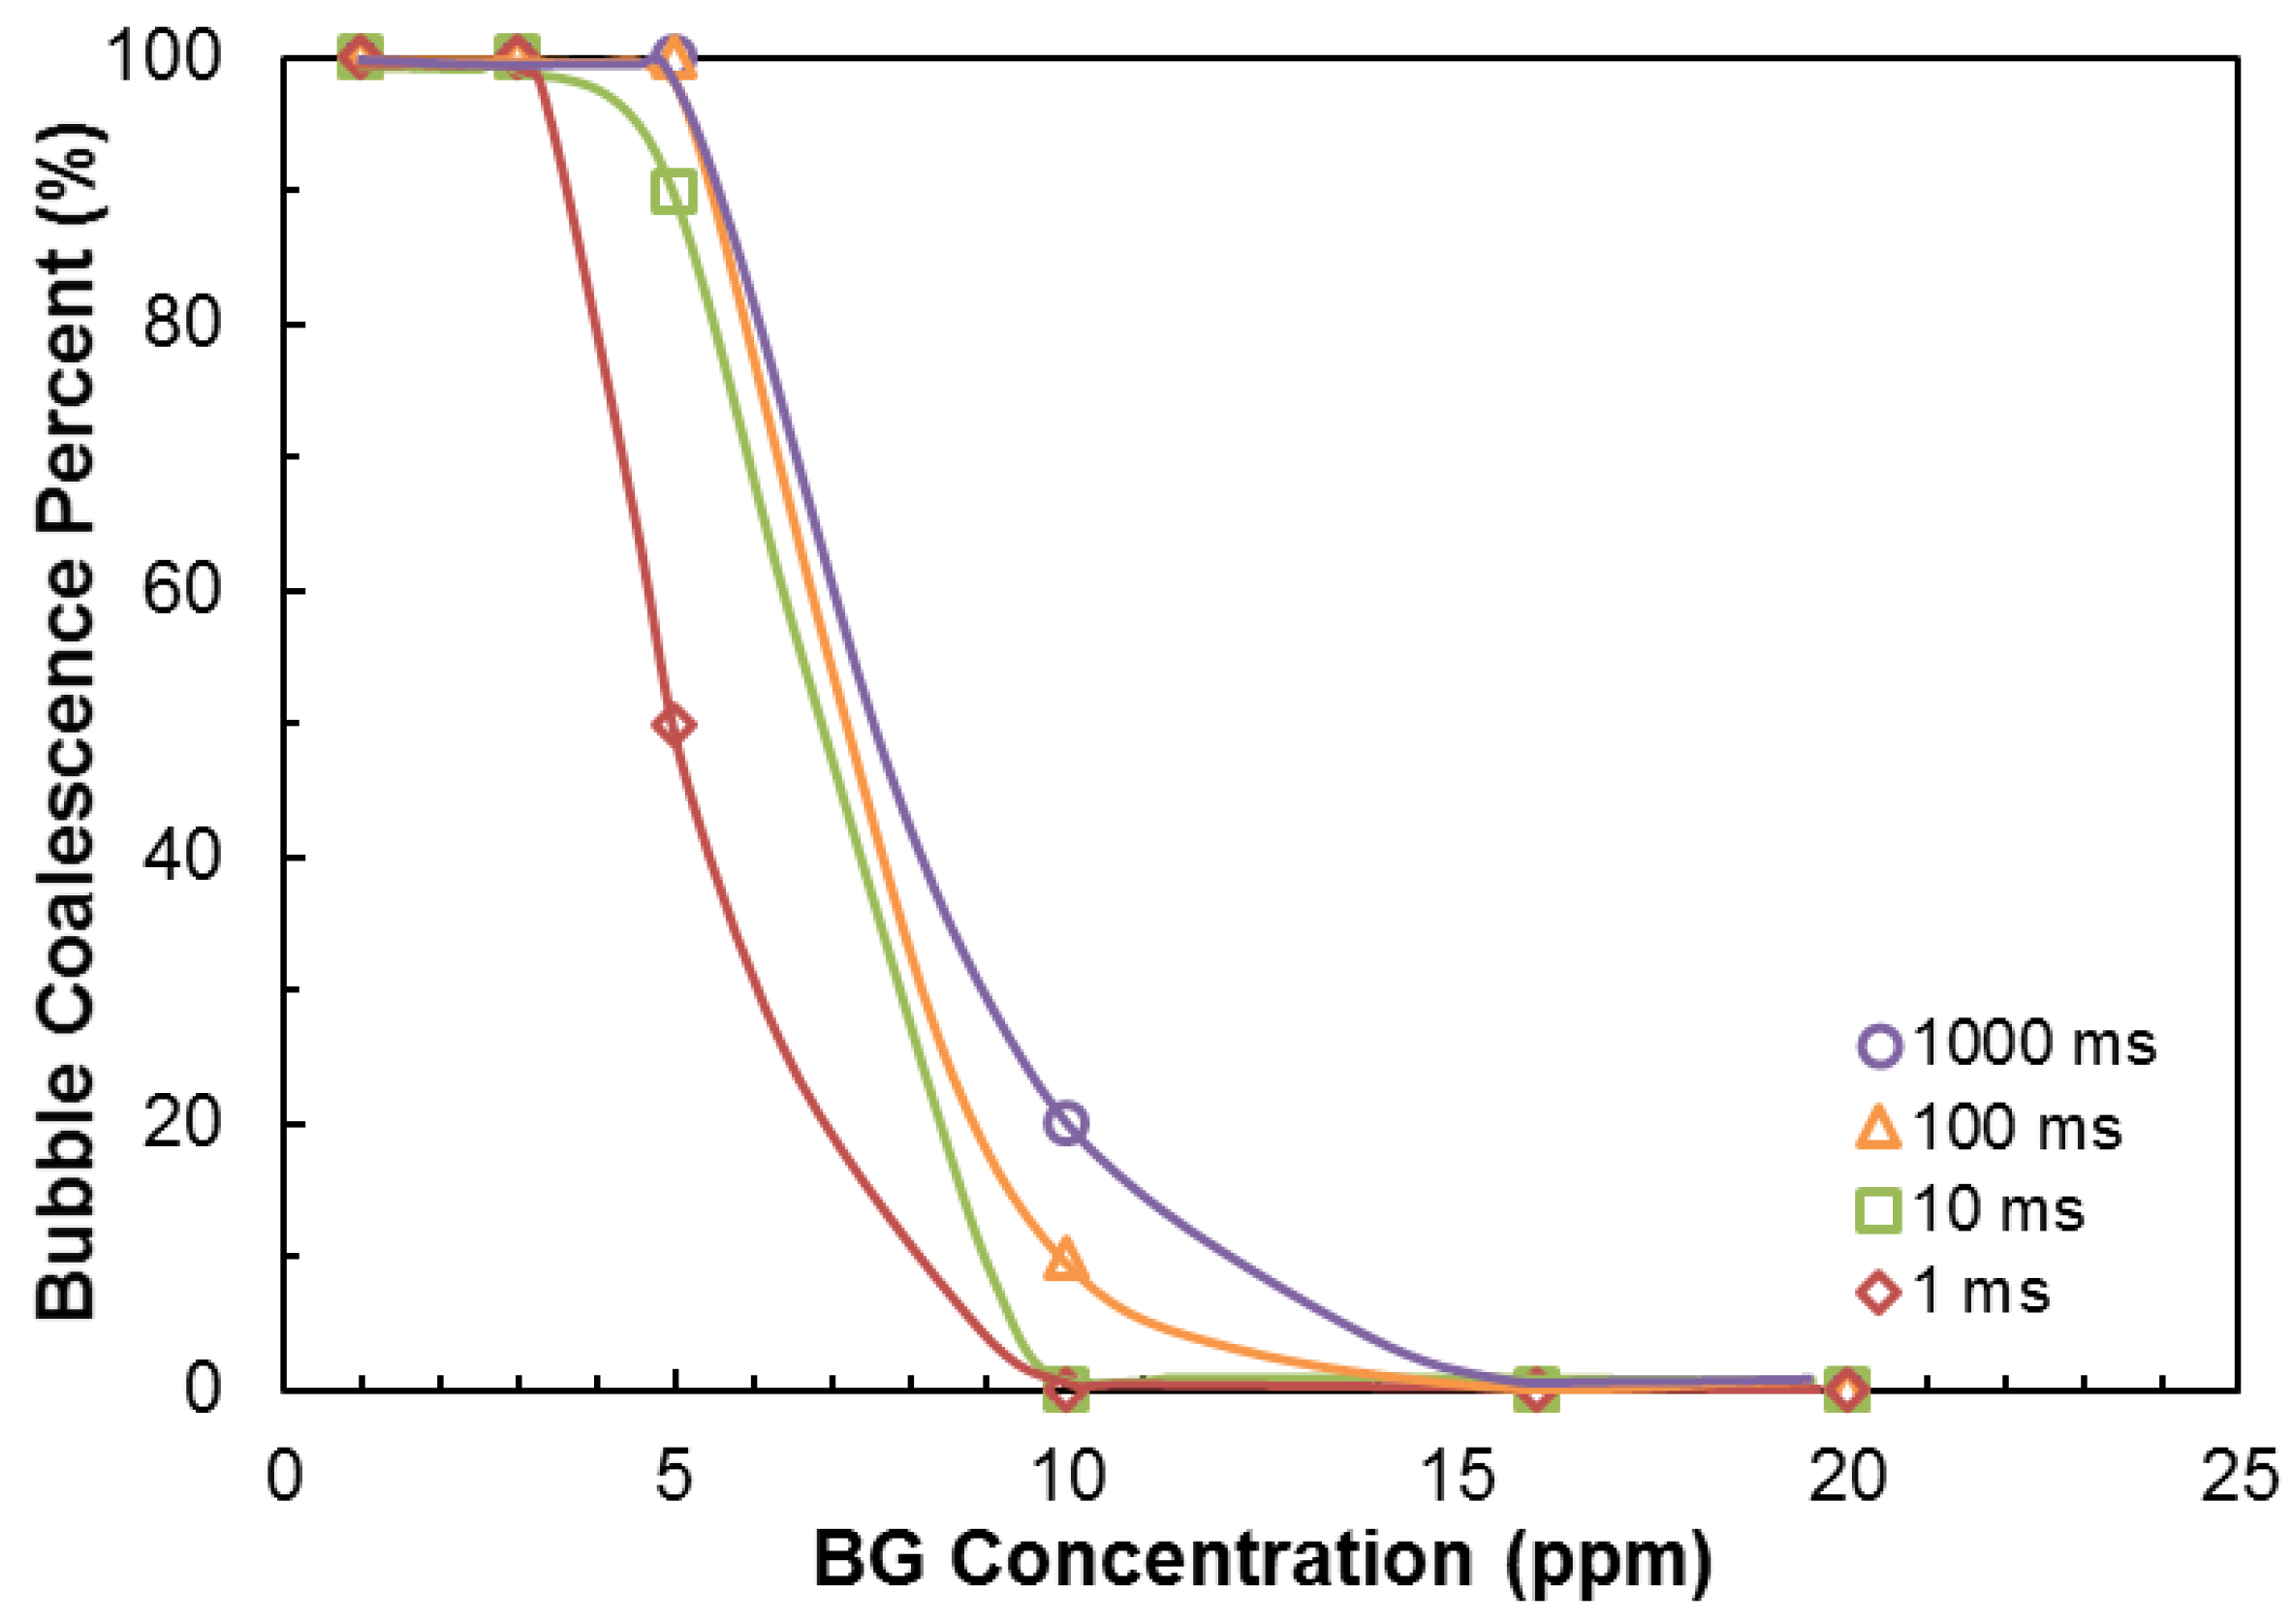
3.2. Bubble Coalescence Time Measurements

Bubble coalescence percentage as a function of BG concentration is shown in Figure 8 for 1, 10, 100, and 1000 ms contact times.
As seen in Figure 8, bubble coalescence could not be prevented up to ~5 ppm BG concentration. With the increase in the concentration of BG, the probability of bubble coalescence decreased, inversely proportional to the contact time. Higher BG concentrations were needed to prevent bubble coalescence at the same contact time. Bubble coalescence was completely inhibited in the presence of 16 ppm BG even at 1000 ms contact time. Therefore, it is clearly seen that bubble coalescence can be inhibited although there is no significant decrease in surface tension at these BG concentrations, as seen in Figure 4b.
In this study, the probability of bubble coalescence in the presence of APW was also investigated. The results indicated that bubble coalescence was completely inhibited (0% bubble coalescence was obtained) at all APW concentrations with or without BG and/or KEX in the medium. The bubble coalescence results of the experiments in the presence of APW with and without BG and KEX are given in Table 2. Meanwhile, Roberto and Arturo [55] stated that KEX decreased the coalescence time at alkaline pH conditions.

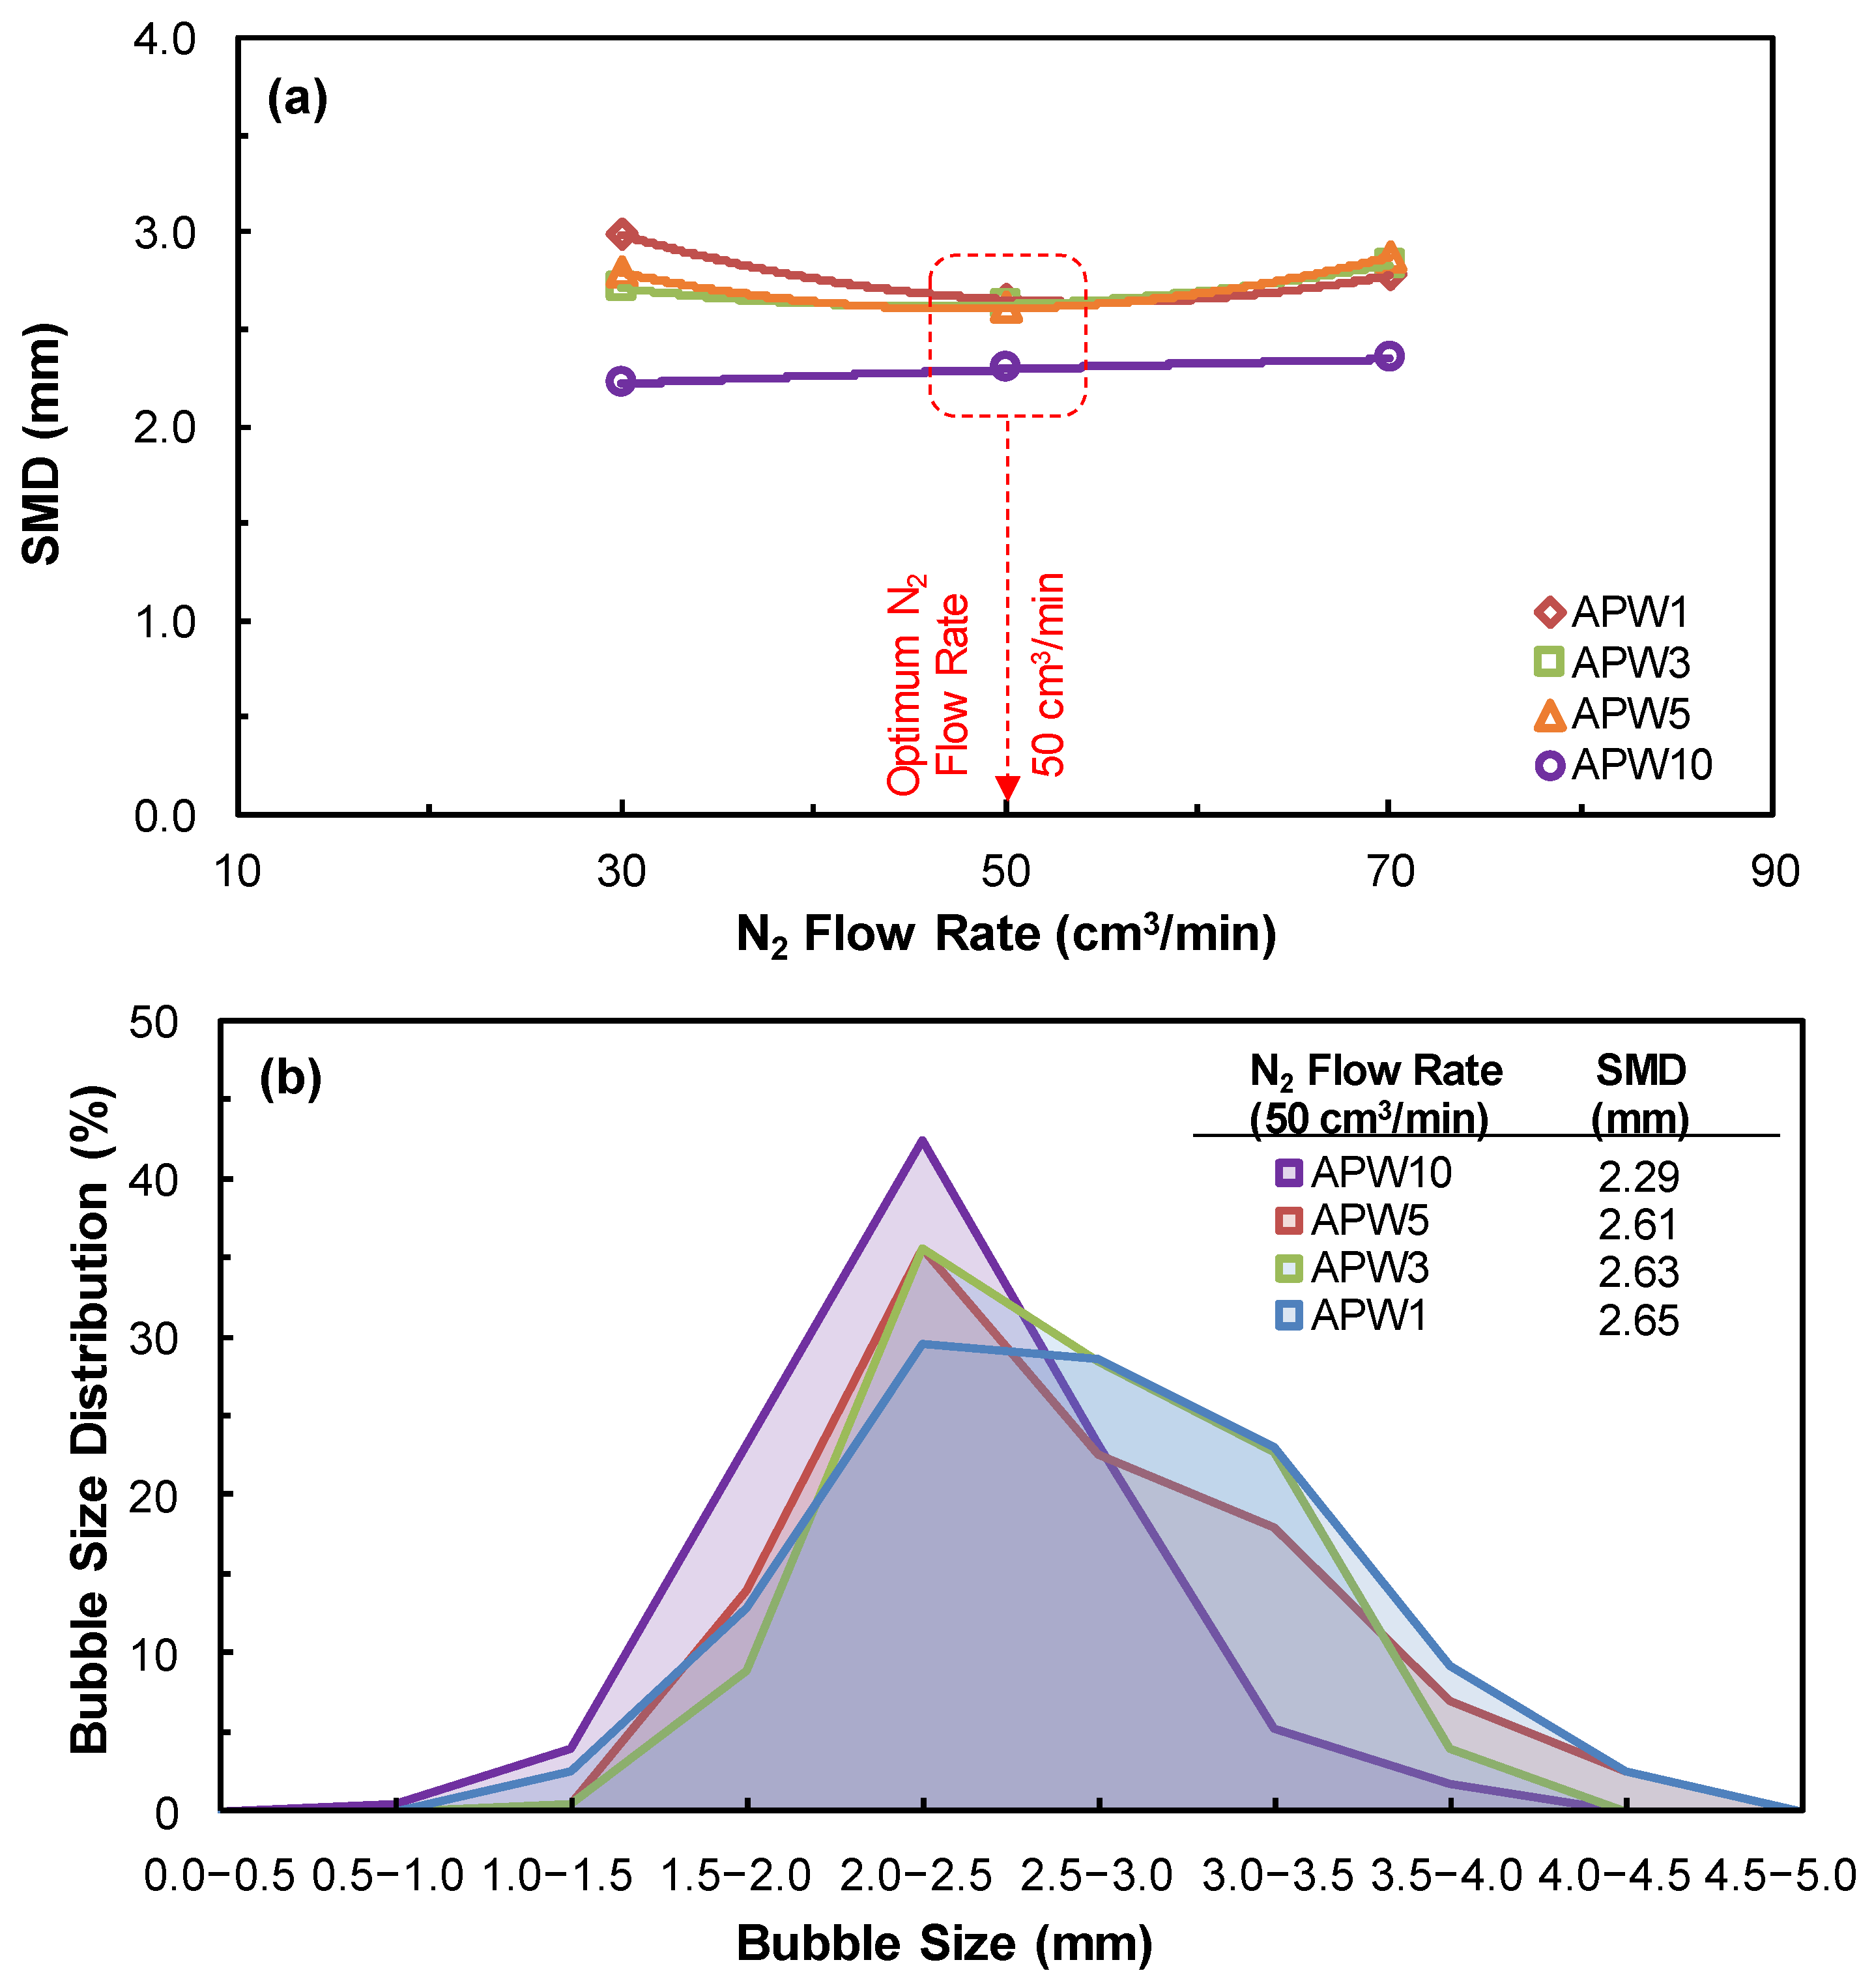
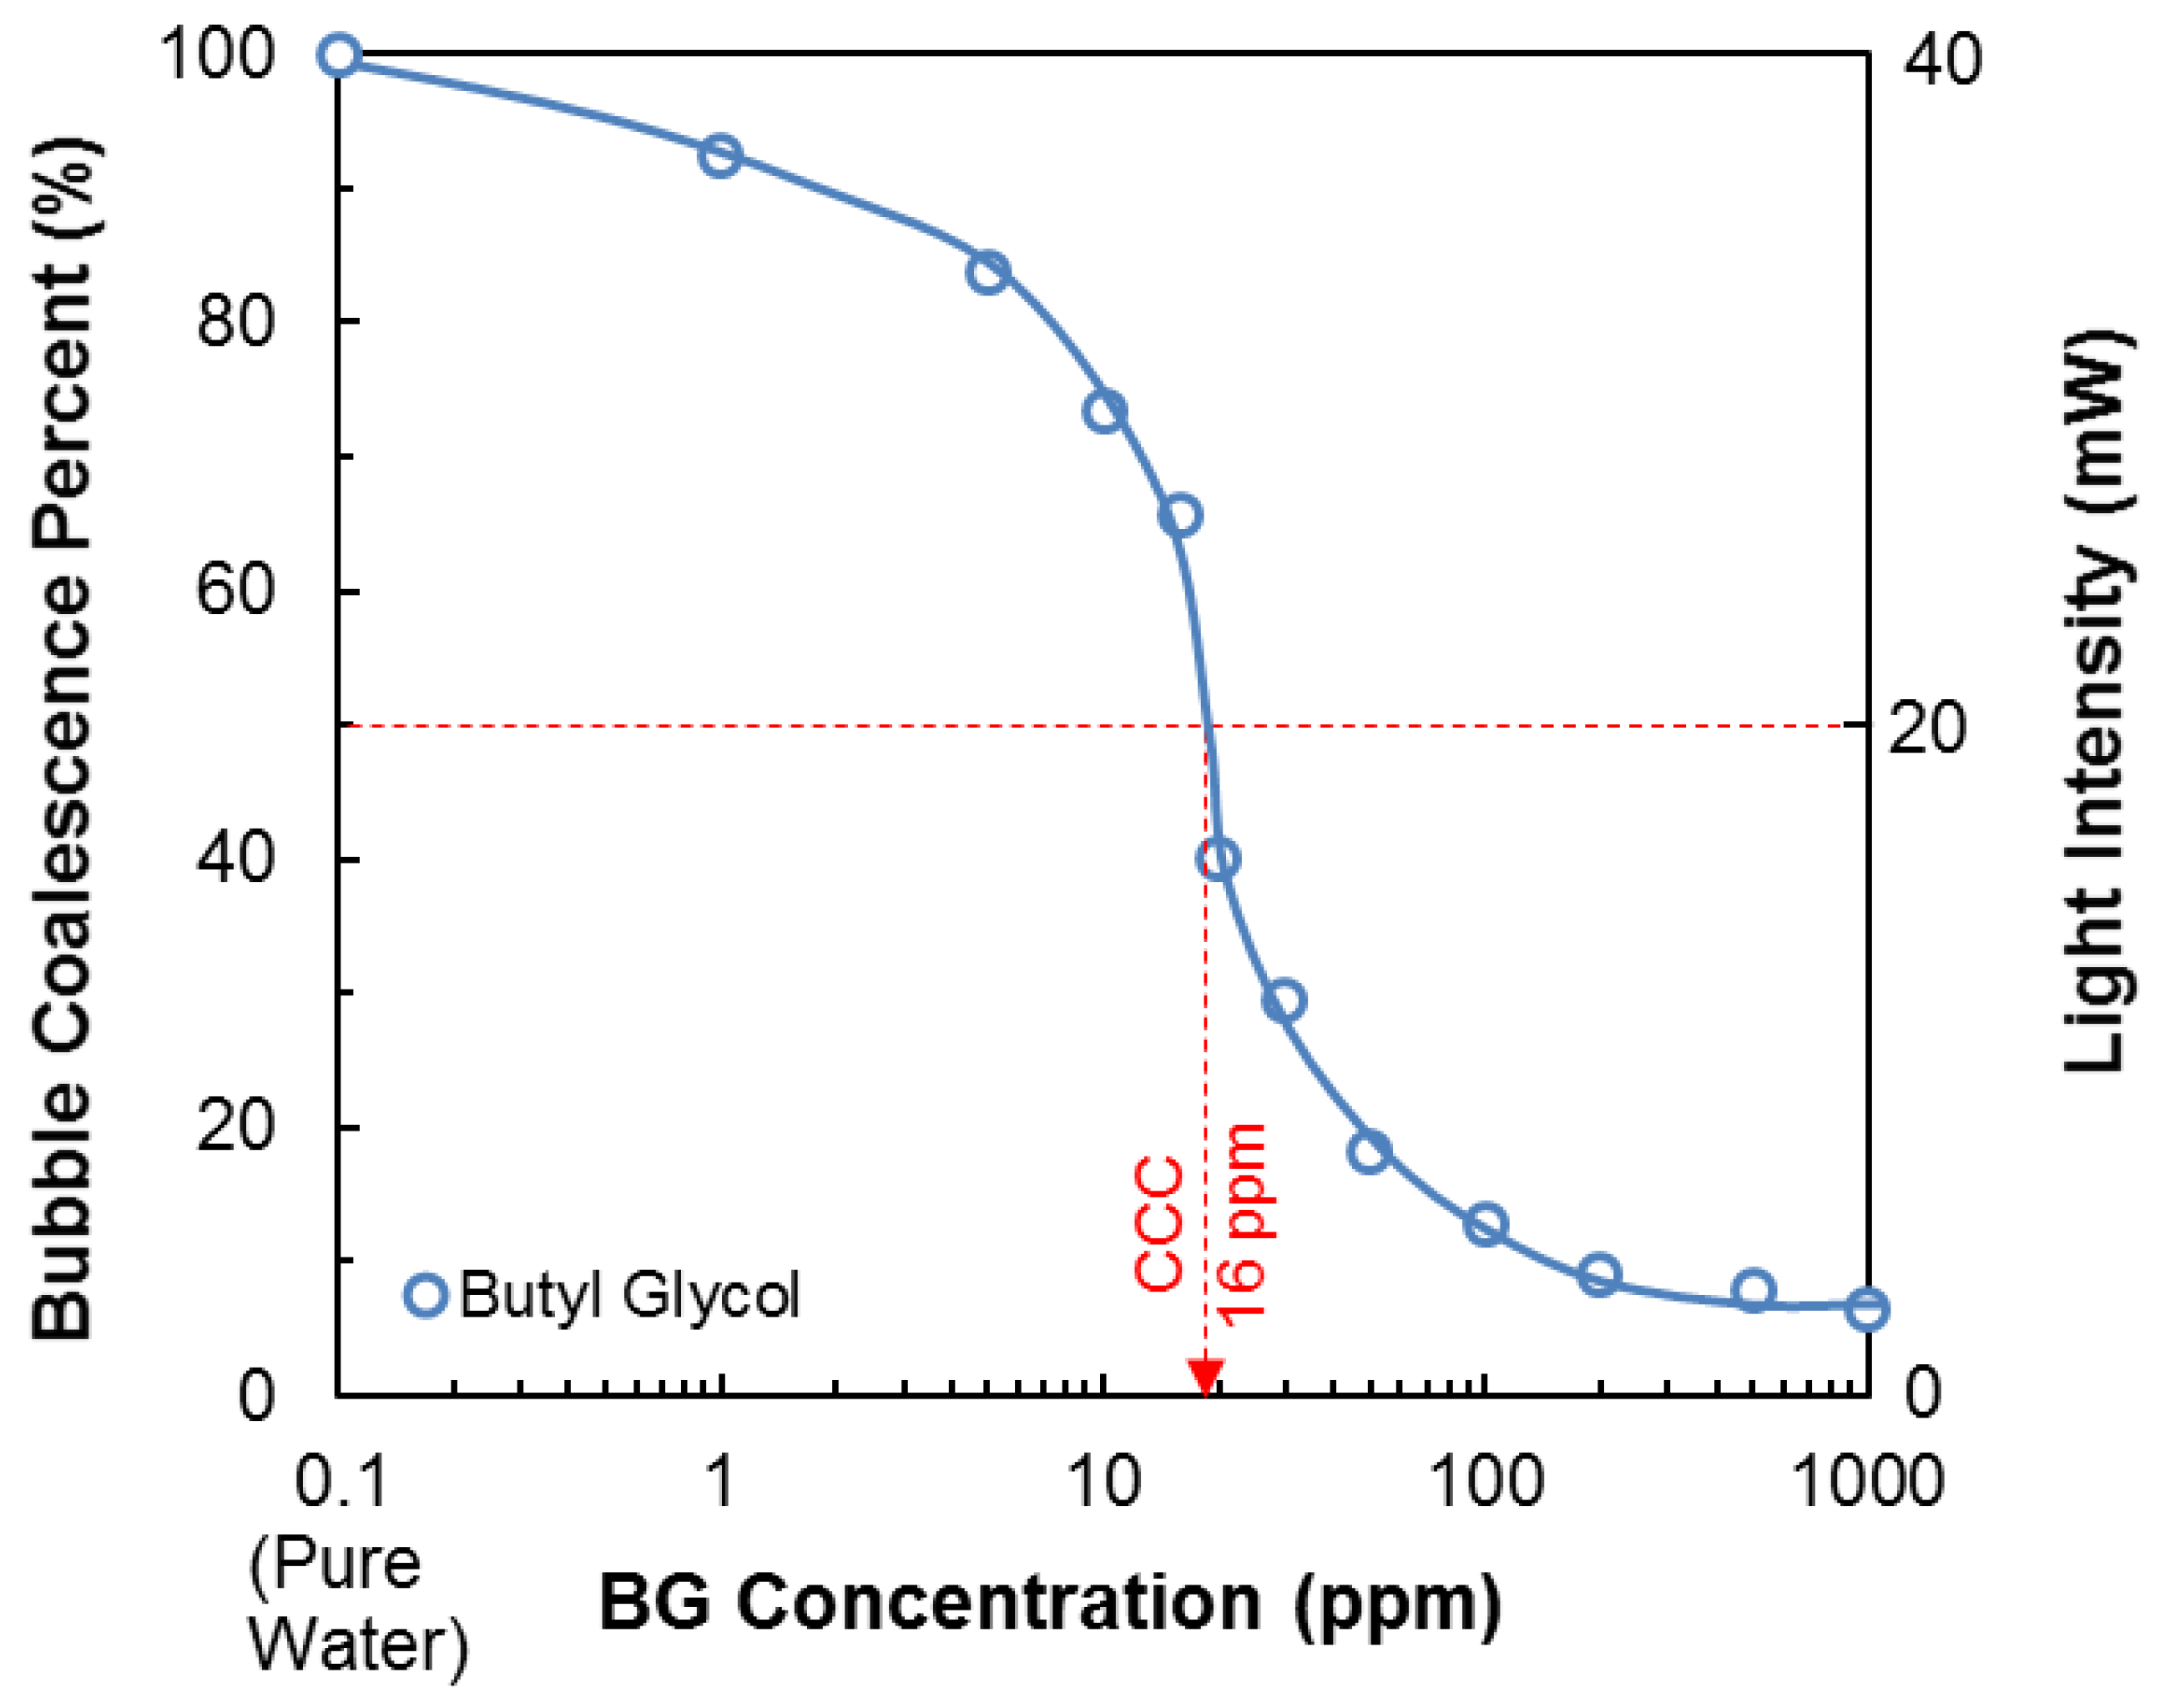
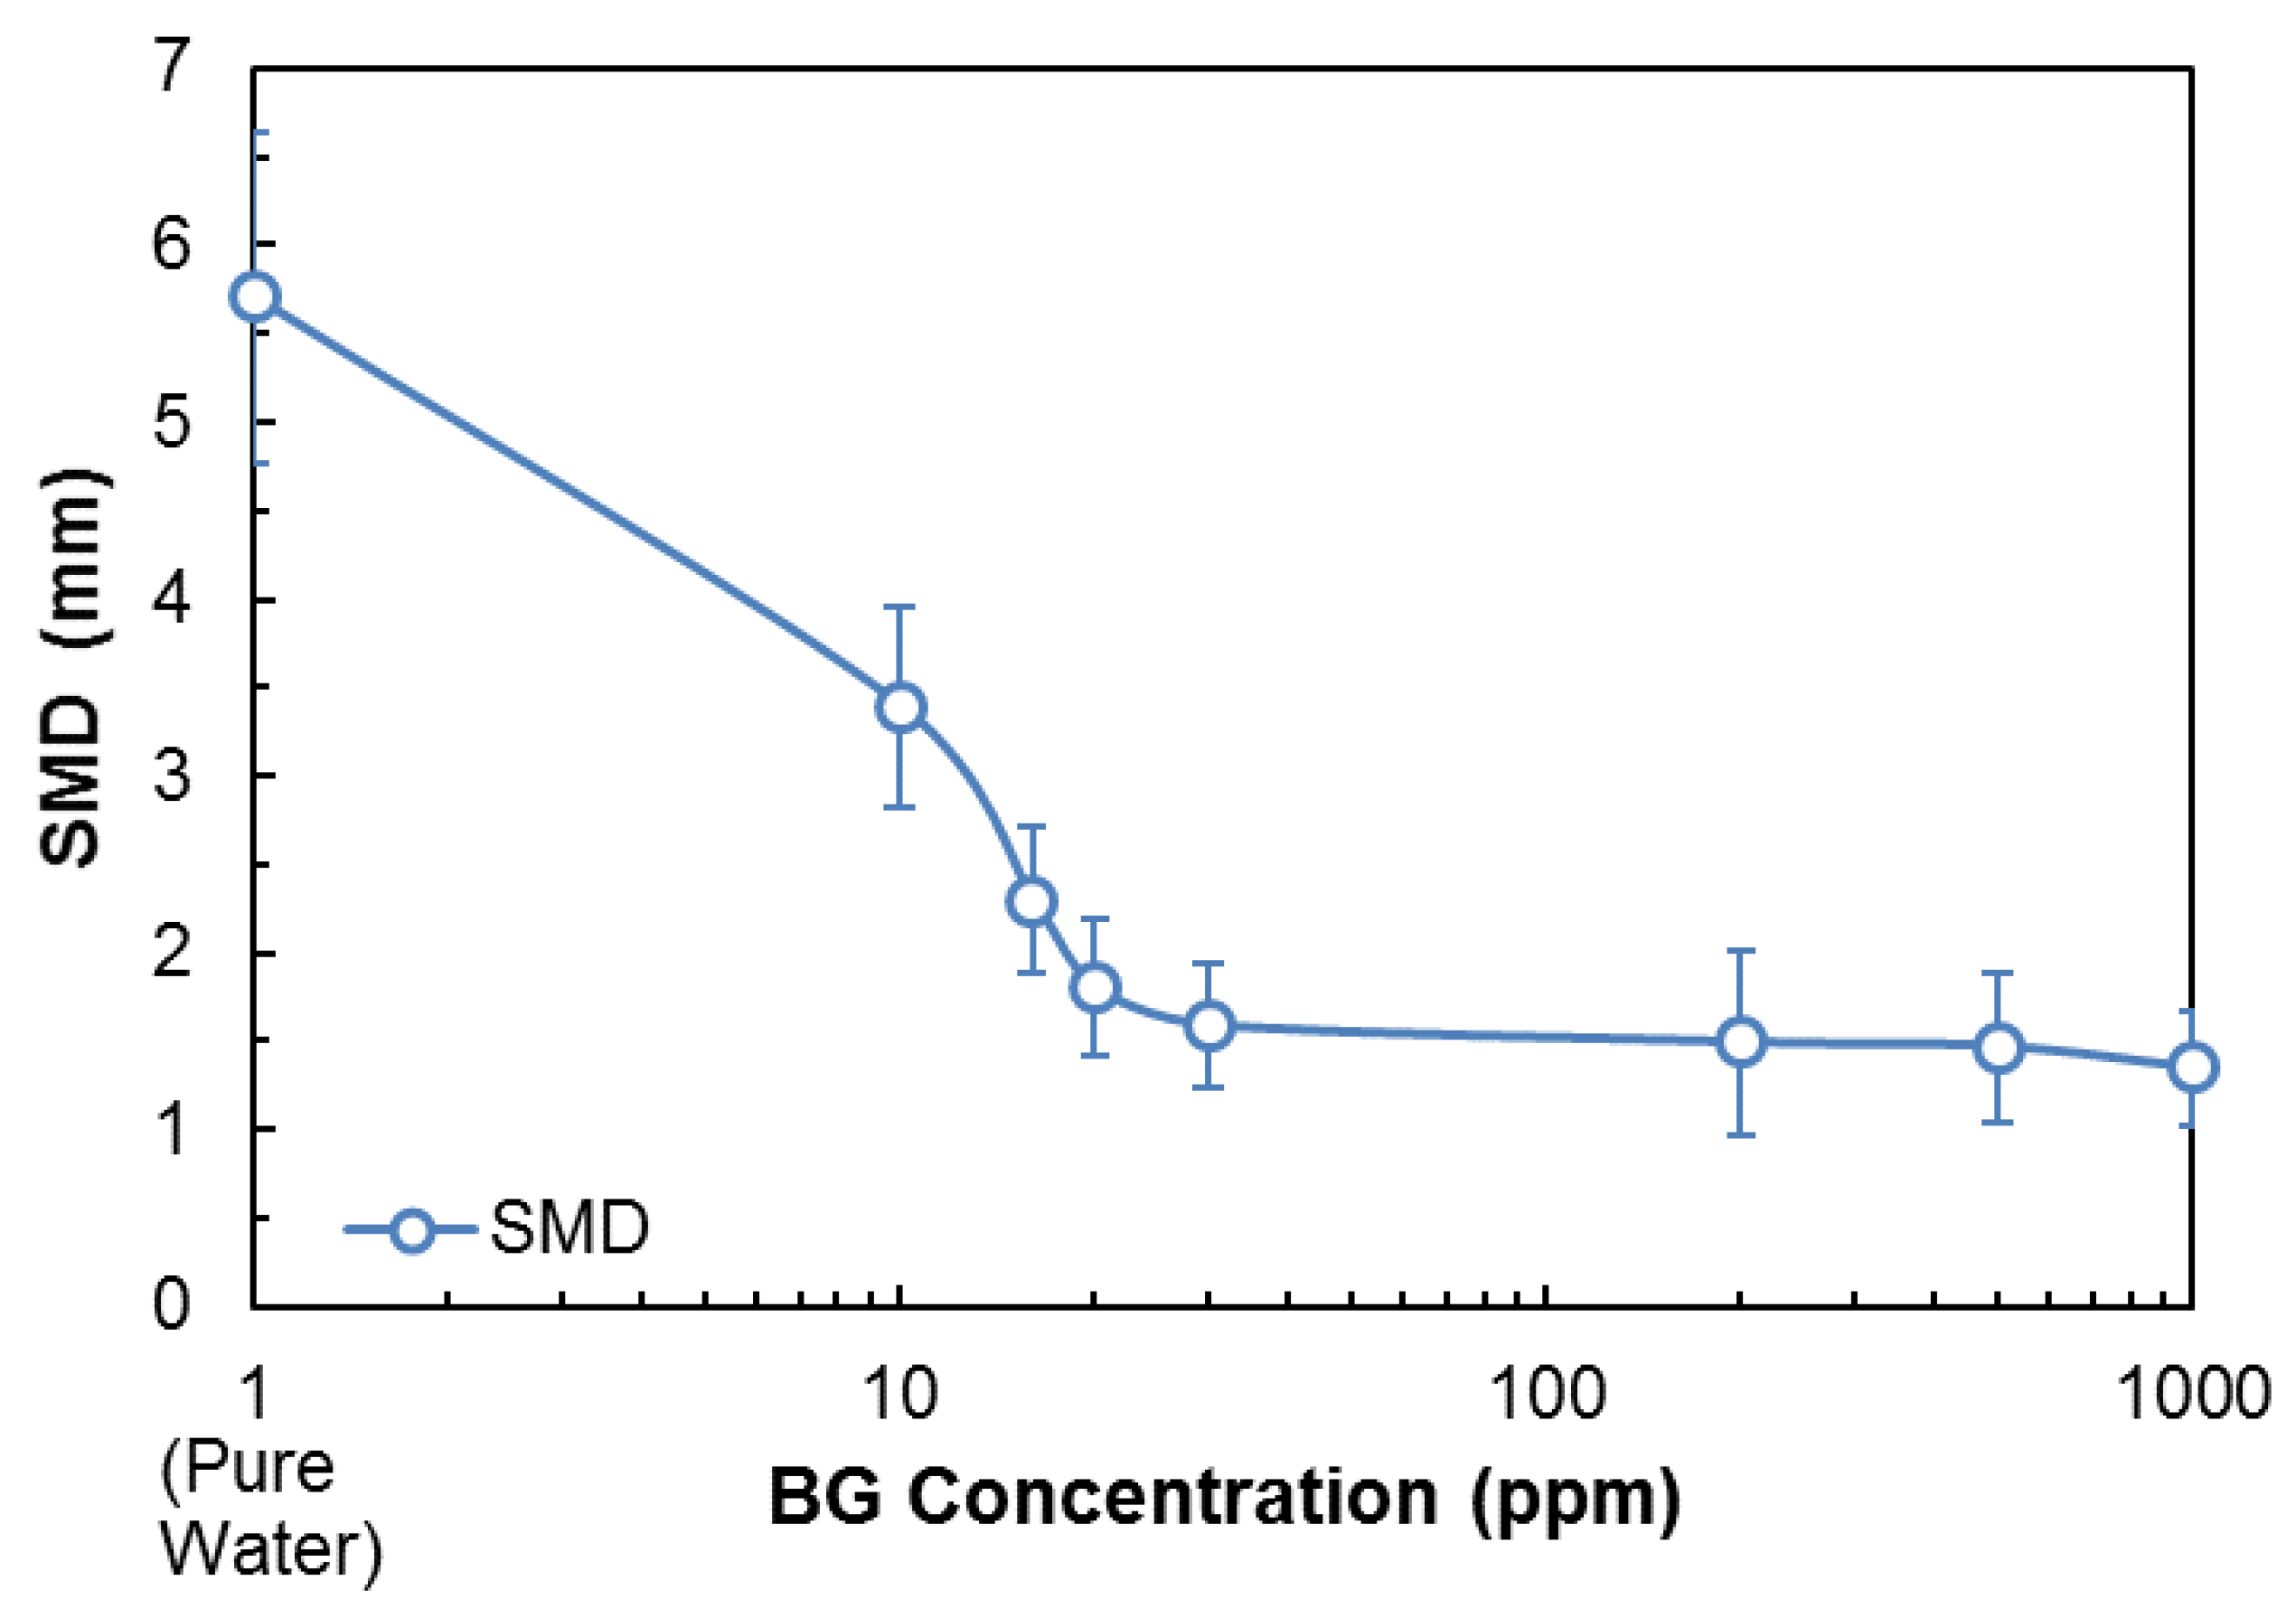
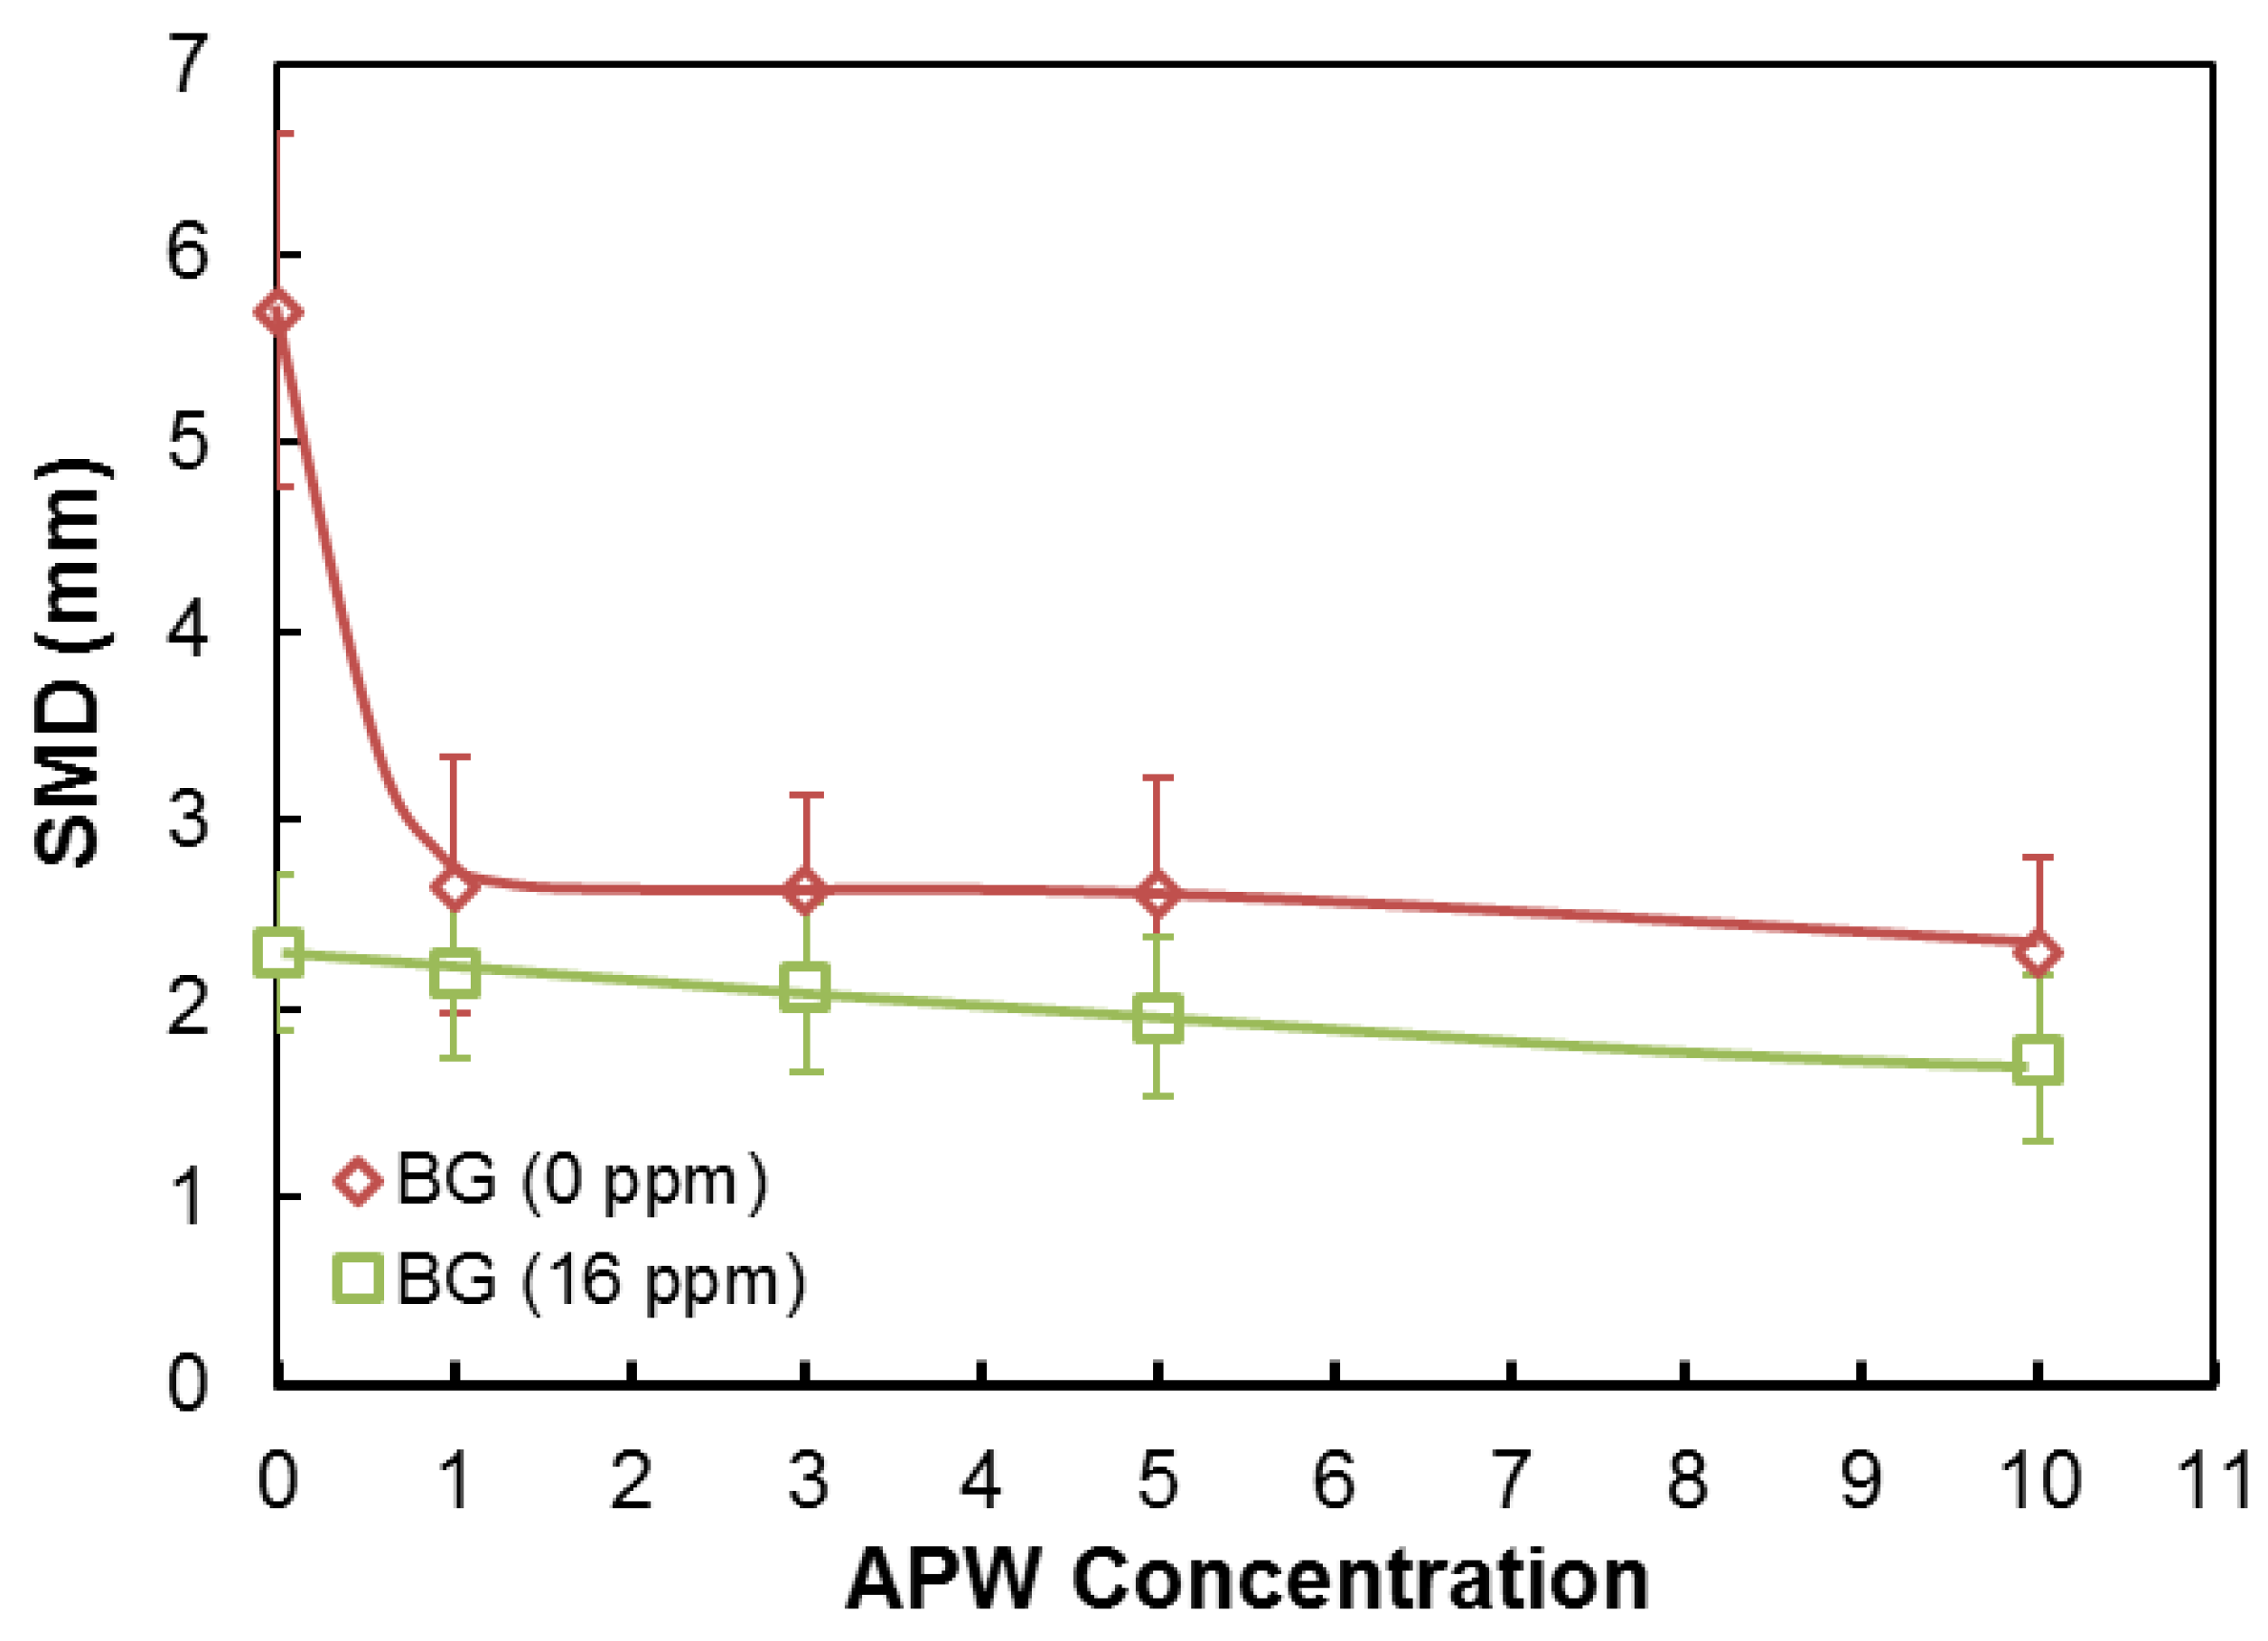
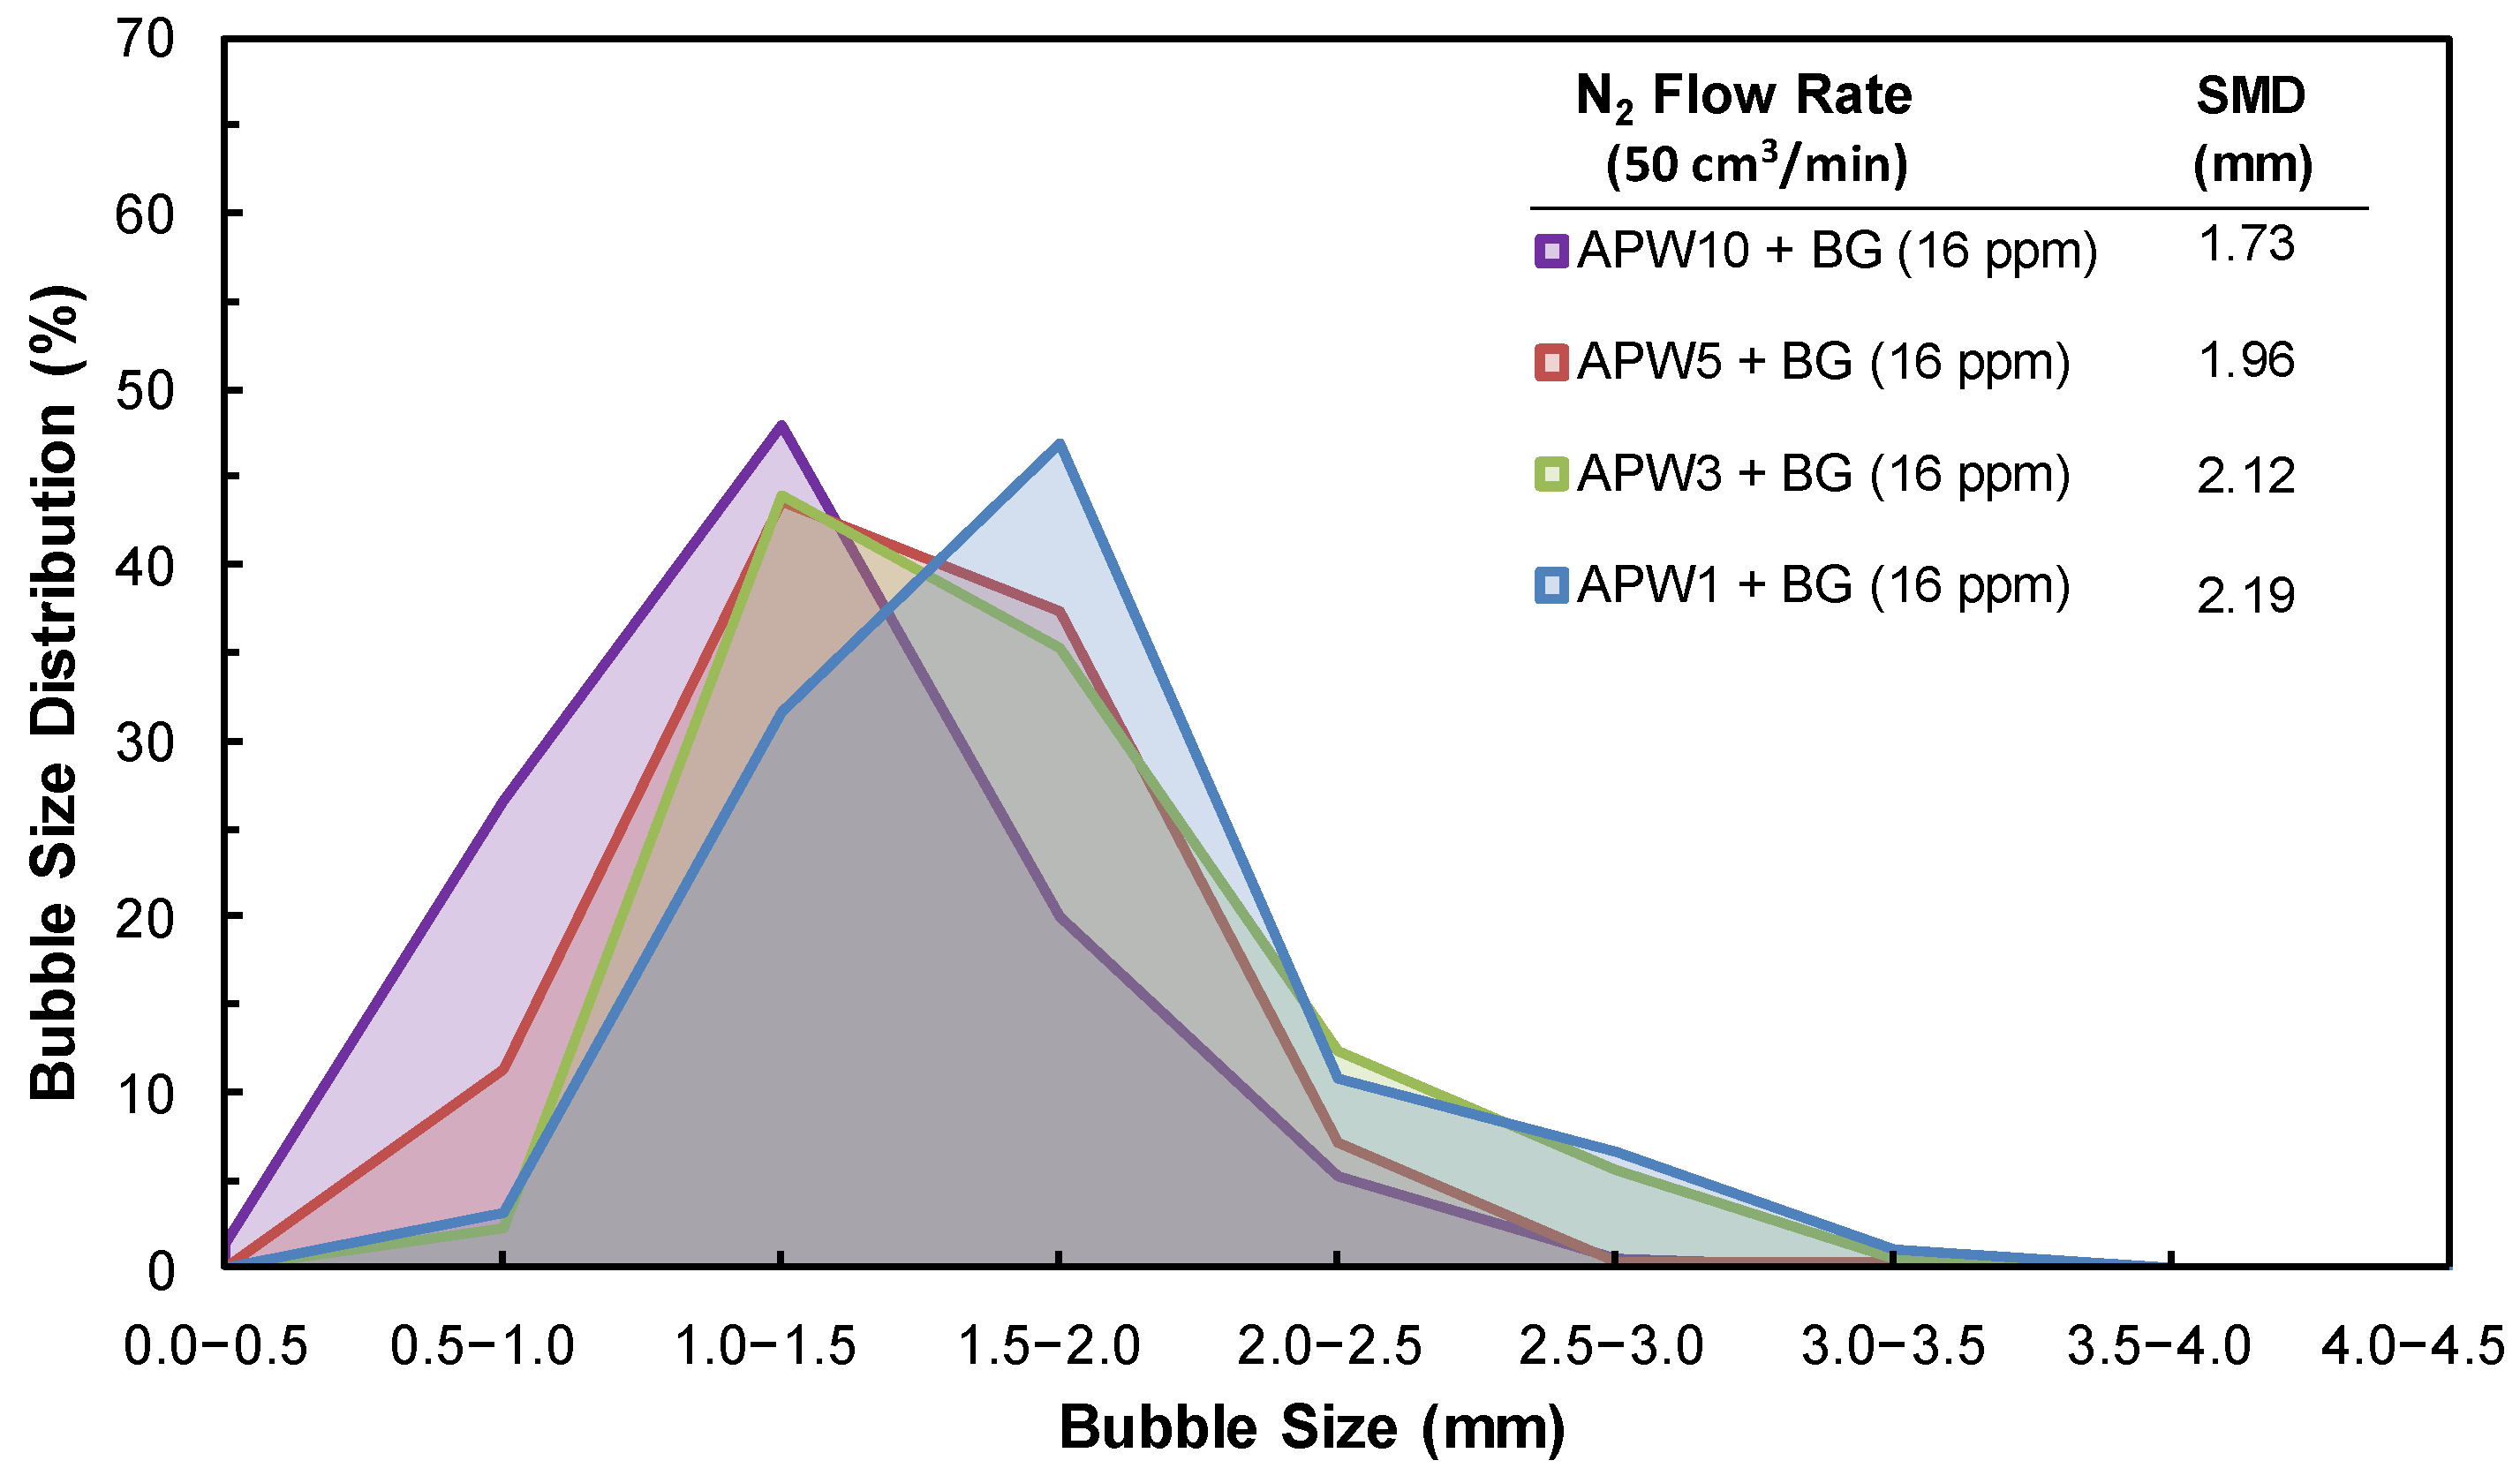
3.3. SMD, BSD, and CCC Experiments

The effect of N2 flow rate (30, 50, and 70 cm3/min) on the SMD of the bubbles was revealed for all APW concentrations (APW1, 3, 5, and 10). As can be seen from the results given in Figure 9a, the lowest SMD values for APW1, 3, and 5 were obtained at 50 cm3/min N2 flow rate, while no significant change was observed in the presence of APW 10. Under these conditions, the optimum N2 flow rate was accepted as 50 cm3/min and was used in further experiments.
It is also seen in Figure 9a that while SMD decreased slightly with the ion concentration from APW1 to APW5, the decrease in the presence of APW10 was greater. As is known from the literature, the transition concentration of Na+ is 1.5 × 10⁻⁵ mol/dm3 [41]. Accordingly, the concentrations of some ions, such as Na+, were higher than the transition concentrations in the presence of APW10, causing the SMD value to decrease more than other APW concentrations. The effect of physical parameters such as N2 flow rate on SMD is relatively higher at low APW concentrations, but the effect of these physical parameters is minimized at high APW concentrations.
The bubble size distribution obtained at various APW concentrations at a constant N2 flow rate of 50 cm3/min is shown in Figure 9b. As seen in Figure 9b, the results of BSD for APW at various concentrations indicated that the bubbles in the presence of APW1 exhibit a wide size distribution. As the APW concentration increased, finer bubbles were obtained with a narrower size range.
The light intensity and bubble coalescence percentage depending on the BG concentration at a constant N2 flow rate of 50 cm3/min are given in Figure 10. It is seen from Figure 10 that the light intensity decreased as the BG concentration increased. The reason for this is that BG adsorbed to the air/water interface and reduced the surface tension so that the bubbles could remain stable at a smaller size without coalescing with other bubbles. As the number of bubbles in the system increased, the air/water interfaces formed by these bubbles refracted the light and, thus, the intensity of the light reaching the detector by passing across the measuring cell decreased. Bubble coalescence, which was 100% in the absence of BG, decreased with the BG concentration and became 50% in the presence of 16 ppm BG. The bubble coalescence was minimal after 100 ppm BG but this concentration was much higher than the BG concentrations used in Pb-Zn flotation.
The change in the SMD of the bubbles obtained by using cells with various frit pore sizes (10–16, 16–40, and 40–100 μm) is given in Figure 11 as a function of APW concentration.
As seen in Figure 11, the SMD of bubbles in pure water produced using the frit with a pore size of 40–100 μm is 8.5 mm, while it is 6.2 and 5.7 mm at 16–40 μm and 10–16 μm pore sizes, respectively. SMD decreased with APW concentration for all pore sizes. Further studies were carried out using a cell with a frit of 10–16 μm, where the smallest bubble size was obtained. At this frit pore size, SMD reached a plateau at 2.7 mm in the presence of APW1.
SMD values as a function of BG concentration at 50 cm3/min N2 flow rate are given in Figure 12.
As can be seen in Figure 12, while the SMD is 5.70 mm in the presence of pure water, it decreases with the addition of BG and reaches a plateau around 1.59 mm at 30 ppm BG. Kowalczuk, et al. [56] reported that CCC95 (the concentration giving a 95% reduction in bubble size compared to water only [57]) of BG is 0.236 mmol/dm3, which is equal to 27.89 ppm.
SMD values at different APW concentrations are given in Figure 13.
As seen in Figure 13, the presence of dissolved ions in water in the absence of BG causes a rapid decrease in the SMD value. SMD, which is 5.70 mm in pure water, decreased to 2.65 mm in the presence of APW1 and reached a plateau. The SMD was 2.30 mm at 16 ppm BG (CCC value) in the absence of ions. A slight decrease was observed in the SMD in the presence of APW related to APW concentration and it reached 1.73 mm in the presence of APW10.
Meanwhile, dissolved ions can interact with flotation reagents such as frothers or collectors and have a synergistic effect. This synergistic effect may significantly influence the air/water interface [58,59]. Xu, et al. [60] reported that the presence of Na+ in the medium decreased bubble size by reducing the surface charge of sodium dodecyl sulfate (SDS) micelles. Therefore, it promotes the adsorption of SDS molecules at the air/water interface. Yekeen, et al. [61] reported that surfactant (SDS) adsorption was higher in the presence of tri-(Al3+) and di-valent (Ca2+) ions compared to mono-valent ions (Na+).
The bubble size distribution at 50 cm3/min N2 flow rate in the presence of APW and BG (16 ppm) is given in Figure 14, which indicates that bubbles with smaller size distribution were obtained in the presence of 16 ppm BG as the ion concentration increased.

3.4. Dynamic Foam Stability (DFS) Measurements

The maximum foam heights (Hmax) obtained in the DFS measurements are given as a function of N2 flow rate, BG, and APW concentrations in Figure 15a–c, respectively.
Figure 15a indicates that when the air flow rate was 0.20 dm3/min, the maximum foam height was 5.5 mm and it increased to 6.3 mm and 6.9 mm for 0.25 dm3/min and 0.30 dm3/min air flow rates, respectively. Further experiments were carried out at a 0.20 dm3/min N2 flow rate.
As seen in Figure 15b, the maximum foam height, which was 3.1 mm at 1 ppm BG concentration, increased to 5.5 mm in the presence of 16 ppm BG. At higher BG concentrations, the positive effect of BG on foam height remained moderate and a foam height of 9.5 mm was obtained in the presence of 1000 ppm BG.
It is seen in Figure 15c that the maximum foam height measured in the presence of pure water is 3.5 mm. This value can be accepted as the baseline. In this condition, since there is no chemical in the medium to ensure the stability of the foam, the bubbles formed will coalesce in a short time and burst. The foam height in the presence of APW1 was 4.2 mm. Considering that 5.5 mm foam height is obtained in the presence of 16 ppm BG (in pure water), it is seen that APW1 is quite beneficial for providing foam stability. The maximum foam height was further increased with the increase in APW concentration and reached 7.4 mm in the presence of APW10. Foam height was maximized when APW and BG were present together in the medium. A maximum foam height of 8.7 mm was reached at APW10 + BG (16 ppm). These results show that the presence of ions in the medium also increases the efficiency of BG.
The results of Yekeen, Manan, Idris and Samin [61] indicated that there is an optimum surfactant concentration, which maximizes the foam stability. This optimum concentration decreases with the ion concentration in the medium. Micelles starting to form at the critical micelle concentration (CMC) value of the surfactant increased foam drainage due to increasing weight. The main mechanism controlling the foaming and adsorption properties of surfactant is the screening effect of electrostatic double layer (EDL) by the ions and the formation of surfactant complex. The presence of ions promotes foam stability below the CMC with thicker lamellae.
It is seen from previous studies that ionic strength affects foam stability as well as frother dosage. It is seen that ionic strength increases the viscosity of the foam, slows down the liquid drainage between bubbles, decreases the bubble size, and increases the foam stability and foam decaying time [62,63]. This often increases the yield of valuable mineral recovery. However, a foam with very high stability will also increase water recovery and gangue transport into the concentrate, thereby reducing its grade [1,32,62].
Frother and xanthate influence the charge of the liquid film between bubbles in the foam related to their concentration. The cohesion in the surface layers and, thus, the stability of foam decreased with increasing xanthate concentration [64].
Meanwhile, the bubble coalescence experiment results of Pan, et al. [65] and Pan, et al. [66] showed that the presence of 1 ppm potassium amyl xanthate (KAX) considerably increased the lifetime of bubbles and the stability of foam compared to methyl isobutyl carbinol (MIBC)-only condition. According to Pan, et al. [67] the presence of NaCl enhanced the adsorption of frothers at the air/water interface, while the effect of KAX was insignificant.

4. Conclusions

In this study, the synergistic effect of frequently found ions in the flotation of Pb-Zn sulfide ores on the air/water interface was revealed with dynamic surface tension, bubble coalescence time, Sauter mean diameter (SMD), bubbles size distribution (BSD), and DFS measurements using artificial process waters (APWs).
The results of the surface tension measurements indicated that while the surface tension of water decreased with BG and KEX, the presence of ions in the APWs increased the surface tension as a function of their concentration.
As is well known from the literature, bubbles in the medium must remain stable at a certain size distribution without coalescing with each other for the bubble-hydrophobic particle attachment efficiency to be at an acceptable level in the flotation process. In flotation, this is made possible with the use of frothers (BG in the case of this study). As seen from the results of this study, bubble coalescence was completely inhibited in the presence of 16 ppm BG.
Additionally, the literature describes the significance of dissolved ions not only at mineral/air and mineral/water interfaces but also at air/water interfaces. For example, the dissolved ions behave like a frother in the system, showing that the bubble size in the pulp phase is reduced upon increasing the electrolyte concentration [68,69].
The results of this study showed that even in the absence of BG or KEX, the ion concentration in the presence of APW1 also completely inhibited bubble coalescence. The provided bubble stability continued at higher BG or ion (APW) concentrations. Moreover, the SMD of bubbles was 5.70 mm in pure water, which is a high size for flotation. This size decreased to a suitable size for flotation (2.30 mm) with the use of BG (16 ppm). When APW1 was used in the absence of BG, the SMD of the bubbles grew close to the values in the presence of BG. Therefore, the presence of APW1 or APWs with higher ionic strength can provide suitable conditions for flotation in terms of bubble and froth stability even in the absence of a frother.

Author Contributions

Conceptualization, C.G., I.K.U. and O.O.; methodology, C.G. and O.O; investigation, S.M.M., C.G., M.T. and M.F.E.; writing—original draft preparation, C.G. and S.M.M.; writing—review and editing, C.G., O.O. and I.K.U.; visualization, C.G. and S.M.M.; supervision, I.K.U.; project administration, O.O.; funding acquisition, O.O. All authors have read and agreed to the published version of the manuscript.

Funding

This research was funded by The Scientific and Technological Research Council of Türkiye (TUBITAK), grant number 221M709.

Data Availability Statement

The original contributions presented in the study are included in the article.

Conflicts of Interest

The authors declare no conflict of interest. The funders had no role in the design of the study; in the collection, analyses, or interpretation of data; in the writing of the manuscript; or in the decision to publish the results.

References

  1. Laskowski, J.S.; Cho, Y.S.; Ding, K. Effect of frothers on bubble size and foam stability in potash ore flotation systems. Can. J. Chem. Eng. 2003, 81, 63–69. [Google Scholar] [CrossRef]
  2. Vazirizadeh, A.; Bouchard, J.; Chen, Y. Effect of particles on bubble size distribution and gas hold-up in column flotation. Int. J. Miner. Process. 2016, 157, 163–173. [Google Scholar] [CrossRef]
  3. Kowalczuk, P.B.; Drzymala, J. Physical meaning of the Sauter mean diameter of spherical particulate matter. Part. Sci. Technol. 2016, 34, 645–647. [Google Scholar] [CrossRef]
  4. Tao, D. Role of bubble size in flotation of coarse and fine particles—A review. Sep. Sci. Technol. 2005, 39, 741–760. [Google Scholar] [CrossRef]
  5. Orvalho, S.; Ruzicka, M.C.; Olivieri, G.; Marzocchella, A. Bubble coalescence: Effect of bubble approach velocity and liquid viscosity. Chem. Eng. Sci. 2015, 134, 205–216. [Google Scholar] [CrossRef]
  6. Ata, S.; Jameson, G.J. The formation of bubble clusters in flotation cells. Int. J. Miner. Process. 2005, 76, 123–139. [Google Scholar] [CrossRef]
  7. Ata, S. Coalescence of bubbles covered by particles. Langmuir 2008, 24, 6085–6091. [Google Scholar] [CrossRef]
  8. Zhu, H.; Valdivieso, A.L.; Zhu, J.; Song, S.; Min, F.; Corona Arroyo, M.A. A study of bubble size evolution in Jameson flotation cell. Chem. Eng. Res. Des. 2018, 137, 461–466. [Google Scholar] [CrossRef]
  9. Ang, Z.; Bournival, G.; Ata, S. Influence of frothers on the detachment of galena particles from bubbles. Int. J. Miner. Process. 2013, 121, 59–64. [Google Scholar] [CrossRef]
  10. Ata, S. The detachment of particles from coalescing bubble pairs. J. Colloid Interface Sci. 2009, 338, 558–565. [Google Scholar] [CrossRef] [PubMed]
  11. Manor, O.; Chau, T.T.; Stevens, G.W.; Chan, D.Y.; Grieser, F.; Dagastine, R.R. Polymeric stabilized emulsions: Steric effects and deformation in soft systems. Langmuir 2012, 28, 4599–4604. [Google Scholar] [CrossRef] [PubMed]
  12. Bournival, G.; Pugh, R.J.; Ata, S. Examination of NaCl and MIBC as bubble coalescence inhibitor in relation to froth flotation. Miner. Eng. 2012, 25, 47–53. [Google Scholar] [CrossRef]
  13. Wang, B.; Peng, Y. The effect of saline water on mineral flotation–A critical review. Miner. Eng. 2014, 66–68, 13–24. [Google Scholar] [CrossRef]
  14. Wei, T.; Peng, Y.; Farrokhpay, S. Froth stability of coal flotation in saline water. Miner. Process. Extr. Metall. 2014, 123, 234–240. [Google Scholar] [CrossRef]
  15. Farrokhpay, S. The significance of froth stability in mineral flotation—A review. Adv. Colloid Interface Sci. 2011, 166, 1–7. [Google Scholar] [CrossRef] [PubMed]
  16. Ozdemir, O. Specific ion effect of chloride salts on collectorless flotation of coal. Physicochem. Probl. Miner. Process. 2013, 49, 511–524. [Google Scholar] [CrossRef]
  17. Liu, W.; Moran, C.J.; Vink, S. A review of the effect of water quality on flotation. Miner. Eng. 2013, 53, 91–100. [Google Scholar] [CrossRef]
  18. Laskowski, J.; Castro, S. Flotation in concentrated electrolyte solutions. Int. J. Miner. Process. 2015, 144, 50–55. [Google Scholar] [CrossRef]
  19. October, L.; Corin, K.; Schreithofer, N.; Manono, M.; Wiese, J. Water quality effects on bubble-particle attachment of pyrrhotite. Miner. Eng. 2019, 131, 230–236. [Google Scholar] [CrossRef]
  20. Sun, K.; Nguyen, C.V.; Nguyen, N.N.; Ma, X.; Nguyen, A.V. Crucial roles of ion-specific effects in the flotation of water-soluble KCl and NaCl crystals with fatty acid salts. J. Colloid Interface Sci. 2023, 636, 413–424. [Google Scholar] [CrossRef]
  21. Wu, Z.; Wang, X.; Liu, H.; Zhang, H.; Miller, J.D. Some physicochemical aspects of water-soluble mineral flotation. Adv. Colloid Interface Sci. 2016, 235, 190–200. [Google Scholar] [CrossRef] [PubMed]
  22. Sun, K.; Nguyen, C.V.; Nguyen, N.N.; Nguyen, A.V. Flotation surface chemistry of water-soluble salt minerals: From experimental results to new perspectives. Adv. Colloid Interface Sci. 2022, 309, 102775. [Google Scholar] [CrossRef] [PubMed]
  23. Weedon, D.; Grano, S.; Akroyd, T.; Goncalves, K.; Moura, R. Effects of high magnesium ion concentration on KCl flotation: Part II—Plant research. Miner. Eng. 2007, 20, 716–721. [Google Scholar] [CrossRef]
  24. Weedon, D.; Grano, S.; Akroyd, T.; Goncalves, K.; Moura, R. Effects of high Mg2+ concentration on KCl flotation: Part I–Laboratory research. Miner. Eng. 2007, 20, 675–683. [Google Scholar] [CrossRef]
  25. Choi, J.; Choi, S.Q.; Park, K.; Han, Y.; Kim, H. Flotation behaviour of malachite in mono- and di-valent salt solutions using sodium oleate as a collector. Int. J. Miner. Process. 2016, 146, 38–45. [Google Scholar] [CrossRef]
  26. Jung, M.; Tadesse, B.; Dick, C.; Logan, A.; Dyer, L.; Albijanic, B. Influence of monovalent and divalent cations on monazite flotation. Colloids Surf. A Physicochem. Eng. 2022, 653, 129975. [Google Scholar] [CrossRef]
  27. Wang, M.; Zhao, W.; Han, G.; Feng, Q. Utilization of lead ions to improve surface hydrophobicity and flotation recovery of sulfidized smithsonite. Colloids Surf. A Physicochem. Eng. 2023, 663, 131126. [Google Scholar] [CrossRef]
  28. Manono, M.S.; Corin, K.C.; Wiese, J.G. An investigation into the effect of various ions and their ionic strength on the flotation performance of a platinum bearing ore from the Merensky reef. Miner. Eng. 2012, 36–38, 231–236. [Google Scholar] [CrossRef]
  29. Wan, H.; Yi, P.; Song, X.; Luukkanen, S.; Qu, J.; Yang, W.; Li, H.; Bu, X. Role of improving molybdenite flotation by using aromatic hydrocarbon collector in high-calcium water: A multiscale investigation. Miner. Eng. 2023, 191, 107984. [Google Scholar] [CrossRef]
  30. Gungoren, C. An investigation of air/water interface in mixed aqueous solutions of KCl, NaCl, and DAH. Physicochem. Probl. Miner. Process. 2019, 55, 1259–1270. [Google Scholar] [CrossRef]
  31. Ozdemir, O.; Karakashev, S.I.; Nguyen, A.V.; Miller, J.D. Adsorption and surface tension analysis of concentrated alkali halide brine solutions. Miner. Eng. 2009, 22, 263–271. [Google Scholar] [CrossRef]
  32. Manono, M.S.; Corin, K.C.; Wiese, J.G. The effect of ionic strength of plant water on foam stability: A 2-phase flotation study. Miner. Eng. 2013, 40, 42–47. [Google Scholar] [CrossRef]
  33. October, L.L.; Manono, M.S.; Wiese, J.G.; Schreithofer, N.; Corin, K.C. Fundamental and flotation techniques assessing the effect of water quality on bubble-particle attachment of chalcopyrite and galena. Miner. Eng. 2021, 167, 1–7. [Google Scholar] [CrossRef]
  34. Ornelas Tabares, J.; Madrid Ortega, I.; Reyes Bahena, J.L.; Sánchez López, A.A.; Valdez Pérez, D.; López Valdivieso, A. Surface properties and flotability of molybdenite. In Proceedings of the 2006 China-Mexico Workshop on Minerals Particle Technology, San Luis Potosí, Mexico, 5–7 December 2006; pp. 115–124. [Google Scholar]
  35. Xue, J.; Fuchida, S.; Ishida, S.; Tokoro, C. Insight on Exogenous Calcium/Magnesium in Weakening Pyrite Floatability with Prolonged Pre-Oxidation: Localized and Concomitant Secondary Minerals and Their Depression Characteristics. Minerals 2022, 12, 115. [Google Scholar] [CrossRef]
  36. Zhang, Q.; Zhu, H.; Yang, B.; Jia, F.; Yan, H.; Zeng, M.; Qu, H. Effect of Pb2+ on the flotation of molybdenite in the presence of sulfide ion. Results Phys. 2019, 14, 102361. [Google Scholar] [CrossRef]
  37. Gao, Y.; Jiang, H.; Li, X.; Khoso, S.A.; Xiang, G.; Han, W. Different Insights into Silicate Rectorite Modification and Its Role in Removal of Heavy Metal Ions from Wastewater. Minerals 2020, 10, 176. [Google Scholar] [CrossRef]
  38. Poliseno, V.; Chaves, S.; Brunetti, L.; Loiodice, F.; Carrieri, A.; Laghezza, A.; Tortorella, P.; Magalhaes, J.D.; Cardoso, S.M.; Santos, M.A.; et al. Derivatives of Tenuazonic Acid as Potential New Multi-Target Anti-Alzheimer’s Disease Agents. Biomolecules 2021, 11, 111. [Google Scholar] [CrossRef]
  39. Domínguez, S.; Torres, J.; Morales, P.; Heinzen, H.; Bertucci, A.; Kremer, C. Complexation and antioxidant activity of flavonoids with biologically relevant metal ions. In Coordination Chemistry Research Progress; Nova Science Publishers, Inc.: Hauppauge, NY, USA, 2008; pp. 305–328. [Google Scholar]
  40. Yang, B.; Tong, X.; Deng, Z.; Lv, X. The Adsorption of Cu Species onto Pyrite Surface and Its Effect on Pyrite Flotation. J. Chem. 2016, 2016, 4627929. [Google Scholar] [CrossRef]
  41. Gungoren, C.; Islek, E.; Baktarhan, Y.; Kurşun Unver, I.; Ozdemir, O. A novel technique to investigate the bubble coalescence in the presence of surfactant (MIBC) and electrolytes (NaCl and CaCl2). Physicochem. Probl. Miner. Process. 2018, 54, 1215–1222. [Google Scholar] [CrossRef]
  42. Cho, Y.S.; Laskowski, J.S. Bubble coalescence and its effect on dynamic foam stability. Can. J. Chem. Eng. 2002, 80, 299–305. [Google Scholar] [CrossRef]
  43. Szyszka, D. Critical Coalescence Concentration (CCC) for Surfactants in Aqueous Solutions. Minerals 2018, 8, 431. [Google Scholar] [CrossRef]
  44. Smallwood, I.M. Ethylene glycol monobutyl ether. In Handbook of Organic Solvent Properties; Smallwood, I.M., Ed.; Butterworth-Heinemann: Oxford, UK, 1996; pp. 131–133. [Google Scholar]
  45. Velasco-Medina, A.A.; Gracia-Fadrique, J. Surface Tension and Density of Ethylene Glycol Monobutyl Ether–Water Mixtures from 277.15 to 308.15 K. J. Chem. Eng. Data 2020, 65, 4547–4555. [Google Scholar] [CrossRef]
  46. Miller, D.J.; Lisy, J.M. Hydrated Alkali-Metal Cations: Infrared Spectroscopy and ab Initio Calculations of M+(H2O)x=2-5Ar cluster ions for M ) Li, Na, K, and Cs. J. Am. Chem. Soc. 2008, 130, 15381–15392. [Google Scholar] [CrossRef]
  47. Huang, B.; Muy, S.; Feng, S.; Katayama, Y.; Lu, Y.C.; Chen, G.; Shao-Horn, Y. Non-covalent interactions in electrochemical reactions and implications in clean energy applications. Phys. Chem. Chem. Phys. 2018, 20, 15680–15686. [Google Scholar] [CrossRef] [PubMed]
  48. Franks, G.V.; Johnson, S.B.; Scales, P.J.; Boger, D.V.; Healy, T.W. Ion-Specific Strength of Attractive Particle Networks. Lungmuir 1999, 15, 4411–4420. [Google Scholar] [CrossRef]
  49. Hishida, M.; Kaneko, Y.; Okuno, M.; Yamamura, Y.; Ishibashi, T.A.; Saito, K. Communication: Salt-induced water orientation at a surface of non-ionic surfactant in relation to a mechanism of Hofmeister effect. J. Chem. Phys. 2015, 142, 171101. [Google Scholar] [CrossRef]
  50. Hervo-Hansen, S.; Heyda, J.; Lund, M.; Matubayasi, N. Anion-cation contrast of small molecule solvation in salt solutions. Phys. Chem. Chem. Phys. 2022, 24, 3238–3249. [Google Scholar] [CrossRef]
  51. Hofmeister, F. Zur Lehre von der Wirkung der Salze. Arch. Exp. Path. Pharm. 1888, 24, 247–260. [Google Scholar] [CrossRef]
  52. Marcus, Y. Specific ion effects on the surface tension and surface potential of aqueous electrolytes. Curr. Opin. Colloid Interface Sci. 2016, 23, 94–99. [Google Scholar] [CrossRef]
  53. Witecki, K.; Polowczyk, I.; Kowalczuk, P.B. Chemistry of wastewater circuits in mineral processing industry—A review. J. Water Process. Eng. 2022, 45, 102509. [Google Scholar] [CrossRef]
  54. Marcus, Y. Individual ionic surface tension increments in aqueous solutions. Langmuir 2013, 29, 2881–2888. [Google Scholar] [CrossRef]
  55. Roberto, P.-G.; Arturo, B.-T. Coalescence of air bubbles: Effect of the electrical double layer. Miner. Eng. 2020, 150, 106301. [Google Scholar] [CrossRef]
  56. Kowalczuk, P.B.; Zaleska, E.; Danczak, O. Flotation of carbonaceous copper shale–quartz mixture with poly(ethylene glycol) alkyl ethers. Trans. Nonferrous Met. Soc. China 2015, 25, 314–318. [Google Scholar] [CrossRef]
  57. Zhang, W.; Nesset, J.E.; Rao, R.; Finch, J.A. Characterizing frothers through critical coalescence concentration (CCC) 95-hydrophile-lipophile balance (HLB) relationship. Minerals 2012, 2, 208–227. [Google Scholar] [CrossRef]
  58. Góralczyk, D.; Ha̧c, K.; Wydro, P. Surface properties of the binary mixed systems of alkylpyridinium halides and sodium alkylsulfonates. Colloids Surf. A Physicochem. Eng. 2003, 220, 55–60. [Google Scholar] [CrossRef]
  59. Naik, P.K.; Reddy, P.S.R.; Misra, V.N. Interpretation of interaction effects and optimization of reagent dosages for fine coal flotation. Int. J. Miner. Process. 2005, 75, 83–90. [Google Scholar] [CrossRef]
  60. Xu, Q.; Nakajima, M.; Ichikawa, S.; Nakamura, N.; Roy, P.; Okadome, H.; Shiina, T. Effects of surfactant and electrolyte concentrations on bubble formation and stabilization. J. Colloid Interface Sci. 2009, 332, 208–214. [Google Scholar] [CrossRef]
  61. Yekeen, N.; Manan, M.A.; Idris, A.K.; Samin, A.M. Influence of surfactant and electrolyte concentrations on surfactant adsorption and foaming characteristics. J. Pet. Sci. Eng. 2017, 149, 612–622. [Google Scholar] [CrossRef]
  62. Corin, K.C.; Tetlow, S.; Manono, M.S. Considering the action of frothers under degrading water quality. Miner. Eng. 2022, 181, 107546. [Google Scholar] [CrossRef]
  63. Corin, K.C.; Reddy, A.; Miyen, L.; Wiese, J.G.; Harris, P.J. The effect of ionic strength of plant water on valuable mineral and gangue recovery in a platinum bearing ore from the Merensky reef. Miner. Eng. 2011, 24, 131–137. [Google Scholar] [CrossRef]
  64. Manev, E.D.; Pugh, R.J. Drainage and equilibrium thickness of aqueous films containing nonionic frothers and xanthate flotation collector. J. Colloid Interface Sci. 1992, 151, 505–516. [Google Scholar] [CrossRef]
  65. Pan, Y.; Bournival, G.; Ata, S. The role of non-frothing reagents on bubble size and bubble stability. Miner. Eng. 2021, 161, 106652. [Google Scholar] [CrossRef]
  66. Pan, Y.; Bournival, G.; Karakashev, S.I.; Yang, B.; Wang, L.; Ata, S. Effect of electrolyte and flotation collector on foam films in the presence of frothers. Chem. Eng. Sci. 2022, 264, 118176. [Google Scholar] [CrossRef]
  67. Pan, Y.; Gresham, I.; Bournival, G.; Prescott, S.; Ata, S. Synergistic effects of frothers, collector and salt on bubble stability. Powder Technol. 2022, 397, 117028. [Google Scholar] [CrossRef]
  68. Manono, M.; Corin, K. Considering Specific Ion Effects on Froth Stability in Sulfidic Cu-Ni-PGM Ore Flotation. Minerals 2022, 12, 321. [Google Scholar] [CrossRef]
  69. Wang, J.; Forbes, G.; Forbes, E. Frother Characterization Using a Novel Bubble Size Measurement Technique. Appl. Sci. 2022, 12, 750. [Google Scholar] [CrossRef]
Figure 1. (a) Experimental setup for bubble coalescence time measurements and (b) the sequential processes that occur in bubble coalescence time measurements (The red dot lines is used for the adjustment of the distance between two bubbles during the measurements).
Minerals 13 01236 g001
Figure 2. (a) Experimental setup for the SMD and BSD measurements as well as the determination of CCC and (b) the schematic view of the setup (The entrance of the N2 is represented by the blue arrow, the bubbles in the system is represented by the blank circles, and the frit is represented with the red cylinder).
Minerals 13 01236 g002
Figure 3. (a) KRÜSS DFA-100 dynamic foam analyzer and (b) the schematic diagram of the system (The bubbles in the system are represented by the blank circles).
Minerals 13 01236 g003
Figure 4. (a) Dynamic surface tension measurement results for BG at various concentrations and (b) equilibrium surface tension values at 180 s as a function of BG concentration in pure water.
Minerals 13 01236 g004
Figure 5. (a) Dynamic surface tension measurement results at various KEX concentrations and (b) equilibrium surface tension values at 180 s with respect to KEX concentration.
Minerals 13 01236 g005
Figure 6. (a) Dynamic surface tension measurement results at various APW concentrations and (b) equilibrium surface tension values at 180 s with respect to APW concentration (in the absence of BG).
Minerals 13 01236 g006
Figure 7. (a) Dynamic surface tension measurement results at various APW concentrations and (b) equilibrium surface tension values at 180 s with respect to APW concentration in the presence of BG (16 ppm).
Minerals 13 01236 g007
Figure 8. Bubble coalescence percentage with respect to BG concentration at 1, 10, 100, and 1000 ms contact times.
Minerals 13 01236 g008
Figure 9. (a) SMD values of the bubbles as a function of N2 flow rate for various APW concentrations and (b) bubble size distribution at various APW concentrations at 50 cm3/min N2 flow rate.
Minerals 13 01236 g009
Figure 10. Light intensity and bubble coalescence percent values with respect to BG concentration at 50 cm3/min N2 flow rate (The 50% bubble coalescence percent and the CCC concentration is indicated with the red dotted line).
Minerals 13 01236 g010
Figure 11. SMD values of the bubbles at various frit sizes as a function of APW concentration.
Minerals 13 01236 g011
Figure 12. SMD values as a function of BG concentration at 50 cm3/min N2 flow rate.
Minerals 13 01236 g012
Figure 13. Effect of APW concentration on SMD in the absence of BG and the presence of 16 ppm (CCC) BG at 50 cm3/min N2 flow rate.
Minerals 13 01236 g013
Figure 14. Bubble size distribution (50 cm3/min N2) at 16 ppm BG and various APW concentrations.
Minerals 13 01236 g014
Figure 15. Maximum foam heights as a function of (a) N2 flow rate in the presence of 16 ppm BG, (b) BG concentration at 0.2 dm3/min N2 flow rate, and (c) APW concentration.
Minerals 13 01236 g015
Table 1. Ion types and concentrations in APWs (TDS: Total dissolved solids, I: Ionic strength).
Na+
(ppm)
Ca2+
(ppm)
Mg2+
(ppm)
Pb2+
(ppm)
Zn2+
(ppm)
Cu2+
(ppm)
Fe3+
(ppm)
SO42−
(ppm)
Cl
(ppm)
CO32−
(ppm)
NO3
(ppm)
TDS
(mg/dm3)
I
(mol/dm3)
pH
APW115380701111276.9238.21203.4945.50.036.72
APW34592402103333830.8714636010.12836.50.086.80
APW576540035055551384.7119160016.84727.50.136.80
APW101530800700101010102769.42382120033.09454.90.267.03
Table 2. Bubble coalescence results of the experiments in the presence of APW with and without BG and KEX.
ConditionCoalescence Result
APW1No coalescence
APW3No coalescence
APW5No coalescence
APW10No coalescence
APW1 + BG (16 ppm)No coalescence
APW3 + BG (16 ppm)No coalescence
APW5 + BG (16 ppm)No coalescence
APW10 + BG (16 ppm)No coalescence
APW1 + BG (16 ppm) + KEX (50 g/t)No coalescence
APW3 + BG (16 ppm) + KEX (50 g/t)No coalescence
APW5 + BG (16 ppm) + KEX (50 g/t)No coalescence
APW10 + BG (16 ppm) + KEX (50 g/t)No coalescence
Disclaimer/Publisher’s Note: The statements, opinions and data contained in all publications are solely those of the individual author(s) and contributor(s) and not of MDPI and/or the editor(s). MDPI and/or the editor(s) disclaim responsibility for any injury to people or property resulting from any ideas, methods, instructions or products referred to in the content.

