Article

Study of Using Quartz Powder as a Mineral Admixture to Produce Magnesium Oxysulfate Cement

1
School of Chemical Engineering, University of Science and Technology Liaoning, Anshan 114051, China
2
The Design Institute of Landscape & Architecture China Academy of Art Co., Ltd., Hangzhou 310023, China
3
School of Environment, Nanjing Normal University, Nanjing 210023, China
4
School of Materials and Metallurgy, University of Science and Technology Liaoning, Anshan 114000, China
*
Author to whom correspondence should be addressed.
Minerals 2023, 13(10), 1240; https://doi.org/10.3390/min13101240
Submission received: 13 July 2023 / Revised: 6 September 2023 / Accepted: 19 September 2023 / Published: 23 September 2023
(This article belongs to the Topic Green Low-Carbon Technology for Metalliferous Minerals)

Abstract

:
Magnesium oxysulfate (MOS) cement features potential advantages, including light weight, green and environmental protection, low thermal conductivity, and high frost- and fire-resistance, but its poor mechanical strength limits the extensive utilization in the architectural engineering. In this study, low-cost quartz (Q) was used as a mineral admixture to increase the mechanical strength of MOS pastes. The impact of the filler Q on the early and later mechanical strength of MOS cement was investigated, in which also had an impact on fluidity, setting times, volume stability, hydration processes, phase transformations, and microstructure. The results show that hydration of periclase to form 5Mg(OH)2·MgSO4·7H2O (phase 5-1-7) in this system was a multi-stage reaction process. 3Mg(OH)2·MgSO4·8H2O was the first sediment in this system and was converted into phase 5-1-7. The dilution and dispersion effects of the filler Q increased the early hydration rate, shortened the setting time, and increased the content and crystallite size of phase 5-1-7, increasing the early mechanical strength of MOS cement, while the volume-filling effect of the filler Q reduced the content of large pore and total pore volume, and improved the pore structure of the MOS cement, improving the later mechanical strength of MOS cement. MOS cement containing 15 wt.% of filler Q exhibited the highest early and later mechanical strength, and the lowest volume shrinkage, which is more suitable for application in architectural engineering. Based on these results, filler Q can be used as an enhancer in MOS cement, however its enhancement mechanisms are effective only when the content of filler Q is no more than 20 wt.%.

1. Introduction

Magnesium oxysulfate (MOS) cement, a type of the air-dried magnesia (MgO)-based cement, is formed from the reaction of reactive MgO and magnesium sulfate (MgSO4) solution at ambient temperature [1,2,3]. Unlike the chemical composition of ordinary Portland cement (OPC), that of MOS cement is magnesium oxide rather than calcium oxide [2,3]. Meanwhile, compared with a magnesium oxychloride (Sorel or MOC) cement system, there is no free chloride ion in the MOS cement system. Compared with Portland cement, MOS cement features potential advantages, such as low density, low thermal conductivity, excellent frost-resistance, high fire-resistance, and good wear-resistance [4,5,6]. Compared with Sorel cement, MOS cement is greener and exhibits better steel-protection owing to the use of MgSO4 instead of magnesium chloride (MgCl2). As a result, MOS cement has been frequently used in production of non-load-bearing building products such as insulating decorative panels, light-weight partition slats, heat insulation boards, and fireproof door core plates [7,8,9]. In addition, compared to the decomposition of calcium carbonate to Portland cement, the production of reactive MgO requires significantly lower calcining temperatures (1450 °C vs. 750–900 °C) and fuel consumptions [10,11]. Statistic data show that the carbon dioxide emissions (approximately 1.1 ton/ton) of preparing reactive MgO are higher than that (approximately 0.8 ton/ton) of preparing Portland cement, however, when the high carbonation ability of the mineral phases (e.g., Mg(OH)2) in the MgO-based cement system is taken into account, the net carbon dioxide emissions of preparing MOS cement products are approximately 30%~40% lower than that of manufacturing Portland cement products [12,13]. Hence, MOS cement has been regarded as a potential environmentally friendly substitute to Portland cement [14,15,16]. Yet, despite all these attractive performances, MOS cement suffers from low mechanical strength, which limits its utilization in architectural engineering [17,18].
Five main magnesium sulfate phases, including phase 1-1-5, phase 1-2-3, phase 3-1-8, phase 5-1-3, and phase 5-1-7 of aMg(OH)2·bMgSO4·cH2O, can be detected in the system at 25–120 °C [19,20,21,22]. The generation of these magnesium sulfate phases is closely linked to environment temperatures and proportion of raw material, owing to the limited solubility of MgSO4 [23]. For instance, the solubility of MgSO4 is only 35.1~39.7 g per 100 mL of water at 20~30 °C. In addition, among these phases, phase 1-1-5, phase 1-2-3 and phase 5-1-3 only form at high environment temperatures of 48–120 °C, whereas phase 3-1-8 and phase 5-1-7 generate at room temperature [18]. It has been found that the mechanical strength of MOS cement is primarily relevant to the content of forming phase 3-1-8 and phase 5-1-7 [16,23]. However, the maximum content of forming phase 3-1-8 and phase 5-1-7 is no more than 50 wt.% and 20 wt.% by mass, respectively, restricting the mechanical capability of MOS cement [24].
Weak acids and their salts [25,26,27], e.g., tartaric acid, citric acid (CA), sodium citrate, silicic acid, phosphoric acid, and sodium silicate, have been utilized as chemical additives to stimulate the growth of rod-like phase 5-1-7 with space self-filling abilities for optimizing the physical-chemical properties of MOS cement. As a result, the phase 5-1-7 content in the modified MOS system can rise to 30 wt.%~50 wt.%, the total pore volume can decrease to 10%~20%, and the compressive and flexural strengths can reach to approximately 75 and 15 MPa, respectively, at 28-d [18,24,25,26,27,28]. It can be concluded that these inorganic or organic chemical additives can reduce the total pore volume of MOS matrix via promoting the growth of phase 5-1-7 crystals, enhancing the mechanical capability of MOS cement. The hardened MOS cement with chemical additives exhibits high later mechanical strength, but its setting time is increased and the early mechanical strength is decreased due to the electrostatic and steric stabilization of weak acids and their salts [3,16]. This limits the extensive utilization of MOS cement.
Filler quartz (Q) has been used to reinforce cementitious materials, e.g., Portland cement, alkali activated slag cement, due to its physical dilution effect and filling effect [29,30,31,32]. For instance, our previous work found granite powders (D50 ≈ 10 μm) with a Q purity of 70.8 wt.% can increase the compressive strength, chlorion- and sulphate-corrosion resistance of MOS paste through exhibiting its filling effect in the system, improving the pore structure of matrix [6]. Meanwhile, the composite materials formed are also low-carbon and low-cost, as a result of a lower quantity of fuel consumption required for manufacturing Q. Adding filler Q to a MOS cement system may therefore reduce the total pore volume of MOS cement and this may further enhance the early and later mechanical performances of MOS cement. On the other hand, China’s Liaoning Province is rich in magnesite resources. Its mineral reserves have been estimated more than 3 billion tons, accounting for approximately 28.9% of the world’s total reserves, approximately 89.3% of China’s total reserves. [16]. Magnesite is the main raw material for the manufacturing of high-graded fused magnesia for high-temperature refractories. For manufacturing high-temperature refractories, however, the purity of fused magnesia needs to be more than 90 wt.%. As a result, a large quantity of magnesite is stored in tailings. Reactive MgO (i.e., light-burned magnesia) powder is manufactured via calcining these tailings. Thus, the use of light-burned magnesia and filler Q to prepare MOS cement for architectural engineering meets the requirements of green and low-carbon.
The objective of this work is to shorten the setting time of MOS paste on the basis of enhancing its mechanical strength. Filler Q is utilized as an inactive mineral admixture to prepare MOS cement. The function mechanisms of filler Q on the micro- and macro-properties of MOS cement are investigated, in which the impact of filler Q on the volume stability, hydration processes, phase transformations, microstructure, and pore characteristics of the hardened MOS cement was also studied. It is believed that a clear understanding of the enhancement mechanisms of filler Q on the micro- and macro-properties of MOS cement facilitate the solving of the issue of the limited utilization of MOS cement in the architectural engineering.

2. Materials and Methods
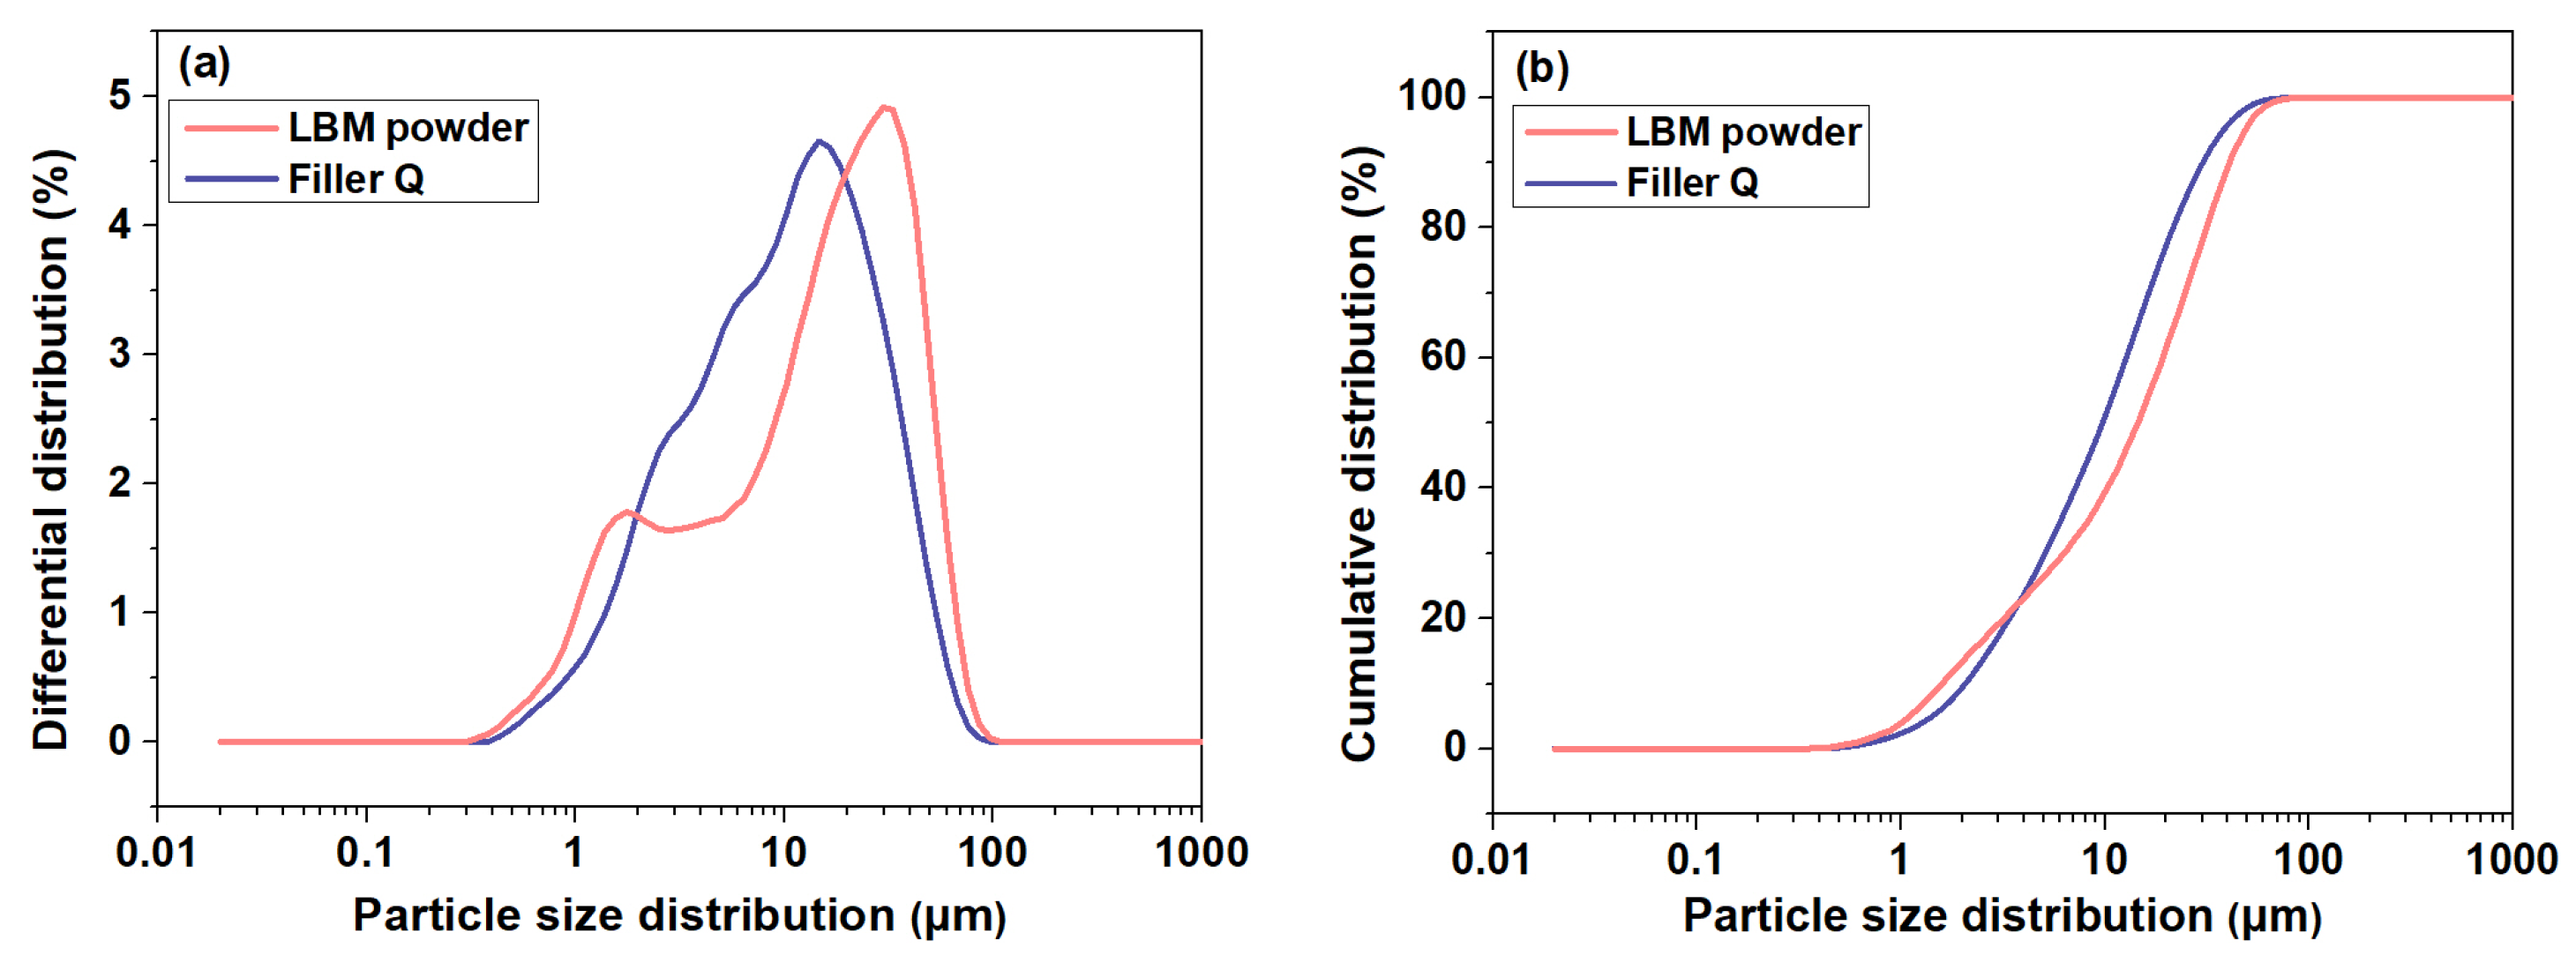
2.1. Raw Materials

Light-burned magnesia (LBM) powder (particle size distribution (PSD) (μm): D10 = 1.8, D50 = 16.3, D90 = 45.6; chemical composition (wt.%): MgO (89.13), SiO2 (1.41), CaO (2.34), Fe2O3 (0.47), Al2O3 (0.42), and others (6.23)) obtained from the Donghe company, Haicheng City, China, was prepared by calcining magnesite at approximately 850 °C for 2 h, where the content of active MgO of LBM powder utilized in this work was approximately 70.50 wt.% obtained by using the standardized hydration method [33,34]. The other raw materials used were supplied as analytical-grade reagents (Sinopharm Group, Shanghai, China), including MgSO4·7H2O, CA and filler Q (PSD (μm): D10 = 2.3, D50 = 11.0, D90 = 33.9). Figure 1 shows the laser PSD curves of LBM powder and filler Q.

2.2. Synthesis of MOS Cement Containing Filler Q

The details of the experimental parameters of MOS cement pastes used in this study are given in Table 1. To obtain MOS pastes with excellent properties, the molar ratio for active MgO (a-MgO)/MgSO4·7H2O/H2O is often 7–12:1:12–15 [35,36]. Therefore, the a-MgO/MgSO4·7H2O/H2O molar ratio utilized to prepare MOS pastes was 9:1:13.
MgSO4·7H2O powder was initially mixed into the pre-weighed water for approximately 24 h to form the required concentration of MgSO4 solution (pH ≈ 6.4 and baume degree ≈ 30.0 °Bé). Then, the pre-weighed CA was dissolved into the obtained MgSO4 solution and stirred for ~3 min to form a colorless mixed solution. After that, the pre-weighed LBM and filler Q were mixed by dry mixing method and slowly poured into the MgSO4 solution containing CA with continuous stirring in the blender for approximately 3 min to obtain a smooth and uniform MOS cement slurry. After the mixing procedure, the MOS cement paste was poured into 25.4 × 25.4 × 285, 40 × 40 × 40 and 40 × 40 × 160 mm3 cubic steel molds to vibrate. Meanwhile, the setting time and fluidity of the obtained MOS pastes were also determined by Vicat apparatus and slump-flow table test instrument, respectively. Later, the steel molds with MOS slurry were cured in an incubator (LHS-250HC-II, Bluepard, Shanghai, China) with a relative humidity of 65 ± 5% and 25 ± 1 °C, and these demolded after curing for approximately 24 h. Finally, the hardened MOS pastes continued to cure in the curing chamber at approximately 22 °C until the testing times (1-d, 3-d, 7-d and 28-d).

2.3. Characterization Methods

The effect of filler Q on the setting, as well as fluidity of MOS pastes were assessed using Vicat apparatus and slump-flow table test instrument at an ambient temperature according to the Chinese national standard GB/T-1346-2019 [37] and GB/T-8077-2012 [38], respectively. Moreover, the hydration heat of MOS paste containing filler Q at the early hydration stage was recorded on a TAM-Air C80 micro-calorimeter (TA instrument, New Castle, DE, USA). The environmental test chamber temperature was constant at 25 °C during the hydration heat test.
The mixing times of pouring LBM and filler Q into the MgSO4 solution with CA were recorded. MOS cement hydration was terminated using anhydrous ethanol after fixed periods of time for mineralogical characterizations. The phase transformations for MOS cement during curing (5 min–72 h) were recorded on a X pert Pro instrument (Panalytical, Almelo, The Netherlands) using copper radiation, scan range = 5°~70° 2-Theta, with a 0.13° step size (5.1 s/step).
The compressive strength of the hardened MOS pastes with size of 40 × 40 × 40 mm3 was recorded using a YAW-300C instrument (Dongshi instrument, Shijiazhuang, China) with a maximum force of 300 kN at a loading rate of 2.4 kN/s. MOS pastes with size of 40 × 40 × 160 mm3 were subjected to 3-point bending tests, and the flexural strength was recorded using a universal motorized test machine with a maximum force of 100 kN at a loading rate of 50 N/s. The edge–length changes of MOS paste containing filler Q were recorded on a bench comparator according to the test standard JC/T 313-2009 [39]. Three samples at different curing ages were tested and the average value was reported.
A D8 advance instrument (Bruker, Mannheim, Germany) with copper radiation (λ1 = 0.15418 nm) in the 2-theta range of 5°~80° with a 0.02° step size (1.00 s/step) was used to record the X-ray diffraction (XRD) analysis. According to the obtained XRD data, the crystallite sizes for all of the crystallographic planes of phase 5-1-7 and brucite were calculated using the Scherrer equation. The quantitative phase analysis (QPA) for the MOS paste with the filler Q at 28-d was obtained through Rietveld refining parameters by using the Topas 6.0 software (Bruker, Mannheim, Germany). For the QPA, 15 wt.% analytically pure ZnO (by mass) was chosen as the internal standard substance to determine the Amorphous phase content in MOS cement [40,41].
A Q600 SDT equipment (TA instrument, New Castle, DE, USA) was utilized to determine the thermal properties of the MOS paste containing filler Q at 28-d. The 0.5 g of test powder was heated from ambient temperature to 1200 °C at a heating speed of 10 °C·min−1 under a protective atmosphere of nitrogen (N2) with a current velocity of 50 mL·min−1 [42].
A ΣIGMA HD equipped (ZEISS, Oberkochen, Germany) with energy-dispersive spectroscopy (SEM-EDS, Oxford Instruments, Abingdon, UK) analyzer was chosen to study the micromorphology and elemental compositions of hydration products formed in MOS paste containing filler Q at 28-d. The tested samples were sputter-coated with platinum film for 30 s prior to scanning electron microscopy (SEM) analysis.
The pore characteristics of MOS samples with filler Q at 28-d was obtained using a PoreMaster 33 instrument (Quantachrome Instruments, Boynton Beach, FL, USA). The tested MOS pastes were cut into about 5 mm cubes, and these test samples were dried in a vacuum drying chamber at 50 °C for approximately 1-d prior to the mercury intrusion porosimetry (MIP) test.

3. Results

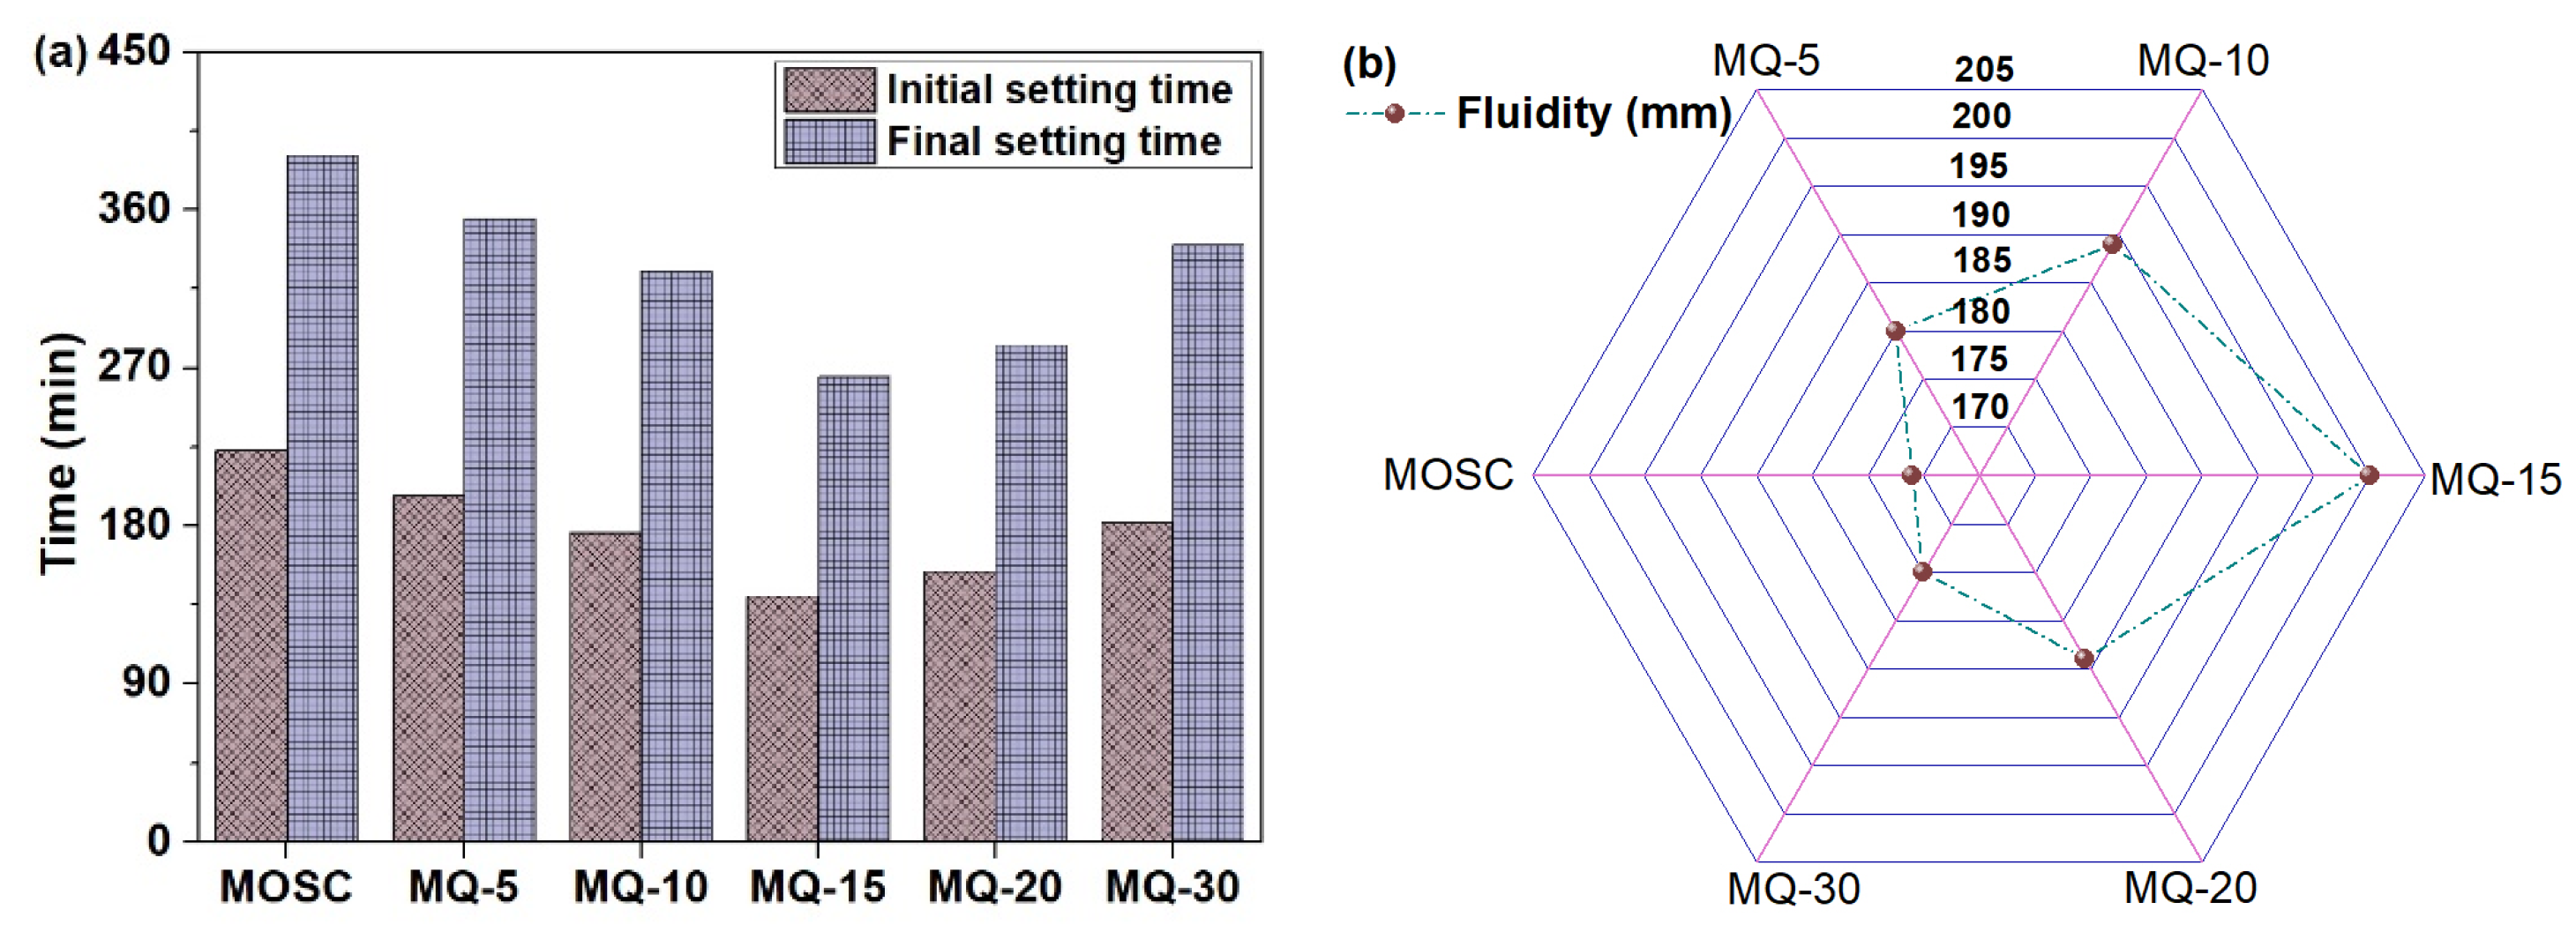
3.1. Setting Time and Fluidity of MOS Cement Containing Filler Q

Figure 2 shows the setting time and fluidity of the MOS cement samples after adding filler Q. Figure 2a shows that the addition of filler Q always shorted the initial and final setting times of MOS cement, although said shortening was not proportional to the percentage of filler Q added, because up to the MQ-15, both setting times were shortened proportionally and with the MQ-20 and MQ-30 they increased proportionally as well, but without ever exceeding those of MOS cement. What agrees, on the other hand, with what has been done in the fluidity of the MOSC slurry to varying degrees as well, but where the MQ-15 cement once again showed the greatest of all. The extendable diameter of the MOSC sample was 176.2 mm, and this increased by 5.1%, 16.5% and 2.3% after adding 5 wt.%, 15 wt.% and 30 wt.% of filler Q, respectively.

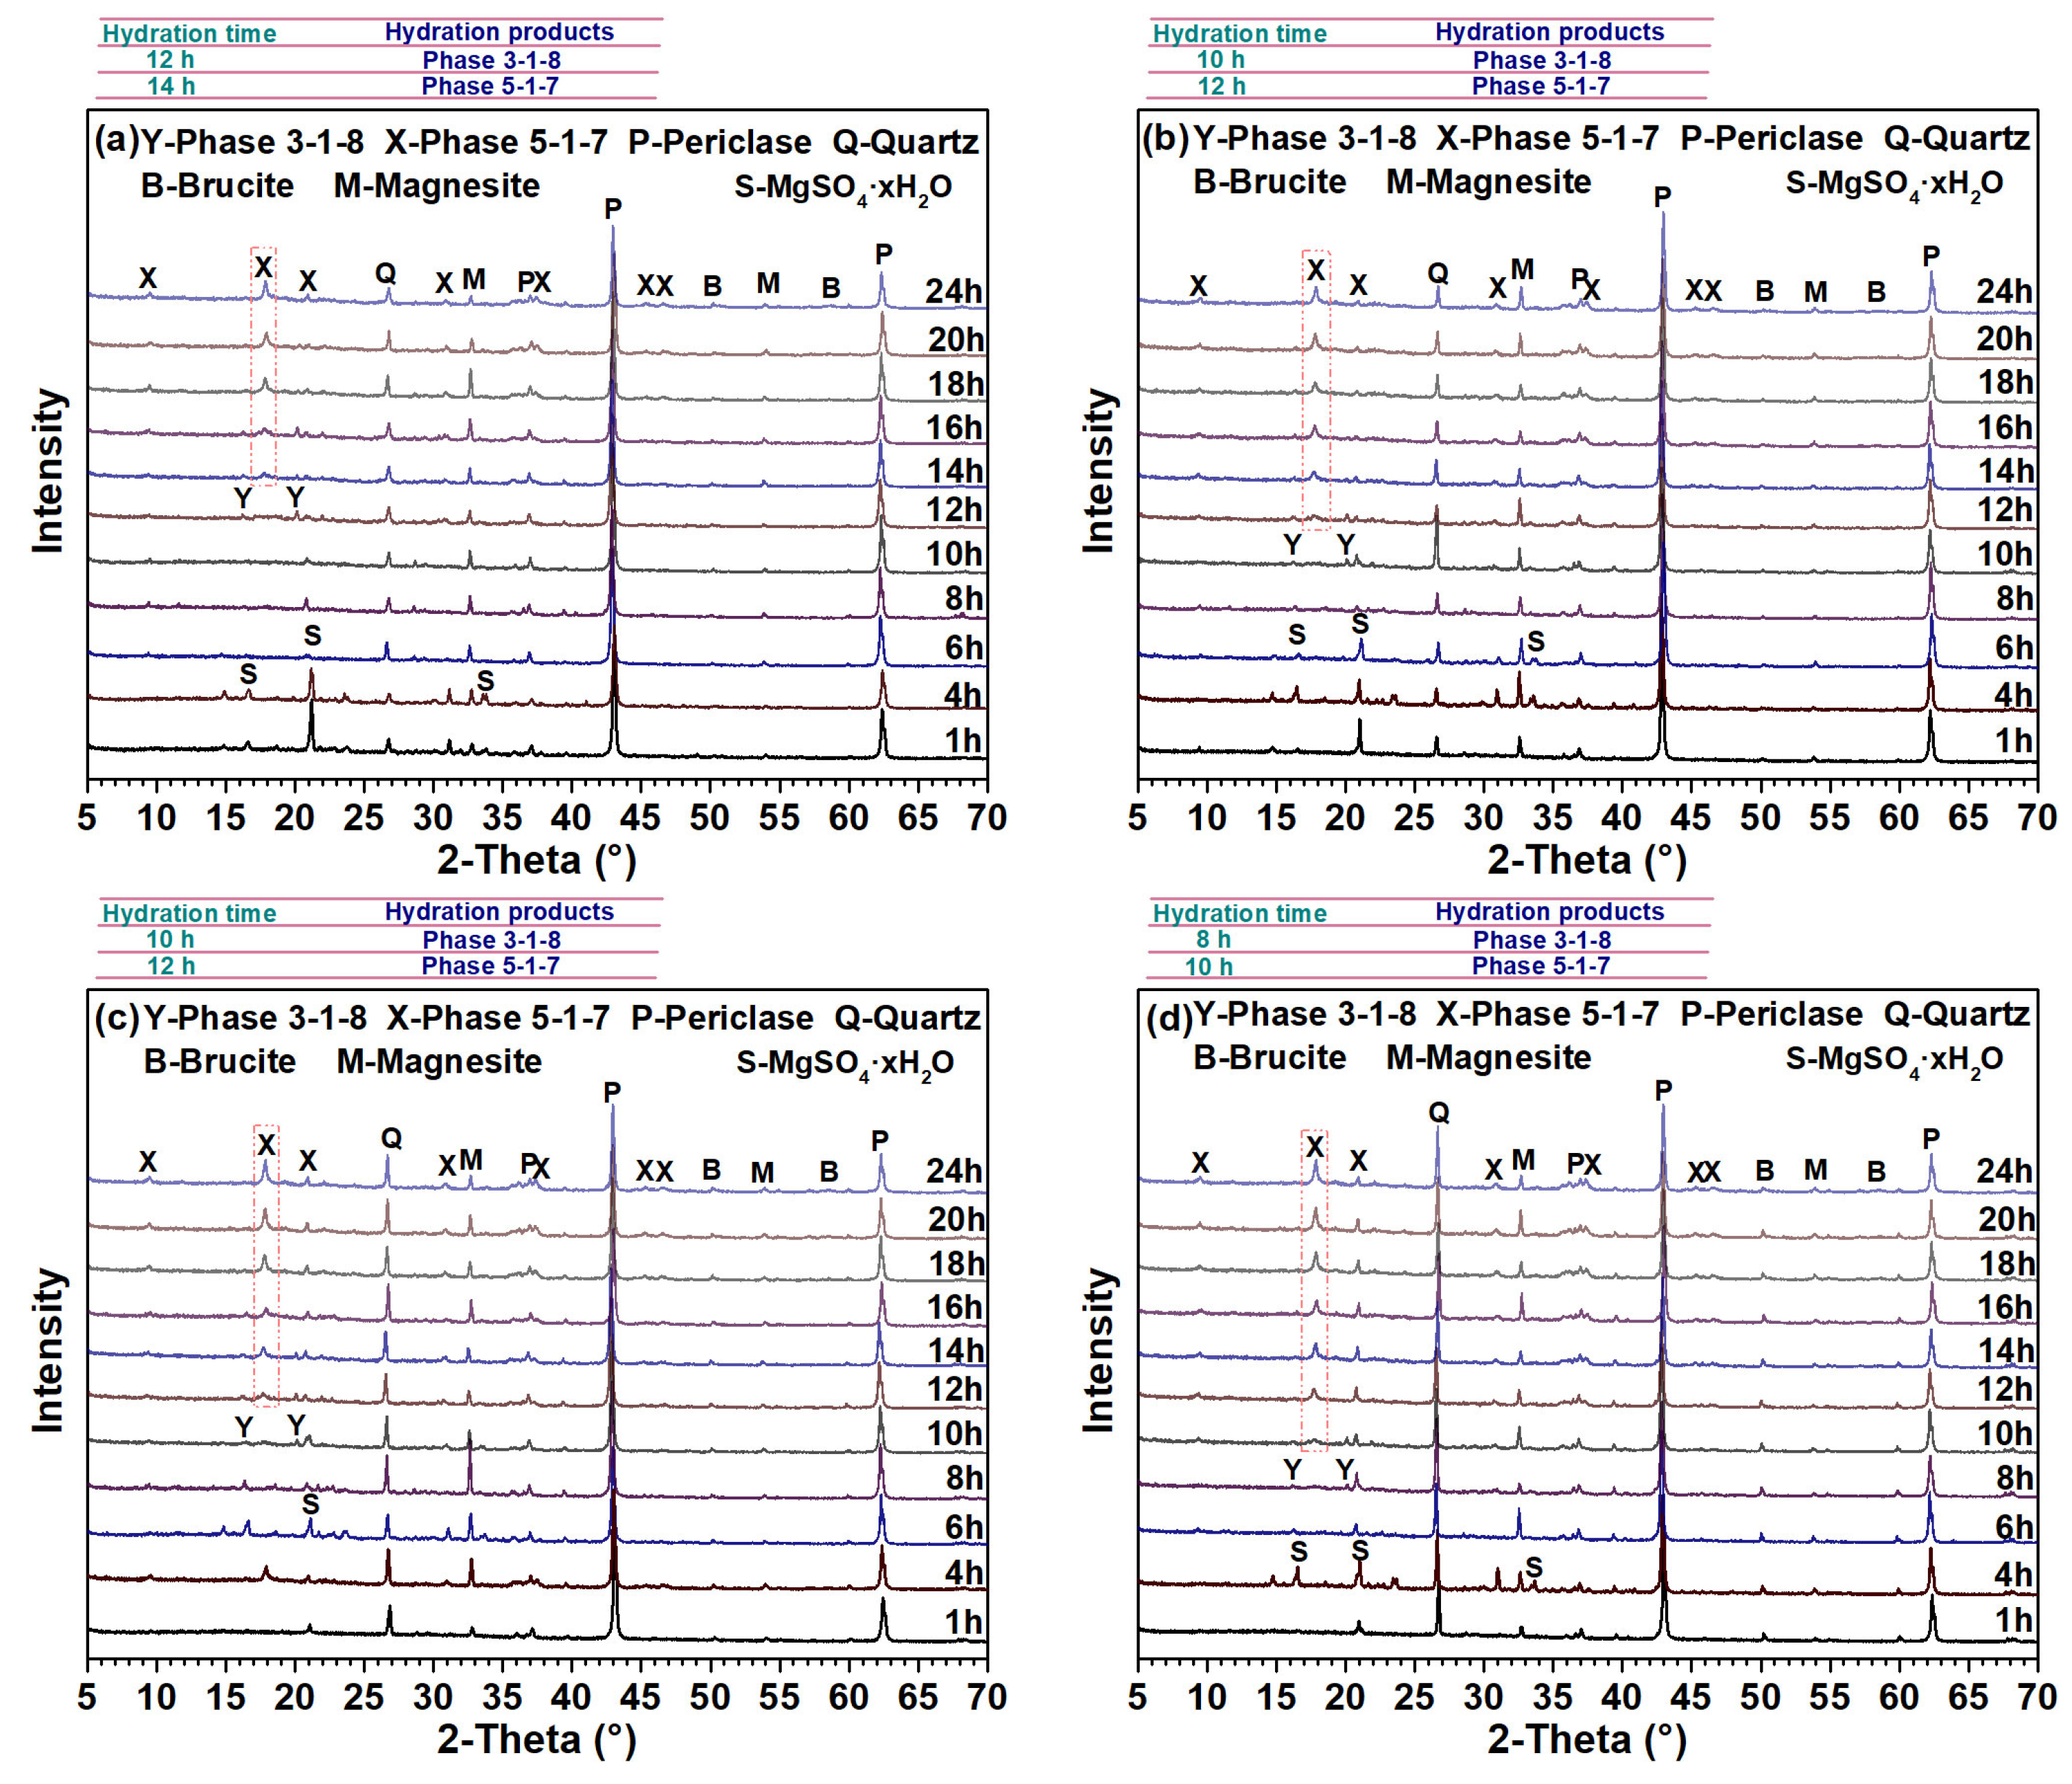
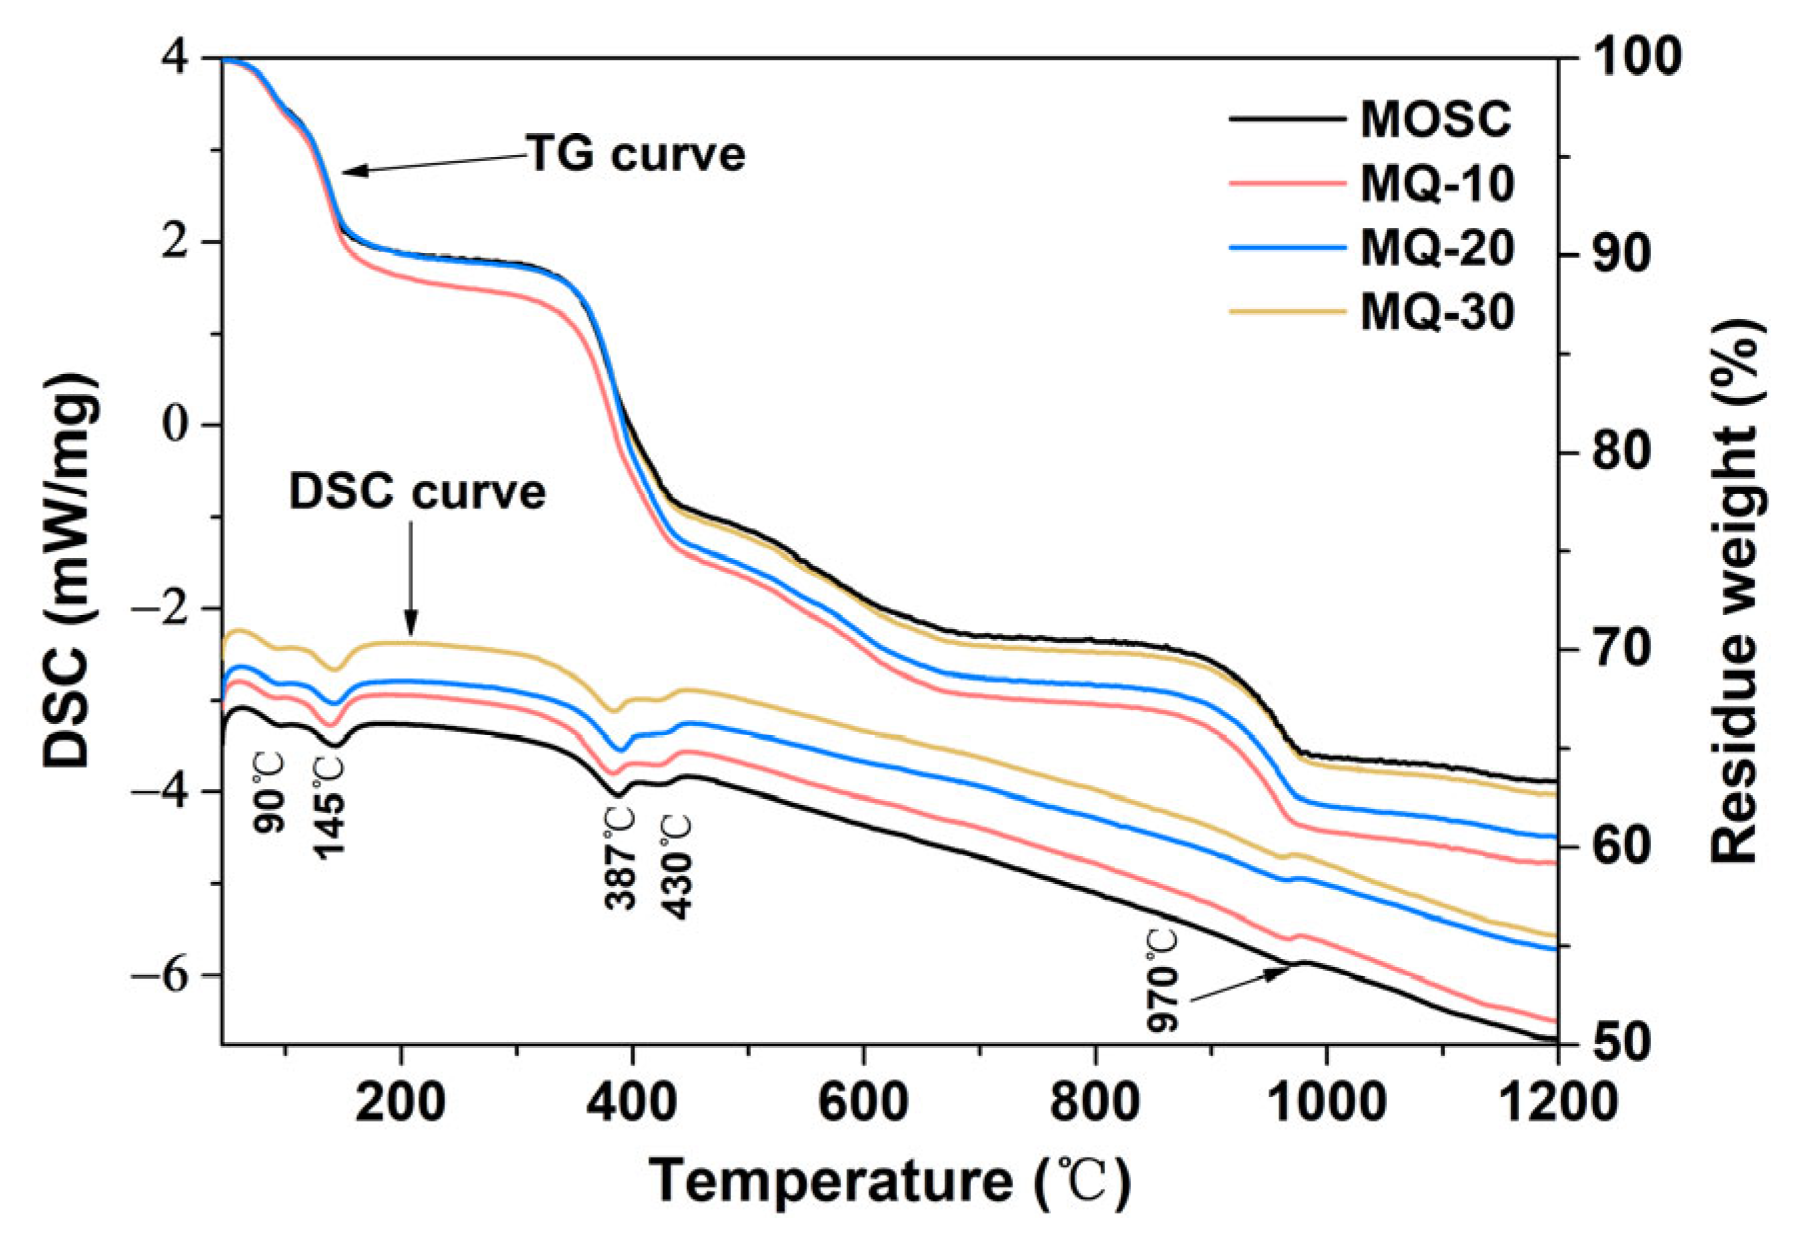
3.2. Early Hydration Process of MOS Cement Containing Filler Q

Figure 3 shows heat dissipation rate and total heat release of MOS paste containing filler Q. As shown in Figure 3a, a 15 wt.%~20 wt.% addition of filler Q reduced the maximum heat dissipation rate of MOS paste, while the heat dissipation rate increased before 12 h of hydration and the time to reach the maximum heat dissipation rate was decreased. Figure 3b presents the total heat release of MOSC was lower than that of MQ-15 and MQ-20 before 12 h of hydration, while much higher after 18 h of hydration. The total heat release of MOSC was approximately 428 J/g as hydration for 48 h, which reduced by 15.2% and 22.7% after adding 15 wt.% and 20 wt.% of filler Q, respectively. These results suggest that filler Q can increase the hydration rate of MOS systems before 12 h of hydration, while decreasing the total heat release after 18 h of hydration via its dilution effect [29,30].
Figure 4 shows the XRD patterns for the MOSC, MQ-5, MQ-15 and MQ-30 samples after different hydration times. It can be found that the hydration of MOS cement was a multi-step process. As shown in Figure 4a, the only hydration product detected was phase 3-1-8 in the MOSC sample until 12 h of hydration, and it gradually disappeared with the formation of phase 5-1-7 after 14 h of hydration. This indicates there was a phase transition from phase 3-1-8 to phase 5-1-7. Figure 4b–d shows the addition of filler Q shortened the formation time for the phase 3-1-8 and phase 5-1-7 in the MOS system. For example, the phase 3-1-8 formed at 8~10 h after adding 5 wt.%, 15 wt.% and 30 wt.% of filler Q. As the hydration time increased to 10~12 h, the phase 3-1-8 disappeared and phase 5-1-7 formed in the MQ-5, MQ-15 and MQ-30 samples.

3.3. Mechanical Strength and Volume Stability of MOS Cement Containing Filler Q

Figure 5a–c shows the mechanical strength and volume stability of the hardened MOS cement containing different filler Q contents. As shown in Figure 5a,b, both the compressive and flexural strengths for all the hardened samples improved with the hydration times, and the 5 wt.%–30 wt.% addition of filler Q all increased the initial and later both strengths to varying degrees. In addition, upon increasing the filler Q content, both strengths for MOS cement at various ages enhanced first and then slightly decreased. The MQ-15 sample exhibited the highest initial and later strength. The compressive strength of MQ-5~MQ-30 at 28-d increased by 11.5%, 23.2%, 26.2%, 18.5%, and 3.7%, meanwhile, flexural strength increased by 4.8%, 10.5%, 14.5%, 12.1%, and 3.2%, respectively, relative to the corresponding strength of the MOSC sample. It can be seen that a 5 wt.%–30 wt.% addition of filler Q exhibited a stronger enhancement effect on the compressive strength than that on the flexural strength for MOS cement. As shown in Figure 5c, all of the hardened pastes showed volume drying shrinkage when curing in air, owing to the evaporation of free water molecules [3,12], but a 10 wt.%~20 wt.% addition of filler Q effectually decreased the drying shrinkage of the hardened MOS cement. According to the Ref. [27], the shrinkage values of MOS cement containing 0.5 wt.%~2.5 wt.% of chemical additives, e.g., trisodium citrate or boric acid, could be reduced to 0.4%~0.5%, while in this study, it can be further reduced by a factor of 4~5 after adding 10 wt.%~20 wt.% of filler Q.

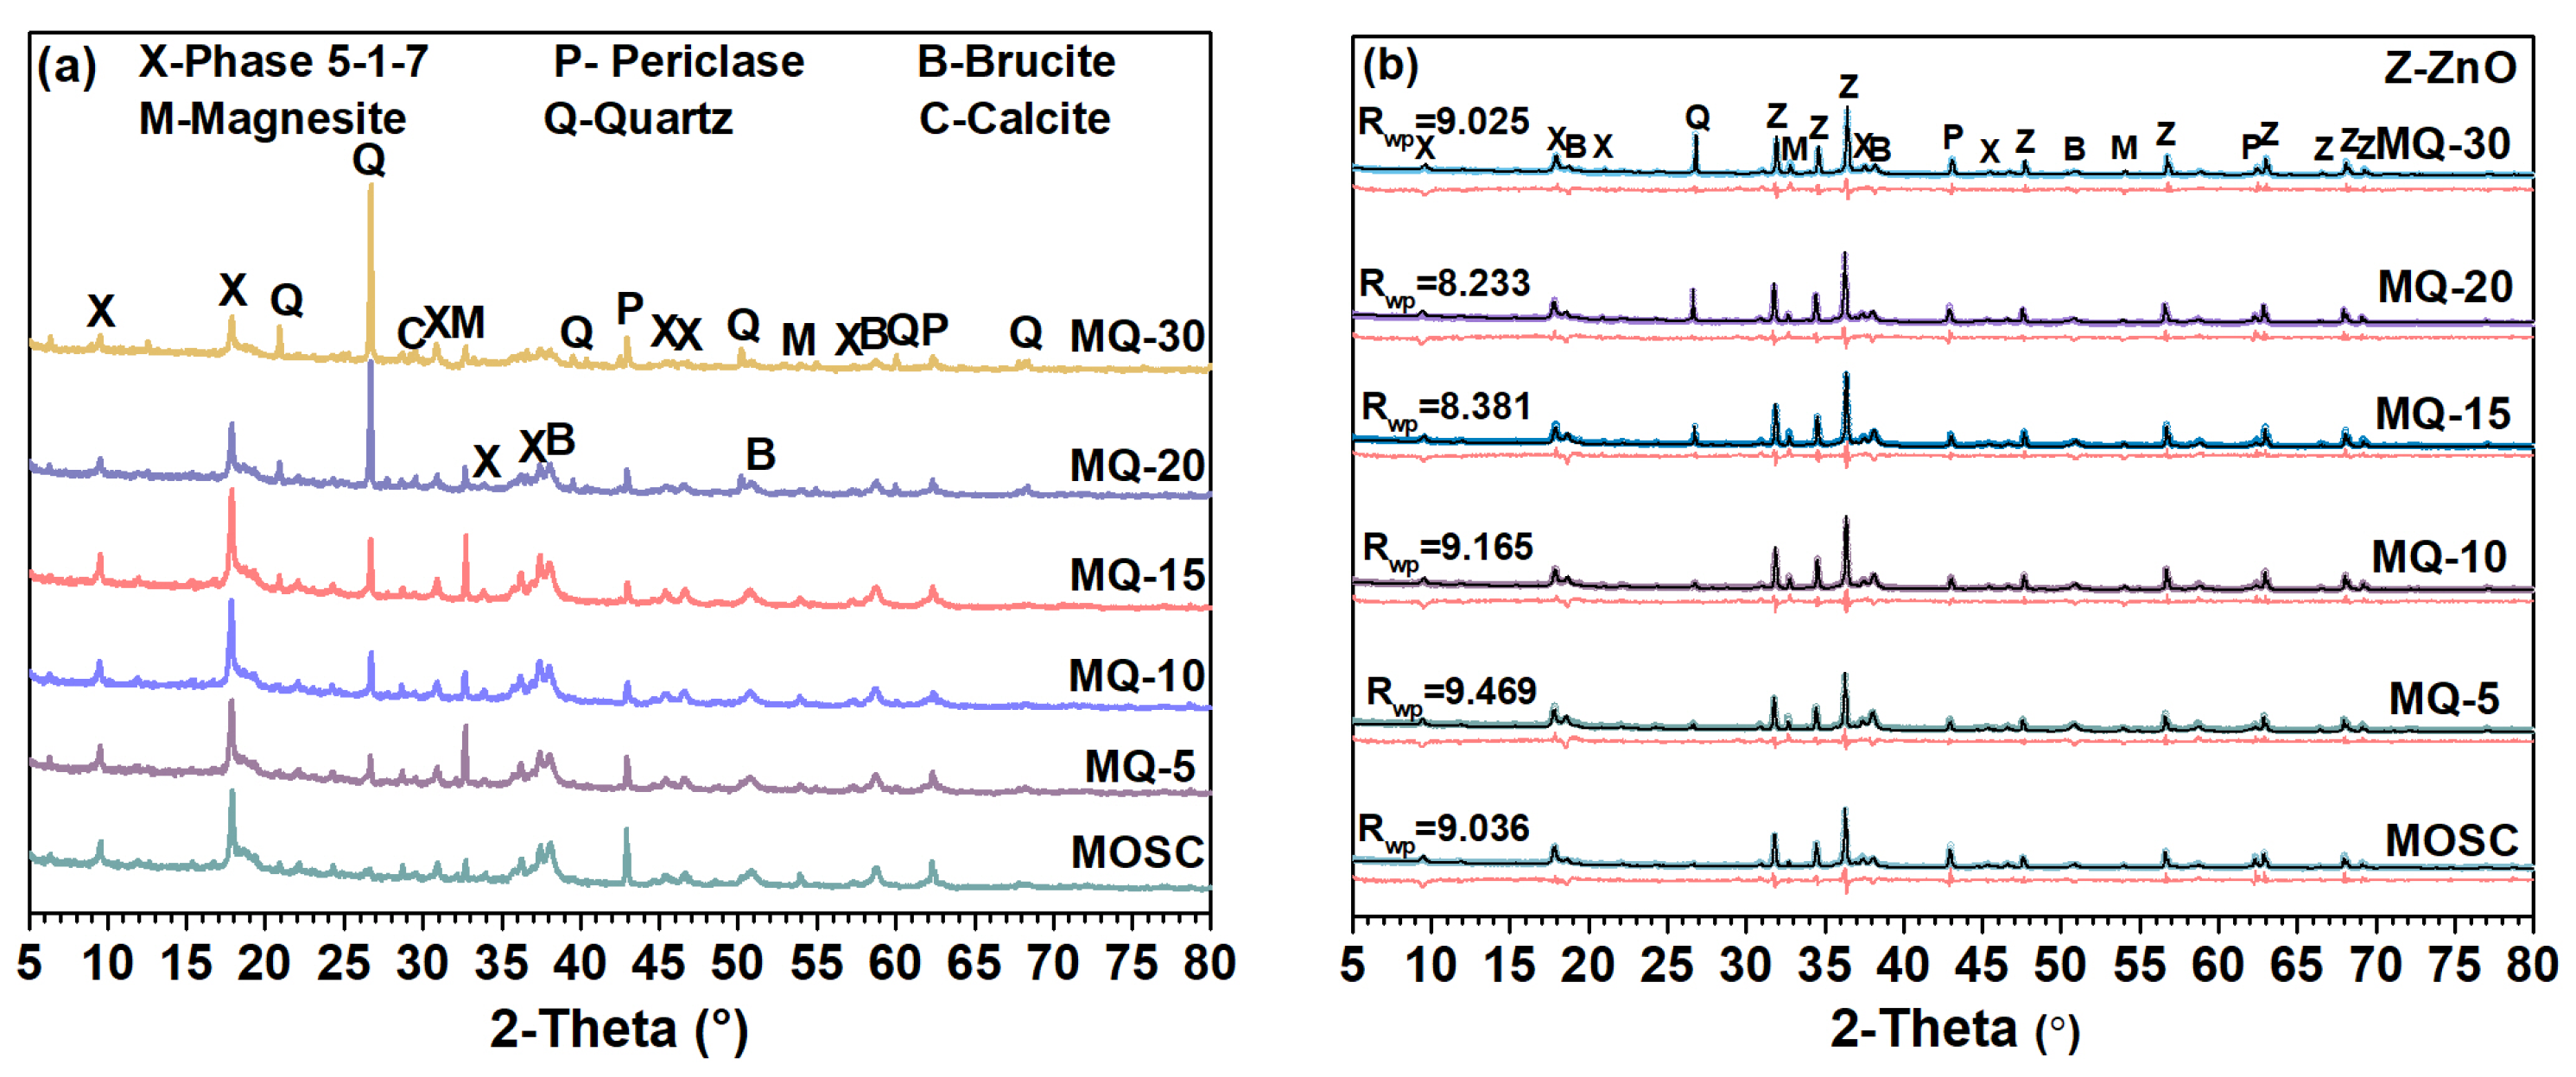
3.4. Phase Composition of MOS Cement Containing Filler Q

Figure 6 shows XRD patterns and Rietveld plot for MOS system containing filler Q at 28-d. As shown in Figure 6a, all these MOS systems contained phase 5-1-7, brucite, periclase, magnesite and quartz. Among them, phase 5-1-7 (9.4°, 17.8°, 30.9° and 37.3° 2-Theta) and brucite (38.0°, 50.8° and 58.6° 2-Theta) were the major reaction products for the MOS system. The 5 wt.%–15 wt.% addition of filler Q enhanced the diffraction peak intensity of phase 5-1-7 and decreased the one of brucite and periclase. Unlike, the peak intensity for phase 5-1-7, brucite as well as periclase were all reduced after adding 20 wt.%–30 wt.% of filler Q. These indicate that the presence of filler Q inhibits the growth of brucite, and the 5 wt.%–15 wt.% addition of filler Q favors the crystal growth for phase 5-1-7 in this system. As shown in Figure 6b, there were reasonable fitting results between the calculated and observed data, and no peaks were losing, meanwhile, the Rwp values of these fitting results were all no more than 10%, suggesting the obtained fitting data from the Rietveld refinements were receivable [16]. Moreover, the content and crystallite size of mineral facies in these systems obtained via Rietveld refinements were shown in Figure 7.
Figure 7 shows the content of phase 5-1-7, periclase and brucite, and crystallite size of hydration products in the system containing filler Q at 28-d. As shown in Figure 7a, a 5 wt.%–15 wt.% addition of filler Q increased the content of phase 5-1-7 and reduced the content of brucite and periclase of MOS cement, suggesting a 5 wt.%–15 wt.% addition of filler Q promotes the reaction of periclase to form phase 5-1-7 rather than brucite. A 20 wt.%–30 wt.% addition of filler Q also reduced the content of periclase, but the content of phase 5-1-7 and brucite was also reduced in the MOS system due to the dilutive effect of filler Q. In addition, MQ-15 exhibited the lowest content of brucite and periclase, and the highest content of phase 5-1-7. As a result, MQ-15 had the highest mechanical strength, and this will be further verified by using MIP test. Figure 7b shows the crystallite size of phase 5-1-7 was larger than that of brucite. Upon increasing the filler Q content, the crystallite size of phase 5-1-7 increased first and then slightly decreased, while that of brucite gradually reduced. The MQ-15 and MQ-30 sample had the largest crystallite size of phase 5-1-7 and the smallest crystallite size of brucite, respectively. The crystallite size of phase 5-1-7 of MOSC was 53.5 nm, and this increased by 3.4%–18.7% after adding 5 wt.%–15 wt.% of filler Q. However, it was reduced by 2.1% and 5.4% after adding 20 wt.% and 30 wt.% of filler Q. These indicate a more complete phase 5-1-7 crystal can be formed in the system after adding 5 wt.%–15 wt.% of filler Q.
The thermal analysis results for the hardened MOS cement containing filler Q at 28-d are shown in Figure 8. The thermogravimetric (TG) curves of these samples exhibited a similar shape, which all show four stages. Similarly, the differential scanning calorimetry (DSC) curves all show five endothermic peaks at roughly 90 °C, 145 °C, 387 °C, 430 °C and 970 °C, respectively. These indicate that MOS cement with and without filler Q have similar hydration products. The thermal decomposition processes of phase 5-1-7 are shown in Equations (1)–(3) [43,44]. Thermal decomposition required an initial dehydration stage of phase 5-1-7 from 45 °C to 145 °C to obtain the anhydrous mineral phase-5Mg(OH)2·MgSO4. Additional thermal decomposition of 5Mg(OH)2·MgSO4 to periclase and SO3 required higher temperatures, producing the peaks at 430 and 970 °C, respectively. Additionally, the peak at 387 °C was associated with the decomposition of brucite to form periclase [45].
5Mg(OH)2·MgSO4·7H2O ➝ 5Mg(OH)2·MgSO4 + 7H2O
5Mg(OH)2·MgSO4 ➝ 5MgO + 5H2O + MgSO4
MgSO4 ➝ MgO + SO3

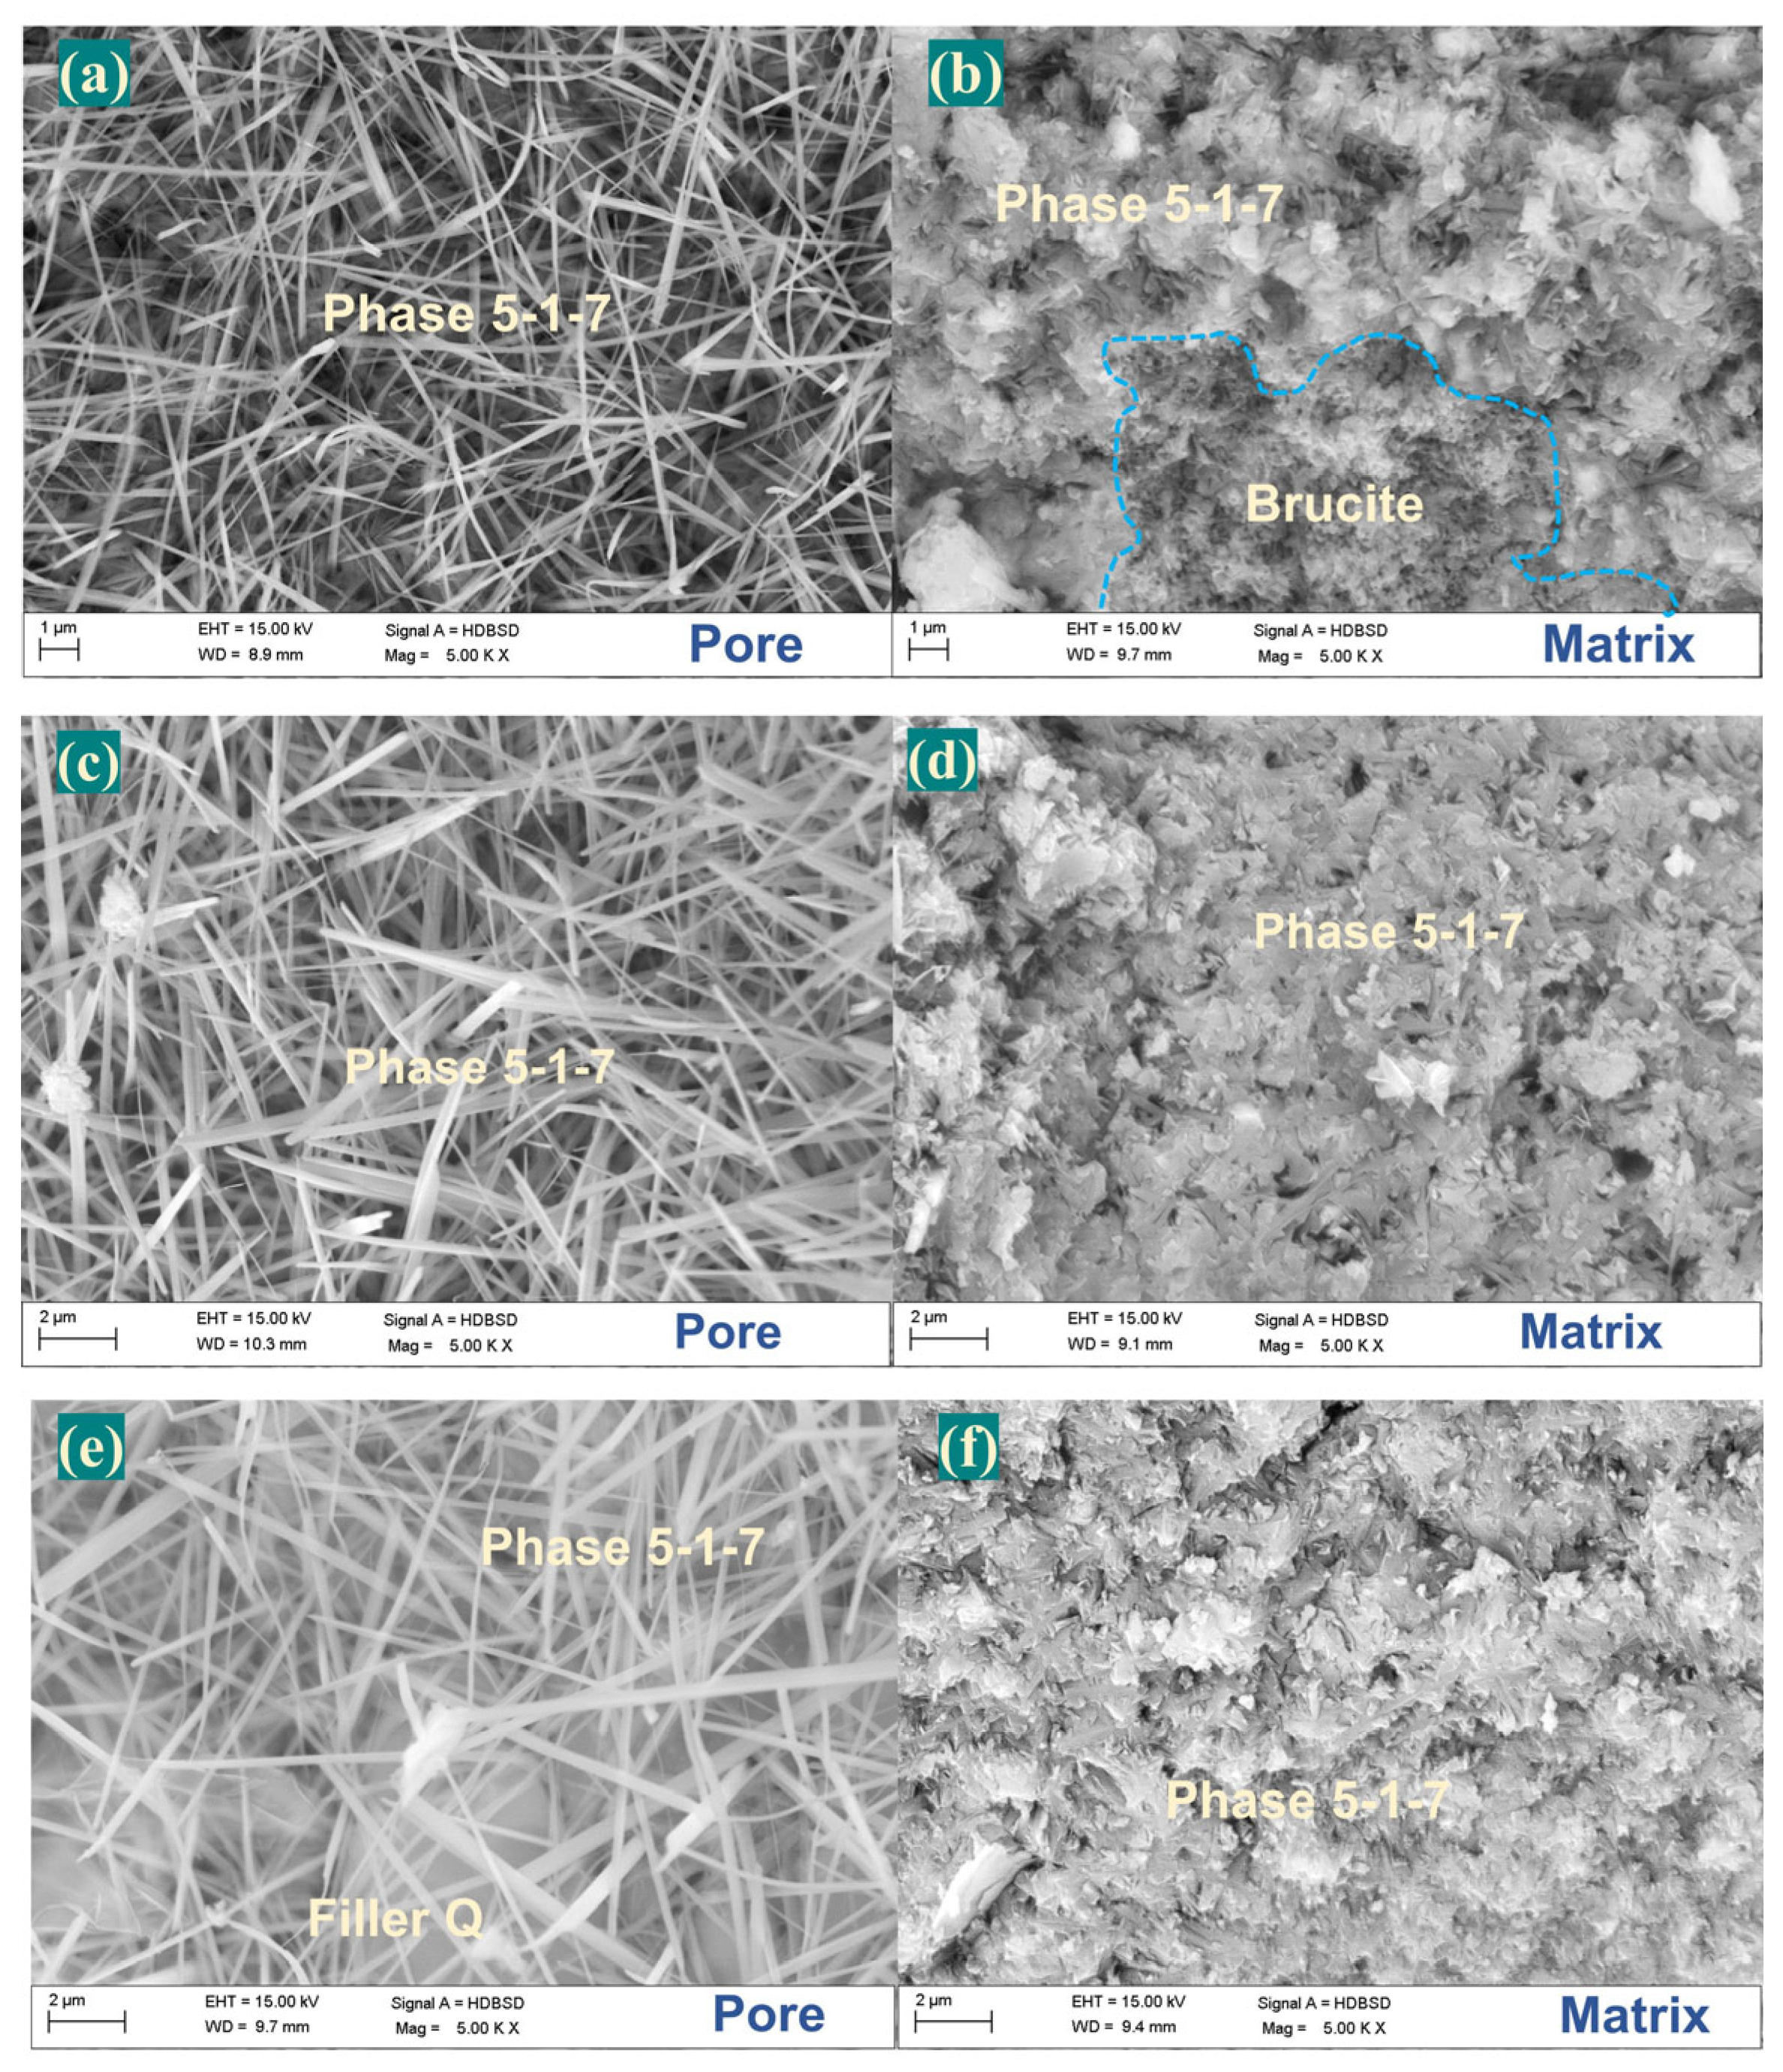
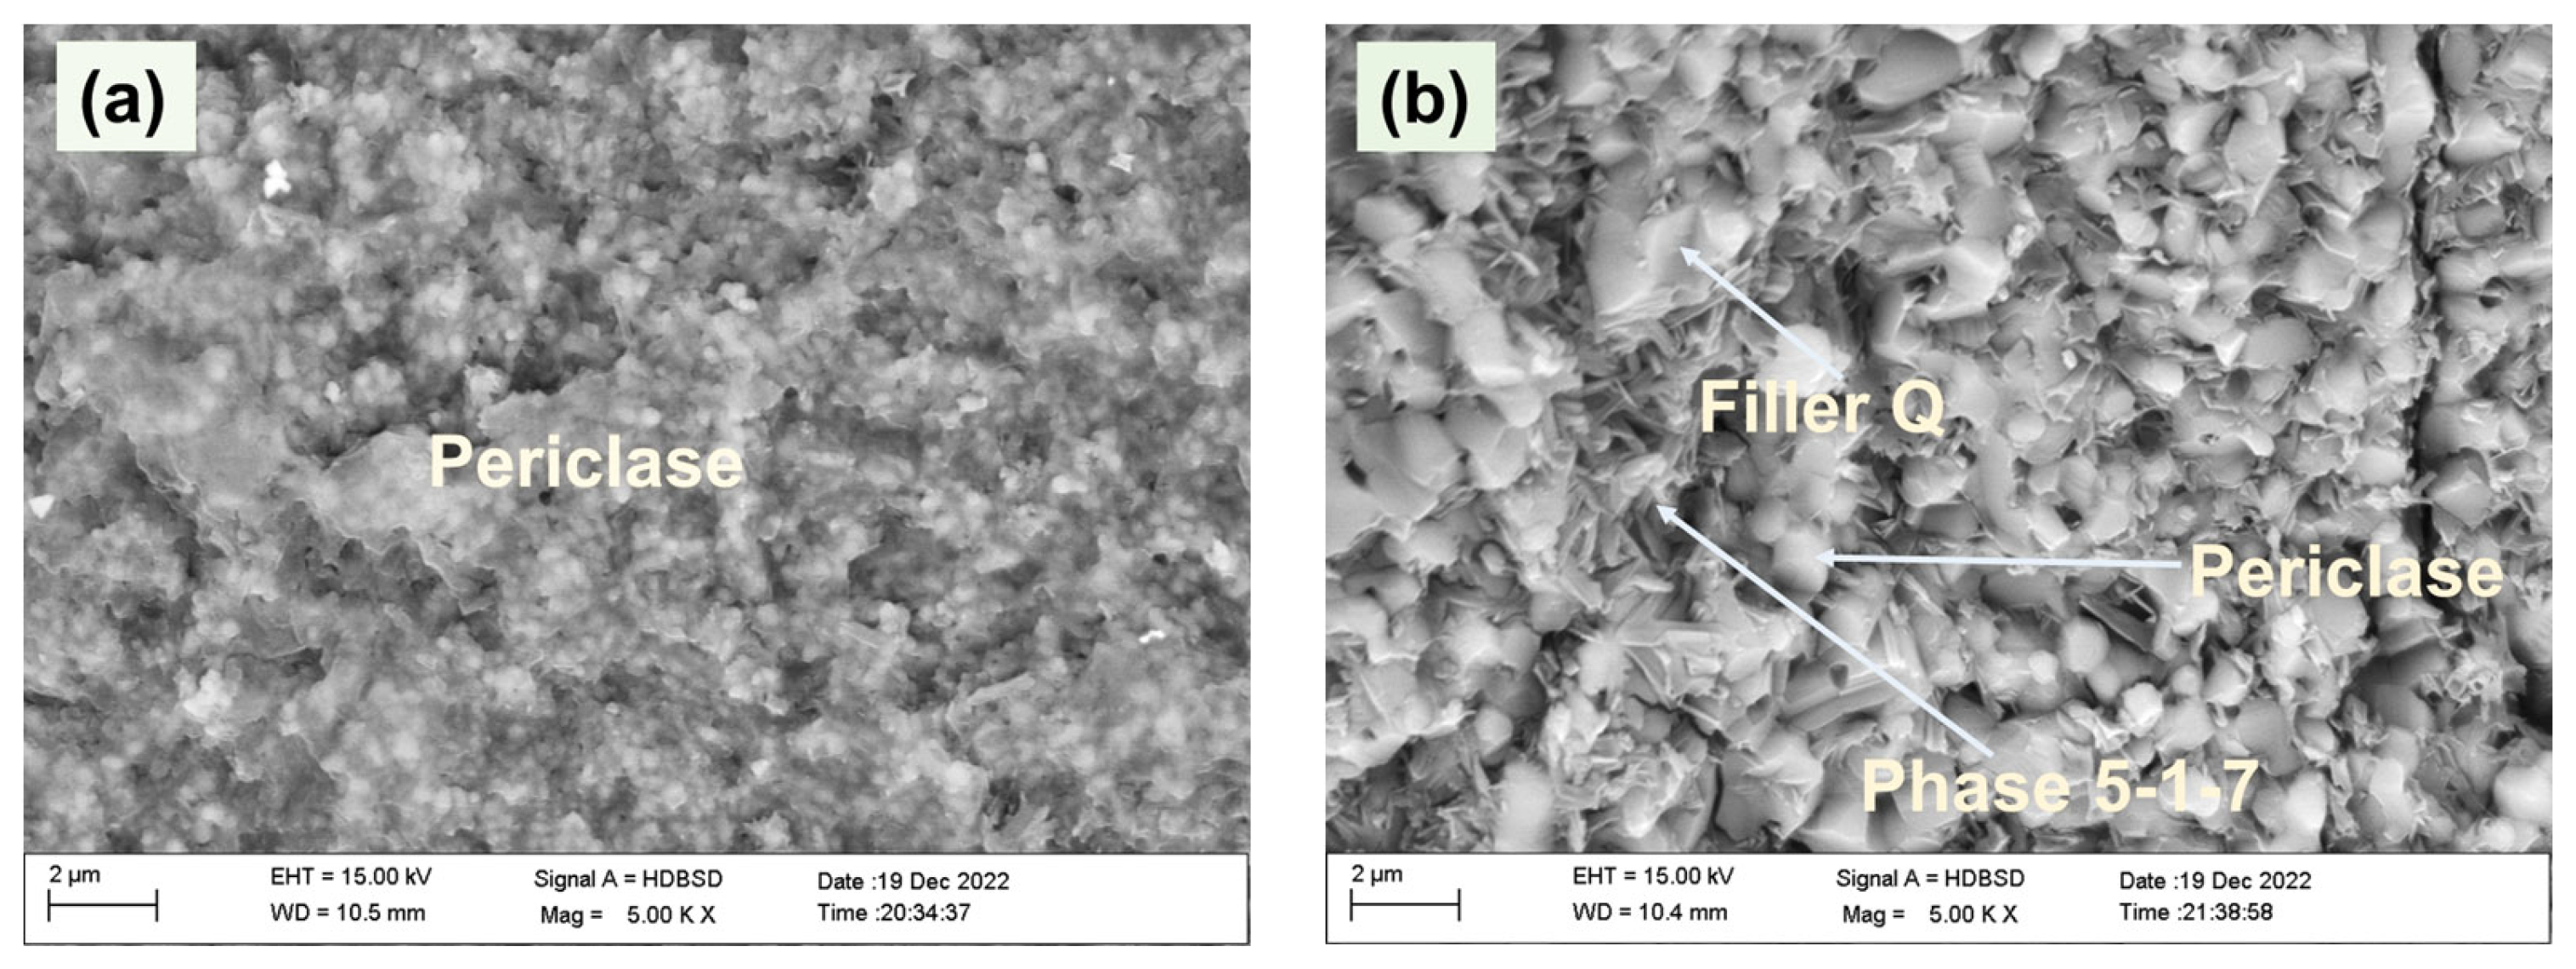
3.5. Microstructure of MOS Cement Containing Filler Q

Figure 9 shows the SEM images of MOS cement containing different filler Q contents at 28-d. As shown in Figure 9a–f, the formed needle-like crystals with large diameter ratio in the pores and intergrown short-rod-like crystals in the matrix in these MOS cement samples were correspond to the generation of phase 5-1-7, which provided a high mechanical capacity for the hardened MOS pastes [46,47,48]. Meanwhile, compared to the matrix, the pores could provide a larger space for the generation of phase 5-1-7 whisker, phase 5-1-7 whisker therefore had a higher length-diameter ratio in the pores. As shown in Figure 9b, the formed brucite was connected to phase 5-1-7 in the matrix, resulting in loose structures and large pores with diameter of about 1 μm obtained in MOSC matrix. As shown in Figure 9c, compared to the size of phase 5-1-7 in MOSC (Figure 9a), a larger phase 5-1-7 whisker was formed in the MQ-15 sample, suggesting that a 15 wt.% addition of filler Q can promote the generation and development for phase 5-1-7 whisker, consistent with the consequences of phase composition analysis. As shown in Figure 9e, the granular filler Q particles were filled in the criss-crossing network formed by the symbiosis of phase 5-1-7 whisker, densifying the pores. Thus, despite a 30 wt.% addition of filler Q reduced the content of phase 5-1-7, the mechanical capacities of MQ-30 were still a bit higher than MOSC. Moreover, from Figure 9b, it could be found a more integrated phase 5-1-7 formed in matrix can provide a more compact structure for MOS cement (compared with Figure 9b).
Figure 10 shows the pore characteristics of MOS cement containing different filler Q contents at 28-d. The pore diameter of MOSC was primarily within the range of 10~1000 nm; and it was primarily within the range of 10~100 nm in the MOS paste containing filler Q, suggesting a 15 wt.%–30 wt.% addition of filler Q reduced the pore diameter of the hardened MOS paste (Figure 10a). As shown in Figure 10b, filler Q reduced the total pore volumes of MOS paste. It can be found that the total pore volume of MOSC was 14.45%, while this can be reduced to 7.54%–10.37% after adding 15 wt.%–30 wt.% of filler Q, indicating that the addition of filler Q can increase the compactness of MOS matrix due to the generation of a more integrated phase 5-1-7 and the filling effect of filler Q (Figure 7 and Figure 9). As a result, the mechanical capacities of MOS cement were enhanced by adding filler Q (Figure 5). Table 2 shows the pore size distribution of MOS paste containing different filler Q contents at 28-d. A 15 wt.%–30 wt.% addition of filler Q increased the contents of pores with a diameter of 10~100 nm (small capillary pores) and <10 nm (gel pores), while reducing the content of pores with diameter of >100 nm (large pore) for MOS cement. Furthermore, the 28-d total pore volume of MOS paste containing 15 wt.%~30 wt.% of filler Q was lower than that of MOS paste containing 50 wt.% of low- or high-calcium fly ash with D50 of 5~10 μm [49]. The 28-d large pore of samples prepared using filler Q was much lower than that of the MOS samples which was prepared by using 20 wt.%~40 wt.% of filler granite with D50 of approximately 10 μm [6].

4. Summary

Hydration of MOS system is a multistep process. Phase 3-1-8 is the first sediment in MOSC; it can be further turned into phase 5-1-7. After adding filler Q into the MOS cement system, no new hydration products forms, but filler Q can accelerate the hydration of periclase to form phase 3-1-8, which can further reduce the time of forming phase 5-1-7. This phenomenon is similar to the results of MOS cement with granite powder and Portland cement with some crystallin mineral additions; it is ascribed to the physico-chemical performances of SiO2 [29,30,49,50,51,52]. The addition of filler Q increases the fluidity of MOS cement slurry due to its dilution and dispersion effects [29,30,50,51], which inhibits the aggregation of periclase particles in the MOS system, increasing the contact area of active MgO in the MgSO4 solution. As a result, the initial and final setting times of MOS paste are decreased and the early hydration rate (before 16 h of hydration) of the system is increased by adding filler Q.
SEM test was used to obtain a clearer mind for the acceleration effect of filler Q on the generation of phase 5-1-7 crystals in MOS system at the early hydration stage. Figure 11 shows the SEM images of MOS paste containing different filler Q contents at 10 h. As shown in Figure 11a, the spherical periclase particles exhibited aggregation in the MOSC matrix. In contrast, the spherical periclase particles uniformly distributed in the MQ-15 matrix, which provided more spaces for the growth of the hydration products (dilution and dispersion effects of filler Q). As a result, the short-rod-like phase 5-1-7 whisker formed between the periclase particles [53,54]. The addition of filler Q therefore could promote the generation of phase 3-1-8 and phase 5-1-7 and enhance the early mechanical capacities of MOS paste.
Nonetheless, the dilution and dispersion effects of filler Q increase the crystallite size of phase 5-1-7 crystals and inhibit the formation of brucite, enhancing the later mechanical capacities of MOS paste. On the other hand, SEM test shows Qz particles fill in the network structure formed by the reciprocal growth of phase 5-1-7 in the pore. This volume-filling effect of filler Q reduces the content of large pore and total pore volume, as well as optimizes the pore structure, which can further enhance the mechanical capacities and volume stability of MOS cement.

5. Conclusions

The purpose of this paper was to shorten the setting time of magnesium oxysulfate (MOS) paste on the basis of enhancing its mechanical strength. Filler Quartz (Q) was utilized as an inactive mineral admixture to prepare MOS paste. Its function mechanisms on the micro- and macro-properties of MOS cement were investigated. Based on the results obtained, following conclusions can be drawn from this study:
(1)
Hydration of reactive MgO to turn into phase 5-1-7 in MOS system was a multi-step process. Phase 3-1-8 was the first sediment and was converted to phase 5-1-7. The 5 wt.%–30 wt.% addition of filler Q promoted the generation of phase 3-1-8 and phase 5-1-7, shortened the setting time, and increased the fluidity of MOS slurry, while reduced the total heat release of MOS system due to its dilution and dispersion effects. After adding 5 wt.%–30 wt.% of filler Q to MOS paste, the fluidity of MOS slurry increased by 2.3%–16.5%; the initial and final setting times of MOS paste shortened by 11.7%–37.2% and 9.2%–32.2%, respectively.
(2)
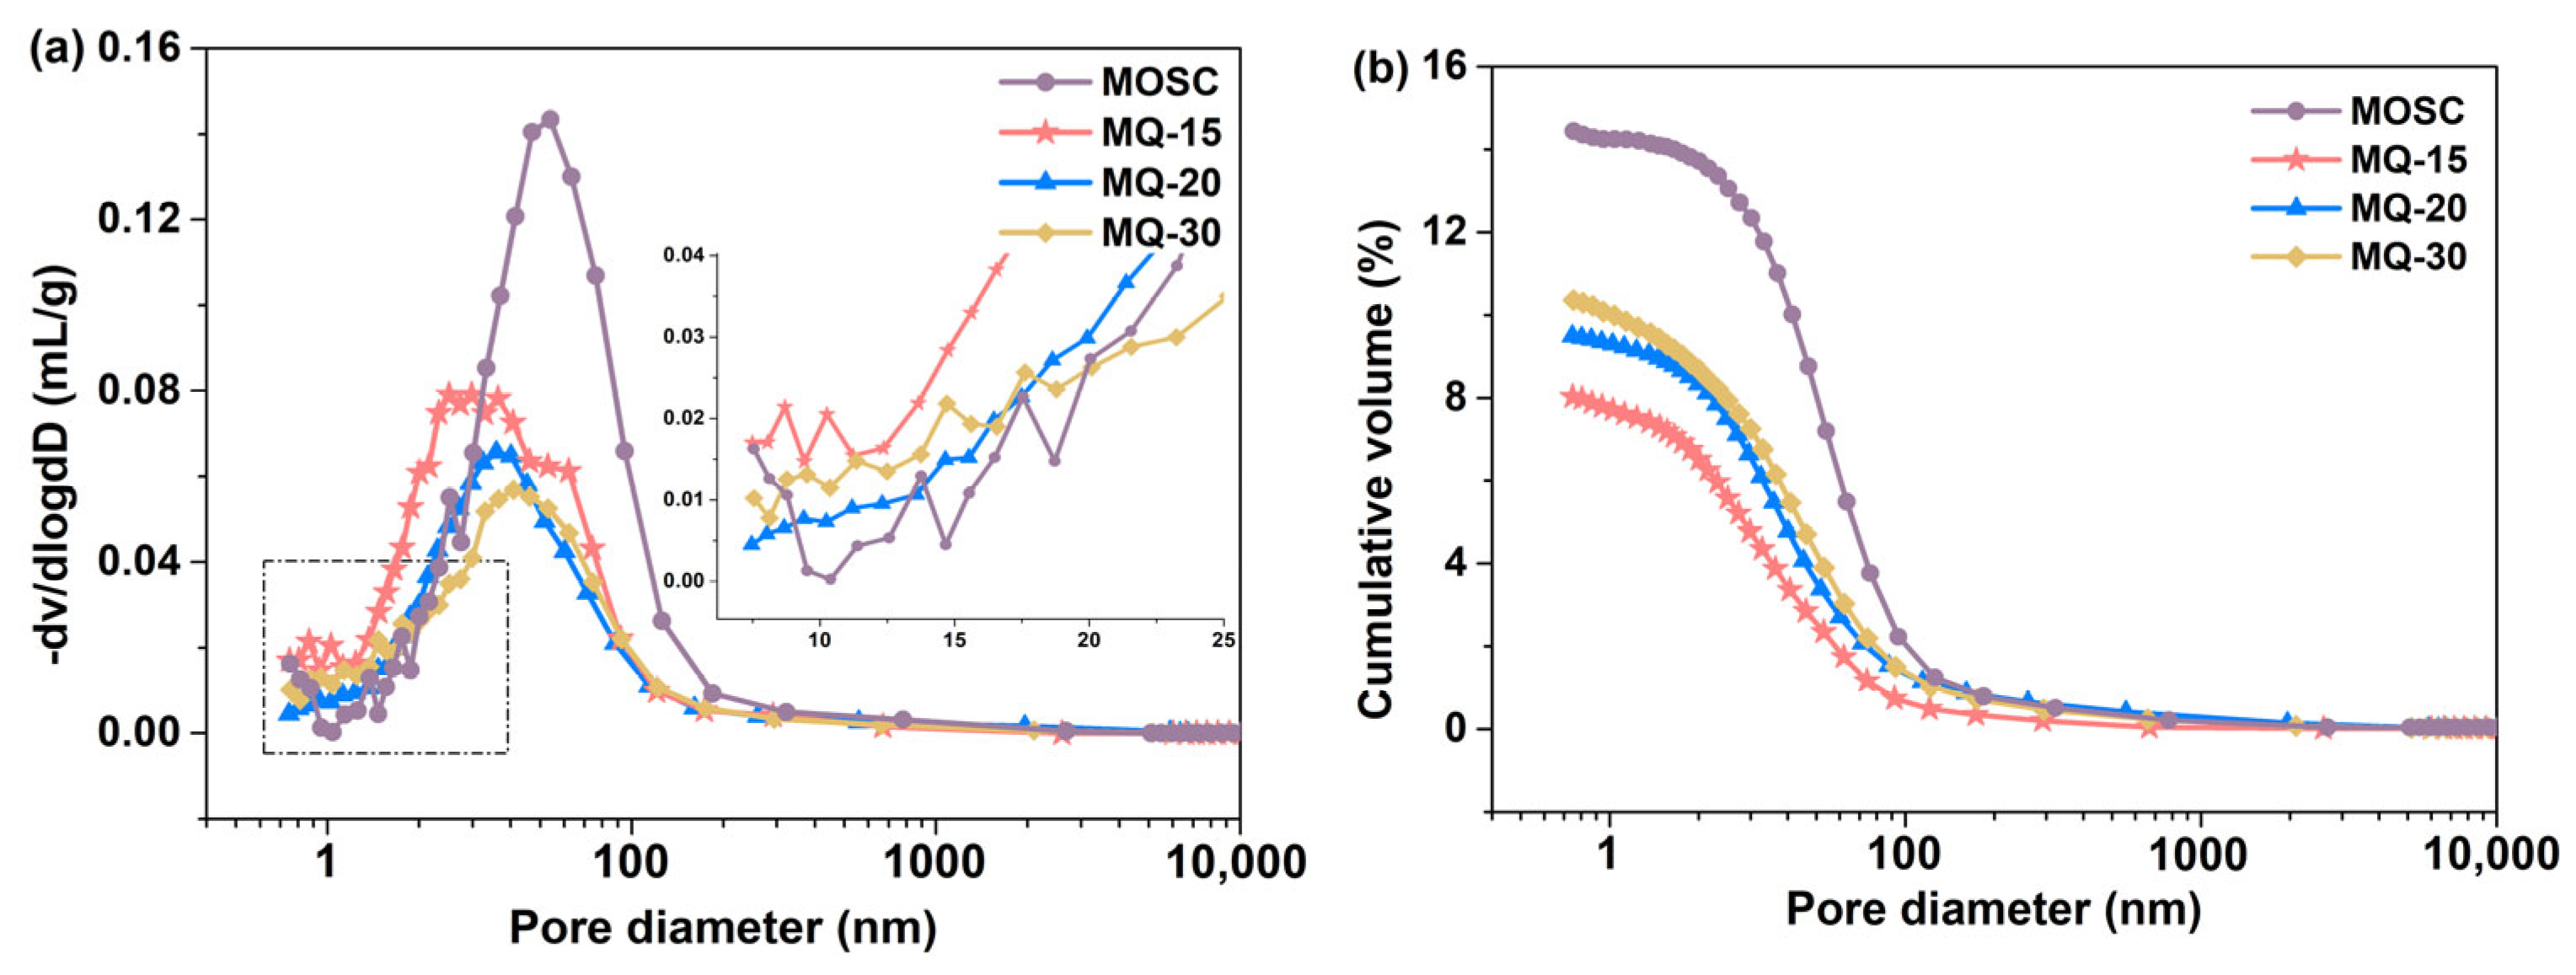
The dilution and dispersion effects of filler Q increased the crystallite size and production of phase 5-1-7, meanwhile, the volume-filling effect of filler Q reduced the content of large pore and total pore volume and improved the pore structure of the MOS paste, enhancing the early and later mechanical strength of the MOS cement. MOS paste with 15 wt.% of filler Q showed the highest early and later mechanical capacities. The compressive and flexural strengths at 3-d can increase by 27.2% and 29.6%, and 28-d compressive and flexural strengths can reach to 94.1 MPa and 14.2 MPa, respectively, after adding 15 wt.% of filler Q to MOS paste.
(3)
A 5 wt.%–30 wt.% addition of filler Q inhibited the formation of brucite. Among them, a 5 wt.%–15 wt.% addition of filler Q increased the crystallite size and production of phase 5-1-7, while a 20 wt.%–30 wt.% one appeared to have the opposite effect. In addition, the crystallite size of phase 5-1-7 was larger than that of brucite in MOS cement.
(4)
Filler Q with low cost can be used as enhancer and coagulant in MOS cement and can also make MOS paste more suitable for application in building materials, e.g., preparing light weight, fireproof, or partition plates. However, its enhancement mechanisms are effective only when there is no excess filler Q, i.e., the content of filler Q should not be more than 20 wt.%.

Author Contributions

Conceptualization, S.W.; methodology, T.Z. and D.P.; software, D.P.; validation, S.C.; formal analysis, D.P. and S.C.; investigation, W.B.; resources, X.C.; data curation, X.C.; writing—original draft preparation, X.C.; writing—review and editing, S.W., D.P., S.C. and T.Z.; supervision, W.B.; project administration, D.P.; funding acquisition, S.W. and D.P. All authors have read and agreed to the published version of the manuscript.

Funding

This research was funded by [Tingting Zhang] National Key R&D Program of China (No. 2022YFC3702300), the National Natural Science Foundation of China (52178189) and Liaoning Revitalization Talents Program (XLYC2007126), and the APC was funded by [Daijun Pang].

Data Availability Statement

Data will be made available on request.

Acknowledgments

We would like to thank the guidance from Rahhal V. (Departamento de Ingeniería Civil Facultad de Ingeniería UNPCBA, Avda. del Valle 5737, Argentina, (B7400JWI), Olavarría, Argentina). The authors are also thankful to Tingting Zhang (Faculty of Infrastructure Engineering, Dalian University of Technology, 116024, Dalian, Liaoning, China) for providing the necessary support.

Conflicts of Interest

The authors declare that they have no known competing financial interest or personal relationships that could appear to influence the work reported in this paper.

References

  1. Runčevski, T.; Wu, C.; Yu, H.; Yang, B.; Dinnebier, R.E. Structural characterization of a new magnesium oxysulfate hydrate cement phase and its surface reactions with atmospheric carbon dioxide. J. Am. Ceram. Soc. 2013, 96, 3609–3616. [Google Scholar] [CrossRef]
  2. Chen, X.; Zhang, T.; Cheeseman, C.; Bi, W.; Wang, S. Production of rapid-hardening magnesium oxysulfate (MOS) cement containing boric acid. J. Mater. Civ. Eng. 2022, 34, 04022045. [Google Scholar] [CrossRef]
  3. Chen, X.; Chen, B.; Chang, J.; Xu, X.; Sun, E.; Wang, S.; Guan, Y. Improved mechanical strength of magnesium oxysulfate cement using ferric sulfate. J. Build. Eng. 2023, 67, 106007. [Google Scholar] [CrossRef]
  4. Qin, L.; Gao, X.J.; Chen, T.F. Recycling of raw rice husk to manufacture magnesium oxysulfate cement based lightweight building materials. J. Clean. Prod. 2018, 191, 220–232. [Google Scholar] [CrossRef]
  5. Li, Q.Y.; Su, A.S.; Gao, X.J. Preparation of durable magnesium oxysulfate cement with the incorporation of mineral admixtures and sequestration of carbon dioxide. Sci. Total Environ. 2021, 809, 152127. [Google Scholar] [CrossRef]
  6. Jin, K.; Bi, W.; Guan, Y.; Chen, X.; Zhou, X.; Wang, D. Performance of magnesium oxysulfate (MOS) cement with granite powders after combined sulfate and chloride attacks. Construct. Build. Mater. 2023, 366, 130141. [Google Scholar] [CrossRef]
  7. Cui, P.; Wu, C.R.; Chen, J.; Luo, F.M.; Kou, S.C. Preparation of magnesium oxysulfate cement as a 3D printing material. Construct. Build. Mater. 2021, 282, 122677. [Google Scholar] [CrossRef]
  8. Wang, R.; Qin, L.; Gao, X.J. Mechanical strength and water resistance of magnesium oxysulfate cement based lightweight materials. Cement Concr. Compos. 2020, 109, 103554. [Google Scholar] [CrossRef]
  9. Qiu, Y.; Sun, Q.; Feng, K.; Luo, A.; Wu, X.; Ba, M. Experimental study on the preparation of magnesium oxysulfate cement-based composites using waste locust powders to replace non-renewable magnesium oxide. Construct. Build. Mater. 2023, 366, 130129. [Google Scholar] [CrossRef]
  10. Walling, S.A.; Provis, J.L. Magnesium-based cements: A journey of 150 years, and cements for the future? Chem. Rev. 2016, 116, 4170–4204. [Google Scholar] [CrossRef]
  11. Zhang, R.; Arrigoni, A.; Panesar, D.K. Could reactive MgO cement be a green solution? The effect of CO2 mineralization and manufacturing route on the potential global warming impact. Cement Concr. Compos. 2021, 124, 104263. [Google Scholar] [CrossRef]
  12. Guan, Y.; Hu, Z.; Zhang, Z.; Chang, J.; Bi, W.; Cheeseman, C.R.; Zhang, T. Effect of hydromagnesite addition on the properties and water resistance of magnesium oxysulfate (MOS) cement. Cement Concr. Res. 2021, 143, 106387. [Google Scholar] [CrossRef]
  13. Ruan, S.Q.; Unluer, C. Comparative life cycle assessment of reactive MgO and Portland cement production. J. Clean. Prod. 2016, 137, 258–273. [Google Scholar] [CrossRef]
  14. Guo, B.; Tan, Y.; Wang, L.; Chen, L.; Wu, Z.; Sasaki, K. High-efficiency and low-carbon remediation of zinc contaminated sludge by magnesium oxysulfate cement. J. Hazard. Mater. 2021, 408, 124486. [Google Scholar] [CrossRef]
  15. Li, X.; Qiu, R.; Xue, F.; Fang, L.; Cheng, F. Effects of unreactive MgO and impurities in light burned MgO on the hydration process and performance of base magnesium sulfate cement. Construct. Build. Mater. 2020, 240, 117854. [Google Scholar] [CrossRef]
  16. Chen, X.; Wang, S.; Zhou, Y.; Cheeseman, C.; Bi, W.; Zhang, T. Improved low-carbon magnesium oxysulfate cement pastes containing boric acid and citric acid. Cement Concr. Compos. 2022, 109, 104813. [Google Scholar] [CrossRef]
  17. Wu, C.; Yu, H.; Dong, J.; Zheng, L. Effects of material ratio, fly ash, and citric acid on magnesium oxysulfate cement. J. ACI Mater. 2014, 111, 291–297. [Google Scholar] [CrossRef]
  18. Barbieri, V.; Gualtieri, M.L.; Manfredini, T.; Siligardi, C. Hydration kinetics and microstructural development of a magnesium oxysulfate cement modified by macromolecules. Construct. Build. Mater. 2020, 248, 118624. [Google Scholar] [CrossRef]
  19. Kahle, K. The formation mechanism for magnesium oxysulfate cements. Silikatechnik 1972, 23, 148–151. [Google Scholar]
  20. Urwongse, L.; Sorrell, C.A. Phase relations in magnesium oxysulfate cements. J. Am. Ceram. Soc. 1980, 63, 523–526. [Google Scholar] [CrossRef]
  21. Dinnebier, R.E.; Pannach, M.; Freyer, D. 3Mg(OH)2·MgSO4·8H2O: A metastable phase in the system Mg(OH)2-MgSO4-H2O. Z. Anorg. Allg. Chem. 2013, 639, 1827–1833. [Google Scholar] [CrossRef]
  22. Zhang, N.; Yu, H.; Ma, H.; Ma, H.; Ba, M. The phase composition of the MgO-MgSO4-H2O system and mechanisms of chemical additive. Compos. Part B Eng. 2022, 247, 110328. [Google Scholar] [CrossRef]
  23. Gu, K.; Chen, B.; Cui, Q. Experimental research on properties of magnesium oxysulfate cement during high temperature exposure. Compos. Part B Eng. 2022, 244, 110168. [Google Scholar] [CrossRef]
  24. Wang, N.; Yu, H.; Bi, W.; Tan, Y.; Zhang, N.; Wu, C.; Ma, H.; Hua, S. Effects of sodium citrate and citric acid on the properties of magnesium oxysulfate cement. Construct. Build. Mater. 2018, 169, 697–704. [Google Scholar] [CrossRef]
  25. Wu, C.; Chen, W.; Zhang, H.; Yu, H.; Zhang, W.; Jiang, N.; Liu, L. The hydration mechanism and performance of modified magnesium oxysulfate cement by tartaric acid. Construct. Build. Mater. 2017, 144, 516–524. [Google Scholar] [CrossRef]
  26. Zhang, N.; Yu, H.; Ma, H.; Ba, M. Effects of different pH chemical additives on the hydration and hardening rules of basic magnesium sulfate cement. Construct. Build. Mater. 2021, 305, 124696. [Google Scholar] [CrossRef]
  27. Qin, L.; Gao, X.; Li, W.; Ye, H. Modification of magnesium oxysulfate cement by incorporating weak acids. J. Mater. Civ. Eng. 2018, 30, 4018209. [Google Scholar] [CrossRef]
  28. Sun, Q.; Ba, M.; Zhang, D.; Zhou, S.; Zhang, N.; Wang, F. Effects of citrate acid, solidum silicate and their compound on the properties of magnesium oxysulfate cement under carbonation condition. Construct. Build. Mater. 2022, 330, 127136. [Google Scholar] [CrossRef]
  29. Rahhal, V.; Bonavetti, V.; Trusilewicz, L.; Pedrajas, C.; Talero, R. Role of the filler on Portland cement hydration at early ages. Construct. Build. Mater. 2012, 27, 82–90. [Google Scholar] [CrossRef]
  30. Rahhal, V.; Talero, R. Early hydration of Portland cement with crystalline mineral additions. Cem. Concr. Res. 2005, 35, 1285–1291. [Google Scholar] [CrossRef]
  31. Chen, L.H.; Li, Q.; Jiang, T. Comprehensive utilization of tailings in quartz vein-hosted gold deposits. Minerals 2022, 12, 1481. [Google Scholar] [CrossRef]
  32. Zhang, Y.; Han, B.; Su, Z.; Chen, X.; Lu, M.; Liu, S.; Liu, J.; Jiang, T. Effect of quartz on the preparation of sodium stannate from cassiterite concentrates by soda roasting process. Minerals 2019, 9, 605. [Google Scholar] [CrossRef]
  33. Xu, M.Z.; Chen, X.Y.; Han, L. Effect of tartaric acid on the early hydration process and water resistance of magnesium oxychloride cement. J. Build. Eng. 2023, 66, 105838. [Google Scholar] [CrossRef]
  34. Chen, X.Y.; Zhang, T.T.; Cheeseman, C.R. Effect of tartaric acid and phosphoric acid on the water resistance of magnesium oxychloride (MOC) cement. Construct. Build. Mater. 2019, 213, 528–536. [Google Scholar] [CrossRef]
  35. Tang, S.; Yuan, J.; Cai, R.; Wei, C.; Chen, J.; Chen, E. In situ monitoring of hydration of magnesium oxysulfate cement paste: Effect of MgO/MgSO4 ratio. Construct. Build. Mater. 2020, 251, 119003. [Google Scholar] [CrossRef]
  36. Tang, S.; Wei, C.; Cai, R.; Huang, J.; Chen, E.; Yuan, J. In situ monitoring of pore structure of magnesium oxysulfate cement paste: Effect of MgSO4/H2O ratio. J. Ind. Eng. Chem. 2020, 83, 387–400. [Google Scholar] [CrossRef]
  37. GB/T-1346-2019; Test Methods for Water Requirement of Normal Consistency, Setting Time and Soundness of the Portland Cement. China Architecture & Building Press: Beijing, China, 2019.
  38. GB/T 8077-2012; Methods for Testing Uniformity of Concrete Admixture. Standards Press of China: Beijing, China, 2012.
  39. JC/T 313-2009; Test Method for Determining Expansive Ratio of Expansive Cement. China Building Materials Press: Beijing, China, 2009.
  40. Albertsson, J.; Abrahams, S.C.; Kvick, Å. Atomic displacement, anharmonic thermal vibration, expansivity and pyroelectric coefficient thermal dependences in ZnO. Acta Crys. Sec. B Struct. Sci. 1989, 45, 34–40. [Google Scholar] [CrossRef]
  41. McCusker, L.B.; Von Dreele, R.B.; Cox, D.E.; Louër, D.; Scardi, P. Rietveld refinement guidelines. J. Appl. Cryst. 1999, 32, 36–50. [Google Scholar] [CrossRef]
  42. Pyzalski, M.; Dąbek, J.; Adamczyk, A.; Brylewski, T. Physicochemical study of the self-disintegration of calcium orthosilicate (β→γ) in the presence of the C12A7 aluminate phase. Materials 2021, 14, 6459. [Google Scholar] [CrossRef]
  43. Guan, Y.; Chang, J.; Hu, Z.; Bi, W. Performance of magnesium hydroxide gel at different alkali concentrations and its effect on properties of magnesium oxysulfate cement. Construct. Build. Mater. 2022, 348, 128669. [Google Scholar] [CrossRef]
  44. Zhang, N.; Yu, H.; Gong, W.; Liu, T.; Wang, N.; Tan, Y.; Wu, C. Effects of low- and high-calcium fly ash on the water resistance of magnesium oxysulfate cement. Construct. Build. Mater. 2020, 230, 116951. [Google Scholar] [CrossRef]
  45. Winnefeld, F.; Epifania, E.; Montagnaro, F.; Gartner, E.M. Further studies of the hydration of MgO-hydromagnesite blends. Cem. Concr. Res. 2019, 126, 105912. [Google Scholar] [CrossRef]
  46. Xu, X.; Li, Y.; Yu, B.; Zhu, B.; Liu, Q.; Hu, H.; Hu, Z.; Yu, B.; Wang, S.; Meng, J. A novelty method of multi-scale toughening cement-based materials: Reactive powder concrete with endogenous whiskers. J. Build. Eng. 2022, 50, 104142. [Google Scholar] [CrossRef]
  47. Gu, K.; Chen, B.; Yu, H.; Zhang, N.; Bi, W.; Guan, Y. Characterization of magnesium-calcium oxysulfate cement prepared by replacing MgSO4 in magnesium oxysulfate cement with untreated desulfurization gypsum. Cem. Concr. Compos. 2021, 121, 104091. [Google Scholar] [CrossRef]
  48. Ba, M.; Gao, Q.; Ma, Y.; Zhu, J.; Du, Y. Improved hydration and properties of magnesium oxysulfate (MOS) cement using sodium silicate as an additive. Construct. Build. Mater. 2021, 267, 120988. [Google Scholar] [CrossRef]
  49. Zhang, N.; Yu, H.; Wang, N.; Gong, W.; Tan, Y.; Wu, C. Effects of low- and high-calcium fly ash on magnesium oxysulfate cement. Construct. Build. Mater. 2019, 215, 162–170. [Google Scholar] [CrossRef]
  50. Rahhal, V.; Talero, R. Very early age detection of ettringite from pozzolan origin. Construct. Build. Mater. 2014, 53, 674–679. [Google Scholar] [CrossRef]
  51. Rahhal, V.; Bonavetti, V.; Delgado, A.; Pedrajas, C.; Talero, R. Scheme of the Portland cement hydration with crystalline mineral admixtures and other aspects. Silic. Ind. 2009, 74, 347–352. [Google Scholar]
  52. Talero, R.; Pedrajas, C.; González, M.; Aramburo, C.; Blázquez, A.; Rahhal, V. Role of the filler on Portland cement hydration at very early ages: Rheological behaviour of their fresh cement pastes. Construct. Build. Mater. 2017, 151, 939–949. [Google Scholar] [CrossRef]
  53. Dionisio, A.K.; Gomes, C.M. Behaviour of autoclaved magnesium oxysulfate cement pastes. J. Build. Eng. 2023, 76, 107263. [Google Scholar] [CrossRef]
  54. Liu, T.; Li, C.; Li, L.; Fan, W.; Dong, Y.; Liang, H.; Yang, H. Effect of fly ash and metakaolin on properties and microstructure of magnesium oxysulfate cement. Materials 2022, 15, 1334. [Google Scholar] [CrossRef] [PubMed]
Figure 1. Laser PSD curves of LBM and filler Q: (a) differential and (b) cumulative curves.
Minerals 13 01240 g001
Figure 2. (a) Setting time and (b) fluidity of MOS cement with filler Q.
Minerals 13 01240 g002
Figure 3. (a) Heat dissipation rate and (b) total heat release of MOS paste with filler Q.
Minerals 13 01240 g003
Figure 4. XRD patterns of (a) MOSC, (b) MQ-5, (c) MQ-15 and (d) MQ-30 samples at early hydration stage.
Minerals 13 01240 g004
Figure 5. (a) Compressive and (b) flexural strengths, and (c) volume stability of MOS cement containing filler Q.
Minerals 13 01240 g005
Figure 6. (a) XRD patterns and (b) Rietveld plot of MOS cement with filler Q at 28-d.
Minerals 13 01240 g006
Figure 7. The (a) content of phase 5-1-7, periclase and brucite, and (b) crystallite size of phase 5-1-7 and brucite generated in MOS cement containing filler Q at 28-d.
Minerals 13 01240 g007
Figure 8. TG-DSC curves for the hardened MOS cement containing filler Q at 28-d.
Minerals 13 01240 g008
Figure 9. SEM images of the (a) pore and (b) matrix of MOSC, (c) pore and (d) matrix of MQ-15, and (e) pore and (f) matrix of MQ-30 samples at 28-d.
Minerals 13 01240 g009
Figure 10. (a) Differential intrusion volume vs. pore diameter, (b) cumulative intrusion volume vs. pore diameter of MOS cement with filler Q at 28-d.
Minerals 13 01240 g010
Figure 11. SEM images of the (a) MOSC and (b) MQ-15 samples at 10 h.
Minerals 13 01240 g011
Table 1. Ratios of raw materials for the synthesis of MOS cement pastes.
SamplesLBM/gMgSO4·7H2O/gH2O/gCA/gFiller Q/g
MOSC10048.445.80.5-
MQ-510048.445.80.55
MQ-1010048.445.80.510
MQ-1510048.445.80.515
MQ-2010048.445.80.520
MQ-3010048.445.80.530
Table 2. Pore structure characteristics of MOS cement with filler Q at 28-d.
SamplesTotal Pore Volume/%Pore Volume Distribution/%
<10 nm10–100 nm>100 nm
MOSC14.456.0974.2819.63
MQ-157.547.2381.6111.16
MQ-208.037.8681.5610.58
MQ-3010.378.2779.1912.54
Disclaimer/Publisher’s Note: The statements, opinions and data contained in all publications are solely those of the individual author(s) and contributor(s) and not of MDPI and/or the editor(s). MDPI and/or the editor(s) disclaim responsibility for any injury to people or property resulting from any ideas, methods, instructions or products referred to in the content.

