Article

Provenance, Depositional Environment, and Paleoclimatic Conditions of a Near-Source Fan Delta: A Case Study of the Permian Jiamuhe Formation in the Shawan Sag, Junggar Basin

1
School of Geology and Mining Engineering, Xinjiang University, Urumqi 830047, China
2
Key Laboratory of Central Asian Orogenic Belts and Continental Dynamics, Urumqi 830047, China
3
Exploration and Development Institute, PetroChina Xinjiang Oilfield Company, Urumqi 830014, China
4
CNOOC Research Institute Co., Ltd., Beijing 100028, China
5
Party Committee Office of Xinjiang Oilfield Company, Karamay 834000, China
*
Author to whom correspondence should be addressed.
Minerals 2023, 13(10), 1251; https://doi.org/10.3390/min13101251
Submission received: 3 August 2023 / Revised: 11 September 2023 / Accepted: 15 September 2023 / Published: 25 September 2023

Abstract

:
The science of the provenance, sedimentary system, and distribution of sand bodies is unclear, limiting oil and gas exploration. Here, we combined heavy mineral, rare earth element, petrographic, and outcrop data to shed new light on the provenance, depositional environment, and paleoclimatic conditions of the Permian Jiamuhe Formation. The provenance is characterized by “a main provenance system, and four provenance zones,” and this result could be interpreted from analyses of its seismic reflection, clastic composition, REES, and heavy minerals. A detailed sedimentological study performed in the excellent outcrops, a comprehensive analysis of logging, and the legalistic cores of this formation allowed for the identification of ten lithofacies and three lithofacies associations. Four distributary/underwater channels were observed. Furthermore, the redox and paleoclimatic conditions based on trace elements (Th/U, V/(V + Ni), V/Cr, Cu/Zn, Sr/Ba, and Sr/Cu) suggested a weak reduction in the environment, as well as semi-humid and semi-dry conditions of the Jiamuhe Formation. These conditions are also supported by the mudstone color and plant fossils. The tectonic setting belongs to the acid island arc area based on the trace element discrimination diagram of La-Th-SC and the values of the La, Ce, ΣREE, L/H, La/Yb, and (La/Yb)N criteria. The research results further confirm that there are differences in the mineral compositions in the same provenance area, and they provide a geological basis for the fine sedimentary facies characterization and a favorable zone prediction in this area.

1. Introduction

Sedimentary provenance studies began in the nineteenth century with the microscopic investigation of the heavy minerals of recent sands. A provenance analysis of sediments aims to reconstruct the parent rock assemblages of sediments and the climatic–physiographic conditions under which sediments are formed [1]. Sediments are complex archives of paleoclimate and related redox conditions [2]. The abundant characteristics of chemical components in sedimentary rocks are controlled by the parent rock and the source area, and the distribution law is dominated by exogenous factors and endogenous factors [3]. Major/trace element analyses are indispensable in provenance and paleoenvironment studies [4,5,6]. Therefore, we can use geochemical indicators, such as trace elements, triangulation diagrams, and REEs, to complete an inversion of a depositional environment and provide evidence for further research [7].
Some researchers have made significant contributions to the study of provenance systems using light minerals, single minerals, and geophysical methods [8]. With the complex process of a sediment source–sink system, it is difficult to recover the complete provenance information with a single provenance analysis, resulting in multiple solutions [9,10]. Therefore, scholars are more likely to use multimethod, comprehensive analyses with the integration of multiple aspects, such as petrology, heavy minerals, and trace element combinations [11]; heavy minerals and clastic zircon dating [12]; and multimineral assemblage analyses [13].
The deposits of the Junggar Basin have been widely studied since the 1950s. Great advances have been made in slope zone studies because this is the main oil and gas production area [14]. It was not until 1990 that oil and gas in the Junggar Basin began to be studied. The Jiamuhe Formation contains a tectono-stratigraphic sequence [15], and the geochemical characteristics of the source rocks [16,17] and a high-quality reservoir [18] have been reported in an important number of excellent studies. However, studies on its provenance and depositional environment [19,20,21] are scarce, as are studies about its paleoclimate. In that sense, the present study attempted to fill a geological and paleoenvironment gap, proposing an overview of the Jiamuhe Formation based on provenance, sedimentological, redox condition, and paleoclimatic analyses of the Jiamuhe Formation. In summary, this study aimed to improve the understanding of the entire denudation–transport–deposition process on the western slope of the Shawan Sag.

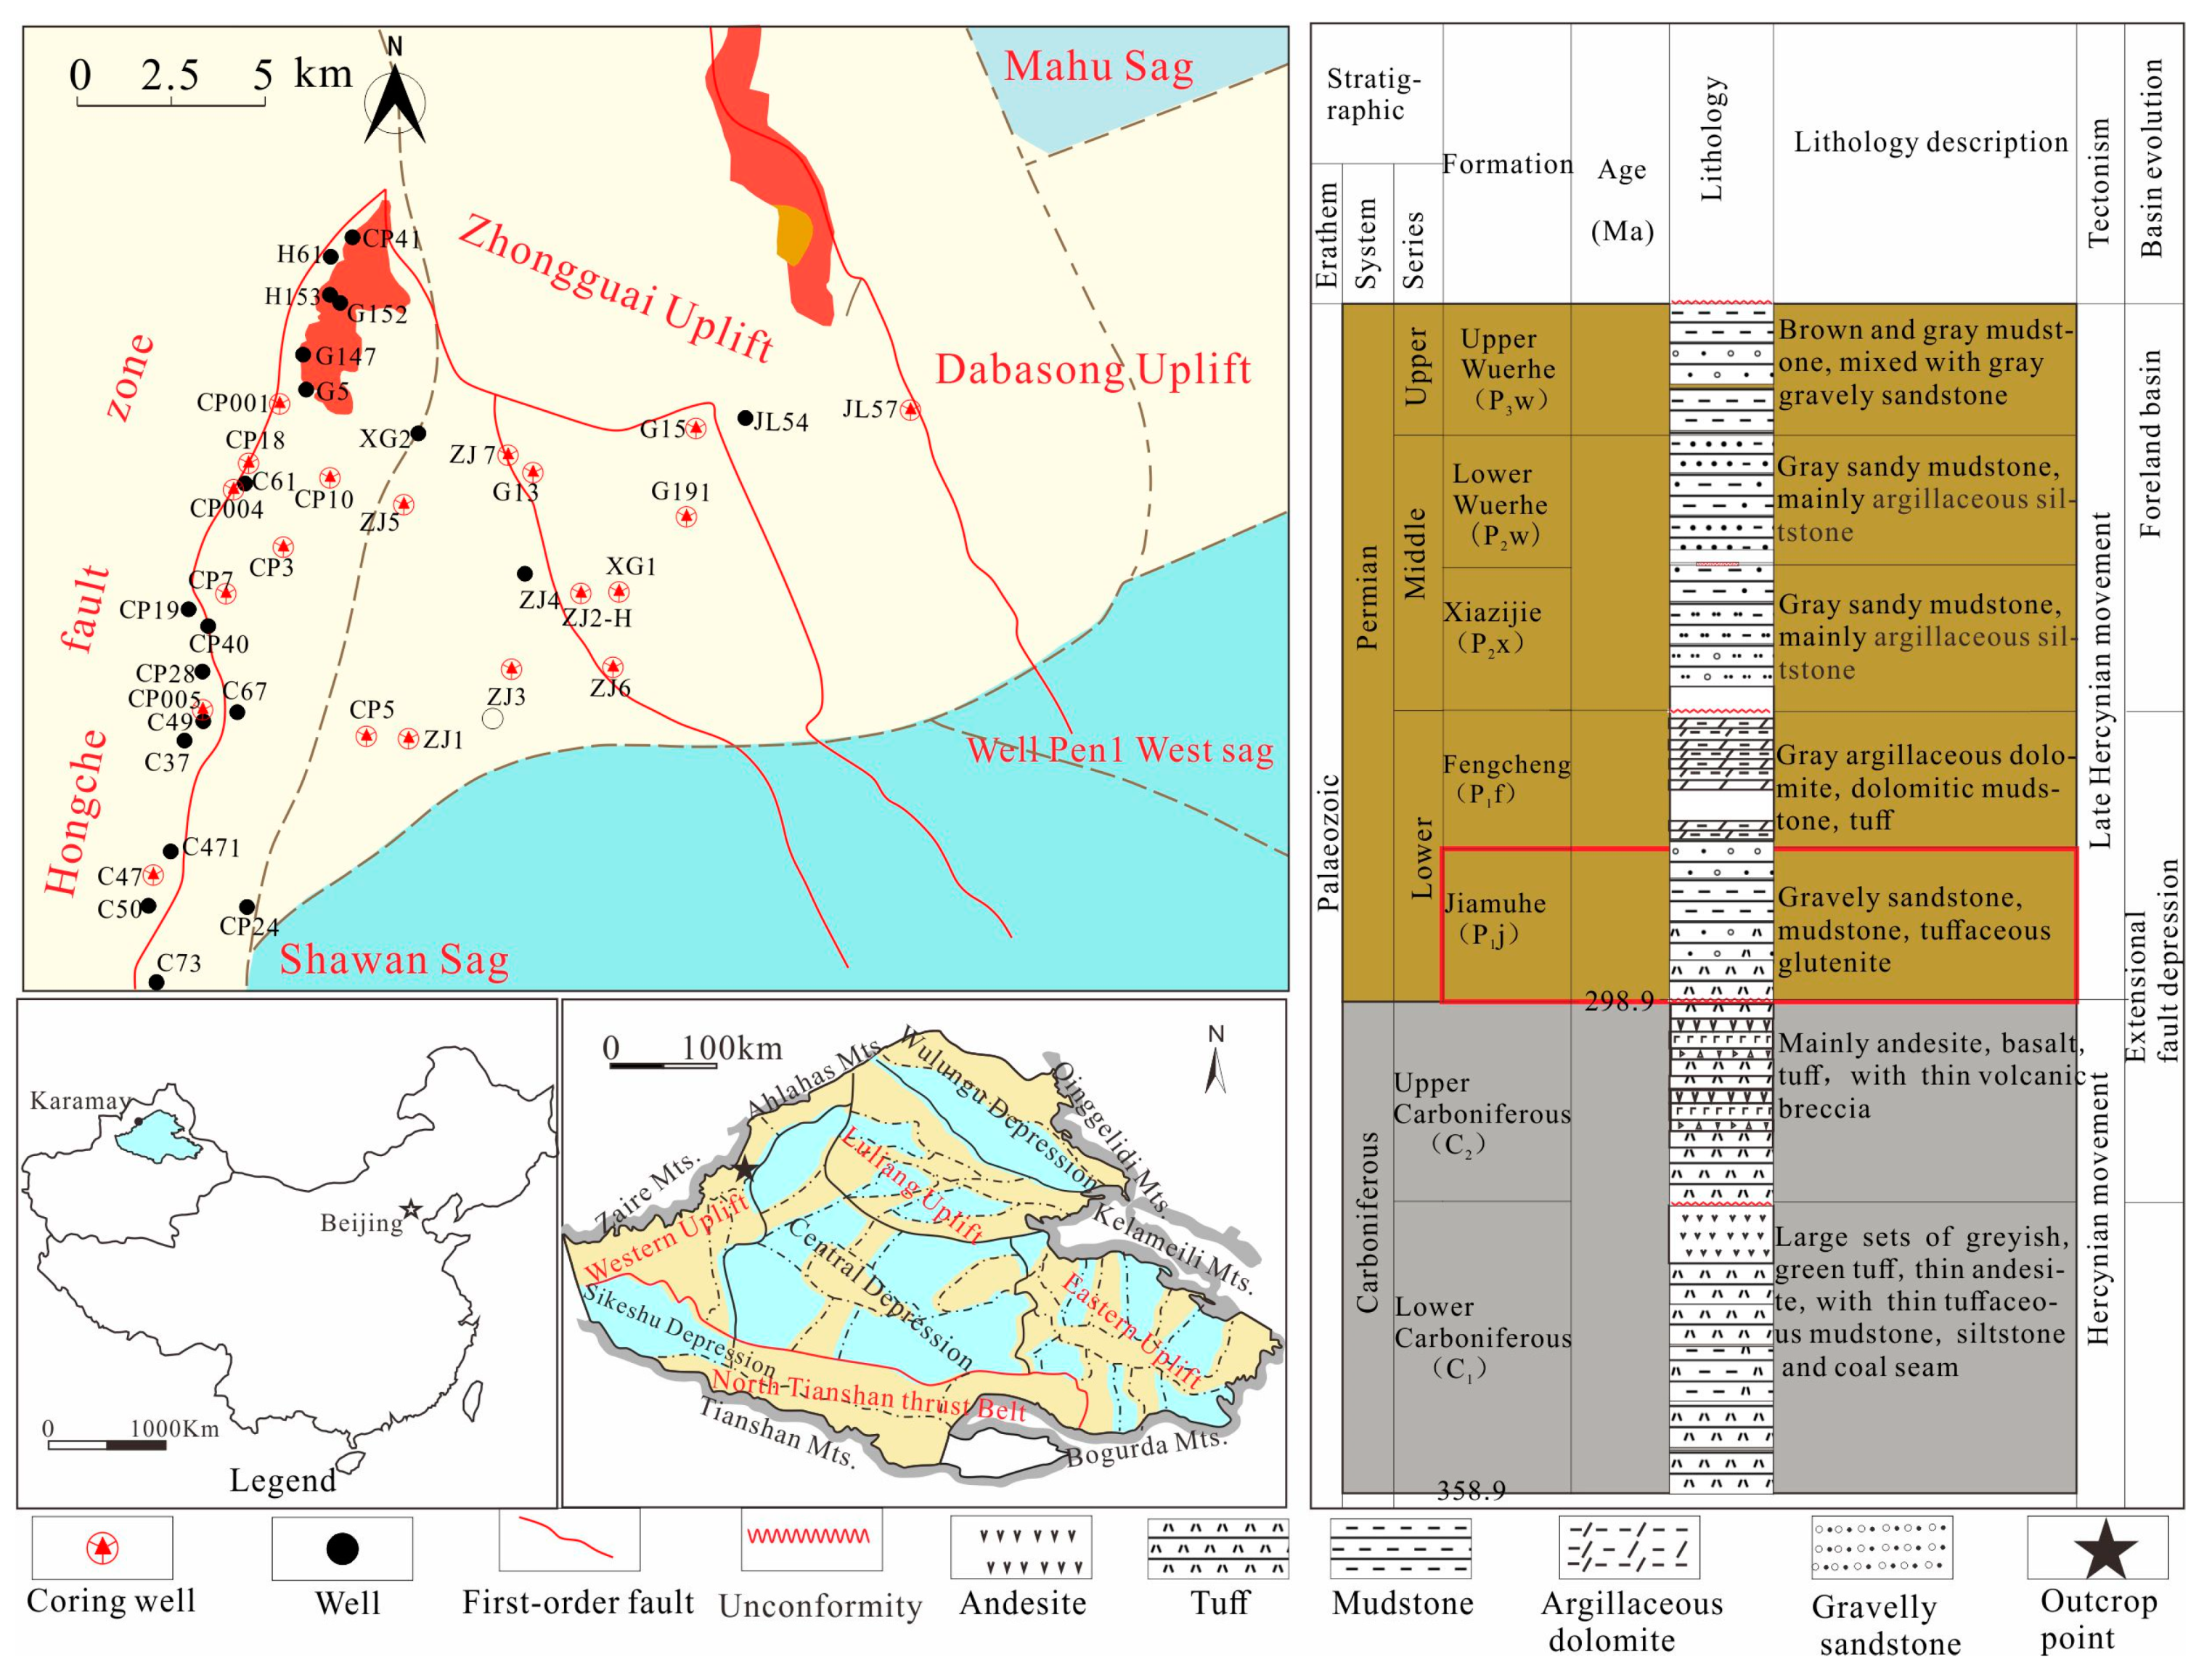
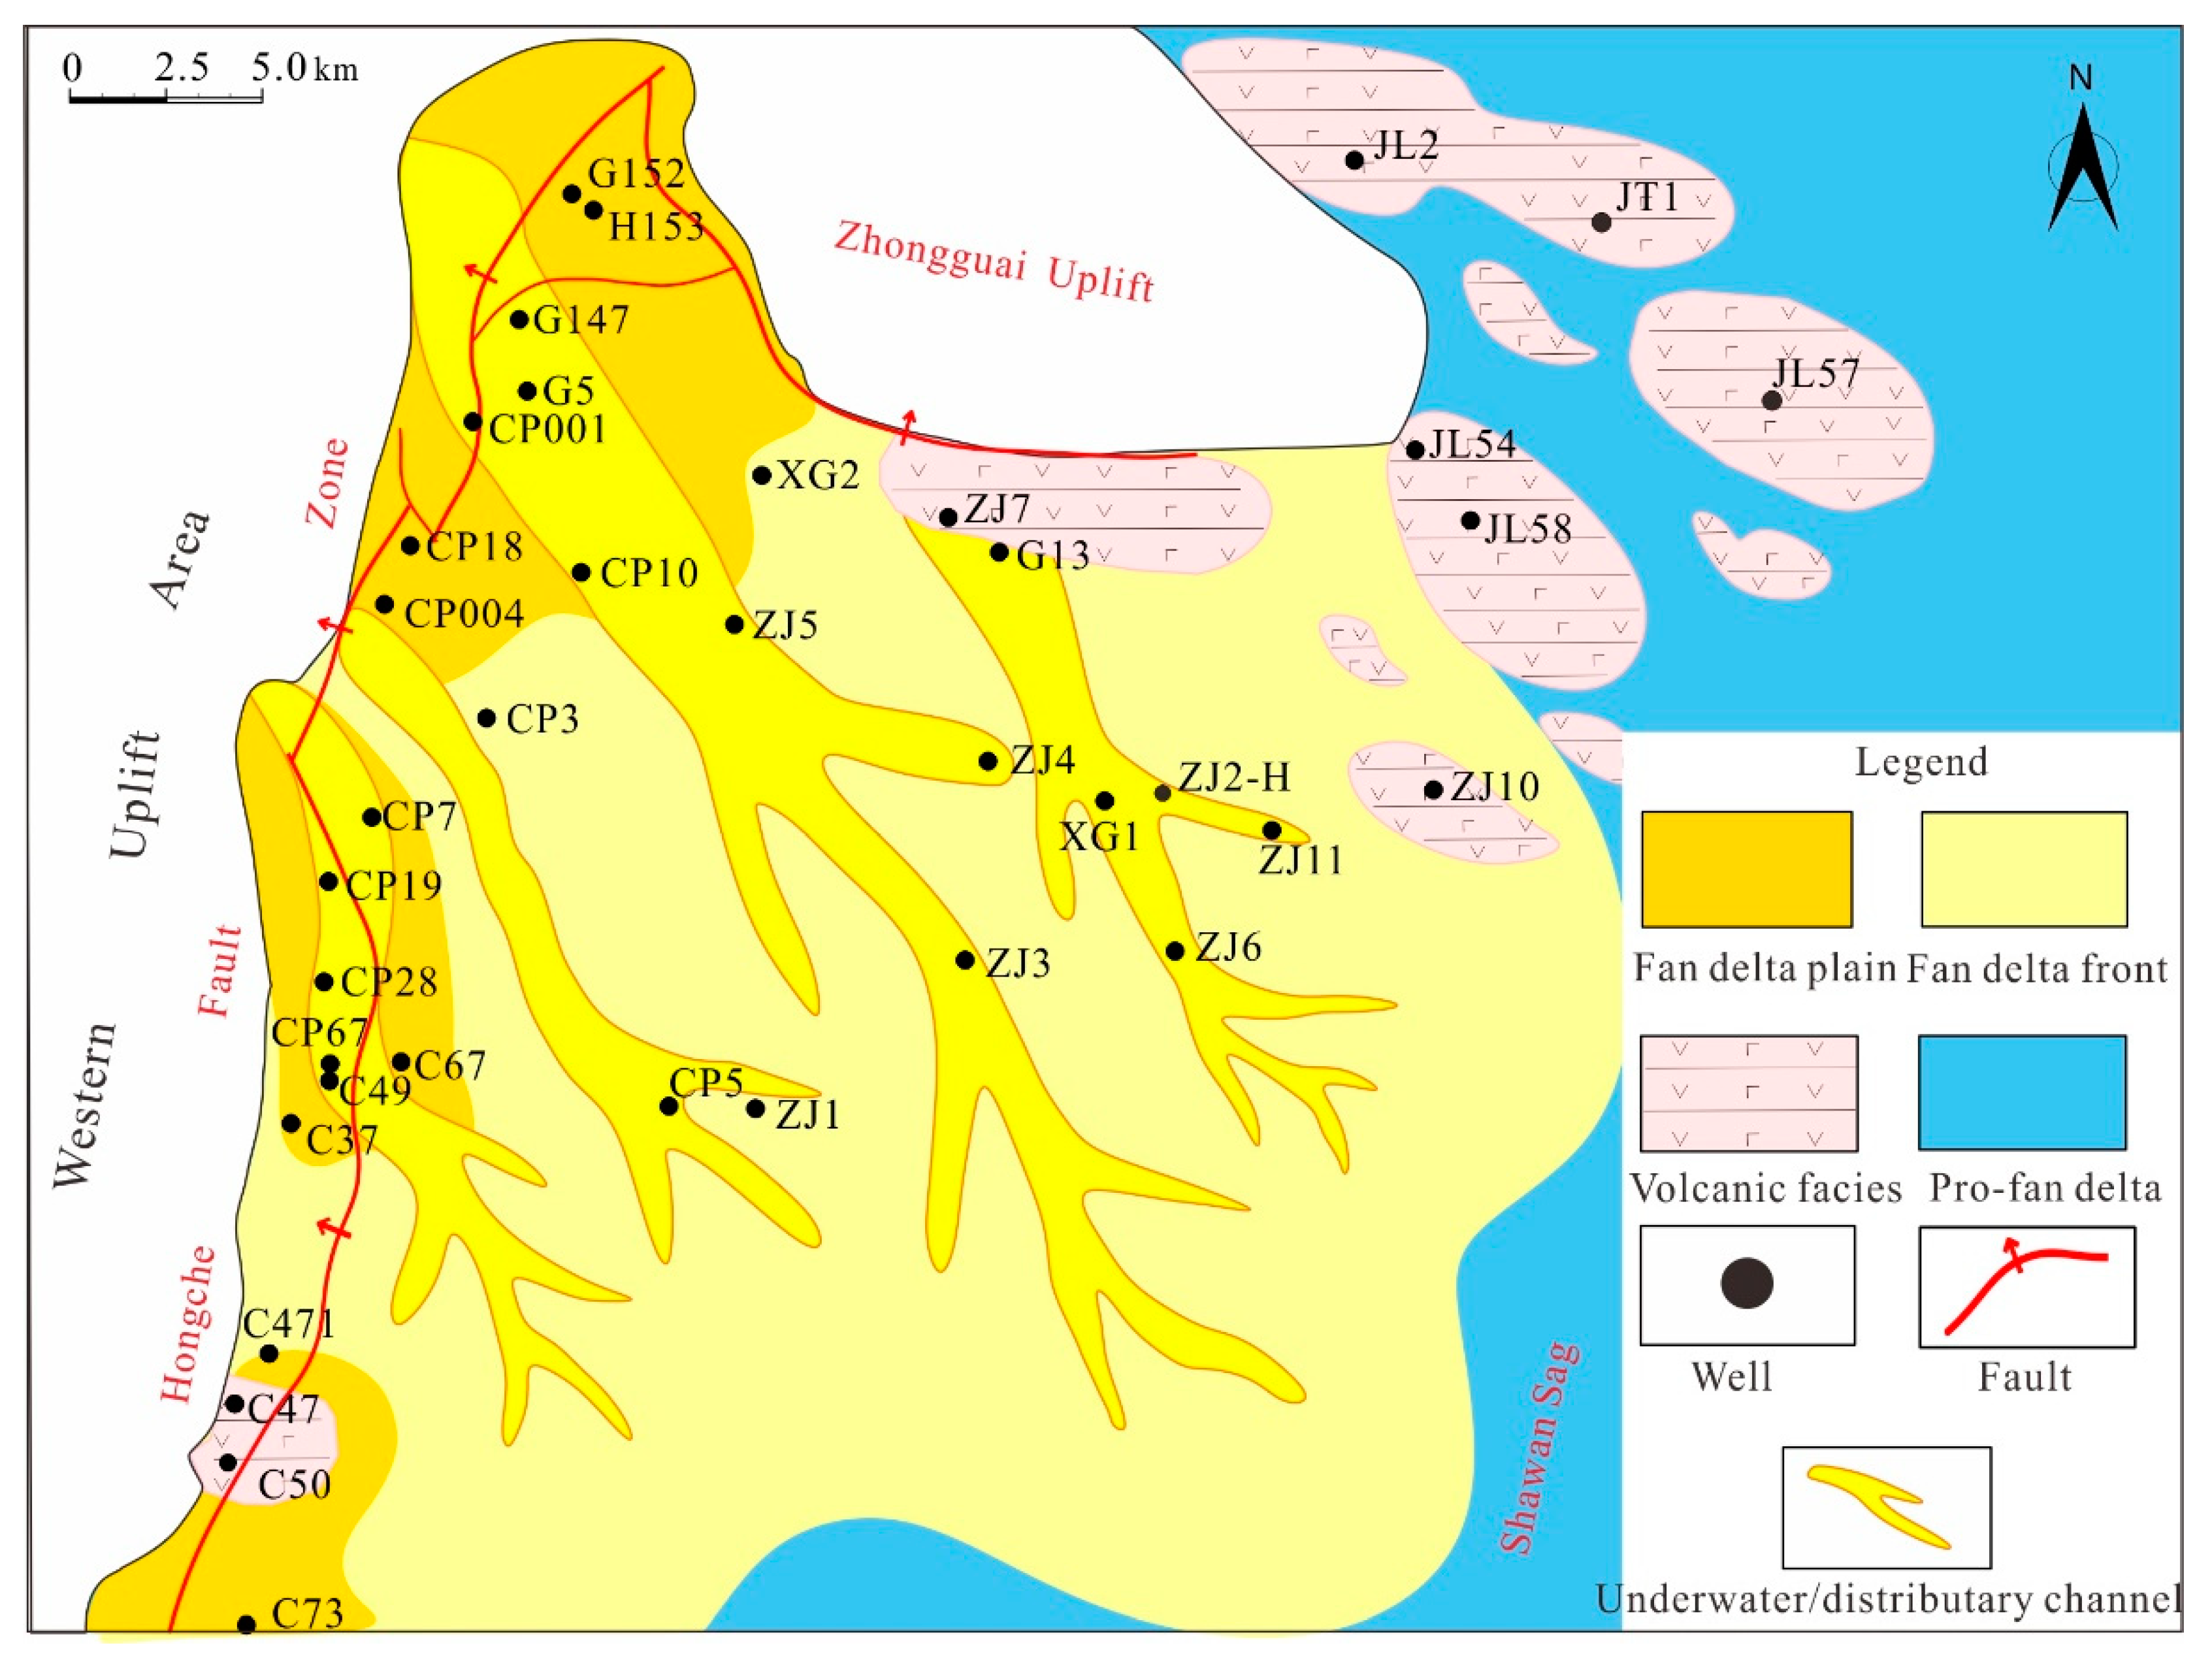
2. Geological Setting

The Junggar Basin is located in the western portion of China. Since its formation, the Junggar Basin has been influenced by Hercynian, Indosinian, Yanshanian, and Himalayan movements, with the Indosinian and Yanshanian movements being the most intense [22], which caused the Shawan Sag to be in the stage of fault-controlled subsidence development during the Permian period [23].
The geological evolution of the Shawan Sag can be divided into seven stages: the Late Carboniferous was an extensional fault-controlled subsidence stage, the Early Permian was an extensional depression stage, the Middle Permian to Late Triassic was a foreland basin stage, the Jurassic was an intracontinental depression and compression torsion basin stage, and the Cretaceous was a Paleogene intracontinental depression and Neogene Quaternary intracontinental foreland basin stage [15]. In the Early Permian, the basin inherited extensional fault depression activity [24]. Because of the principal stress from NWW to NEE in the northwestern zone [25], the basin acted on the transitional zone of the Shawan Sag in the form of a structural wedge [15].
The Shawan Sag developed from the Carboniferous to the Quaternary stages, from bottom to top. The Permian stage can be subdivided into five formations. The Lower Permian Jiamuhe Formation is consistent with the Carboniferous stage, and the Jiamuhe Formation (P1j) and Fengcheng Formation (P1f) are in mostly overlapping contact [16] (Figure 1). As the Lower Permian Jiamuhe Formation is one of the main hydrocarbon-generating layers of the Permian [26], its oil and gas development is active, and recent exploratory wells have yielded highly productive oil and gas areas, with the potential for large-scale exploration [15].

3. Methods and Dataset

This study was based on a broad dataset acquired and provided by the PetroChina Xinjiang Oilfield Company, which included data on 23 cored wells, logging data, and 3D seismic data. Basic logging data were available for each well, which allowed for the verification and analysis of combined well–seismic calibration. The analyzed outcrop sections were obtained from the Baiyang River. The stratigraphic column locations were obtained using a handheld GPS device, and the measurement data were obtained using a long tape. The sedimentological analysis was derived mainly from the data collected during core and field trips, and it was based upon the study of facies/lithofacies associations and their spatio-temporal distribution. In doing so, it was possible to recognize lithofacies and lithofacies associations, categorize boundary surfaces, deduce the sub-environments, and, finally, define the depositional environment. The terms “facies” and “lithofacies associations” followed the classic criteria and methodology established by Miall in 1996 [27].
Twenty thin sections for the clastic composition of the central Asian orogenic belts and continental dynamics were achieved using a field-emission scanning electron microscope (Sigma 300) in a key laboratory. The preparation and testing of 7 core samples for the REEs and 11 core samples for the heavy minerals analyzed were conducted by Beijing Standard Energy Co., Ltd. (Beijing, China). The sampling information is presented in Table 1 and Table 2, and the mineral characteristics were described, tested, and named for provenance analysis proposes in a tectonic setting. The cluster analysis was performed using the Hungarian clustering algorithm [28]. The multidimensional scaling analysis (MDS) followed the Kruskal algorithm [29], and the principal component analysis (PCA) referred to the study by Aitchison (1983) [30]. The Hf-La/Th identification was used for the provenance region [31], and the rare earth elements (REEs) were obtained using XRF-1800 and PQ-MS Elite ICP-MS (Jena, Germany). In the data analysis, the tectonic setting referred to the La-Th-Sc identification map established by Bhatia and Crook (1986) [32].

4. Results

4.1. Provenances

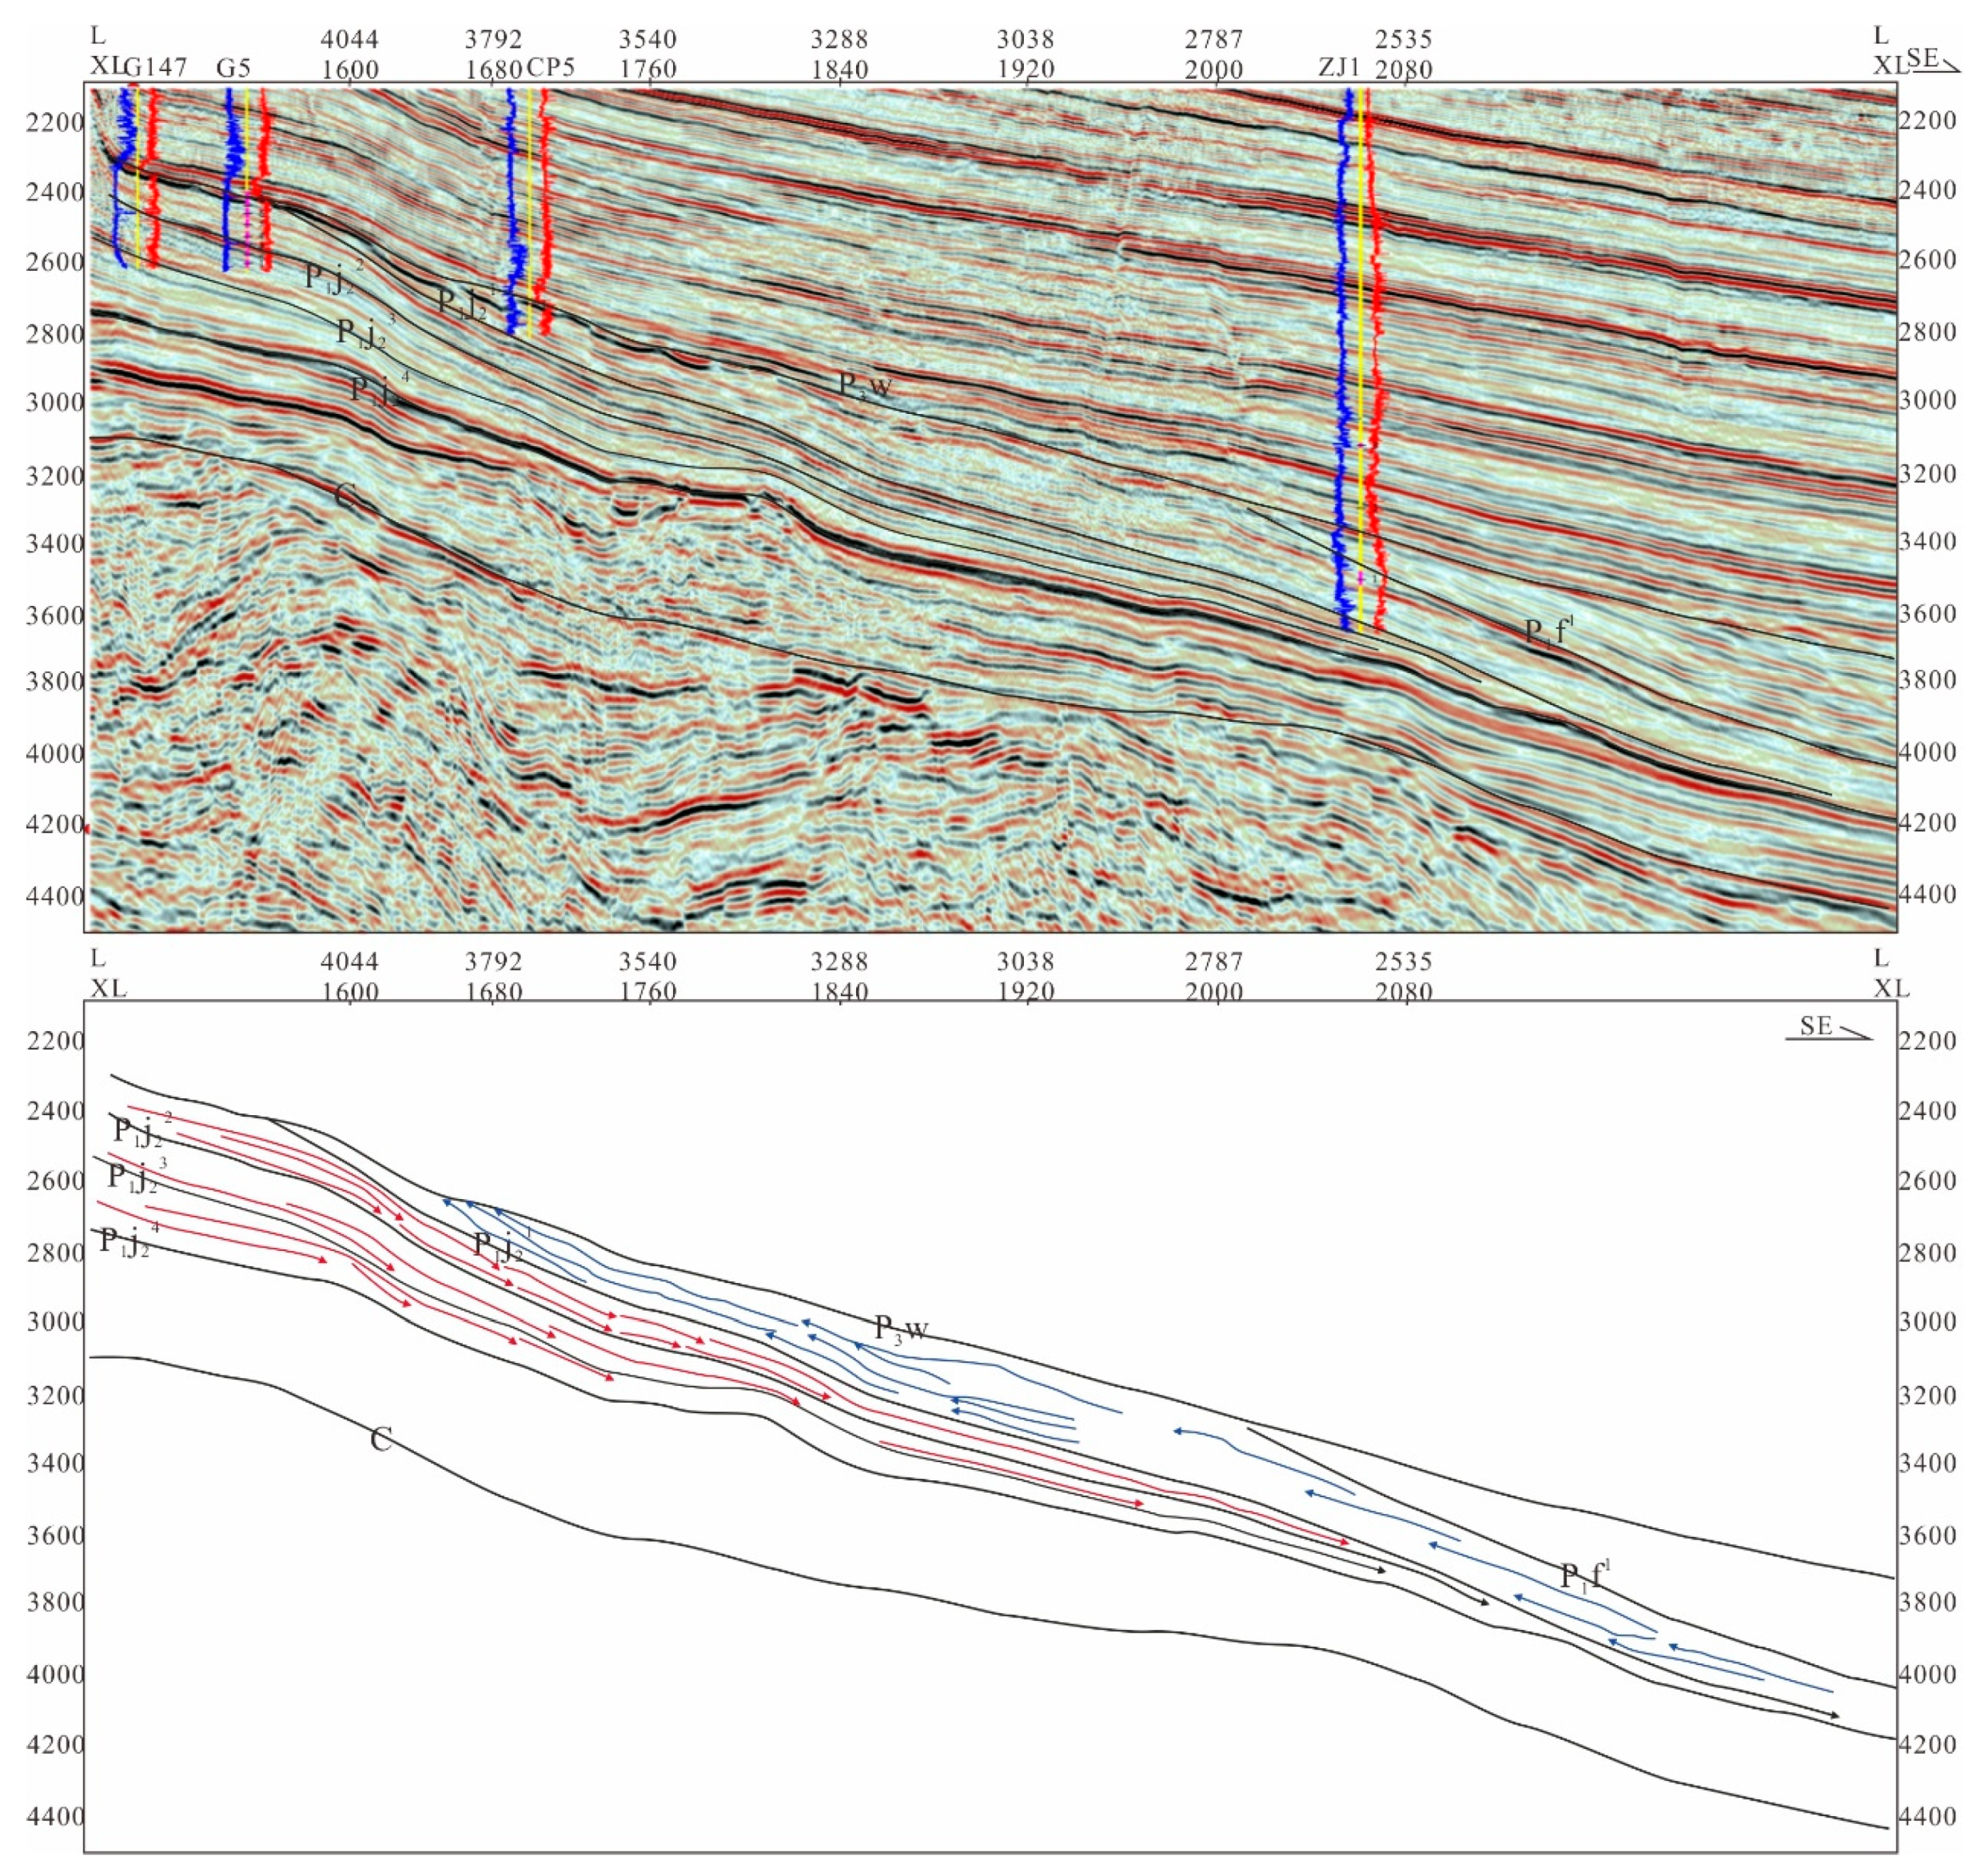
4.1.1. Seismic Reflection Characteristics
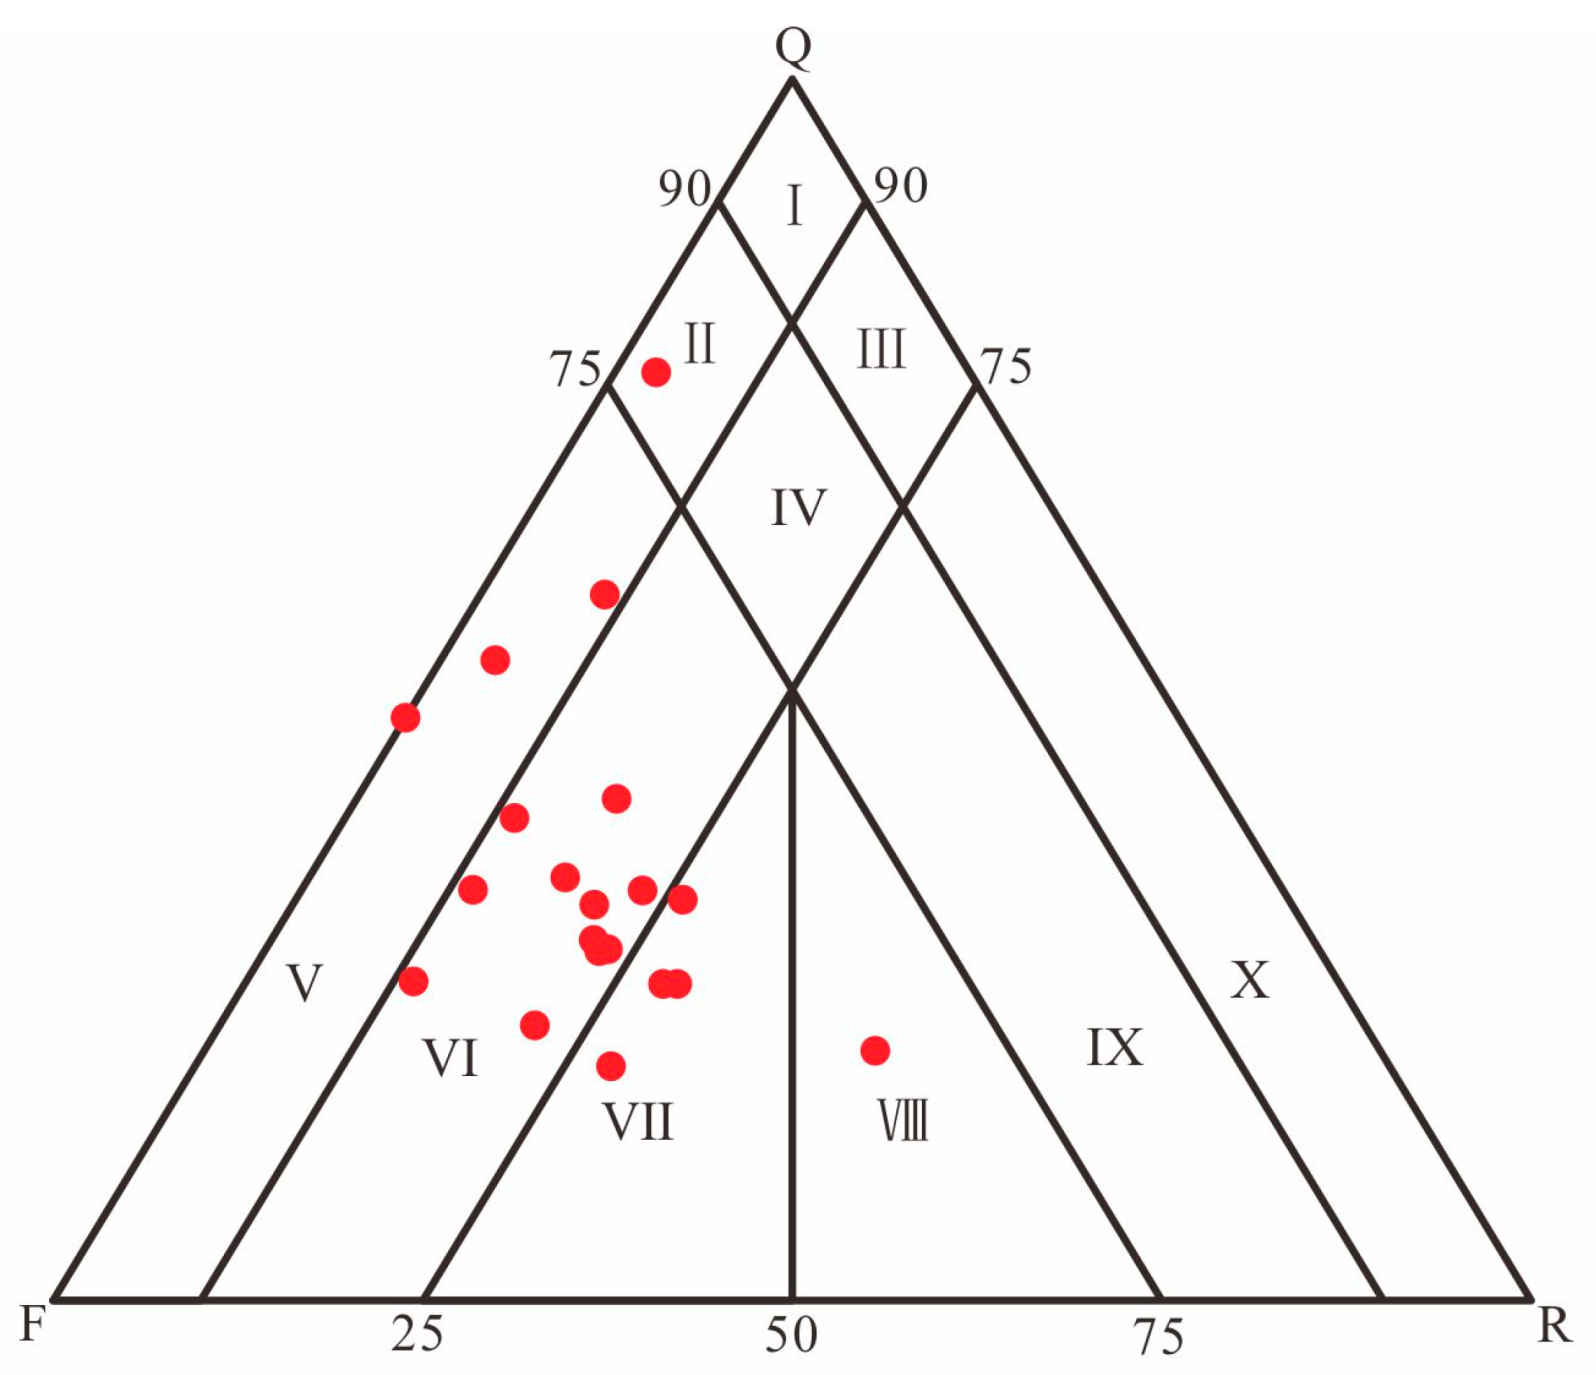
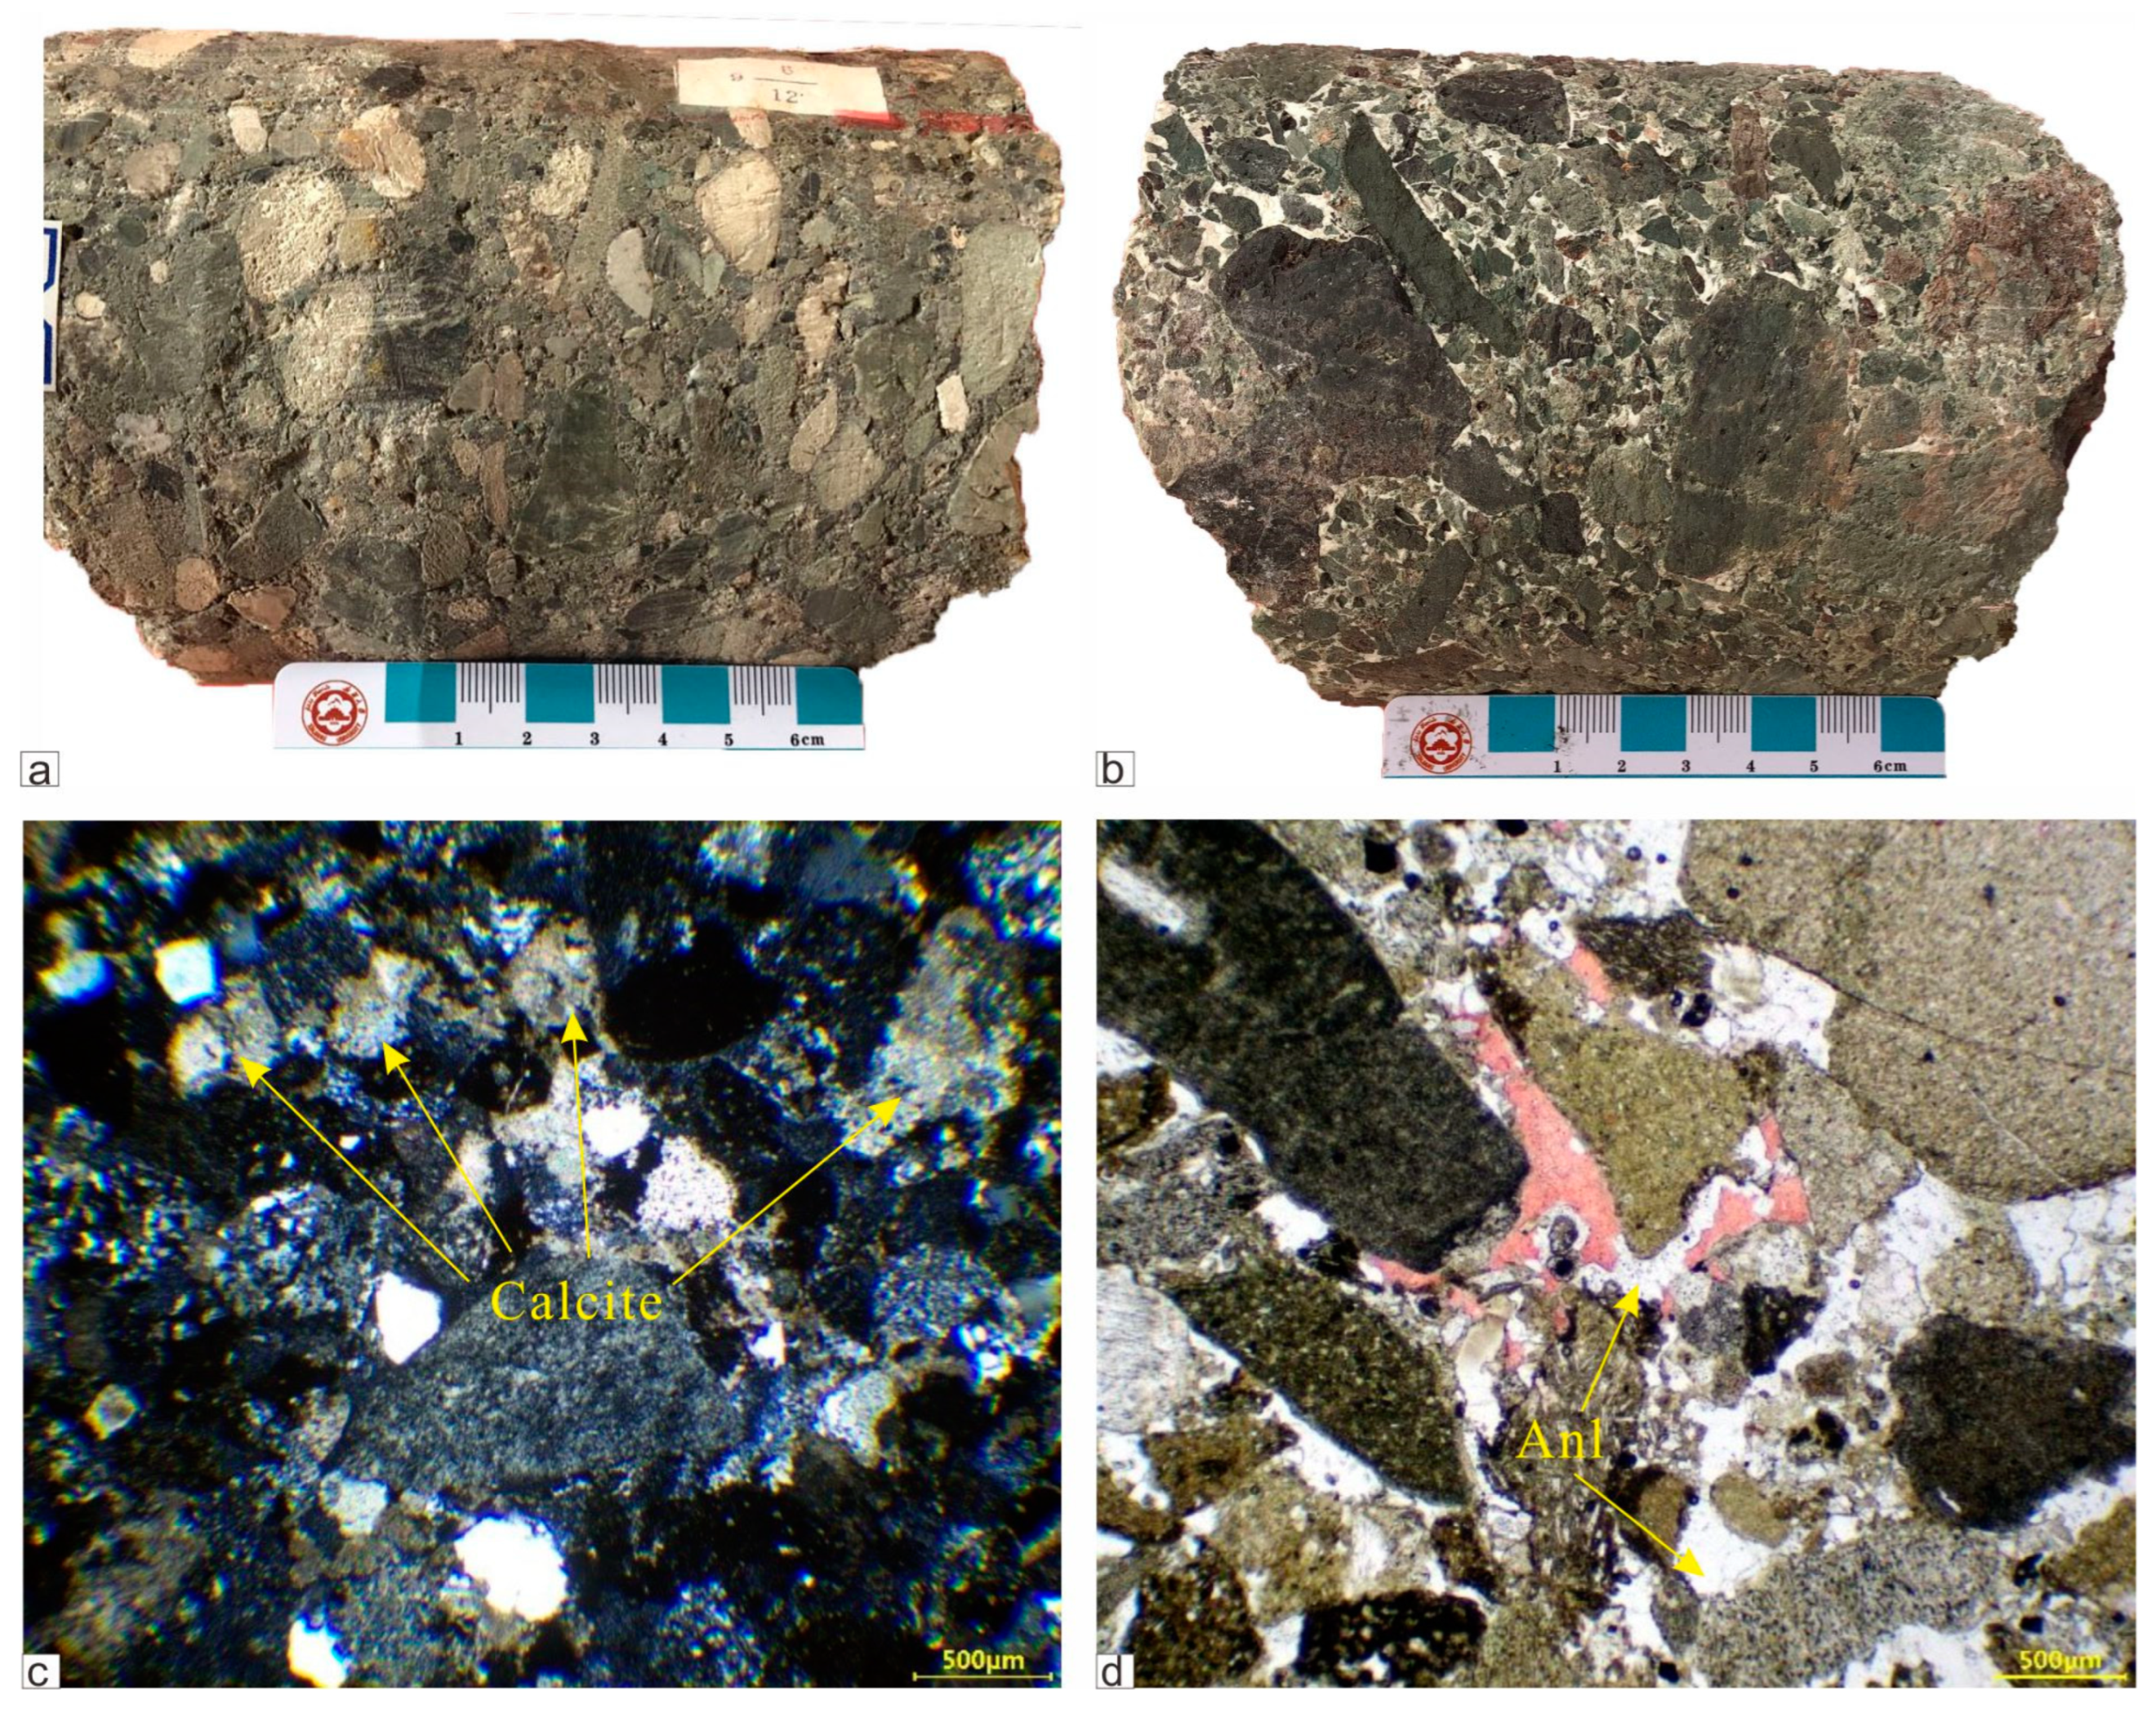
Yu (2020) discovered that the paleoslope is higher in the northwest than in the southeast, providing favorable conditions for progradation [34]. The seismic progradational reflection can be used to guide the paleocurrent direction [35]. Based on the calibrated single-well synthetic records, a geological seismic associative well profile of the well G147-G5-CP5-ZJ1 was established. Through 3D seismic reflection characteristics that indicated flows from northwest to southeast, we were able to accurately establish the locations of the source areas. However, there was an obvious onlap phenomenon in P1j21, with an obviously thickened layer, that was caused by the rising lake level (Figure 2).

4.1.2. Petrography

Texturally, there were fine-to-coarse-grained particles (grain sizes ranging from 0.0625 to 32 mm). The gravelly sandstone framework consisted of rounded to subangulose grains with point and tangential contacts and very-well-to-moderate sorting. The interstitial pore spaces appeared to be filled by both matrix and cement. The matrix was composed of quartz, feldspars, and cement. According to the compositional analysis and following the classical point-counting method, the feldspar content was 15.48–59.02%, and the average content was 43.2%, with potassium feldspar and plagioclase accounting for 43.2% of the total. The feldspar had a self-shaped distribution between the particles and mild mud characteristics. The quartz content was 19.15–57.77%, with an average content of 35.41%. The content of rock debris ranged from 0 to 45.42%, with an average content of 18.71% (Figure 3). The point counts showed mainly lithic feldspar sandstone, with some feldspar sandstone and lithic feldspar sandstone.
There was tuffaceous volcaniclastic sedimentary rock debris in the core. Lu (2018) provided ages ranging between 313.2 ± 2.3 and 291.8 ± 3.5 Ma for the archaic age information conforming to the root of the batholith [21]. The laumontites were mostly developed in the extrusive rocks, and the standard type characteristics of quartz were present (Figure 4). Regarding the type of rock fragments, virtually all the evidence showed a dominant percentage of extrusive rocks. This view also confirmed that the Jiamuhe Formation is dominated by near-source sediments.

4.1.3. Trace and Rare Earth Element Characteristics

The provenance area was examined using La/Sc and Th/Sc values [36]. The average values were 2.7 and 0.63, respectively. The ΣREE values ranged between 115.56 and 232.99 mg/L, with an average value of 139 mg/L, which was close to the average value of the upper continental crust (UCC) (148.14 mg/L) (Table 1). The application of the analyzed data to the tectonic provenance plots (Hf -La/Th) was established by Taylor in 1985 [31], and the trace element La/Sc-Co/Th conclusion is consistent with the study by Wang in 2018 [37], all of which confirmed that the provenance belongs to the source area of acidic rocks (Figure 5 and Figure 6).
REEs are often considered nonmigrating, showing slight changes during sedimentation. Therefore, they can be used as important reference evidence for a sediment provenance [32]. The Eu anomaly (Eu/Eu*) and the distribution patterns of REEs can sensitively reflect the geochemical status and be used as important parameters to identify the provenance. The Eu/Eu* values of the Jiamuhe Formation are in the range of 0.8–1.75, with an average of 1.19 as a negative anomaly, which is mainly caused by the absence of Eu elements in the upper crust (caused by element differentiation) (Table 2) [38].
After standard treatment of the samples using the standardized value of chondrite [38], the entire distribution pattern showed a right-leaning pattern, with an REE pattern the same as that of acid rock, indicating that the provenance was from the acid provenance area (Figure 7). Furthermore, the values of L/H, Ce/Ce*, and La/Yb were in the range of 4.49–7.26, 0.52–0.99, and 4.81–18.98, respectively, indicating that the study area was a shallow to semi-deep lake environment with freshwater injection under the influence of volcanic hydrothermal activity.

4.2. Heavy Mineral Characteristics

The detrital heavy mineral data for the Jiamuhe Formation sediments are summarized in Table 2, and they are graphically shown in Figure 8. The heavy mineral assemblages of the study area could be divided into four categories. The parent rock type and provenance system were determined using Q-type cluster, MDS, and PCA.

4.2.1. Q-Type Cluster Analysis of the Heavy Minerals

A cluster analysis is an important unsupervised learning method with the aim of identifying the “natural grouping” of datasets called “clusters,” which are sets of similar elements. Objects in the same cluster are highly similar, while objects in different clusters have great heterogeneity [39]. The distance of cluster recalibration can reflect the degree of homology between samples. The closer the calibration distance, the stronger the sample’s homology, and vice versa.
To determine the homology of the provenance in the study area, the Hungarian clustering algorithm was applied [28]. After removing the abnormal heavy mineral data, the Q-type cluster analysis pedigree of the heavy mineral data of nine wells was obtained (Figure 9). Based on the principle that the distance between centers of gravity must be large and that the number of classifications should be in line with the purpose of use, all samples could be divided into four categories when the clustering recalibration distance was within the range of 15–20 (Table 3).

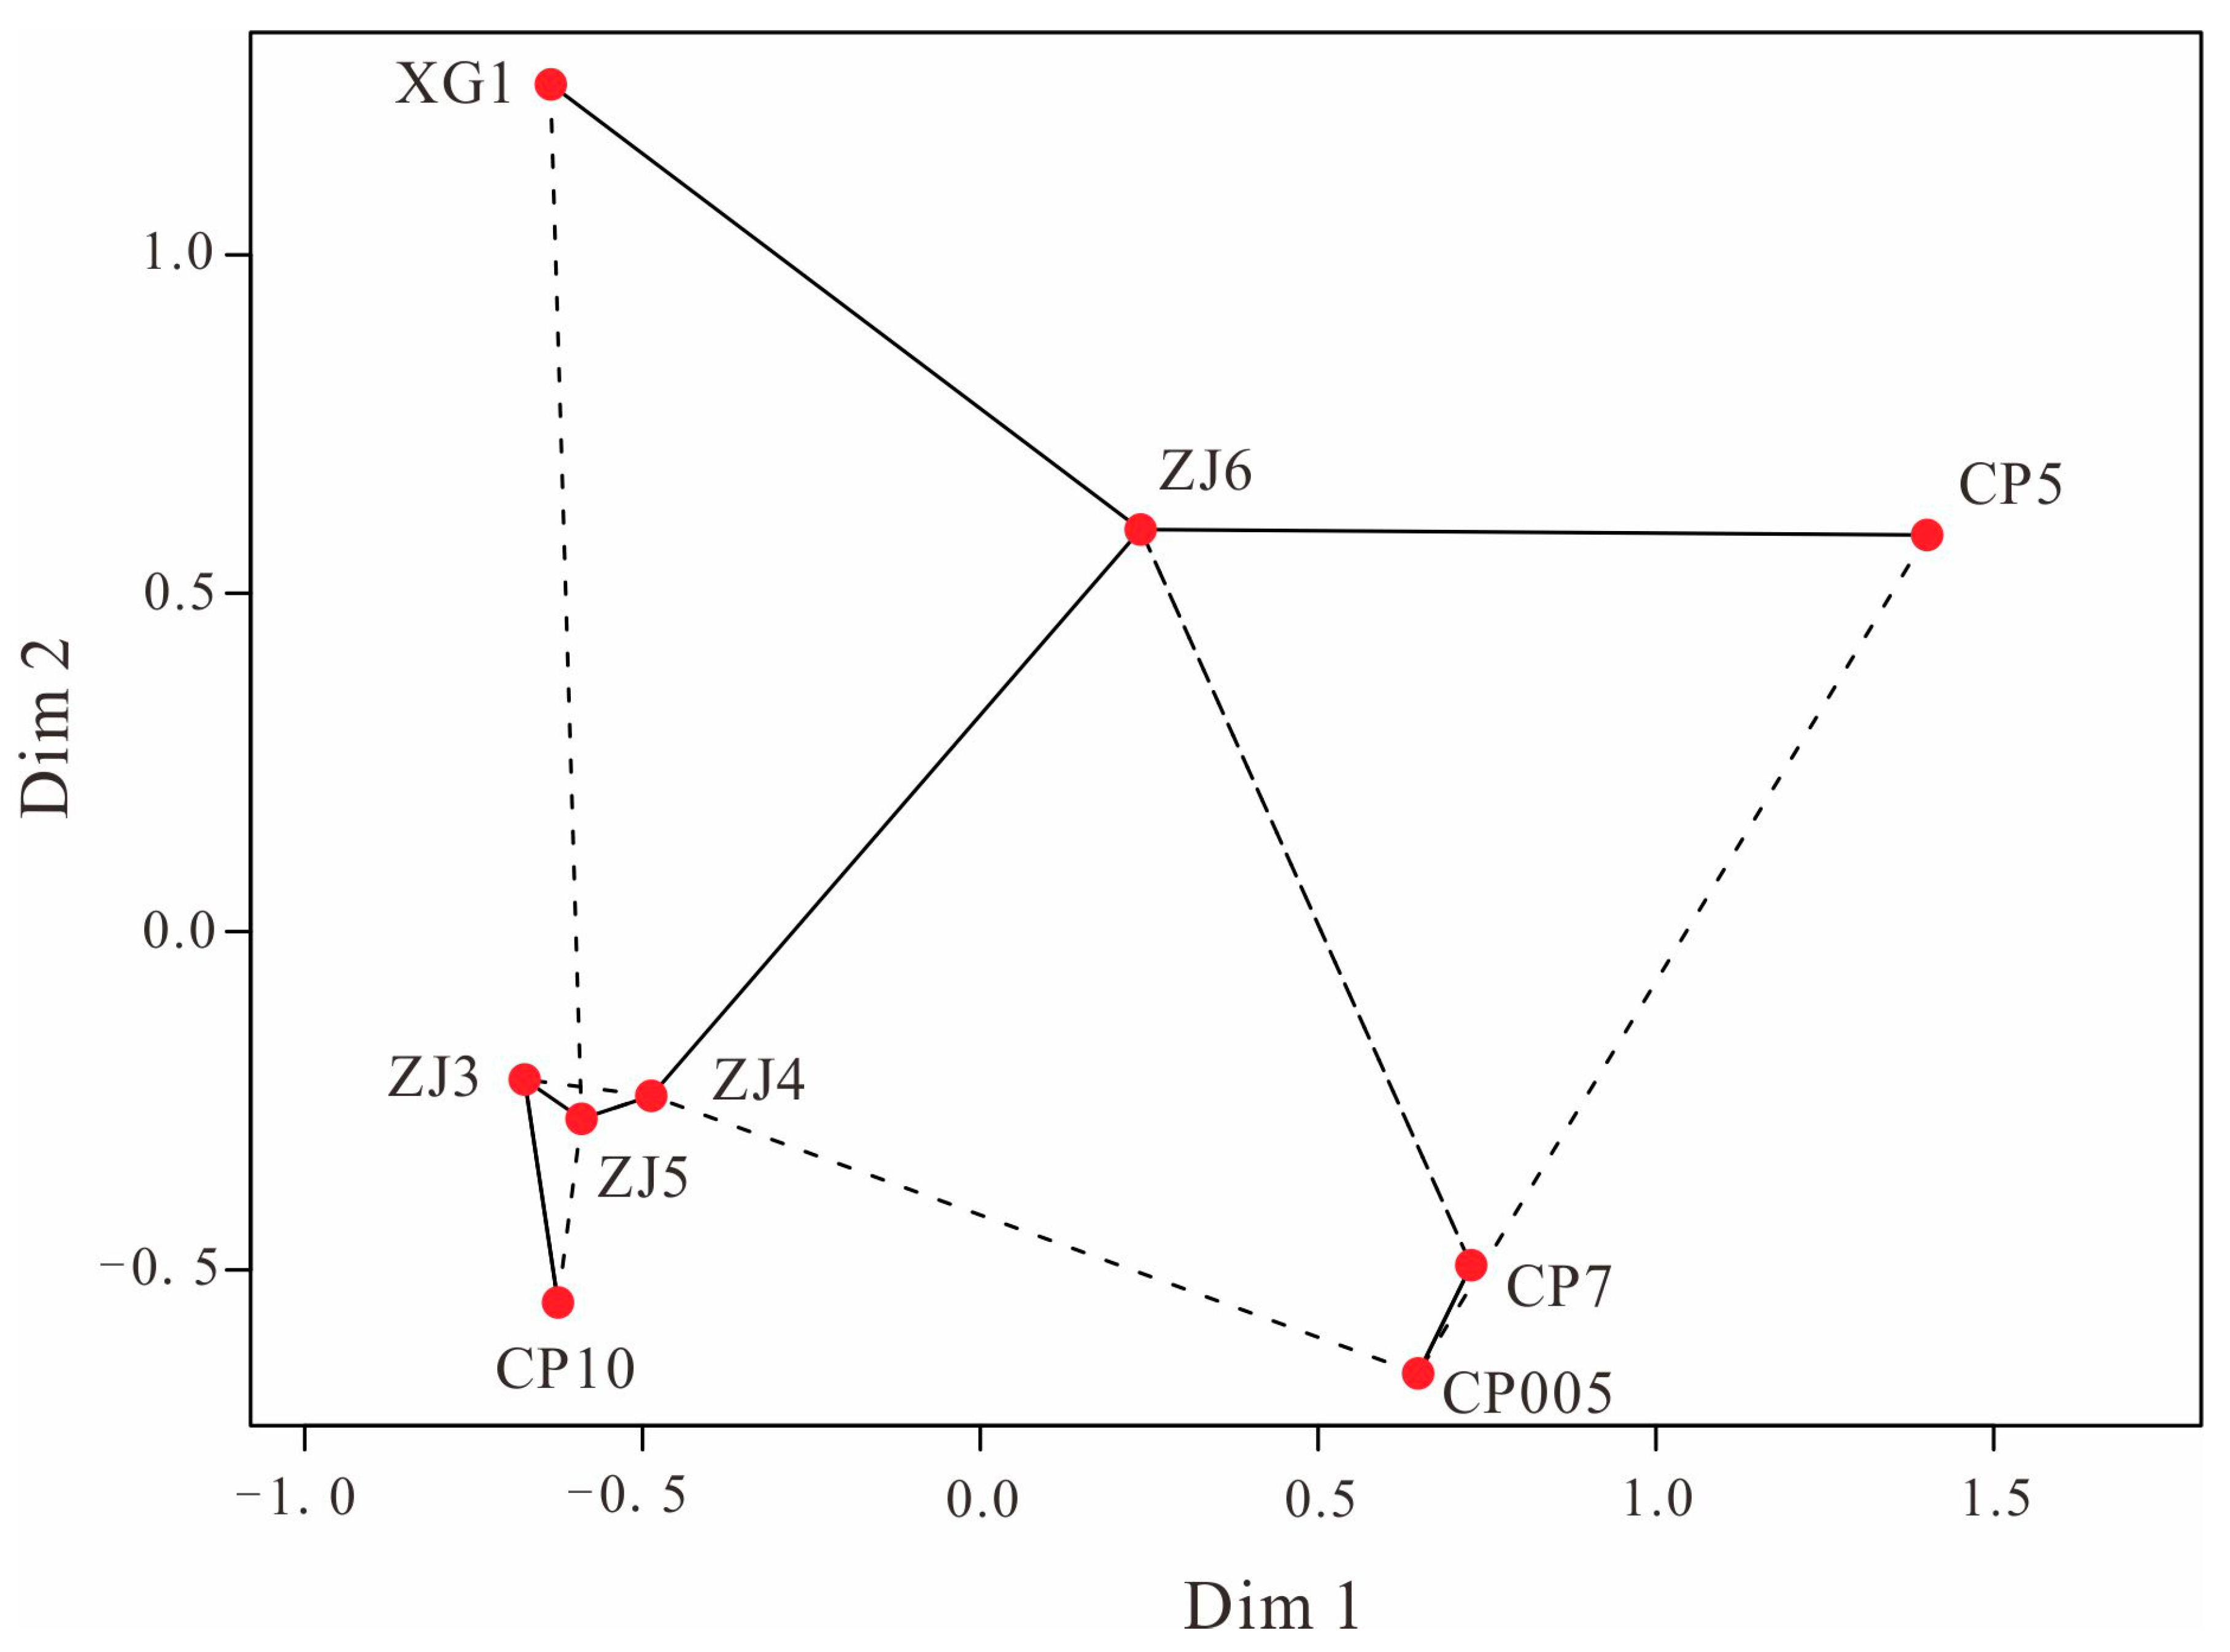
4.2.2. MDS and PCA of the Heavy Minerals

The MDS method was proposed by Torgerson in 1958 [40], but the Kruskal algorithm is currently the most widely used method [29]. The principle is to develop a distribution diagram of the research objects in space and observe the coincidence relationship between the Euclidean distance between the points in the graph and the known anisotropy measurement [41]. If the distance between two points is short, then it means that the corresponding two entities are similar; otherwise, the two entities are different [42]. In this study, the data were distributed in the form of points at specific locations in space that could intuitively reflect the provenance information [43].
With the help of SPSS20.0 software, the MDS results for 11 types of heavy minerals were obtained (Figure 10). ZJ3, ZJ4, ZJ5, and CP10 were connected by solid lines and had short distances between them. The Dim1 and Dim2 values were approximately −0.5 and −0.5–0, respectively, indicating a close homologous relationship. CP7 and CP005 were connected by a solid line and had a short distance between them. The Dim1 and Dim2 values were approximately 0.5 and −0.5, respectively, reflecting a close homology. ZJ6 and XG1 were connected by a solid line, and the Dim1 and Dim2 values were −0.5–0.5 and 0.5–0.15, respectively. Although the range span was larger than that of the former, they could still show a relative homology, and CP5 was far away from the other wells, with poor homology.
PCA is a statistical method that can display the relationship between input variables, with the advantage of the results being displayed as a biplot [30]. Herein, the heavy minerals were analyzed using PCA. The dataset distribution was similar to the MDS results’ distribution (Figure 11). In conclusion, the heavy minerals of the Permian Jiamuhe Formation in the Shawan Sag could be divided into four categories (Table 4). Except for the ZJ6 well, which was abnormal in the PCA plot, the other wells demonstrated high coincidence. This showed that the research area could be further divided into four zones under the same provenance, namely, “one provenance area, four provenance zones” (i.e., the ZJ3-ZJ4-ZJ5-CP10, CP7-CP005, ZJ6-XG1, and CP5 provenance zones).

4.3. Lithofacies and Lithofacies Associations

Taking into account lithology, texture, internal arrangement, and geometry, up to ten types of lithofacies were identified, and they followed the nomenclature established by Miall in 1996 [44]. A special sedimentary phenomenon whose main characteristics are summarized in Figure 12 was also identified. The meanings of the letters involved in the lithofacies associations refer to the studies by Tan (2014) [45] and Yao (2021) [46]. Spatio-temporal relations between the identified lithofacies allowed for the description of three lithofacies associations that were useful for developing a better understanding of and observing the depositional environments and sub-environments (Figure 13).
Interpretation: The deposits characterizing FA-1 were always observed immediately above large erosion surfaces that were interpreted as distributary channels. The channels were filled with sandy and conglomerate sediments constituting the associations. The lag deposits, immediately above the basal erosion surface are, obviously, indicative of the erosional processes that occurred within the channel. They represent the remains of what the current could not transport. Above them, the conglomerates with Gcm represent a short distance of transport with a lack of energy, and they were not yet thoroughly washed. Finally, the Gcs indicate a slowed degree of the slope, and the stable hydrodynamic conditions allowed conglomerates to be transported to certain distances. The conglomerates were washed thoroughly, and the mudstone content was low. The stacking of the sequence capped by erosional surfaces with high angles reflecting the superposition of several discharge events resulted in the multiepisodic infill of the channel. The color of the matrix-filled interconglomerates was mostly reddish brown, reflecting the oxidizing environment at that time.
FA-2 (Gcm Gcs Gg/Gi St/Sm): This was basically composed of the lithofacies Gcm and Gcs, followed by finning upwards-grained conglomerate facies (Gg) or imbricated conglomerate facies (Gi) developed and characterized by the periodic occurrence of grain order changes from pebbles to granules, and they are distinguished by a laminated or stacked directional arrangement between the conglomerates. They evolved toward the top into sandstones with massive, bedded sandstone facies (Sm) with a single lithology, and there were no obvious sedimentary structures or planar cross-bedded sandstone facies (St) with intercut bedding and lamination. They were stacked according to an accretion downstream model characterized by low-angled surfaces. The FA-2 had mainly gray-black lithology, and it consisted of a thinning and finning upwards sequence.
Interpretation: These facies association preserves traits that suggest a reduction environment dominated by subaqueous distributary channels. Periodic grain-bedding changes reflect the intermittent flood changes for that time, which usually developed at the top of channels. Gi indicate a more stable hydrodynamic condition. It is often developed in subaqueous distributary channels. From a sedimentological perspective, they could already be considered as constituting a gradual waning flow and tended to be stable. As the conglomerates were transported over certain distances, better textures and compositional maturities were observed. The overlapping of the co-sets of Gmg, Gcm, Gg, and Gi provided solid evidence for the development of fan deltas rather than braided river deltas in the study area.
FA-2 is akin and commonly related to the association FA-1. The features of FA-2 such as thickness, lateral extension, or erosional surfaces are nevertheless of a smaller scale. This is indicative of a decrease in the energy regime of the association FA-2 compared to the association FA-1.
FA-3 mixed volcanic sedimentary facies (Mvsf): These are predominantly composed of the pyroclastic flow (>50%) of sedimentary rocks with breccia. The cores are severely weathered, mostly massive or powdery, and the bedding is not developed. These were mainly distributed in the northern part of the study area.
Interpretation: This lithofacies association implies modification by the fluvial action of volcanic clastic material, which is often confined to low-lying areas between the domes of volcanic agencies [47].

4.4. Baiyang River Section of the Architecture

The sedimentological and stratigraphic macro-scale analyses of the Baiyanghe River deposits are highly reliable, given the excellent quality of this area’s outcrops. This has made it possible to quantify the relative proportion of each facies association and to elucidate a general stacking model [9]. The facies associations defined in this study were envisaged as depositional units and interpreted as sedimentary sub-environments. Their distributions could be directly observed in the outstanding exposures offered on the southwest slope of the Haraat Mountain (Figure 1). The lithology was mainly gray-brown gravelly sandstone with local volcanic interbed. Cobble, pebble, granule, and conglomerate-bearing coarse sandstones were developed. The sorting and roundness differences were general. The conglomerate had a certain bedding orientation, as well as large cross-bedding, lag conglomerates, and occasional “floating clasts.” The section included three finning upwards units of variable thicknesses (0.80–3 m), limited by undulating erosional surfaces and reaching more than 6 m in length, and one coarsening upwards unit. In the first semicycle, there was an obvious scouring surface in the lowest part of the section. This developed below the surface and almost without conglomerate, while the Gcm, Gi, and Gcs were formed above the surface. In the second semicycle, the grain size was decreased compared to that in the first semicycle, and the conglomerate was distributed in layers at the bottom of the channel, while the Gi and Gg were mostly developed. In the third semicycle, a set of red mudstones (0.3 m thick) appeared and was intercalated within the conglomerate and sandstone. A set of reverse rhythmics that transitioned from sandstone to granule, with low-angle downcut Sp, developed. At a large scale, the shape was convex-up. The fourth semicycle showed a finning upwards-grained rhythmic with trough cross-bedding sandstone, and the shape was concave-up (Figure 14).
Interpretation: The stratified conglomerate mainly developed at the bottom of the channel. The structural and compositional maturity of the conglomerate generally indicated that there was a gradual filling flow. In the third semicycle of the section, the mudstone corresponded to floodplain overflows composed of lithofacies deposited under low-flow regime conditions [48]. The “convex-up”-shaped sand body could be inferred as an estuary bar superposed by a “concave-up”-shaped sand body, which would usually represent the channel. Together, these constituted the “bar-channel transition” model. This model has been found in many oil fields [49]. The section was dominated overall by St Gcm Gcs Gg/Gi; this is consistent with the FA-2 lithofacies association observed in the core, which reflected a depositional environment dominated by underwater distributary channels.
Another outcrop section is shown, with severe weathering of the volcanic rock, and it was intercalated within the banded volcanic rock and gravelly sandstone (Figure 15). It is consistent with FA-3.

4.5. Sedimentary Facies

At present, there are many different views on the sedimentary facies of the Jiamuhe Formation. Zhang (2007) believes that the sedimentary environment is dominated by alluvial–fluvial deposits [45], and volcanic deposits can only be seen in the northwest margin [50]. Other authors have stated that it is dominated by a volcano-sedimentary sequence [19,51], fan-delta deposits controlled by grooves [52], and multi-source inputs that form multistage superimposed flood and alluvial-delta deposits [16].
In contrast to earlier findings, however, it was observed that a large number of scouring surfaces have developed along the western slope of the Shawan Sag (Figure 16). The “floating conglomerate” involves shorter transport lengths, favoring the preservation of unstable lithic fragments and, thus, the compositional immaturity of the sandstones [53]. The size of the conglomerate is up to 100 mm, and the lithofacies associations of Gmg and Gcm are developed. The mudstone is mostly reddish brown in color. The wells in the southeast direction of the scouring surface have smaller grain sizes, ranging from 4 to 20 mm. The structure and the composition maturity of the conglomerate are better, and the lithofacies associations are mainly composed of Gcs, Gg/Gi, and St/Sm. The color of the mudstone is mainly light gray-green.
Taking into account the seismic progradational reflection, petrographic profile, lithofacies, and lithofacies associations of the core, outcrop, and vertical sequence, it is possible to consider four source zones as the main zones responsible for the compositional variability of the sandstones. The MVSF has mainly developed locally, and along the “one provenance and four zone” theory, four distributaries/underwater distributary channels were observed (Figure 17).
The first channel comprises the XG1-ZJ6 well, and an underwater/distributary channel, which is mainly composed of tuffaceous pyroclastic rocks, has developed along the provenance zone. The second channel runs through the CP10-ZJ 5-ZJ 4-ZJ3 well and has developed from a northwest–southeast direction. The third channel runs through the CP7-CP005 well and has mainly developed near the fault zone, and its progradation is towards the center of the sag. The last channel runs through the CP5 well and is between the provenance zones of the CP10 well and the CP5 well, forming an independent underwater/distributary channel.

5. Discussion

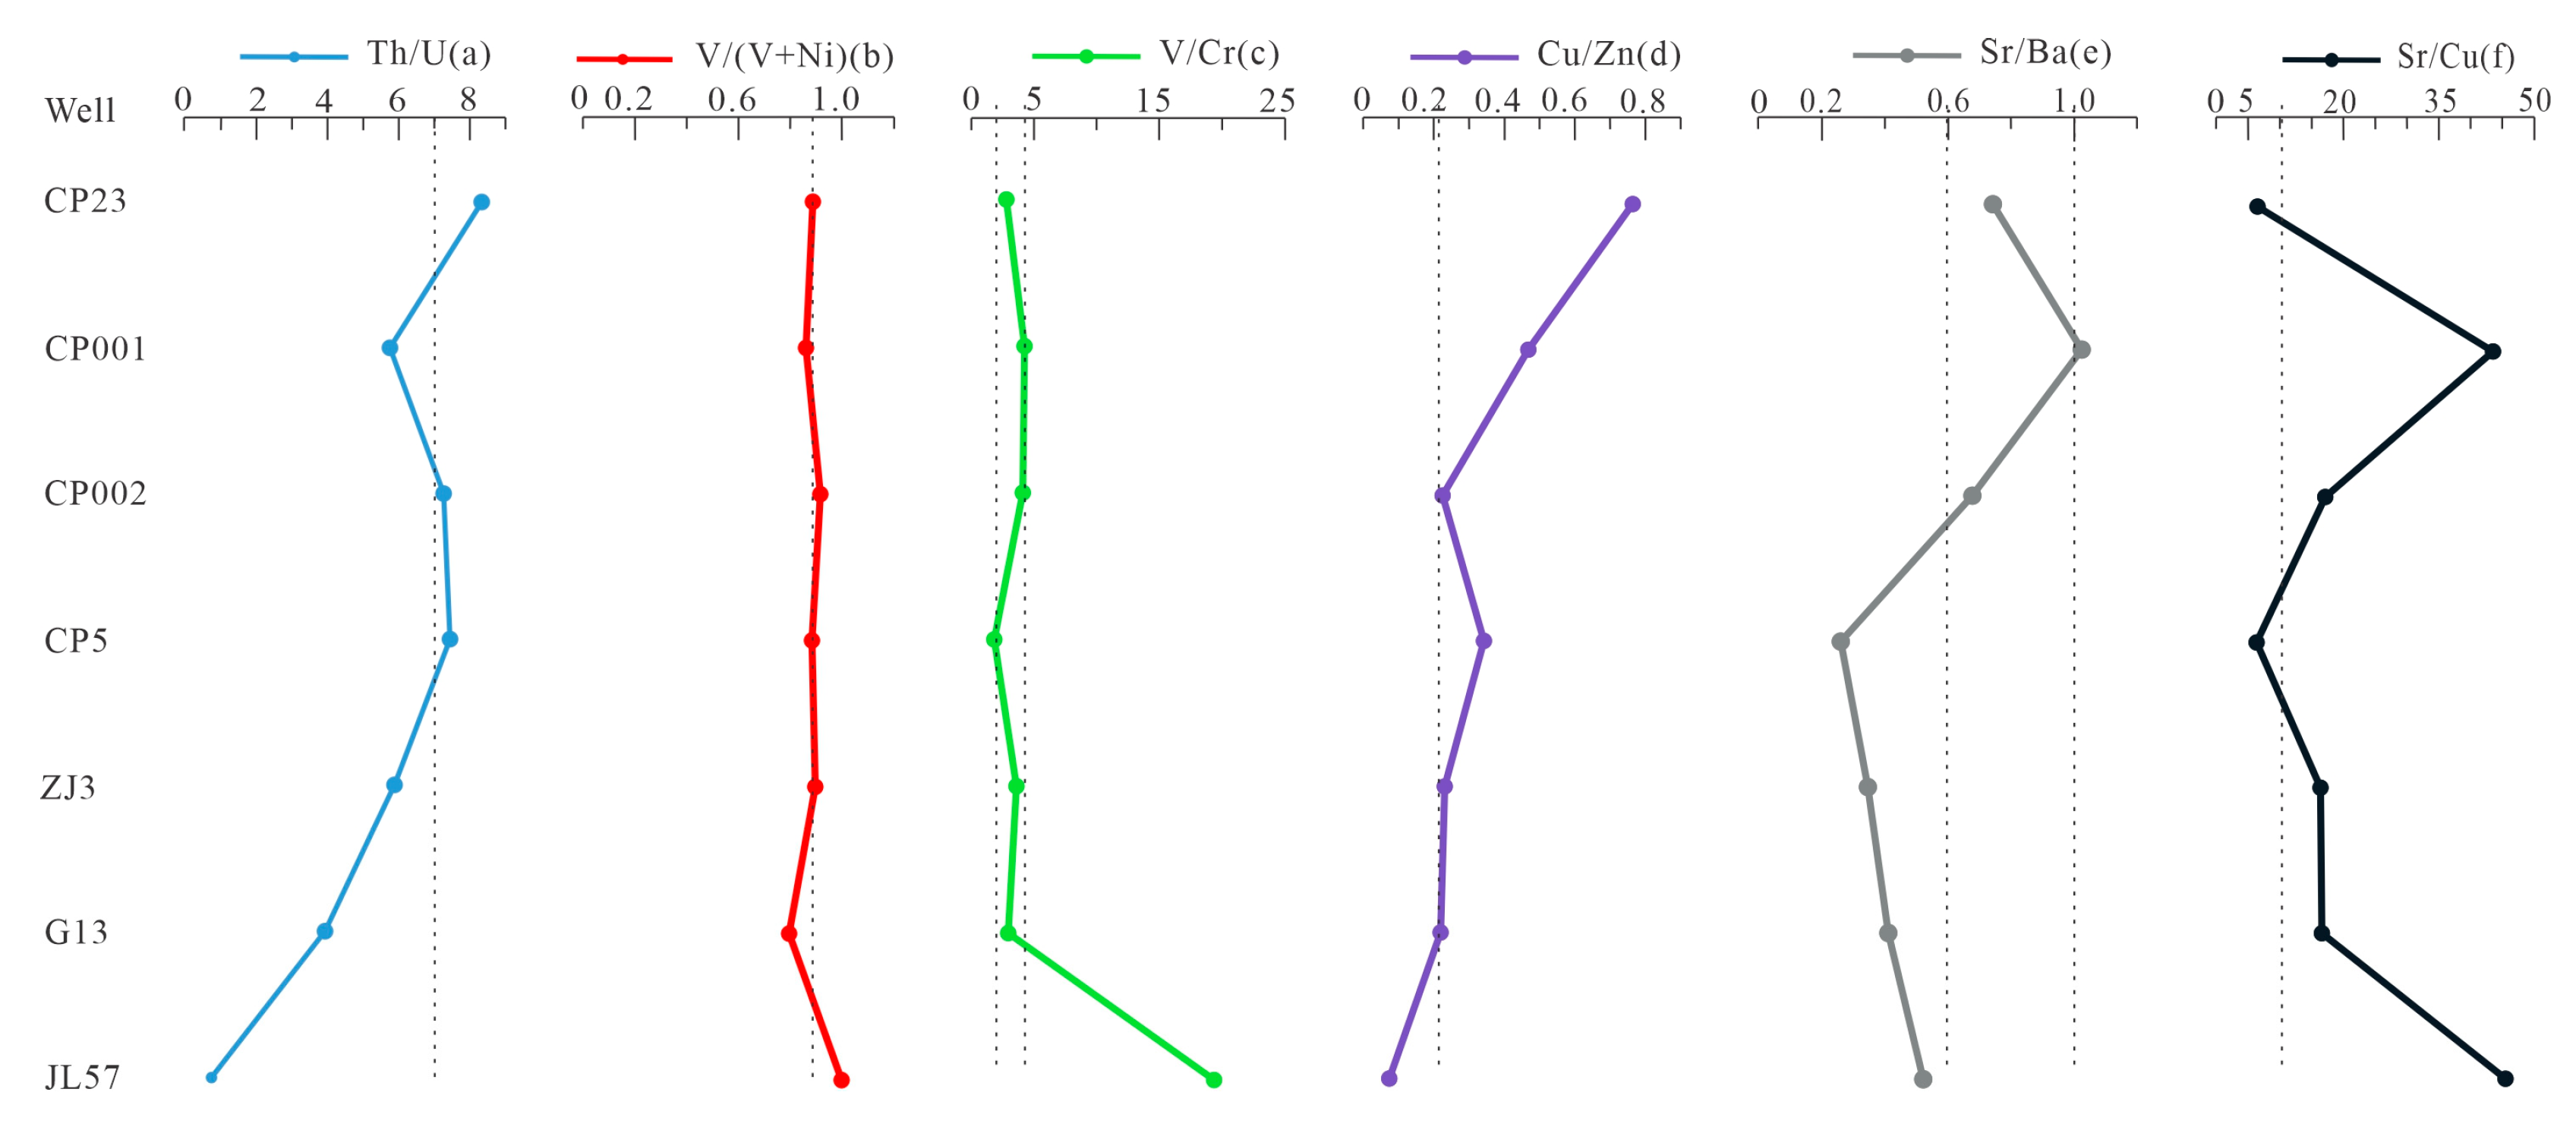
5.1. Redox Conditions and Paleoclimatic Information

Based on an element geochemistry characteristics analysis, the paleoclimate information was reconstructed [54]. Sr/Ba was used to determine the salinity of the ancient sediment water, the V/(V + Ni) of the oxidation reduction conditions, and the ratios of the U and Th/U [55]. Cullers (1994) analyzed the changes in and controlling factors of the trace elements in the near-source mudstone, siltstone, and sandstone [56]. Zhang (2013) reconstructed the evolution history using element geochemistry [57].

5.1.1. Paleoredox Conditions

Th/U values are often used to evaluate redox conditions. Anoxic sediments have Th/U ratios of below two, and oxidizing terrestrial environments have ratios in excess of seven [58]. The study area’s Th/U ratios (except for the JL57 well) were less than two, and the other wells were close to or more than seven, which indicated that the study area is in a weak reduction–oxidation environment (Figure 18a).
When a V/(V + Ni) ratio’s value is greater than 0.84, it indicates an euxinic environment. Ratios ranging from 0.54 to 0.82 indicate an anoxic environment, ratios of 0.46–0.6 indicate a dysoxic environment, and values less than 0.46 indicate an oxic environment [59]. The value for the study area was approximately 0.84, indicating a weak reduction environment with poor oxygen (Figure 18b).
High V contents generally occur under reducing conditions [60], while Cr usually occurs in sediments. Therefore, V/Cr can be used as an indicator of oxygen content. When the value of V/Cr is less than 2, it indicates an oxygenated environment; when the value of V/Cr is between 2.0 and 4.25, it indicates an oxygen-poor environment; and when the value of V/Cr is greater than 4.25, it indicates an oxygen-poor to anoxic environment [60]. Most of the samples in the study area fell between 2.0 and 4.25, indicating an oxygen-poor and low reduction environment (Figure 18c).
A Cu/Zn value of less than 0.21 indicates a reduction environment, a Cu/Zn value ranging from 0.21 to 0.35 indicates weak reduction environment, and a Cu/Zn value ranging from 0.35 to 0.50 indicates an oxidation environment. Most of the samples had values ranging from 0.21 to 0.35, indicating a weak reduction environment (Figure 18d).
The mudstone developed in the study area was mainly red (CP23, ZJ4, and CP28), and gray-green and reddish brown interbeds could be seen in some wells, such as CP23 (3024 m). Notably, their presence indicates seasonality in the precipitation regime, which, in turn, causes fluctuations in the water table levels and generates alternating oxidizing and reducing conditions [60]. Only a few of the wells were distributed in the middle of the sag, which was light gray (ZJ4, 4630.01 m). Moreover, charcoal and pyrite were also found (Figure 19). The reddish-brown mudstone indicated a completely oxidized environment, and the grayish green and reddish brown interbeds indicated that the water body was turbulent or shallow with oxygen at that time. The occurrence of pyrite indicated that the central part of the study area was dominated by a reducing environment. Charcoal indicated local wetting of the environment at that time [61].

5.1.2. Paleoclimatic Considerations

Paleontological evidence from the Permian Jiamuhe Formation, as reported by Liu in 2015 for the Halalat Mountain [20], provided clues about the climatic conditions. The Paracalamites and Lepidodendron were well preserved, with a clear texture on the stem and no obvious traces of fragmentation and transport. The author proposed an in situ or near-source deposition and semi-arid and semi-humid climatic conditions [62]. In addition, it could be deduced that the red color of the mudstones indicated depositions in well-drained floodplains under oxidizing conditions.
Another aspect to consider for the paleoclimatic estimation is the rare earth element. Sr/Ba is frequently used to indicate water salinity. A Sr/Ba value greater than 1.0 refers to marine brackish water, a Sr/Ba value of 0.6–1.0 refers to brackish water, and a Sr/Ba value of less than 0.6 refers to terrestrial freshwater [63]. Most of the samples had values ranging from 0.2 to 1.0, belonging to a terrestrial freshwater environment (Figure 18e).
Sr/Cu is often used as an indicator for determining climate temperatures, humidity, and dry heat. A Sr/Cu value of ~1.3–5.0 indicates a warm and humid climate, and a Sr/Cu value greater than 5 indicates a relatively dry and hot climate [2]. Most points in the study area were near 10, suggesting a semi-humid and semi-dry environment (Figure 18f). The associations of Sr/Ba and Sr/Cu were also indicative of semi-arid climates. The paleoclimatic data deduced in this study are in good agreement with the sedimentary model.

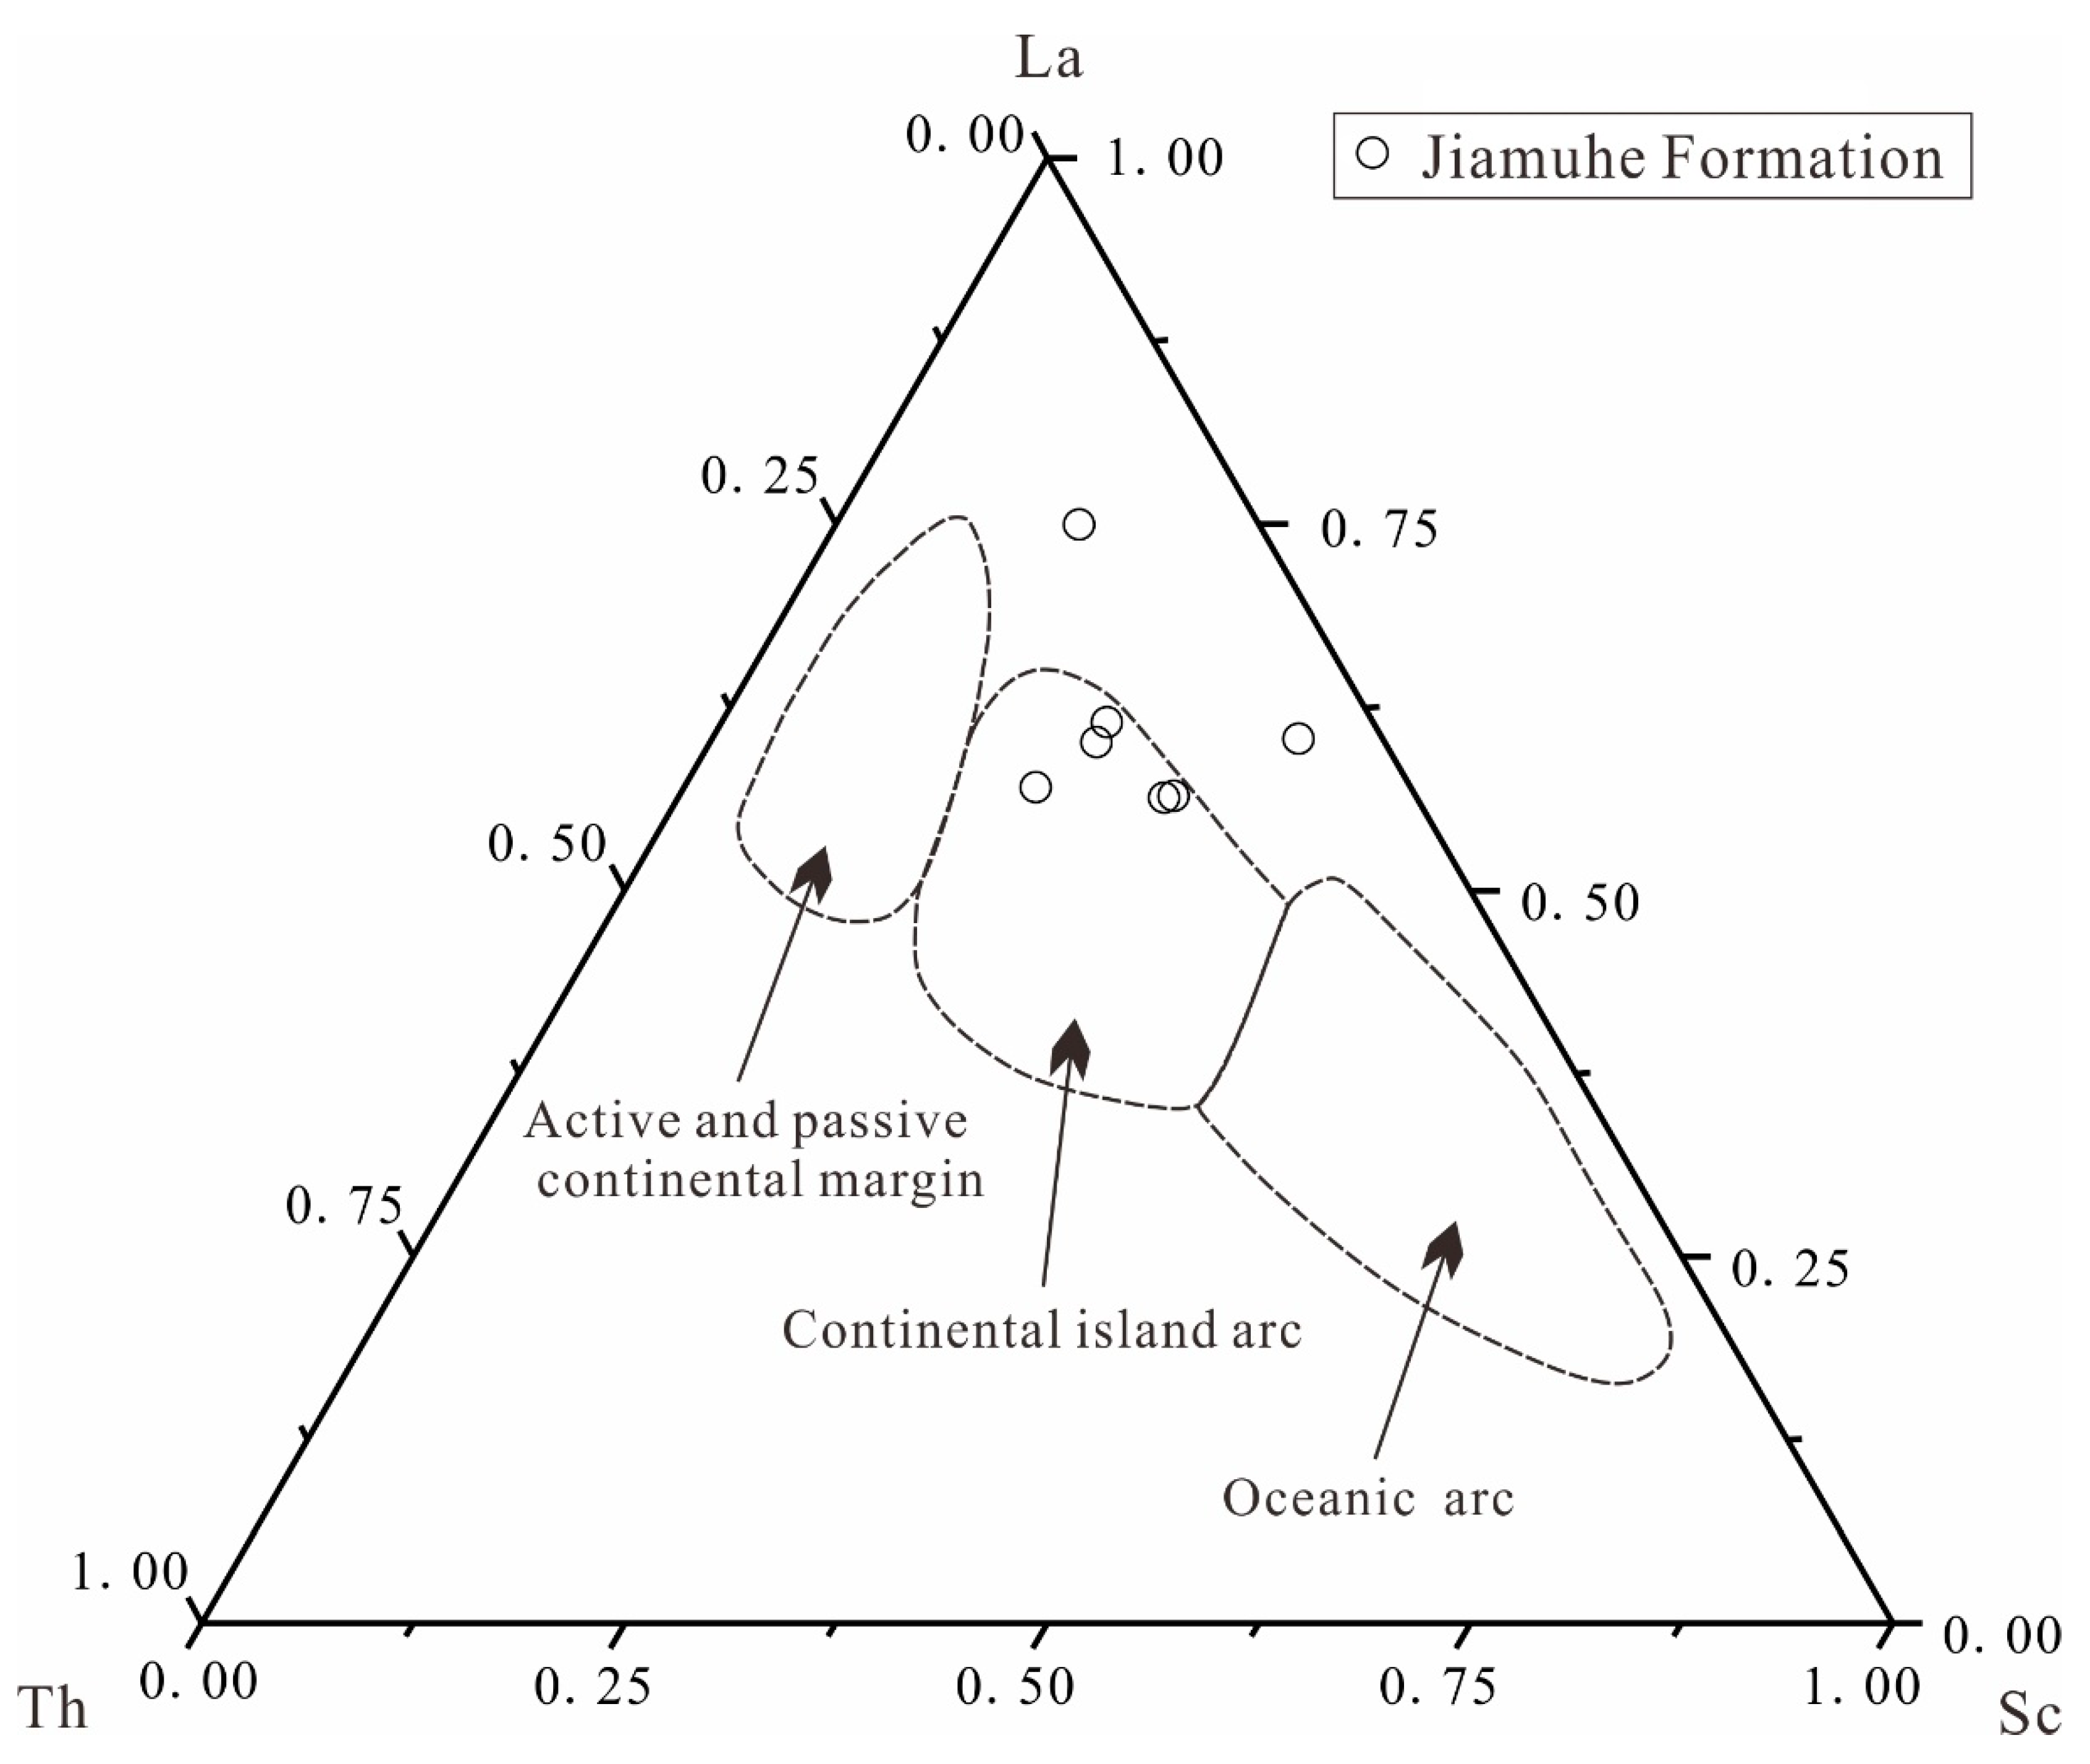
5.2. Tectonic Setting and Provenance

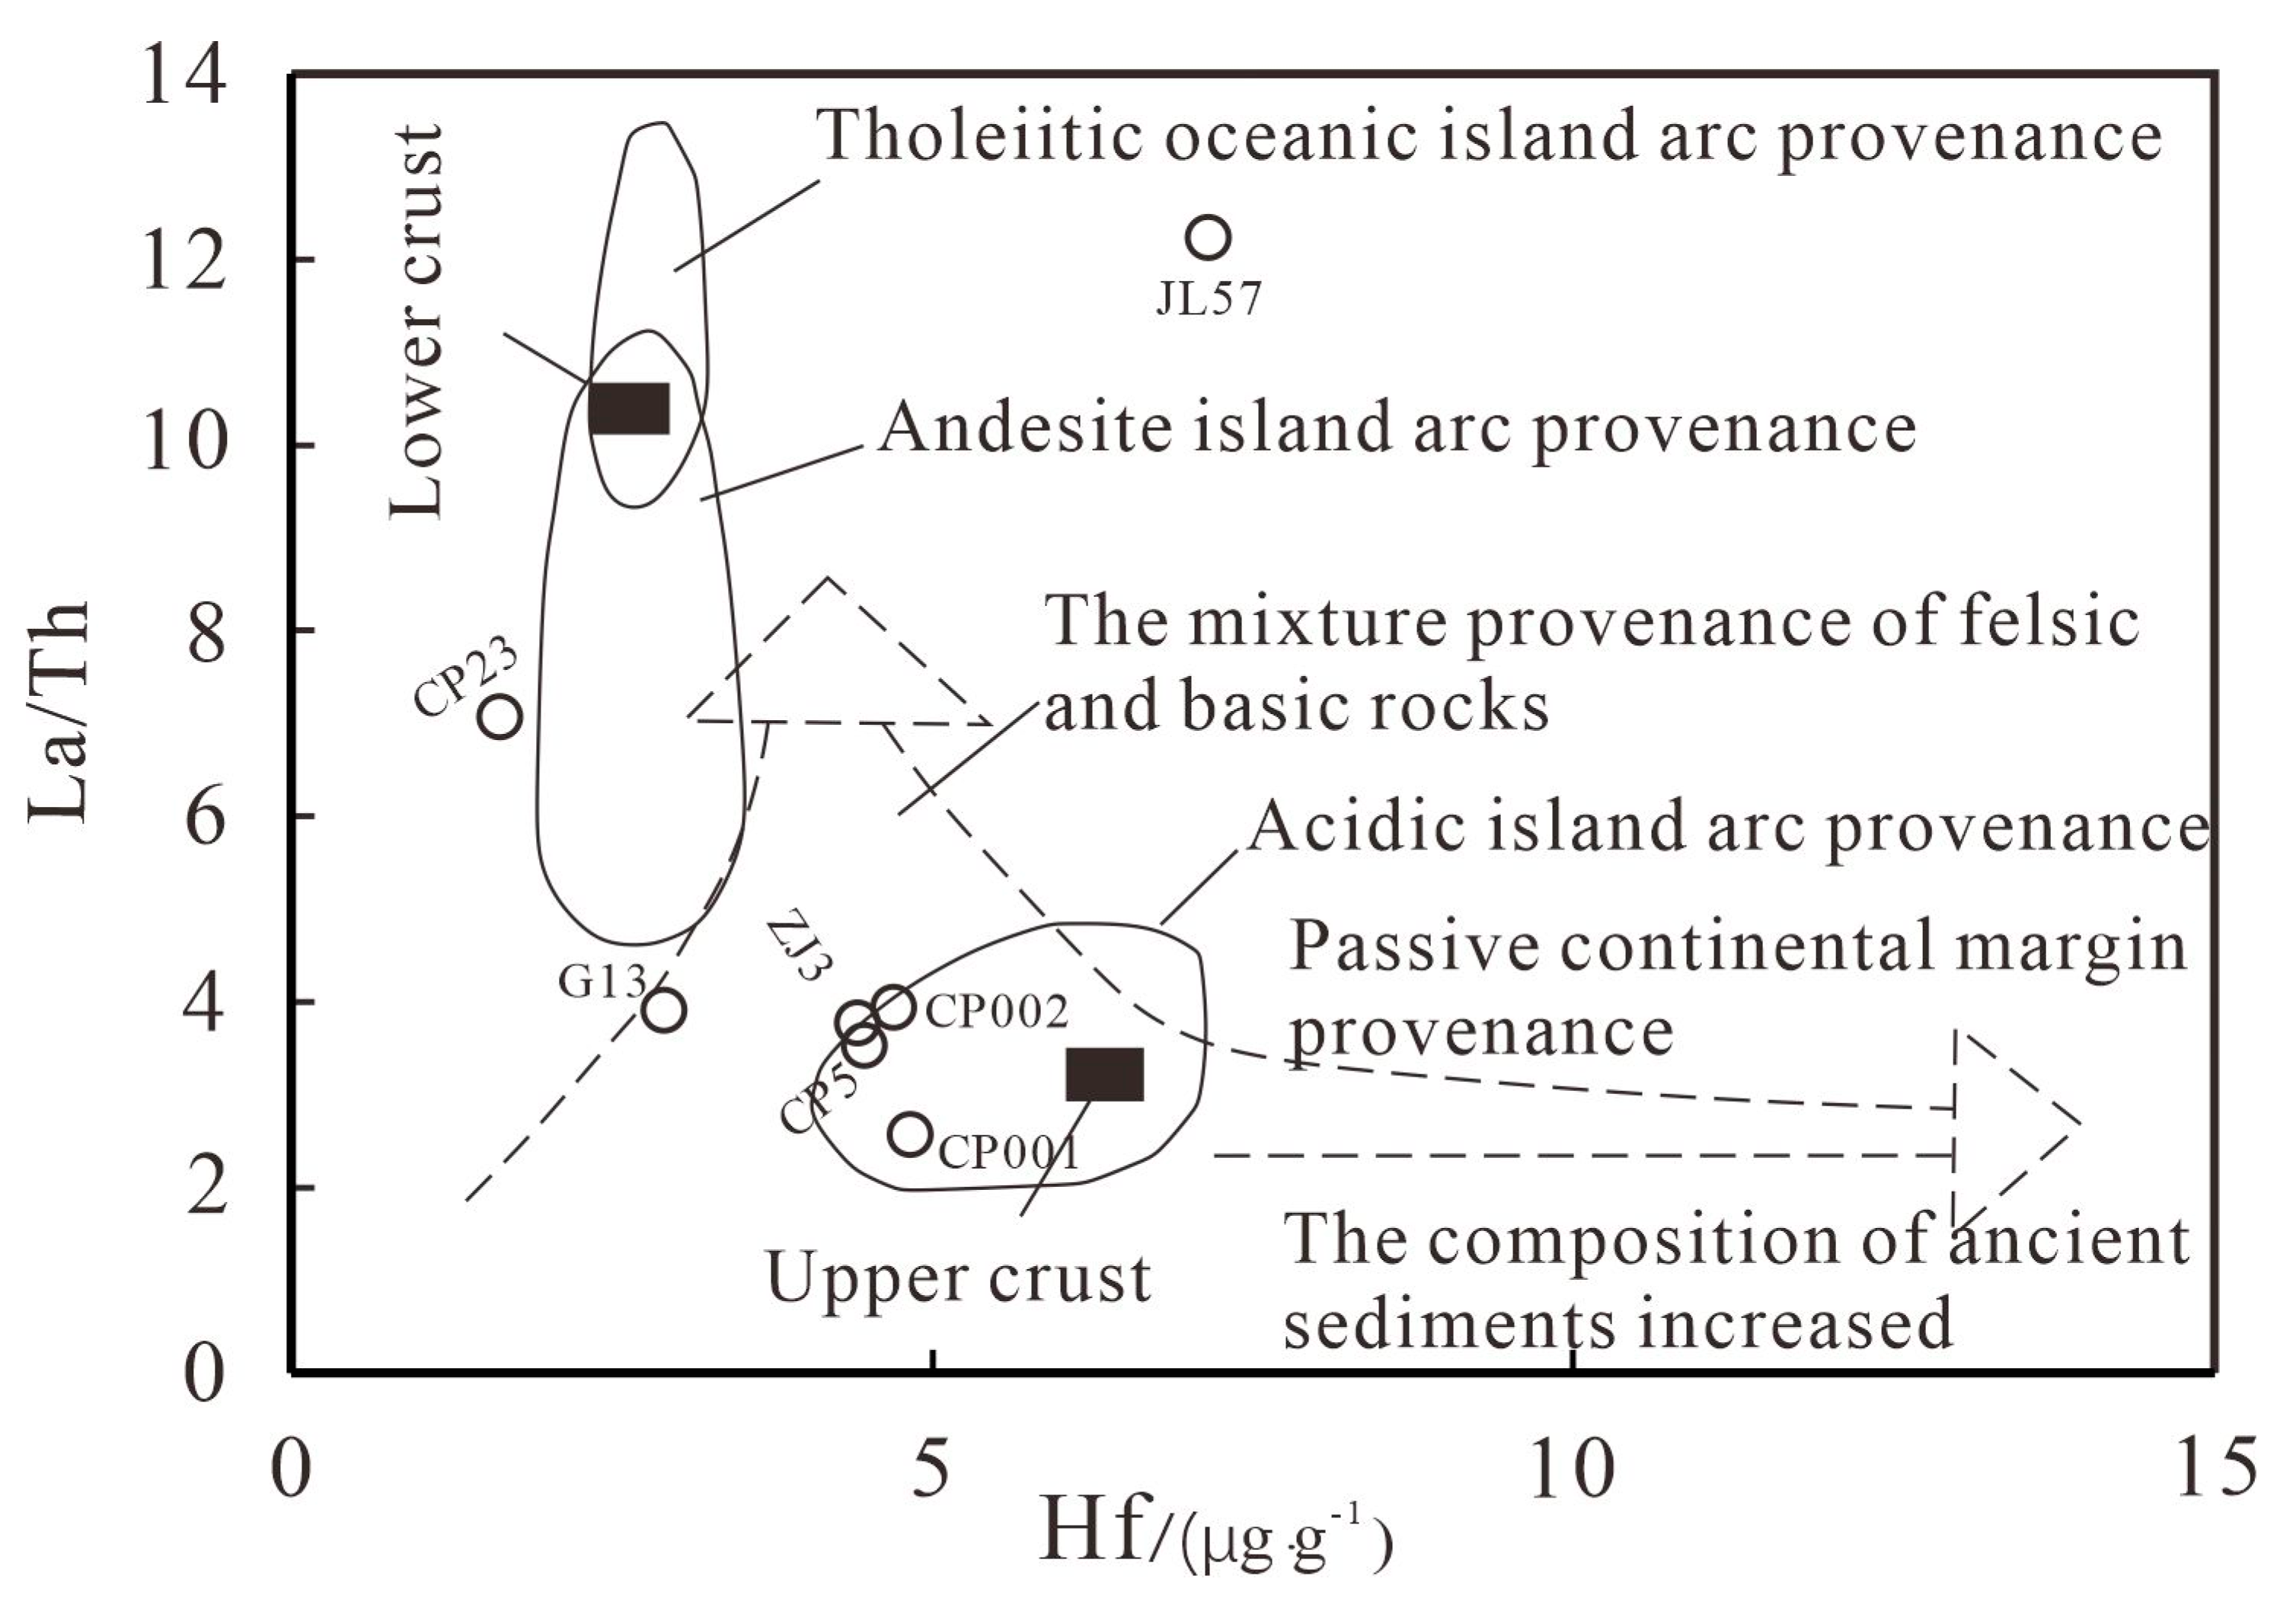
5.2.1. Tectonic Setting Restoration Based on the Elements

Trace elements such as Th, Sc, and Co do not decompose easily in natural water, and they are less susceptible to weathering, transportation, and sedimentation and can respond well to the geochemical properties of the provenance. Therefore, they are widely used in provenance and tectonic background studies [32,64]. The discrimination diagram of the trace element La-Th-SC tectonic environment reflects that its formation may have been related to subduction (Table 4 and Figure 20). Bhatia summarized the geochemical parameters of the different tectonic settings in 1985 [65]. A comparison of the REE values for the Jiamuhe Formation in the Shawan Sag showed that La, Ce, ΣREE, L/H, La/Yb, and (La/Yb)N are all close to the continental island arc, and its provenance type belongs to undissected magmatic arc (Table 5).
In summary, according to the criteria established by different scholars, it was indicated that the tectonic setting of the Shawan Sag is a continental island arc, and the sediments are from volcanic rocks in the acidic island arc area (Figure 20). The continental island arc is mainly characterized by eruptive facies, and so the interbedded sedimentary strata of volcanic rock and gravelly sandstone that developed in the Jiamuhe Formation were formed.

5.2.2. Indicative Significance of the Provenance System

Lu (2018) pointed out that there are ancient basement blocks in the Shawan Sag, and the western part of the basin is a provenance area dominated by near-source deposition [21]. Xiong (2021) and Yu (2020) believed that the Wuerhe development fan delta on the western slope of the Shawan Sag came from the western slope [34,66]. The provenance system of the Jiamuhe Formation, which overlies the Wuerhe Formation, has inheritance.
Different provenances have different geological conditions (e.g., different parent rock type, weathering, transport, deposition, paleogeomorphology, and tectonic conditions), resulting in different sediment characteristics (e.g., different heavy minerals, compositions, and grain sizes), which, in turn, reflect and distinguish the provenance. The movement of sedimentary debris from a source to a sink is affected by a series of physical and chemical actions [67]. In a later stage, it may also undergo decomposition, recrystallization, and exposed weathering, changing the contents and compositions of the heavy minerals [68,69]. Song (2002) found that the heavy mineral combinations along the northeast direction in the middle Triassic Yanchang of the Ordos Basin had obvious zonality [70]. They also pointed out that the delta deposit process, due to environmental differences, led to different chemical element enrichments, with partitions. The thickness of the Jiamuhe Formation changes rapidly, and the heterogeneity is strong [15,21]. Therefore, although the provenance area is in the northwest direction, it may have been the subtle differences in the subfacies and microfacies that led to the different characteristics of the heavy minerals. The reservoir had mostly developed in a depositional environment with strong hydrodynamics and poor stability, with low compositional maturity and structural maturity and obvious zoning. Heavy minerals and trace element analyses are expected to provide reference data for the study of provenance and structure to provide a basis for the sedimentary microfacies characterization and reservoir evaluation.

6. Conclusions

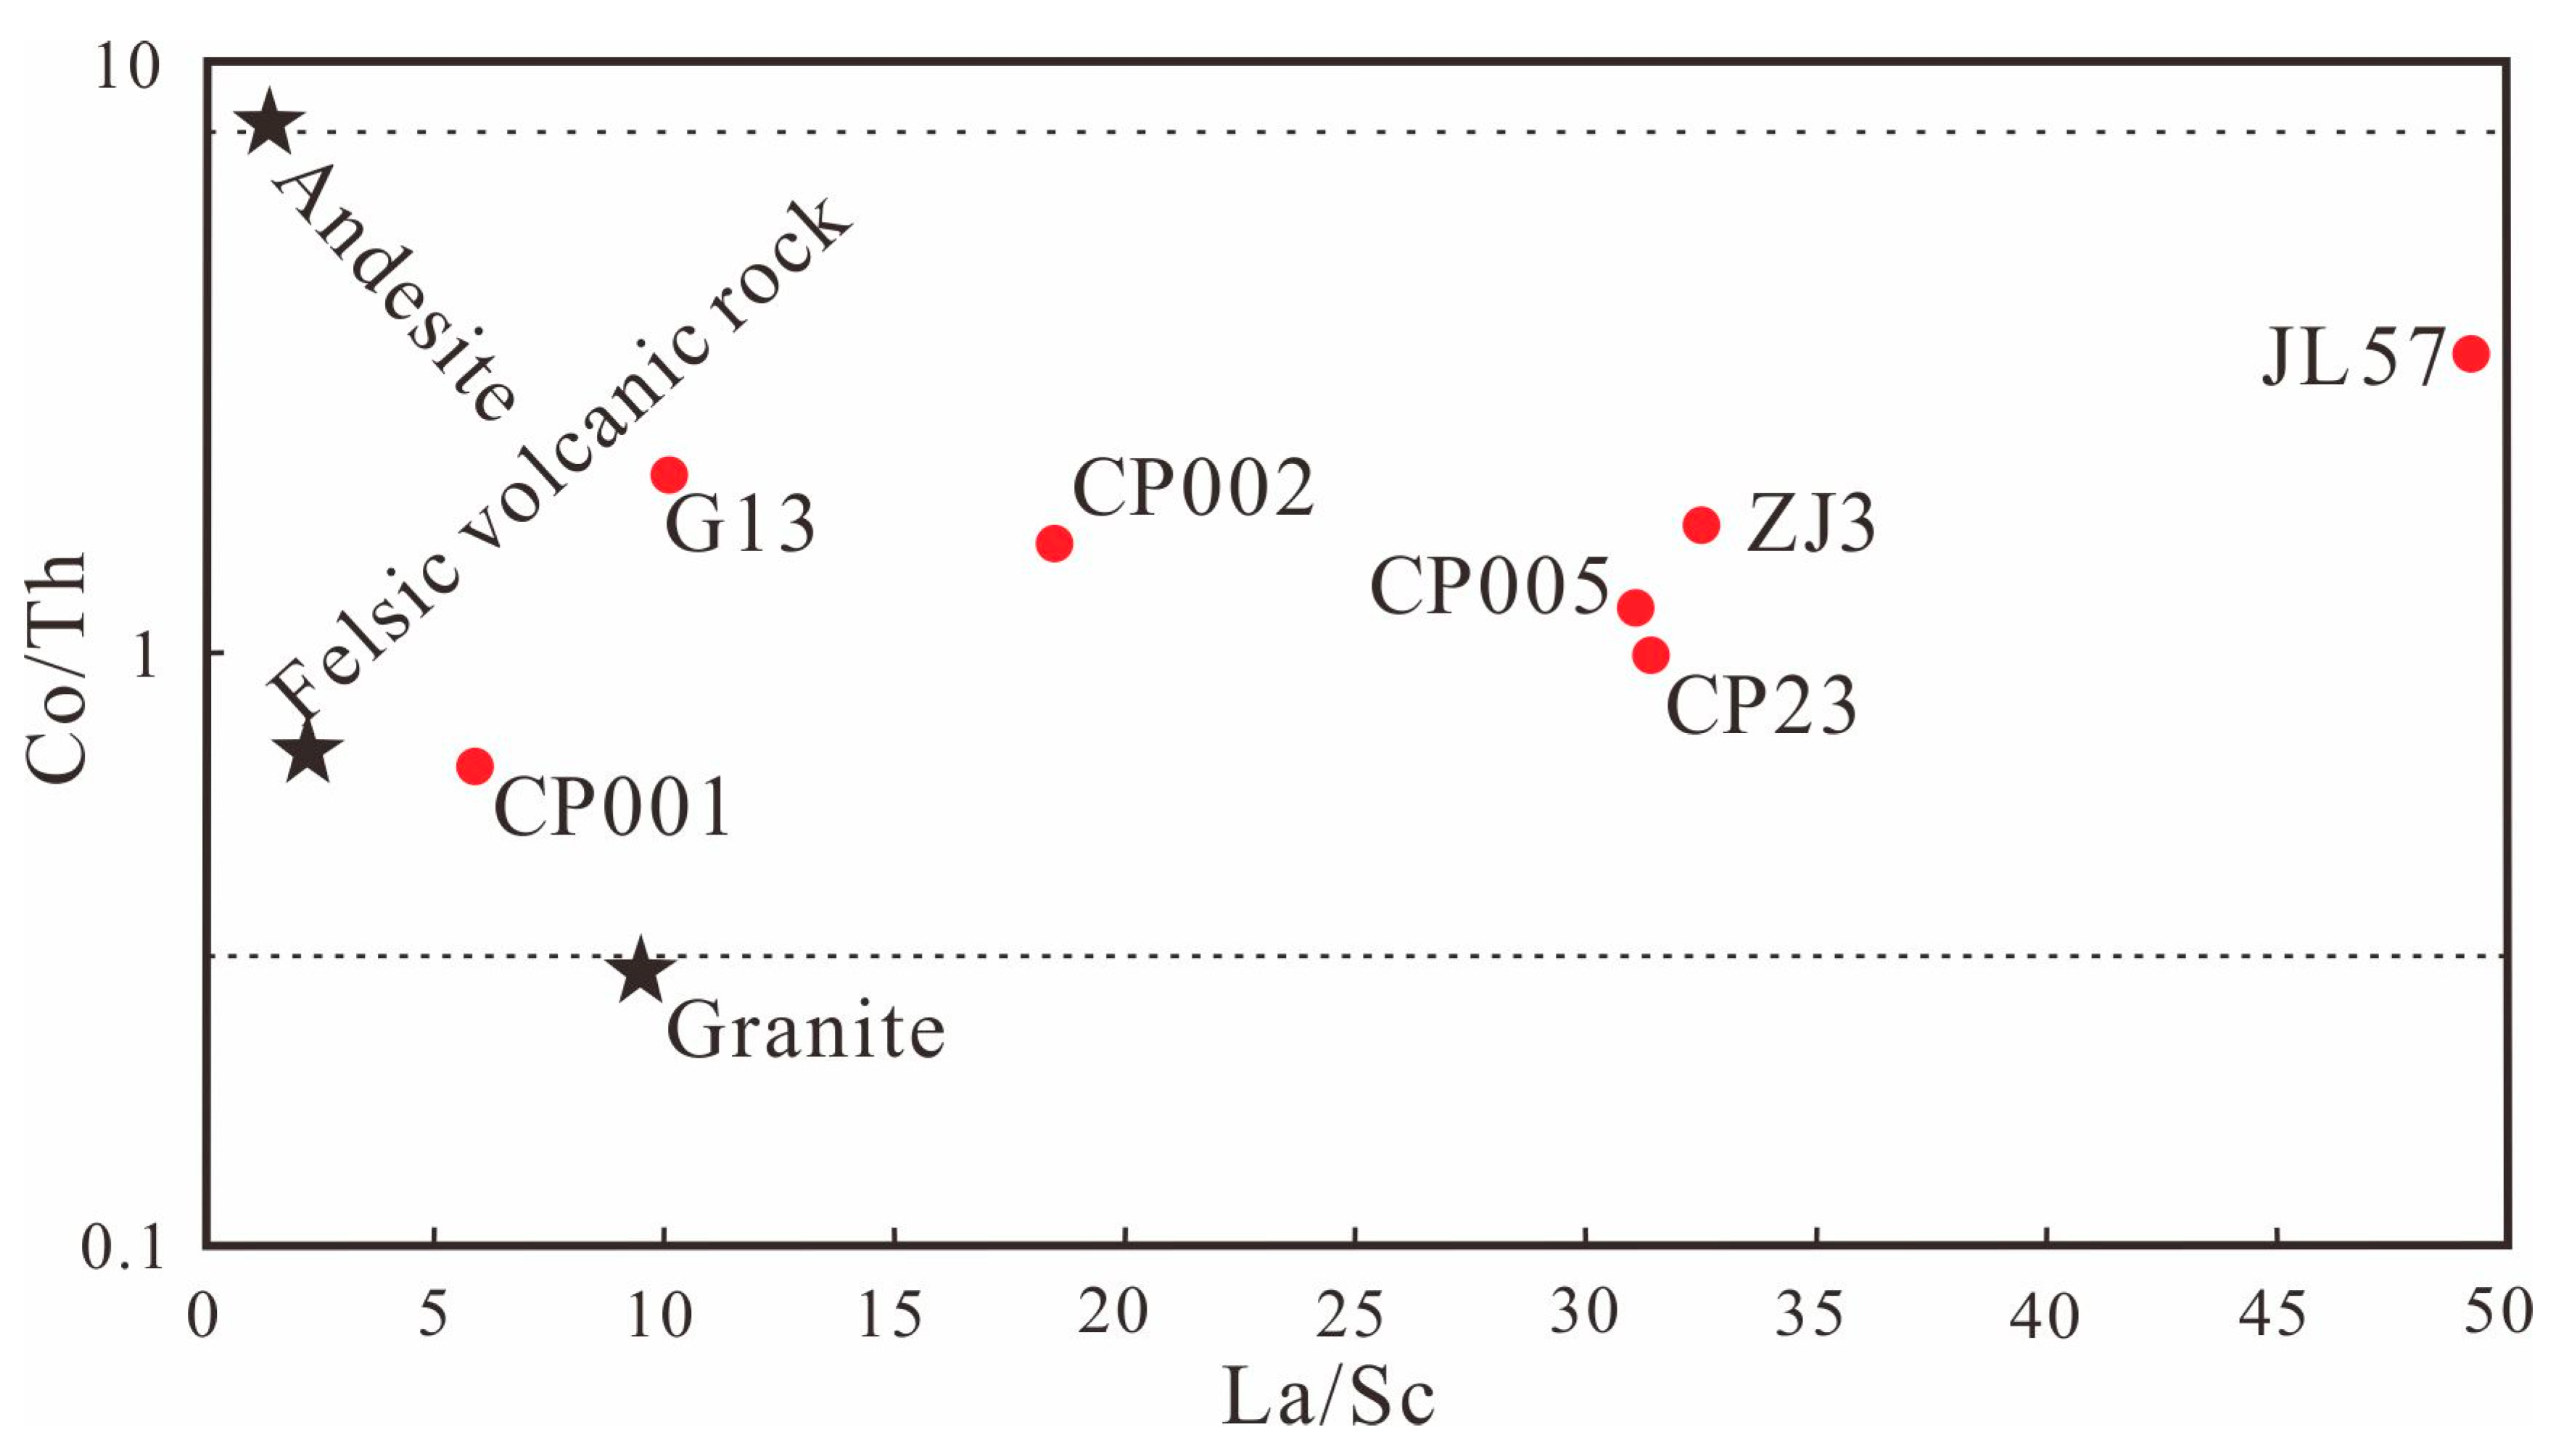
  • According to the compositional analysis, the study area mainly consists of lithic feldspar sandstone. The trace elements (La/Sc, Th/Sc, and La/Sc-Co/Th) confirm that the provenance belongs to the acid island arc. The seismic progradational reflection, which indicated flows from the northwest to the southeast. Through a Q-type cluster analysis and the MDS and PCA results of the heavy minerals analysis, the provenance of the study area could be divided into four zones. There are significant differences in the heavy mineral contents in these four zones. This phenomenon reflects the movement of sedimentary debris from the source to a sink, which is affected by a series of processes, such as exposed weathering, denudation, sediment transportation, decomposition, and recrystallization.
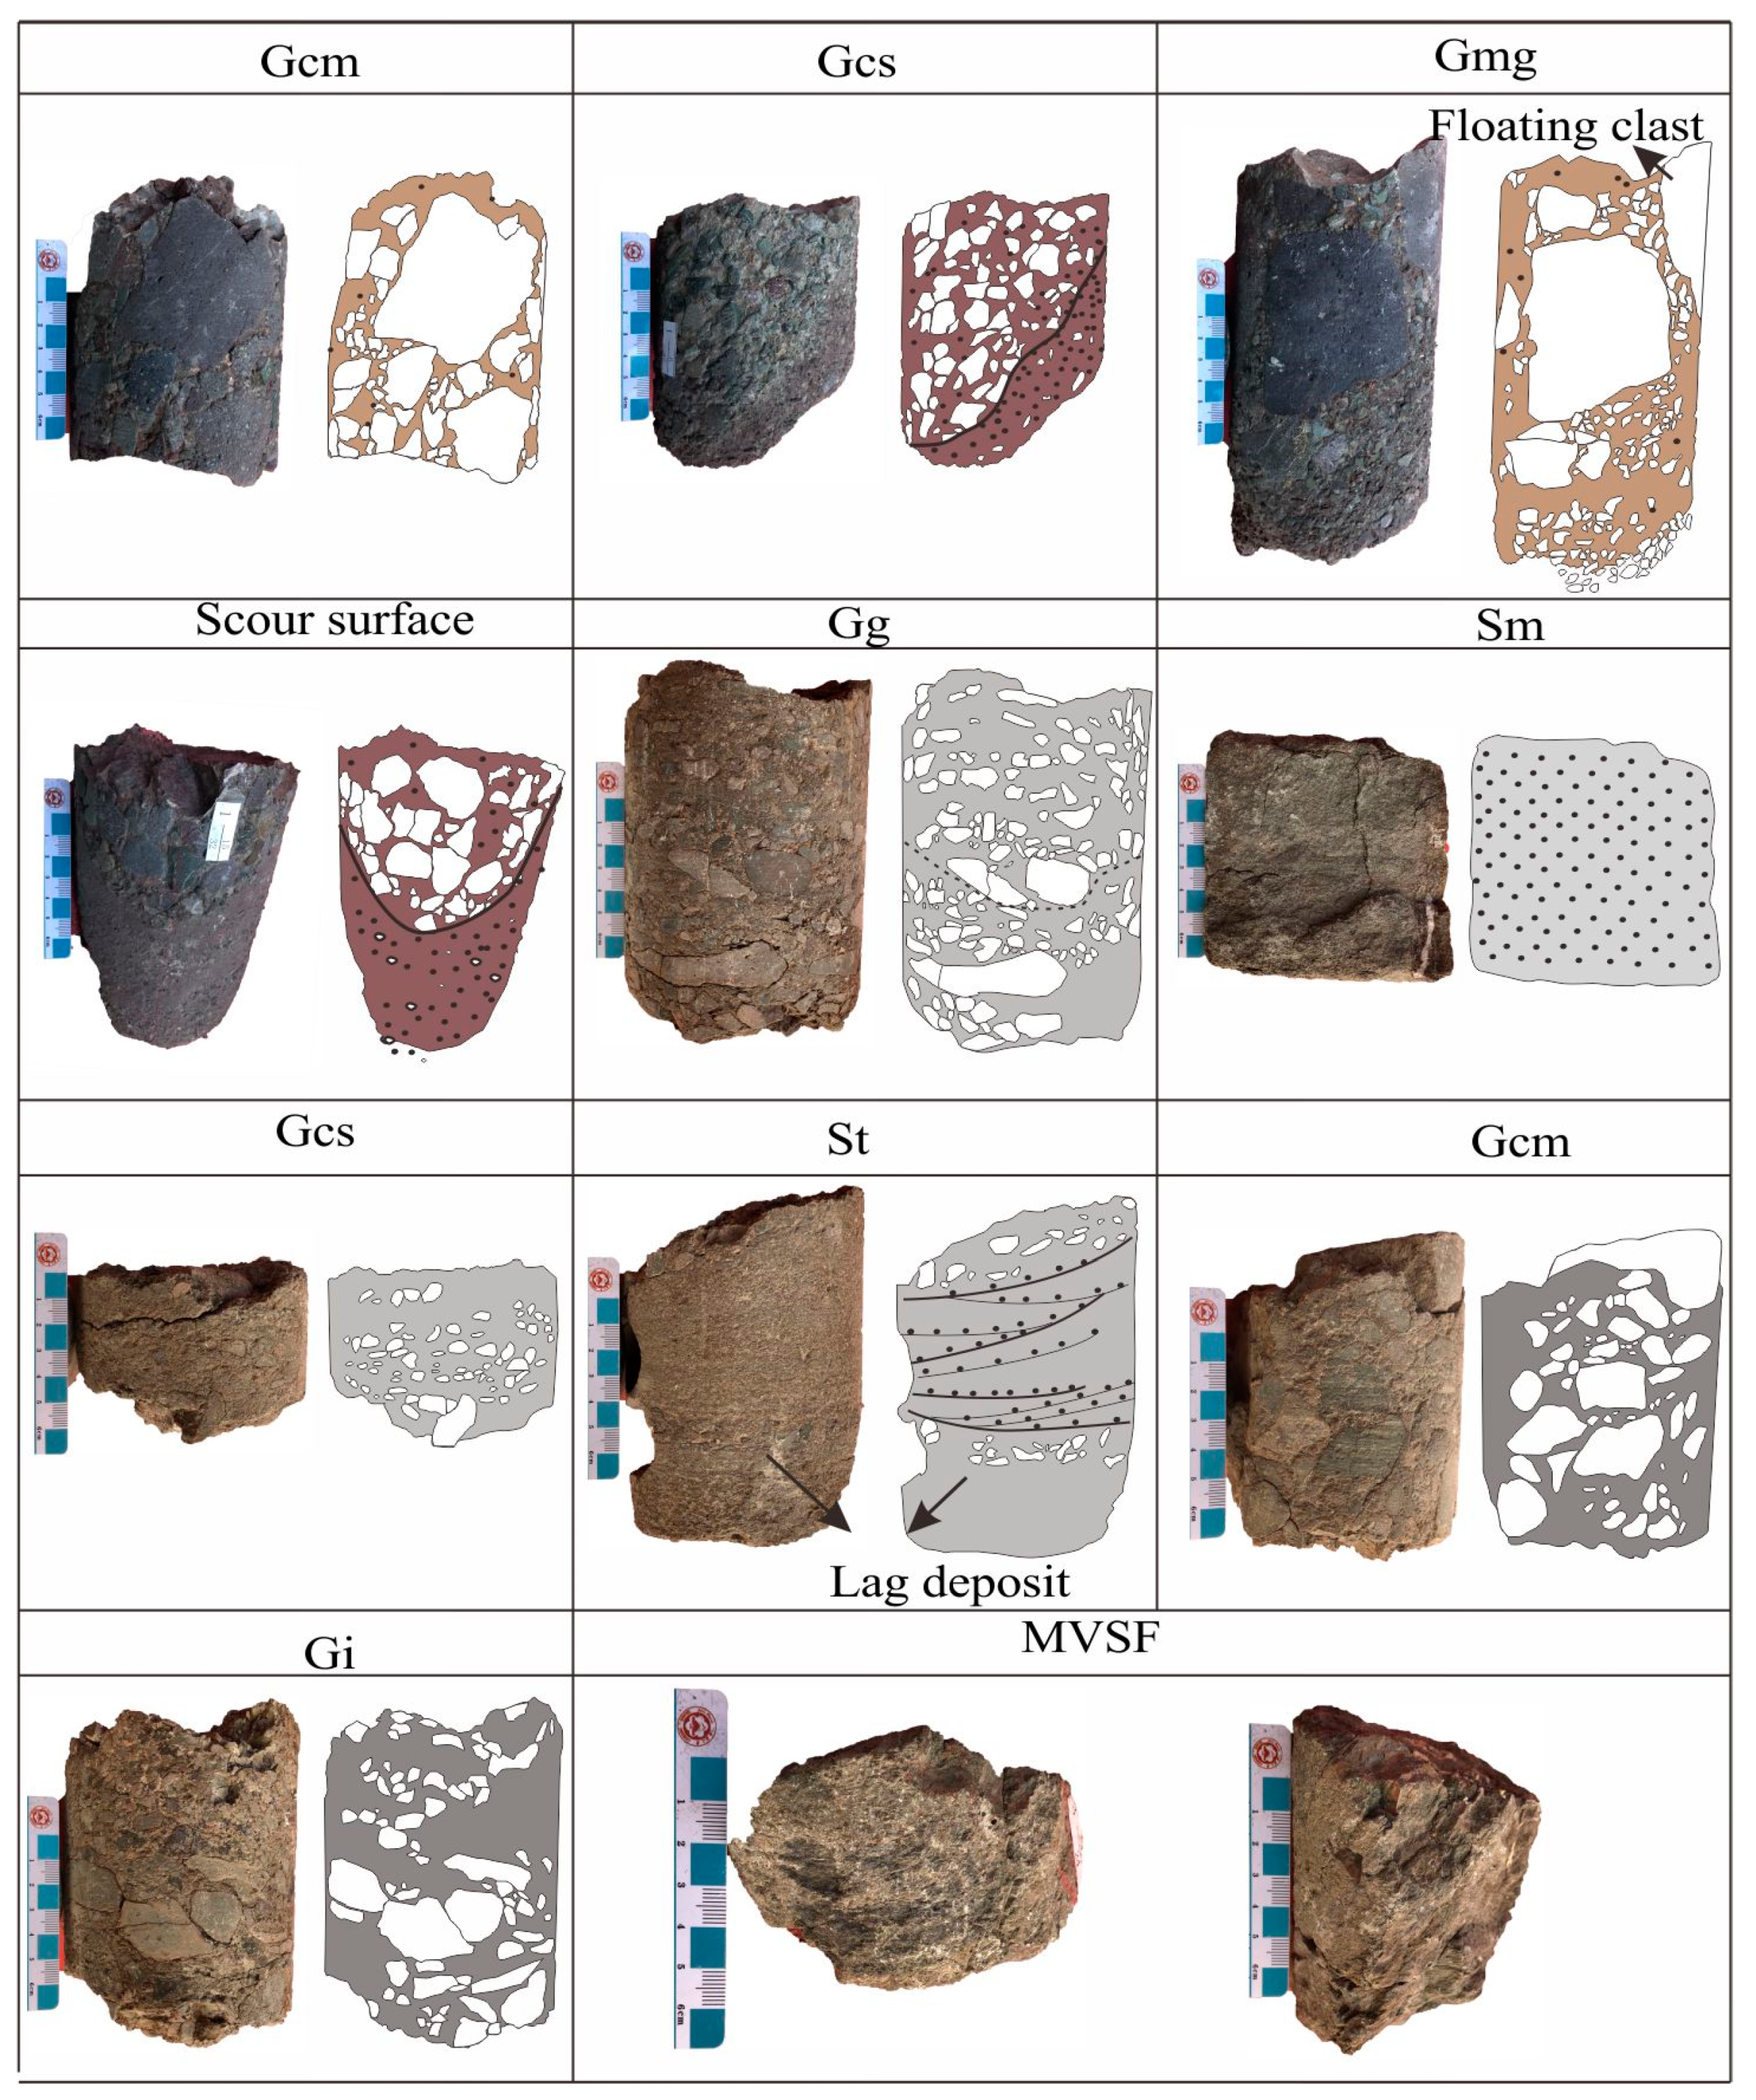
  • We considered the lithology, texture, internal arrangement, and geometry of the core and the Baiyang River section and underwater/distributary channels, and they were well defined by ten kinds of lithofacies and three lithofacies associations. FA-1 is composed of Gmg, Gcm, and Gcs, and a scouring surface and “floating clasts” are typical identification marks. FA-2 is composed of Gcm, Gcs, Gg/Gi, and St/Sm and is characterized by the directional arrangement of gravel, reflecting a depositional environment with stable hydrodynamic conditions. FA-3 consists of the pyroclastic flow (>50%) of sedimentary rocks with breccia, which indicated the volcanic facies, and it could be seen locally in the northern area of the study area.
  • Weak reduction, semi-humid, and semi-dry conditions are evidenced by the Th/U, V/(V+ Ni), V/Cr, Cu/Zn, Sr/Ba, and Sr/Cu values in the Jiamuhe Formation. Alternating wet and dry periods influenced the sedimentological and petrographic characteristics of the sandstones and mudstones.
  • Based on the petrography, La/Sc and Th/Sc values, tectonic provenance plots (Hf-La/Th), REE models, and trace element La/Sc-Co/Th identification maps, the tectonic setting of the Shawan Sag is a continental island arc, which is mainly characterized by eruptive facies. This result supports the interbedded sedimentary strata of the volcanic rock and gravelly sandstone that have developed in the Jiamuhe Formation.

Author Contributions

Conceptualization, Z.Y.; methodology, Z.Y.; software, T.L.; validation, F.Y.; formal analysis, N.A.; investigation, H.Y. and Z.Z.; resources, H.Y.; data curation, T.P.; writing—original draft preparation, Z.Y.; writing—review and editing, Z.Y.; visualization, D.J. and W.Z.; supervision, D.J.; project administration, B.Z. and C.J.; funding acquisition, Z.Y. All authors have read and agreed to the published version of the manuscript.

Funding

This research was funded by the National Natural Science Foundation of China.

Data Availability Statement

Not applicable.

Acknowledgments

This study was supported by the National Natural Science Foundation of China (41902109) and the Tianshan Youth Program (2020Q064). It also received aid from the research team at Xinjiang University.

Conflicts of Interest

The authors declare no conflict of interest.

References

  1. Weltje, G.J.; von Eynatten, H. Quantitative provenance analysis of sediments: Review and outlook. Sediment. Geol. 2004, 171, 1–11. [Google Scholar] [CrossRef]
  2. Scheffler, K.; Buehmann, D.; Schwark, L. Analysis of late Palaeozoic glacial to postglacial sedimentary successions in South Africa by geochemical proxies–Response to climate evolution and sedimentary environment. Palaeogeogr. Palaeoclimatol. Palaeoecol. 2006, 240, 184–203. [Google Scholar] [CrossRef]
  3. El-Bialy, M.Z. Geochemistry of the neoproterozoic metasediments of Malhaq and Um Zariq Formations, Kid metamorphic complex, Sinai, Egypt: Implications for source-area weathering, provenance, recycling, and depositional tectonic setting. Lithos 2013, 175, 68–85. [Google Scholar] [CrossRef]
  4. Meinhold, G.; Howard, J.P.; Strogen, D.; Kaye, M.D.; Abutarruma, Y.; Elgadry, M.; Thusu, S.; Whitham, A.G. Hydrocarbon source rock potential and elemental composition of lower Silurian subsurface shales of the eastern Murzuq Basin, Southern Libya. Mar. Petrol. Geol. 2013, 48, 224–246. [Google Scholar] [CrossRef]
  5. He, D.; Lv, Q.; Zhang, Y.; Zhang, P.; Pei, F.; Zhang, X. Paleosedimentary environment evolution during the Middle-Late Permian in the western slope of Songliao basin and its petroleum geological implications. Acta Geol. Sin. 2022, 96, 1–16. [Google Scholar]
  6. Zhang, Z.B.; Xu, Y.; Miao, Y.J.; Wang, W.F.; Zhao, D.F.; Chen, L.D. Provenance and sedimentary environment of Paleogene Gongjue Formation in Qamdo Basin. Acta Sedimentol. Sin. 2022, 40, 1561–1581. [Google Scholar]
  7. Awan, R.S.; Liu, C.L.; Gong, H.W.; Dun, C.; Tong, C.; Chamssidini, L. Paleo-sedimentary environment in relation to enrichment of organic matter of early cambrian black rocks of Niutitang Formation from Xiangxi area China. Mar. Petrol. Geol. 2020, 112, 104057. [Google Scholar] [CrossRef]
  8. Aléon, J.; Chaussidon, M.; Marty, B.; Schütz, L.; Jaenicke, R. Oxygen isotopes in single micrometer-sized quartz grains: Tracing the source of Saharan dust over long-distance atmospheric transport. Geochim. Cosmochim. Acta 2002, 66, 3351–3365. [Google Scholar] [CrossRef]
  9. Armas, P.; Moreno, C.; Sánchez, M.L.; González, F. Sedimentary palaeoenvironment, petrography, provenance and diagenetic inference of the Anacleto Formation in the Neuquén Basin, Late cretaceous, Argentina. J. S. Am. Earth Sci. 2014, 53, 59–76. [Google Scholar] [CrossRef]
  10. Xu, J.; Jiang, Z. Provenance analysis of clastic rocks: Current research status and prospect. J. Palaeogeogr. 2019, 21, 379–396. [Google Scholar]
  11. Wang, J.; Hu, X.; Huang, Z. Provenance analysis of late cretaceous-early eocene sandstones in the sangdanlin area, Southern Tibet. Acta Geol. Sin. 2008, 82, 92–103. [Google Scholar]
  12. Jiang, T.; Cao, L.; Xie, X.; Wang, Z.; Li, X.; Zhang, Y.; Zhang, D.; Sun, H. Insights from heavy minerals and zircon U–Pb ages into the middle Miocene–Pliocene provenance evolution of the Yinggehai Basin, northwestern South China Sea. Sediment. Geol. 2015, 327, 32–42. [Google Scholar] [CrossRef]
  13. Carrapa, B. Resolving tectonic problems by dating detrital minerals. Geology 2010, 38, 191–192. [Google Scholar] [CrossRef]
  14. Chen, L.; Yang, Y.; Wang, F.; Lu, H.; Zhang, Y.; Xin, W.; Yanping, L.; Chen, L. Exploration history and enlightenment in Junggar Basin. Xinjiang Pet. Geol. 2020, 41, 505–518. [Google Scholar]
  15. Liang, Y.S.; He, D.; Zhen, Y.; Zhang, L.; Tian, A. Tectono-stratigraphic sequence and basin evolution of Shawan Sag in the Junggar Basin. Oil Gas Geol. 2018, 39, 943–954. [Google Scholar]
  16. Li, E.; Jin, J.; Wang, J.; Ma, W.; Chen, S.; Liu, C.; Wang, H. Geochemical characteristics and genesis of mid-to-shallow natural gas on the periphery of Shawan Sag, Jungger Basin. Oil Gas Geol. 2022, 43, 175–185. [Google Scholar]
  17. Li, Y.; Lu, J.; Liu, X.; Wang, J.; Chen, S.; He, Q. Geochemical characteristics of source rocks and gas exploration direction in Shawan Sag, Junggar Basin. Nat. Gas Geosci. 2022, 33, 1319–1331. [Google Scholar] [CrossRef]
  18. Guan, X.; Pan, S.X.; Qu, Y.Q.; Xu, D.N.; Zhang, H.; Ma, Y.P.; Wang, G.; Chen, X.Z. Discovery and hydrocarbon exploration potential of beach-barsand in Shawan Sag, Junggar Basin. Lithol. Reserv. 2021, 33, 90–98. [Google Scholar]
  19. Li, Y.J.; Xu, Q.; Liu, J.; Wang, R.; Xiang, K. Redefinition and geological significance of Jiamuhe Formation in Hala’alate mountain of West Junggar, Xinjiang. J. Earth Sci. 2016, 41, 1479–1488. [Google Scholar]
  20. Liu, J. Research on Permian in the Hala’alate Mountain, West Junggar. Master’s Thesis, Chang’an University, Xi’an, China, 2015. [Google Scholar]
  21. Lu, Y. Permian Chronostratigraphic Framework and Sedimentary Filling Evolution in Mahu-Shawan and Adjacent Area, Junggar Basin. Master’s Thesis, China University of Geosciences, Beijing, China, 2018. [Google Scholar]
  22. Wu, Q. Development stage, Structural unit division and local structural genesis of Junggar Basin. Xinjiang Pet. Geol. 2018, 7, 29–37. [Google Scholar]
  23. Carroll, A.R.; Yunhai, L.; Graham, S.A.; Xuchang, X.; Hendrix, M.S.; Jinchi, C.; McKnight, C.L. Junggar basin, northwest China: Trapped Late Paleozoic ocean. Tectonophysics 1990, 181, 1–14. [Google Scholar] [CrossRef]
  24. Cai, Z.; Chen, F.; Jia, Z. Types and tectonic evolution of Junggar Basin. Earth Sci. Front. 2000, 7, 431–440. [Google Scholar]
  25. Xiao, F.F.; Hou, G.T.; Wang, Y.X.; Li, L. Study on structural stress fields since permian, Junggar Basin and adjacent areas. Acta Sci. Nat. Univ. Pekin. 2010, 46, 224–230. [Google Scholar]
  26. Li, G.; Qin, J.; Xian, C.; Fan, X.; Zhang, J.; Ding, Y. Theoretical understandings, key technologies and practices of tight conglomerate oilfield efficient development: A case study of the Mahu oilfield, Junggar Basin, NW China. Pet. Explor. Dev. 2020, 47, 1185–1197. [Google Scholar] [CrossRef]
  27. Miall, A.D. The Geology of Fluvial Deposits; Springer: Berlin/Heidelberg, Germany, 1996. [Google Scholar]
  28. Zhao, J.; Chen, X. Dualoptimization of seismic attributes based on principal component analysis and K-L transform. Geophys. Geochem. Explor. 2005, 29, 253–256. [Google Scholar]
  29. Kruskal, J.B. Nonmetric multidimensional scaling: A numerical method. Psychometrika 1964, 29, 115–129. [Google Scholar] [CrossRef]
  30. Aitchison, J. Principal component analysis of compositional data. Biometrika 1983, 70, 57–65. [Google Scholar] [CrossRef]
  31. Taylor, S.R. An examination of the geochemical record preserved in sedimentary rocks. In The Continental Crust: Its Composition and Evolution; Blackwell Scientific Pub: Hoboken, NJ, USA, 1985; Volume 312. [Google Scholar]
  32. Bhatia, M.R.; Crook, K.A.W. Trace element characteristics of graywackes and tectonic setting discrimination of sedimentary basins. Contrib. Mineral. Petrol. 1986, 92, 181–193. [Google Scholar] [CrossRef]
  33. Rudnick, R.; Gao, S. Composition of the continental crust. In Treatise on Geochemistry; Holland, H., Turekina, K.K., Eds.; Elsevier: Amsterdam, The Netherlands, 2014; pp. 1–51. [Google Scholar]
  34. Yu, H.T.; Liu, X.Y.; Wu, B.W.; Liu, X.M. Large fan delta control factors of upper wuerhe Formation of Shawan sag in Northwest margin of Junggar Basin. Xinjiang Geol. 2020, 38, 71–76. [Google Scholar]
  35. Hui, X.; Hou, Y.; Yu, J.; Long, S.; Guo, Y.; Liu, Y.; Zhang, J. Progradational seismic strata features and distribution of sandstone in the deep-water area of a large-scale lacustrine depression basin: A case study of the middle Yanchang Formation in Longdong, Ordos basin. Acta Sedimentol. Sin. 2022, 40, 787–800. [Google Scholar]
  36. Wang, J.; Wu, C.; Li, Z.; Zhu, W.; Zhou, T.; Wu, J.; Wang, J. Whole-rock geochemistry and zircon Hf isotope of Late Carboniferous–Triassic sediments in the Bogda region, NW China: Clues for provenance and tectonic setting. Geol. J. 2018, 54, 1853–1877. [Google Scholar] [CrossRef]
  37. Wu, S.; Liang, Y.; Zhang, L.; Tian, A. Tectonic transition relationship between Shawan sag and western Well Pen-1 sag and its geological significance. Xinjiang Pet. Geol. 2018, 39, 277–284. [Google Scholar]
  38. Mclennan, S.M.; Hemming, S.R.; Taylor, S.R.; Eriksson, K.A. Early proterozoic crustal evolution: Geochemical and NdPb isotopic evidence from metasedimentary rocks, southwestern North America. Geochim. Cosmochim. Acta 1995, 59, 1153–1177. [Google Scholar] [CrossRef]
  39. Wang, J.; Wang, S.; Deng, Z. Survey on challenges in clustering analysis research. Control Decis. 2012, 27, 321–328. [Google Scholar]
  40. Torgerson, W.S. Theory and Methods of Scaling; John Wiley & Sons: New York, NY, USA, 1958. [Google Scholar]
  41. Gan, Z.; Zhou, F.; Xiao, Y. Study on the algorithm for multidimensional scaling. J. Tsinghua Univ. 1991, 31, 20–27. [Google Scholar]
  42. He, K. A Method for Fault Diagnosis Based on Multidimensional Scaling and Neural Network in Power Electronic Circuit. Master’s Thesis, Hefei University of Technology, Hefei, China, 2018. [Google Scholar]
  43. Wei, Z.; Li, X.; Sinclair, H.; Fan, X.; Wang, J.; Zhang, C.; Jiebu, G. The embryonic Himalayan foreland basin revealed in the eastern Yarlung Zangbo suture zone, southeastern Tibet. Sediment. Geol. 2020, 407, 105743. [Google Scholar] [CrossRef]
  44. Miall, A. The Geology of Fluvial Deposits: Sedimentary Facies, Basin Analysis and Petroleum Geology; Springer: New York, NY, USA, 1996; Volume 575. [Google Scholar]
  45. Tan, C.; Yu, X.; Qu, J.; Wang, Z.; Li, X.; Gao, Z. Complicated conglomerate lithofacies and their effects on hydrocarbons. Pet. Sci. Technol. 2014, 32, 2746–2754. [Google Scholar] [CrossRef]
  46. Yao, Z.; Li, S.; Yu, X.; Deleqiati, J.; Yang, F.; Wang, W.; Akedan, S.; Yang, X.; Zheng, B.; Li, L.; et al. Effects of the interaction of tectonics, eustasy, climate, and minerals on the sedimentary evolution of early-middle Jurassic in the Hongshanzui region in Junggar Basin. J. Pet. Sci. Eng. 2021, 196, 107967. [Google Scholar] [CrossRef]
  47. Pyros, A.; Pujalte, V.; Schmitz, B. Mid-latitude alluvial and hydroclimatic changes during the Paleocene–Eocene Thermal Maximum as recorded in the Tremp-Graus Basin, Spain. Sediment. Geol. 2022, 435, 106–155. [Google Scholar] [CrossRef]
  48. Martini, L.; Leckie, D. Anatomy and evolution of a Lower Creta-ceous alluvial plain: Sedimentology and palaeosols in the upper BlairmoreGroup, south-western Alberta, Canada. Sedimentology 1997, 44, 197–220. [Google Scholar]
  49. Li, F.; Li, D.; Deng, X.; Liu, Z.; Wang, F.; Li, S.; Wang, Z. The microfacies architecture of delta front along gentle slope zone of Yanchang Formation in Huachi Area, Shanxi-Gansu-Ningxia Basin. Acta Sedimentol. Sin. 2002, 20, 582–587. [Google Scholar]
  50. Zhang, Y.; Qi, X.; Cheng, X.; Luo, Z. Approach to sedimentary environment of late Carbniferous-Permian in Junggar Basin. Xinjiang Pet. Geol. 2007, 28, 673–675. [Google Scholar]
  51. Zhao, Y.; Xiao, L. Coupling between the permian volcanic--sedimentary sequences and the basin evolution in the Western Junggar Foreland Basin. Geol. Rev. 2000, 46, 530–535. [Google Scholar]
  52. Du Jinhu, Z.D.; Yong, T.; Chunming, J.; Yang, X. Prospects in Upper Permian and strategic discovery in Shawan sag, Junggar Basin. China Pet. Explor. 2019, 24, 24–35. [Google Scholar]
  53. Allen, J.L.; Johnson, C.L. Facies control on sandstone composition (and influence of statistical methods on interpretations) in the John Henry Member, Straight Cliffs Formation, Southern Utah, USA. Sediment. Geol. 2010, 230, 60–76. [Google Scholar] [CrossRef]
  54. Rimmer, S.M.; Thompson, J.A.; Goodnight, S.A.; Robl, T.L. Multiple controls on the preservation of organic matter in Devonian–Mississippian marine black shales: Geochemical and petrographic evidence. Palaeogeogr. Palaeoclimatol. Palaeoecol. 2004, 215, 125–154. [Google Scholar] [CrossRef]
  55. Kimura, H.; Watanabe, Y. Oceanic anoxia at the Precambrian-Cambrian boundary. Geology 2001, 29, 995–998. [Google Scholar] [CrossRef]
  56. Cullers, R.L. The controls on the major and trace element variation of shales, siltstones, and sandstones of pennsylvanian-permian age from uplifted continental blocks in colorado to platform sediment in Kansas, USA. Geochim. Cosmochim. Acta 1994, 58, 4955–4972. [Google Scholar] [CrossRef]
  57. Zhang, M.; Liu, Z.; Xu, S.; Sun, P.; Hu, X. Element response to the ancient lake information and its evolution history of argillaceous source rocks in the Lucaogou Formation in Sangonghe area of southern margin of Junggar Basin. J. Earth Sci. 2013, 24, 987–996. [Google Scholar] [CrossRef]
  58. Wignall, P.B.; Twitchett, R.J. Oceanic anoxia and the end permian mass extinction. Science 1996, 272, 1155–1158. [Google Scholar] [CrossRef]
  59. Bryn, J.; Manning, D.A. Comparison of geochemical indices used for the interpretation of palaeoredox conditions in ancient mudstones. Chem. Geol. 1994, 111, 111–129. [Google Scholar]
  60. Therrien, F. Palaeoenvironments of the latest cretaceous (Maastrichtian) dinosaurs of Romania: Insights from fluvial deposits and paleosols of the Transylvanian and Haeg basins. Palaeogeogr. Palaeoclimatol. Palaeoecol. 2005, 218, 15–56. [Google Scholar] [CrossRef]
  61. Opluštil, S.; Lojka, R.; Rosenau, N.A.; Strnad, L.; Sýkorová, I. Middle Moscovian climate of eastern equatorial Pangea re.orded in paleosols and fluvial architecture. Palaeogeogr. Palaeoclimatol. Palaeoecol. 2015, 440, 328–352. [Google Scholar] [CrossRef]
  62. Bercovici, A.; Cui, Y.; Forel, M.B.; Yu, J.; Vajda, V. Terrestrial paleoenvironment characterization across the Permian–Triassic boundary in South China. J. Asian Earth Sci. 2015, 98, 225–246. [Google Scholar] [CrossRef]
  63. Chen, L.; Guo, F.; Steel, R.J.; Li, Y. Petrography and geochemistry of the late cretaceous redbeds in the Gan-Hang Belt, southeast China: Implications for provenance, source weathering, and tectonic setting. Int. Geol. Rev. 2016, 58, 1196–1214. [Google Scholar] [CrossRef]
  64. Tian, Y.; Zhao, X.; Wang, L.; Tu, B.; Xie, G.; Zeng, B. Geochemistry of clastic rocks from the Triassic Xujiahe Formation, Lichuan area, southwestern Hubei: Implications for weathering, provenance and tectonic setting. Acta Petrol. Sin. 2015, 31, 261–272. [Google Scholar]
  65. Bhatia, M.R. Rare earth element geochemistry of Australian Paleozoic graywackes and mudrocks: Provenance and tectonic control. Sediment. Geol. 1985, 45, 97–113. [Google Scholar] [CrossRef]
  66. Xiong, T.; Dang, Y.; Jia, C.; Li, S.; Shang, C. High-resolution sequence architecture and sandbody distribution prediction of fan delta: A case study of upper wuerhe Formation of Permian in west slope of shawan Sag. J. Xi’an Shiyou Univ. Nat. Sci. Ed. 2021, 36, 16–22. [Google Scholar]
  67. Xu, M.; Wei, X.; Yang, R.; Wang, P.; Cheng, X. Research progress of provenance tracing method for heavy mineral analysis. Adv. Earth Sci. 2021, 36, 154–171. [Google Scholar]
  68. Morton, A.C.; Hallsworth, C.R. Processes controlling the composition of heavy mineral assemblages in sandstones. Sediment. Geol. 1999, 124, 3–29. [Google Scholar] [CrossRef]
  69. Zhao, H.; Liu, C. Approaches and prospects of provenance analysis. Acta Sedimentol. Sin. 2003, 21, 409–415. [Google Scholar]
  70. Song, K.; Lv, J.; Du, J.; Wang, H. Source direction analysis and delta depositional systems of yanchang Formation of the upper Triassic in the central Ordos Basin. J. Palaeogeogr. 2002, 4, 59–66. [Google Scholar]
Figure 1. Location and work area map of the Permian Jiamuhe Formation in the Shawan Sag, Junggar Basin (the red box marks the studied formation).
Minerals 13 01251 g001
Figure 2. The 3D seismic section of the G147-G5-CP10-ZJ1 well of the Permian Jiamuhe Formation in the Shawan Sag, Junggar Basin.
Minerals 13 01251 g002
Figure 3. Triangle diagram for the sandstone classification of the Permian Jiamuhe Formation in the Shawan Sag, Junggar Basin. (I—quartz sandstone; II—feldspar quartz sandstone; III—lithic quartz sandstone; IV—feldspathic lithic quartz sandstone; V—feldspar sandstone; VI—lithic feld-spar sandstone; VII—debris-arkosic sandstone; VIII—fedspar debris sandstone; IX—felds pathic lithic sandstone; X—lithic sandstone).
Minerals 13 01251 g003
Figure 4. The core and thin sections of the Permian Jiamuhe Formation in the Shawan Sag, Junggar Basin. Note: (a,b) are the cores; (c,d) are the thin sections. (a)—G15, 4498.25 m, P1j, gravelly sandstone. (b)—CP005, 2972 m, P1j, tuffaceous conglomerate. (c)—G15, 4498.25 m, P1j, calcite metasomatic, the intergranular pores are wells developed, (-). (d)—CP005, 2972 m, P1j, the particles are in point-tangential contact, the main interstitial pore spaces appear filled by analcite, (-).
Minerals 13 01251 g004
Figure 5. Discrimination diagram of the source types of the Hf-La/Th trace elements of the Permian Jiamuhe Formation in the Shawan Sag, Junggar Basin [31].
Minerals 13 01251 g005
Figure 6. La/Sc-Co/Th diagram of the source compositions of the Permian Jiamuhe Formation in the Shawan Sag, Junggar Basin.
Minerals 13 01251 g006
Figure 7. Chondrite-normalized REE patterns of the Permian Jiamuhe Formation in the Shawan Sag, Junggar Basin.
Minerals 13 01251 g007
Figure 8. Plane distribution characteristics of the heavy mineral assemblage types of the Permian Jiamuhe Formation in the Shawan Sag, Junggar Basin.
Minerals 13 01251 g008
Figure 9. Q-type clustering pedigree of the heavy minerals of the Permian Jiamuhe Formation in the Shawan Sag, Junggar Basin.
Minerals 13 01251 g009
Figure 10. MDS results of the heavy minerals of the Permian Jiamuhe Formation in the Shawan Sag, Junggar Basin.
Minerals 13 01251 g010
Figure 11. PCA results for the heavy minerals of the Permian Jiamuhe Formation in the Shawan Sag, Junggar Basin.
Minerals 13 01251 g011
Figure 12. Lithofacies of the Permian Jiamuhe Formation in the Shawan Sag, Junggar Basin. MVSF, mixed volcanic sedimentary facies; Gcm, multigrade supported conglomerate lithofacies; Gcs, same-grade supported conglomerate lithofacies; Gms, sand supporting the suspended conglomerate lithofacies; Gi, imbricated conglomerate lithofacies; Gg, graded bedding conglomerate lithofacies; Gmg, gravel supporting suspended conglomerate lithofacies; St, trough cross-bedding sandstone lithofacies; Sm, massive bedding sandstone.
Minerals 13 01251 g012
Figure 13. Lithofacies associations of the Permian Jiamuhe Formation in the Shawan Sag, Junggar Basin. FA-1 (Gmg Gcm Gcs): from base to top, this association is composed of reddish brown, medium-coarse conglomerates (gravelly matrix-supported conglomerate facies, Gmg), which are suspended in fine-grained sediments, and a large number of “floating clasts” in granules and sandstones with an “up-right” shape, with poor texture maturity and a relatively large pore structure. These are followed by conglomerates with multistage particles supporting conglomerate facies (Gcm) in which the conglomerates are mixed in grain size; the texture maturity is poor, and the interconglomerates are filled with different grades of conglomerate and sandstone. Then, the same-grade particles are supported by conglomerate facies (Gcs) that develop upwards, with better rounding and sorting than Gcm. This area is usually dominated by red-brown, medium-fine conglomerates with smaller pore spaces between the particles. At a large scale, the sedimentary bodies show flat tops and erosional concave-up bases, occasionally with profuse load casts. The entire association is arranged in a thinning and fining upwards sequence topped by an erosive surface.
Minerals 13 01251 g013
Figure 14. The Baiyang River section of the Permian Jiamuhe Formation in the Shawan Sag, Junggar Basin (N 46°7′54.8″, E 85°27′32.6″). Note: ①~④ are detailed maps of the four cycles respectively.
Minerals 13 01251 g014
Figure 15. The volcano erupted in multiple stages, forming the interbedded distribution of volcanic lava and conglomerate of the Permian Jiamuhe Formation in the Shawan Sag, Junggar Basin (N 46°07′1.4″, E 85°27′34.5″), scale (22 cm).
Minerals 13 01251 g015
Figure 16. The plane distribution of the scour surface of the Permian Jiamuhe Formation in the Shawan Sag, Junggar Basin.
Minerals 13 01251 g016
Figure 17. The sedimentary microfacies of the Permian Jiamuhe Formation in the Shawan Sag, Junggar Basin.
Minerals 13 01251 g017
Figure 18. The paleoclimate indicators of the Permian Jiamuhe Formation in the Shawan Sag, Junggar Basin. Note: (a)—Th/U values, (b)—V/(V+Ni) values, (c)—V/Cr values, (d)—Cu/Zn values, (e)—Sr/Ba values, (f)—Sr/Cu values.
Minerals 13 01251 g018
Figure 19. Mud colors of the Permian Jiamuhe Formation in the Shawan Sag, Junggar Basin.
Minerals 13 01251 g019
Figure 20. Discrimination diagram of the trace element La-Th-SC tectonic environment of the Permian Jiamuhe Formation in the Shawan Sag, Junggar Basin [32].
Minerals 13 01251 g020
Table 1. Analysis results of the trace and rare earth elements of the Permian Jiamuhe Formation in the Shawan Sag, Junggar Basin (×10−6).
Well CP23CP002CP5ZJ3G13CP001JL57Average
Depth (m)2023.502775.104733.224955.004130.762331.905301.20
Pb6.909.0412.0711.5213.3815.1913.0311.59
Zn33.3671.0885.0267.8953.2955.0252.0959.68
Cr27.0826.0073.2229.0724.9514.835.9528.73
Co 5.82 10.28 9.21 10.76 12.62 6.73 8.93 9.19
Rb19.3239.7754.7558.5069.3864.6715.1045.93
Sr 164.13 269.41 177.12 249.65 186.69 1117.25 159.77 332.0
V 75.92 105.79 129.11 101.89 70.63 62.66 107.58 93.37
Sc 8.05 13.72 10.39 12.67 9.14 9.82 20.62 12.06
U 0.71 0.93 1.04 1.12 1.62 1.82 4.34 1.65
Th 5.91 6.72 7.72 6.56 6.31 10.46 2.93 6.66
La41.8126.4827.2924.8124.6726.935.8429.69
Ce37.7741.240.0736.8243.3141.3479.5145.72
Pr6.615.95.975.34.875.310.446.34
Nd26.927.325.3624.0221.522.0249.3528.06
Sm5.336.885.25.644.634.4211.526.23
Eu1.441.641.351.511.161.073.881.72
Gd4.555.34.454.363.513.4710.445.15
Tb0.831.010.810.80.590.641.880.94
Dy4.795.764.264.755.633.9411.415.79
Ho0.861.20.851.000.660.782.251.09
Er2.523.762.673.012.022.526.733.32
Tm0.370.550.390.430.320.411.030.50
Yb2.23.532.563.222.312.997.463.47
Lu0.380.610.420.490.390.451.250.57
Rb/Sr0.12 0.15 0.31 0.23 0.37 0.06 0.09 0.19
Th/U8.34 7.25 7.42 5.85 3.88 5.74 0.67 5.59
La/Th7.073.94 3.533.783.912.5712.255.29
La/Sc5.191.932.631.962.702.741.742.70
Th/Sc0.73 0.49 0.74 0.52 0.69 1.06 0.14 0.62
Sc/Cr0.30 0.53 0.14 0.44 0.37 0.66 3.69 0.88
Th/Co1.02 0.65 0.84 0.61 0.50 1.55 0.33 0.79
ΣREE136.35 131.10 121.63 116.16 115.56 116.25 232.99 139
L/H7.26 5.04 6.42 5.43 6.49 6.65 4.49 5.97
Ce/Ce*0.52 0.78 0.76 0.76 0.93 0.83 0.99 0.80
Eu/Eu*0.870.80 0.84 1.67 0.85 1.54 1.75 1.19
La/Yb18.98 7.50 10.68 7.70 10.66 8.99 4.81 9.90
(La/Yb)N12.82 5.07 7.22 5.20 7.20 6.07 3.25 6.69
(La/Yb)UCC1.20 0.47 0.68 0.49 0.67 0.57 0.30 0.63
Note: L/H refers to light/heavy rare earth, N indicates the standardization of elements relative to chondrites, UCC represents standardization relative to the upper continental crust, Eu/Eu* = 2 × EuN/(SmN + GdN) and Ce/Ce* = 2 × CeN/(LaN + NdN), the values refer to the study by Rudnick and Gao (2014) [33], and the chondrite values refer to the study by Taylor (1985) [31].
Table 2. Contents of the heavy minerals of the Permian Jiamuhe Formation in the Shawan Sag, Junggar Basin (wB/%).
Well Total Mass of Heavy
Minerals (g)
Terrigenous Mineral (%)
PerovskiteMagnetiteZirconLimonitePyroxeneSpinelEpidoteAugiteGarnetIlmeniteSphene
C900.03 0.2416.080.6866.330.220.002.400.110.1611.540.00
CP70.73 0.0010.140.0020.800.000.000.0069.110.000.000.00
CP51.541.726.050.690.1887.220.0273.925.180.250.130.04
CP100.30 0.199.670.111.750.000.000.010.000.000.000.09
CP260.01 2.9536.350.4244.030.000.000.001.710.210.000.00
CP0050.12 1.3447.360.302.450.000.000.0041.720.260.000.10
ZJ30.60 7.518.290.025.6572.880.030.590.000.054.570.12
ZJ41.39 1.5422.610.0422.7149.880.020.080.000.011.930.14
ZJ50.23 1.4822.110.360.7560.850.090.570.000.2311.860.00
ZJ63.68 6.0410.500.3957.610.000.0115.820.520.085.510.04
XG11.860.370.621.747.940.000.070.810.000.3762.540.51
Note: the authigenic minerals were not involved in the heavy mineral analysis and are not listed in the table.
Table 3. Statistical classification of the heavy minerals of the Permian Jiamuhe Formation in the Shawan Sag, Junggar Basin.
CategoryHeavy Mineral AssemblageQ-Type ClusterPCAMDS
IPyroxene plus magnetiteZJ3, ZJ4, ZJ5, and CP10ZJ3, ZJ4, ZJ5, CP10, and ZJ6ZJ3, ZJ4, ZJ5, and CP10
IIAugite plus limoniteCP7 and CP005CP7 and CP005CP7 and CP005
IIILimonite plus magnetite plus ilmeniteZJ6 and ZJ1XG1ZJ6 and XG1
IVEpidote plus magnetite plus augiteCP5CP5CP5
Table 4. Comparison of the trace element characteristic parameters between sandstone and the different tectonic environments of the Permian Jiamuhe Formation in the Shawan Sag, Junggar Basin.
Tectonic SettingOceanic Island ArcContinental Island ArcActive Continental MarginPassive MarginsJiamuhe Formation
Pb6.9 ± 1.415.1 ± 1.124 ± 1.116 ± 3.411.59
Th2.27 ± 0.711.1 ± 1.118.8 ± 3.016.7 ± 3.56.66
Sc19.5 ± 5.214.8 ± 1.78 ± 1.16 ± 1.412.06
V131 ± 4089 ± 13.748 ± 5.931 ± 9.993.37
Co18 ± 6.312 ± 2.710 ± 1.75 ± 2.49.19
Zn89 ± 18.674 ± 9.852 ± 8.626 ± 1258.68
La8.72 ± 2.524.4 ± 2.333 ± 4.533.5 ± 5.829.68
Ce22.53 ± 5.950.5 ± 4.372.7 ± 9.871.9 ± 11.545.72
Nd11.36 ± 2.920.8 ± 1.625.4 ± 3.429 ± 5.0328.06
Rb/Sr0.05 ± 0.050.65 ± 0.330.89 ± 0.241.19 ± 0.400.19
Th/U2.1 ± 0.784.6 ± 0.454.8 ± 0.385.6 ± 0.75.59
La/Th4.26 ± 1.22.36 ± 0.31.77 ± 0.12.20 ± 0.475.29
La/Sc0.55 ± 0.221.82 ± 0.34.55 ± 0.86.25 ± 1.352.70
Th/Sc0.15 ± 0.080.85 ± 0.132.59 ± 0.53.06 ± 0.80.63
Sc/Cr0.57 ± 0.160.32 ± 0.060.30 ± 0.020.16 ± 0.020.87
Table 5. Comparison of the REE characteristics of the Permian Jiamuhe Formation in the Shawan Sag, Junggar Basin [60].
Tectonic Settings
Provenance Type
Oceanic Island Arc and Undissected Magmatic ArcContinental Island Arc and Dissected Magmatic ArcAndean-type Continental Margin (Uplifted Basement)Passive Margins (Craton Interior and Tectonic Highlands)Jiamuhe Formation
La8 ± 1.727 ± 4.5373929.69
Ce19 ± 3.759 ± 8.2788545.72
Eu/Eu*1.04 ± 0.110.79 ± 0.130.60.561.19
ΣREE58 ± 10146 ± 20186210139
L/H3.8 ± 0.97.7 ± 1.79.18.55.97
La/Yb4.2 ± 1.311.0 ± 3.612.515.99.90
(La/Yb)N2.8 ± 0.97.5 ± 2.58.510.86.69
Disclaimer/Publisher’s Note: The statements, opinions and data contained in all publications are solely those of the individual author(s) and contributor(s) and not of MDPI and/or the editor(s). MDPI and/or the editor(s) disclaim responsibility for any injury to people or property resulting from any ideas, methods, instructions or products referred to in the content.

