Article

Paleoenvironmental Significance of Claystone in the Middle Ordovician Miboshan Formation of Ordos Basin, China: Evidence from Trace Elements

School of Land Resource Engineering, Kunming University of Science and Technology, Kunming 650093, China
*
Author to whom correspondence should be addressed.
Minerals 2023, 13(11), 1383; https://doi.org/10.3390/min13111383
Submission received: 9 September 2023 / Revised: 26 October 2023 / Accepted: 26 October 2023 / Published: 28 October 2023

Abstract

:
The Miboshan Formation in the Middle Ordovician plays a crucial role in the sedimentary evolution of the western margin of the Ordos Basin as it represents the transition from a carbonate platform to a deep-water slope-basin environment. This study focuses on the paleoenvironment of claystone in the Middle Ordovician Miboshan Formation, located in the Ningxia Hui Autonomous Region of the Ordos Basin. The study aims to analyze the influence of sea level and salinity on rare earth elements, investigate terrigenous input and redox conditions through trace element analysis, and exemplify the coupling relationship between depositional and tectonic environments. The Miboshan Formation profile consists of thick- to thin-bedded limestones, mainly composed of lenticular calcirudite with erosion surfaces and horizontal laminae. Grayish black claystone have deformation structures and graptolite fossils. Based on the total number of rare earth elements and the trace element indexes, the seawater properties, redox degree, and terrigenous input are located in two data sets in different parts of the profile (i.e., sample 6-1 to 6-5: Concentrated in lower part, and samples 6-6 to 6-8: Concentrated in upper part), implying that they were deposited at different subaqueous uplifts. Negative Ce anomalies, La/Ce, V/Cr, and Fe3+/Fe2+ ratios indicate an anoxic condition with stratified redox structure, whereas characteristic LaN/NdN, Y/Ho, and Sr/Ba suggest deep-water affected by fresh water. The ∑REEs and Th/U ratios indicated that the study area was mainly deposited from terrigenous materials in the stable tectonic area. According to the ages of deposition, lithologic analyses, and chemical parameters, the Miboshan Formation is related to the deep water environment in a ponded basin influenced by subaqueous uplift resulting from plate subduction in an active continental margin. This study provides valuable insights into paleoenvironment and paleotectonic environments of the Miboshan Formation in the Middle Ordovician.

1. Introduction

The Middle and Upper Ordovician in the western margin of the Ordos Basin are ideal areas for the study of deep-water deposits and potential targets of deep-water oil and gas exploration, giving them vital research significance [1] because of their various deep-water deposits and gravity flow, such as the mass transport and debris flow and turbidity currents [2,3,4], and their tractive currents, such as contour currents, internal waves, and internal tides [5,6]. However, the tectonic setting of the Middle and Late Ordovician in this area remains unclear [7,8,9,10], seriously hindering further research for other fields. The main viewpoints can be summarized as follows. (1) Aulacogen developed in the compression background of the North Qilian area during the geological age from Middle Ordovician Darrivelian to Late Ordovician Sanbian, and the basin filling is characterized by thick, massive, deep-water gravity flow and graptolite-bearing fine-grained deposits [2]. (2) A passive continental margin developed in the extensional tectonic background, primarily based on the slump accumulation and geochemical characteristics of Miboshan and its surrounding areas [7,11]. (3) An active continental margin, including the accretionary wedge near the trench [12], the back-arc foreland of the continental margin subduction [13], the arc-back extensional basin of the intra-oceanic subduction [14], and the peripheral foreland, was formed by collisional zones [4,15]. (4) The Xiangshan Group in Qilian and the Zhangxia Formation in the Alexa stratigraphic area have a collage-like contact relationship, indicating that the Xiangshan Group is an exotic block [8].
The Miboshan Formation has great significance in the study of the paleogeography and paleotectonic evolution of the western margin of Ordos Basin because it is the first stratum of deep-water deposits in the study area. This presents the crucial horizon of transformation from an epicontinental carbonate platform to deep-water slope-basin environment. In this study, we focus on the Miboshan Formation in the Zhongwei and Tongxin areas, Ningxia Hui Autonomous Region, in the synthetic analysis of the trace element characteristics of claystones because of the large lithological change in the vertical section and the rapid evolution of sedimentary characteristics according to detailed field work and previous research in the study area. The sedimentary paleogeography and paleo-tectonic environment and its vertical evolution in the Miboshan Formation are also discussed.

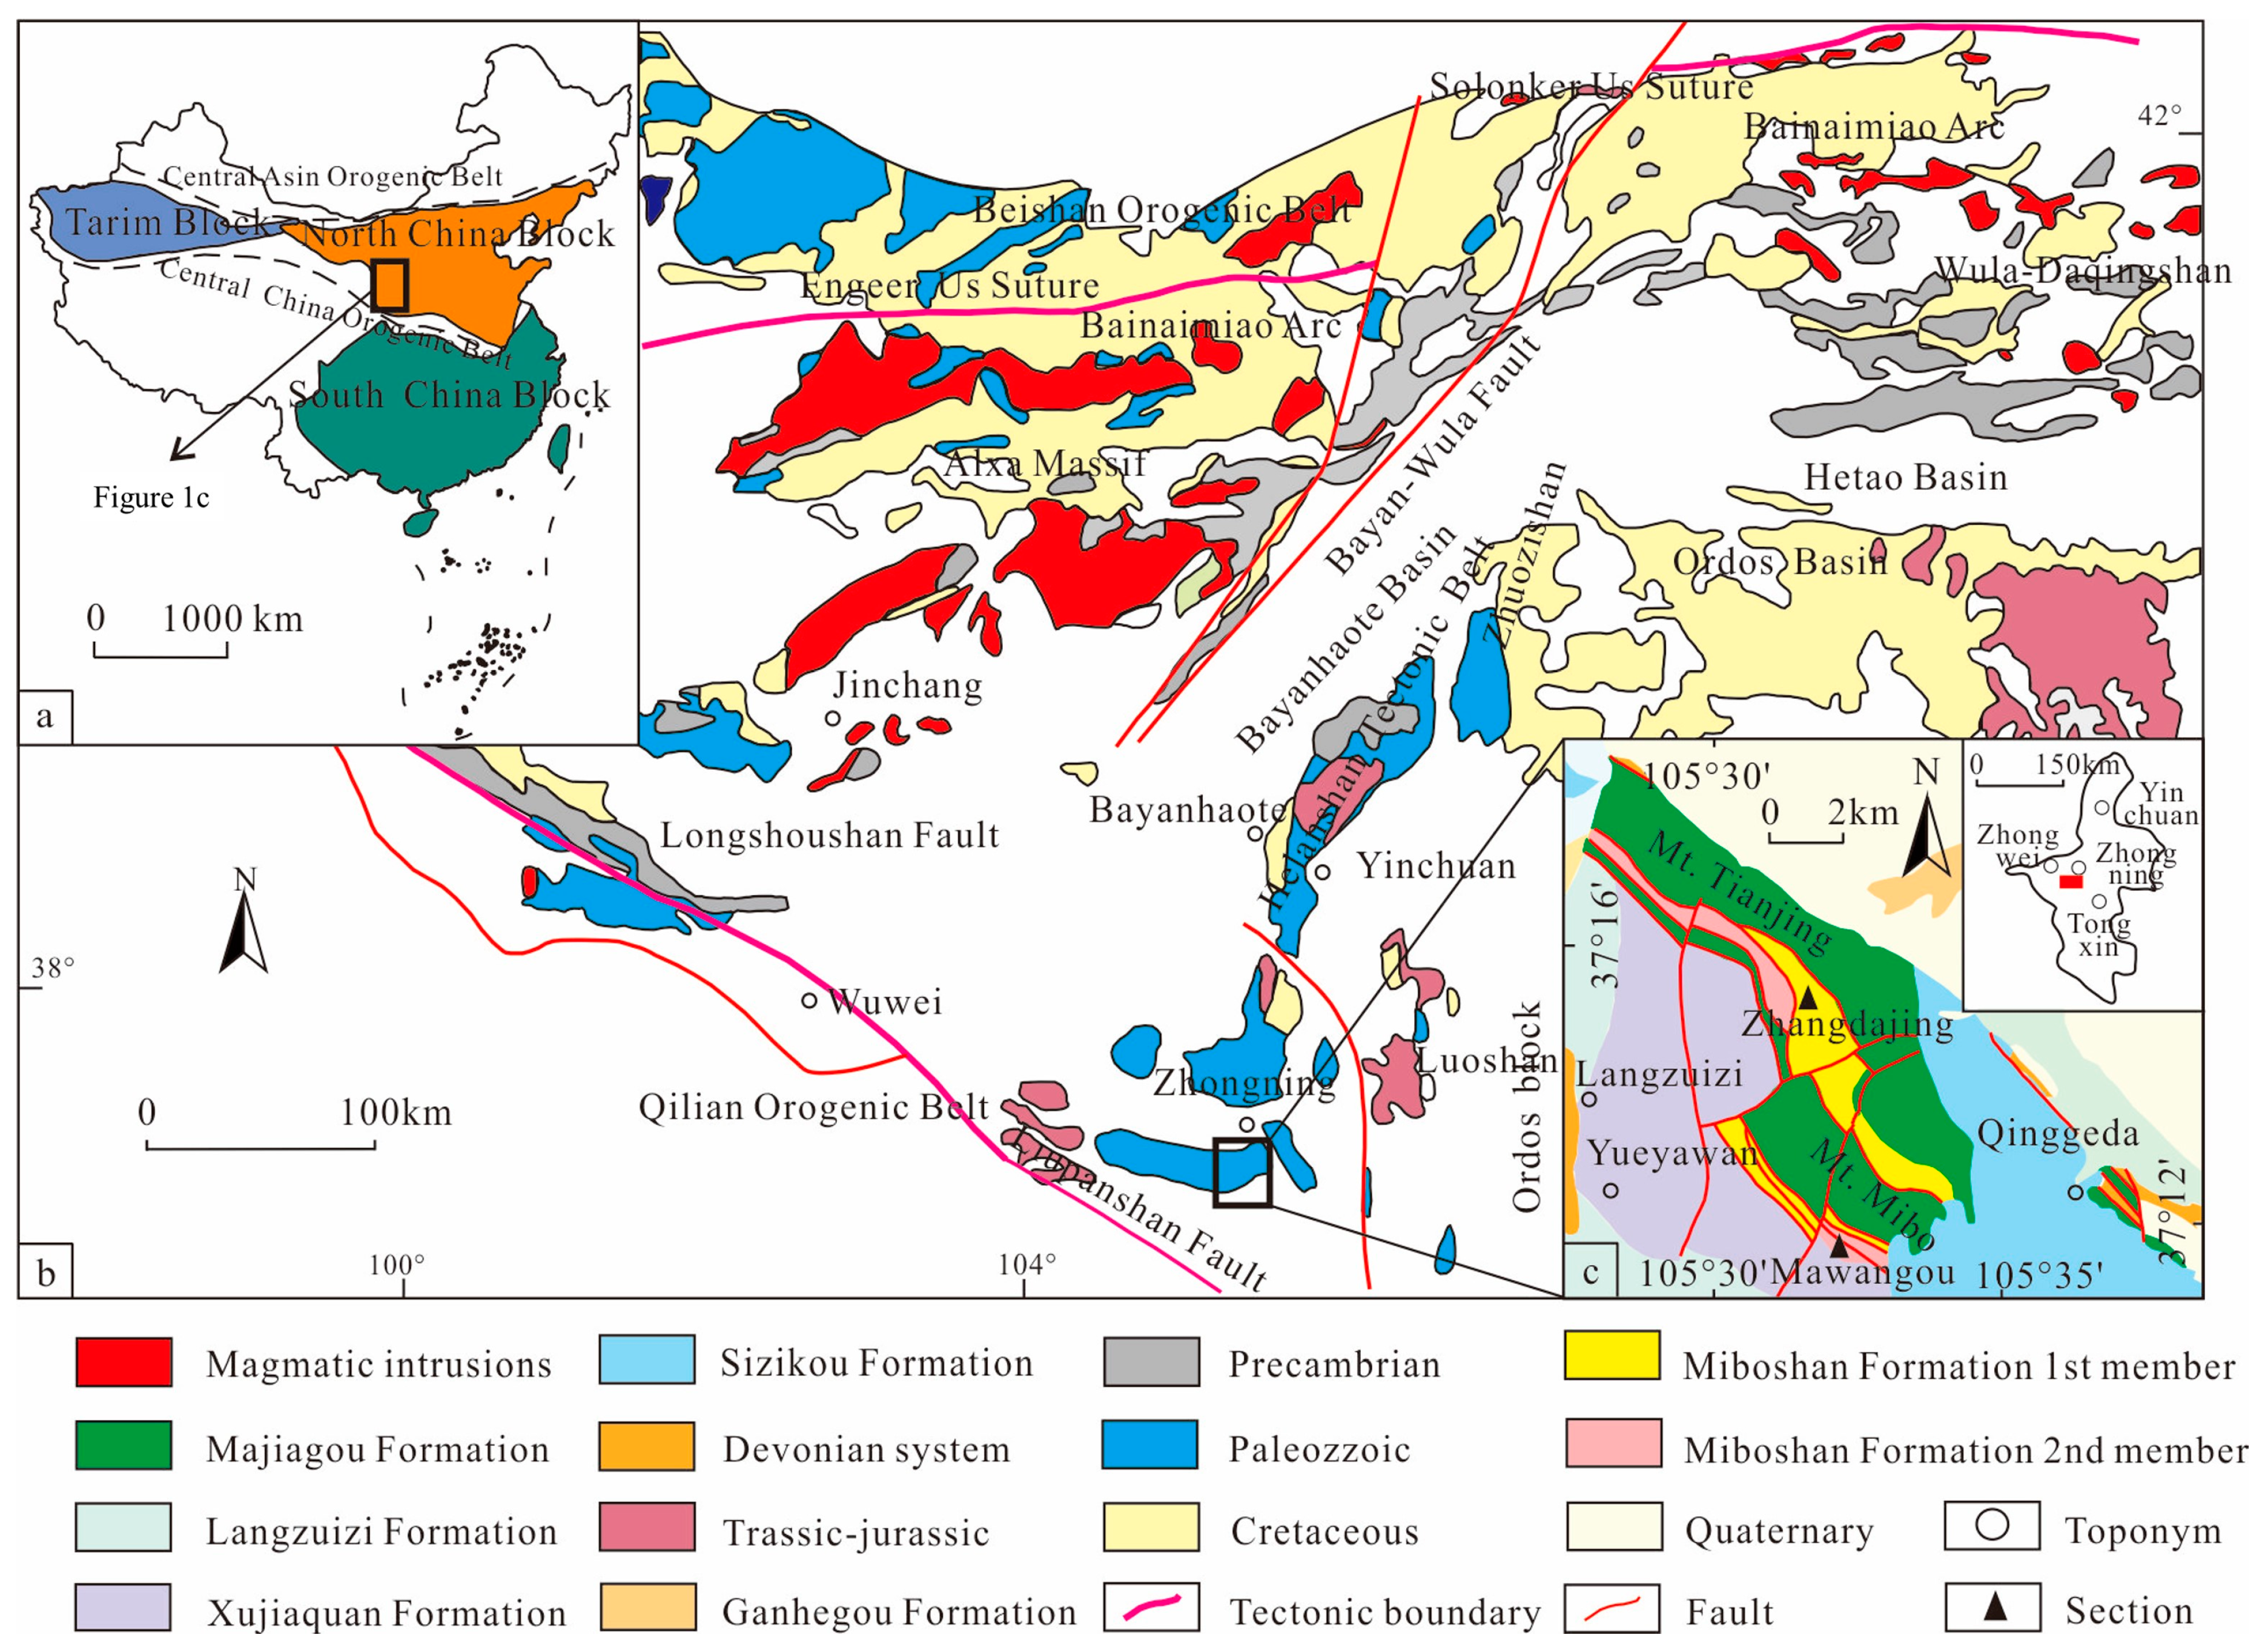
2. Geological Setting

The study area is located in the western region of Ordos Basin, which is defined by the Qilian Orogenic Belt of the Central China Orogenic Belt (CCOB) to the south and the Central Asin Orogenic Belt (CAOB) to the north (Figure 1a). The area belongs to the western segment of the Proto-Tethyan Northern Branch of the Qin-Qi-Kun Ocean in Middle and Upper Ordovician [16] and is located between the North China Block (Craton) and Alexa microblock in the Qaidam–North China Plate [12,17] (Figure 1b). The northern part of the study area is adjacent to Bayanhot Basin, and the east and west sides are the Ordos landmass and the Qilian orogenic belt, which are influenced by the evolution of the North Qilian (Figure 1b). In the tectonic units of the Ordos Basin, the study area belongs to the western thrust belt, which is composed of several significant eastward overthrust faults with a near north–south strike and a westward dip; it is adjacent the Tianhuan syncline in the east (Figure 2). The Yinchuan–Wuzhong micro-continent or subaqueous uplift (Figure 2) may have existed in the Western Ordos basin in Middle and Late Ordovician [12,14,16]. In terms of geographical location, the study area is located in the Zhangdajing and Mt. Mibo areas between the cities of Zhongwei and Tongxin in the Ningxia Hui Autonomous Region, and in the tectonic units of the Ordos Basin (Figure 2).
The Miboshan Formation was named by the Ningxia Survey Team in 1963 and published by the Ningxia Stratigraphic Table Compilation Group in 1990. The named section is located in Zhangdajing, Tongxin City, Ningxia. This section was originally defined by the alternation of limestone and claystone in the lower part, which changed into limestone and tabular claystone along the strike, and limestone and claystone with graptolites in the upper part [18]. The area was expanded to Mt. Helan, Mt. Niushou, and Mt. Luo during the 1:200,000 regional survey [1]. However, arguments regarding the original and extensional definitions of the Miboshan Formation exist due to significant differences in lithology and thickness (thicker than 2000 m in some areas) [10,19]. The distribution of the Miboshan Formation spreads to the northeast, which is consistent with the upper age of the Yingtaogou Formation in the Mt. Helan area, and is distributed in Mt. Tianjing and Mt. Mibo in the Zhangdajing area and Mt. Daluo, Mt. Xiaoluo, and Mt. Mei in the Weizhou area (Figure 1c). The lower contact of the Miboshan Formation conformably underlies the Lower Ordovician Tianjingshan Formation (Majiagou Formation), which consists of thick-bedded, massive limestone [17]. The Miboshan Formation is conformity underlain by greyish-green medium- to thick-bedded sandstone induced by turbidity currents of the Xujiaquan Formation. Furthermore, there is some controversy over the age of the overlying Xiangshan Group due to conformable, fault, and collage-like contacts [8,11]. Fuchen Huo argued that Xujiaquan Formation might be a quasi-conformable contact in which faults are difficult to identify through field work and a conformable contact trend exists [18].

3. Samples and Methods

Detailed field work was proposed for the middle Ordovician Miboshan Formation in Ningxia, and eight geochemical samples of claystones were collected from equally spaced sites from the Mawangou section (sample number: 6-1 to 6-8). The first five samples (first data set) and the last three samples (second data set) were collected from the lower and upper parts, respectively, through equivalent interval sampling. Chemical analyses were performed on the unweathered samples, which were crushed and sieved to 60 μm, in the Analysis and Testing (Guangzhou) Co., Ltd. (Guangzhou, China). The trace element content was determined using inductively coupled plasma–mass spectrometry (ICP-MS), with average and relative standard deviations of less than 10% and 5%, respectively. The main elements were identified through X-ray fluorescence (XRF), with an error of less than 3%, and the FeO was examined by titration.
The related testing results and calculations for the eight samples are shown in Table 1. Rare earth elements (REEs), which were normalized using Post Archean Australian shale and chondrite [20], were used for the research on sedimentary environment and provenance, respectively. The shale-normalized (N) elemental anomalies were calculated through the average arithmetic method because the relative calculation error to the geometric average method [21] is less than 5%, and the formulas are as follows: (CeN/Ce*N) = 2CeN/(LaN + PrN), (EuN/Eu*N) = 2EuN/(SmN + GdN), (GdN/Gd*N) = 2GdN/(EuN + TbN), and (YN/Y*N) = 2YN/(DyN + HoN). The La anomaly was calculated using (LaN/La*N) = LaN/(3PrN-2NdN) for the Ce pervasive anomaly in the REE patterns [22]. The Ce anomaly index is Ceanom = lg [3CeN/(2LaN + NdN)], and the low marker N refers to standardized data.

4. Results

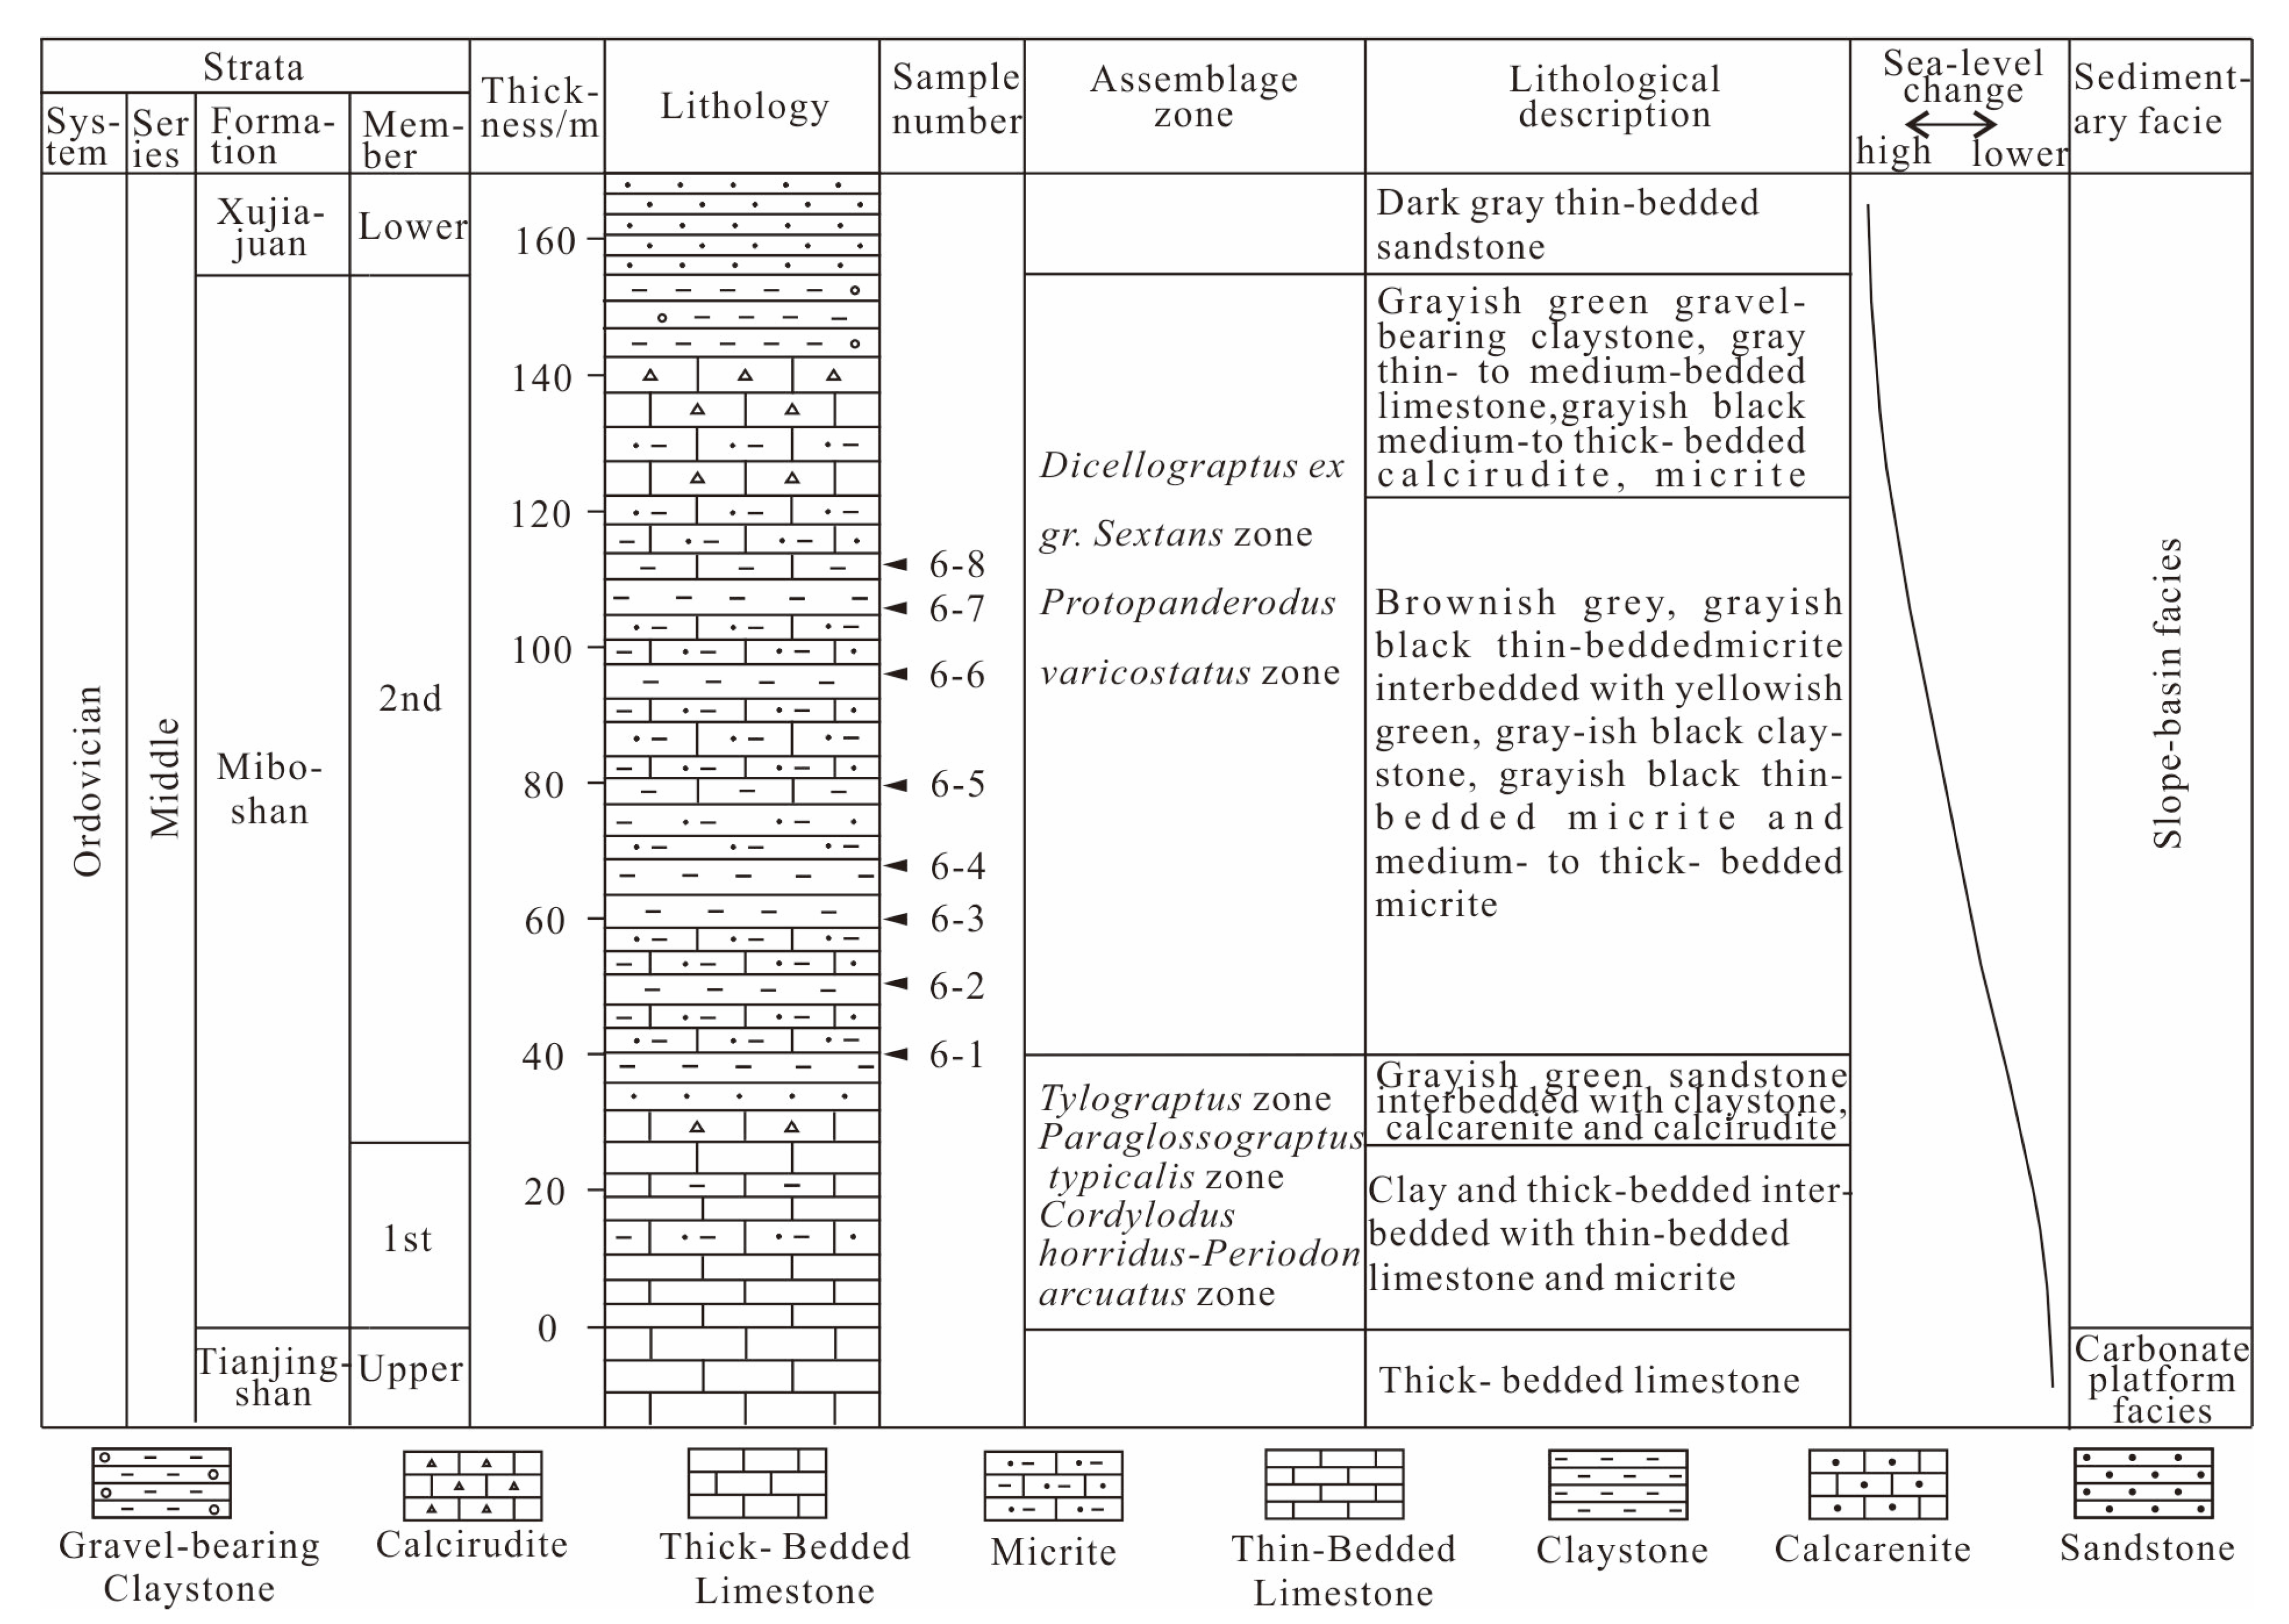
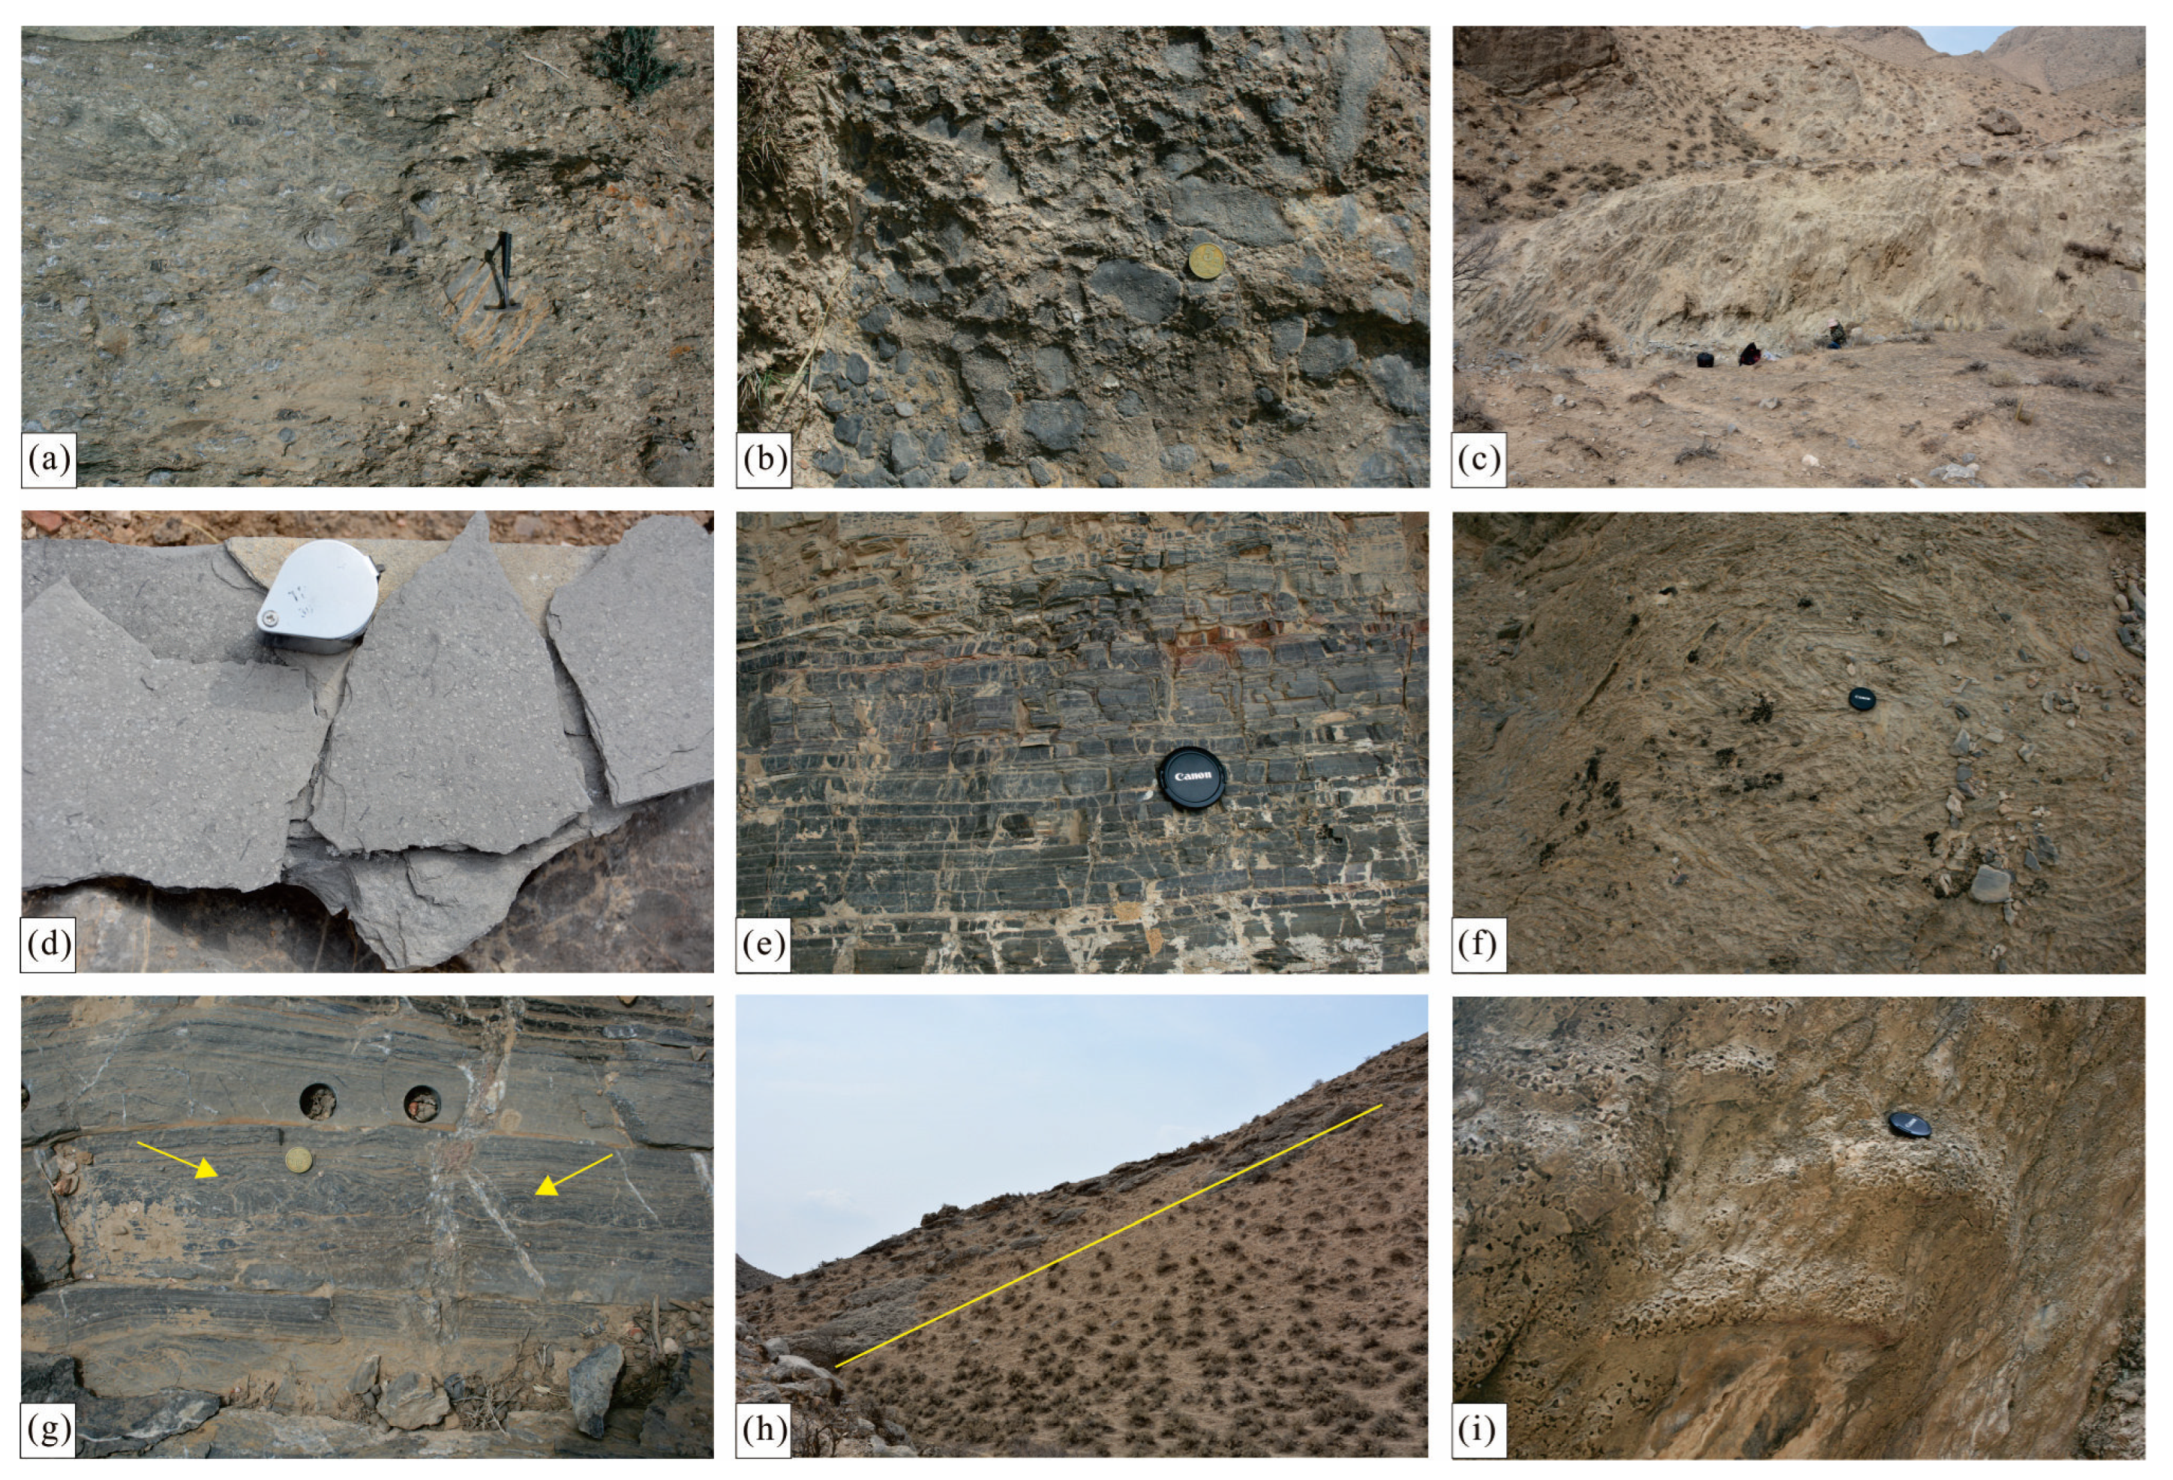
4.1. Lithologies of Profile

The Miboshan Formation in the study area is mainly composed of dark gray thin-bedded limestone and calcirudite, interbedded with grayish-green gravel-bearing claystone and claystone and can be divided into two members for lithologic differences: the first and second members (Figure 3). The main lithology of the first member is composed of dark gray medium- to thick-bedded calcarenite with abundant biological fossils, such as graptolites, trilobites, and conodonts, including the fossils of the Didymograputus murchisoni zone, and the bottom is grayish-black thin-bedded micrite or grayish green claystone, which is a disconformity underlain by the dark gray thick-bedded to massive limestone of the Tianjingshan Formation. The Zhangdajing, Jianshanzi, and Majangou sections are 168.5 m, bottom not found, and 27 m thick, respectively.
The second member of the Miboshan Formation can be divided into five parts, namely, the bottom, lower, middle, upper, and top parts, for lithology and grain size. The bottom part is mainly the interbeds of calcirudite, sandstone, and claystone in different thicknesses. In the interbeds of calcarenite and claystone, the calcarenite is disordered and uneven in size, and some of the calcarenite is lenticular (Figure 4a). A small amount of the calcarenite is in the Mawangou section, with a total thickness of 10–29 m, and the lithology of the Jianshanzi section transitions into calcirudite and gravel-bearing claystone, with a total thickness of 14–27 m (Figure 4b). The lower part has grayish black and dark gray thin-bedded micritic, argillaceous and bioclastic limestones alternating with grayish black thin-bedded and calcareous claystones. The claystone content is increasing while the micritic and bioclastic limestones are decreasing. The Mawangou section has a thickness of 26 m and is composed of grayish green claystones with abounded graptolites (Figure 4d), including Didymograputus murchisoni zone fossils; the samples (6-1 to 6-5) in the first data set were collected from this section. The lithology of the Jianshanzi section changes into fine-grained micritic and claystones with a horizontal bedding (Figure 4e) and slump deformation structures (Figure 4g). The middle part is grayish-black medium- to thick-bedded limestone with yellowish-green and grayish-black claystone, which transforms into medium- to thick-bedded argillaceous limestone and thin-bedded micritic argillaceous limestone as it moves upward. The Mawangou section is 10.7 m thick. The upper part consists of dark gray to grayish-black thin-bedded carbonaceous bearing micritic interbedded or alternated with yellowish-green to grayish-black calcareous claystones, which are increasing. The thin layer limestone of Miboshan Formation shows obvious interbed deformation (Figure 4f). The Mawangou section is 23.4 m thick; samples (6-6 to 6-8) of the second data set were collected from this section (Figure 4h). The top is composed of dark gray medium- to thick-bedded calcirudite and grayish-green gravel-bearing and grayish-green claystones. The thickness of the calcirudite at the top varies greatly in the transverse direction, and the cast is developed at the bottom, similar to the groove cast (Figure 4i). The composition of claystone is increasing, and the Mawangou section is 40.6 m thick.

4.2. Geochemical Characteristics

Evaluation of Sample Effectiveness

The REEs have stable chemical characteristics and preserve a huge amount of original geochemical information from the sedimentary process, showing sedimentary environment characteristics. However, this sedimentary information could be deduced distinctly from the influence of provenance, tectonic environment, diagenesis, and the absorption of Fe and Mn [23,24]. Some cross-plots of the total ∑REE + Y and related major elements are proposed to determine the effects of these factors (Figure 5).
The relationships between the total ∑REE + Y and various influence factors are as follows. The regression between (∑REE + Y) and TFe2O3, FeO, and Fe2O3 shows a statistically significant relationship with high correlation, while the values of R2 are 0.98, 0.98, and 0.97, respectively (Figure 5a,c). No distinct linear relationship exists between MnO and (∑REE + Y) (Figure 5d), and the general correlation is R2 = 0.61. Among the major elements relating to provenance, SiO2 and Al2O3 have a distinct linear relationship with a high correlation, and the values of R2 are 0.97 and 0.95, respectively (Figure 5e,f). A nearly scattered distribution can be observed in the diagram of MgO versus (∑REE + Y), indicating a weak correlation (R2 = 0.18; Figure 5g). Linear positive and negative correlations are easily distinguished in the CaO-(∑REE + Y) (R2 = 0.94; Figure 5h) and CaO-SiO2 (R2 = 0.99; Figure 5i) diagrams.
A good linear correlation exists between TFe2O3, FeO, and Fe2O3 and (∑REE + Y), while MnO does not have a linear relationship with (∑REE + Y) (Figure 5a–d), indicating that the fractionation of REE is affected by iron adsorption but not by manganese. This abnormal phenomenon occurs because the state of manganese in sea water is dissolved Mn2+ rather than solid manganese particles under the anoxic condition [25]. The positive linear relationships of SiO2 and Al2O3 with (∑REE + Y) reveal the influence of provenance and weathering on REEs [26]. The respective weak and strong correlations in the MgO and CaO versus (∑REE + Y) diagrams suggest that the REEs are not controlled by dolomitization and diagenesis but influenced by sedimentation (Figure 5g,h). This inference is also demonstrated by the high negative linear correlation of CaO and SiO2 (Figure 5i) due to the pervasive inhibition of terrestrial clastics on calcium carbonate sedimentation. Therefore, the REEs in this area could show the provenance characteristics, sedimentary environment, and seawater characteristics during deposition.

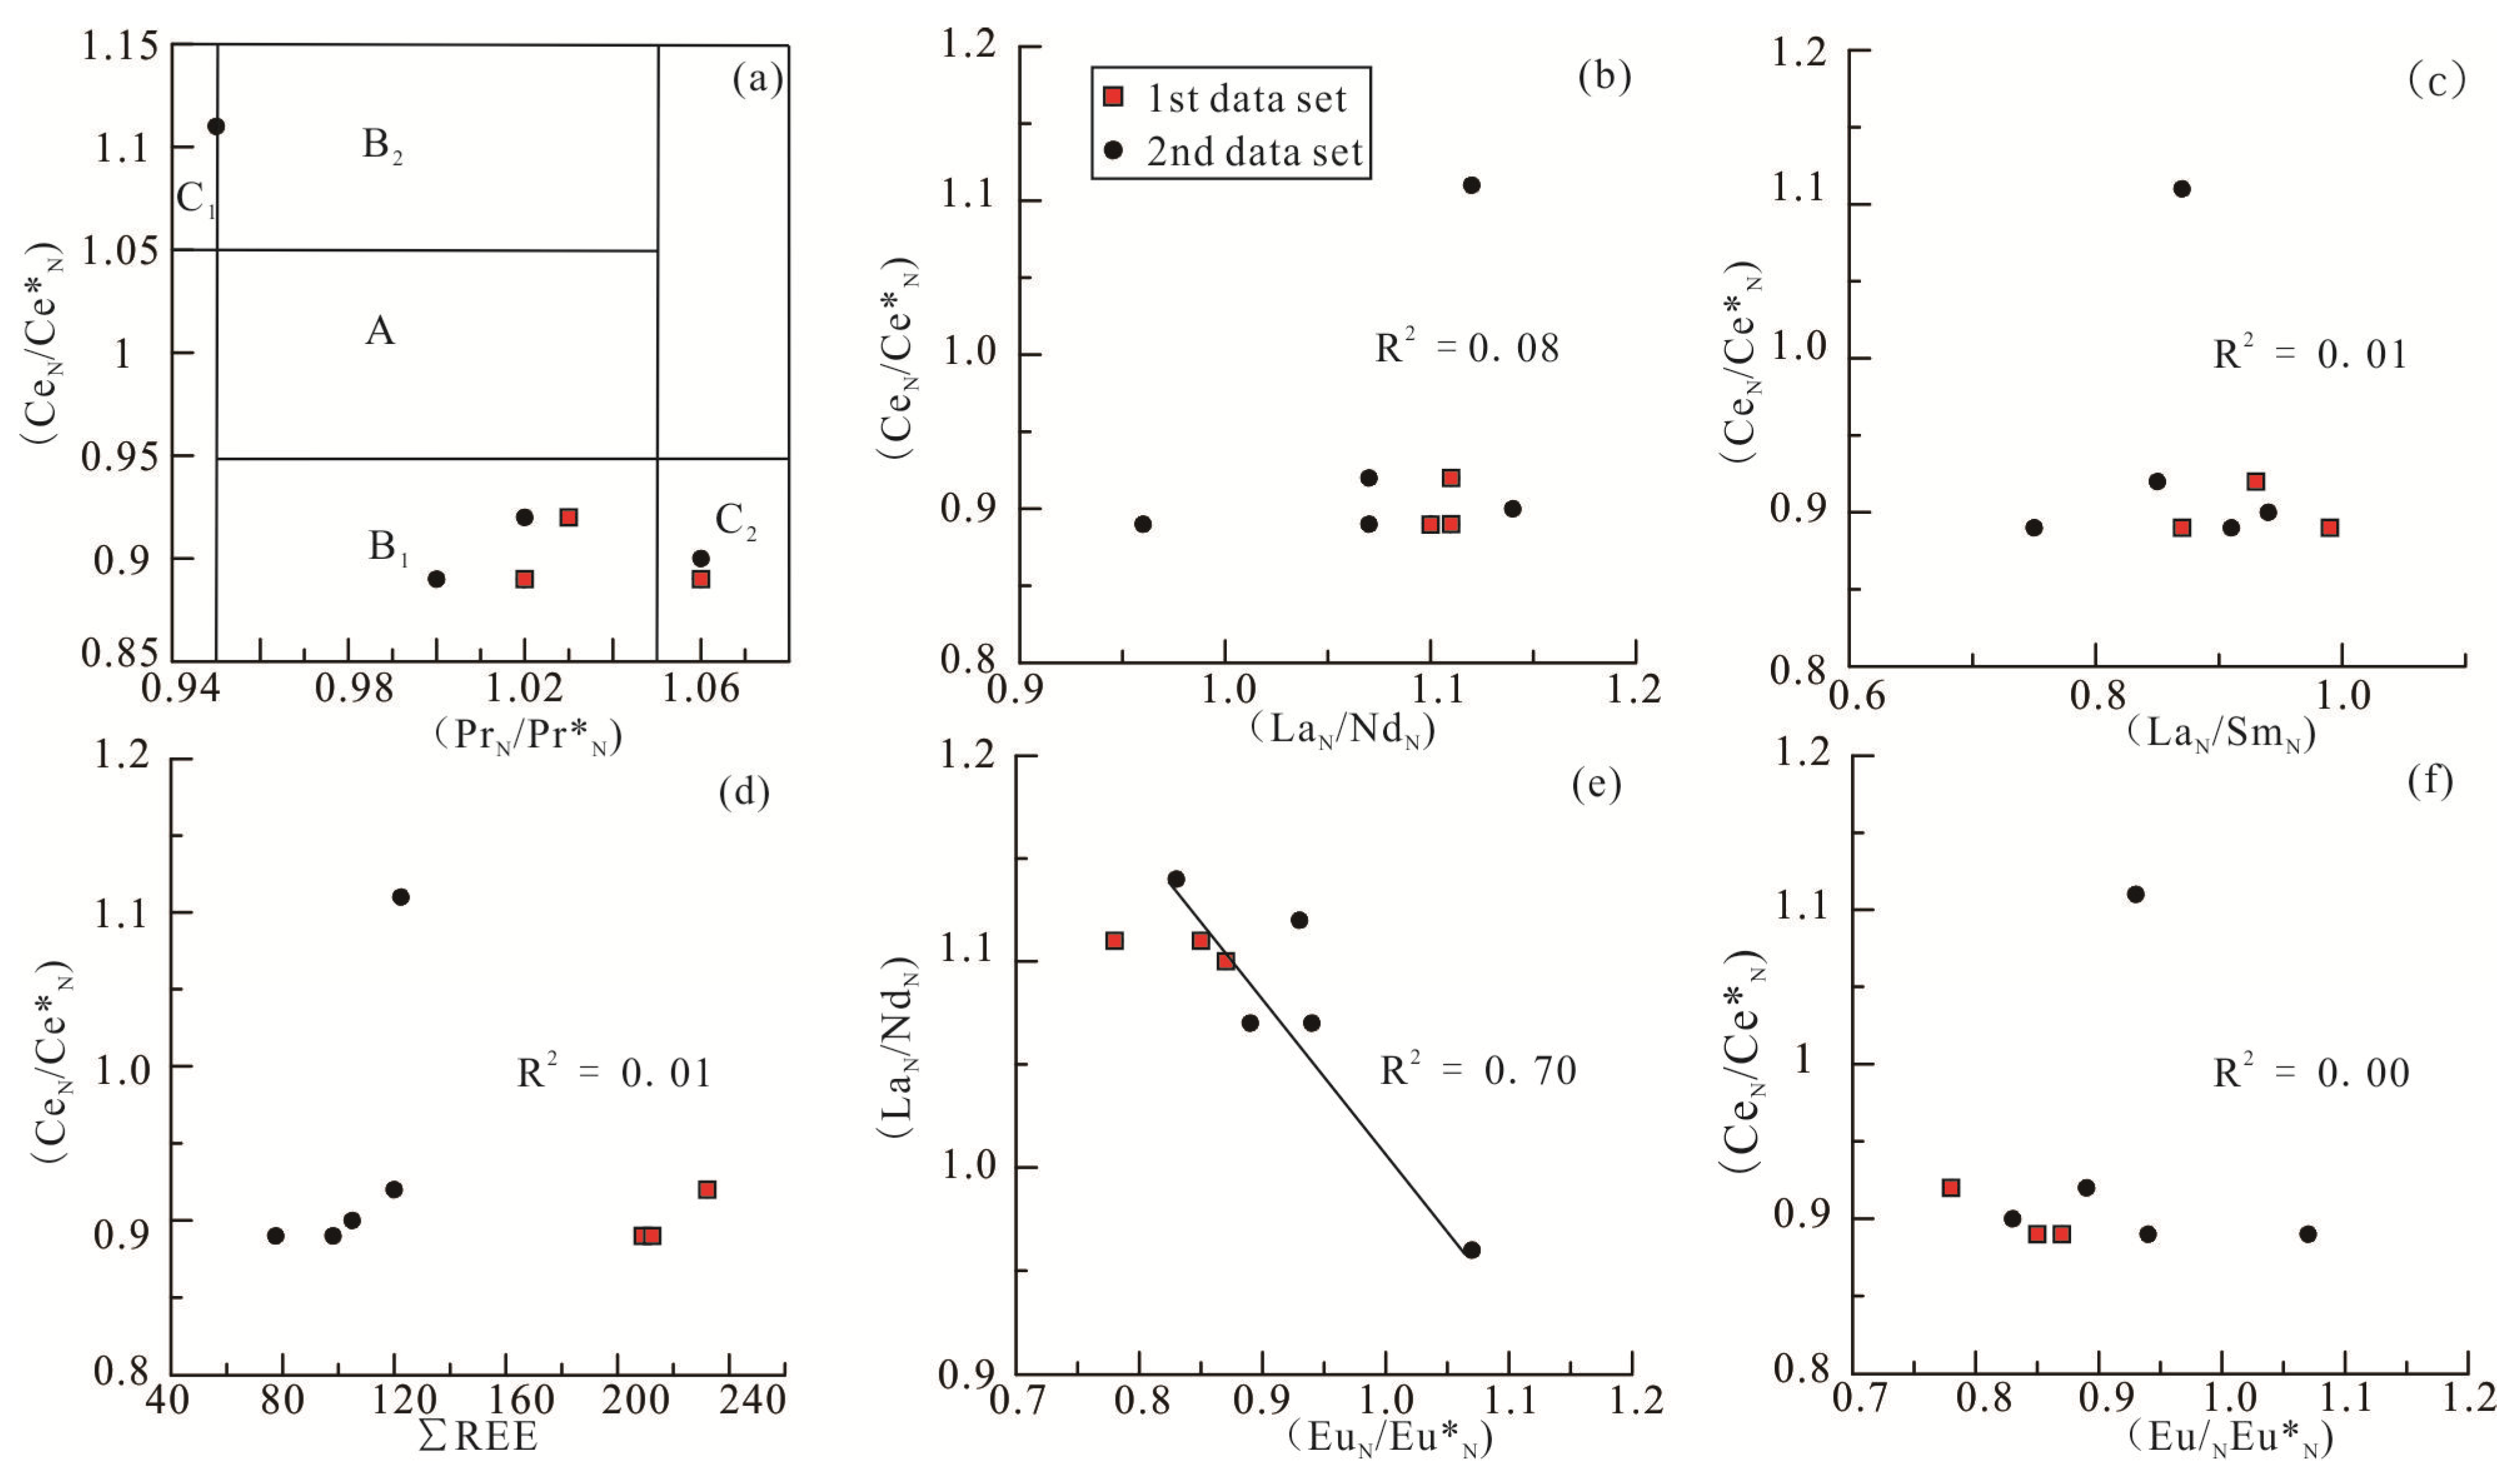
4.3. REE Characteristics and Distribution Patterns

The measured data of REEs and related calculated values are provided in Table 1. The results show that the total amounts of REE (∑REE) of the eight samples range from 77.53 × 10⁻⁶ to 232.17 × 10⁻⁶, with an average value of 147.06 × 10⁻⁶. According to the total amounts of REE (∑REE), the eight samples could be divided into two data sets. The first data set includes the first five samples (samples 6-1, 6-2, 6-3, 6-4, and 6-5), which have high ∑REEs ranging from 77.53 × 10⁻⁶ to 119.97 × 10⁻⁶ and an average of 104.57 × 10⁻⁶. The second data set includes the next three samples (samples 6-6, 6-7, and 6-8), which have low ∑REEs, ranging from 209.04 × 10⁻⁶ to 232.17 × 10⁻⁶, and an average of 217.88 × 10⁻⁶.
The total amounts of light rare earth elements (LREEs) of the eight samples range from 69.09 × 10⁻⁶ to 266.47, with an average of 131.96 × 10⁻⁶, while the heavy rare earth elements (HREEs) range from 8.44 × 10⁻⁶ to 22.86, with an average of 15.10 × 10⁻⁶, and the LREE/HREE ratios range from 7.35 to 10.06, with an average of 8.62. These data are consistent with the upper crust. In the first data set, the total amount of LREEs of the five samples range from 69.09 × 10⁻⁶ to 110.16 × 10⁻⁶, with an average of 93.33 × 10⁻⁶, while the HREEs range from 8.44 × 10⁻⁶ to 12.78 × 10⁻⁶, with an average of 11.24 × 10⁻⁶, and the LREE/HREE ratios range from 7.35 to 9.01 with an average of 8.29. In the second data set, the total amount of LREEs of the three samples range from 186.48 × 10⁻⁶ to 209.31 × 10⁻⁶, with an average of 196.34 × 10⁻⁶, while the HREEs range from 19.20 × 10⁻⁶ to 22.86 × 10⁻⁶, with an average of 21.54 × 10⁻⁶, and the LREE/HREE ratios range from 8.27 to 10.06, with an average of 9.16. The minimum values of LREE and HREE in the second data set are 186.48 × 10⁻⁶ and 19.20 × 10⁻⁶, respectively, which are much higher than the maximum counterpart data of 110.16 × 10⁻⁶ and 12.78 × 10⁻⁶ of the first data set.
The REE + Y related geochemical indicators of salinity (Y/Ho), redox (Ce/La), hydrotherm (LaN/YbN), and depth of water (LaN/NdN) are also shown here. The first Y/Ho ratios of the eight samples range from 24.87 to 27.97, with an average of 26.76; those of the first data set range from 26.57 to 27.97, with an average of 27.29, and those of the second data set range from 24.87 to 26.59, with an average of 25.87. The data shows that the minimum value of the first data set is nearly equal to the maximum value of the second data set. Although the single sample ratio of Ce/La and the shale-normalized ratios of LaN/YbN and LaN/NdN are involved with each other, a distinct difference in the average values of these two data sets can be observed. The average Ce/La, LaN/YbN, and LaN/NdN ratios are as follows: 1.86, 1.01, and 1.08, respectively, for all the eight samples; 1.90, 0.98, and 1.07, respectively, in the first data set (5 samples); and 1.80, 1.06, and 1.10, respectively, in the second data set (3 samples).
The Post Archaean Australian shale (PAAS)-normalized REE patterns of the average value of the eight samples and the first and second data sets are shown in Figure 6a. The eight samples display a nearly flat pattern with a weak Ce negative anomaly (the shale-normalized ratios of CeN/Ce*N range from 0.89 to 1.11, with an average of 0.93; the Ce anomaly indices (Ceanom) range from −0.06 to 0.05, with an average of −0.04 and a strong Eu negative anomaly (the shale-normalized ratios EuN/Eu*N range from 0.92 to 1.07 with an average of 0.89). The average distribution pattern of the first data set is slightly cap-shaped with an enrichment of the middle REE relative to the light and heavy REEs, which have small negative Ce and Eu anomalies. The ranges of the PAAS-normalized ratios of CeN/Ce*N and EuN/Eu*N are 0.89–1.11 and 7.35–9.01, respectively, with averages of 0.94 and 0.93, respectively, and the Ce anomaly index is between −0.06 and 0.05, respectively, with an average of −0.03. Similar to the eight samples, the average distribution pattern of the second data set is flat, with relatively large negative Ce and Eu anomalies. The ranges of the CeN/Ce*N and EuN/Eu*N ratios and Ceanom are 0.89–0.92, 0.78–0.87, and negative 0.06–0.04, respectively, with averages of 0.90, 0.83, and −0.05, respectively.
The chondrite-normalized REE patterns of the average values of the eight samples and the first and second data sets are shown in Figure 6b. All patterns are typical of shale, and the overall morphologies are similar to those of the PAAS and the shale of Eastern China, with an enrichment of LREE relative to HREE, clear Eu depletion, and an overall “L” shape. The pattern of the first data set reflects small total amounts of REEs, with a relatively weak differentiation of LREE and HREE. The pattern of the second data set is highly consistent with the shale of Eastern China. The total amounts of REEs are large, and the LREE and HREE differentiation is relatively strong. The pattern of the eight samples is similar to that of the PAAS, with relatively low LREE concentrations (Figure 6b).
Except for sedimentation, the other factors that influence the Ce anomalies in the PAAS-normalized data include the positive anomalies of La, diagenesis, and provenance [27,28]. Some plots are used to determine the degree of influence of these non-sedimentary facts, which include the plots of (CeN/Ce*N) − (PrN/Pr*N) and (CeN/Ce*N) − (LaN/NdN) for the positive La anomaly, the plot of (CeN/Ce*N) − (LaN/SmN) for diagenesis, and the plot of ∑REE − (CeN/Ce*N) for provenance [26,29]. In general, Eu anomalies are mainly influenced by provenance, the hydrothermal condition, diagenesis, and sedimentation, such as the redox condition [22]. Here, we use the plots of (EuN/Eu*N) − (LaN/NdN) and (CeN/Ce*N) − (EuN/Eu*N) to determine the influence of diagenesis and the redox condition, respectively (Figure 7).
Only two samples fall in the true Ce negative anomaly region, and the other six samples fall in the region affected by positive or negative La (Figure 7a). By contrast, no linear correlation (R2 = 0.08) exists between (CeN/Ce*N) and (LaN/NdN) (Figure 7b). In addition, the Ce anomaly (CeN/Ce*N) has no linear correlation with the LaN/SmN ratio and the ∑REE (Figure 7c,d), and the LaN/SmN ratios of all the samples are larger than 0.35 (Table 1). The plot of (EuN/Eu*N) − (LaN/NdN) has a good linear relationship (Figure 7e) with the correlation coefficient of approximately 0.70. The PAAS-normalized Eu anomaly (EuN/Eu*N) and Ce anomaly (CeN/Ce*N) are uncorrelated (Figure 7f), with a nearly 0 correlation coefficient.
The PAAS-normalized Ce anomaly of the claystones of the Miboshan Formation is partially influenced by the La anomaly, and diagenesis and provenance have nearly no influence, as suggested by the discordant Figure 7a,b and the absence of correlation in Figure 7c,d. The good and poor linear correlations in Figure 7e,f indicate that the Eu anomaly is affected by diagenesis but not by the redox environment [23]. Therefore, the Ce negative anomaly is controlled by deposition, which could be used to analyze the redox condition, and the Eu anomaly could be used for provenance analysis.

4.4. Characteristics of Other Elements

The content of some trace elements and the ratio of some sensitive elements could reflect the coeval sedimentary and tectonic environment because the geological process could control the concentration and depletion of trace elements to a certain extent [28]. Except for the REEs, the other trace elements’ geochemical indexes were selected as follows: the redox indexes include the Fe3+/Fe2+ and V/Cr ratios [22,25,30], the provenance index Th/U ratio, the salinity index Sr/Ba ratio, and the hydrodynamic index Zr/Rb ratio [22,26,31,32].
The redox indexes of the eight claystone samples of the Miboshan Formation show Fe3+/Fe2+ ratios ranging from 0.39 to 0.66 with an average of 0.46, and V/Cr ratios ranging from 1.14 to 1.35 with an average of 1.26. Meanwhile, the average Fe3+/Fe2+ and V/Cr ratios of the first data set are 0.42 and 1.24, respectively, which are lower than the average values of 0.52 and 1.29, respectively, of the second data set. The provenance index Th/U ratio and the salinity index Sr/Ba ratio show no overlap range between the first and second data sets. The Th/U ratios of the eight samples and the first and second data sets range from 3.70 to 6.24, 3.70 to 5.07, and 5.97 to 6.24, respectively, with averages of 4.98, 4.42, and 6.11, respectively. The counterpart Sr/Ba ratios range from 0.13 to 2.77, 1.27 to 2.77, and 0.13 to 0.17, respectively, with averages of 1.29, 1.86, and 0.14, respectively. The hydrodynamic index Zr/Rb ratios of the eight samples range from 0.68 to 0.85, with an average of 0.78, and those of the first and second data sets vary from 0.68 to 0.85, with an average of 0.79, and from 0.71 to 0.82, with an average of 0.76, respectively.
The Miboshan Formation was deposited in the Western Ordos Basin during the transition from a passive continental margin to an active continental margin [9,33,34], and the overlying thin-bedded limestones at the top of the Xujiaquan Formation of the Xiangshan group have been found, including some hydrothermal deposition [35]. Trace radiated elements U and Th, which are related to submarine hydrothermal deposition [27], are used in this article to determine the influence of the submarine hydrothermal process of the Miboshan Formation (Figure 6c). The result shows that all the samples fall in the normal pelagic sedimentary area (place I), and the second data set samples (squares) are near the edge of this region (Figure 6c).

5. Discussion

5.1. Depositional Environment and Characteristics of Seawater

5.1.1. Depositional Environment

Unlike the platform facies carbonate rocks of the Tianjingshan Formation, the lower member of the Miboshan Formation is mainly composed of thick- to thin-bedded limestones interbedded with claystones, including some lenticular calcirudite with a sedimentary erosion surface at the bottom and deposited by debris flows [3], indicating a slope-basin environment with an increasing water depth. The dark gray claystone and lamination micritic (Figure 4d) of the middle and upper members of the Miboshan Formation also suggest a quiet and low energy deep-water environment, and the deformation structures intercalated in the laminae (Figure 4e) demonstrate a syn-depositional slide process in the seabed. Overall, the pervasive graptolite fossils in the grayish black claystone of the Miboshan Formation show typical graptolite shale facies, indicating a quiet anoxic condition and deep-water deposition. Therefore, the Miboshan Formation of the study area deposited in a deep-water slope-basin environment.

5.1.2. Seawater Characteristics

The paleo-water-depth can be estimated from the PAAS-normalized LaN/NdN ratio using the linear interpolation method on the basis of the data of modern oceans. A previous work showed that the LaN/NdN ratio in the present North and South Pacific is 0.8 and 1.5 at sea level and at the 1000 m depth, respectively [36]. According to the ratio relation of the present Pacific, the calculated paleo-water-depths of the Miboshan Formation range from ca. 228 m to 457 m with an average of ca. 400 m using the LaN/NdN ratio data, the minimum 0.96, the maximum 1.14, and the average 1.08 of the eight samples. The water depths show a deep-water environment, which is consistent with the lithology result.
The Y/Ho and Sr/Ba ratios serve as monitors for the salinity induced by the differentiation between different types of waters, such as freshwater and seawater. The Y/Ho ratios in modern river or estuary waters (25–28) are equal to or slightly higher than the values in the upper continental crust (27.5) and chondrites (26–28), showing characteristics of terrigenous origin [36]. These data are lower than the modern open seawater values, which are generally greater than 45 [21]. The Sr/Ba ratios for salinity are explained by barium and sulfate ions’ formation of barium sulfate precipitation when freshwater flows into and mixes with seawater, while strontium ion could be reserved in seawater and transported for a long distance. The Sr/Ba ratio of marine facies is generally greater than 1 [37].
The Y/Ho ratio of the Miboshan Formation is equal to that of modern river water, that is, similar to that of the upper continental crust, and showing a mixture of freshwater and seawater. The minimum value of the first data set is similar to the maximum value of the second data set and has recognizable differences in average values (27.29 and 25.87, respectively). Samples of the second data set deposited in seawater are therefore affected by more fresh water than the first data set. The average values of the Sr/Ba ratios in the first and second data sets (1.86 and 0.14, respectively) further support this view because of the definite greater and less than 1 values, that is, the criterion for seawater and freshwater on the Sr/Ba ratios index.
The Zr/Rb ratio could serve as a monitor for hydrodynamics, with a higher Zr/Rb ratio indicating stronger water dynamics [26]. The eight samples’ average Zr/Rb ratio in the Miboshan Formation is 0.78, with small differences from those in the first and second data sets, which are much smaller than the average ratio (6.30) of thin-bedded limestone in the overlain Xujiajuan Formation of the Xiangshan Group in the study area [38]. According to the relatively stronger hydrodynamics in the Xujiajuan Formation, which could transport fine-grained terrigenous grains because the internal-wave and internal-tide induced cross-laminations are both pervasive in limestone and fine-grained sandstone [38], the average Zr/Rb ratio of 0.78 demonstrates weak hydrodynamics in the geological time when the Miboshan Formation was deposited.

5.1.3. Redox Conditions

In terms of the PAAS-normalized model, although the Ce negative anomaly of the Miboshan Formation is partially affected by the positive La anomaly, it is still controlled by sedimentation and could be used as an indicator of the redox condition [39]. In general, the negative Ce anomalies in abiotic rocks or those affected by the adsorption of Fe or Mn minerals and clay minerals represent an anoxic condition [39]. Overall, negative Ce anomalies are observed in the Miboshan Formation, except for one sample (Sample 6-3) that shows a positive Ce anomaly, indicating an overall anoxic depositional condition. The other two redox indicators related to REE, namely, the Ce anomaly index (Ceanom) and the non-standardized Ce/La ratio, also indicate a weak anoxic condition, as indicated by the average values of Ceanom and Ce/La of −0.04 and 1.86, respectively, which fall in the range of anoxic to weak anoxic condition [40] (Table 2), respectively.
The Fe3+/Fe2+ ratios of the eight samples are all less than 1.0 with an average of 0.46, suggesting the same anoxic condition as the REE related monitors. Unfortunately, the V/Cr ratios of all the samples are less than 2.0 (Table 1) with an average of 1.26, indicting an oxic condition [41]. This contradiction is attributed to the low V/Cr ratio in the anoxic condition above the denitrification boundary line in which Cr is enriched in sediments, while V is still dissolved in water [42]. The second data set is the recycling of sedimentary rocks (Section 5.2.1. Provenance Characteristics), in which weathering effects and erosion are greater than terrigenous clastics rocks (the first data set). Vanadium and chromium ions readily adsorb to particle surfaces and are added to the sediment and water as the particles settle [26,30,42]. The content of Vanadium and chromium in the second data set are therefore higher than the first data set. In addition, the Vanadium accumulation is related to particle size of clastic sediments [36]. The first data set is terrigenous clastics rocks influenced by volcanic island arc materials (Section 5.2.1. Provenance Characteristics), after complexation and precipitation phenomena occur in vanadium and clay minerals, reducing vanadium content. During diagenesis, some vanadium complexes out of rocks, but an amount of vanadium is retained in organic matter or clay minerals [36]. Thus, the V/Cr ratio of samples 6-2 and 6-5 is below 1.2.
Ignoring the inconsistent index V/Cr ratio, the other anoxic indexes (i.e., Ceanom and the Ce/La and Fe3+/Fe2+ ratios) reveal a slightly stronger anoxic condition in the first data set than in the second data set, except for the Ce anomaly index (Table 2). Considering that the negative Ce anomaly is partly influenced by the positive La anomaly (Figure 7a), the strong negative Ce anomaly in the second data set (Figure 6a, Table 2) may not represent the real anoxicity in the sedimentary environment. Therefore, combined with graptolite shale facies, the sedimentary environment while the Miboshan Formation was deposited appears to have a weak anoxic condition above the denitrification boundary, and the anoxicity represented by the first data set is relatively stronger than that by the second data set.

5.2. Tectonic Environment

5.2.1. Provenance Characteristics

Compared with the redox indicator in limestones, the Th/U ratio of terrigenous clastic rocks, especially for fine-grained mudstones or claystone, could be used as an index of provenance because the process of sediment transport could lead to further loss of U and an increase in Th/U ratio [29]. Typical island-arc volcanic rocks have low Th/U ratios, ranging from 2.5 to 3.0, and those of typical sedimentary rocks or possibly mixed with island arc volcanic materials are ~4.5 [43]; the ratios increase to ~6.0 recycling of sedimentary rocks [29]. The average Th/U ratios of the first and second data sets are 4.42 and 6.11, respectively, indicating that the first data set is influenced by volcanic island arc materials, that is, abundant terrigenous clastics mixed with some volcanic materials, and the second data set is the recycling of sedimentary rocks.
The average amount of REE in the eight samples is 147.06 × 10⁻⁶, which is mainly that of the upper crust (146.4 × 10⁻⁶) and is lower than the global sediment average value (150 × 10−6–300 × 10−6), suggesting a mainly stable terrigenous origin. This view is further supported by the similar REE distribution patterns of all the samples, showing an L-shaped curve with a high content on the left and a low content on the right [43]. The evolution of the provenance origin of the first and second data set is greatly influenced by the unstable provenance region (such as an island arc) to the stable tectonic region (such as a passive continental margin or craton), with the following evidence: (i) The average value of the first data set is 104.57 × 10⁻⁶, which is much smaller than the average value of the upper crust (146.4 × 10⁻⁶) and larger than that of the ocean crust (86.90 × 10⁻⁶). (ii) The differentiation between the LREE and HREE of the first data set is relatively weak. (iii) The average value of the second data set is 217.88 × 10⁻⁶, which is equal to the mudstone of Eastern China (ECA; 217.76 × 10⁻⁶) [44] and higher than that of the PAAS (183.96 × 10⁻⁶) [20].
Considering the Th/U ratios, the ∑REEs, and the chondrite-normalized REE distribution patterns, the provenance origin of the Miboshan Formation is mainly from terrigenous materials in the stable tectonic area. The lower part (first data set) is greatly influenced by the volcanic island arc, while the upper part (second data set) is recycling sedimentary rocks.

5.2.2. Tectonic Environment Analysis

The Mibalshan Formation and the Klimori Formation in the Northern Zhuozishan area were deposited in the same geological period [1], along with the Didymograputus murchison graptolite zone, which belongs to the upper part of the Darrivelian stage and corresponds to the “golden nail” age; the bottom and top are 467.3 and 458.4 Ma, respectively [4,45]. Some isotopic chronology data support the occurrence of oceanic crust subduction in the Northern Qilian area in the Darrivelian stage of Middle Ordovician. These data include (1) the bulk rock Sm-Nd isochron age of typical back arc extension ridge type lavas in the Mt. Laohu ophiolite in the Jingtai area, Gansu Province, that is, 465.68 ± 23.18 Ma [46]; (2) the bulk rock Sm-Nd isochron age of mature island arc lava of Shihuigou in southern of Jingtai, that is, 453.36 ± 4.44 Ma [46]; (3) the SHRIMP zircon U-Pb age of gabbro from the Kwa ophiolites in the Gulang area, Northern Qilian, that is, 462 ± 19 Ma [47]. Combining the ages of deposition and tectonic activities in the study and adjacent areas, we suggest that the Miboshan Formation was deposited in a back-arc extensional basin in the North Qilian area that was transformed from a passive to an active continental margin.
Like the Ce element, the Eu element is also a variable element with bivalent and trivalent valence states, and the Eu anomaly depends on the balance of these two valence states. In general, stable provenance regions (such as the crust) have stronger negative Eu anomalies than unstable ones (such as the oceanic crust) [20]. Although Eu is easily dissolved in water (Eu2+) under anoxic environments, which could result in the enrichment of Eu in sediments when the ion exchange equilibrium is reached in the system between sediments and seawater, the positive Eu anomalies are still used as a reliable index of the hydrotherm because the anoxic action of Eu only works under high temperature (generally greater than 250 °C) [28]. In the PASS-normalized patterns, the average values of the eight samples have a strong Eu negative anomaly, indicating that the rocks in the Miboshan Formation are unaffected by the submarine hydrothermal condition and maintain provenance characteristics (Figure 6a). Furthermore, the second data set presents a high stable provenance degree, which could be attributed to the strong negative Eu anomaly of the second data set (Figure 6a). In addition, all samples fall in the range of normal pelagic deposition in the U-TH plot (Figure 6c), which also indicates that the Miboshan Formation is unaffected by the submarine hydrothermal condition.

5.3. Sedimentary Model

The Miboshan Formation in the study area deposited in the deep-water slope-basin environment of back-arc extensional basin located at the active continental margin, which is distinctly affected by fresh water and hardly affected by the submarine hydrothermal condition. A small highland or subaqueous uplift may have existed in the western margin of the Ordos Basin during Middle and Late Ordovician, such as the Yinchuan-Wuzhong highland [48,49,50], and pond turbidity current deposits were also found in the Northern Zhuozishan area [6]. Therefore, the Miboshan Formation may also be deposited in a small pond basin affected by subaqueous uplifts (Figure 8). The development degree of the subaqueous uplifts could prevent volcanic matter and submarine hydrothermal input into the basin from the island arc outside the uplift and confine the diffusion of terrigenous material and freshwater overflow into the open sea (Figure 8).
When the samples from the first data set in the lower part of the second member of the Miboshan Formation were deposited, the range of subaqueous uplift was small, while the freshwater flowed easily into open sea and mixed well with the seawater. Therefore, the characteristics of water in the confined–limited ponded basin are near those of sea water, that is, the Y/Ho ratio is large, with an average value of 27.29, and the PAAS-normalized pattern of REE is slightly hat-shaped (Figure 6a). Inside the mini-basin, the salinity of the water is relatively high (average Sr/Ba ratio of 1.86) and the degree of anoxic condition is relatively strong (Table 2). Outside the mini-basin, the limited efficiency for blocking unstable island arc materials and hydrothermal input from the open sea into the mini-basin can be attributed to the small range of subaqueous uplift, which is mainly responsible for the following facts: (i) The Th/U ratios in the sediments are low, with an average of 6.61. (ii) The total amount of REEs is low, with an average of 104.57 × 10⁻⁶, just higher than that of the ocean crust (86.90 × 10⁻⁶). (iii) The differentiation of LREE and HREE in the chondrite standardization model is relatively weak (Figure 6b). Therefore, the provenance is mainly composed of the terrigenous material from the stable tectonic area, with the distinct influence of volcanic island arc matter in the active tectonic area.
When the samples of the second data set were deposited, the range of subaqueous uplift was large, and the fresh water flowing into open sea was greatly obstructed by the topography and might have partially collected in the basin (Figure 6c). Therefore, the fresh water in the mini-basin was distinct, and some of the water was confined to open sea, that is, the Y/Ho ratio was small with an average value of 25.87, and the PAAS-normalized REE distribution pattern is flat (Figure 6a). Inside the mini-basin, the relatively confined fresh water and flow disturbance were responsible for the relative low salinities (average value of Sr/Ba was 0.14) and the weak anoxic condition (Table 2) in the restrictive environment. Due to the large subaqueous uplift outside the mini-basin, the unstable island arc and the hydrothermal input from the ocean direction are effectively blocked. Therefore, the provenance is recycling sedimentary rocks, and hardly any hydrothermal effects are seen in the sediments, including the relatively high Th/U ratios, with an average of 6.11, the large total amount of REE, with an average of 217.88 × 10⁻⁶, and the high and low L-shaped curves on the left and right of the chondrite-normalized pattern, respectively (Figure 6b).

6. Conclusions

(1)
The Miboshan Formation in the study area deposited in a deep-water environment from slope–basin facies in an extensional back-arc developed in the active continental margin. The seawater depth is ~400 m, and graptolite shale facies, deep-water in situ deposits, and debris flow deposits were developed.
(2)
The Miboshan Formation deposited in a small, ponded basin, which was confined by a subaqueous uplift, so that the seawater was greatly affected by fresh water and slightly affected by unstable island arc provenance and the submarine hydrothermal condition.
(3)
The lower part of the second member of the Miboshan Formation (first data set) was deposited in a small subaqueous uplift, which was confine-limited such that seawater was relatively less affected by fresh water, and the anoxicity is relatively strong while the provenance is mainly a terrigenous material with a few effects from the volcanic island arc and the submarine hydrothermal condition.
(4)
The upper part of the second member of the Miboshan Formation (second data set) was deposited in a significant subaquatic uplift, which was confined well so that seawater was strongly affected by fresh water, the anoxicity is relatively weak, and the provenance is nearly entirely composed of recycled sedimentary rocks.

Author Contributions

Conceptualization, Z.W. and X.L.; field investigation: Z.W. and X.L.; experimental analysis: Z.W.; software, Z.W.; validation, Z.W. and X.L.; resources: X.L. and Z.W.; data curation, Z.W.; writing—original draft preparation, Z.W.; writing—review and editing, Z.W.; visualization, Z.W.; funding acquisition, Z.W. and X.L. All authors have read and agreed to the published version of the manuscript.

Funding

The work is co-funded by the Analysis and Measurement Fund of Kunming University of Science and Technology (No. 2022M20212201092), the Fund from the Key Laboratory of Deep-Earth Dynamics of Ministry of Natural Resources (No. J1901-16), and the National Nature Science Foundation of China (No. 41272119).

Data Availability Statement

Not applicable.

Conflicts of Interest

We declare no known competing financial interests or personal relationships that could have appeared to influence the work reported in this paper.

References

  1. Guo, Y.R.; Zhao, Z.Y.; Fu, J.H.; Xu, W.L.; Shi, X.Y.; Sun, L.Y.; Gao, J.R.; Zhang, Y.L.; Zhang, Y.Q.; Liu, J.B.; et al. Sequence lithofacies paleogeography of Ordovician in Ordos Basin, China. Acta Pet. Sin. 2012, 33, 95–109. [Google Scholar] [CrossRef]
  2. Lin, C.S.; Yang, Q.; Li, S.T.; Li, Z. Sedimentary characters of the early Paleozoic deep water gravity flow system and basin filling style of in the helanola trough. Geoscience 1991, 5, 252–262+347. [Google Scholar]
  3. Gao, Z.Z.; Luo, S.S.; He, Y.B.; Zhang, J.S. Ordovician submarine fan systems in west margin of Ordos. Oil Gas Geol. 1995, 16, 119–125+203. [Google Scholar] [CrossRef]
  4. Sun, J.; Dong, Y. Ordovician tectonic shift in the western North China Craton constrained by stratigraphic and geochronological analyses. Basin Res. 2020, 32, 1413–1440. [Google Scholar] [CrossRef]
  5. Li, X.D.; He, Y.B.; Wang, D.; Luo, J.X.; Li, H.; Zheng, Z.C. Internal-wave and internal-tide deposits of the Middle Ordovicaian Xiangshan Group Xujiajuan Formation, Ningxia. J. Palaeogeogr. 2009, 11, 513–523. [Google Scholar]
  6. Li, X.D.; Chen, H.Y. Paleocurrents direction analysis and identification of clog turbidity current deposits in deep water environment: A case study of the Upper Ordovician Lashizhong Formation in Zhuozishan area, Ordos Basin. Acta Pet. Sin. 2020, 41, 1348–1365. [Google Scholar] [CrossRef]
  7. Xu, L.M.; Zhou, L.F.; Zhang, Y.K.; Yang, W.J.; Lu, B. Record of deposition magmatism of Xiangshan Group and the reflection of tectonic environment. J. Northwest Univ. 2006, 36, 442–448. [Google Scholar] [CrossRef]
  8. Xu, S.M.; Feng, H.W.; Li, S.Z.; Li, M. Study on the Caledonian Movement in Helanshan and its surrounding area. Acta Petrol. Sin. 2016, 32, 2137–2150. [Google Scholar]
  9. Li, X.D.; Wei, Z.Y.; Chen, H.D. Genetic analysis of internal-wave and internal-tide deposits in the Upper Ordovician Lashenzhong Formation, western Ordos basin. Acta Geol. Sin. 2023, 97, 1278–1294. [Google Scholar] [CrossRef]
  10. Wang, Z.T.; Zhou, H.R.; Wang, J.L.; Jing, X.C. Provenance and tectonic settings analysis of Yingtaogou formation of Middle Ordovician in Helan Mountain area. Acta Sedimentol. Sin. 2014, 32, 205–217. [Google Scholar] [CrossRef]
  11. Zhang, K. Olistostrome in qrdovician system, western and southern margin of ordos basin. Acta Sedimentol. Sin. 1992, 10, 11–18. [Google Scholar] [CrossRef]
  12. Liu, X.; You, G.Q. Tectonic zoning of the East China Sea. Geol. China 2015, 42, 1–17. [Google Scholar]
  13. Zhang, J.; Ma, Z.J.; Ren, W.J.; Lei, Y.L. Structural characterisitics in the Niushoushan Area, Tectonic central Ningxia and its geological significance. Geotecton. Metallog. 2003, 27, 132–142. [Google Scholar] [CrossRef]
  14. Yang, W.J. Sedimentary Evolution of Ordovician in the Western Margin of Ordos Basin and Its Oi1-Gas Geological Conditions. Ph.D. Thesis, Northwest University, Xi’an, China, 2006; pp. 29–31. [Google Scholar]
  15. Xie, G.A.; Zhang, Q.L.; Guo, L.Z. The genesis and hydrocarbon distribution of western and southern margins of Paleozoic foreland basin and central paleouplift in Ordos Basin. Acta Pet. Sin. 2003, 24, 18–29. [Google Scholar]
  16. Li, S.Z.; Li, T.; Zhao, S.j.; Li, X.Y.; Liu, X.; Guo, L.L.; Yu, S.Y.; Li, S.J. Proto-Tethys Ocean in East Asia (V): Attribute of contientnal margin and microcontinental assembly in the west segment of the northern Proto-Tethys Tectonic Domain. Acta Petrol. Sin. 2017, 33, 1633–1652. [Google Scholar]
  17. Yang, J.Q.; Zhang, J.T.; He, Z.L.; Zhang, T. Paleoenvironment reconstruction of the Middle Ordovician thick carbonate from western Ordos Basin, China. Pet. Sci. 2023, 20, 48–59. [Google Scholar] [CrossRef]
  18. Huo, F.C. Introduction to Geology of Ningxia; Science Press: Beijing, China, 1989; pp. 43–65. [Google Scholar]
  19. Gu, Q.C. Petro Stratigraph of Ningxia Hui Autonomous Region; China University of Geosciences Press: Wuhan, China, 1996; pp. 29–42. [Google Scholar]
  20. Mclennan, S.M. Rare earth elements in sedimentary rocks: Influence of Provenance and sedimentary processes. Rev. Mineral. 1989, 21, 169–200. [Google Scholar]
  21. Lawrence, M.G.; Greig, A.; Collerson, K.D.; Kamber, B.S. Rare earth element and Yttrium variablility in South East Queensland waterways. Aquat. Geochem. 2006, 12, 39–72. [Google Scholar] [CrossRef]
  22. Frimmel, H.E. Trace element distribution in Neoproterozoic carbonates as palaeoenvironmental indicator. Chem. Geol. 2009, 258, 338–353. [Google Scholar] [CrossRef]
  23. Shields, G.; Stille, P. Diagenetic constraints on the use of cerium anomalies as palaeoseawater an isotopic and REE study of Cambrian phosphorites. Chem. Geol. 2001, 175, 29–48. [Google Scholar] [CrossRef]
  24. Huang, S.H.; Zhang, Z.M.; He, S.Y.; Wang, Z.G. Experimental studies on transportable forms and precipitation conditions for REE in sea water. Geochimica 1981, 4, 398–406. [Google Scholar] [CrossRef]
  25. Bian, P.; Sha, X.; Ma, L.; He, Z.X.; Wang, J.R.; Zhai, X.W. Discovery and tectonic significance of Kawa ophiolites in the Western Member of North Qilian. J. Lanzhou Univ. Nat. Sci. 2016, 52, 142–144. [Google Scholar] [CrossRef]
  26. He, J.W.; Xie, Y.; Hou, M.C.; Liu, J.Q.; He, L.; Lu, Y.F. Geochemical characteristic sand geological significance of the Silurian Longmaxi Formation shale in Yanjin area, southwestern Sichuan Basin. J. Palaeogeogr. 2021, 23, 1174–1191. [Google Scholar] [CrossRef]
  27. Boström, K.; Kraemer, T.; Gartner, S. Provenance and accumulation rates of opaline silica, Al, Ti, Fe, Mn, Cu, Ni and Co in Pacific pelagic sediments. Chem. Geol. 1973, 11, 123–148. [Google Scholar] [CrossRef]
  28. Mou, B.L. Geochemical Characteristics and Prospecting Potential of Xilaokou Gold Deposit in Shandong Province; Peking University Press: Beijing, China, 1999; pp. 1–210. [Google Scholar]
  29. Bhatia, M.R. Plate tectonics and geochemical composition of sandstones. J. Geol. 1983, 91, 611–627. [Google Scholar] [CrossRef]
  30. Breit, G.N.; Wanty, R.B. Vanadium accumulation in carbonaceous rocks: A review of geochemical controls during deposition and diagenesis. Chem. Geol. 1991, 91, 83–97. [Google Scholar] [CrossRef]
  31. El-Anwar, E.A.; Salman, S.A.; Mousa, D.; Aita, S.K. Geochemical and Mineralogical Evaluation of Black Shale and its Hydrocarbon Potentiality, Southwest Sinai, Egypt. Egypt. J. Chem. 2020, 63, 5055–5070. [Google Scholar] [CrossRef]
  32. El-Anwar, E.A. Evaluation of the Upper Cretaceous Black Shales: A Case Study from Islam and Hamrawin Phosphate Mines, Qussier Area, Southern Eastern Desert, Egypt. Egypt. J. Chem. 2023, 66, 271–290. [Google Scholar] [CrossRef]
  33. Wang, Z.T.; Zhou, H.R.; Wang, Q.L.; Jing, X.C.; Zhang, Y.S.; Yuan, L.P.; Shen, Z.J. The Ordovician Basin Prototype in the Northwest Ordos Basin: Constraint from the Ordovician Sedimentary Respond in the Helan—Zhuozi Mountains. Geol. Rev. 2016, 4, 1041–1061. [Google Scholar] [CrossRef]
  34. Li, X.D.; Huan, Y.Q.; Que, Y. REE geochemistry and analysis of sedimentary aqueous media in lower part of Kelimoli Formation, Middle Ordovician, Zhuozishan area. Chin. J. Geol. 2018, 52, 547–565. [Google Scholar] [CrossRef]
  35. Li, X.D.; He, Y.B. Geochemical characteristics and age significance of limestone in the Top of Xujiaquan Formation of Xiangshan Group, Ningxia. Geochemistry 2019, 48, 325–341. [Google Scholar] [CrossRef]
  36. Alibo, D.S.; Nozaki, Y. Rare earth elements in seawater: Particle association, shale normalization, and Ceoxidation. Geochim. Cosmochim. Acta 1999, 63, 363–372. [Google Scholar] [CrossRef]
  37. Zheng, R.C.; Liu, M.Q. Study on paleosalinity of Chang-6 oil reservoir set in Ordos Basin. Oil Gas Geol. 1999, 20, 22–27. [Google Scholar] [CrossRef]
  38. Li, X.D.; He, Y.B. REE geochemistry and their indicators of sedimentary aqueous media at the top of Xujiajuan Formation, Xiangshan Group in Ningxia Autonomous Region, China. J. Jilin Univ. 2020, 50, 139–157. [Google Scholar]
  39. Byrne, R.H.; Sholkovitz, E.R. Marine chemistry and geochemistry of the lanthanides. Handb. Phys. Chem. Rare Earths 1996, 23, 497–593. [Google Scholar] [CrossRef]
  40. Elderfield, H.; Greaves, M.J. The Rare Earth Elements in Seawater. Nature 1982, 296, 214–219. [Google Scholar] [CrossRef]
  41. Jones, B.; Manning, D.A.C. Comparison of geochemical indices used for the interpretation of depositional environments in ancient mudstones. Chem. Geol. 1994, 111, 112–129. [Google Scholar] [CrossRef]
  42. Lin, Z.J.; Chen, D.F.; Liu, Q. Geochemical indices for redox conditions of marine sediments. Bull. Mineral. Petrol. Geochem. 2008, 27, 72–80. [Google Scholar] [CrossRef]
  43. Song, G.; Miao, Z.Y.; Du, S.R.; Li, X.M. Geochemical characteristics of trace elements before and after the upper salt forming period of the mk-3 core, simao basin and their paleoenvironmental implications. Acta Geosci. Sin. 2022, 43, 584–592. [Google Scholar] [CrossRef]
  44. Yan, M.C.; Chi, Q.H. The Chemical Compositions of the Continental and Rocks in the Eastern Part of China; Science Press: Beijing, China, 1997; pp. 180–192. ISBN 7030146670. [Google Scholar]
  45. Zhang, Y.D.; Zhan, R.B.; Zhen, Y.Y.; Wang, Z.H.; Yuan, W.W.; Fang, X. Ordovician integrative stratigraphy and timescale of China. Sci. China Earth Sci. 2019, 49, 66–92. [Google Scholar] [CrossRef]
  46. Xia, L.Q.; Xia, Z.C.; Xu, X.Y. Magmagenesis of Ordovician back-arc Basins in the Northern Qilian Mountains. Geol. China 2003, 30, 48–60. [Google Scholar] [CrossRef]
  47. He, D.F.; Shao, D.B.; Cui, Y.P.; Bao, H.P.; Kai, B.Z.; Fu, D.W.; Cao, Y.G. Delineation, formation, and geological significance of Majatan paleo-uplift at the western margin of Ordos Basin. Acta Pet. Sin. 2018, 39, 609–619. [Google Scholar] [CrossRef]
  48. Guo, Y.; Li, Y.S.; Ling, Y.; Zhang, H.G.; Hou, Y.J. The sedimentary geochemical characteristics and metallogenic mechanism of manganese-bearing rock series in southeastern Chongqing, China. Acta Geol. Sin. 2018, 92, 2331–2348. [Google Scholar]
  49. Xie, R.C.; Zhou, W.; Zhang, C.; Lei, T.; Yin, S. Characteristics, influencing factors, and prediction of fractures in weathered crust karst reservoirs: A case study of Ordovician Majiagou Formation in the Daniudi Gas Field, Ordos Basin, China. Geol. J. 2020, 55, 7790–7806. [Google Scholar] [CrossRef]
  50. Li, W.J.; Chen, J.T.; Hakim, A.J.; Myrow, P.M. Middle Ordovician mass-transport deposits from western Inner Mongolia, China: Mechanisms and implications for basin evolution. Sedimentology 2021, 69, 1301–1338. [Google Scholar] [CrossRef]
Figure 1. (a) Tectonic subdivision of the Chinese mainland showing the tectonic location of the study area [13]; (b) Sketch map illustrating the geological framework of the Western North China block [5]; (c) Map showing the strata distribution of Miboshan Formation in the study area.
Minerals 13 01383 g001
Figure 2. Tectonic units in the western Ordos Basin [9,10].
Minerals 13 01383 g002
Figure 3. Schematic lithologic column of the Miboshan Formation of Ningxia.
Minerals 13 01383 g003
Figure 4. Sedimentary characteristics of Miboshan Formation. (a) Interbeds of calcarenite and claystone; (b) Dark gray medium- to thick-bedded calcirudite, the composition of gravel is mainly micrite with a sub-angular to sub-round, Jianshanzi section at the bottom of the second member of Miboshan Formation; (c) Dark gray thin-bedded micrite, argillaceous limestone, and bioclastic limestone interbedded with claystone, Mawangou section of the lower part of 2nd member of Miboshan Formation; (d) Light grayish-black thin-bedded claystone with abundant graptolites, in (c) position; (e) Dark grayish-black thin-bedded micrite with horizontal laminae, Jianshanzi section of 2nd member of Miboshan Formation; (f) Interbeds deformation of limestone; (g) Dark grayish-black thin- to medium-bedded micritic with slump structure (short arrow), with undeformed horizonal lamina in the upper and lower part (long arrow); (h) Dark gray and grayish-black micritic (below the yellow straight line) overlying dark gray thick-bedded calcirudite of the upper section; (i) calcirudite cast and formation strike: 146°, 147°, formation occurrence: 215° ∠ 25°.
Minerals 13 01383 g004
Figure 5. Cross plots for checking up from (∑REE + Y) of claystones of Miboshan Formation; plots of (∑REE + Y) vs. TFe2O3 (a), Fe2O3 (b), FeO (c), MnO (d), SiO2 (e), Al2O3 (f), MgO (g), CaO (h) and CaO vs. SiO2 (i).
Minerals 13 01383 g005
Figure 6. REE + Y patterns of claystone and cross plot of hydrothermal origin of Miboshan Formation [27]. (a) PAAS-normalized patterns of REE; (b) Chondrite-normalized patterns of REE; (c) U-TH plot: I is normal pelagic sediments, II is Pacific Rise sediments, III is submarine exhalative sediments.
Minerals 13 01383 g006
Figure 7. Cross plots for checking Ce and Eu anomalies of claystones of Miboshan Formation [23]; plots of Ce anomaly vs. (PrN/Pr*N) (a), LaN/NdN (b), LaN/SmN (c), and ∑REE (d); plots of Eu anomaly vs. (LaN/NdN) (e) and Ce anomaly (f); A: true Ce; B1: the Ce negative region affected by La positive anomaly; B2: the Ce positive region affected by La negative anomaly; C1: true Ce positive anomaly region; C2: true Ce negative anomaly region.
Minerals 13 01383 g007
Figure 8. Sedimentary model of Miboshan Formation.
Minerals 13 01383 g008
Table 1. Trace element and related element concentrations of claystone of the Miboshan Formation.
Sample Number6-16-26-36-46-51st Data Set6-66-76-82nd Data SetAverage
La26.2023.6024.8020.5017.3022.4851.7049.0046.6049.1031.35
Ce48.3042.7055.4037.4030.6042.8895.8086.4083.3088.5058.09
Pr5.645.055.354.573.634.8511.0510.1010.1010.426.70
Nd21.8018.3019.7019.0014.3018.6241.5039.4037.4039.4325.56
Sm4.483.664.143.982.753.808.077.227.807.705.10
Eu0.770.600.770.860.510.701.191.121.281.200.87
Gd3.743.173.693.602.363.316.445.026.525.994.21
Tb0.610.520.580.590.400.541.060.851.081.000.69
Dy3.442.873.073.172.102.936.114.675.815.533.80
Ho0.700.610.640.670.460.621.291.131.251.220.82
Er1.781.641.871.611.411.663.423.203.353.322.22
Tm0.310.230.300.250.170.250.600.480.510.530.34
Yb1.931.711.811.631.361.693.393.333.503.412.26
Lu0.270.260.260.230.180.240.550.520.540.540.34
Y18.6016.7017.9017.9012.8016.7834.3028.1032.7031.7021.75
∑REE119.97104.92122.3898.0677.53104.57232.17212.44209.04217.88142.34
∑REE + Y138.57121.62140.28115.9690.33121.35266.47240.54241.74249.58164.10
LREE107.1993.91110.1686.3169.0993.33209.31193.24186.48196.34127.67
HREE12.7811.0112.2211.758.4411.2422.8619.2022.5621.5414.67
L/H8.398.539.017.358.198.299.1610.068.279.168.58
La/Nd1.201.291.261.081.211.211.251.241.251.251.22
La/Ce0.540.550.450.550.570.530.540.570.560.560.54
CeN/Ce*N0.920.901.110.890.890.940.920.890.890.900.93
PrN/Pr*N1.021.060.951.001.021.011.031.021.061.041.02
EuN/Eu*N0.890.830.931.070.940.930.780.870.850.830.90
LaN/La*N1.090.970.991.241.161.091.041.161.001.071.08
LaN/YbN1.001.021.010.930.940.981.131.090.981.071.01
LaN/NdN1.071.141.120.961.071.071.111.101.111.111.08
LaN/SmN0.850.940.870.750.910.860.930.990.870.930.89
Al2O310.8410.9910.787.627.849.6119.2620.8119.2719.7813.00
CaO23.5022.9022.9031.0030.4026.140.510.370.220.3717.55
TFe2O34.534.514.643.513.284.097.727.257.537.505.23
MgO2.992.963.092.443.743.042.822.952.592.792.96
SiO231.5232.0332.4924.6122.6028.6558.6957.6959.6158.6638.65
FeO3.033.043.162.402.282.785.214.794.944.983.51
SiO2/Al2O32.912.913.013.232.882.993.052.773.092.972.98
Fe3+/Fe2+0.450.440.420.420.390.420.430.460.660.520.46
Fe2O33.173.163.252.462.302.875.405.085.275.253.66
Ba259.00242.00254.00175.00192.50224.50477.00510.00506.00497.67315.56
Cr60.0060.0060.0040.0050.0054.00110.0110.0100.0106.671.56
Rb125.00116.50121.5083.8093.70108.10238.00255.00230.00241.00152.40
Sr336.00337.00322.00484.00499.00395.6063.3084.7067.5071.83287.68
Th10.659.5210.608.346.969.2122.2021.2020.4021.2713.23
U2.342.162.091.921.882.083.723.403.333.482.55
V78.0070.0076.0054.0057.0067.00138.00149.00126.00137.6790.56
Zr100.0089.00103.0071.0064.0085.40195.00181.00175.00183.67118.16
Sr/Ba1.301.391.272.772.591.860.130.170.130.141.29
V/Cr1.301.171.271.351.141.251.251.351.261.291.26
U/Th0.220.230.200.230.270.230.170.160.160.160.21
Zr/Rb0.800.760.850.850.680.790.820.710.760.760.78
Th/U4.554.415.074.343.704.415.976.246.136.114.98
Fe2+ = FeO% ÷ 1.2865, Fe3+ = Fe2O3% ÷ 1.4297.
Table 2. Values and characteristics of Redox condition analysis.
IndicatorsThe AverageResultStandard of Indicators
1st2ndtotal1st2ndTotal
Ce anomaly0.940.900.93weaker anoxicitystronger anoxicityanoxic conditionNegative Ce anomalies in abiotic rocks indicates anoxic condition [39]
Ceanom0.030.050.04stronger anoxicityweaker anoxicityanoxic conditionCeanom > −0.1 indicates anoxic condition; Ceanom < −0.1 indicates oxic condition [40]
Ce/La1.901.801.86stronger anoxicityweaker anoxicityweak anoxic condition1.5 ≤ Ce/La < 1.8 indicates oxygen-poor environment, 1.8 ≤ Ce/La < 2 indicates weak anoxic condition, and Ce/La ≥ 2 indicates anoxic condition [40]
V/Cr1.241.291.26oxic conditionoxic conditionoxic conditionV/Cr > 4.25 indicates anoxic condition [41]; V/Cr < 1.2 indicates oxic condition; V/Cr>1.2 indicates dysoxic condition [26]
Fe3+/Fe2+0.420.520.46stronger anoxicityweaker anoxicityanoxic conditionFe3+/Fe2+ < 1 indicates anoxic condition; Fe3+/Fe2+ > 1 indicates oxic condition
Disclaimer/Publisher’s Note: The statements, opinions and data contained in all publications are solely those of the individual author(s) and contributor(s) and not of MDPI and/or the editor(s). MDPI and/or the editor(s) disclaim responsibility for any injury to people or property resulting from any ideas, methods, instructions or products referred to in the content.

