Abstract
Regional paleoregolith is found to exist immediately below unconformities separating basin fills from basement rocks in sedimentary basins. However, the controlling role of paleoregolith on unconformity-type uranium mineralization has not been quantitatively addressed before. Coupled hydrothermal fluid flow and reactive mass transport modeling are therefore performed in this study by using the software TOUGHREACT. The modeling results reveal that preferential flow occurs in the regolith due to its relatively high permeability in comparison with that of the host rocks. The thicker the regolith is, the more concentrated the fluids in the footwall of a fault zone are, leading to more compact and higher-grade deposits therein, and vice versa. Also, displacement of the regolith caused by fault offset plays an important role, as it appears to control the shape of uranium deposits. When the displacement is less than 30 m, the deposits are characterized by a more compact shape. When the displacement is over 60 m, the deposits extend more laterally and even exhibit a ‘discrete’ shape due to the expelling effect of downslope flow that occurs at the fault offset site.
1. Introduction
Unconformity-type uranium deposits are high grade and have large tonnage, and they are the main source of global uranium resources. Giant deposits of this type occur in the Athabasca and Thelon Basins in Canada and the McArthur Basin in Australia, although there are smaller and lower-grade deposits elsewhere in the world [1,2,3]. Uranium mineralization is associated spatially with unconformities, and structurally controlled by reactivated reverse faults that intersect unconformities (e.g., [4]).
Regional paleoregolith was found to be present immediately below the unconformities in the above-mentioned basins, and is interpreted as being formed by paleo-weathering of basement rocks prior to the deposition and development of the basins [2,3,4,5,6]. In addition, when basement rocks were exposed at the surface, they underwent multiscale micro fracturing due to the lack of overburden, thereby enhancing permeability. Its thickness varies from place to place, ranging from several centimeters to a few hundred meters [4]. Paleoregolith was commonly offset by reactivated fault zones, with displacements ranging from tens to hundreds of meters [4,7,8]. It was likely permeable due to weathering and micro fracturing processes and acted as a preferential flow path during uranium mineralization. For instance, Skirrow et al. [9] reported that the regolith in the McArthur Basin allowed for basinal fluid flow into the basement to leach uranium from metamorphic rocks. Thus, regional paleoregolith represents an important component of the ore-forming fluid flow framework associated with the formation of uranium deposits, enhancing fluid flow and ore genesis (e.g., [4,10,11]). However, the question of how it controls fluid flow and uranium mineralization still remains poorly understood quantitatively.
Computational modeling of fluid flow has been applied to address the ore-forming processes for different types of mineral deposits (e.g., [12,13,14,15,16]). Previous numerical studies have mainly emphasized the physical aspects of unconformity-type uranium deposits. For instance, Pek and Malkovsky [17] linked the fluid circulation in the sandstone layer with the heat convection in the underlain basement unit. Eldursi et al. [18] conducted 2D and 3D numerical modeling in relation to the ore genesis of the Cigar Lake deposit in the Athabasca basin. Li et al. [19] investigated the interaction between fault reactivation and heat convection. More recently, Lin et al. [20] conducted numerical investigation into the tectonic deformation and buoyancy force in focusing ore fluids in the Chanziping region of China. However, these studies ignored reactive mass transport. In contrast, Komninou and Sverjensky [21] showed that reduced iron present in host rocks was the primary reducing agent for oxidized uranium-bearing fluids, but ignored the hydrological aspects (in particular, fluid flow). Following the first reactive flow modeling effort by Raffensperger and Garven [22], recent numerical studies have begun to fully couple fluid flow, heat transport, and chemical reactions to address the ore genesis of unconformity-type uranium deposits in the Athabasca Basin, conducted mainly by the corresponding author’s research team. For instance, Lin et al. [23] examined the effect of fault locations on uranium mineralization. Xu et al. [24] confirmed that the location of uranium-bearing brines plays a critical role in ore genesis. However, to the best of our knowledge, no numerical modeling research has been performed to examine the role of paleoregolith in controlling fluid flow and uranium mineralization. This paper aims to fill this knowledge gap through conducting a series of reactive flow modeling case studies.
2. Development of 2D Reactive Flow Models
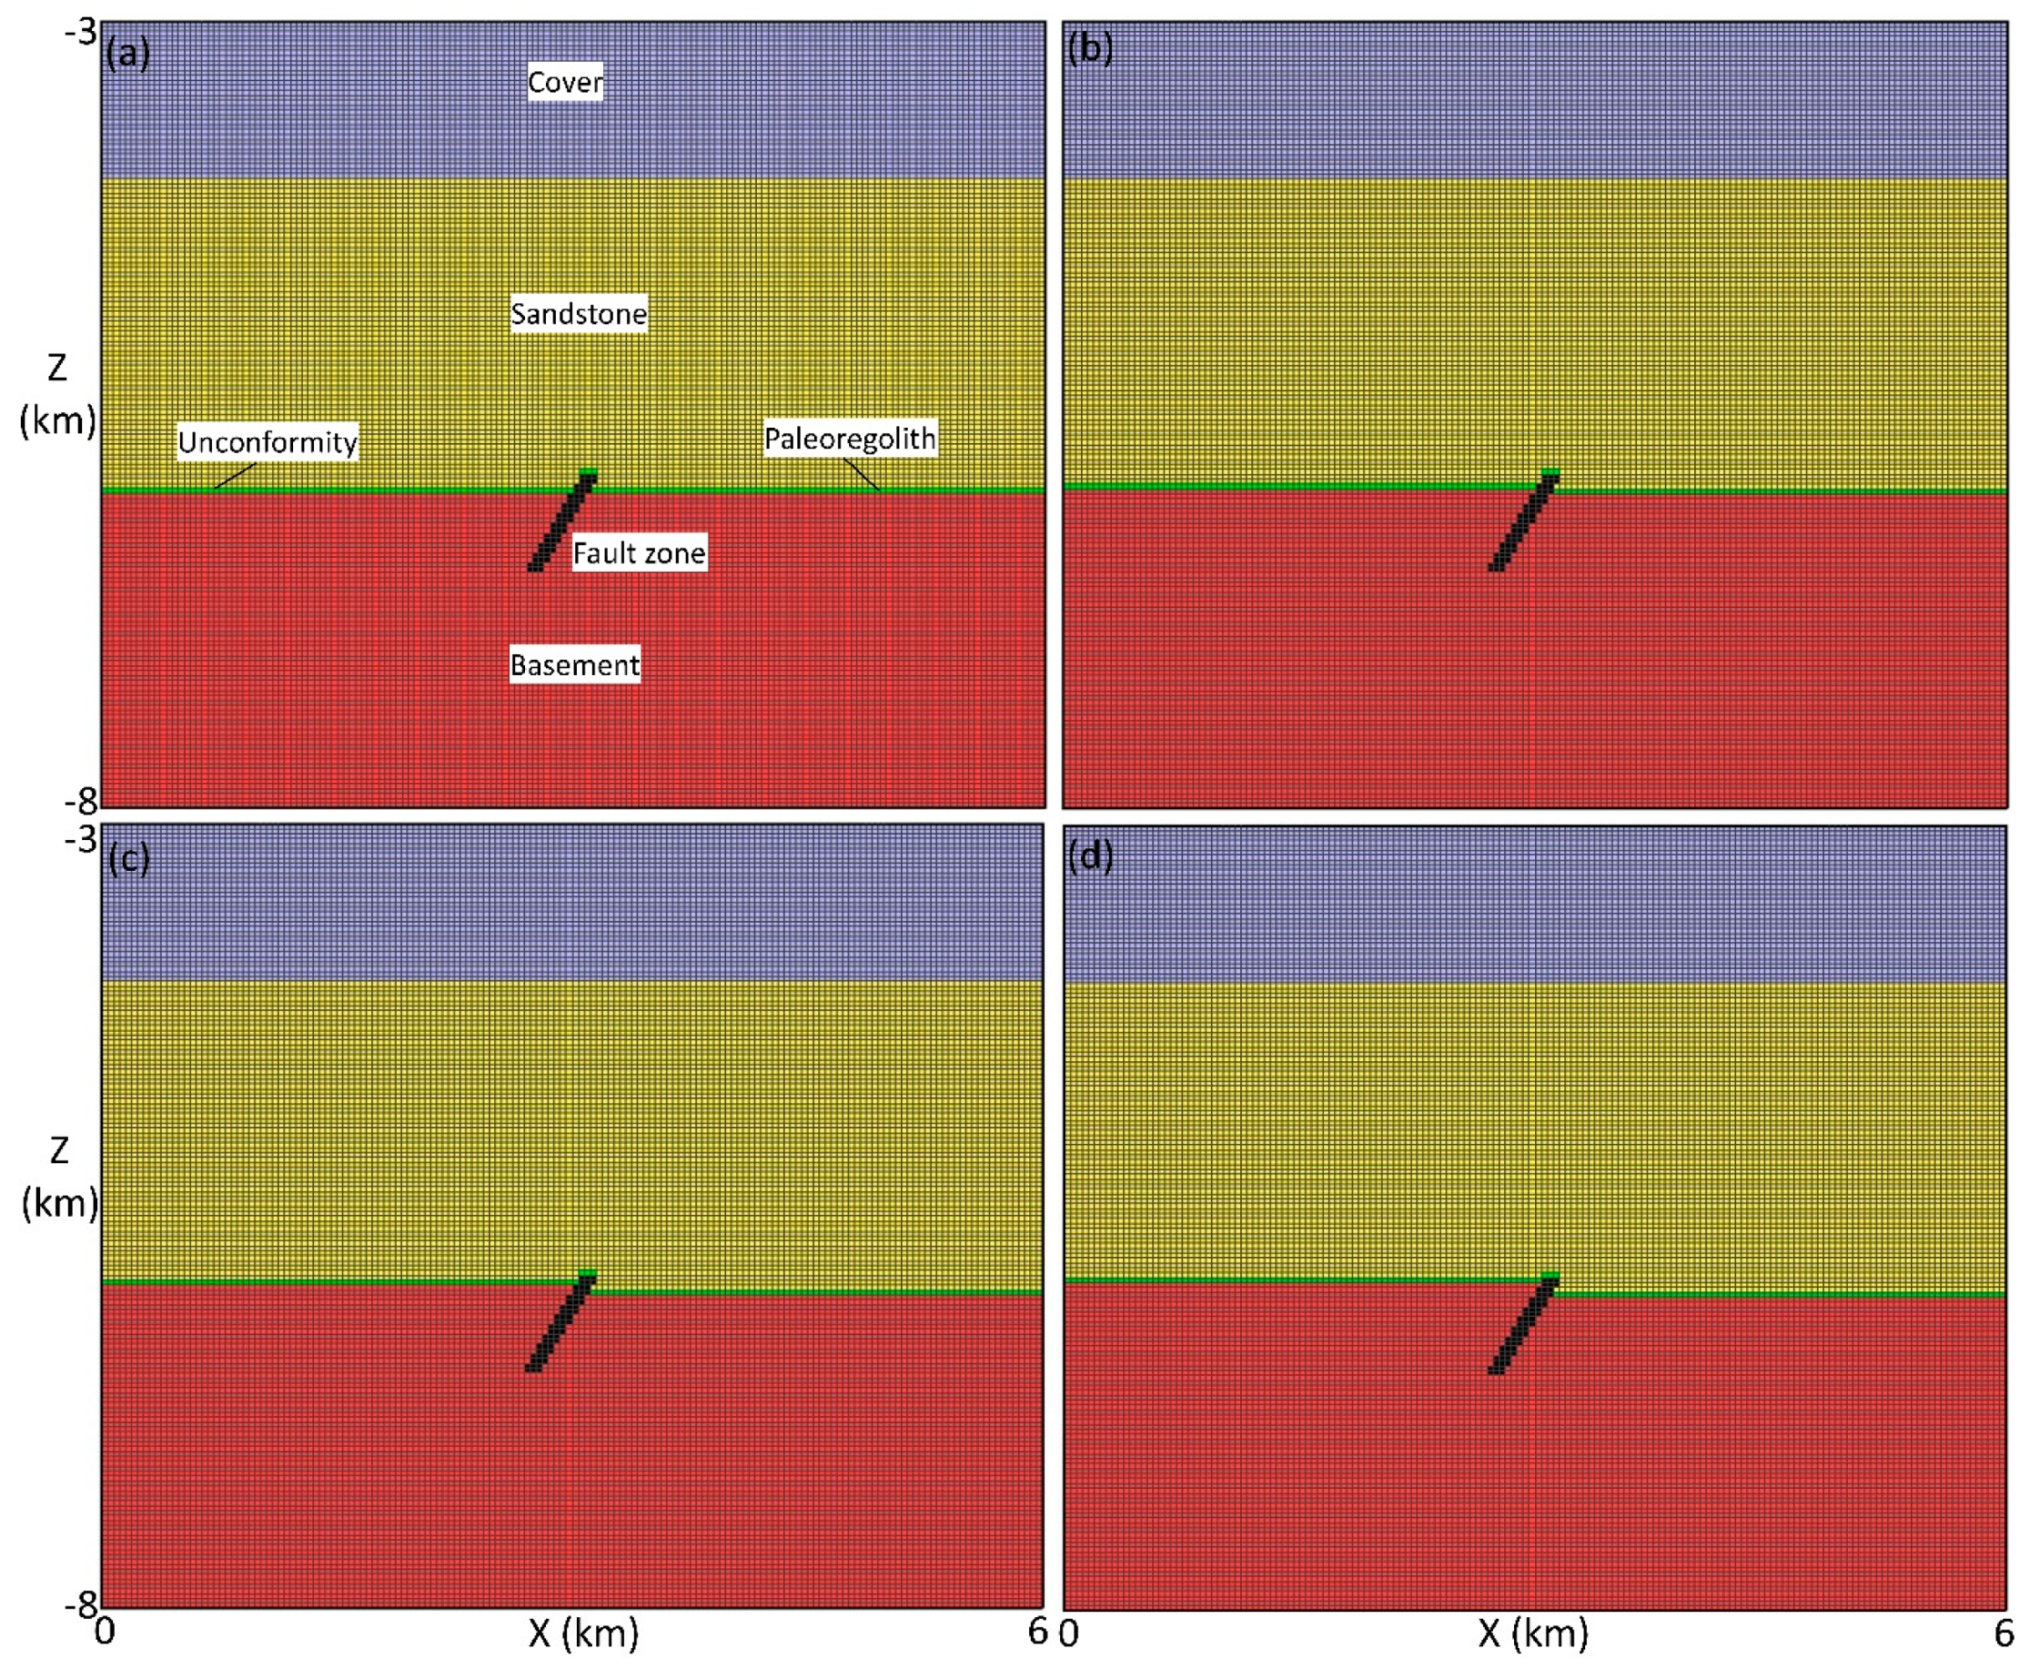
Figure 1 shows our conceptual models, which were developed by integrating some common characteristics of typical deposits of this type in the Athabasca Basin. The model is characterized by a layered structure, from bottom to top, containing a 1 km thick confining cover, a 2 km thick intermediate sandstone layer, and a 2 km thick basement unit, with the unconformity interface separating the sandstone and basement units. The top boundary is 3 km below the surface. Previous numerical studies also employed similar layered models, e.g., [24,25,26,27,28]. A paleoregolith layer occurs below the unconformity, which is intersected and offset by a fault zone. The model has a vertical dimension of 5 km and a horizontal dimension of 6 km, and it is discretized uniformly by 160 cells both vertically and horizontally. Therefore, there are 25,921 grid nodes in total, with each individual cell having dimensions of 37.5 m and 31.25 m in the x and z directions, respectively.
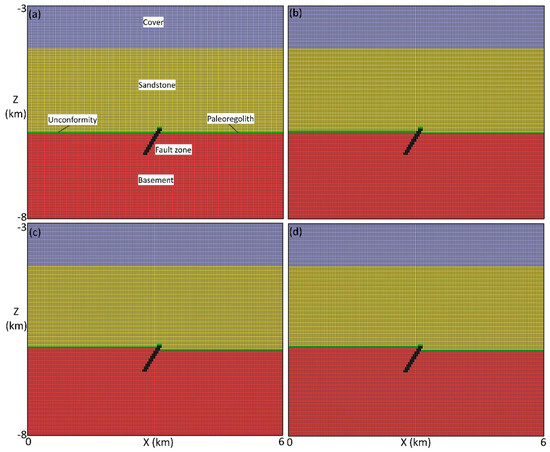
Figure 1.
2-D reactive flow models showing different displacements of paleoregolith and unconformity caused by fault offset: (a) 0 m, (b) 31.25 m, (c) 62.5 m, and (d) 93.75 m. The paleoregolith has varying thicknesses.
It has long been recognized that fault zones in the Athabasca Basin played important roles in ore genesis in that they not only contribute the reducing agent (i.e., methane) for the precipitation of uraninite but also concentrate mineralized fluids to deposition sites [4,29,30,31,32,33,34]. Taking into account the different local tectonic settings, the width of the fault zones varies from tens to hundreds of meters, e.g., [4,35], and the dip angle varies from extremely low to nearly vertical, e.g., [29,36,37,38]. They occur dominantly in the basement but often extend across the unconformity into the sandstone to several tens of meters [7,18,25,39]. The deepest extension of the reverse faults below the unconformity is reported to be about 400 m, although longer and shorter variants are possible [4]. Based on these constraints, in this study the fault zone is assumed to dip 59° to the left, extend vertically for 625 m (20 cells), and have a horizontal width of 112.5 m (3 cells). Figure 1a–d corresponds to a displacement of 0, 31.25 m (1 cell), 62.5 m (2 cells), and 93.75 m (3 cells) for the regolith and unconformity, respectively. The regolith is assumed to have varied thicknesses, ranging from 0 to 93.75 m (3 cells), which is constrained by previous works [4,7,8] corresponding to different numerical case studies, as presented below.
The cover layer on top simulates sedimentary rocks that were formed under shallow marine conditions, serving as a fluid confinement unit. The middle sandstone layer is the main aquifer that allows fluids to circulate within it. The basement represents the least permeable geological unit. The regolith is assumed to have the same mineral composition as the basement but is more permeable due to the weathering process of the basement rocks. The fault zone is considered a fluid conduit as before. The physical properties assigned to the different geological units are shown in Table 1. The mineral composition and volume fractions for each geological unit are tabulated in Table 2, and the concentrations of aqueous components are listed in Table 3. In addition, the oxygen fugacity fO2 and pH of different geological units are also provided in Table 3. The data presented in Table 1, Table 2 and Table 3 are based on previous modeling studies and fluid inclusion reports (e.g., [19,22,23,24,25,26,27,28,40,41,42]). For instance, a recent fluid inclusion analysis of barren sandstones in the Athabasca Basin [40] indicates that the concentration of aqueous uranium UO22+ ranges from 2.2 × 10⁻⁶ to 9.9 × 10⁻⁵ mol/L, with an average of 2.5 × 10⁻⁵ mol/L, while previous fluid inclusion studies of quartz veins in barren samples coexisting with several uranium deposits in the Athabasca Basin [41,42] report that the UO22+ concentration in the basement brine ranges from 1.0 × 10⁻⁶ to 2.8 × 10⁻³ mol/L, and that the average is 1.0 × 10⁻⁴ mol/L. Therefore, this study assigns UO22+ concentrations of 2.5 × 10⁻⁵, 1.0 × 10⁻⁴, 1.0 × 10⁻⁶, and 1.6 × 10⁻⁶ mol/L for the sandstone, basement, confining cover, and fault zone, respectively, as shown in Table 3. In other words, the basement unit represents the main uranium source region.

Table 1.
Physical parameters assigned for different geological units.
Table 2.
Initial volume fractions of minerals for different geological units.
Table 3.
Initial concentrations (mol/L) of aqueous components for different geological units.
As in previous modeling studies (e.g., [24]), the upper and lower boundaries are assigned constant temperatures of 90 °C and 240 °C, respectively. The side boundaries are presumably impermeable to fluid flow, whereas the top has a constant fluid pressure of 30 MPa. For chemical reactions, fixed volume fractions of the minerals and fixed concentrations of the aqueous components are used for the top and bottom and are the same as their corresponding geological units. The two sides are set to zero values in normal gradients of the volume fractions and concentrations. The initial conditions include a linear increase in temperature, hydrostatic pressure, and lithostatic pressure from the top to bottom. This paper also assumes that at typical ore-forming temperatures, graphite in the fault zone dissolves to produce aqueous methane, which then reduces aqueous uranium to uraninite (e.g., [24]).
Numerical computations were performed by using the commercial software package TOUGHREACT [43], which is capable of simulating chemically reactive non-isothermal flows of fluids in porous and fractured media, as well as interactions between mineral assemblages and fluids. Governing equations include coupled non-isothermal fluid flow, solute transport, and reactive geochemistry. The flow and transport equations can be derived from the principle of mass and energy conservation. The chemical transport equations are written in terms of total dissolved concentrations of chemical components, which are concentrations of their primary species plus their associated aqueous secondary species. Advection and diffusion processes are considered for chemical transport, and diffusion coefficients are assumed to be the same for all aqueous species. Aqueous complexation, acid-base, redox, and cation exchange are assumed to be in local equilibrium. Mineral dissolution and precipitation are assumed to proceed under kinetic conditions, with the exception of anhydrite and calcite where an equilibrium approach is employed due to their fast reaction rate when reacting with aqueous species [43].
3. Modeling Results and Discussion
Let us first consider a scenario when the paleoregolith has a thickness of 31.25 m and there is no displacement, as shown in Figure 1a.
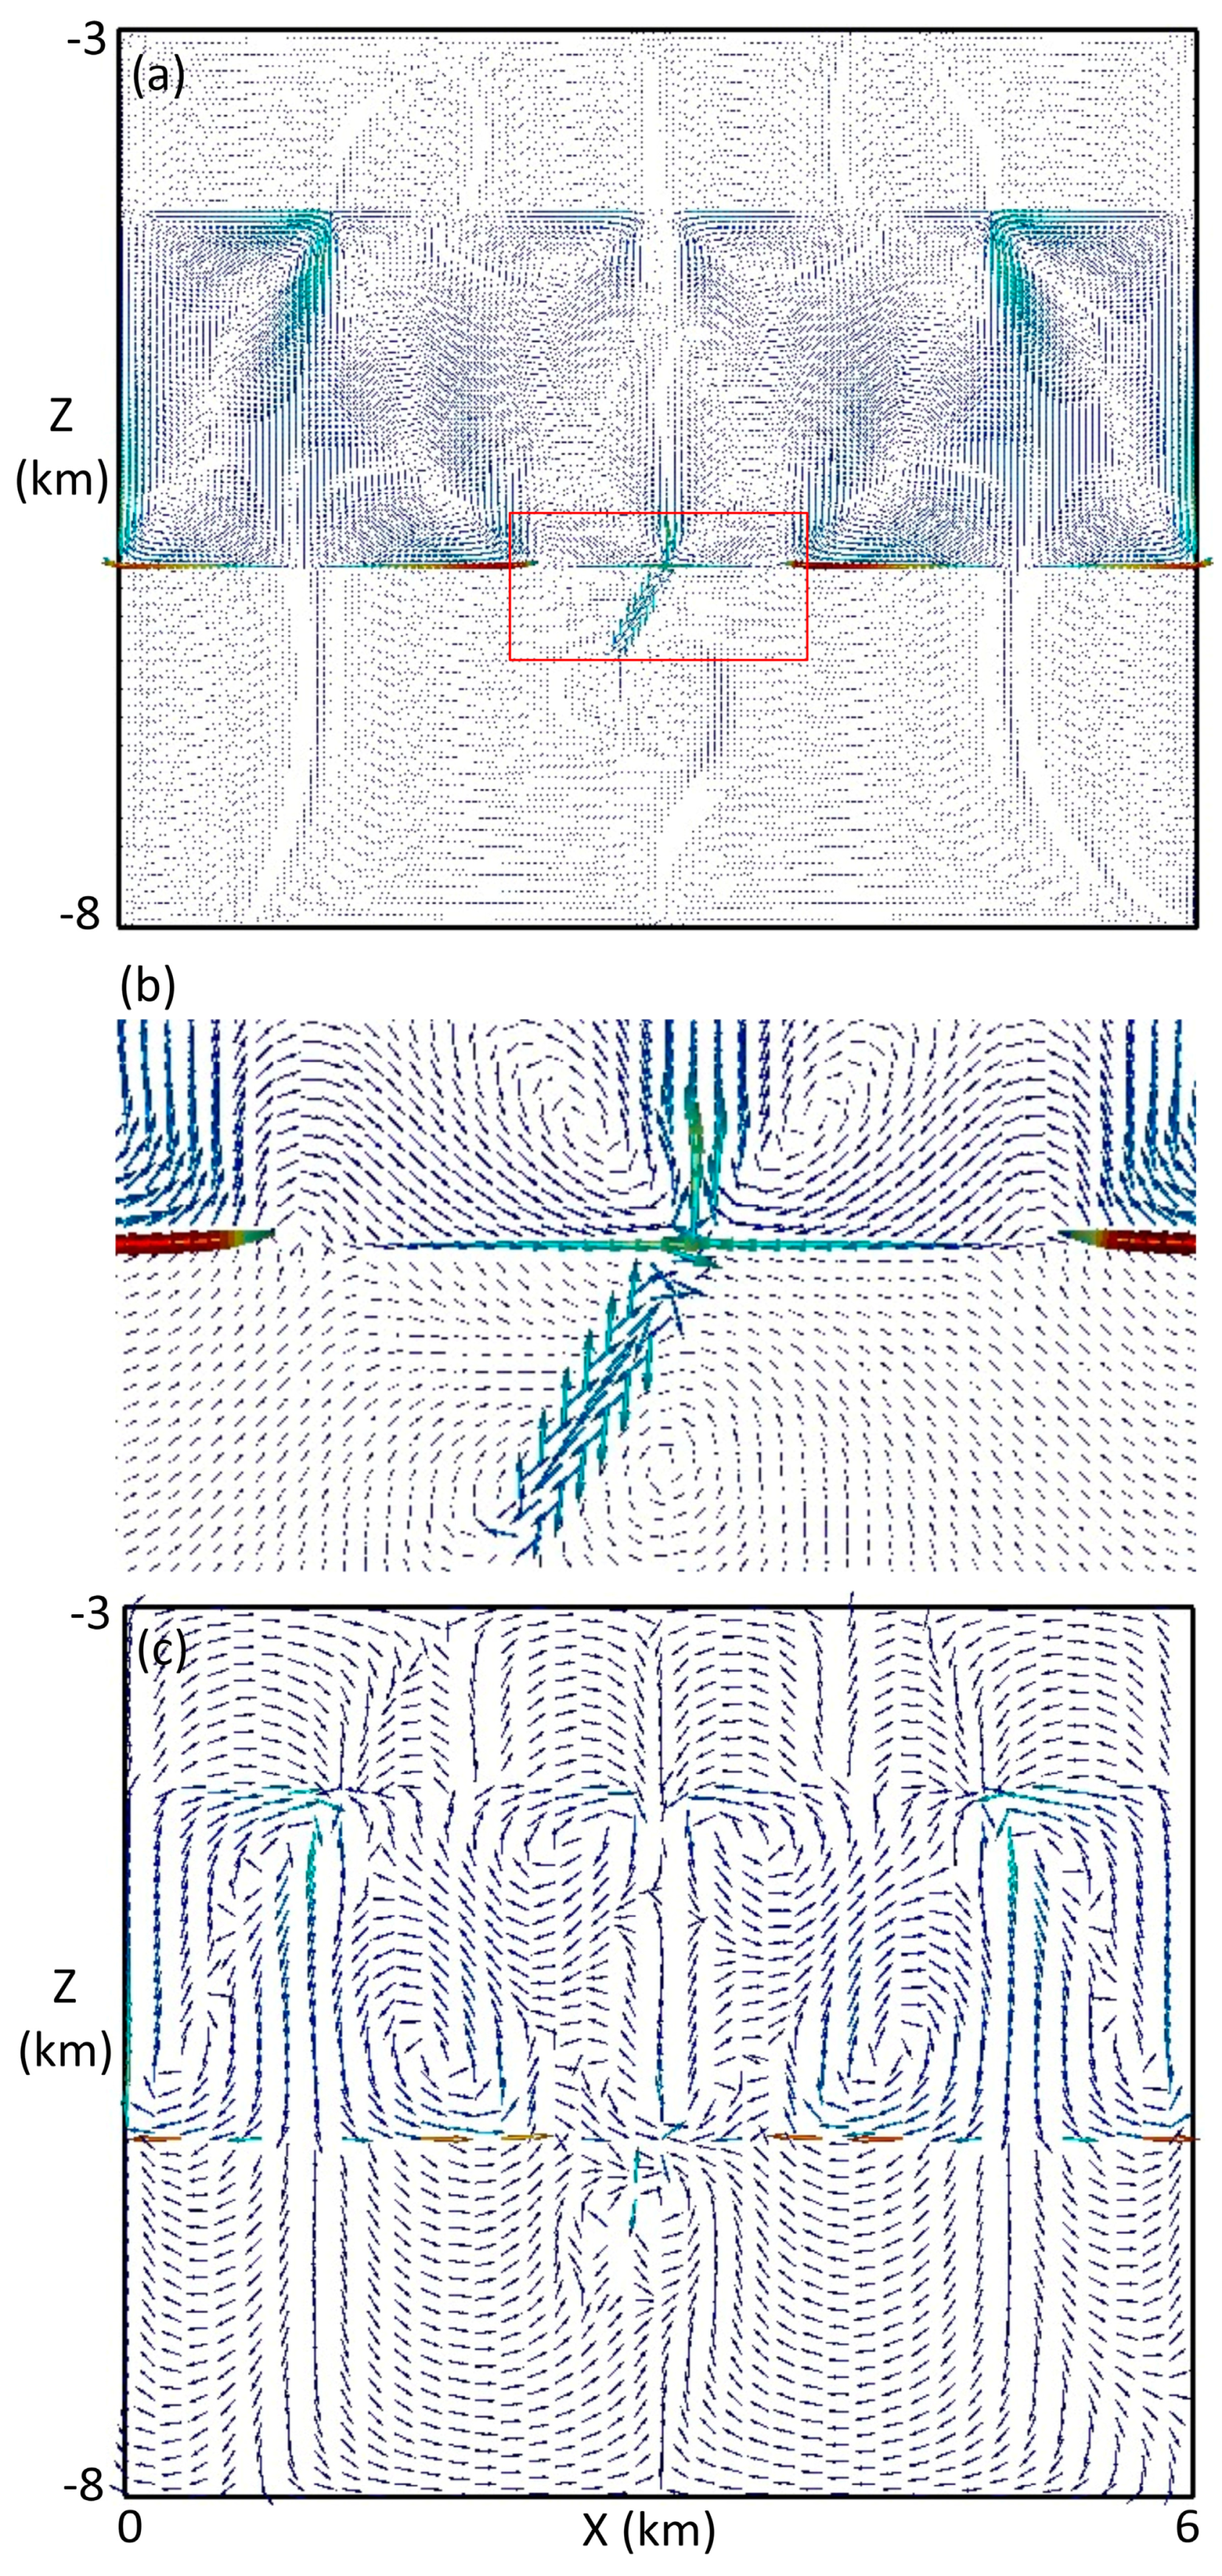
Figure 2a illustrates the fluid flow vectors at 1000 years, which was driven by buoyancy force resulting from the thermal gradient. The maximum fluid rate in the sandstone layer was three orders of magnitude greater than those in the basement and cover. Figure 2b shows an enlarged view of the fluid flow surrounding the fault zone, indicating that the left upper half of the fault zone carried an up-flow, while the right lower half carried a down-flow. Flow vectors in the cover and basement unit were too small to be identified. To better visualize the flow pattern, the original flow vectors in Figure 2a were sparsely sampled and artificially adjusted in their length, as illustrated in Figure 2c. It can be seen from Figure 2c that the convective cells in the sandstone layer were of similar size, with alternating upwelling and downwelling flow zones. Part of the basinal fluid from the downwelling flow zones percolated across the unconformity to mix with the basement brine, which also moved downwards but at a much lower rate. The basement brine then diverged and flowed upwards to join the upwelling zones in the sandstone layer. Similarly, some of the basinal fluid from the upwelling zones penetrated across the sandstone–cover interface to mix with the fluid in the cover, which also moved upwards but at a much lower rate. The fluid in the cover then diverged and flowed downwards to join the downwelling flow zones in the sandstone layer.
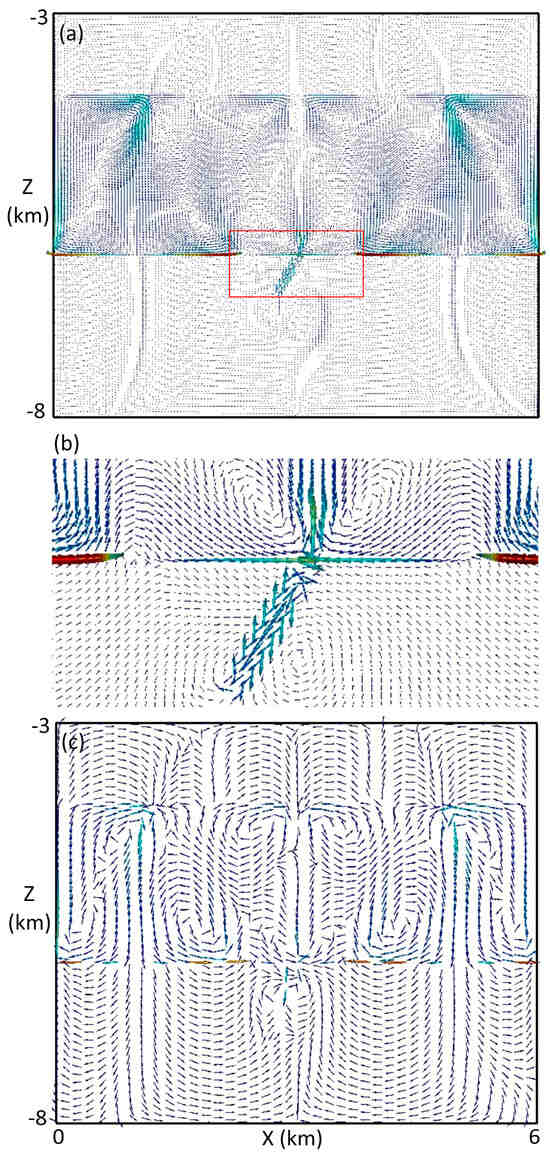
Figure 2.
Fluid flow velocity vectors at 1000 years when the paleoregolith has a thickness of 31.25 m and there is no displacement: (a) raw velocity vectors, (b) zooming in to the red box in Figure 2a, and (c) modified from Figure 2a by using a uniform vector length and sampling a smaller number of cells.
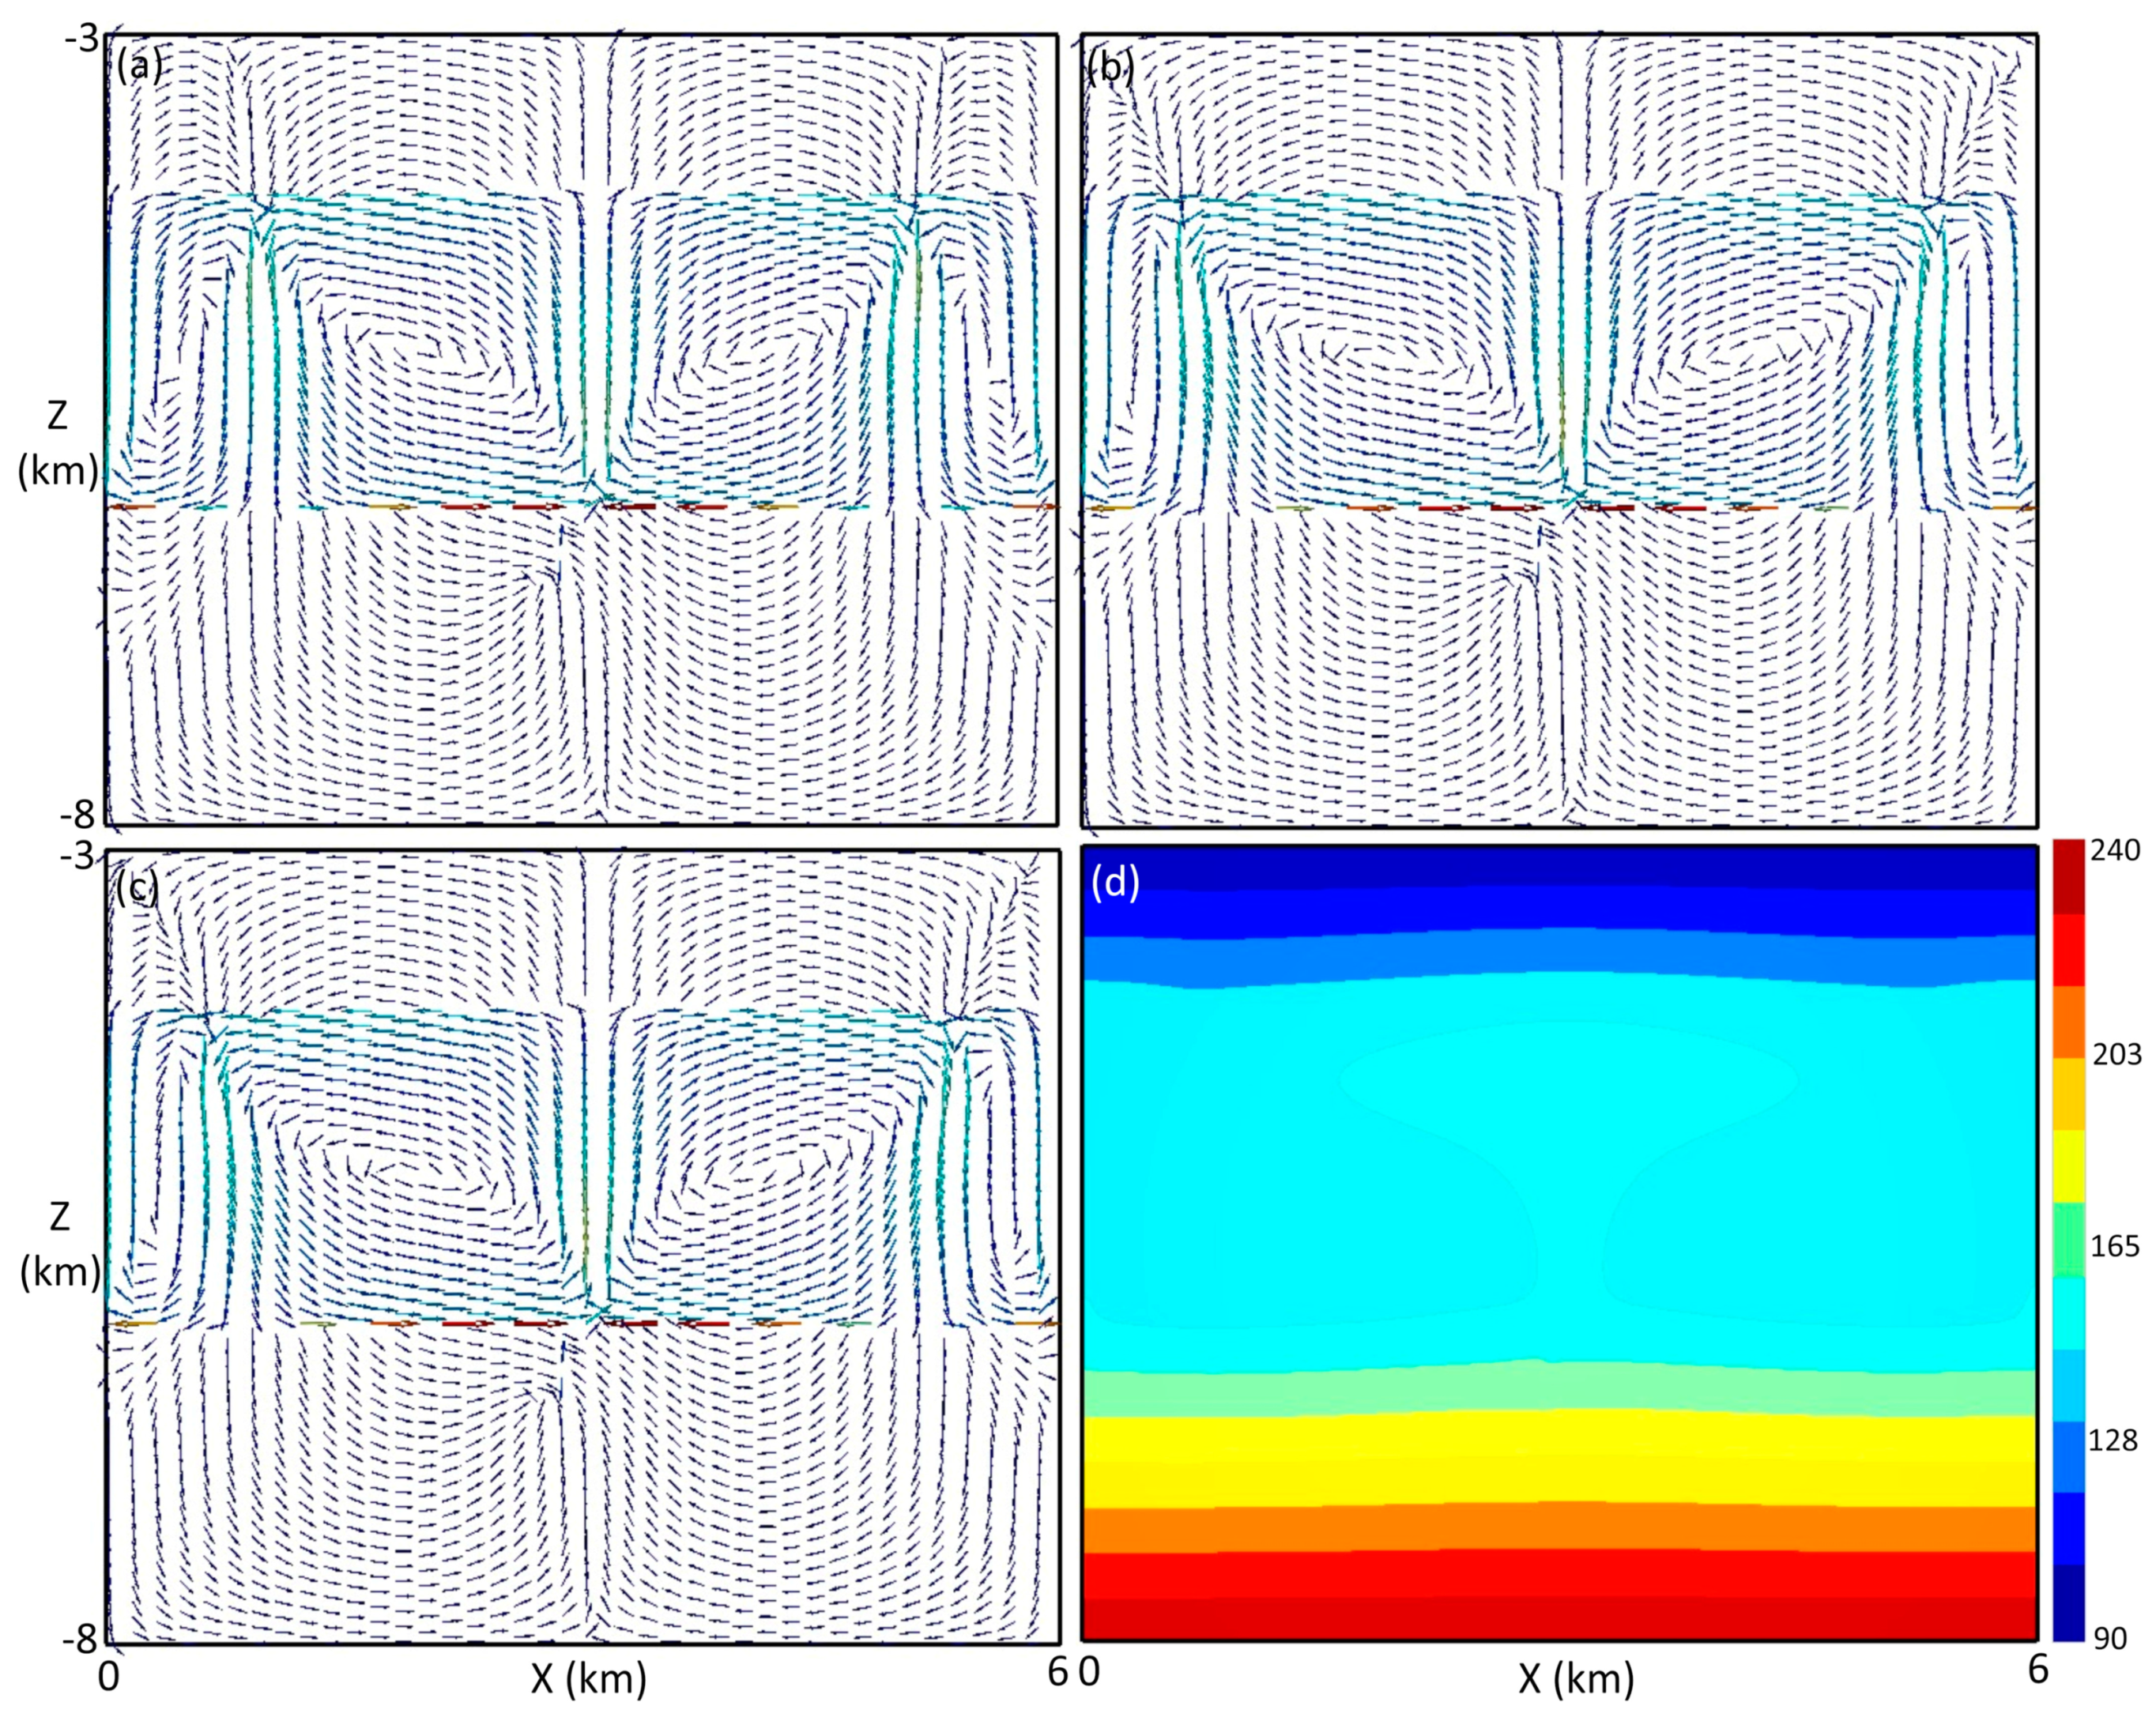
Figure 3a shows the flow vectors at 50,000 years. Two dominant convection cells established in the sandstone layer, with two minor cells formed close to the side boundaries. The basinal fluid circulated upwards from the top of the fault zone. When the fluid reached the top of the sandstone layer, part of it discharged to the overlain confining cover, and the rest diverged to the left and right, and then flowed downwards through the two downwelling zones which are located close to the left and right boundaries. When the fluid descended to the bottom of the sandstone layer, some of it percolated into the underlain basement, and the rest flowed parallel to the unconformity interface until joining the central upwelling flow. Compared with Figure 2c, currently, almost all the basal brine of the entire basement focused into the footwall area of the fault zone beneath the unconformity, except that some shallow basement brine, which was close to the side boundaries, discharged to the sandstone layer. The fluid flow system started to reach a steady state at about 150,000 years (Figure 3b). Figure 3c shows the flow vectors at 300,000 years, which are almost identical to Figure 3b. It is obvious that more basement brine was focused into the footwall area with fewer discharges to the overlain sandstone layer in Figure 3c than in Figure 3a. The convective heat transport due to the afore-mentioned fluid circulation modified the initially assigned geothermal field, leading to the temperature distribution at 300,000 years, as illustrated in Figure 3d. The mushroom-shaped isothermal line of 145 °C resulted from the central upwelling flow and the side downwelling flow in the sandstone layer. The effect of the basement brine on the temperature distribution was negligible due to its extremely low rate, as evidenced by the almost uniformly spaced isothermal lines in the basement. However, the basement flow plays an important role in uranium mineralization, as discussed below.
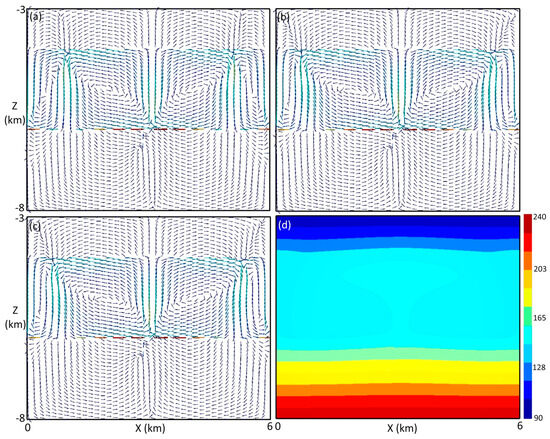
Figure 3.
Numerical results when the paleoregolith has a thickness of 31.25 m and there is no displacement. Flow velocity vectors: (a) at 50,000 years, (b) at 150,000 years, and (c) at 300,000 years. Temperature distribution at 300,000 years (d).
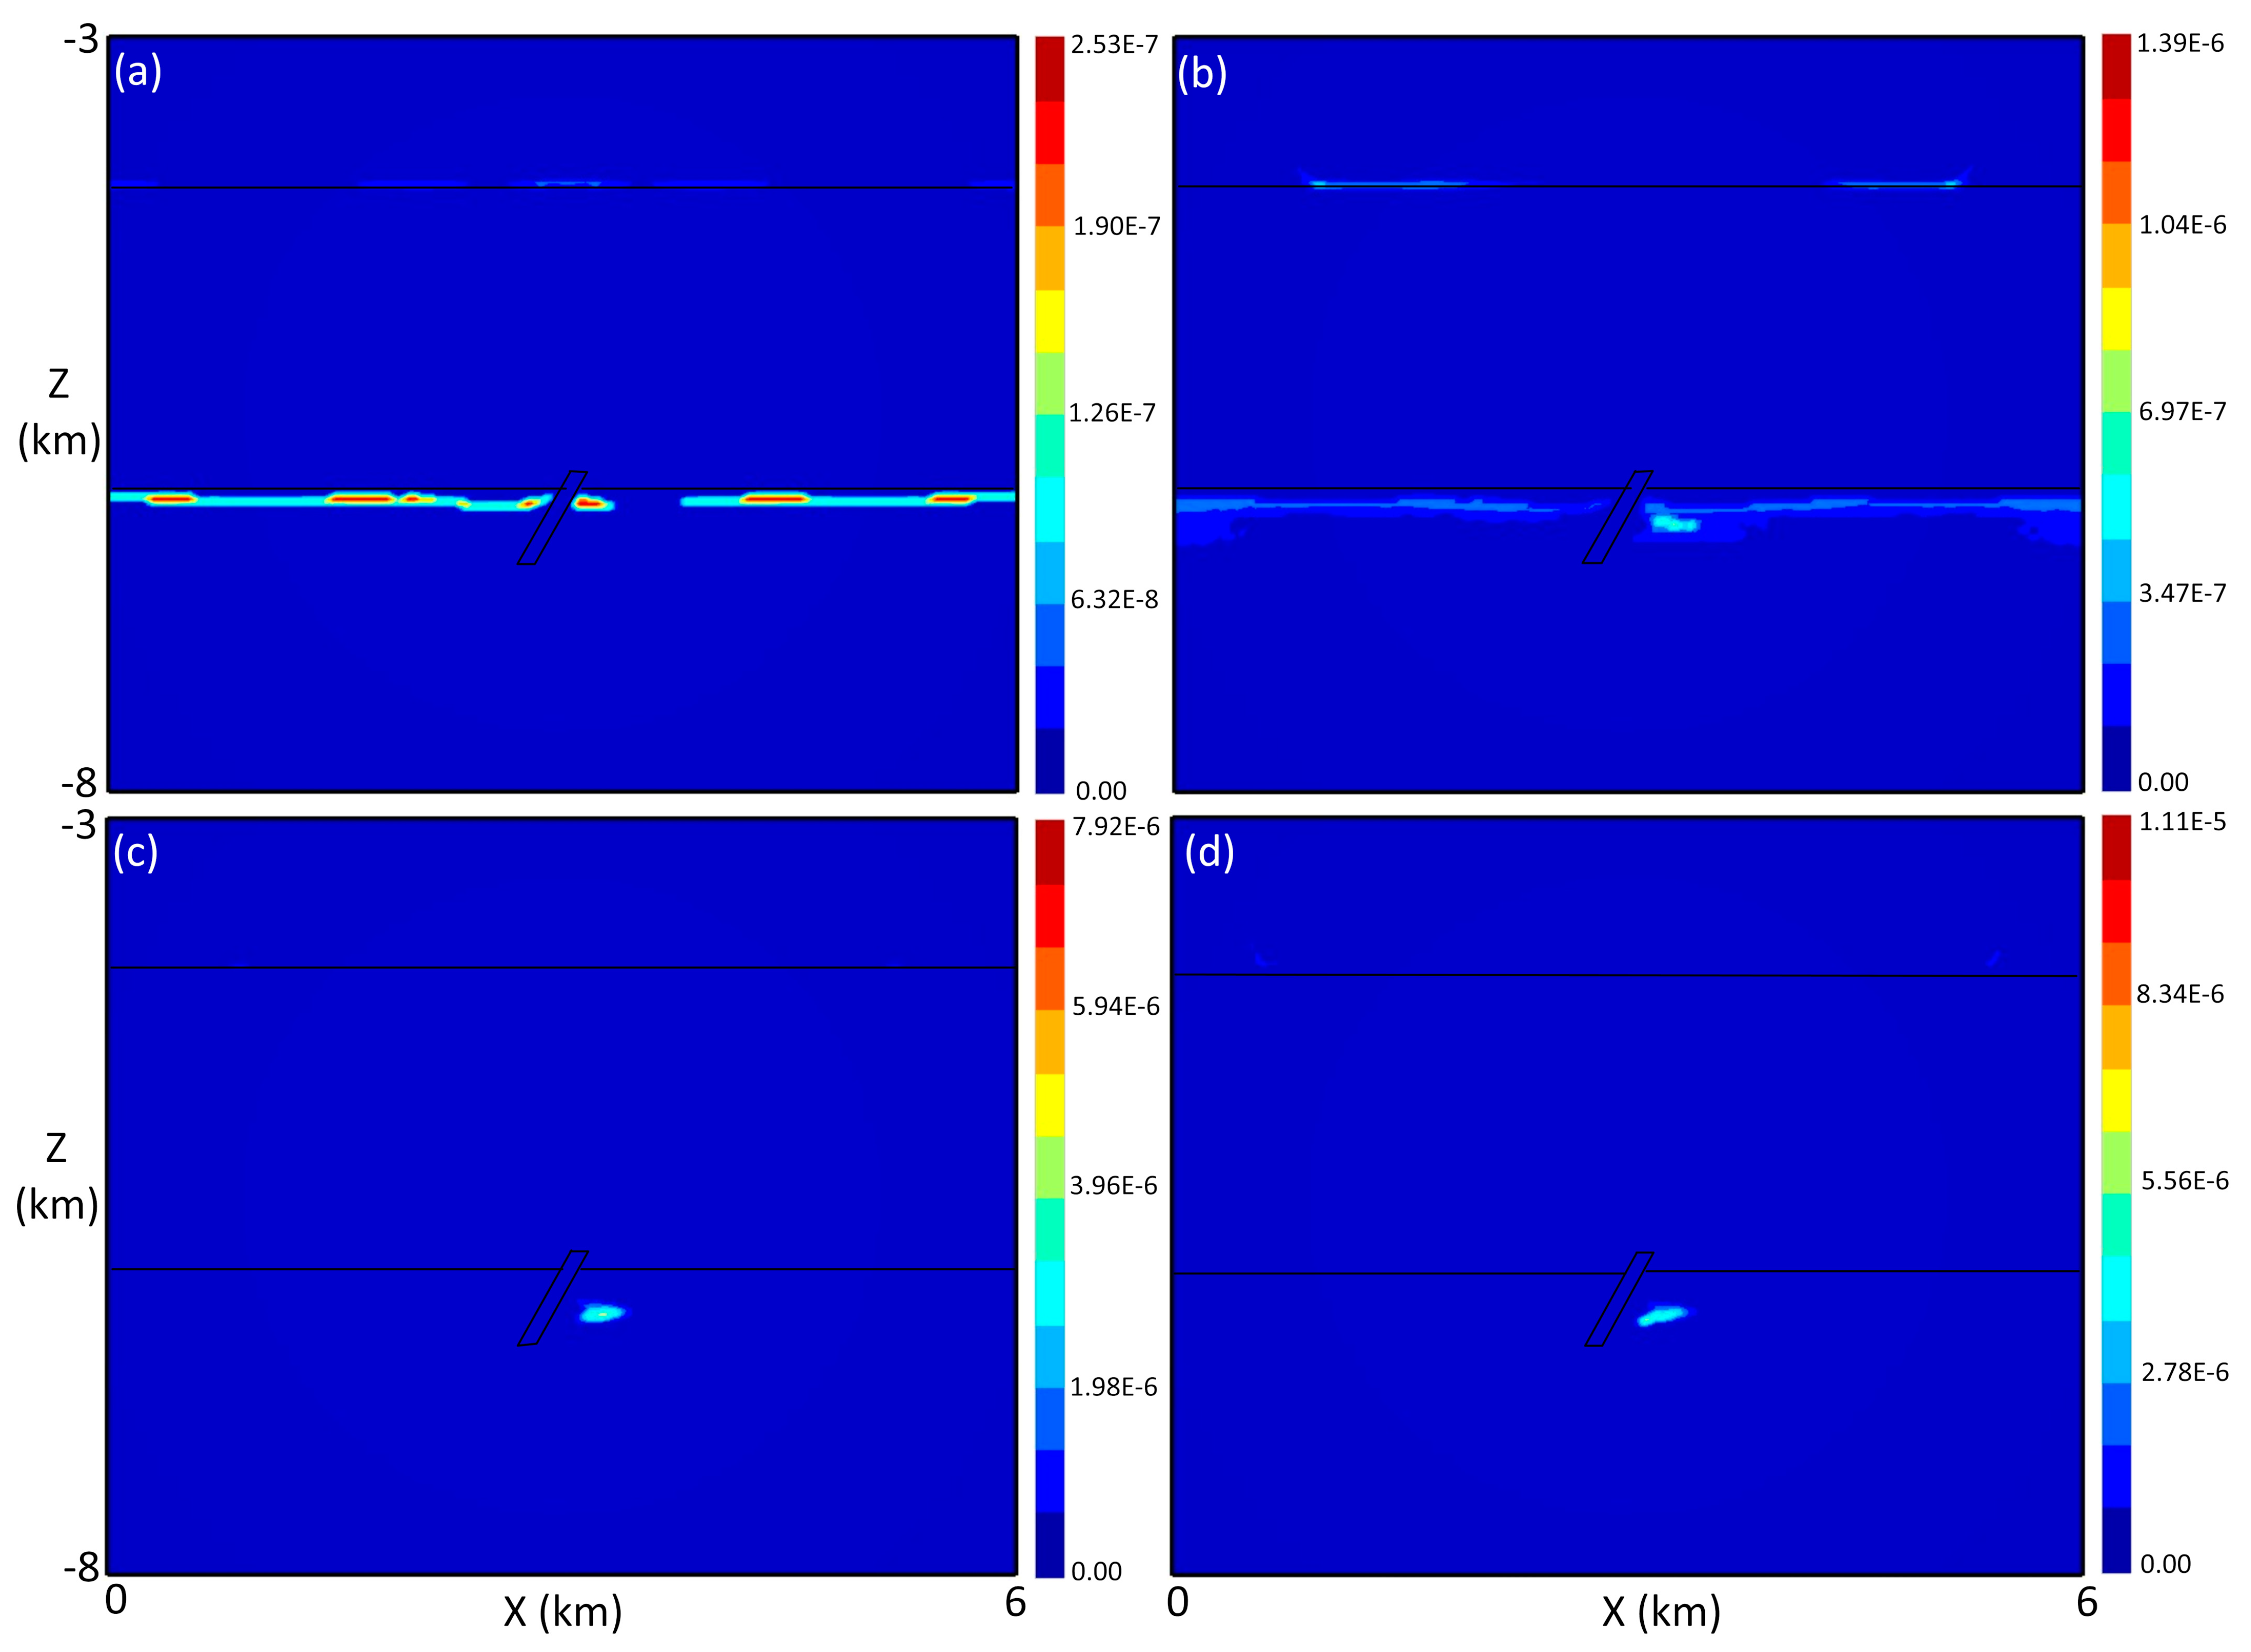
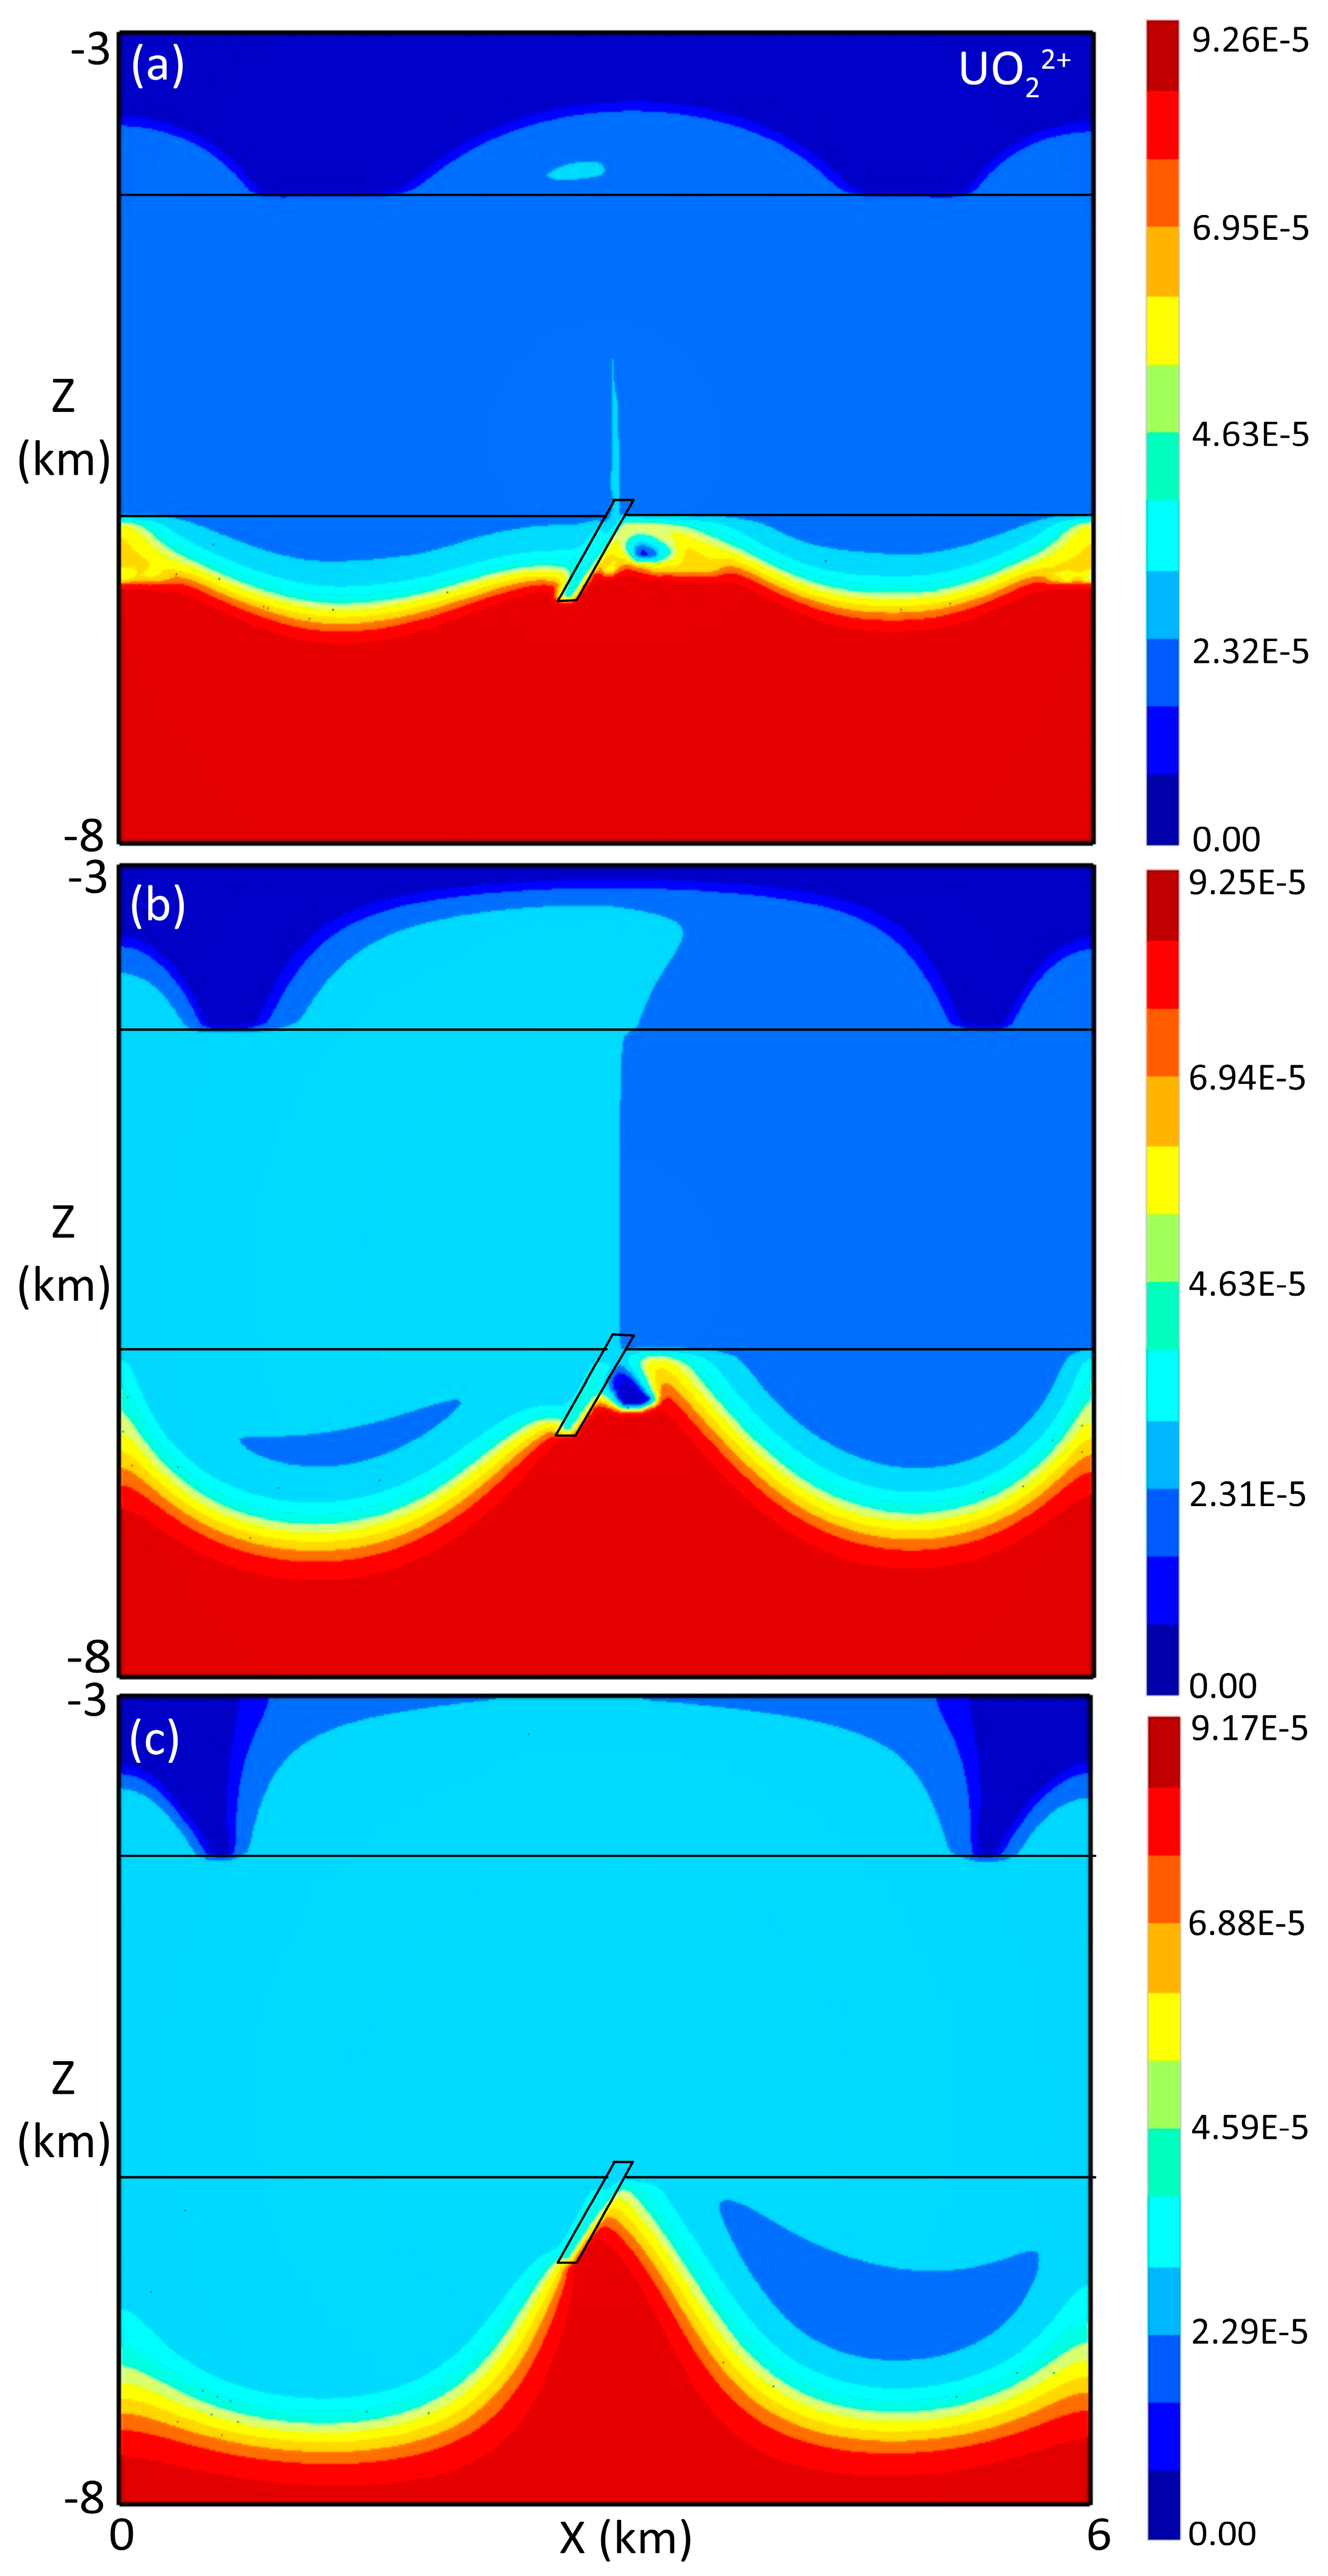
Based on the oxygen fugacity fO2 assigned to each geologic unit, two oxidation–reduction fronts occurred. One is the sandstone–cover interface, and the other is the sandstone–basement interface (i.e., the unconformity). Uranium precipitation started to occur along these two fronts when the basinal fluid percolated across the sandstone–cover interface and reacted with the more oxidizing cover fluid, and when the basinal fluid infiltrated the basement and reacted with the reducing basement brine, respectively. Figure 4a shows the precipitated uraninite at 1000 years, which is characterized by a horizontal sheet-like distribution immediately beneath the unconformity and a max volume fraction of 2.53 × 10⁻⁷. Uraninite mineralization also occurs along the cover–sandstone interface but with an even lower volume fraction. Accordingly, the concentration of UO22+ close to the unconformity in the basement was depleted due to its consumption for uranium precipitation. Thus, as time goes by, the basement brine becomes more important since it can drive deep aqueous uranium to shallow areas. As stated above, starting at 50,000 years, the basal brine was focused dominantly into the footwall area of the fault zone, which brought deep aqueous uranium up to such an area, as illustrated in Figure 5a, which shows the UO22+ concentration at 50,000 years. The aqueous uranium then reacted with the oxidizing fluid that was percolated to the basement from the overlain sandstone via the fault zone for uranium precipitation. Figure 4b illustrates the precipitated uraninite at 50,000 years. Now, more focused uranium precipitation occurs in the footwall with a higher volume fraction of 1.39 × 10⁻⁶. Therefore, the footwall area in the basement seems to represent a favorable structural trap for uranium deposition. It can be seen from Figure 5a that UO22+ experiences a significant drop in its concentration around the ore genesis site, which resulted from its consumption in precipitating uraninite. As time progressed, more basal brine was focused into the structural trap, refer to Figure 3b,c which further brought more aqueous uranium from depth to be concentrated in such a trap, as shown in Figure 5b,c. As a result, the uranium precipitation grew up gradually with time in size and volume fraction. Figure 4c shows the precipitated uraninite at 150,000 years with a max volume fraction of 7.92 × 10⁻⁶, and Figure 4d illustrates the precipitated uraninite at 300,000 years with a max volume fraction of 1.11 × 10⁻⁵. The uranium deposit was located at the same structural trap, but as time increased from 150,000 to 300,000 years, the deposit became slightly greater in its size and volume fraction.
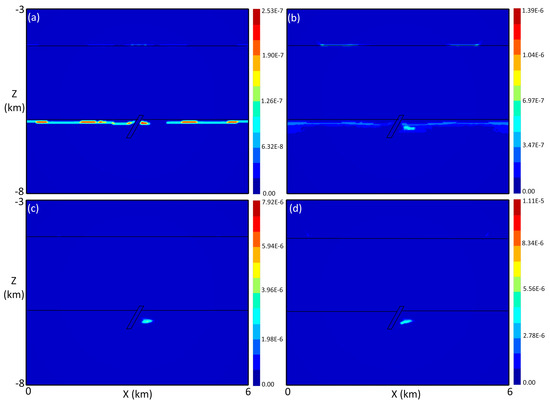
Figure 4.
Precipitated uraninite and volume fraction when the paleoregolith has a thickness of 31.25 m and there is no displacement: (a) at 1000 years, (b) at 50,000 years, (c) at 150,000 years, and (d) at 300,000 years.
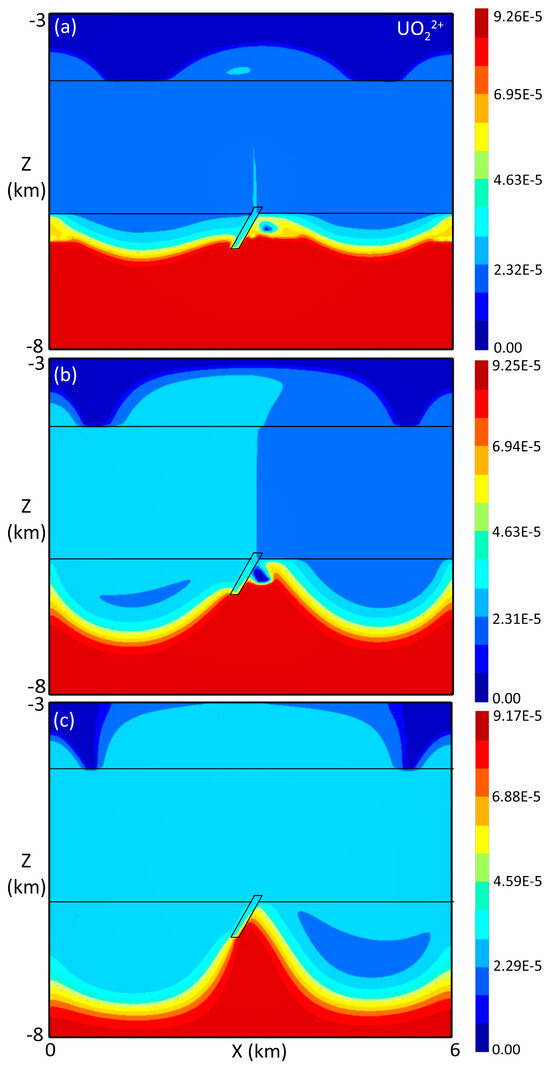
Figure 5.
UO22+ concentration (mol/L) when the paleoregolith has a thickness of 31.25 m and there is no displacement: (a) at 50,000 years, (b) at 150,000 years, and (c) at 300,000 years.
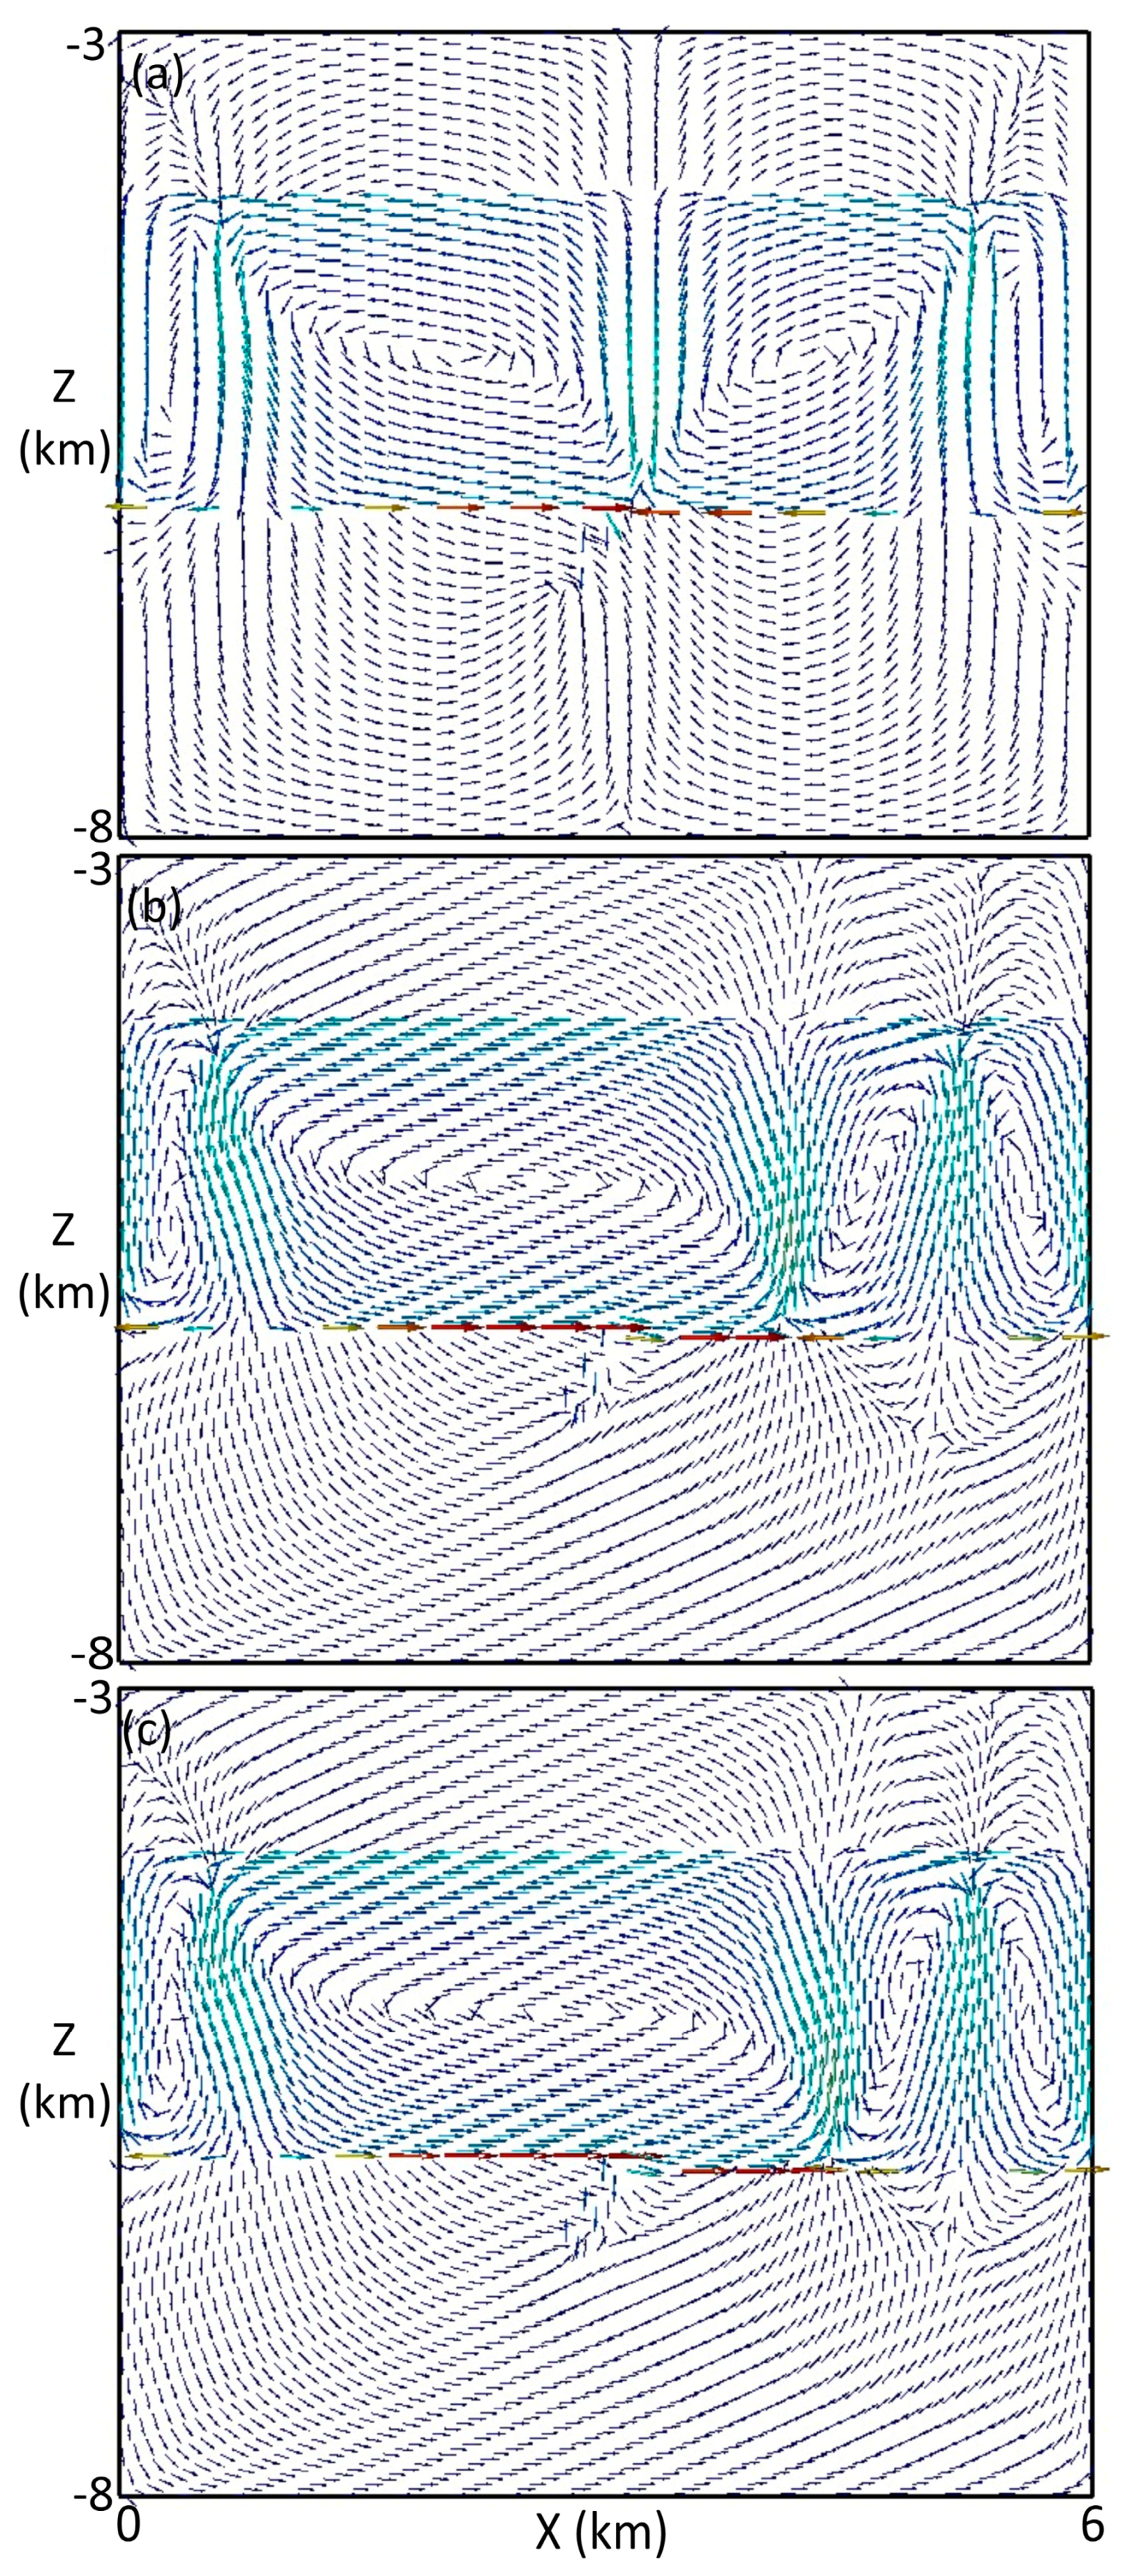
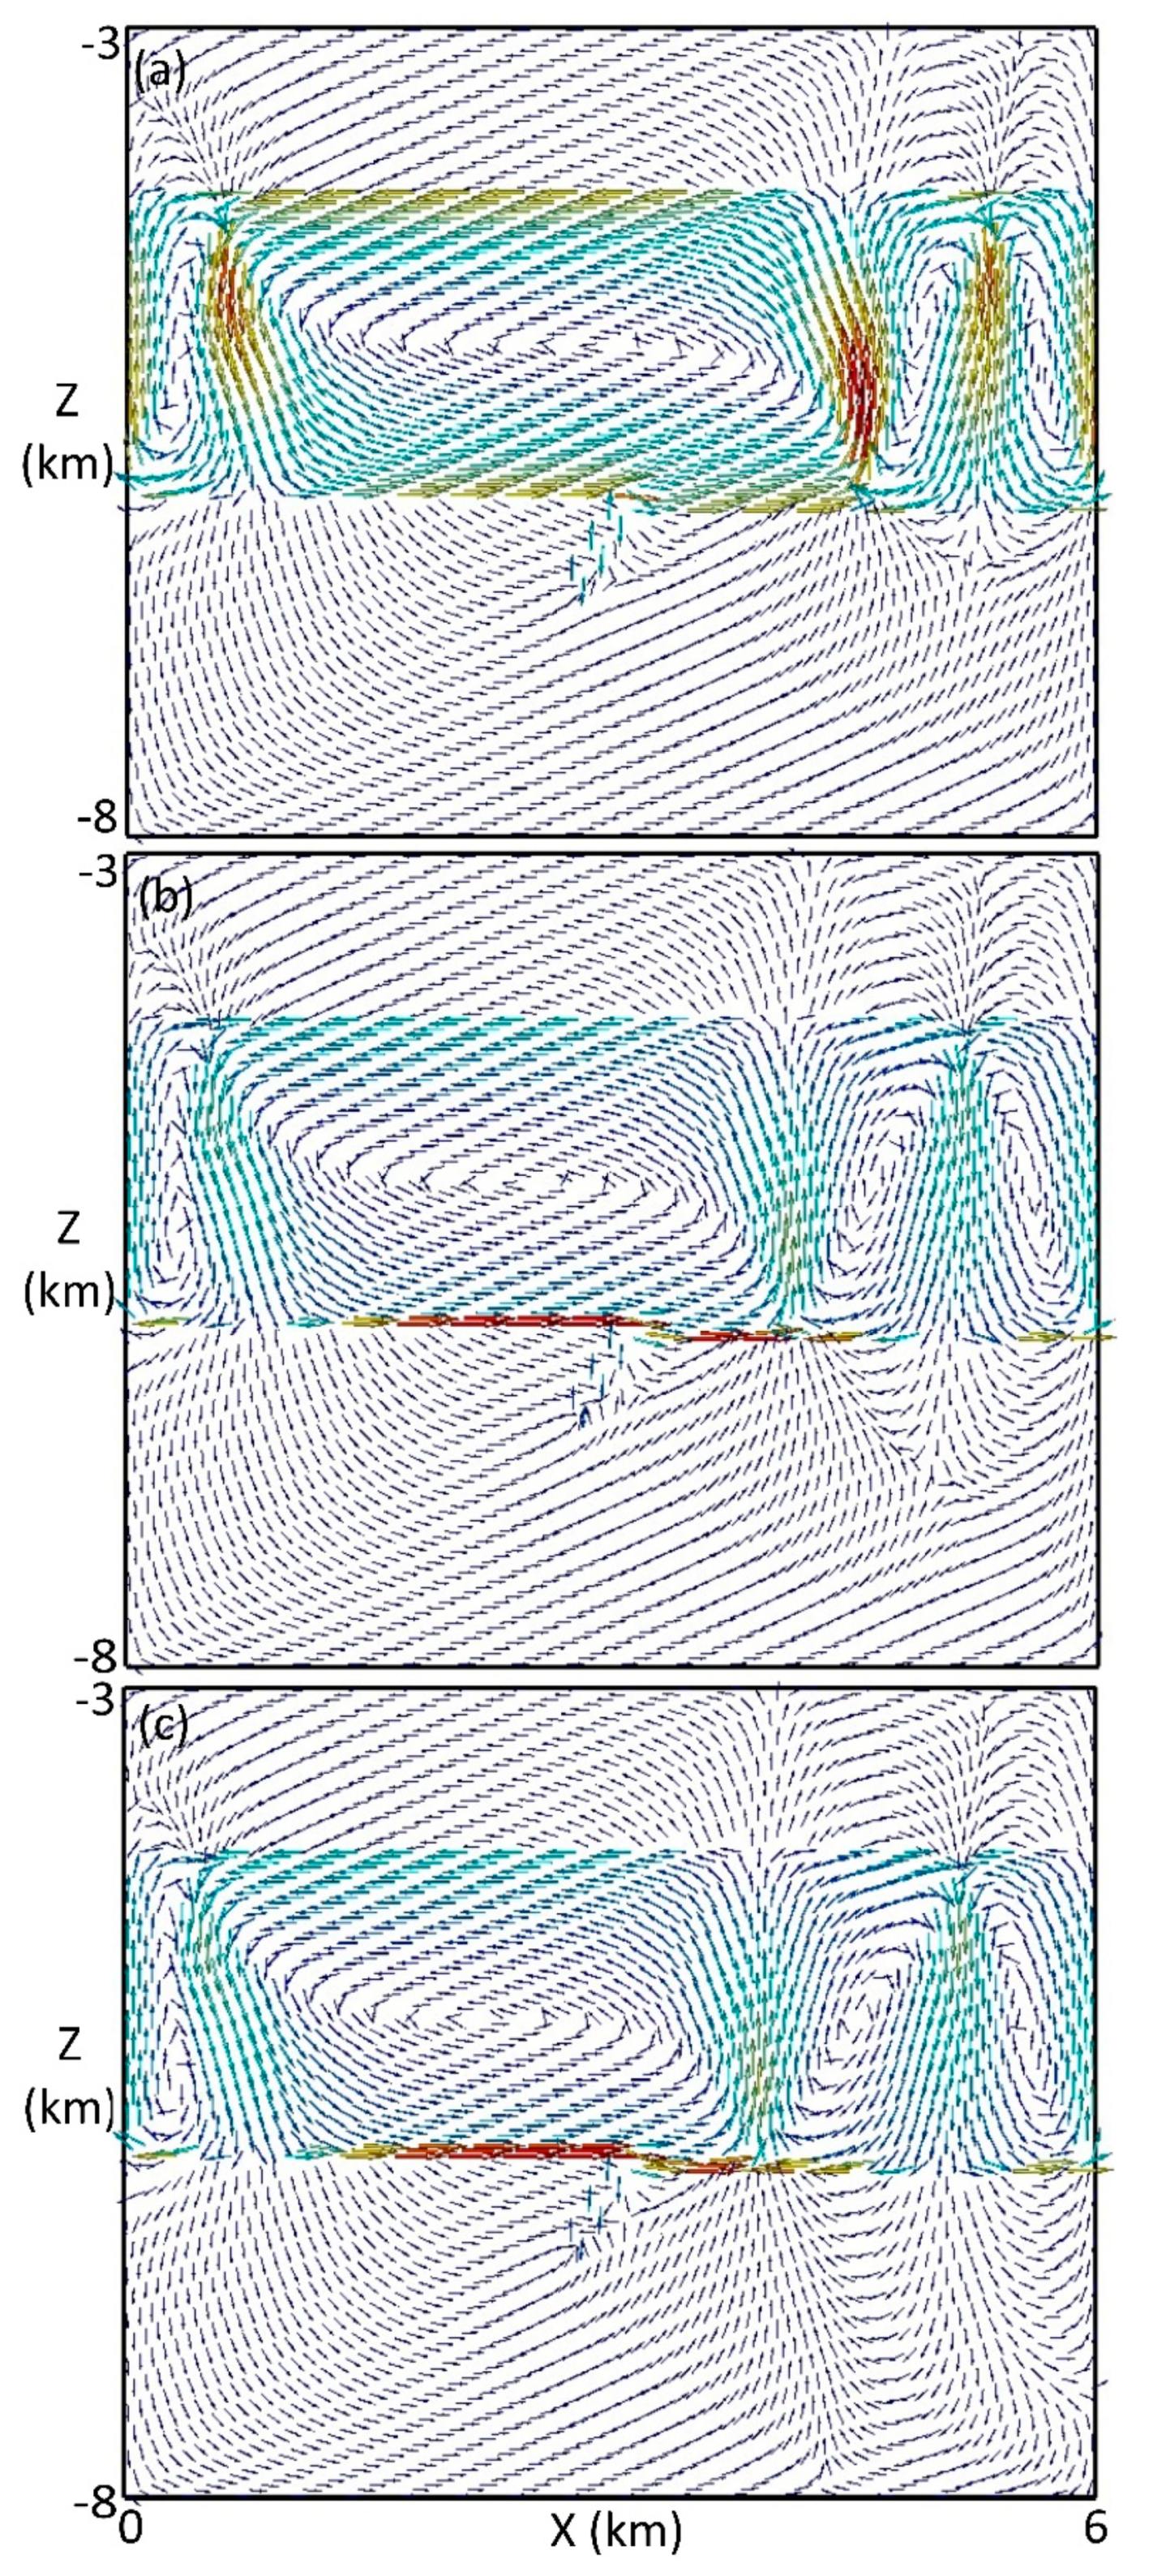
Let us next investigate the effect of fault offset degree corresponding to Figure 1b–d. Figure 6 shows the fluid flow velocity vectors at 300,000 years for different displacements of the regolith while its thickness was fixed at 31.25 m. It was noticed that the central dominant upwelling zone shifted to the right in comparison with the above case where there was no displacement, which was likely driven by the rightward downslope flow at the fault offset of the regolith. The greater the displacement was, the farther the shifting became. The shift distance from the center of the model was about 50 m, 1000 m, and 1500 m, corresponding to displacements of 31.25 m, 62.5 m, and 93.75 m in Figure 6a–c. As a result, convection cells in the sandstone layer became asymmetrical, with the counterclockwise convection cell occupying a larger area as the displacement increased. The convective effect of this flow pattern on heat transfer resulted in the temperature distribution illustrated in Figure 7, which also exhibits the asymmetry of the mushroom-shaped isotherm. Figure 8 shows the simulated uraninite distribution at 300,000 years, corresponding to different displacements of the regolith. It appears that displacements control the shape of the uranium deposits. With smaller displacements, the deposits were characterized by a more compact shape in the footwall region (see Figure 4d and Figure 8a). When displacements were larger, the deposits extended more laterally to the right (see Figure 8b,c) at the root of the upwelling zone (see Figure 6b,c). In particular, when the displacement was up to 93.75 m, the deposit exhibited a ‘discrete’ shape (Figure 8c), which was clearly controlled by the fluid flow pattern in Figure 6c.
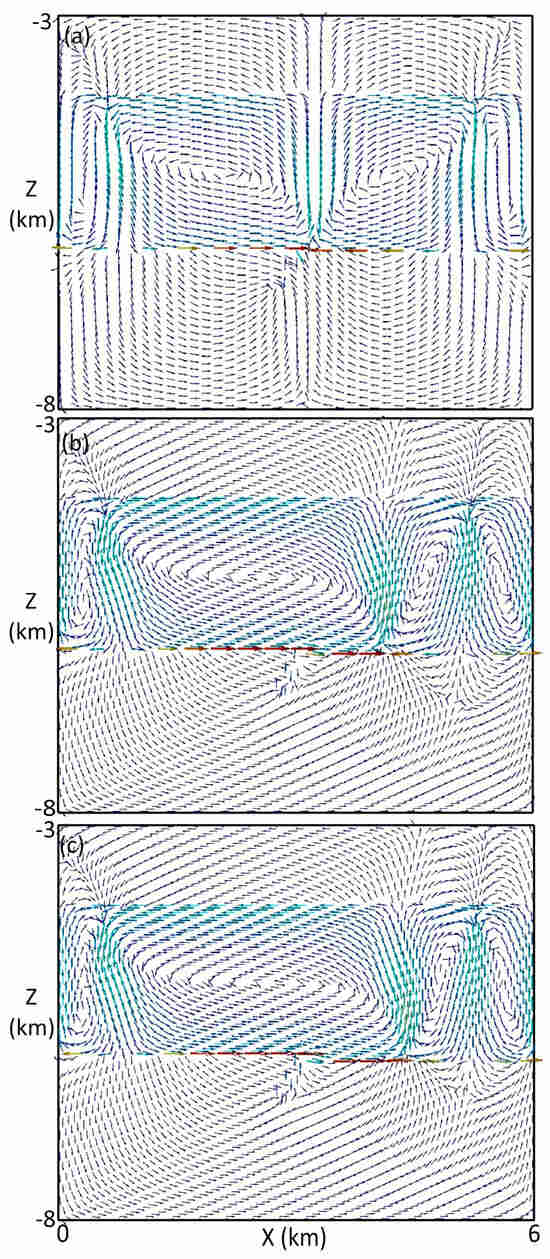
Figure 6.
Fluid flow velocity vectors at 300,000 years when the thickness of paleoregolith is fixed at 31.25 m. The paleoregolith has different displacements: (a) 31.25 m, (b) 62.5 m, and (c) 93.75 m.
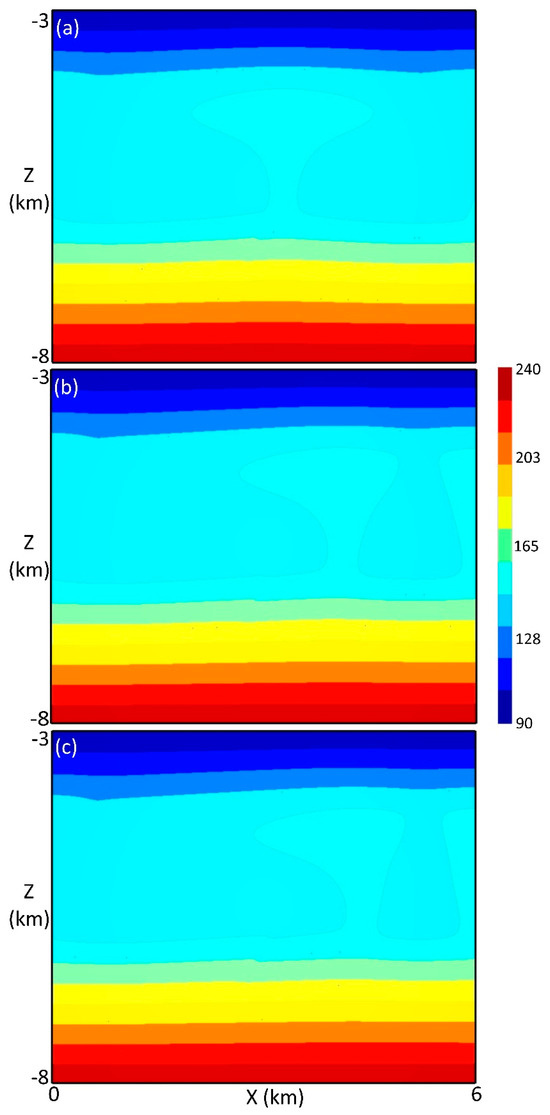
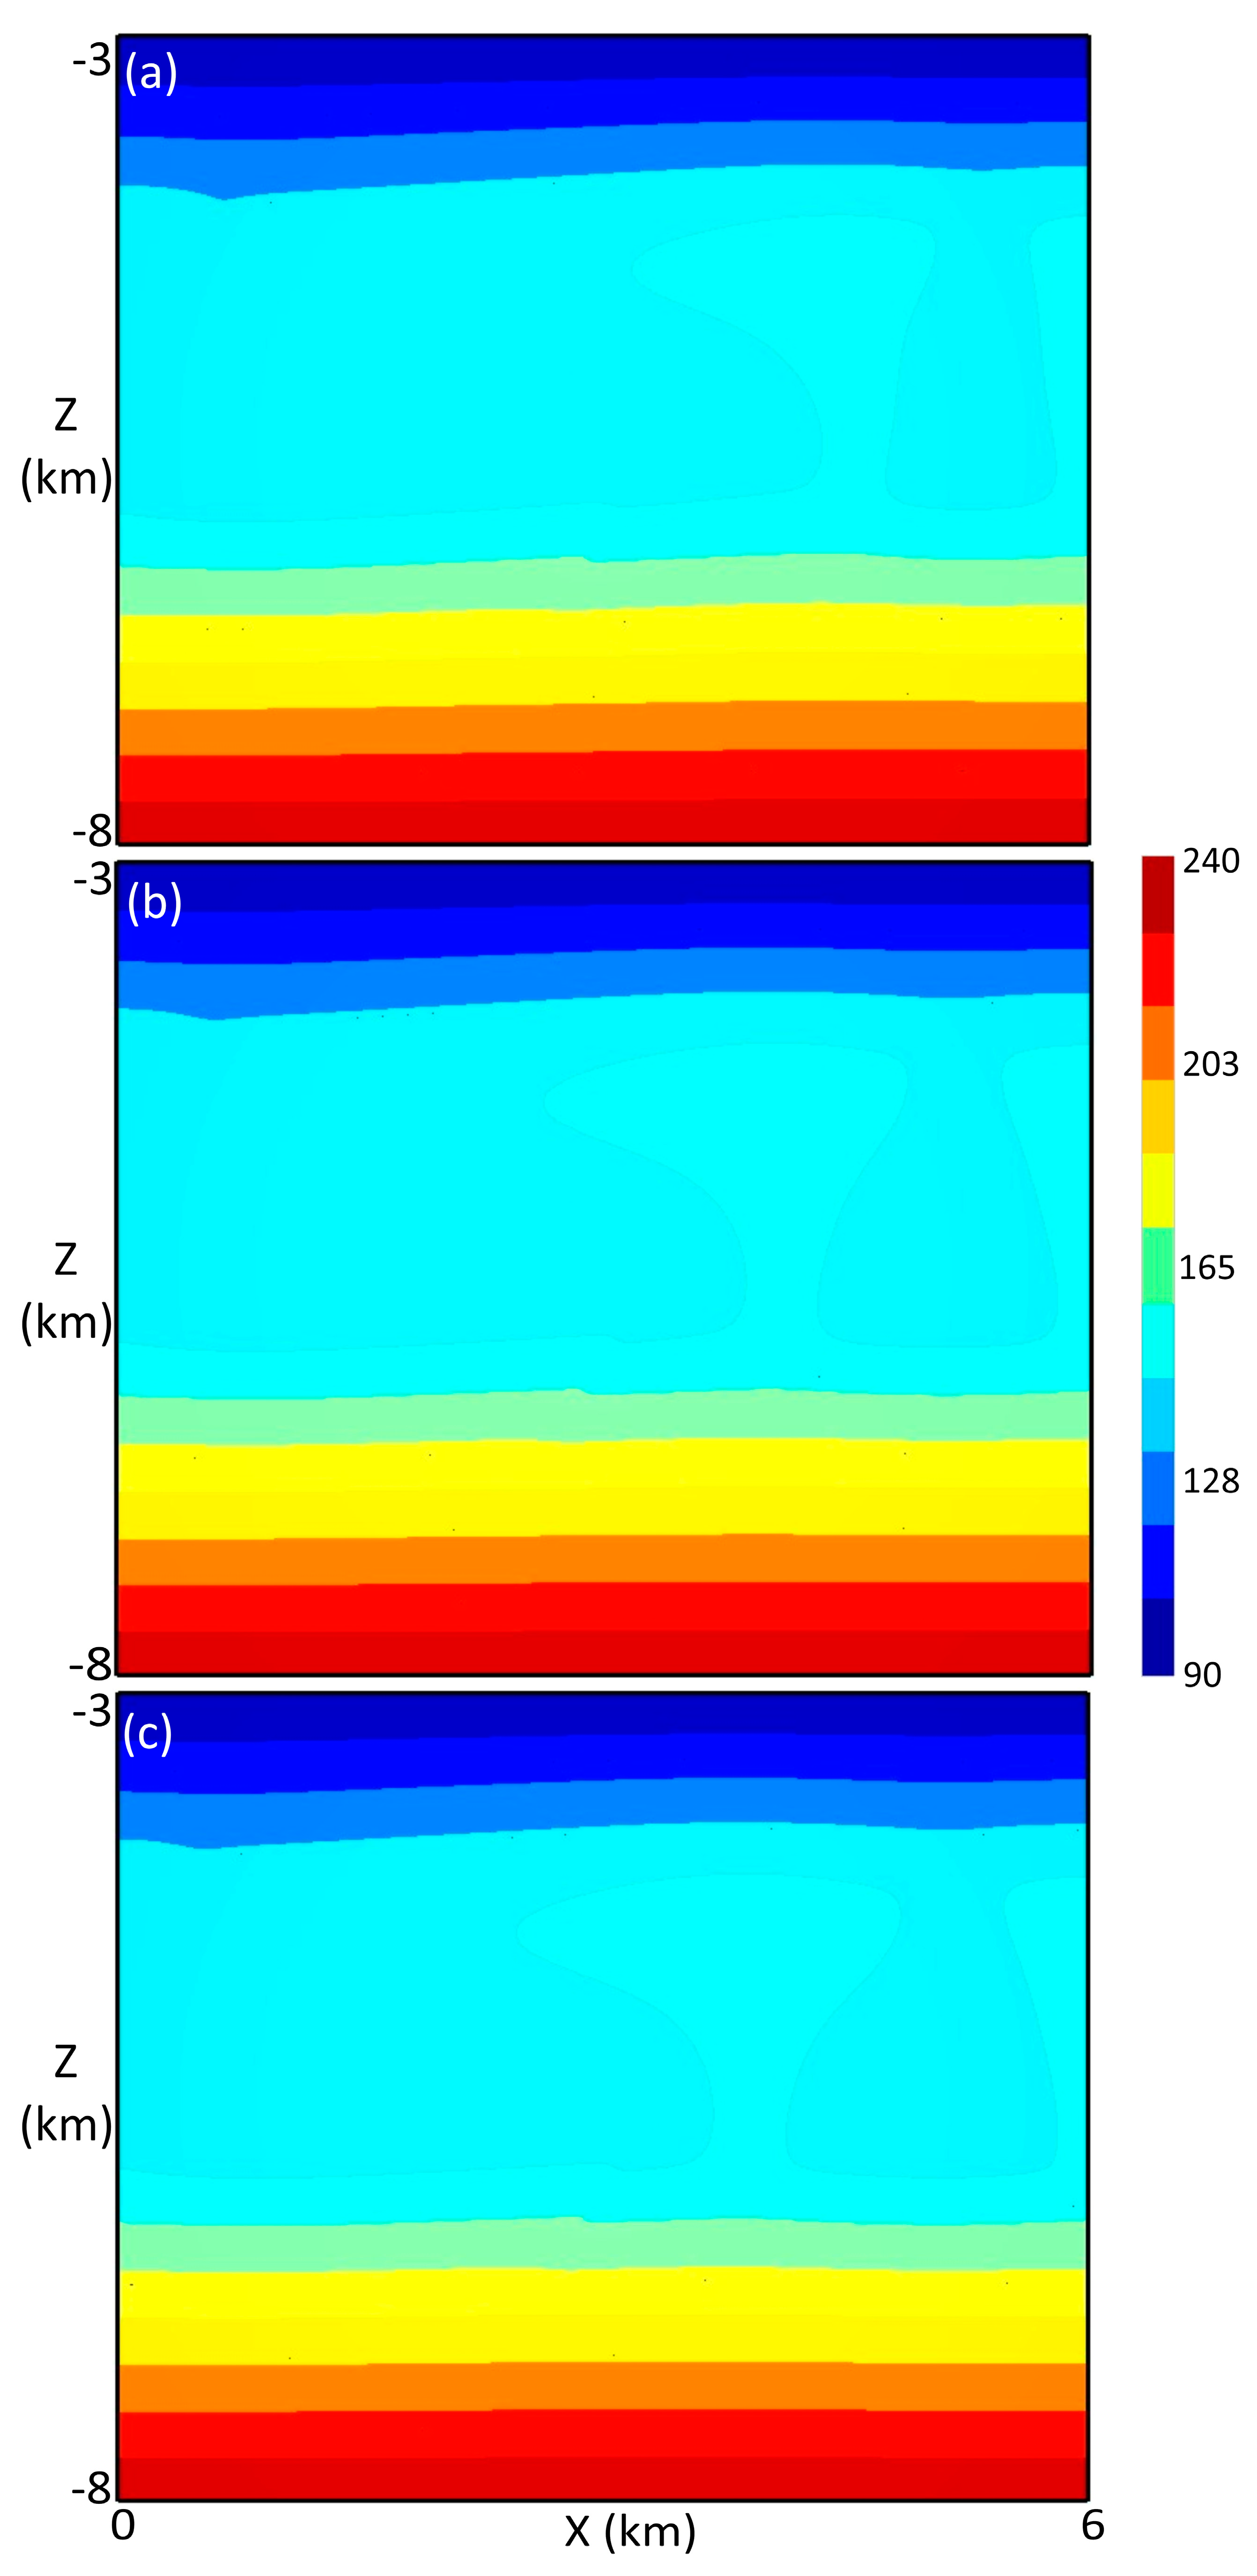
Figure 7.
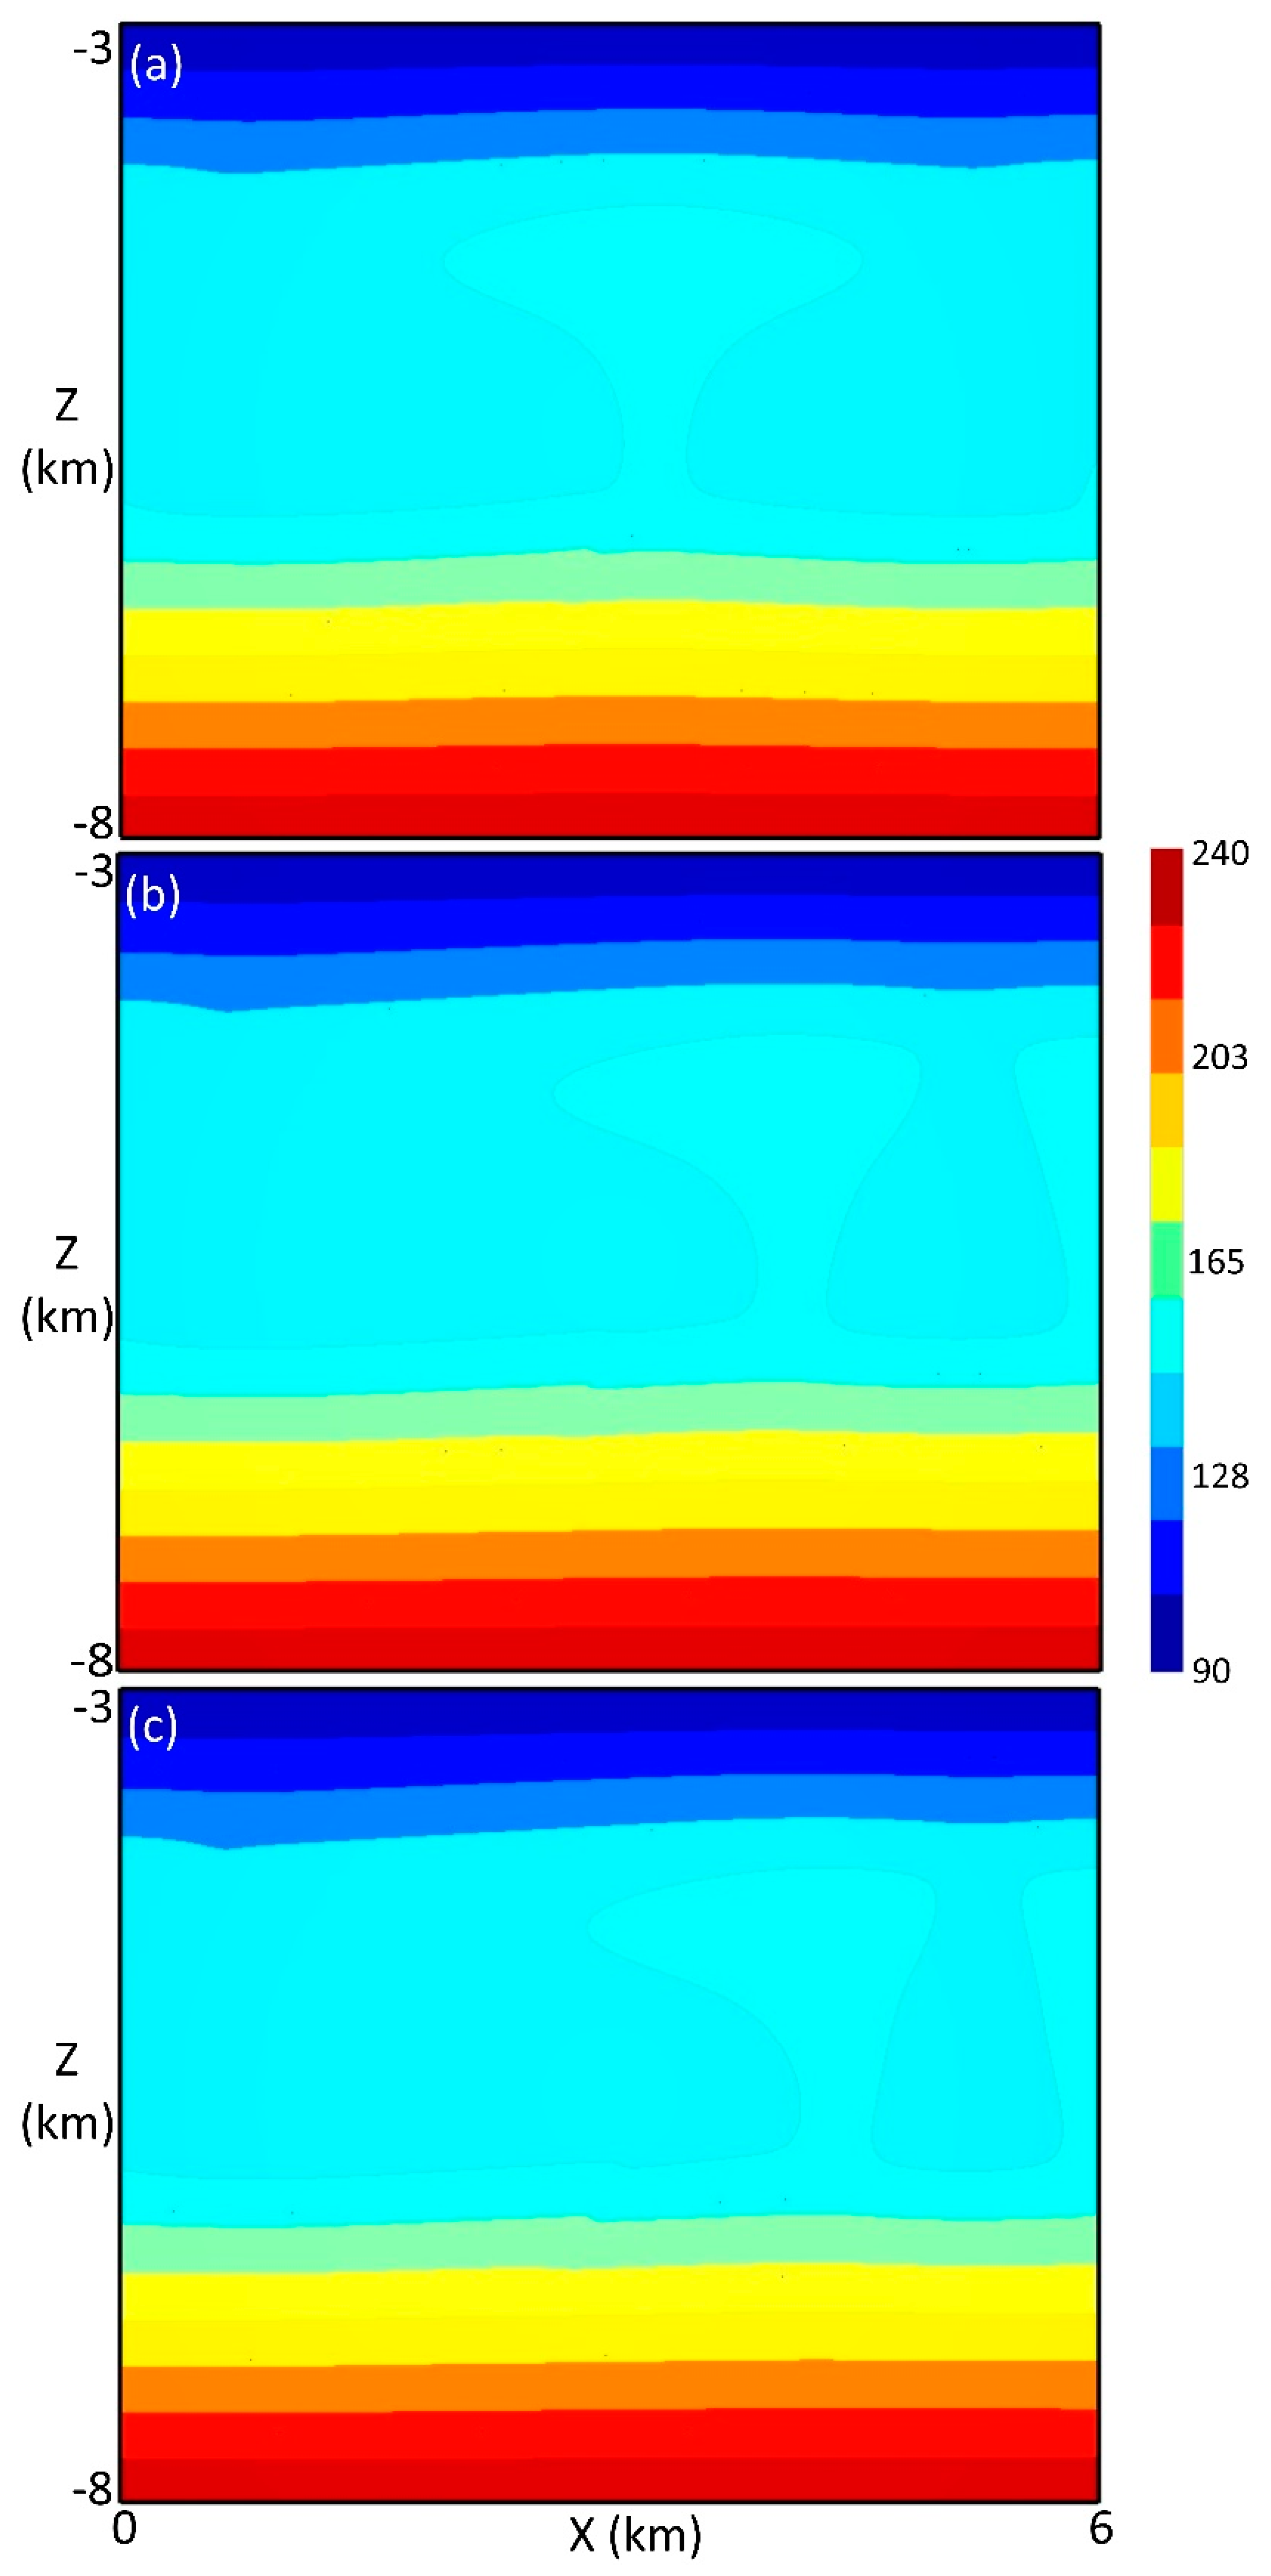
Temperature distribution at 300,000 years when the thickness of paleoregolith is fixed at 31.25 m. The paleoregolith has different displacements: (a) 31.25 m, (b) 62.5 m, and (c) 93.75 m.
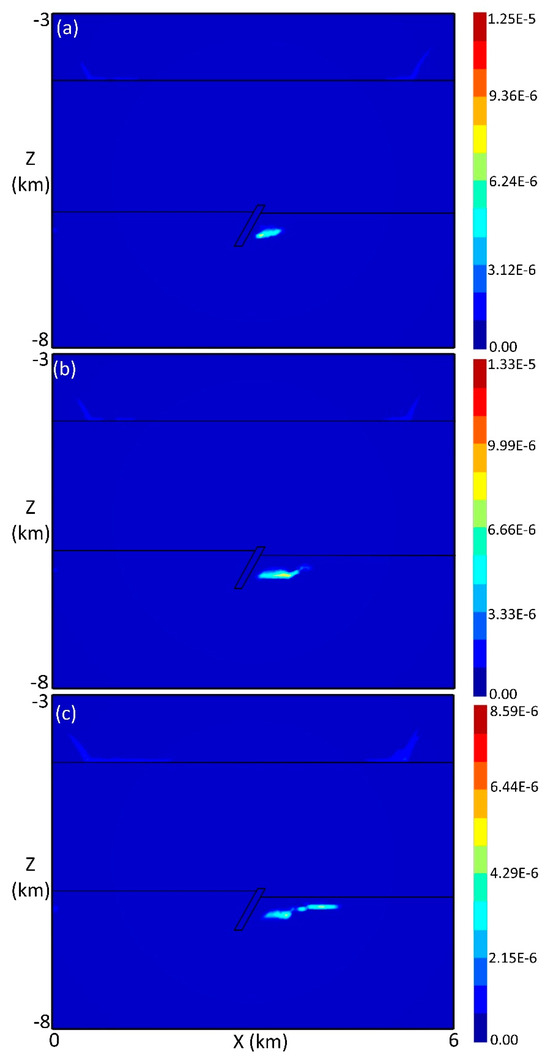
Figure 8.
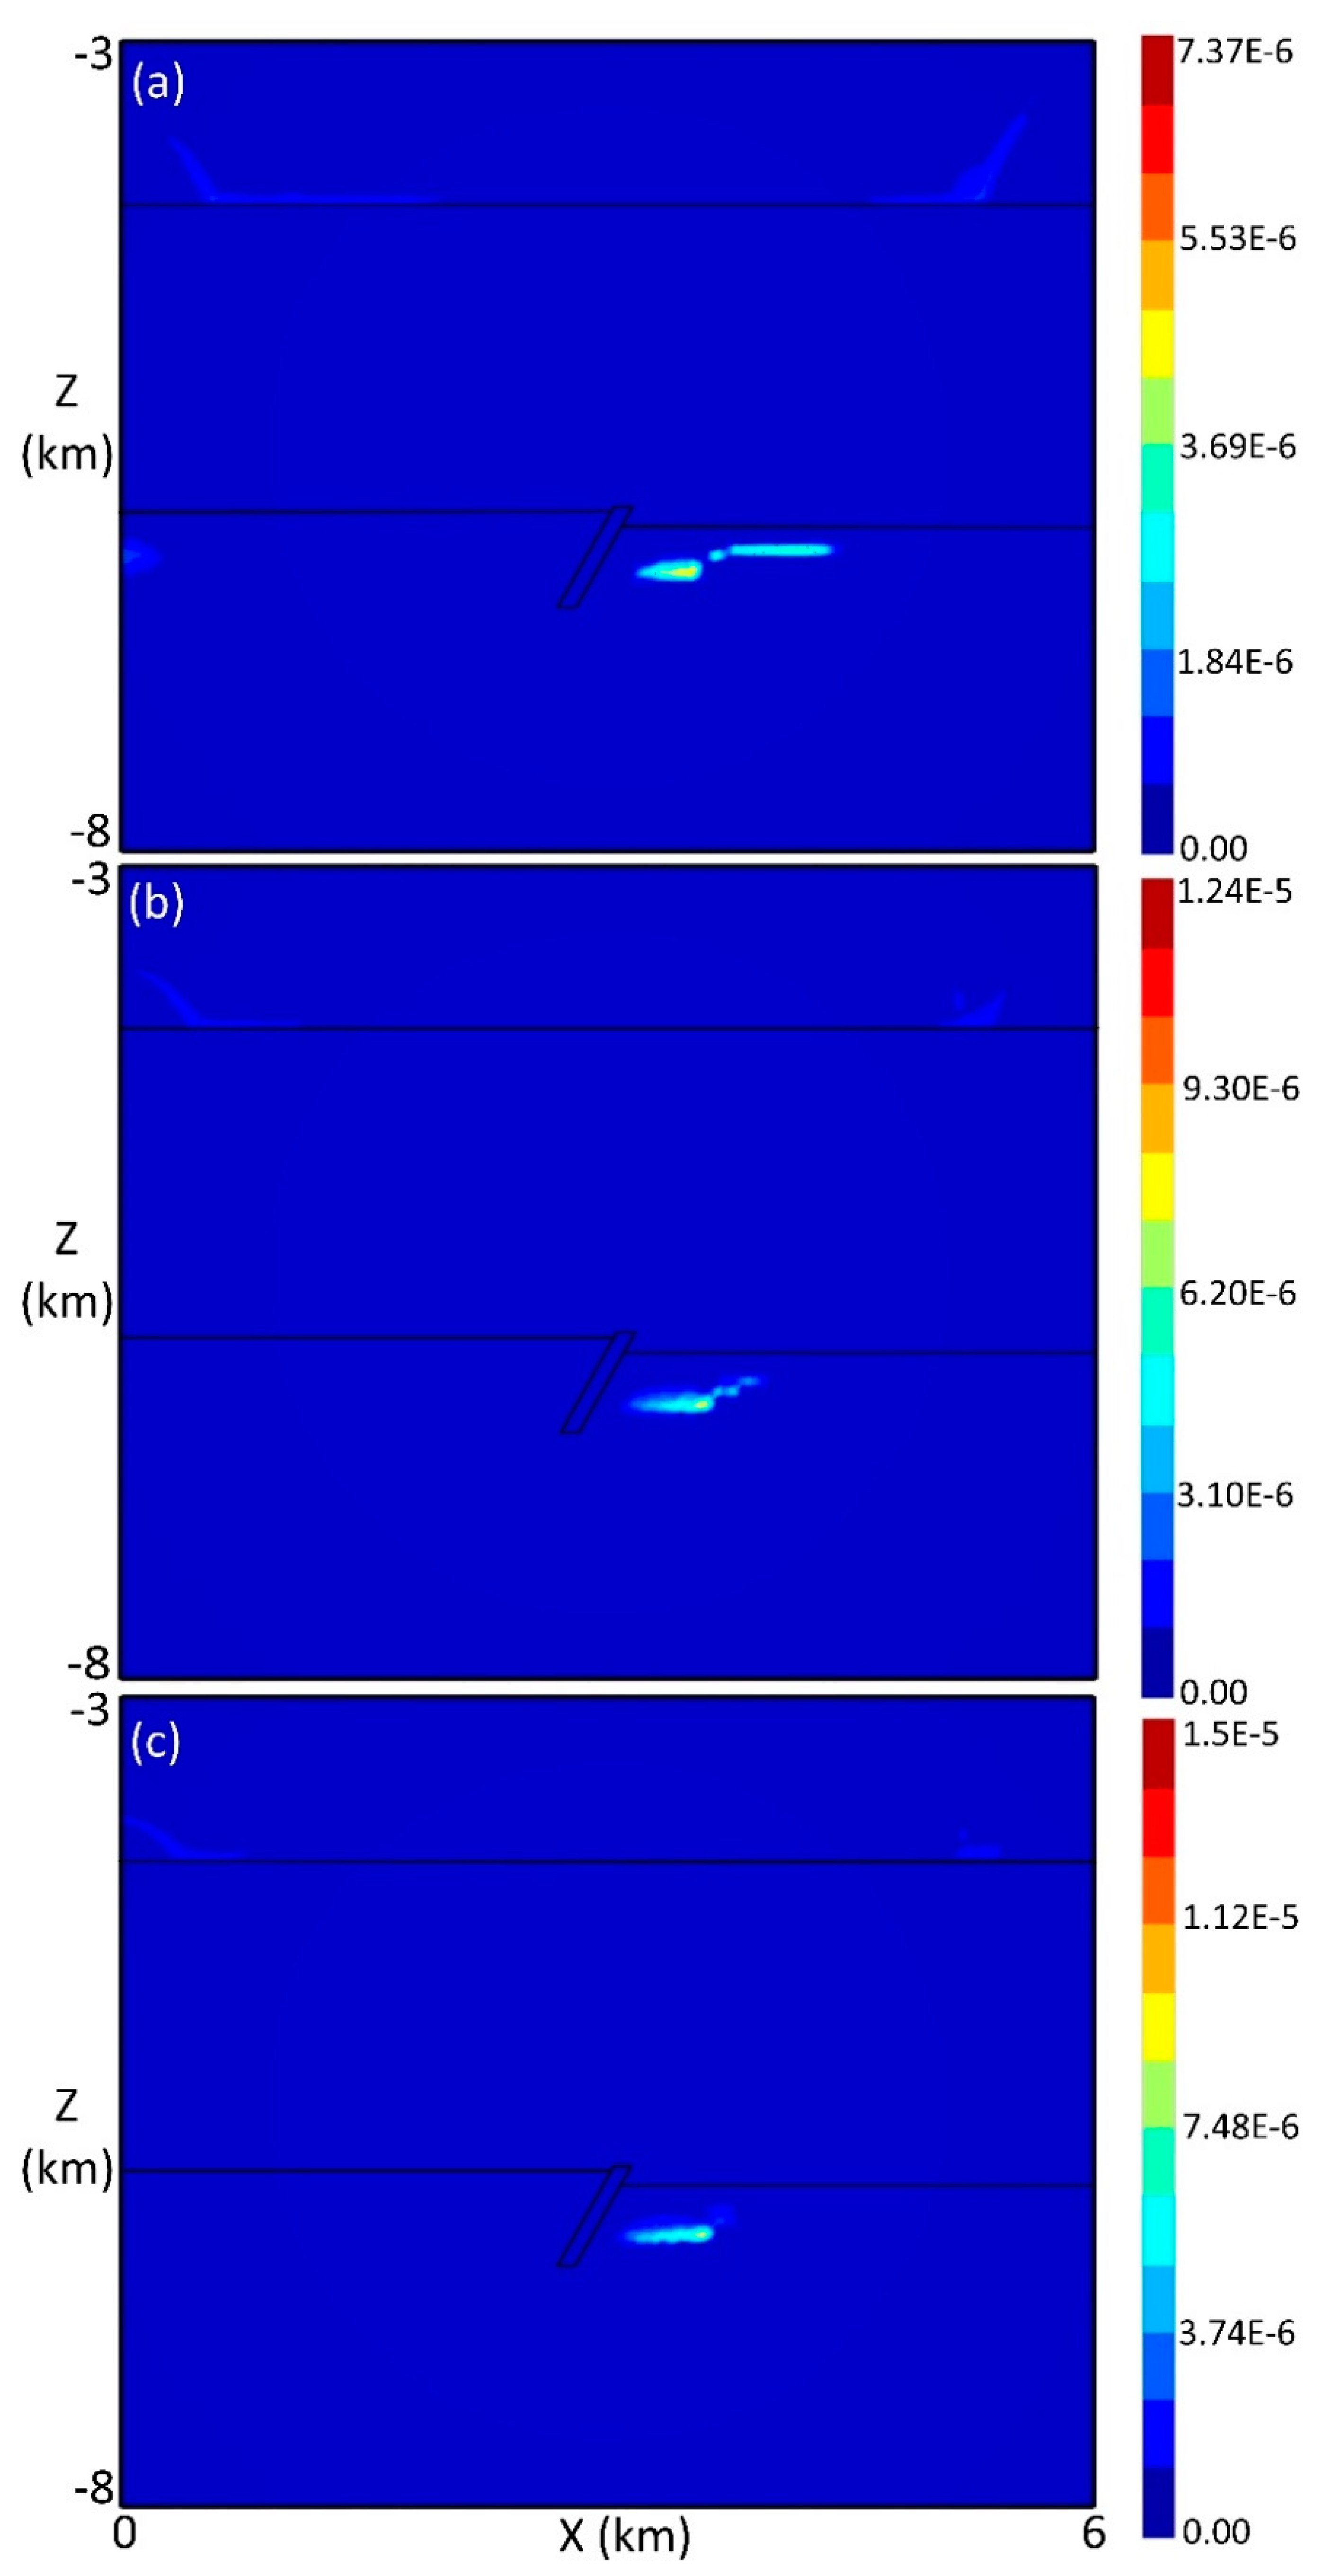
Precipitated uraninite and volume fraction at 300,000 years when the thickness of paleoregolith is fixed at 31.25 m. The paleoregolith has different displacements: (a) 31.25 m, (b) 62.5 m, and (c) 93.75 m.
Finally, let us examine the effect of paleoregolith thickness while maintaining a fixed displacement of 93.75 m. Figure 9a–c show the numerical results of a 300,000-year fluid flow corresponding to different thicknesses of 0 m, 62.5 m, and 93.75 m paleoregolith, respectively. Clearly, as the regolith thickness increased, the dominant upwelling zone moved horizontally back to the central part of the model, causing the counterclockwise convection cell in the sandstone layer to become smaller. This implies that increasing regolith thickness essentially counteracts the rightward shifting effect caused by the above-described fault offset effect. Comparing Figure 9a and Figure 9c, it can be seen that the thicker the regolith is, the more concentrated the fluid flow in the footwall of the fault zone, which is favorable for the reaction of reducing basal brine with oxidizing basinal fluid to form more compact and higher-grade ore deposits in this area. Consequently, the simulated uranium deposits (Figure 10) tended to be more compact in shape and located closer to the footwall region as the regolith thickness increased. When there was no regolith layer (Figure 10a), the deposit had a ‘discrete’ shape, but was lower in volume fraction. However, when the thickness of the regolith was up to 93.75 m (Figure 10c), the deposit showed a more compact shape, a fraction higher in volume but relatively smaller in size. This can be explained by the fluid focusing effect of the permeable regolith as stated above. The temperature distribution in this case is illustrated in Figure 11, indicating that the mushroom-shaped isotherm shifted to the left as the regolith thickened.
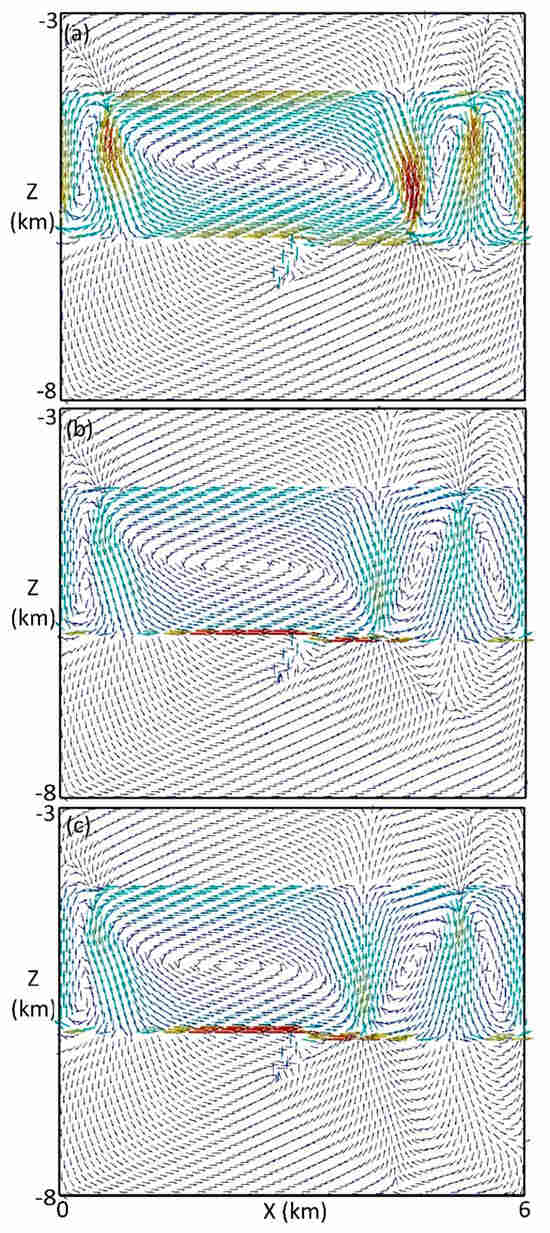
Figure 9.
Fluid flow velocity vectors at 300,000 years when the displacement of paleoregolith is fixed at 93.75 m. The paleoregolith has different thickness: (a) 0 m, (b) 62.5 m, and (c) 93.75 m.
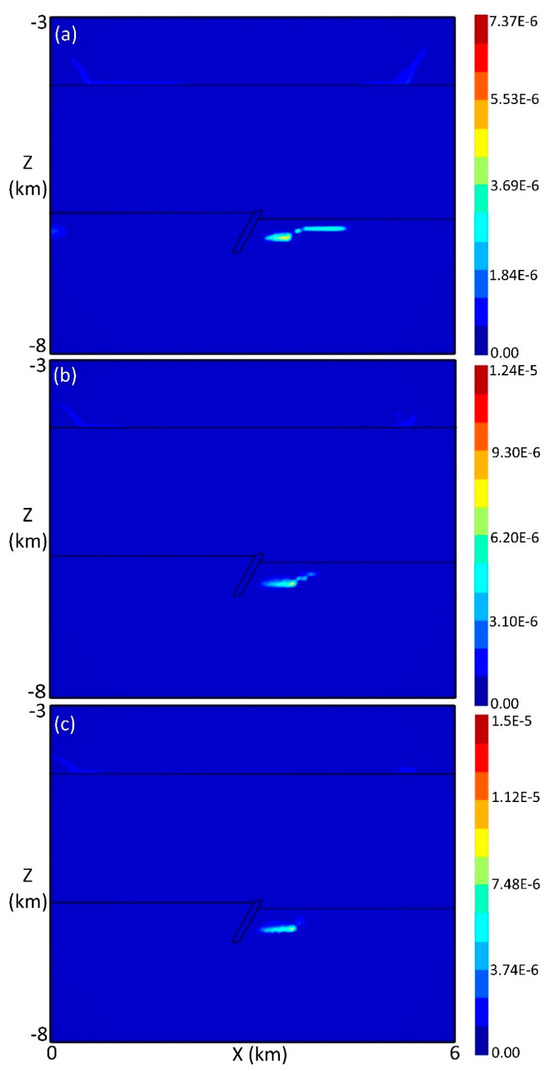
Figure 10.
Precipitated uraninite and volume fraction at 300,000 years when the displacement of paleoregolith is fixed at 93.75 m. The paleoregolith has different thickness: (a) 0 m, (b) 62.5 m, and (c) 93.75 m.
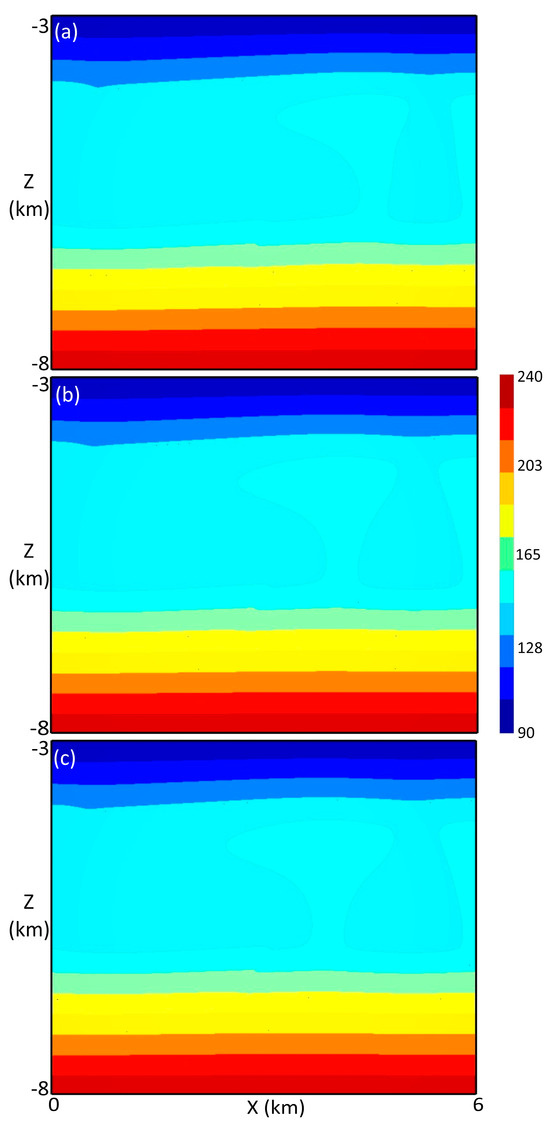
Figure 11.
Temperature distribution at 300,000 years when the displacement of paleoregolith is fixed at 93.75 m. The paleoregolith has different thickness: (a) 0 m, (b) 62.5 m, and (c) 93.75 m.
All the above numerical modeling results indicate that significant uranium deposits tend to be formed in the footwall area in the basement, although uranium mineralization also occurs along the unconformities at an early time. It should be noted that some deposits in the Athabasca Basin occur in the sandstone layer or along the unconformities. This study does not simulate sandstone-hosted uranium deposits, mainly because the software TOUGHREACT only considers thermally induced buoyancy as the driving force for hydrothermal fluid circulation. As a result, the ore-forming brines driven by buoyancy tend to be focused on the footwall to precipitate uraninite. In order to model sandstone-hosted deposits, it seems necessary to couple tectonic deformation with reactive fluid flow modeling. Through this coupling, under compressive deformation, basement brine would flow upward into the sandstone layer and react with oxidizing basinal fluid, forming deposits therein. This is beyond the scope of the current paper and will be conducted in the near future.
4. Conclusions
Computational models coupling fluid flow, reactive mass transport, and heat transfer have been developed in this study to address the controlling role of regional paleoregolith and fault offset in precipitating unconformity-type uranium deposits. Our numerical case studies reveal that both thickness and displacement of the regolith have important effects on fluid flow, heat transport, and uranium mineralization. The permeable regolith is conducive to the enrichment of fluid in the footwall of the fault zone. The thicker the regolith is, the stronger the fluid accumulation, which favors the formation of more compact and higher-grade deposits in the footwall. This study also reveals that the regolith displacement caused by fault offset appears to control the distribution of precipitated uraninites. The larger the displacement is, the stronger the downslope flow that develops at the fault offset is, which pushes convection cells farther away from the fault zone. As a result, deposits are characterized by large lateral extensions and possibly discrete patterns.
Author Contributions
Conceptualization, J.Y.; methodology, J.Y.; software, H.Q. and H.L.; validation, H.Q., H.L. and J.Y.; data collection and analysis, H.L., H.Q. and J.Y.; writing—original draft preparation, H.Q. and H.L.; writing—review and editing, J.Y.; funding acquisition, J.Y. All authors have read and agreed to the published version of the manuscript.
Funding
This research was funded by a Discovery Grant of the Natural Sciences and Engineering Research Council of Canada (NSERC) to J.Y., Grant Number RGPIN-2016-04965.
Data Availability Statement
Acknowledgments
Constructive comments by three anonymous reviewers greatly improved the paper.
Conflicts of Interest
The authors declare no conflict of interest.
References
- Potter, E.G.; Tschirhart, V.; Powell, J. Targeted Geoscience Initiative 5: Integrated multidisciplinary studies of unconformity-related uranium deposits from the Patterson Lake corridor, northern Saskatchewan. Bull. Geol. Surv. Can. 2020, 615. [Google Scholar] [CrossRef]
- Luo, J.; Hu, R.; Shi, S. Timing of uranium mineralization and geological implications of Shazijiang Granite-Hosted uranium deposit in Guangxi, South China: New constraint from chemical U-Pb age. J. Earth Sci. 2015, 26, 911–919. [Google Scholar] [CrossRef]
- Luo, J.; Hu, R.; Fayek, M.; Bi, X.; Shi, S.; Chen, Y. Newly discovered Quaternary uranium mineralization at ~2.0 Ma in the Menggongjie granite-hosted uranium deposit, South China. J. Asian Earth Sci. 2017, 137, 241–249. [Google Scholar] [CrossRef]
- Jefferson, C.W.; Thomas, D.J.; Gandhi, S.S.; Ramaekers, P.; Delaney, G.; Brisbin, D.; Cutts, C.; Quirt, D.; Portella, P.; Olson, R.A. Unconformity associated uranium deposits of the Athabasca Basin, Saskatchewan and Alberta. In Mineral Deposits of Canada: A Synthesis of Major Deposit-Types, District Metallogeny, the Evolution of Geological Provinces, and Exploration Methods; Goodfellow, W.D., Ed.; Special Publication; Geological Association of Canada, Mineral Deposits Division: Ottawa, ON, Canada, 2007; Volume 5, pp. 273–305. [Google Scholar]
- Shakotko, P.H. Paleoregolith and Unconformity-Type Uranium Mineralization at Beaverlodge Lake, Great Bear Magmatic Zonenorthwest Territories. Master’s Thesis, University of Saskatchewan, Saskatoon, SA, Canada, 2014. [Google Scholar]
- Bruce, M.; Kreuzer, O.; Wilde, A.; Buckingham, A.; Butera, K.; Bierlein, F. Unconformity-type uranium systems: A comparative review and predictive modelling of critical genetic factors. Minerals 2020, 10, 738–793. [Google Scholar] [CrossRef]
- McGill, B.; Marlatt, J.; Matthews, R.; Sopuck, V.; Homeniuk, L.; Hubregtse, J. The P2 North uranium deposit Saskatchewan, Canada. Explor. Min. Geol. 1993, 2, 321–331. [Google Scholar]
- Harvey, S.E.; Bethune, K.M. Context of the Deilmann orebody, Key Lake mine, Saskatchewan. In EXTECH IV: Geology and Uranium EXploration TECHnology of the Proterozoic Athabasca Basin, Saskatchewan and Alberta; Jefferson, C.W., Delaney, G., Eds.; Special Publication; Geological Association of Canada, Mineral Deposits Division: Ottawa, ON, Canada, 2007; Volume 4, pp. 249–266. [Google Scholar]
- Skirrow, R.G.; Mercadier, J.; Armstrong, R.; Kuske, T.; Deloule, E. The Ranger uranium deposit, northern Australia: Timing constraints, regional and ore-related alteration, and genetic implications for unconformity-related mineralisation. Ore Geol. Rev. 2016, 76, 463–503. [Google Scholar] [CrossRef]
- Mwenifumbo, C.J.; Elliott, B.E.; Jefferson, C.W.; Bernius, G.R.; Pflug, K.A. Physical rock properties from the Athabasca Group: Designing geophysical exploration models for unconformity-associated uranium deposits. J. Appl. Geophys. 2004, 55, 117–135. [Google Scholar] [CrossRef]
- Mwenifumbo, C.J.; Bernius, G.R. Crandallite-group minerals: Host of thorium enrichment in the eastern Athabasca Basin, Saskatchewan. In EXTECH IV: Geology and Uranium EXploration TECHnology of the Proterozoic Athabasca Basin, Saskatchewan and Alberta; Jefferson, C.W., Delaney, G., Eds.; Special Publication; Geological Association of Canada, Mineral Deposits Division: Ottawa, ON, Canada, 2007; Volume 4, pp. 521–532. [Google Scholar]
- Yang, J.; Feng, Z.; Luo, X.; Chen, Y. Three-dimensional numerical modeling of salinity variations in driving basin scale ore-forming fluid flow: Example from Mount Isa Basin, northern Australia. J. Geochem. Explor. 2010, 106, 236–243. [Google Scholar] [CrossRef]
- Wang, Y.; Chi, G.; Li, Z.; Bosman, S. Large-scale thermal convection in sedimentary basins revealed by coupled quartz cementation-dissolution distribution pattern and reactive transport modeling—A case study of the Proterozoic Athabasca Basin (Canada). Earth Planet Sci. Lett. 2021, 574, 117168. [Google Scholar] [CrossRef]
- Sheldon, H.A.; Schaubs, P.M.; Blaikie, T.N.; Kunzmann, M.; Poulet, T.; Spinks, S.C. 3D thermal convection in the Proterozoic McArthur River Zn-Pb-Ag mineral system, northern Australia. Ore Geol. Rev. 2021, 133, 104093. [Google Scholar] [CrossRef]
- Smith-Schmitz, S.E.; Appold, M.S. Reactive transport modeling of the role of fluorine-rich groundwater in the formation of fluorite ore deposits in the Illinois-Kentucky district, USA. Hydrogeol. J. 2022, 30, 1199–1218. [Google Scholar] [CrossRef]
- Liu, X.; Zhang, D.; Yang, J.; Xiao, C.; Zhang, T. High heat producing granites and prolonged extraction of tungsten and tin from melts. Geochim. Cosmochim. Acta 2023, 348, 340–354. [Google Scholar] [CrossRef]
- Pek, A.A.; Malkovsky, V.I. Linked thermal convection of the basement and basinal fluids in formation of the unconformity-related uranium deposits in the Athabasca Basin, Saskatchewan, Canada. Geofluids 2016, 16, 925–940. [Google Scholar] [CrossRef]
- Eldursi, K.; Chi, G.; Bethune, K.; Li, Z.; Ledru, P.; Quirt, D. New insights from 2- and 3-D numerical modelling on fluid flow mechanisms and geological factors responsible for the formation of the world-class Cigar Lake uranium deposit, eastern Athabasca Basin, Canada. Miner. Deposita 2020, 56, 1365–1388. [Google Scholar] [CrossRef]
- Li, Z.; Chi, G.; Bethune, K.M.; Eldursi, K.; Quirt, D.; Ledru, P.; Thomas, D. Interplay between thermal convection and compressional fault reactivation in the formation of unconformity-related uranium deposits. Miner. Deposita 2021, 56, 1389–1404. [Google Scholar] [CrossRef]
- Lin, H.; Xu, X.; Yang, J. Driving mechanisms and their relative importance in focusing hydrothermal fluid flow in the Chanziping ore district, South China. Nat. Resour. Res. 2023, 32, 117–128. [Google Scholar] [CrossRef]
- Komninou, A.; Sverjensky, D.A. Geochemical modeling of the formation of an unconformity-type uranium deposit. Econ. Geol. 1996, 91, 590–606. [Google Scholar] [CrossRef]
- Raffensperger, J.P.; Garven, G. The formation of unconformity-type uranium ore deposits 2. coupled hydrochemical modeling. Am. J. Sci. 1995, 295, 639–696. [Google Scholar] [CrossRef]
- Lin, H.; Xu, X.; Yang, J. Effect of fault extension relevant to unconformity on hydrothermal fluid flow, mass transport, and uranium deposition. Water 2022, 14, 1097. [Google Scholar] [CrossRef]
- Xu, X.; Lin, H.; Yang, J. Location of uranium-rich brines determines the distribution and grade of unconformity-related uranium deposits. Earth Space Sci. 2022, 9, e2022EA002323. [Google Scholar] [CrossRef]
- Li, Z.; Chi, G.; Bethune, K. The effects of basement faults on thermal convection and implications for the formation of unconformity-related uranium deposits in the Athabasca Basin, Canada. Geofluids 2016, 16, 729–751. [Google Scholar] [CrossRef]
- Cui, T.; Yang, J.; Samson, I.M. Tectonic deformation and fluid flow: Implications for the formation of unconformity-related uranium deposits. Econ. Geol. 2012, 107, 147–163. [Google Scholar] [CrossRef]
- Aghbelagh, Y.B.; Yang, J. Role of hydrodynamic factors in controlling the formation and location of unconformity related uranium deposits: Insights from reactive-flow modeling. Hydrogeol. J. 2017, 25, 465–486. [Google Scholar] [CrossRef]
- Aghbelagh, Y.B.; Yang, J. Effect of graphite zone in the formation of unconformity-related uranium deposits: Insights from reactive mass transport modeling. J. Geochem. Explor. 2014, 144, 12–27. [Google Scholar] [CrossRef]
- Hoeve, J.; Sibbald, T.I. On the genesis of Rabbit Lake and other unconformity-type uranium deposits in northern Saskatchewan, Canada. Econ. Geol. 1978, 73, 1450–1473. [Google Scholar] [CrossRef]
- Kyser, T.K.; Wilson, M.R.; Ruhrmann, G. Stable isotope constraints on the role of graphite in the genesis of unconformity-type uranium deposits. Can. J. Earth Sci. 1989, 26, 490–498. [Google Scholar] [CrossRef]
- Hoeve, J.; Quirt, D. Mineralization and host rock alteration in relation to clay mineral diagenesis and evolution of the middle-Proterozoic, Athabasca Basin, northern Saskatchewan, Canada. Sask. Res. Counc. Tech. Rep. 1984, 187, 187. [Google Scholar]
- Pascal, M.; Ansdell, K.M.; Annesley, I.R. Graphite-bearing and graphite-depleted basement rocks in the Dufferin Lake zone, south-central Athabasca Basin, Saskatchewan. In Targeted Geoscience Initiative 4: Unconformity-Related Uranium Systems; Potter, E.G., Wright, D.M., Eds.; Geological Survey of Canada Open File; Natural Resources Canada: Ottawa, ON, Canada, 2015; Volume 7791, pp. 83–92. [Google Scholar]
- Potter, E.G.; Wright, D.M. Targeted geoscience initiative 4: Unconformity-related uranium systems. In Geological Survey of Canada Open File; Natural Resources Canada: Ottawa, ON, Canada, 2015; Volume 7791, p. 126. [Google Scholar] [CrossRef]
- Song, H.; Chi, G.; Wang, K.; Li, Z.; Bethune, K.M.; Potter, E.G.; Liu, Y. The role of graphite in the formation of unconformity-related uranium deposits of the Athabasca Basin, Canada: A case study of Raman spectroscopy of graphite from the world-class Phoenix uranium deposit. Am. Mineral. 2022, 107, 2128–2142. [Google Scholar] [CrossRef]
- Bruneton, P. Geological environment of the Cigar Lake uranium deposit. Can. J. Earth Sci. 1993, 30, 653–673. [Google Scholar] [CrossRef]
- Hajnal, Z.; Györfi, I.; Annesley, I.R.; White, D.J.; Powell, B.; Koch, R. Seismic reflections outline complex structural setting of the uranium in the Athabasca Basin. In Uranium production and raw materials for the nuclear fuel cycle: Supply and demand, economics, the environment and energy security. Extended synopses, Report IAEA-CN-128. In Proceedings of the An International Symposium Held in Vienna, Vienna, Austria, 20–24 June 2005. [Google Scholar]
- Finch, W. Uranium provinces of North America: Their definition, distribution, and models. US Geol. Surv. Bull. 1996, 2141, 1–15. [Google Scholar]
- Bishop, C.; Mainville, A.; Yesnik, L. Cigar Lake Operation Northern Saskatchewan, Canada; Cameco Technical Report; National Instrument: Austin, TX, USA, 2016; pp. 1–164. [Google Scholar]
- Derome, D.; Cathelineau, M.; Cuney, M.; Fabre, C.; Lhomme, T.; Banks, D.A. Mixing of sodic and calcic brines and uranium deposition at McArthur River, Saskatchewan, Canada: A Raman and laser-induced breakdown spectroscopic study of fluid inclusions. Econ. Geol. 2005, 100, 1529–1545. [Google Scholar] [CrossRef]
- Chi, G.; Chu, H.; Petts, D.; Potter, E.; Jackson, S.; Williams-Jones, A. Uranium-rich diagenetic fluids provide the key to unconformity-related uranium mineralization in the Athabasca Basin. Sci. Rep. 2019, 9, 1–10. [Google Scholar] [CrossRef]
- Richard, A.; Rozsypal, C.; Mercadier, J.; Cuney, M.; Boiron, M.C.; Cathelineau, M.; Banks, D.A. Giant uranium deposits formed from exceptionally uranium-rich acidic brines. Nature Geosci. 2012, 5, 142–146. [Google Scholar] [CrossRef]
- Richard, A.; Cathelineau, M.; Boiron, M.C.; Mercadier, J.; Banks, D.A.; Cuney, M. Metal-rich fluid inclusions provide new insights into unconformity-related U deposits (Athabasca Basin and Basement, Canada). Miner. Deposita 2016, 51, 249–270. [Google Scholar] [CrossRef]
- Xu, T.; Spycher, N.; Sonnenthal, E.; Zhang, G.; Zheng, L.; Pruess, K. TOUGHREACT Version 2.0: A simulator for subsurface reactive transport under non-isothermal multiphase flow conditions. Comput. Geosci. 2011, 37, 763–774. [Google Scholar] [CrossRef]

Disclaimer/Publisher’s Note: The statements, opinions and data contained in all publications are solely those of the individual author(s) and contributor(s) and not of MDPI and/or the editor(s). MDPI and/or the editor(s) disclaim responsibility for any injury to people or property resulting from any ideas, methods, instructions or products referred to in the content. |
© 2023 by the authors. Licensee MDPI, Basel, Switzerland. This article is an open access article distributed under the terms and conditions of the Creative Commons Attribution (CC BY) license (https://creativecommons.org/licenses/by/4.0/).