Abstract
Polymetallic nodules (nodules) are a predominant deep-sea mineral resource due to theirenrichment with critical metals, such as Co, Ni, and Cu, and rare earth elements (REEs). The loose and porous nature of nodules contributes to their adsorption and enrichment in trace metals from seawater and pore water. Consequently, the specific surface area (SSA) of nodules is a key factor requiring further study. However, controls on the SSA of nodules with various genetic types remain poorly characterized. This study aimed to investigate controls on nodule SSA by analyzing the transition metals, REEs, mineralogy, and SSA of nodules recovered from basins in the Atlantic, Indian, and Pacific oceans, including the Northwest Pacific Basin (NPB), Bauer Basin (BB), Tiki Basin (TB), Wharton Basin (WB), Central Indian Basin (CIB), and Angola Basin (AB). Nodule SSAs were compared among the various basins by calculating the BET SSA (based on the equation proposed by Brunauer, Emmett, and Teller, 1938). The results suggest thatnodules from the PNB, WB, CIB, and AB are mainly hydrogenetic, and those nodules have a relatively high SSA, high Co, low Ni and Cu, positive Ce anomalies, and low X-ray diffraction (XRD) intensities at ~10 Å. The nodules from the BB and TB are mainly diagenetic in origin, characterized by a relatively low SSA, low Co, high Ni and Cu, negative Ce anomalies, and high XRD intensities at ~10 Å. The SSAs of nodules were significantly positively correlated with Co, δCe, and light REEs (LREEs), and negatively correlated with the XRD intensity at ~10 Å, Ni, and Cu. The SSAs of nodules from the NPB ranged from 329.440 m2/g to 418.711 m2/g, comparable to the SSAs of Co-rich crusts on seamounts. This study proposes that nodule SAA is regulated by nodule genesis and that hydrogenetic nodules have a higher SSA.
1. Introduction
Deep sea polymetallic nodules (nodules) are generally 1–10 cm in diameter and discoidal–ellipsoidal–spherical in shape [1]. Nodules are composed predominantly of Mn and Fe oxides and are enriched in critical metals, including Co, Ni, Cu, rare earth elements (REEs), and Mo. These nodules are extensively distributed upon the vast abyssal plains of the global oceans at depths of 3500–6500 m [2,3]. Nodules can be classified according to their genesis as hydrogenetic, diagenetic, or hydrothermal, with nodules in these categories differentiated by their compositions of major elements, REEs, and minerals [4,5,6,7]. The Clarion–Clipperton Zone (CCZ) is estimated to have 34 billion tons of nodules, containing 7500, 265, 340, and 78 million tons of Mn, Cu, Ni, and Co, respectively [8]. The Metals Company has recovered 3021 tons of nodules from the seafloor of the CCZ [9], and the International Seabed Authority is working intensively on mining code concerningtheirapplication forexploitation contracts [10]. These developments suggest the approaching technological and regulatory maturity of commercial mining of nodules for some critical metal resources.
Metal enrichment in nodules occurs through the adsorption or absorption of trace metals in seawater and pore water by Mn and Fe oxides [2,11]. The concentrations of Mn, Fe, Co, and Ni in seawater of the CCZ are 5.0 ng/g, 6.0 ng/g, 0.1 ng/g, and 50 ng/g [12], respectively, whereas in sediment pore water they are 16.43 ng/g, 123.3 ng/g, 4.12 ng/g, 0.34 ng/g, and 1.19 ng/g [13], respectively. The concentrations of Co, Ni, and Cu in nodules in the CCZ exceed those in seawater and pore water, with average concentrations of 0.21%, 1.30%, and 1.07%, respectively [14], with the Co and Ni concentrations exceeding those in seawater by factors of 2.1 × 10⁷ and 2.6 × 10⁵,respectively, and those in pore water by factors of 6.18 × 10⁶ and 1.09 × 10⁷, respectively. Nodule enrichment in trace metals, such as Co, Ni, and Cu, occurs through the adsorption of metals from the seawater and sediment pore water. Therefore, this enrichment is strongly related to the large specific surface area (SSA) of nodules and their long-term exposure to seawater and sediment pore water.
The nodule growth rates in the CCZ and Cook Islands Exclusive Economic Zone (EEZ) are 3–8 mm/Ma and 1.0–4.2 mm/Ma, respectively [15,16]. This suggests that trace metal adsorption by these nodules from seawater and pore water occurs over an extended geological time. Furthermore, the large SSA of nodules is due to their loose and porous texture and contributes to nodule enrichment in Co and Ni [17]. Adsorption experiments have shown that the SSA and hydroxyl site density of Mn oxides correlate positively with the equilibrium concentration of Co2+ [18], which suggests that SSA is a critical factor regulating nodule enrichment in trace metals.
The SSAs of nodules and ferromanganese crusts are generally determined by nitrogen adsorption using the BET equation proposed by Brumauer, Emmett, and Teller [19]. Previous studies have analyzed the SSAs of nodules and crusts under various conditions, including sample size, degassing temperature, and degassing duration [20,21,22,23]. The sample sizes were1–2 mm [22], 75–45 μm [23], or 170 μm [24]. Degassing in these previous studies was conducted at 130–140 °C for 3 h [22], at 25 °C for 16 h [24], or at 110 °C to 900 °C with an increment of 100 °C [23]. Li [25] obtained comparable estimates of SSA by constraining the degassing temperature and degassing duration, limiting the sample size, applying temperature programming, accumulating heat, and applying particle size comparison methods based on BET. Their results suggested that consistent SSA values can be obtained by heating polymetallic nodules with a diameter ranging between 1 and 2 mm in a vacuum system for 3 h at 210 °C.
The present study aimed to investigate how nodule genesis regulates nodule SSA by examining the major elements, REEs, and mineralogy of nodules obtained from the Pacific, Indian, and Atlantic oceans.
2. Samples and Methods
2.1. Samples
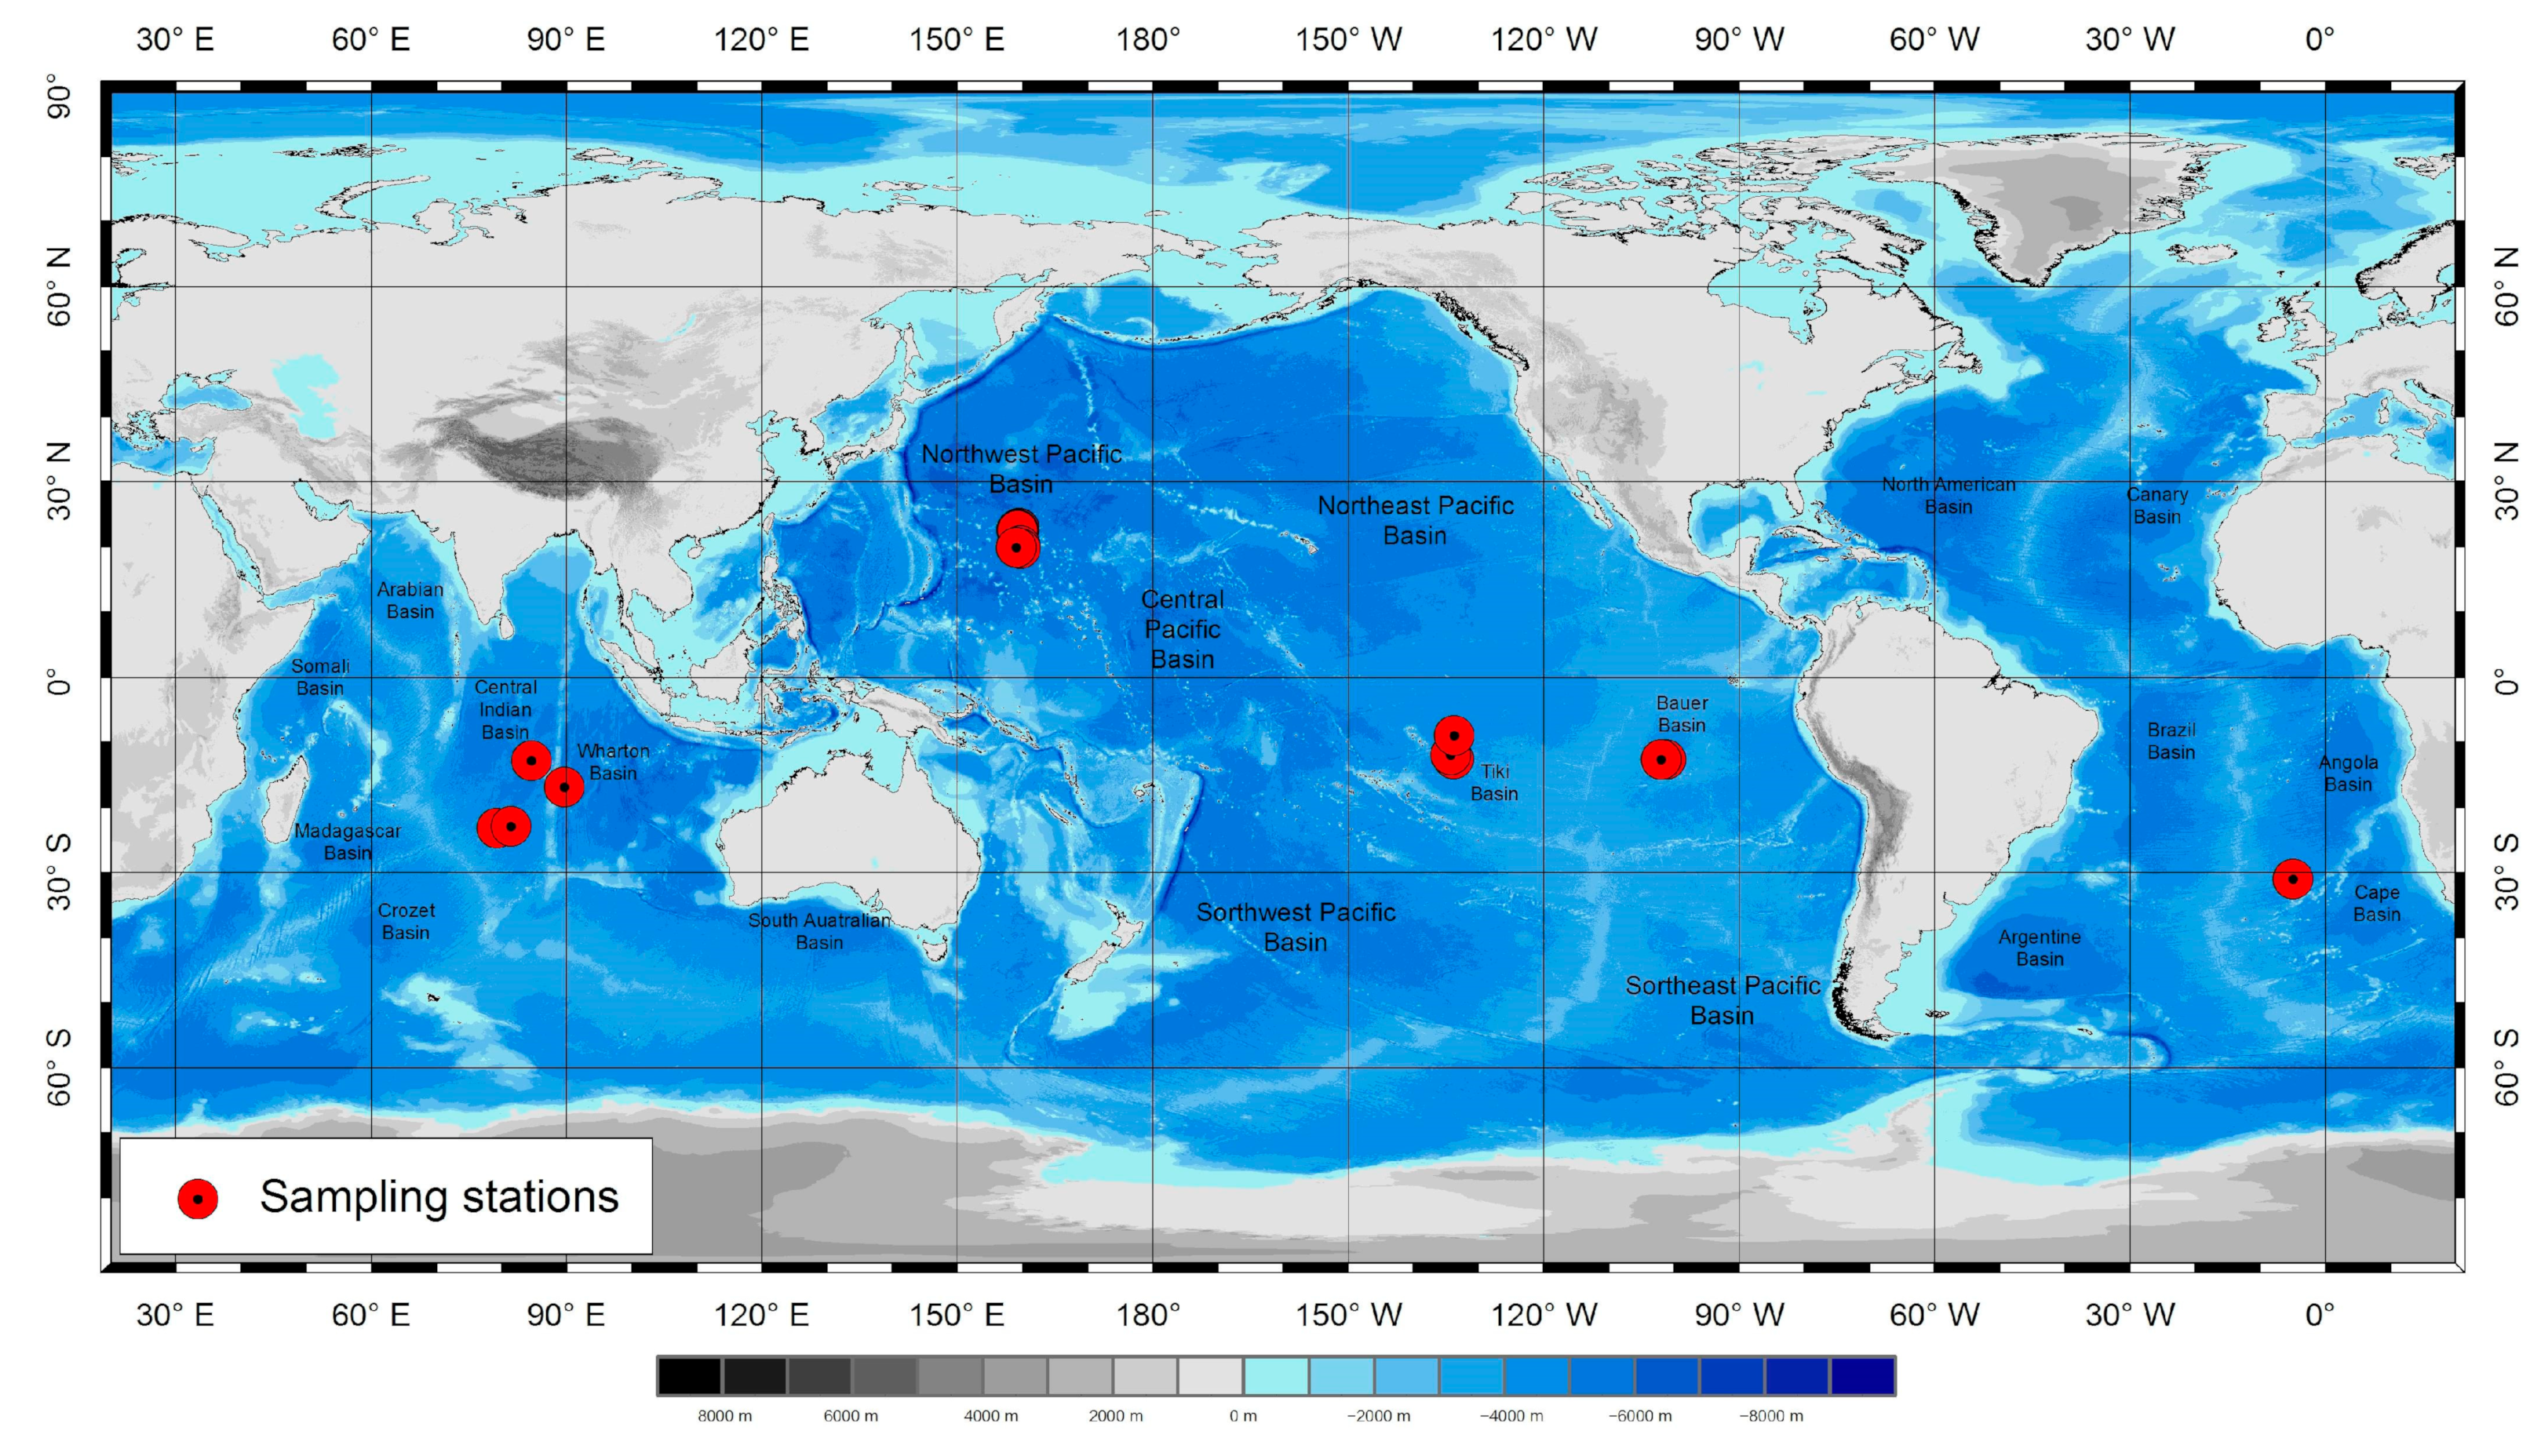
The present study analyzed 20 nodules recovered from 18 sites in 6 basins using a box corer during Cruises DY42 in 2017, DY 46 and 48 in 2018, and DY52 in 2019. Nodules were recovered from the Pacific, Indian, and Atlantic oceans, including the Northwest Pacific Basin (NPB), Bauer Basin (BB), Tiki Basin (TB), Wharton Basin (WB), Central Indian Basin (CIB), and Angola Basin (AB) (Table 1, Figure 1). Sampling water depths ranged from 4271 m to 5629 m. The nodules recovered from 8 sites in the NPB were mainly spheroidal in shape with a smooth surface or comprised several joined spheroidal nodules forming a polynucleate nodule. Cauliflower-shaped nodules were recovered from two sites and three sites in the BB and TB, respectively. Spheroidal, polynucleate, and cauliflower-shaped nodules were recovered from one site and three sites in the WB and CIB, respectively. The nodules recovered from one site in the AB were polynucleate or cauliflower-shaped. An aliquot subsample was extracted from the surface of each of the 20 nodules for the analysis of chemistry, mineralogy, and SSA. All analyses were conducted at the Key Laboratory of Marine Geology and Metallogeny of the First Institute of Oceanography, Ministry, and Natural Resources of the People’s Republic of China.

Table 1.
Nodule compositions of transition metals and rare earth elements (REEs), X-ray diffraction (XRD) intensities at 10 Å, and the SSAs.

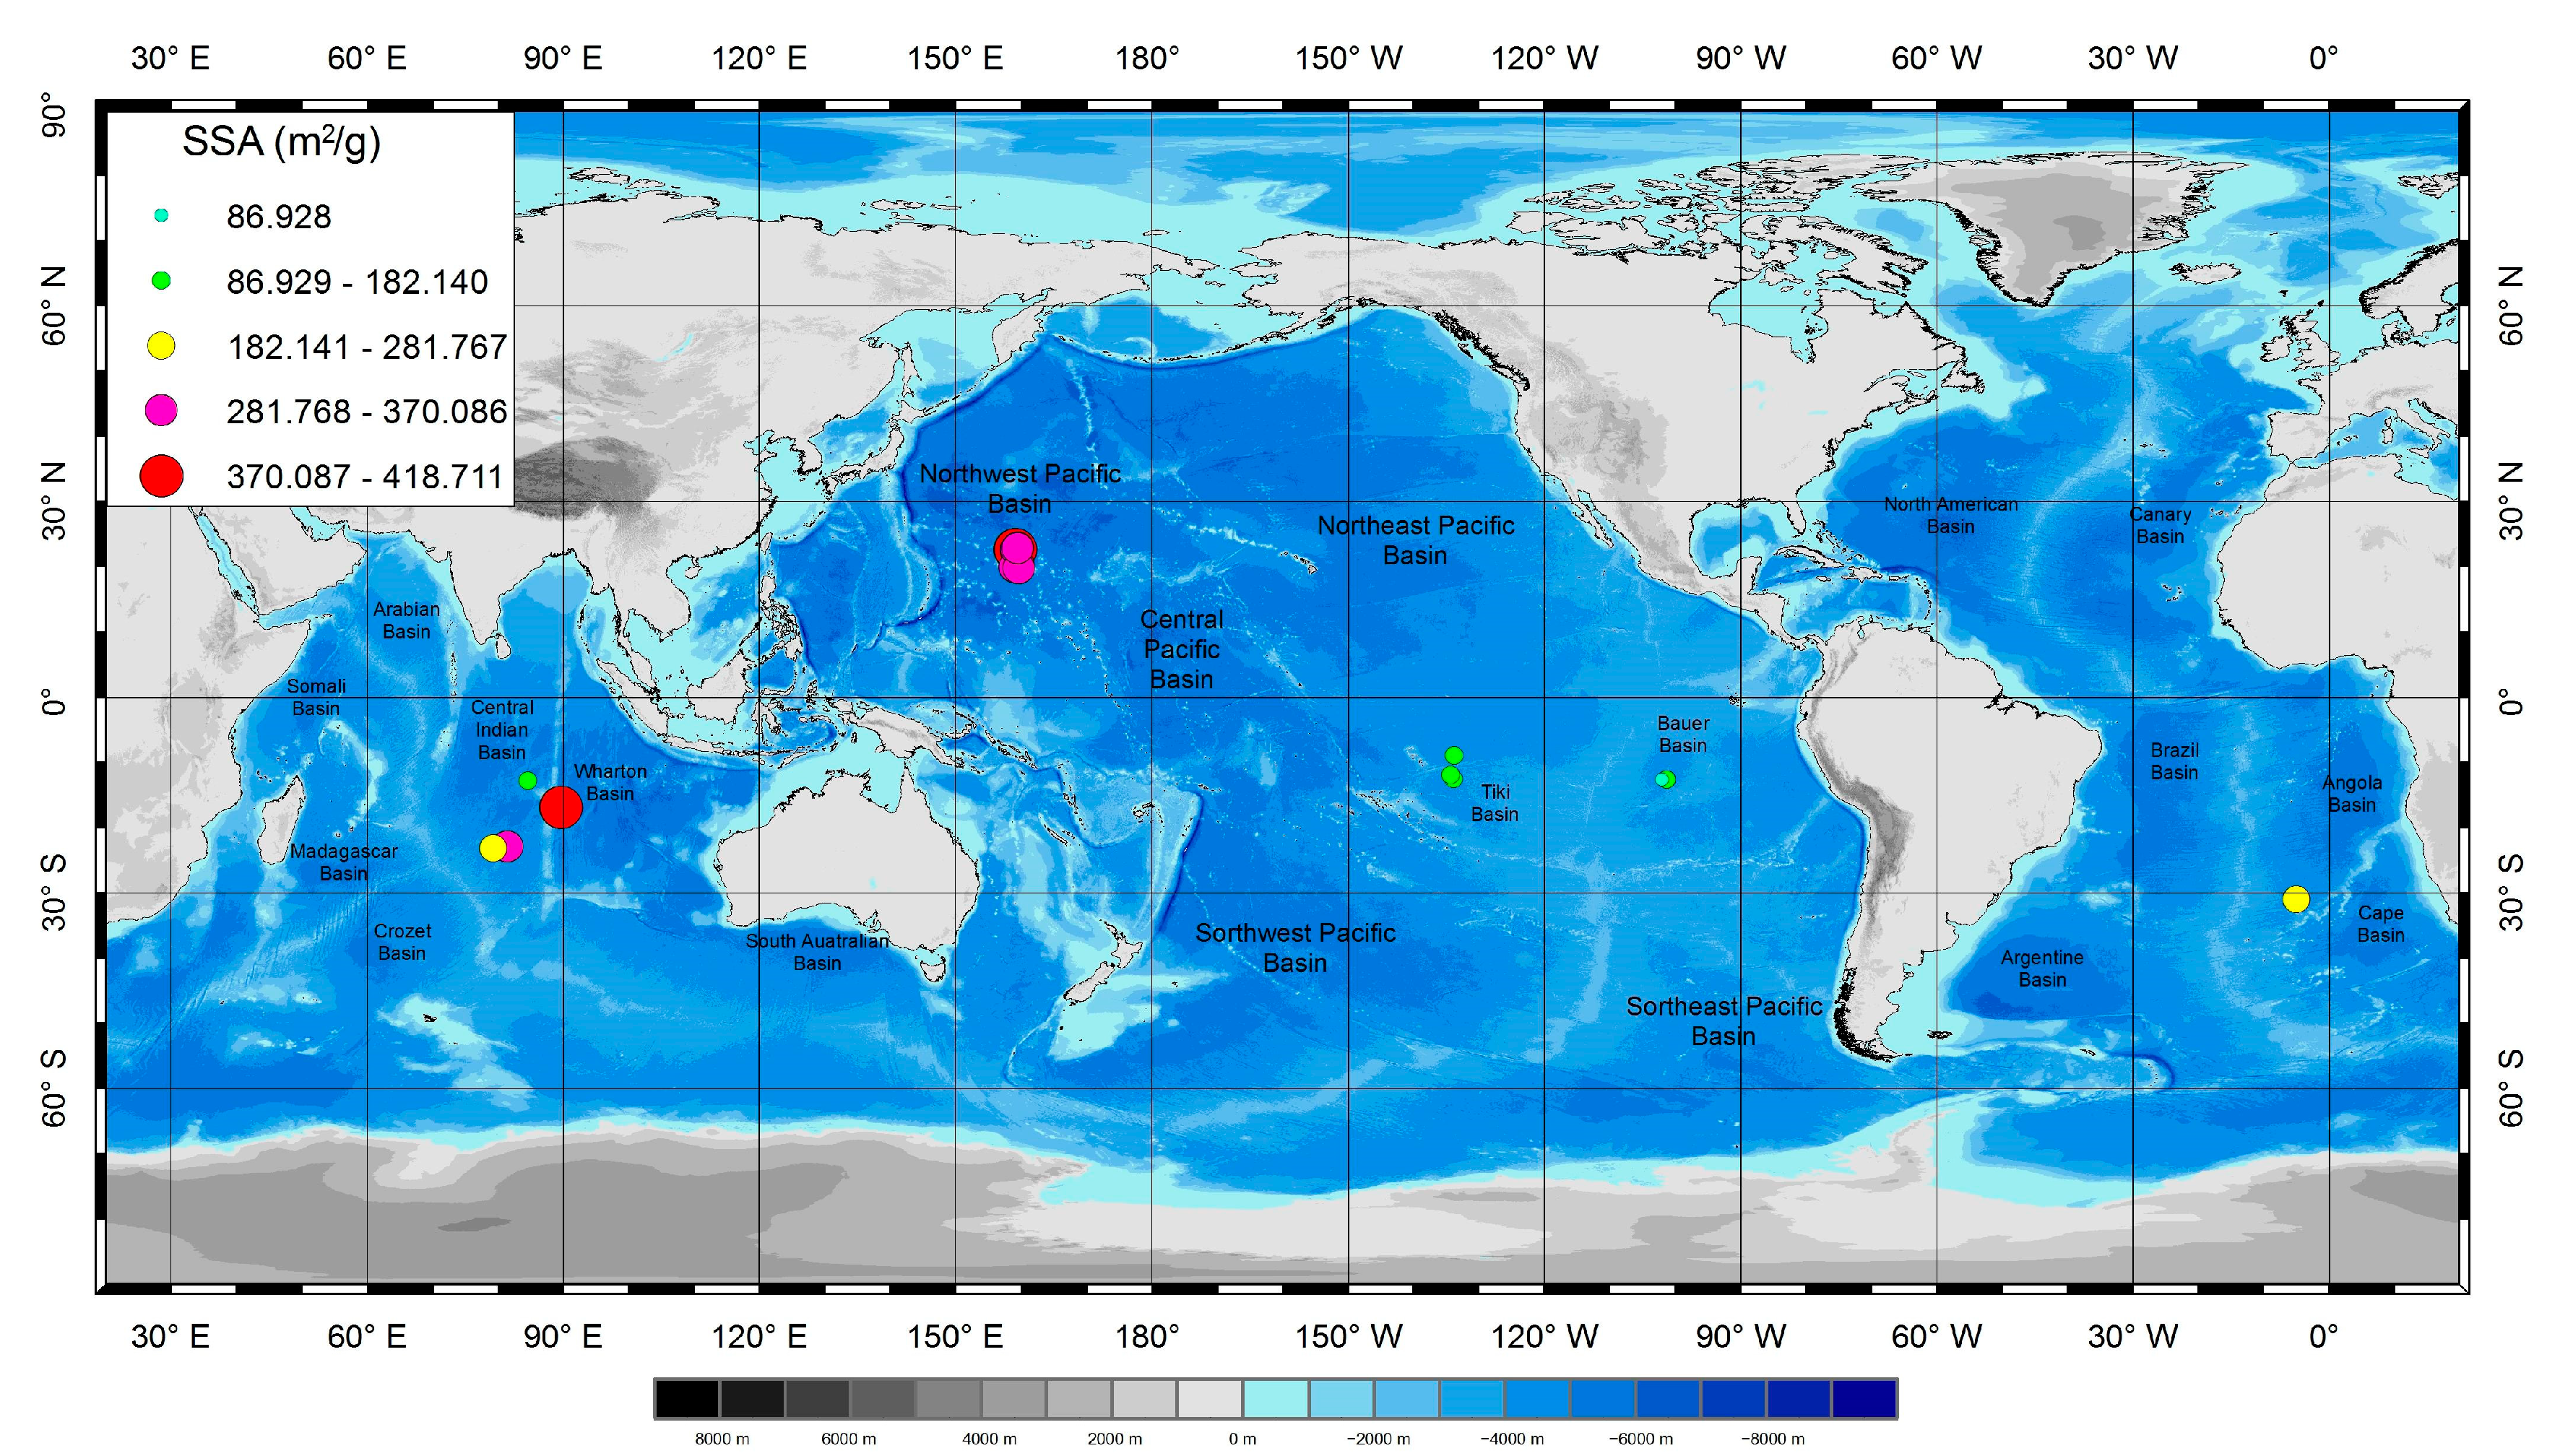
Figure 1.
Locations of sites from which nodules were collected by a box corer. (www.gebco.net (accessed on 14 January 2020)).
2.2. Methods
A portion of each aliquot was ground to a particle size < 74 μm using an agate mortar and pestle for chemical and mineralogical analysis. The remaining portion of each aliquot was ground to a particle size < 7 mm for the SSA analysis. Sample particles for chemical analysis were dried at 110 °C for 4 h prior to digestion, following which they were placed in a silicagel desiccator to cool to room temperature. A subsample of 0.05 ± 0.0005 g of each dried sample was digested in a Teflon pressure vessel. The dried fine particles were dissolved using ultrapure concentrated acids, first using 1.5 mL HNO3 and 1 mL HF at 190–200 °C for 48 h. After cooling, the samples were evaporated at 140–150 °C to incipient dryness, redissolved in 1 mL HNO3 (1:1), and heated again to incipient dryness to evaporate the HF. The residues were dissolved again in 4 mL HNO3 (1:1), following which 1 mL Rh (1 ppm) was added as an internal standard, and the sample was heated at 150 °C for 12 h in a Teflon pressure vessel. After cooling, 1 to 2 droplets of H2O2 were added to the residues, and the sample was transferred to a plastic cup containing 2% HNO3. The sample was finally diluted with 2% HNO3 to 100 g for analysis.
Analyses of major and minor elements were conducted using inductively coupled plasma optical emission spectrometry(ICP-OES, Thermal iCAP6300 instrument) (Thermal Fisher Scientific Inc., Waltham, MA, USA). The samples were analyzed for Al2O3, CaO, TFe2O3, K2O, MgO, MnO, Na2O, P2O5, TiO2, Co, Cu, Ni, Ba, Sr, and Pb, whereas REEs were determined using inductively coupled plasma mass spectrometry(ICP-MS, Thermal X SeriesII) (Thermal Fisher Scientific Inc., Waltham, MA, USA). Analytical accuracy was assessed by analyzing standards GSMC-1 and GSMC-2 together with the nodule samples. X-ray diffraction (XRD) on the dried sample particles using the Rigaku Corporation D/max2500PC (18 KW) (Rigaku Corp., Akishima-shi, Tokyo, Japan) was conducted for mineralogical analysis. XRD was conducted at a tube power of 18 KW, a scanning range of 3° to 75° (2θ), and a step scan width of 2°/min.
The SSA was determined by extracting a surface sample of 1–2 mm from each of the 20 nodules. These samples were pre-treated for 3 h at 210 °C for degassing, following the procedure described in the literature [25]. The specific surface areas were determined by N2 adsorption by applying the BET equation [26] and using the JW-BK100B instrument (JWGB Sci.&Tech. Inc., Beijing, China). Measurement accuracy was assessed by analyzing the standard SRB-9C (N134) with an SSA of 137.9 m2/g together with the nodule samples.
3. Results
3.1. Nodule Transition Metals and REEs
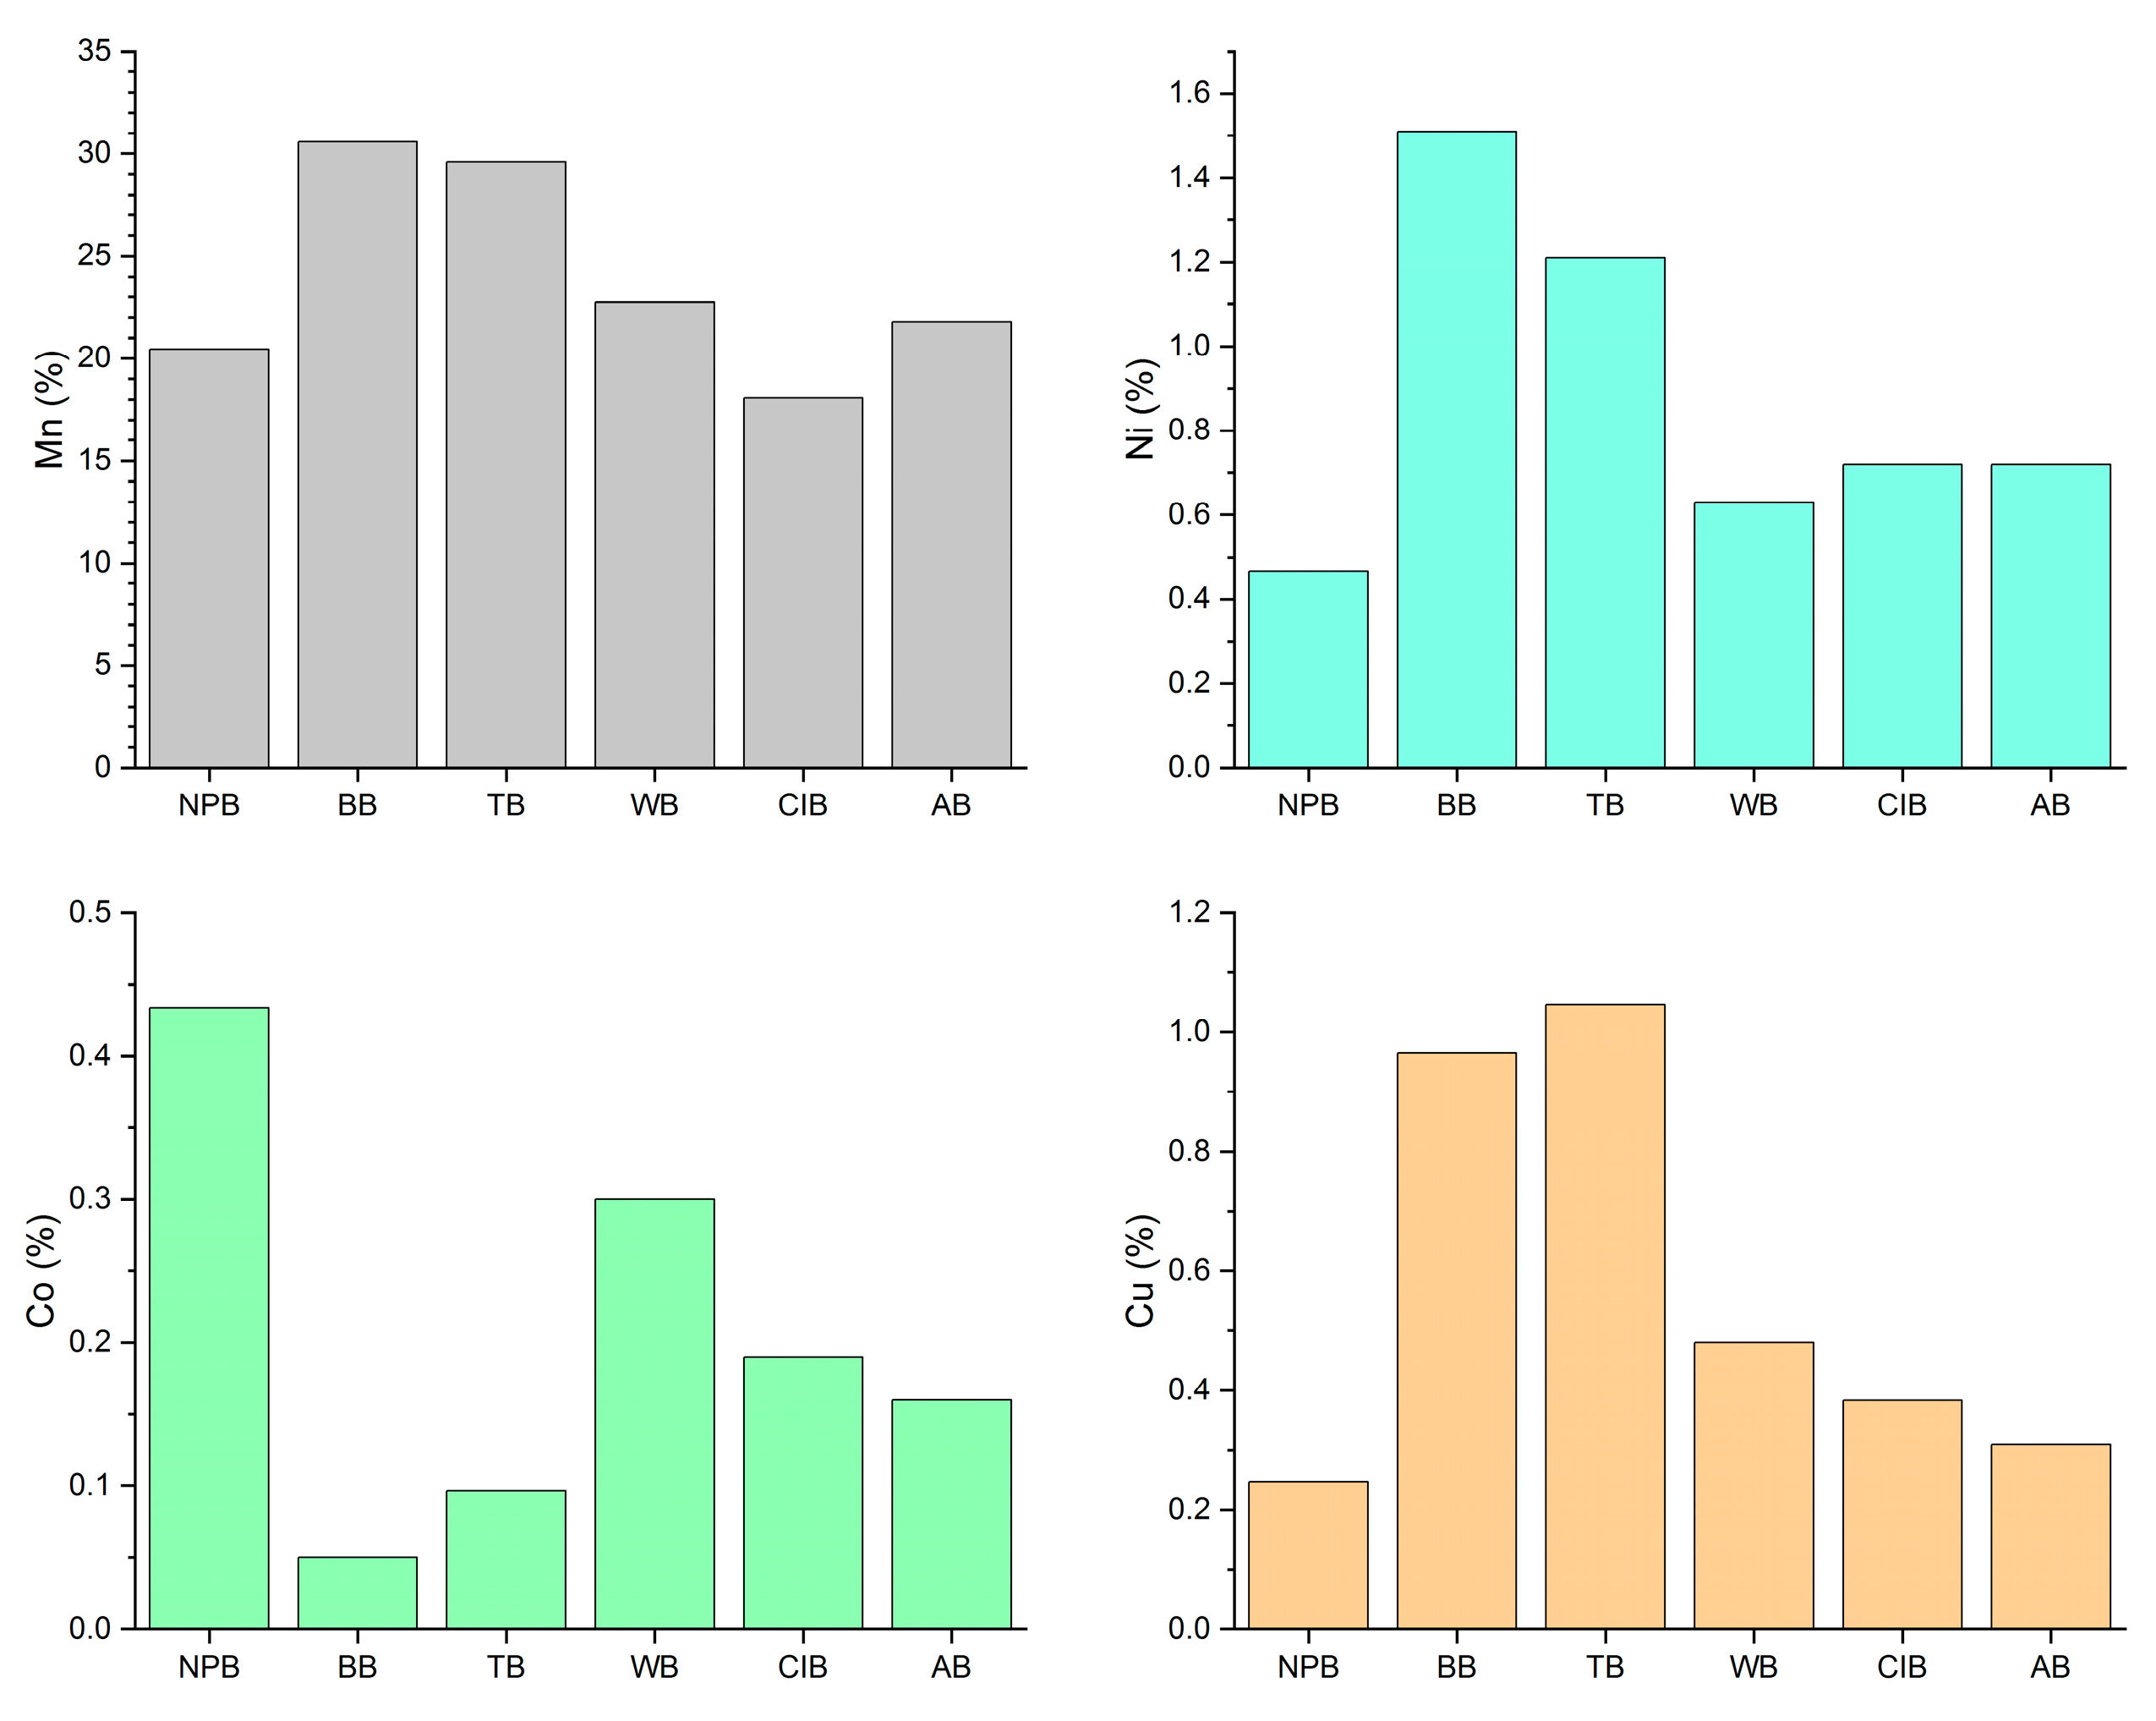
The nodule concentrations of transition metals and REEs determined in the present study varied among the different basins from which the nodules were collected (Table 1, Figure 2). The Mn concentrations of nodules collected from the NPB ranged from 19.68% to 22.04%, whereas those of nodules collected from the BB and TB were higher, ranging from 29.49% to 31.48% and from 28.18% to 31.62%, respectively. Nodules collected from the CIB had the lowest Mn concentrations, ranging from 14.44% to 22.16%. Nodules collected from the WB and AB showed similar average Mn concentrations to those collected from the NPB at 22.74% and 21.79%, respectively.
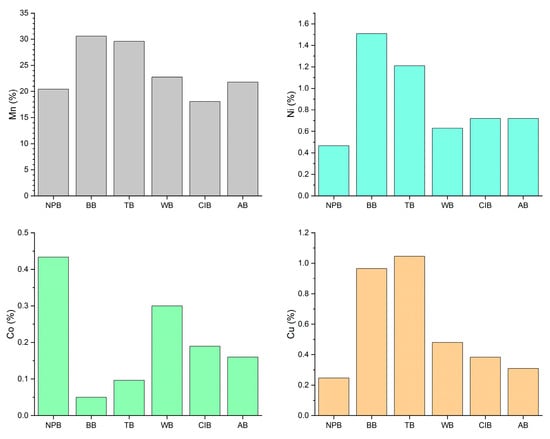
Figure 2.
Average concentrations of transition metals of nodules in this study. (Grey, blue, green and orange bars are the average concentrations of Mn, Ni, Co, and Cu of nodules from NPB, BB, TB, WB, CIB, and AB, respectively).
The nodules collected from the NPB showed the highest Co concentrations at 0.42% to 0.46%, whereas those collected from the BB and TB showed the lowest concentrations at 0.03% to 0.07% and 0.09% to 0.10%, respectively. Nodules collected from the CIB, WB, and AB showed intermediate Co concentrations of 0.10 to 0.26%, 0.30%, and 0.16%, respectively.
The nodules collected from the NPB showed the lowest Ni concentrations, ranging from 0.36% to 0.61%, whereas those collected from the BB and TB showed the highest concentrations, ranging from 1.28% to 1.61% and from 1.19% to 1.23%, respectively. Nodules collected from the CIB, WB, and AB showed intermediate Ni concentrations at 0.61 to 0.84%, 0.63%, and 0.72%, respectively.
The Cu concentrations of nodules among the different basins showed a pattern similar to that of Ni. The nodules collected from the NPB had the lowest Cu concentrations at 0.19% to 0.31%, whereas those collected from the BB and TB had the highest concentrations at 0.94% to 0.99% and 0.97% to 1.13%, respectively. Nodules collected from the CIB, WB, and AB showed intermediate Cu concentrations of 0.33 to 0.43%, 0.48%, and 0.31%, respectively.
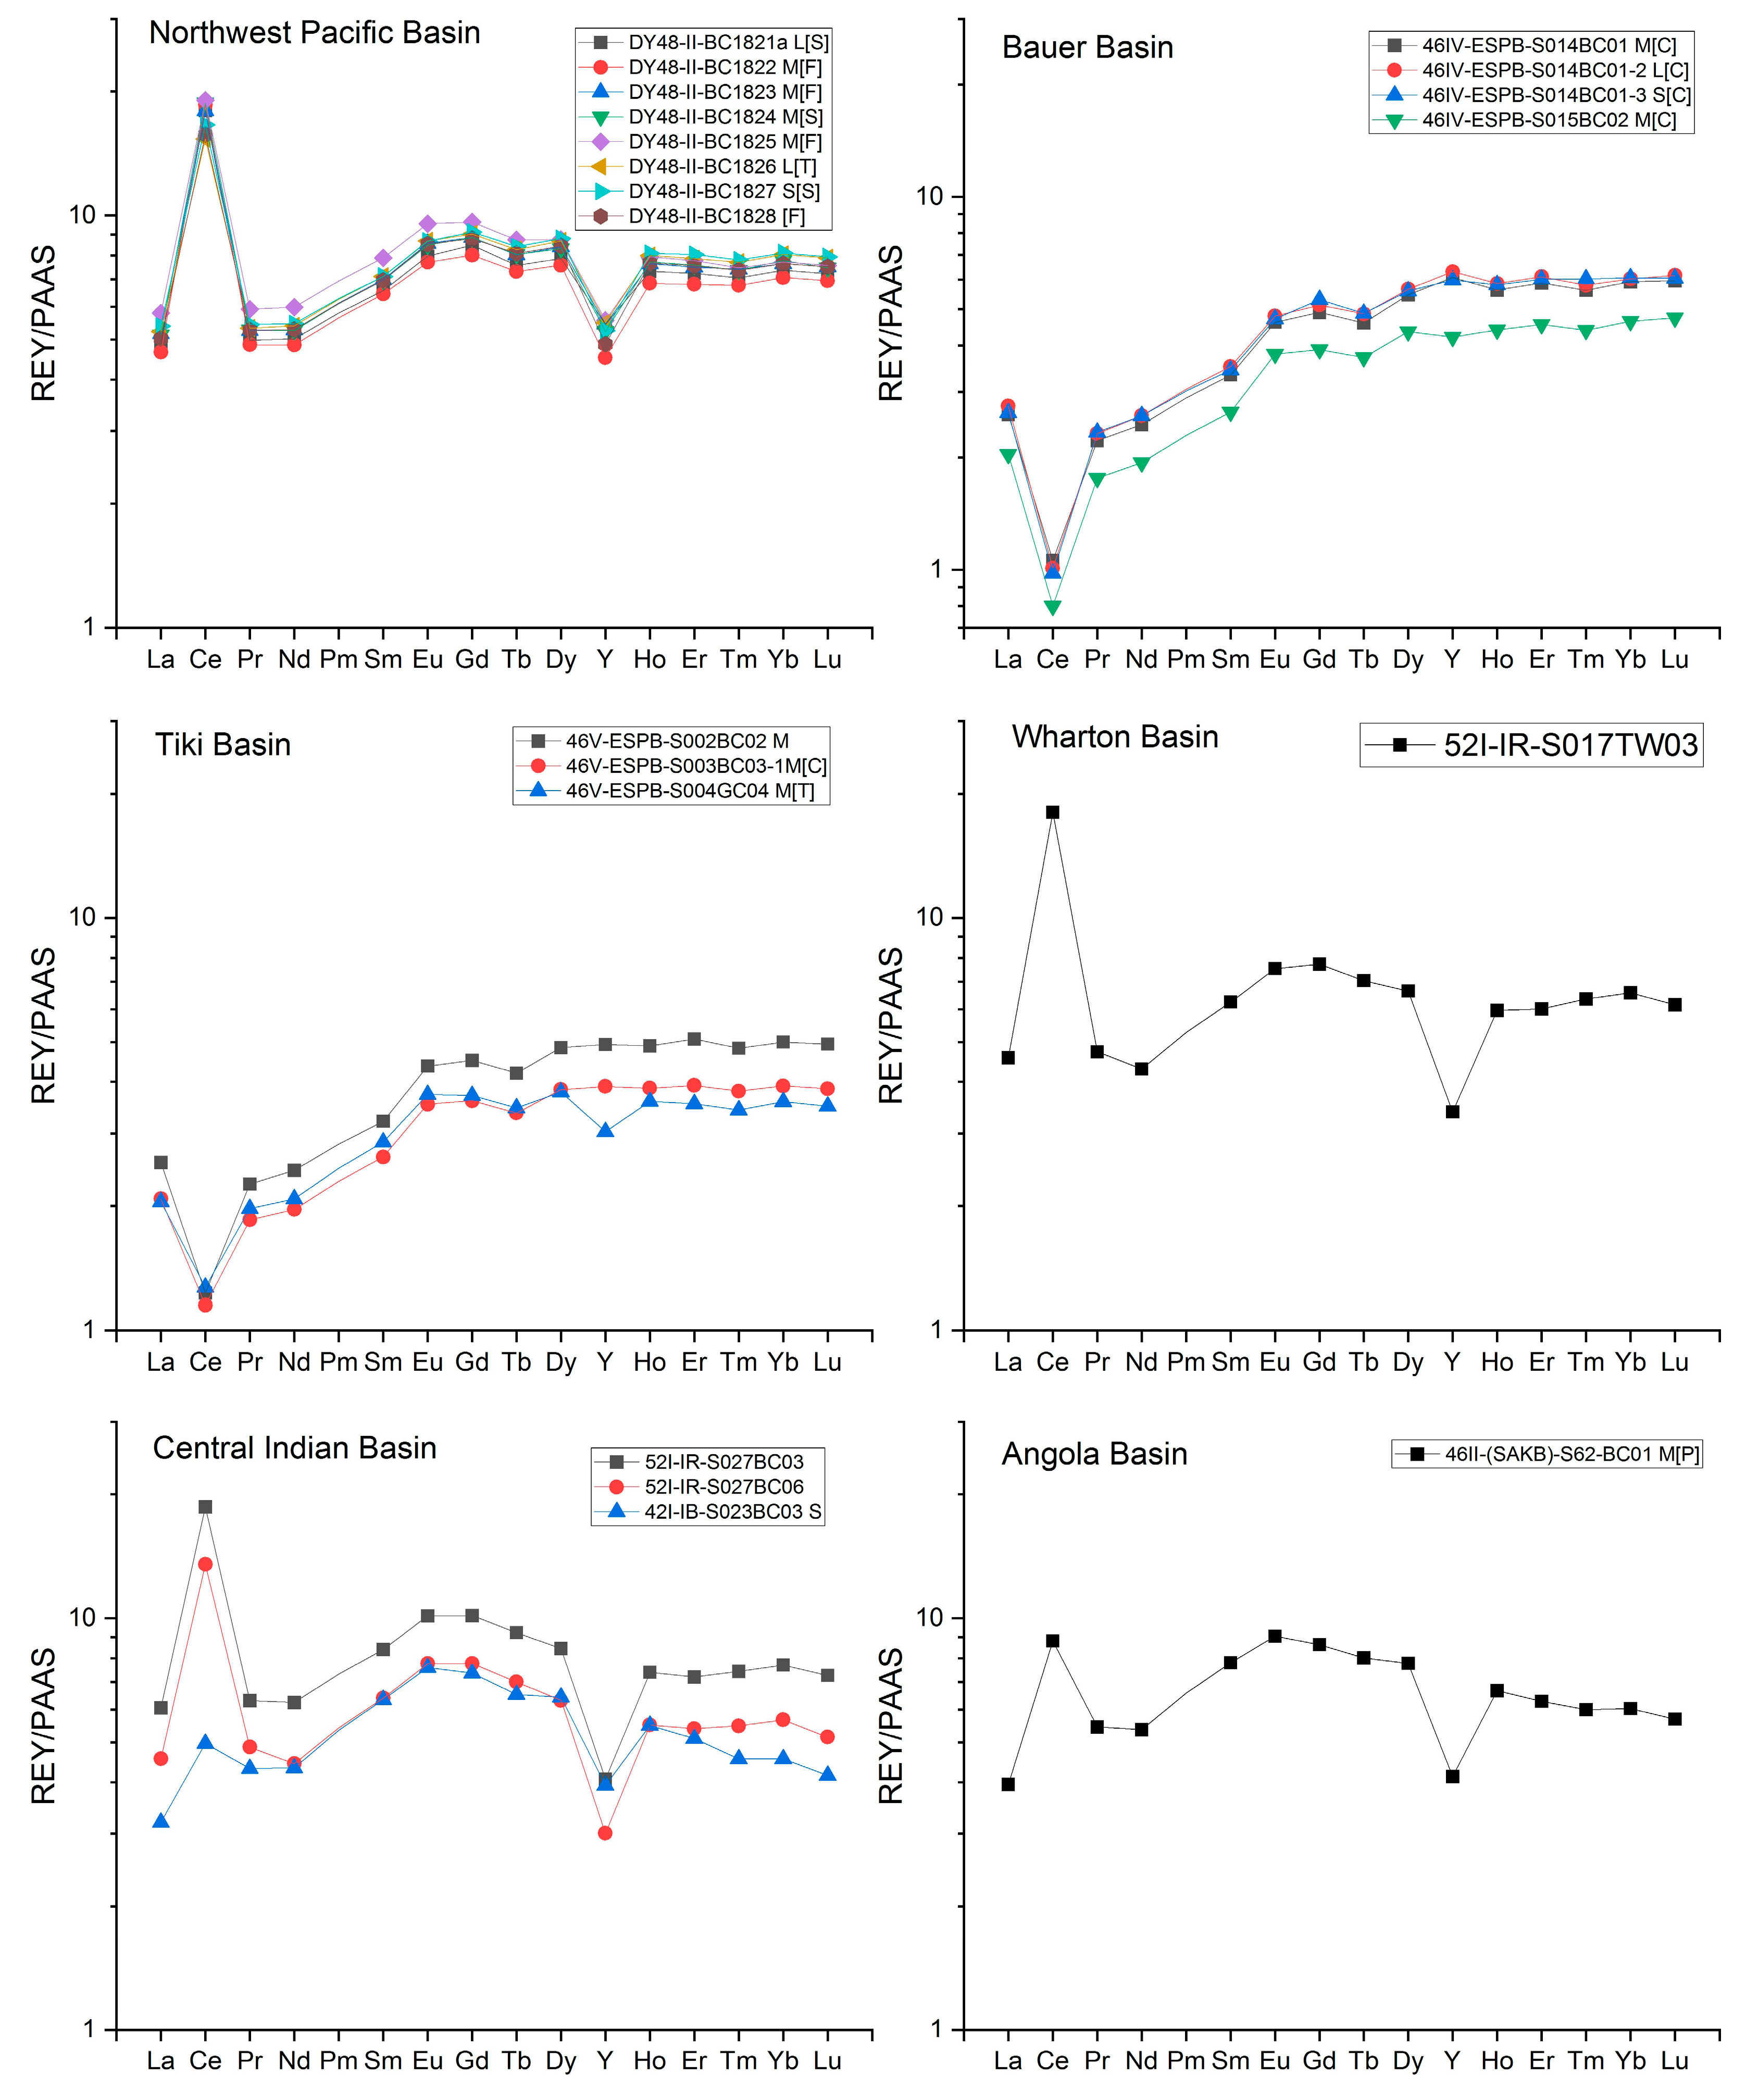
The ΣREE concentrations of nodules collected from the NPB ranged from 1991 μg/g to 2348 μg/g. In comparison, those of nodules collected from the BB and TB were far lower and ranged from 430 μg/g to 588 μg/g and 433 μg/g to 538 μg/g, respectively. Nodules collected from the CIB, WB, and AB showed a higher ΣREE relative to those from the BB and TB at 959 μg/g to 1646 μg/g, 2053 μg/g, and 1376 μg/g, respectively. The distributions of REE (Figure 3) in nodules collected from the NPB, WB, CIB, and AB exhibited positive Ce anomalies and negative Y anomalies, whereas those of nodules collected from the BB and TB showed negative Ce anomalies.
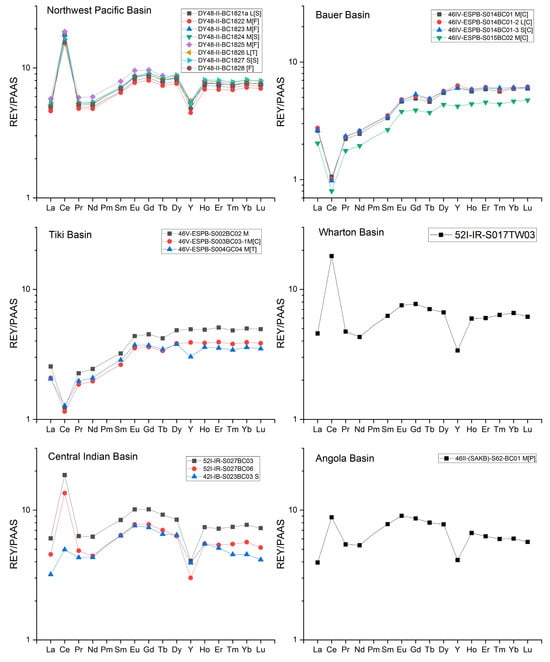
Figure 3.
Distribution patterns of rare earth elements (REEs) of nodules. (PAAS, REE concentrations of post-Archean shales from Australia from [27]).
3.2. Mineralogical Composition of Nodules
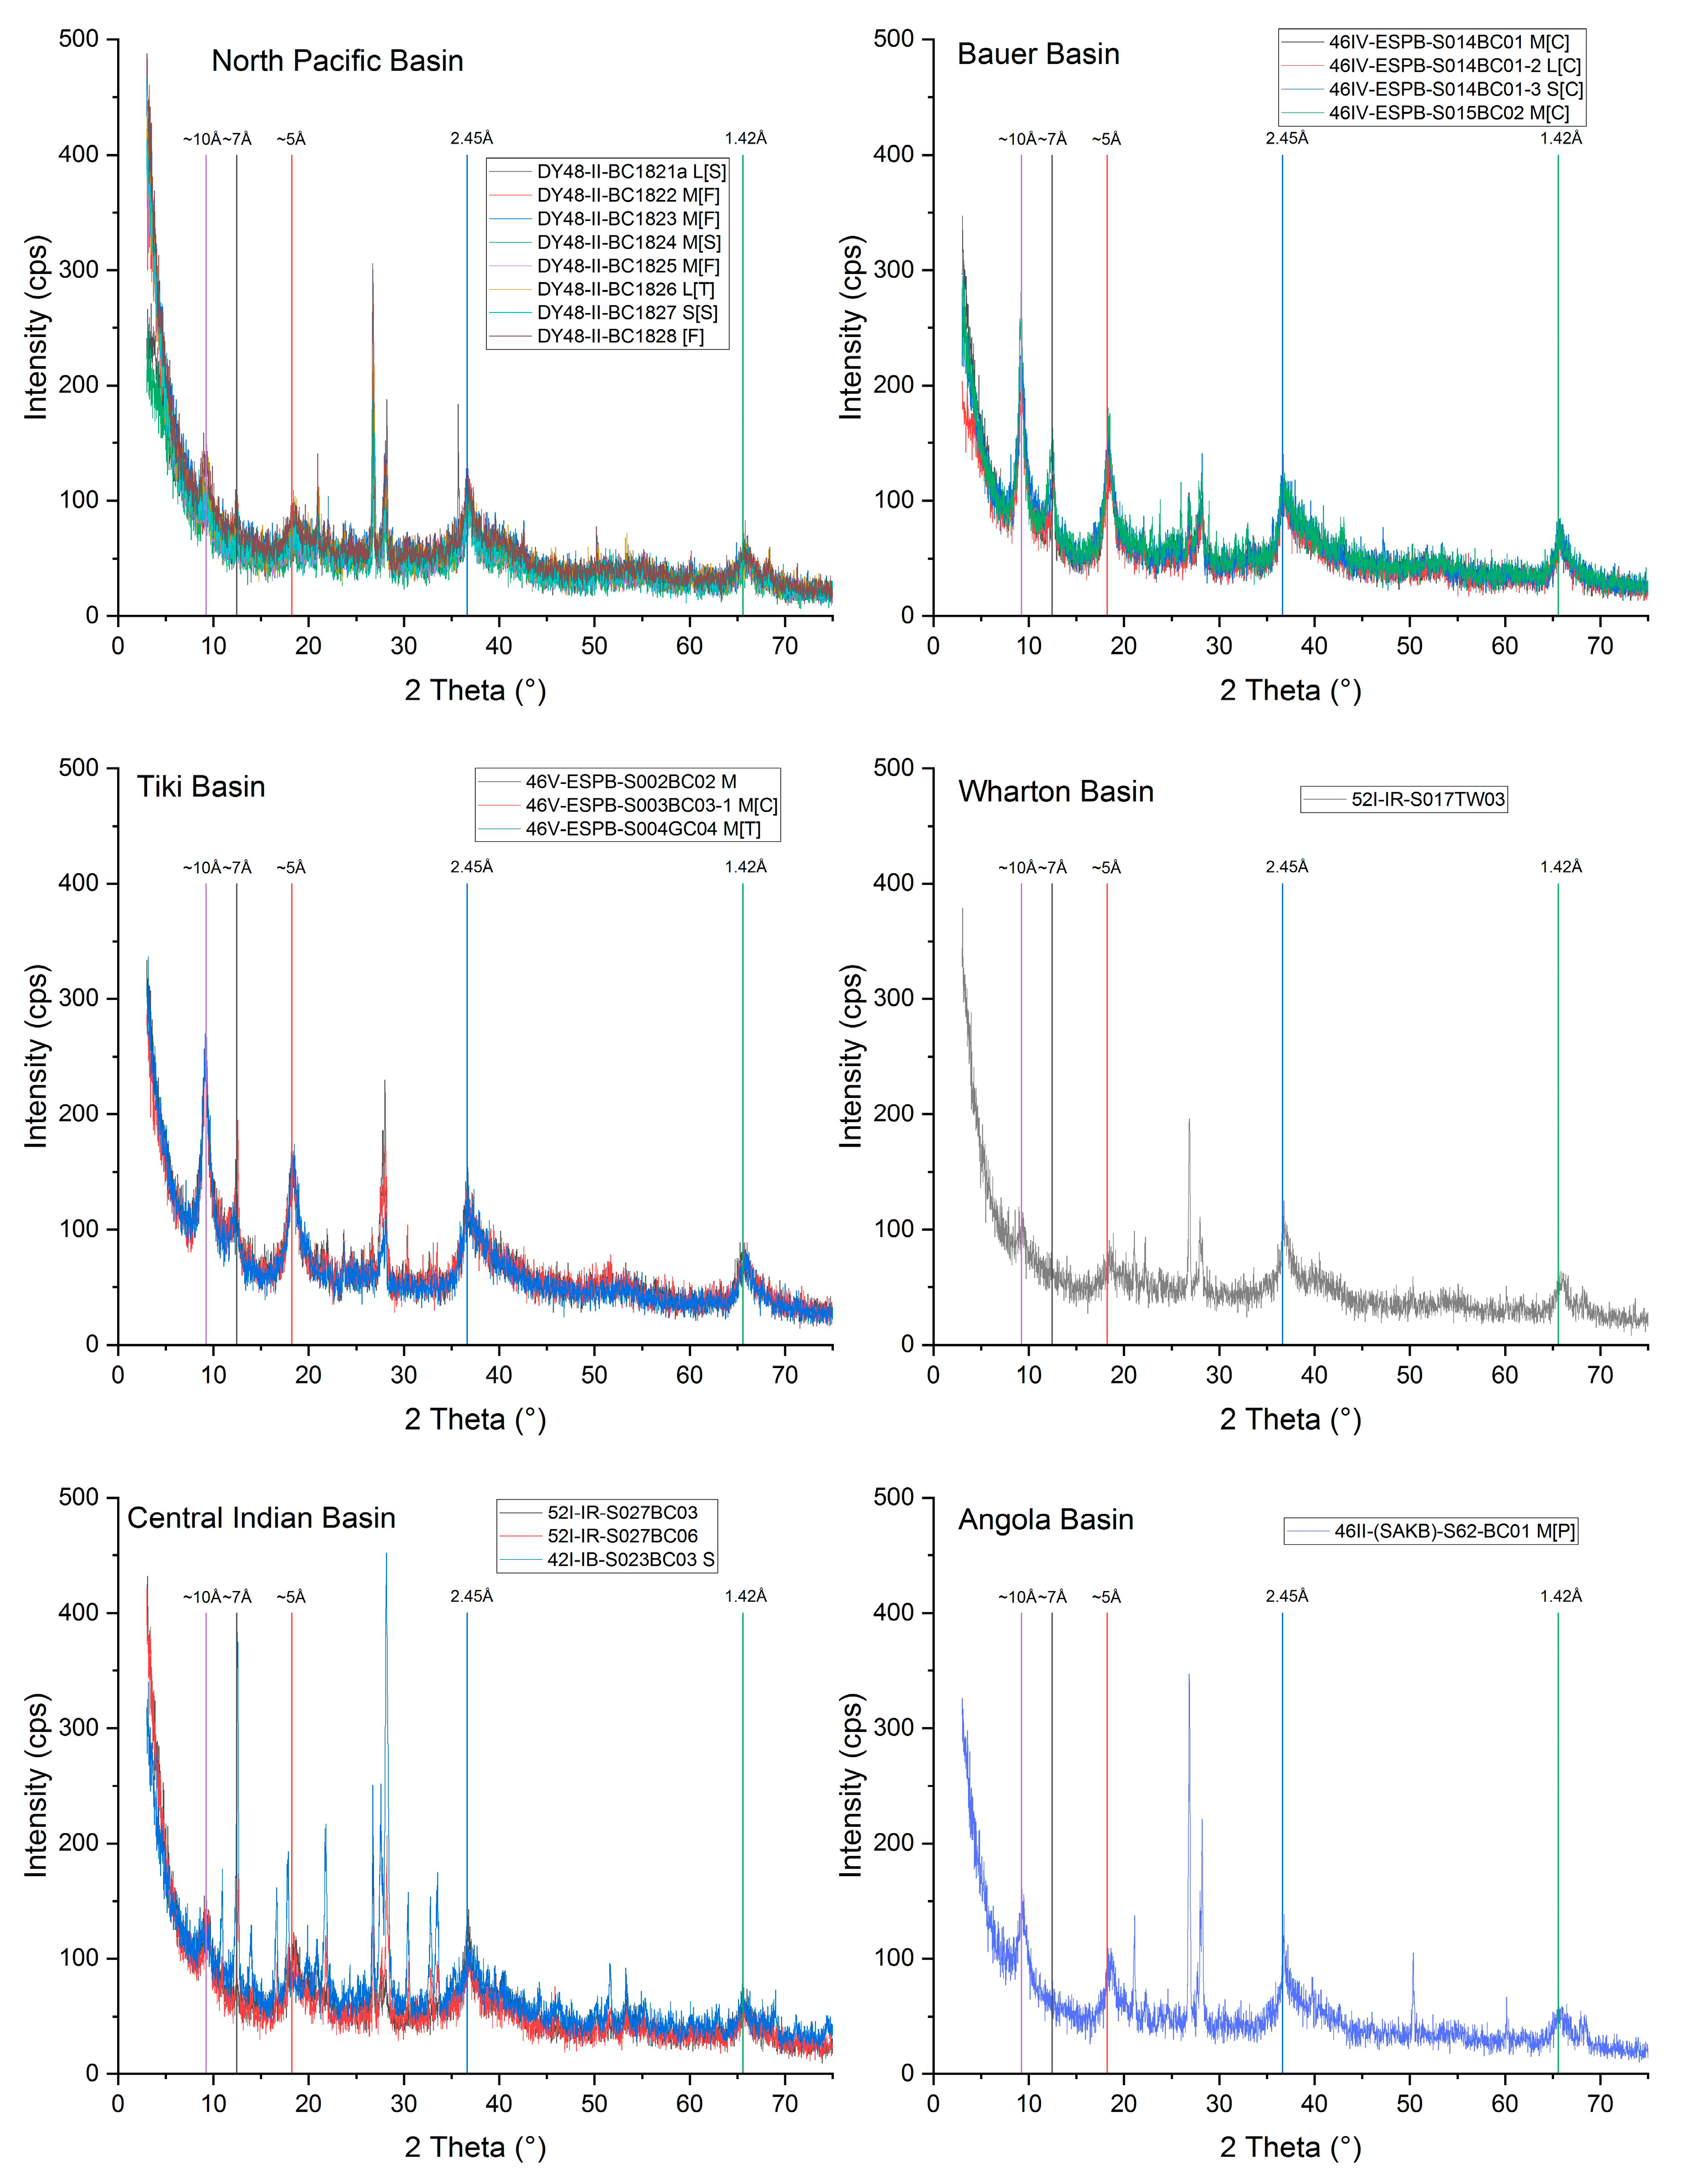
The present study applied XRD to determine the crystalline phase of nodule mineralogy (Figure 4). XRD patterns of nodules from the six basins showed broad peaks at ~10 Å and ~5 Å corresponding to todorokite, at ~7 Å corresponding to 7 Å phyllomanganate, and at ~2.45 Å and ~1.42 Å corresponding to vernadite. Furthermore, they demonstrated narrow and sharp peaks at ~3.34 Å corresponding to quartz, and at ~3.20 Å corresponding to phillipsite.
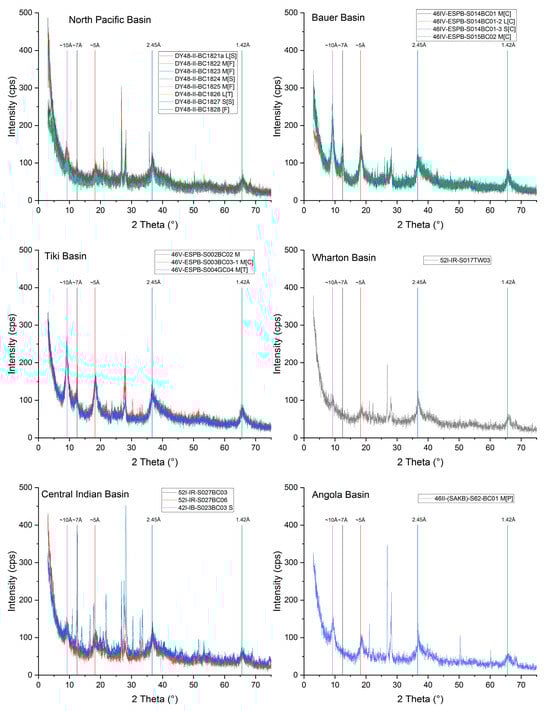
Figure 4.
X-ray diffraction patterns of nodules examined in this study.
The XRD intensities of nodules from the BB and TB at ~10 Å exceeded those of nodules from the NPB, CIB, WB, and AB. The XRD intensities of nodules from the NPB at ~10 Å ranged from 72 cps to 133 cps (mean of 93 cps); those of nodules from the BB and TB ranged from 145 cps to 175 cps (mean of 160 cps) and from 156 cps to 182 cps (mean of 171 cps), respectively; while those of nodules from the CIB, WB, and AB were 93 to 136 cps, 86 cps, and 120 cps, respectively.
3.3. Nodule-Specific Surface Areas
The SSAs of nodules collected from the PNB (329.440 m2/g to 418.711 m2/g; mean of 359.250 m2/g) significantly exceeded those of nodules from the TB (135.417 m2/g to 174.141 m2/g; mean of 153.925 m2/g) and BB (86.928 m2/g to 181.343 m2/g; mean of 150.229 m2/g). Nodules collected from the AB, CIB, and WB also showed relatively high SSAs (Figure 5) at 281.767 m2/g, 182.140 m2/g to 366.570 m2/g (mean of 264.857 m2/g), and 387.827 m2/g, respectively.
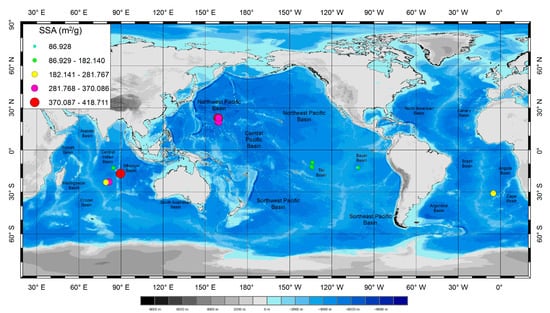
Figure 5.
Geographical distribution of specific surface areas (SSAs) of nodules examined in this study.
4. Discussion
4.1. Genesis Discrimination
Three principle processes are mainly responsible for the formation of ferromanganese oxides in the oceans [2]: (1) hydrogenetic precipitation, (2) diagenetic precipitation, and (3) fallout of hydrothermal fluids. Although examinations of the nodule texture, chemistry, and mineralogy have indicated that nodule genesis varies during the growth of nodules [28,29,30], the dominant processes responsible for nodule formation differ among the different oceans. For example, hydrogenetic precipitation is the dominant process responsible for the formation of nodules in the EEZ of the Cook Islands in the West Pacific [16], whereas diagenetic precipitation dominates in the PB [2], and both processes contribute in the CCZ and CIB.
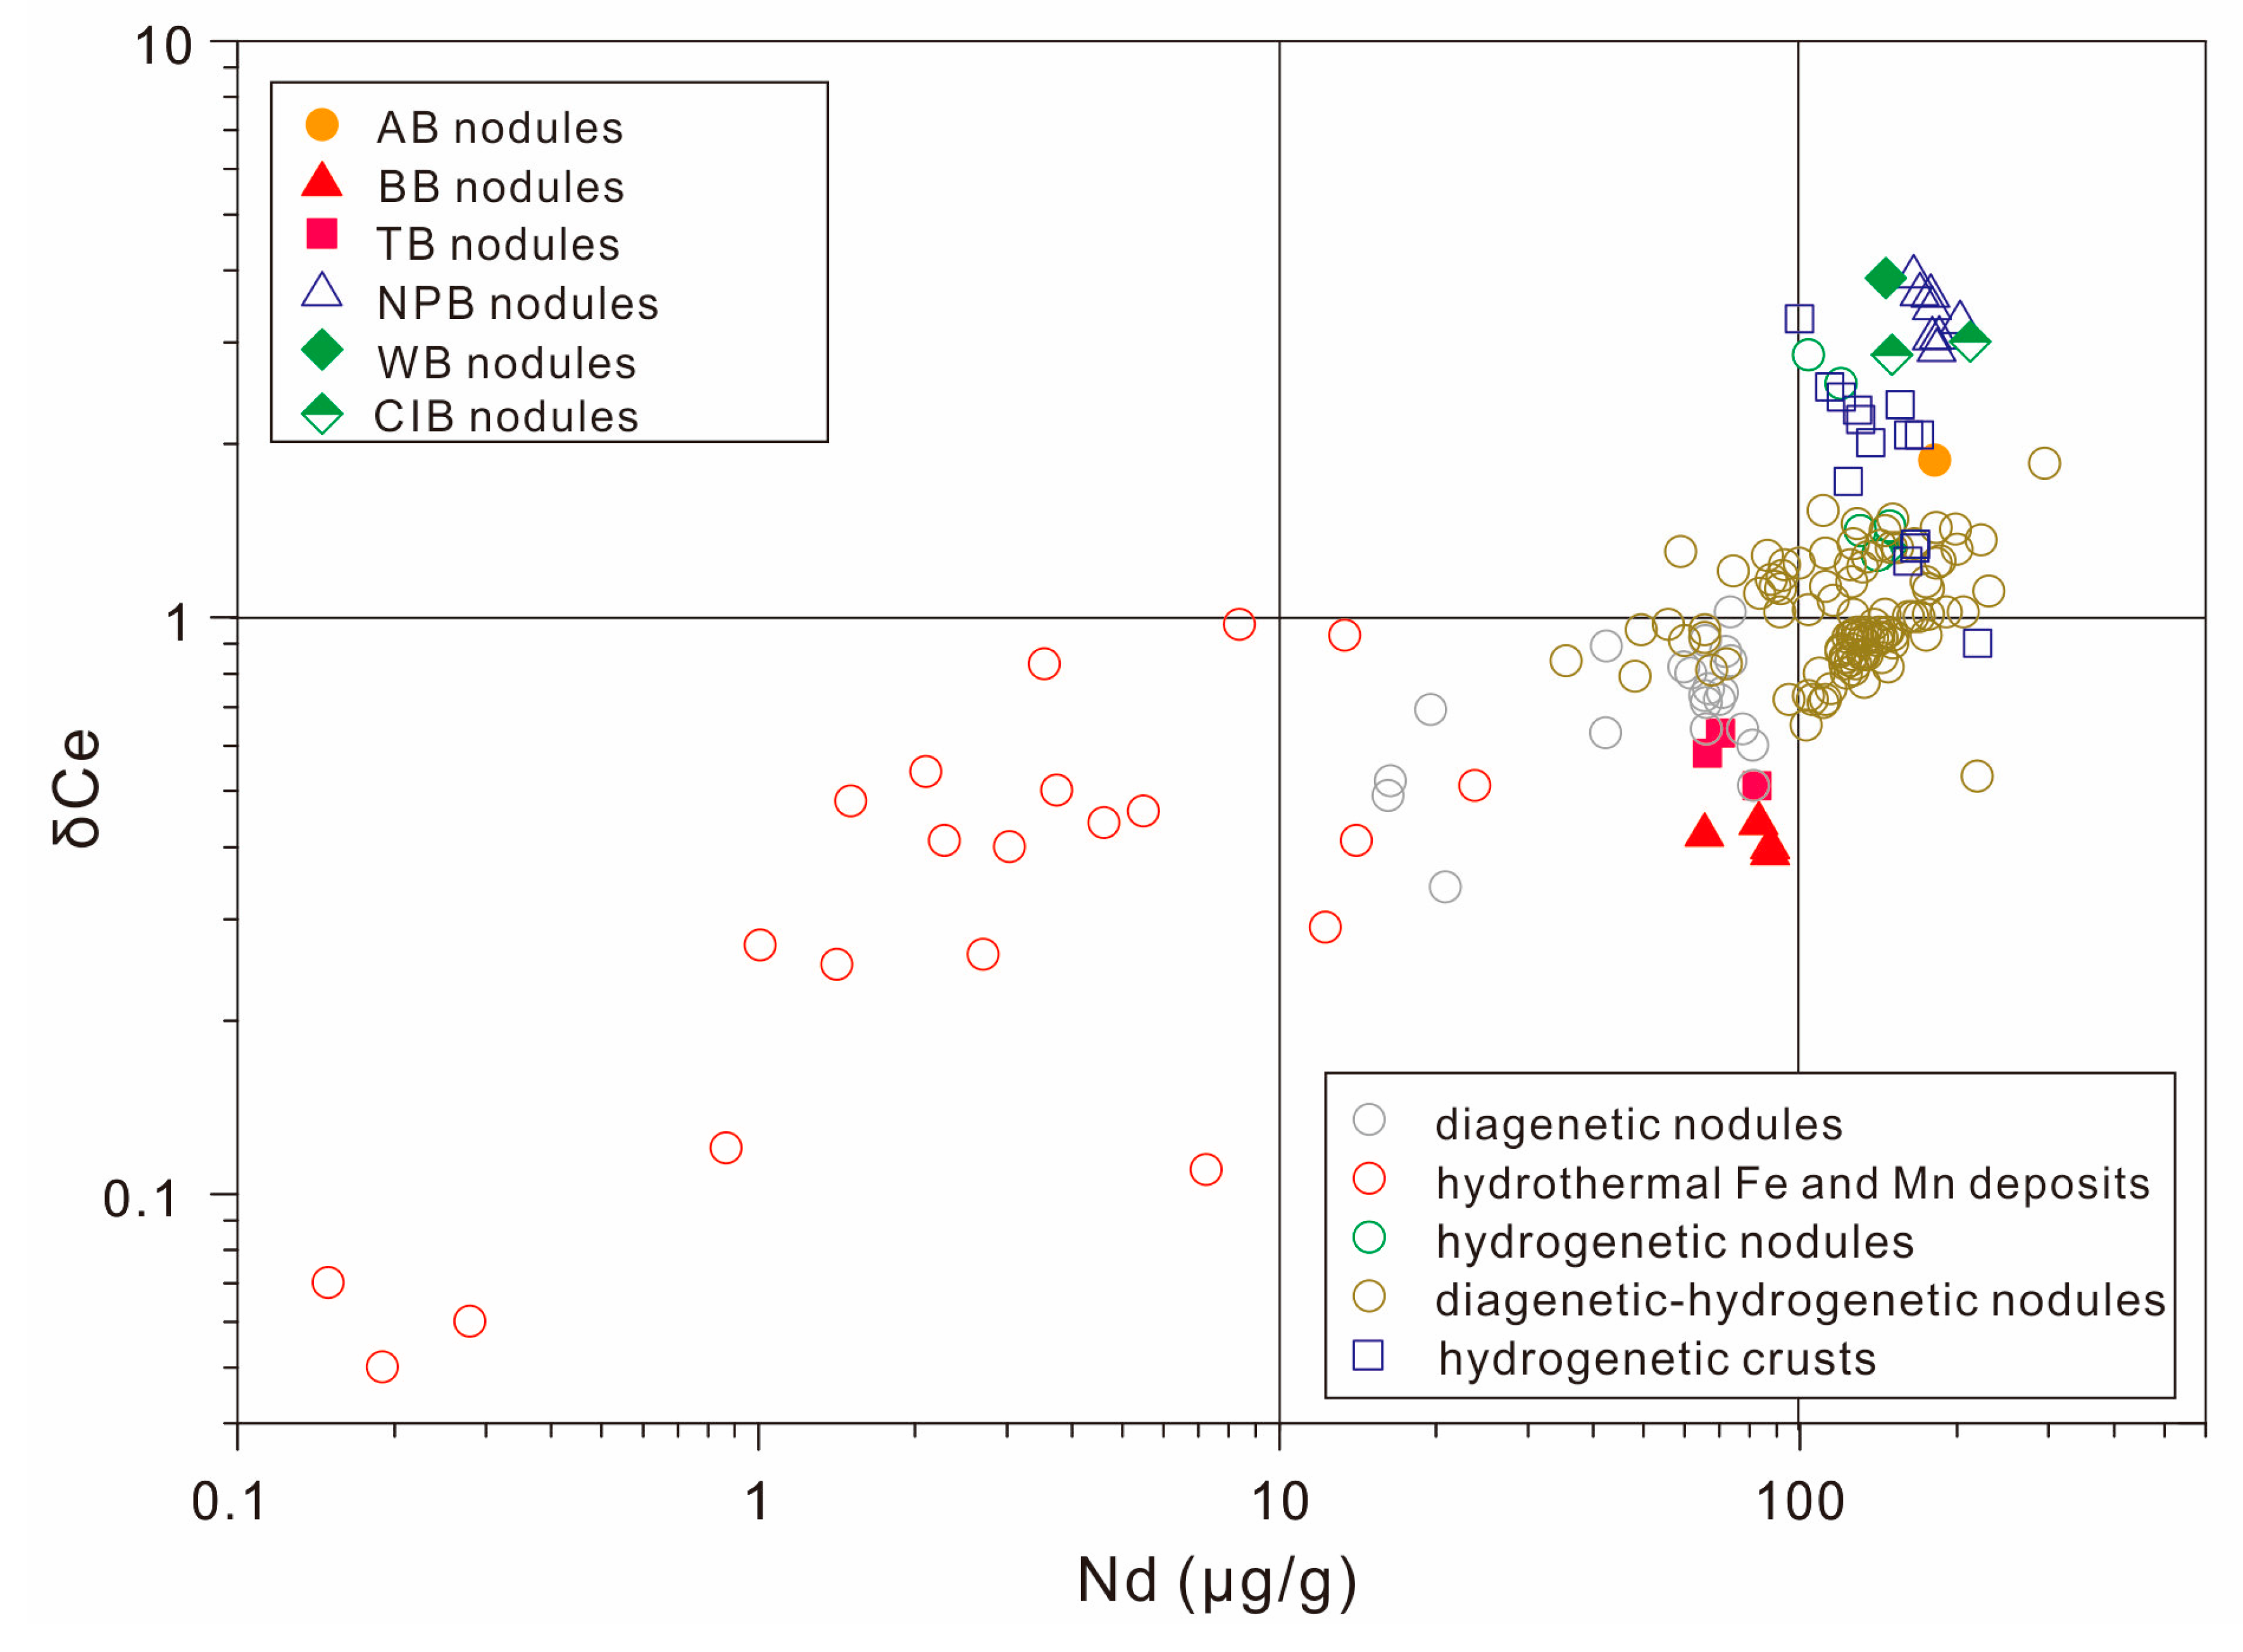
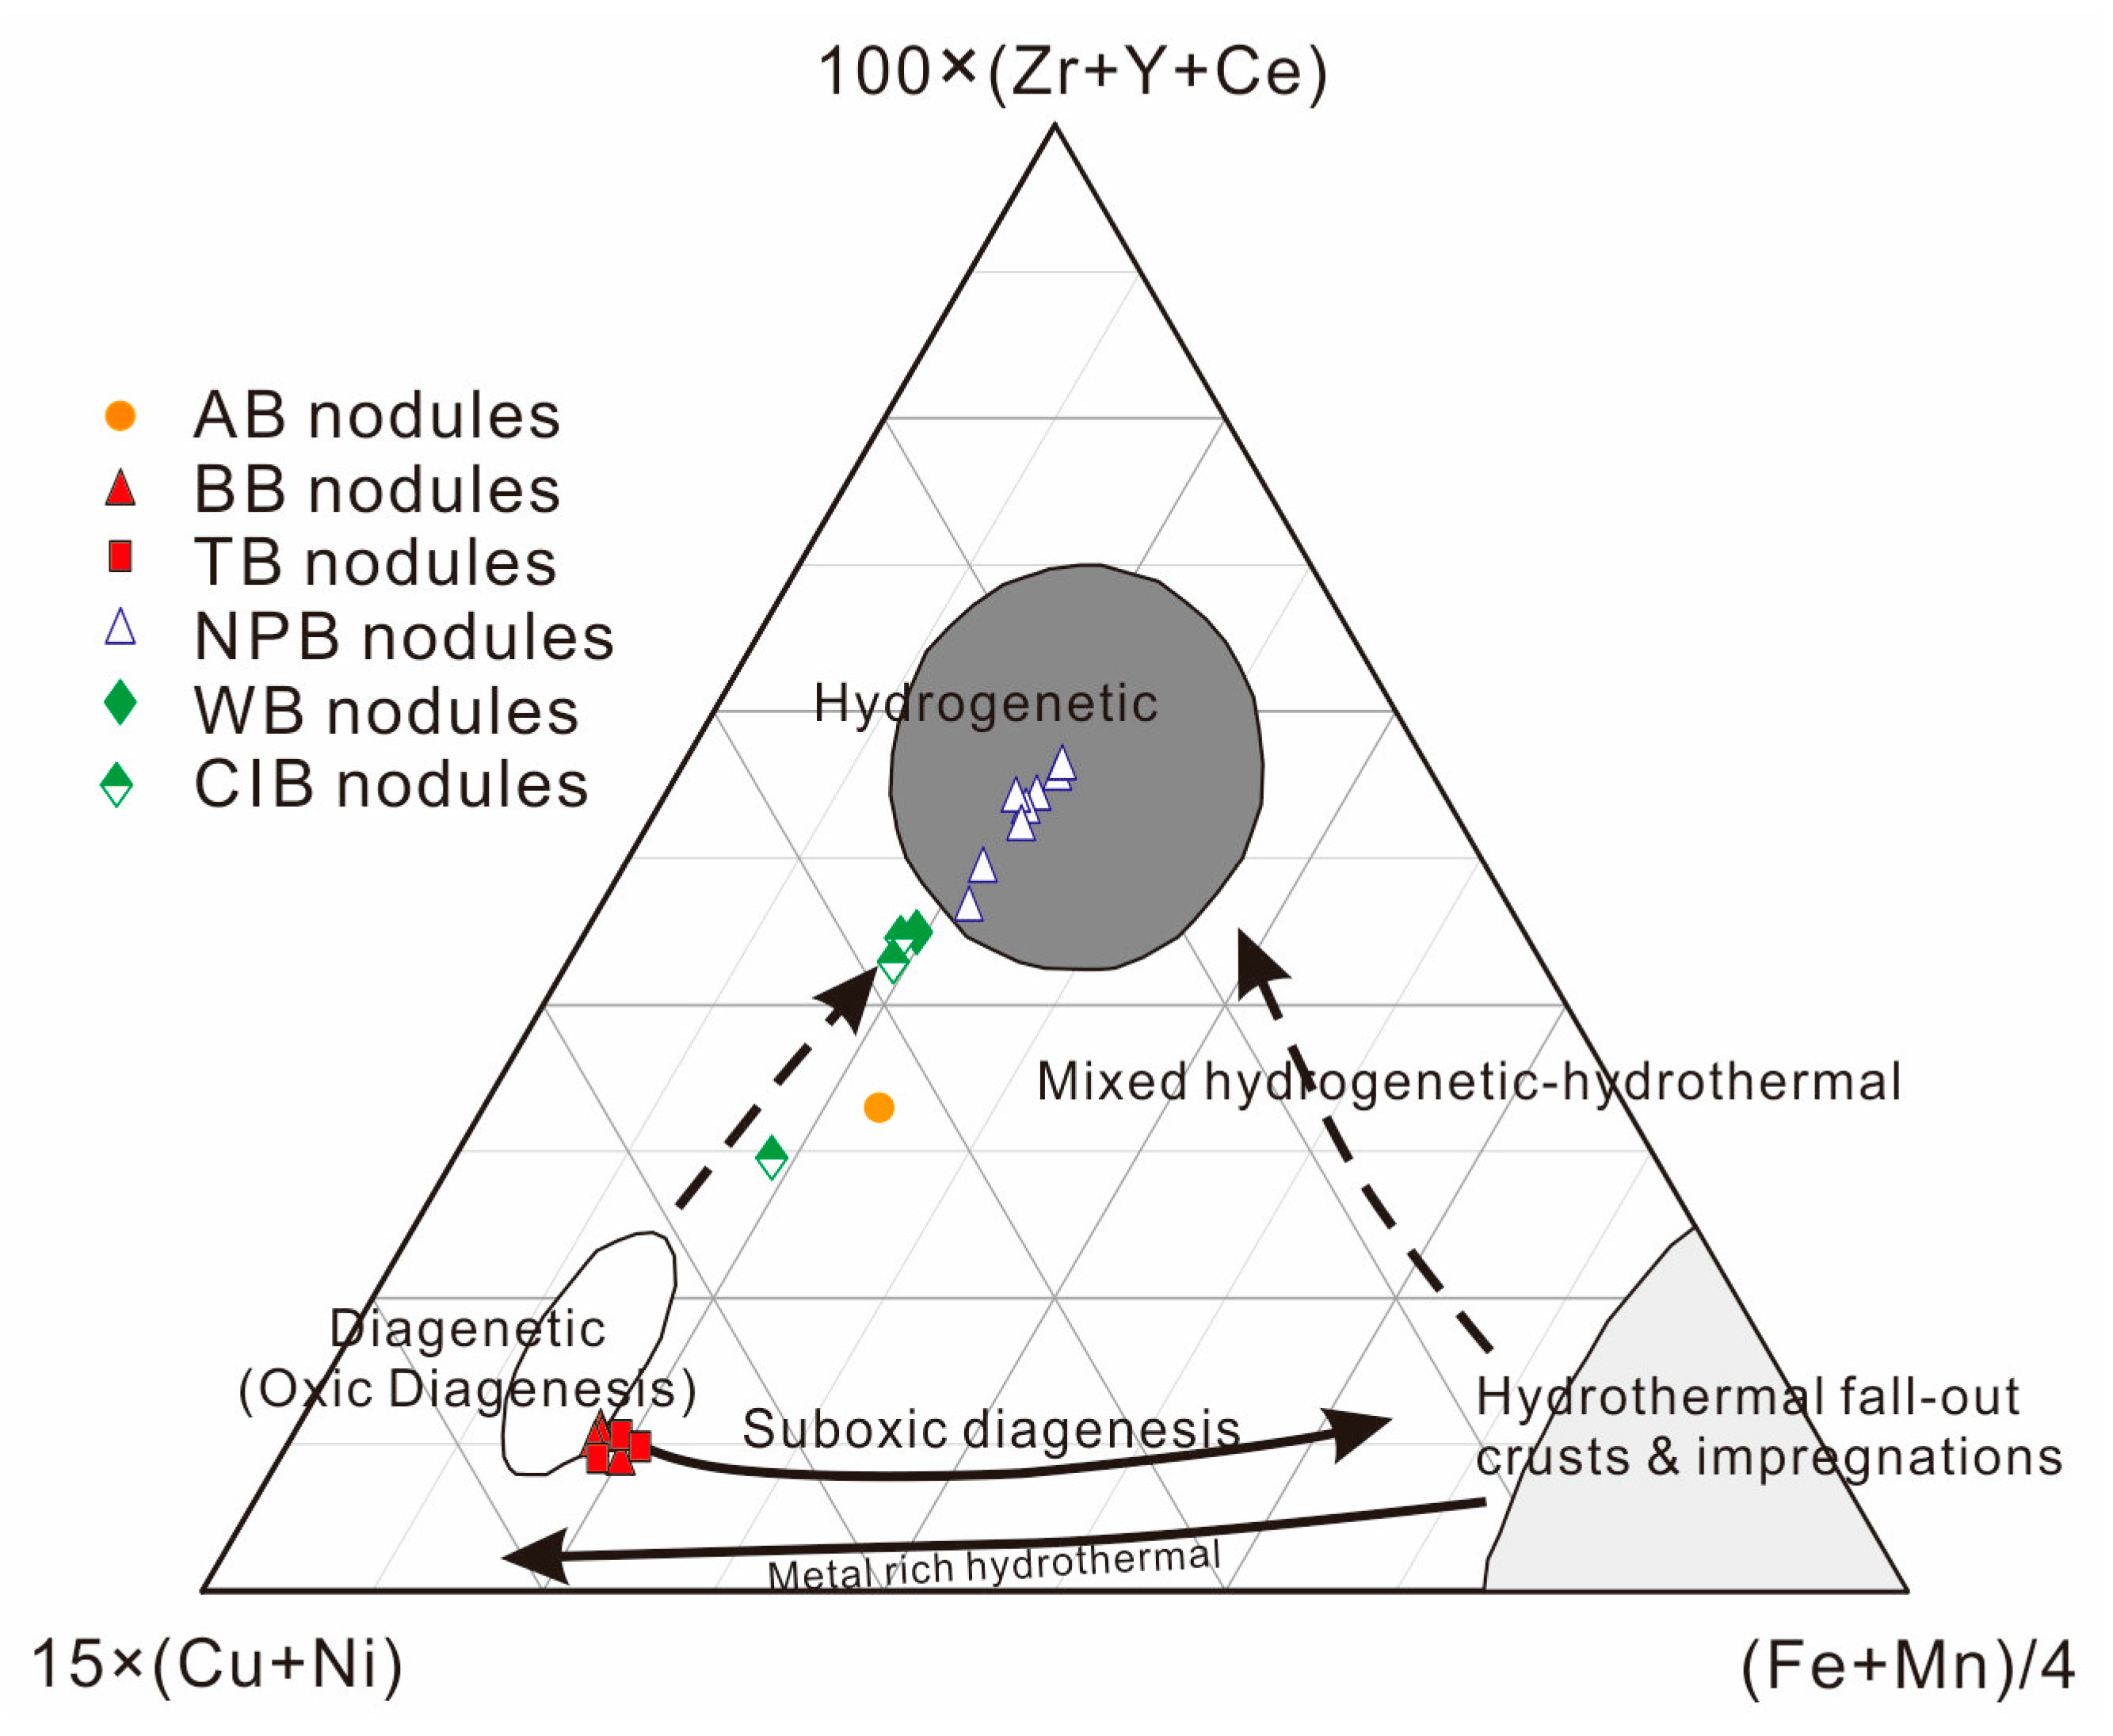
Nodule genesis can be determined by examining the nodule contents of transition metals, trace elements, and REEs, as shown in Figure 6 and Figure 7 [6,7]. As shown in Figure 6, the Nd concentrations and Ce anomalies of nodules from the NPB and WB indicated genesis dominated by hydrogenetic processes. In comparison to nodules collected from the NPB and WB, those collected from the CIB and AB had compositions that indicated the dominance of diagenetic–hydrogenetic processes. The Nd concentrations and Ce anomalies of nodules collected from the BB and TB indicated the dominance of diagenetic processes. As shown in Figure 7, the compositions of nodules collected from the NPB indicated the dominance of hydrogenetic processes, whereas those from the BB and TB indicated diagenetic processes. Nodules collected from the WB and two sites in the CIB had compositions that indicated hydrogenetic processes, whereas those of nodules collected from the AB and the remaining CIB sites indicated hydrogenetic and diagenetic processes, effectively representing nodules of mixed origin. The discrimination of nodule genesis shown in Figure 6 is consistent with that shown in Figure 7, with the latter figure better discriminating between nodules produced by mixed hydrogenetic–diagenetic processes.
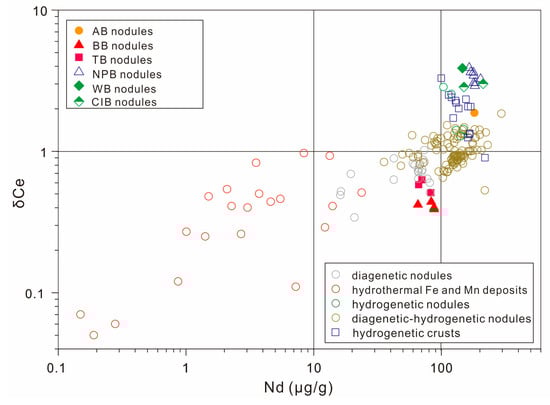
Figure 6.
Discrimination of nodule genesis according to nodule compositions of rare earth elements (REEs) [6]. (The plots shown in this diagram by the upper-left legend represent nodules examined in the present study, whereasthe plots of nodules and crusts of various geneses are data from a previous study [6]).
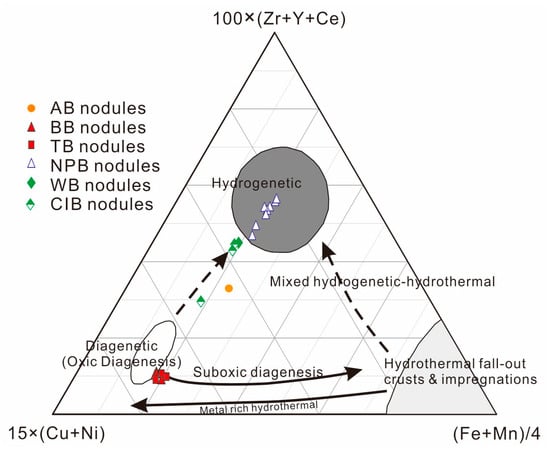
Figure 7.
Ternary discriminative diagram for genetic classification of oceanic ferromanganese deposits [7].
The nodules formed by diagenetic processes in the CCZ and PB consisted mainly of disordered phyllomanganates, and these nodules showed prominent XRD peaks at ~10 Å relative to those of the crust produced by hydrogenetic processes [31]. The nodule genesis discrimination provided by Figure 6 and Figure 7 is consistent with the mineralogy of those nodules. Nodules from the PNB, WB, CIB, and AB showed low XRD intensities at ~10 Å ranging from 72 cps to 136 cps and showed short peaks differing from the background XRD patterns. In comparison, the nodules collected from the BB and TB showed relatively high XRD intensities at ~10 Å ranging from 145 cps to 182 cps andprominent peaks in the XRD patterns. Furthermore, the results of the discrimination of nodule genesis were consistent with the nodule SSA, with nodules in the NPB produced by hydrogenetic processes having a high SSA and nodules in the BB and TB produced by diagenetic processes having a relatively low SSA.
4.2. Correlation Analysis among Transition Metals, Mineralogy, and SSA
The present study investigated the controls on nodule SSA by calculating Pearson correlation coefficients among the concentrations of the transition metals Co, Ni, and Cu, Ce anomalies, and XRD intensities at ~10 Å, and SSA. With an n = 20, correlation coefficients >0.561 or <−0.561 were taken to represent a significant correlation at p = 0.01. As shown in Table 2, nodule SSA showed correlations with the concentrations of Co, Ni, and Cu, Ce anomaly, and XRD intensities at ~10 Å (p < 0.01). SSA was correlated positively with Co concentrations and Ce anomalies with correlation coefficients of 0.895 and 0.706, respectively, whereas it was negatively correlated with Cu and Ni concentrations and XRD intensity at ~10 Å with correlation coefficients of −0.842, −0.879, and −0.875, respectively. Furthermore, XRD intensity at ~10 Å showed positive correlations with Cu and Ni with correlation coefficients of 0.894 and 0.942, respectively. XRD intensity at ~10 Å was negatively correlated with Co, Ce anomaly, and SSA, with correlation coefficients of −0.859, −0.668, and −0.875, respectively.
Table 2.
Correlation coefficient matrix of transition metals, Ce anomalies, X-ray diffraction (XRD) intensity at ~10 Å, and specific surface area (SSA).
The nodule compositions of transition metals, REEs, and minerals suggested that the main processes regulating their geneses included hydrogenesis and diagenesis. Nodules created through hydrogenetic processes showed relatively high Co and Nd concentrations, low Ni and Cu concentrations, positive Ce anomalies, and low XRD intensities at ~10 Å, whereas the opposite compositional patterns were observed for nodules created through diagenesis processes. Nodules produced through mainly hydrogenetic processes, such as those of the NPB, WB, CIB, and AB, showed a relatively high SSA, whereas nodules produced by mainly diagenetic processes, such as those from the BB and TB, showed a relatively low SSA. This pattern of SSA was consistent with the correlation coefficients among the nodule compositions. Therefore, the present study proposes that the SSAs of polymetallic nodules of the global ocean basins are regulated by hydrogenetic and/or diagenetic processes.
5. Summary
Nodules that were produced by mainly hydrogenetic processes showed a relatively high SSA, high Co concentrations, low Ni and Cu concentrations, positive Ce anomalies, and low XRD intensities at ~10 Å, whereas the opposite pattern was observed for nodules produced by mainly diagenetic processes. The SSAs of polymetallic nodules in the global ocean basins, including the Northwest Pacific Basin, Bauer Basin, Tiki Basin, Wharton Basin, Central Indian Basin, and Angola Basin, were significantly correlated with the concentrations of transition metals Co, Ni, and Cu, Ce anomalies, and XRD intensities at ~10 Å. This pattern suggests that nodule SSAs are regulated by hydrogenetic and/or diagenetic processes.
Author Contributions
X.R.: Funding acquisition, conceptualization ideas, Writing–original draft, writing review, and editing. H.L. (Huaiming Li): Methodology and analyzing samples. S.Y.: Data curation and visualization. H.L. (Haonan Li): Investigation. X.S.: Supervision. All authors have read and agreed to the published version of the manuscript.
Funding
This work was financially supported by the Marine S&T Fund of Shandong Province for Laoshan Laboratory under Grant No. 2021QNLM020003-2, and by the China Ocean Mineral Resources R&D Association (COMRA) project under Grant No. DY135-N2-1-04.
Data Availability Statement
Not applicable.
Acknowledgments
We thank the captains and crews of the R/V Dayangyihao and Xiangyanghong01, and the science party members of the Chinese Dayang Cruise DY 42, DY 46, DY 48, and DY 52. The nodule samples in this study were provided by the China Ocean Sample Repository.
Conflicts of Interest
The authors declare no conflict of interest.
References
- Chester, R.; Jikells, T. Marine Geochemistry, 3rd ed.; Wiley-Blackwell: Chichester, UK, 2012; pp. 334–344. [Google Scholar]
- Kuhn, T.; Wegorzewski, A.; Rühlemann, C.; Vink, A. Composition, formation, and occurrence of polymetallic nodules. In Deep-Sea Mining; Chapter 2; Sharma, R., Ed.; Springer: Cham, Switzerland, 2017; pp. 23–63. [Google Scholar]
- Hein, J.R.; Koschinsky, A.; Kuhn, T. Deep-ocean polymetallic nodules as a resource for critical materials. Nat. Rev. Earth Environ. 2020, 1, 158–169. [Google Scholar] [CrossRef]
- Bonatti, E.; Kraemer, T.; Rydell, H. Classification and genesis of submarine iron-manganese deposits. In Ferromanganese Deposits on the Ocean Floor; Horn, D.R., Ed.; National Science Found: Washington, DC, USA, 1972; pp. 159–166. [Google Scholar]
- Halbach, P.; Friedrich, G.; von Stackelberg, U. The Manganese Nodule Belt of the Pacific Ocean; Ferdinand Enke Verlag: Stuttgart, Germany, 1988; p. 254. [Google Scholar]
- Bau, M.; Schmidt, K.; Koschinsky, A.; Hein, J.R.; Kuhn, T.; Usui, A. Discriminating between different genetic types of marine ferromanganese crusts and nodules based on rare earth elements and yttrium. Chem. Geol. 2014, 381, 1–9. [Google Scholar] [CrossRef]
- Josso, P.; Pelleter, E.; Pourret, O.; Fouquet, Y.; Etoubleau, J.; Cheron, S.; Bollinger, C. A new discrimination scheme for oceanic ferromanganese deposits using high field strength and rare earth elements. Ore Geol. Rev. 2017, 87, 3–15. [Google Scholar] [CrossRef]
- Morgan, C.L. Resource estimates of the Clarion-Clipperton manganese nodule deposits. In Handbook of Marine Mineral Deposits; Chapter 6; Cronan, D.S., Ed.; CRC Press: Boca Raton, FL, USA, 2000; pp. 145–170. [Google Scholar]
- TMC. The Metals Company Q4 and FY2022 Corporate Update Call: Unlocking the World’s Largest Estimated Undeveloped Source of Battery Metals; TMC: Vancouver, BC, Canada, 2023. [Google Scholar]
- ISA. ISBA/28/C/9; Decision of the Council of the International Seabed Authority Relating to the Understanding and Application of Section 1, Paragraph 15, of the Annex to the Agreement Relating to the Implementation of Part XI of the United Nations Convention on the Law of the Sea. ISA: Kingston, Jamaica, 2023.
- Hein, J.R.; Koschinsky, A. Deep-Ocean ferromanganese crusts and nodules. In Treatise on Geochemistry, 2nd ed.; Holland, H.D., Turekian, K.K., Eds.; Elsevier: Oxford, UK, 2014; Volume 13, pp. 273–291. [Google Scholar]
- Hein, J.R.; Koschinsky, A.; Bau, M.; Manheim, F.T.; Kang, J.-K.; Roberts, L. Cobalt-rich ferromanganese Crusts in the Pacific. In Handbook of Marine Mineral Deposits; Chapter 9; Cronan, D.S., Ed.; CRC Press: Boca Raton, FL, USA, 2000; pp. 239–279. [Google Scholar]
- Jin, X.L. Marine Geology and Mineral Characteristics of Polymetallic Nodule Belts in the Eastern Pacific; China Ocean Press: Beijing, China, 1997; p. 443, (In Chinese with English abstract). [Google Scholar]
- Hein, J.R.; Mizell, K.; Koschinsky, A.; Conrad, T.A. Deep-ocean mineral deposits as a source of critical metals for high-and green-technology applications: Comparison with land-based resources. Ore Geol. Rev. 2013, 51, 1–14. [Google Scholar] [CrossRef]
- Huh, C.A.; Ku, T.L. Radiochemical observations on manganese nodules from three sedimentary environments in the north Pacific. Geochim. Cosmochim. Acta 1984, 48, 951–963. [Google Scholar] [CrossRef]
- Hein, J.R.; Spinardi, F.; Okamoto, N.; Mizell, K.; Thorburn, D.; Tawake, A. Critical metals in manganese nodules from the Cook Islands EEZ, abundances and distributions. Ore Geol. Rev. 2015, 68, 97–116. [Google Scholar] [CrossRef]
- Li, D.F.; Fu, Y.; Sun, X.M.; Wei, Z.Q. Critical metal enrichment mechanism of deep-sea hydrogenetic nodules: Insights from mineralogy and element mobility. Ore Geol. Rev. 2020, 118, 103371. [Google Scholar] [CrossRef]
- Tamura, H.; Katayama, N.; Furuichi, R. The Co2+ adsorption properties of Al2O3, Fe2O3, Fe3O4, TiO2 and MnO2evaluated by modeling with the Frumkin Isotherm. J. Colloid. Interface Sci. 1997, 195, 192–202. [Google Scholar] [CrossRef] [PubMed]
- Brunauer, S.; Emmett, P.H.; Teller, E. Adsorption of gases in multimolecular layers. J. Am. Chem. Soc. 1938, 60, 309–319. [Google Scholar] [CrossRef]
- Hein, J.R.; Koschinsky, A. Deep-ocean ferromanganese crust and nodules. In Earth Systems and Environmental Sciences, Treatise on Geochemistry, 2nd ed.; Holland, H., Turekian, K., Eds.; Elsevier: Amsterdam, The Netherlands, 2013; pp. 273–291. [Google Scholar]
- Blöthe, M.; Wegorzewski, A.V.; Müller, C.; Simon, F.; Kuhn, T.; Schippers, A. Manganese-cycling microbial communities inside deep-sea manganese nodules. Environ. Sci. Technol. 2015, 49, 7692–7700. [Google Scholar] [CrossRef] [PubMed]
- Stashchuk, M.F.; Chervonetsky, D.V.; Kaplun, E.V.; Chichkin, R.V.; Avramenko, V.A.; Tishchenko, P.Y.; Gramm-Osipov, L.M. Adsorption properties of ferromanganese crusts and nodules. In Open File Report 94-230 of U. S. Department of the Interior and U. S. Geological Survey-Data and results from R.V. Aleksandr Vinogradov Cruises 91-AV-19/1, North Pacific Hydrochemistry Transect; 91-AV-19/2, North Equatorial Pacific Karin Ridge Fe-Mn Crust Studies; and 91-AV-19/4, Northwest Pacific and Bering Sea Sediment Geochemistry and Paleoceanographic Studies; Hein, J.R., Bychkov, A.S., Gibbs, A.E., Eds.; USGS: Menlo Park, CA, USA, 1994; pp. 93–98. [Google Scholar]
- Parida, K.M.; Satapathy, P.K.; Das, N.N.; Rao, S.B. Studies on Indian Ocean manganese nodules Part 2: Physico-chemical characteristics and catalytic activity of heat-treated marine manganese nodules. J. Colloid. Interface Sci. 1996, 179, 241–248. [Google Scholar] [CrossRef]
- Xue, T. Geochemical Characters and Ore-Forming Elements Enrichment Mechanism of Ferromanganese Crusts from Pacific Ocean. Ph.D. Dissertation, Sun Yat-sen University, Guangzhou, China, 2007. (In Chinese with English abstract). [Google Scholar]
- Li, H.N.; Ren, X.W.; Song, Z.J.; Li, H.M.; Wang, W.Y. Studies on analysis conditions of specific surface area of polymetallic nodules. Rock Miner. Anal. 2021, 40, 435–443, (In Chinese with English abstract). [Google Scholar]
- GB/T 19587-2004; Determination of the Specific Surface Area of Solids by Gas Adsorption Using the BET Method (ISO 9277:1995, NEQ). General Administration of Quality Supervision, Inspection and Quarantine of the People’s republic of China and Standarization Administration of the People’s republic of China: Beijing, China, 2004.
- Mclennan, S.M. Rare earth elements in sedimentary rocks; influence of provenance and sedimentary processes. Rev. Mineral. Geochem. 1989, 21, 169–200. [Google Scholar]
- Benites, M.; Millo, C.; Hein, J.; Nath, B.N.; Murton, B.; Galante, D.; Jovane, L. Integrated geochemical and morphological data provide insights into the genesis of ferromanganese nodules. Minerals 2018, 8, 488. [Google Scholar] [CrossRef]
- Park, J.; Jung, J.; Ko, Y.; Lee, Y.; Yang, K. Reconstruction of the paleo-ocean environment using mineralogical and geochemical analyses of mixed-type ferromanganese nodules from the tabletop of western Pacific Magellan Seamount. Geochem. Geophys. Geosystems 2023, 24, e2022GC010768. [Google Scholar] [CrossRef]
- Hassan, M.B.; Rodelli, D.; Benites, M.; Abreu, F.; Murton, B.; Jovane, L. Presence of biogenic magnetite in ferromanganese nodules. Environ. Microbiol. Rep. 2020, 12, 288–295. [Google Scholar] [CrossRef] [PubMed]
- Wegorzewski, A.V.; Kuhn, T. The influence of suboxic diagenesis on the formation of manganese nodules in the Clarion Clipperton nodule belt of the Pacific Ocean. Mar. Geol. 2014, 357, 123–138. [Google Scholar] [CrossRef]
Disclaimer/Publisher’s Note: The statements, opinions and data contained in all publications are solely those of the individual author(s) and contributor(s) and not of MDPI and/or the editor(s). MDPI and/or the editor(s) disclaim responsibility for any injury to people or property resulting from any ideas, methods, instructions or products referred to in the content. |
© 2023 by the authors. Licensee MDPI, Basel, Switzerland. This article is an open access article distributed under the terms and conditions of the Creative Commons Attribution (CC BY) license (https://creativecommons.org/licenses/by/4.0/).