Article

Comparison of the Analytical Performance of Inductively Coupled Plasma Mass Spectrometry and Instrumental Neutron Activation Analysis Techniques in the Elemental Analysis of Coal Fly Ash

Laboratory of Nuclear Analytical Techniques, Institute of Nuclear Chemistry and Technology, 03-195 Warsaw, Poland
*
Author to whom correspondence should be addressed.
Minerals 2023, 13(12), 1484; https://doi.org/10.3390/min13121484
Submission received: 25 September 2023 / Revised: 20 November 2023 / Accepted: 20 November 2023 / Published: 24 November 2023
(This article belongs to the Special Issue Ashes: Characterisation, Recovery and Utilization)

Abstract

:
Inductively coupled plasma mass spectrometry (ICP-MS) and instrumental neutron activation analysis (INAA) were applied to study the elemental content of coal combustion residues. Both methods’ analytical applicability and suitability for this type of material were described in detail. A certified reference material, fine fly ash (CTA-FFA-1), was used to examine the capabilities and validation of both methods. A comparison study allowed for the modification of the procedures for these materials (previously elaborated in the Institute of Nuclear Chemistry and Technology), resulting in more accurate data with lower uncertainty. We highlighted that INAA and ICPs complemented each other in the analysis of coal and coal combustion residues. The digestion procedure was an integral part of the measurement and affected the environmental analysis results. Both methods were applied to the chemical characteristics of coal ashes from household furnaces. The hard coal was from Polish, Columbian, and Kazakh mines. The majority of elements had similar concentrations, independently of coal origin. Because ash from domestic coal combustion is used as a fertilizer or an anti-icing agent, we assessed the potential environmental impact via leaching experiments (according to PN-EN 12457-2). The potential risk of soil contamination due to ash dumping around the house and its surroundings was determined as insignificant (for the elements investigated).

1. Introduction

The analysis of ash from coal combustion currently has two main functions:
  • To study the impact of its storage/use on the environment.
  • The possibility of assessing its potential use as a source of valuable and/or rare elements, e.g., rare earth elements (REEs) [1,2,3,4].
Poland is one of 17 EU countries that employed coal as an energy resource over the past year; coal remains significantly dominant in the domestic energy mix, consisting of well over 70% of the share. The number of households heated with solid fuel exceeds 3 million in Poland. Around 13 million tonnes of coal are burnt in household furnaces, resulting in waste in the form of slag and ash of over 2.5 million tonnes per year (Poland accounts for 87% of coal burned in EU households) [5,6].
For many years, the majority of all hard coal for domestic power and industrial purposes originated from Poland. However, in the last few years, changes imposed by climate policy, and the profitability of exploiting Polish hard coal deposits, resulted in a significant increase in hard coal imports from Russia. The current political and economic situation caused by the war in Ukraine (II 2022) caused the coal import from Russia to become impossible in Poland. As reported by the Ministry of Climate and Environment in the first half of 2022, coal imports to Poland were from more than 15 countries. Among the suppliers to the Vistula were Australia, Belarus, China, Indonesia, Canada, Kazakhstan, Kyrgyzstan, Colombia, Mozambique, Norway, South Africa, Russia, the United States, Ukraine, and the United Kingdom [7].
During the winter, the average coal-fired household produces large amounts of ash. According to current legislation, the municipality is responsible for the disposal of ash and slag; hence, the municipality determines how to deal with waste generated by domestic central heating [8]. Many municipalities organize regular collection of ash and slag from residents. Other municipalities allow residents to dispose of their residual firewood in mixed waste bins. However, many people sprinkle the ash on access roads around their farmyard to prevent slipping during the winter season. Assuming that the heating season in Poland lasts approx. 4–5 months, the amount of ash entering the environment from individual households can be significant.
Depending on the origin of the hard coal, ash and other coal combustion residue (CCR) properties can vary significantly both in terms of calorific value and the presence of potential impurities [4,9,10,11]. Leaching studies should also give some information about the possibilities of potential hazards associated with the extraction of toxic metals and their penetration into the soil and, in turn, into plants and the human food chain [12,13,14]. In recent years, other materials have been sought as an alternative source of valuable elements. Reducing the consumption of non-renewable natural resources and replacing them with industrial waste is one of the most important aspects of a sustainable development strategy. Fly ash is recognized as a potential source of rare earth elements [2,4,12,15]; however, the efficient extraction and isolation of valuable lanthanides remain elusive to date. In known cases, the described processes are too energy- and labor-intensive and involve the introduction of additional chemicals into the environment. Hence, novel and innovative methods for the extraction of lanthanides from ashes, and their selective separation and concentration, are a topic of many research groups.
Chemical analysis, especially the determination of elements important for their strategic significance and human and environmental safety, is a vital part of scientific research as well as commercial analysis. There are several instrumental methods routinely utilized in determining the minor (0.1–1%) and trace (<0.1%) elements of CCRs: inductively coupled plasma mass spectrometry, ICP-MS; inductively coupled plasma optical emission spectroscopy, ICP-OES; X-ray fluorescence, XRF; and the less commonly used single-element atomic absorption spectroscopy, AAS [9,10,11,12,13,14,15,16,17].
Each analytical technique has particular advantages and disadvantages that make it suitable (or unsuitable) for a given application. ICP-MS is characterized by high sensitivity and precision, the possibility of simultaneous determination of multiple elements, selectively allowing for the determination of individual isotopes of a given element in complex matrices, low limits of detection (for solutions at the level of pg/L) obtained owing to high plasma ionization efficiency, and the wide-ranging straightness of the calibration curves. Hence, it is possible in a single measurement to determine both trace elements and macro-components. The main limitations of this technique are the following: complex acid digestions required of the sample, the formation of possible interferences, and high operating costs [18,19].
Contrary to ICP-MS, instrumental neutron activation analysis (INAA) is a non-destructive technique, which is very useful for materials that are “difficult-to-digest”, such as coal combustion residues. INAA’s primary advantages are the following: matrix independent and multi-element technique, unaffected by errors associated with yield determinations, high precision and accuracy, and very low detection limits for 30–40 elements with high sensitivity. Additionally, after INAA analysis, the sample can be further analyzed by other techniques [20,21].
INAA, in the analysis of coal and its combustion residues, is treated primarily as a reference method, allowing confirmation of the quality of results obtained by other methods. For some elements (e.g., Au and Sc- due to their nuclear properties), it can be used as a first-choice method [22,23].
The comparison of the applicability of ICP-MS and INAA for the study of the chemical composition of various matrices has been described in several articles [24,25,26,27]. However, they do not consider the determination of trace elements in ashes and coal combustion residues. The majority of these articles are several years old, when the instrumental capabilities of ICP-MS were far less than they are today. Moreover, the INAA technique is also becoming a less and less popular approach due to research reactors (an essential source of neutrons) being shut down. Nevertheless, more than a dozen papers on the complementary application of ICP-MS and INAA in geological, archaeological, medical, and industrial research are published annually [28,29,30,31]. The Institute of Nuclear Chemistry and Technology (INCT), as one of the few scientific centers in the world, possesses and develops both ICP-MS and INAA [32,33,34].
In this study, a comparison between non-destructive INAA and destructive ICP-MS for the determination of elemental content in ashes (while considering the metrological issues of both methods used for the analysis of this type of material) was investigated. The elemental content in the ash samples collected from individual domestic furnaces (east part of Poland) and its potential environmental impact was also presented.

2. Materials and Methods

2.1. Samples and Reagents

The hard coal was delivered to the village households (by the coal sale intermediary) from Polish, Columbian, and Kazakh mines. Coal ash from household furnaces was collected in heating seasons 2019/2020 and 2022/2023. In the 2022/2023 heating season, imported coal from Kazakhstan or Colombia was practically available on the market for residential customers. Samples were taken from houses built by a sole developer; houses had the same type of furnaces (class 4). Samples were obtained from individual households who declared they had burned a particular type of coal in the last month before the ash was collected for testing. For each type of coal, approx. 0.2–0.3 kg of ash was extracted from a single furnace. The ash was sieved, homogenized, and a sample was taken by quartering. The ash collected in the 2019/2020 season came from the combustion of Polish coal mined in the Silesia region. Ash was collected from burning Polish (n = 7), Kazakh (n = 5), and Colombian coal (n = 4). Certified reference material CTA-FFA-1 was used for analytical procedures’ validation. Nitric acid (Chempur, Piekary Śląskie, Poland) was purified by a quartz sub-boiling distillation system. Suprapur-grade hydrofluoric acid 40% (Merck) was used for sample digestion. All other reagents used in this study (30% H2O2 and H3BO3 (Chempur) were of analytical grade. Furthermore, high-purity water (18 MΩ cm resistivity) was used (Millipore Co., Burlington, MA, USA) to prepare all solutions.

2.2. Apparatus

To prepare the samples and CRMs, analytical (Sartorius MC5) and micro-analytical (BP221S) balances, calibrated using the national mass standards traceable to the international standards, were used. The Multiwave3000 high-pressure microwave system (Anton Paar GmbH, Graz, Austria), equipped with temperature and pressure regulation, was used for the digestion of samples. ICP-MS instrument: an ELAN DRC II (Perkin Elmer) with a crossflow nebulizer, a Scott double-pass spray chamber, and Pt cones was used in all measurements. An HPGe well-type detector (Canberra), with a relative efficiency of 55% and energy resolution of 2.1 keV for the 1332 keV peak of 60Co, coupled to Gennie 2000 spectroscopy software (Canberra), was used for gamma-ray measurements.

2.3. Sample Digestion Optimization

Microwave digestion (procedure A): Digestion of the sample (c.a. 250 mg, 6 mL HNO3 + 2 mL HF) was carried out in a microwave high-pressure system under controlled conditions. The resulting solution was transferred into a 50 mL PFA volumetric flask and submitted for analysis.
To prevent losses of some elements and to remove fluoride ions, the following modifications of this procedure were introduced:
Microwave digestion (procedure B): Procedure as described above (A), with the removal of fluoride ions by evaporation on a hot plate with hydrochloric acid with the addition of 2 mL of 4% H3BO3.
Microwave digestion (procedure C): Procedure as described above (A), with the removal of fluoride ions in the microwave digestion system by adding 6 mL of 4% H3BO3 to the microwave vessel after the first step of digestion.

2.4. Neutron Activation Analysis

Samples, CRM, and standards were weighed into polyethylene (PE) capsules and sealed. The irradiation package consisted of samples, CRMs, standards, and an empty capsule (blank) wrapped together in aluminum foil. Neutron activation was performed in a MARIA nuclear reactor (Świerk, Poland) with a thermal neutron flux of 1014 n·cm−2·s−1 for 30–50 min. The cooling time was 1–7 days.

2.5. Microwave-Assisted Digestion and ICP-MS Measurements

Sample digestion was carried out using a Multiwave3000 high-pressure microwave system. Known amounts of ash (100–150 mg) were weighed into Teflon vessels, and a mixture of concentrated HNO3, H2O2, and HF was added. In the second step, 6 mL of 4% H3BO3 solution was added to the sample for fluoride removal. An ELAN DRC II inductively coupled plasma quadrupole mass spectrometer was used for ICP-MS measurements. The measurement parameters applied had a radio frequency (RF) power of 1000 W, lens voltage of 5.75 V, plasma gas flow of 13 L·min−1, auxiliary gas flow of 1.2 L·min−1, nebulizer gas flow of 0.89 L·min−1, measurement mode—standard, cones—Pt, Scott spray chamber, and a crossflow nebulizer.

2.6. Leaching Experiments

Batch leaching experiments were conducted using all analyzed samples. Deionized water was used to test the mobility of selected elements from the ashes according to PN-EN 12457-2 (2006). The sample (approx. 5 g) was added to 50 mL of appropriate solution, then it was mixed and stirred for 24 h at room temperature. Then, the supernatant solution was centrifuged and filtered through a 0.25 mm syringe filter. After acidification, samples were measured with ICP-MS.

3. Results and Discussion

Currently, several publications are related to the determination of major and trace elements in coals and ashes. Fly ashes are considered a potential source of contamination due to the enrichment and surface association of trace elements in the ash particles [35]. On the other hand, ashes from industrial coal combustions are recognized as an alternative source of REEs [4,36,37]. Whatever the purpose of determining trace elements in ash, the results should be reliable and useful for specific applications [38,39]. ICP-MS has become one of the most widely used analytical techniques when considering issues related to the chemical analysis of ashes, especially the determination of trace metals.

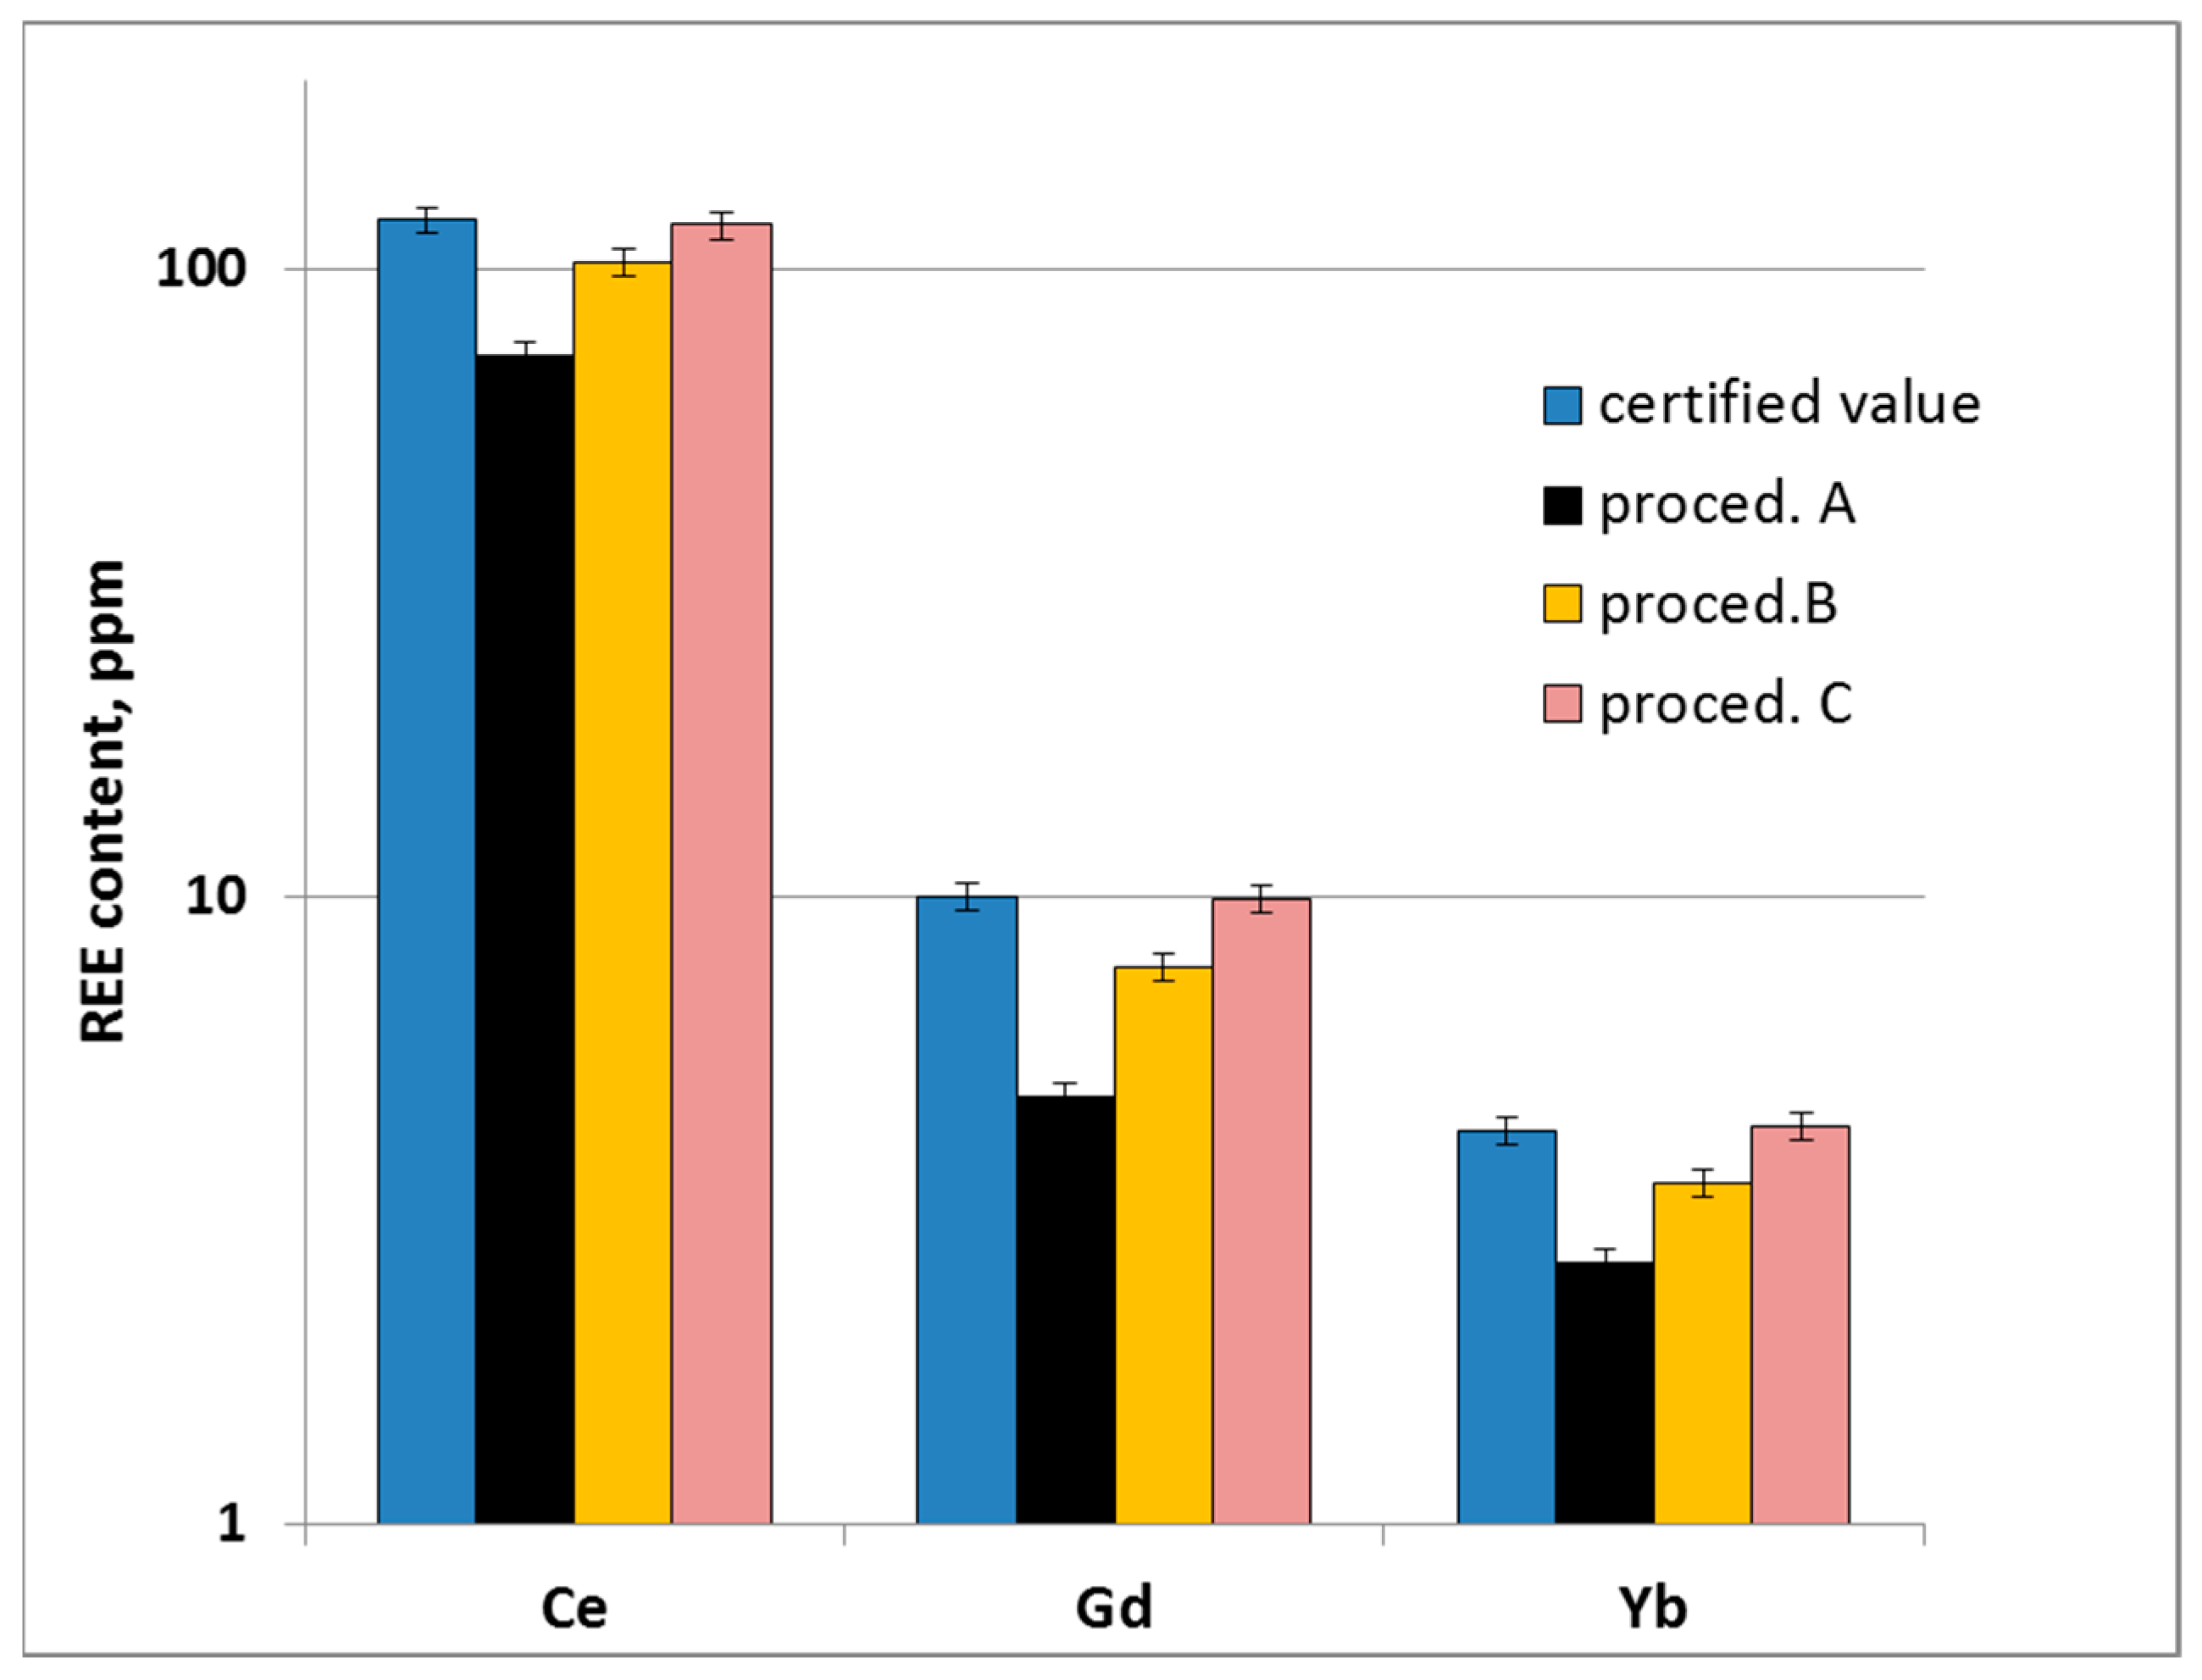
3.1. Optimization of the Sample Microwave Digestion

To achieve accurate determination of elemental content by ICP-MS, complete digestion is essential in the analytical procedure [40]. Because this approach is a solution technique, an important step is the quantitative solution of the sample, which, in the case of coal combustion residue analysis, can be a source of loss of selected analytes, the introduction of contaminants in the decomposition of the sample, etc.
One way to obtain the total decomposition of samples with a complex matrix is fusion with sodium peroxide. Fusion with lithium borate can also be applied, particularly for laser ablation LA ICP-MS [41,42]. However, issues do arise, including the fact that some materials are more resistant to laser ablation than others. Furthermore, it requires extra steps to improve the ablation yield. Microwave-assisted acid digestion is an alternative to alkaline fusion for geological/industrial/environmental samples. Optimal amounts of nitric acid, hydrofluoric acid, and their mixture were evaluated for total digestion of ash samples. For the analysis of coal and ash for trace elements (including REEs), sample digestion was carried out according to the guidelines of ASTM D6357-11 [43]. This standard lists the following elements: antimony, arsenic, beryllium, cadmium, chromium, cobalt, copper, lead, manganese, molybdenum, nickel, vanadium, and zinc. Therefore, determining REEs after the sample was digested using the method described may be inaccurate. However, in 2021, the standard was revised, with additional guidance on specific test methods that pertain to the determination of rare earth elements in coal and coal combustion residues [44].
During the digestion of coal and coal combustion products with concentrated acids, it was necessary to add hydrofluoric acid. To avoid losses of volatile fluoride-forming analytes (e.g., U, REEs), it was essential to remove fluorides from the digested samples. Figure 1 shows the influence of H3BO3 addition on the recovery of selected values in CTA-FFA-1.
The determined values from a single microwave digestion in a mixture of concentrated HNO3 and HF, without fluoride removal, were lower than the certified value of approx. 35–40% (procedure A). When the diluted sample was evaporated with hydrochloric acid with the addition of 2 mL of 4% H3BO3, REE content was still lower than the certified values, with an average recovery of approx. 85% (procedure B). Quantitative determination was observed when 6 mL of 4% H3BO3 was added to the microwave vessel after the first step of digestion, and the second microwave complexification of residual fluorides occurred (procedure C).

3.2. Analysis of Certified Reference Material CTA-FFA-1

In the case of the determination of some essential elements (toxic or of strategic importance), it is necessary to have analytical methods that provide results with as little uncertainty as possible. This is especially important when legislative, environmental, commercial, etc., decisions are made based on the analytical results obtained.
Comparing analytical methods for trace elements could be problematic in some cases because each technique has merits and limitations [38,39,40]. The following factors were considered during the comparison study: multi-elemental analysis ability, sample matrix and available sample amount, speed and cost, sensitivity and accuracy, etc.
The results obtained during the analysis of CRM for CTA-FFA-1 using ICP-MS and INAA are presented in Table 1. There was a strong agreement between the results obtained by INAA and ICP-MS and the certified values. In the case of ICP-MS, the obtained results indicated that the digestion procedure was properly carried out.
In typical INAA conditions, the analytical capabilities for the determination of individual elements were much greater than those introduced in Table 1; at least 10 more elements could be determined with low uncertainty (i.a., Al, Ca, Cl, Mg, Ti, V, Dy, Er, and Tm). These elements formed short-lived isotopes, and for their irradiation and measurements, a pneumatic transfer system (Rabbit) had to be applied. Regrettably, the Polish Maria research reactor was not equipped with a pneumatic sample transfer system allowing for the determination of short-lived isotopes. In addition, the reactor was located about 20 km from the analytical laboratory, which in practice means that there is a possibility of the quantitative determination of isotopes with a half-life of approx. 2–3 h (e.g., macro-quantities of 54Mn). The determination of Pb by INAA was practically impossible as it is not activated to a measurable extent by neutron absorption. The analytical capabilities of ICP-MS were theoretically greater, as dozens of elements at different concentration levels could be determined in a single, short measurement (1–3 min).
For quality control of the obtained results, the z-score or standardized difference values were calculated [45].
The value of the z-index was calculated using Equation (1):
z = x m e t x C R M σ ^
where xmet—result obtained using the particular method, xCRM—certified value, and σ ^ —relative standard deviation calculated from the Horwitz formula:
σ ^ = 0.22   c   ( for   c < 1.2 × 10 7 ) , σ ^ = 0.22   c 0.8495   ( for   1.2 × 10 7 c 0.13 ) , σ ^ = 0.01   c 0.5   for   c > 0.138 ,
where c—concentration in g·g−1.
The z-score values presented in Figure 2 indicate |z—score|< 2, which means that the analytical results obtained by ICP-MS and INAA were within the ranges of certified data at a 99% confidence level.
Based on the results of the FFA-1 analyses, an uncertainty budget was prepared for the two methods used in this study.

3.2.1. Estimation of the Uncertainty Budget for Ash Analysis by ICP-MS and INAA

The accuracy of a chemical analysis can only be accepted together with its established uncertainty of measurement. Different approaches can be applied for estimating the uncertainty; “the bottom-up” approach is widely used. This concept includes identification, estimation, and quantification of all uncertainty sources throughout the entire analytical procedure. Then, all the obtained uncertainty values are combined to estimate the combined standard uncertainty. Considering the uncertainty values that were estimated for both methods for each element, differences between ICP-MS and INAA were observed. Relative combined standard uncertainties varied significantly depending on the analyte, its concentration, blank levels, and the presence or absence of the interferences.

INAA

The specific parameters that influenced the uncertainty of obtained results by INAA are illustrated in Figure 3. The standard uncertainties within particular categories in relation to individual sources of uncertainty were quantitatively evaluated and expressed in SI units [46].
In the case of INAA, the sources of standard uncertainty ui were divided into three groups: (1) preparation of the samples and standards; (2) irradiation in the neutron flux in the nuclear reactor; and (3) γ-ray spectrometric measurements [47,48].
In the first step, only the weight of uncertainty from the balance’s specification and the uncertainty in the purity of the standards obtained from the manufacturer’s specifications were considered. Relative standard uncertainty in relation to the preparation of samples and standards u1 was estimated as 0.1–0.2%. Elemental standards consisted of high-purity compounds using analytical balances calibrated by national standard weights traceable to the international standard of mass. An ash sample was also weighed using a calibrated balance. The other sources of uncertainties in the preparation step, i.e., change in ash mass during weighing, purity and stoichiometry, variation of isotopic abundance, and residual blank, were neglected. Uncertainties due to the presence of impurities in activation vessels, which may affect the final result, are evaluated in some laboratories during sample preparation [49,50]. In the INCT protocols, an empty vessel is irradiated as a blank, and mathematical corrections are made. Impurities in vials are recognized as an uncertainty factor in the gamma ray measurement [34].
The main uncertainty sources during the neutron irradiation in the nuclear reactor were as follows: differences in the irradiation positioning of the sample and standard, neutron self-shielding and scattering, possible occurrence of nuclear reactions, the formation of interfering isotopes, and volatile element losses. The applied irradiation process used the following sandwich-type configuration: the samples were placed between two standards/comparators; the standard uncertainty due to flux inhomogeneity was estimated to be below 0.1% (type A). Self-shielding and scattering effects were not expected to occur in the coal and coal combustion residues. The content of elements with high absorption cross-sections and high-density materials was between low and very low; thus, self-shielding was practically negligible. Scattering could be important for elements with very low Z values. The standard uncertainty due to thermal neutron self-shielding and scattering was evaluated below 0.2% (type B), which depended upon the measured nuclide and was insignificant in many cases.
Nuclear reaction interferences mainly concern irradiation not by thermal neutrons but by fast neutrons. For example, during Co determination by INAA, the following interfering nuclear reactions were considered: 60Ni (n,p) 60Co and 63Cu (n,α) 60Co. The interference contributions of these reactions were measured, and appropriate corrections were introduced. When the low concentration of Cu and Ni in analyzed coals and ashes was considered, the uncertainty from the corrections for the interfering nuclear reactions were neglected. Similarly, in the case of a high U content, corrections for lanthanides determination were introduced. U fission results in the formation of lanthanide isotopes, which were employed for their quantification. Therefore, it was obvious to introduce the correction for radionuclides formed in the U(n,f) reaction. Two standards containing 1 µg of U each were irradiated together with standards of those elements that were formed in the U(n,f) reaction. It was shown that the quantities of the elements originating from 1 mg of U amounted to 8.25 × 10⁻² µg La, 4.12 × 10⁻¹ µg Ce, 1.56 × 10⁻¹ µg Nd, and 4.74 × 10⁻² µg Sm.
Uncertainty originating from volatilization losses was neglected; this was especially relevant for halogens and Hg, which were not determined in this study. A standard uncertainty connected with the irradiation was estimated as 0.1–1.5%. Similar standard uncertainty values during neutron irradiation were obtained for food samples and geological and environmental materials [47,49,50].
In the γ-ray spectrometry measurement, at least 10 sources of uncertainties were found [25], of which only 3 significantly contributed to the uncertainty budget: counting statistics, counting geometry differences, and peak integration method.
Counting statistics for the sample and standard were the most critical in this group. The uncertainty introduced due to the counting statistics in both samples and standards was calculated from the Poisson distribution: u = 100(Np + 2B)1/2/Np, where B is the background and Np the net peak area. Depending on the number of counts for the selected element, and the impact of the Compton continuum on the baseline, the standard uncertainty varied between 0.5% and 20% for small peaks slightly higher than the detection limit. Uncertainty from the counting geometry was evaluated from the repeated measurements of the same sample at a given geometry and repositioning after each measurement. The relative uncertainty was calculated as 0.3–5% using triangular distribution.
The uncertainty in the calculation of peak areas in the gamma-ray spectra using Gennie 2000 software allowed for the evaluation of the differences between peak areas calculated by the software and by hand integration channel-by-channel, assuming that the rectangular distribution for both the sample and standard (type A) was between 0.3% and 10%. For single peaks, the uncertainty of long-lived isotopes was calculated as below 1%, and the differences between the software and hand integration were negligible. In the case of multiple small peaks, the differences between both methods were higher, and the contribution of uncertainty was also higher (up to 10%).
Other sources of uncertainty associated with gamma-ray spectrometric measurement are the following: pulse-up losses, cascade summing, effects of dead-time and decay timing, and blank correction; they are practically below 0.5% and could be neglected.
The biggest uncertainty was related to Cr determination, due to its presence in the irradiation vials. When Cr content in the sample was low, its presence in the vessel produced high uncertainty. Measuring a blank (empty vessel) and making appropriate mathematical corrections was necessary. For Cr in the tested ashes, the expanded uncertainty U (k = 2) was estimated as 10%.
For the chosen REE, the expanded uncertainty was higher than for other lanthanides. As a result of the reaction of neutrons with U (U(n,f)), lanthanide isotopes were formed as fission products, the content of which was the basis for their quantification. Therefore, with each irradiation, it was necessary to determine the amount of lanthanides formed from the irradiation of U and then make the appropriate corrections.
In neutron activation analysis, the expanded uncertainty U (k = 2) was in the range of 1–10%, dependent on the determined element. Obtained values are in good agreement with uncertainties reported previously [47,48,49,50].

ICP-MS

The uncertainty budget for chemical composition analysis by ICP-MS was estimated based on the designated main sources of uncertainty. Figure 4 shows the Ishikawa diagram for ICP-MS used, which should be considered.
Sources of uncertainty in the elaborated analytical procedure based on ICP-MS were divided into two general categories [51]:
  • Preparation of samples and standards;
  • Measurement by ICP-MS technique.
As previously mentioned, for INAA, not all sources of uncertainty had the same weight, so they were not all included in the uncertainty budget. In the case of ICP-MS, the following points were considered: sample and standard solution preparations, calibration, measurements, and recovery.
The following example illustrates the influence of the purity of the reagents on the uncertainty of the measurements carried out. The influence of boric acid on the quantitative determination of lanthanides from post-dilution solutions with HF was investigated. According to the reaction H3BO3 + 4HF = HBF4 + 3H2O, an excess of free fluoride ions are consumed in the solution, generating fluoroboric acid. Reducing fluorides allows for easier control over the formation of volatile metal fluoride complexes. Depending on the manufacturer, boric acid can contain significant amounts of impurities (the same purity grade). The obtained results showed dramatic differences in the content of individual ions in the tested reagents, especially for K, Mn, and SO4 (Table 2). The use of a reagent with a large amount of impurities affects the size of the blank and the accuracy of the determinations.
For ICP-MS, a calibration curve was created using the measurements of four solutions with the appropriate concentrations, according to the expected levels of the analyte in question in the sample. The coefficients of determination (R2), demonstrating linearity of the calibration data, are between 0.9998 and 1.0000.
The significant difficulty in ICP-MS determination was the presence of isobaric interferences. For example, Eu measurements could be hampered, where Eu was positively biased by the presence of large amounts of BaO (151Eu-135Ba16O, 153Eu-137Ba16O); other interferences were found for two of the strongest Gd isotopes (155Gd and 157Gd) by 139La16O and 141Pr16O or 138Ba16OH and 140Ce16OH [52]. Similarly, in the case of heavy elements, Cr, Ni determinations, and analyte ions could be overlapped by polyatomic ions (52Cr with 40Ar12C and 35Cl16OH, 44Ca16O, or 60Ni). Monoisotopic arsenic determination was effected by the formation of 40Ar35Cl in most materials (water, food, etc.). Because As concentration in the ash samples was relatively high and no hydrochloric acid was added to the digestion, the effect of ArCl ion formation was negligible.
Individual uncertainties were estimated experimentally (e.g., digestion, dilution, plasma stability, etc.) or based on the manufacturers’ data (weight accuracy and purity of standard solutions). During the standard solution and sample preparation, all operations were carried out by weight, not by volume, using a calibrated analytical balance. The uncertainty was calculated according to producer’s specification with a maximum of 0.1% for the samples and 0.2–0.3% for standard solution. The higher uncertainty for the standard solution preparation was due to the purity of the stock solution obtained from the producer’s certificate. The uncertainties associated with the other sources of uncertainty during the preparation of the sample and standards, change in mass during sample weighing, variation in isotopic abundance, and stoichiometry, were neglected. The standard uncertainty related to the repeatability of sample digestion and recovery was evaluated by measuring 10 independently digested CRM samples. In ICP-MS, the expanded uncertainty U (k = 2) was in the range of 5–15% and depended on the determined element. Similarly, the expanded uncertainties (between 8.2% and 16.4%) for toxic elements in food were calculated [53].
The zeta-score was calculated to check the correctness of the uncertainty estimation (Figure 5). It was calculated as follows [45]:
zeta = x met x CRM u met 2 + u CRM 2
where xmet—result obtained using the particular method, xCRM—certified value, and their respective standard uncertainties are umet and uCRM. The assessment criteria for satisfactory, questionable, and unsatisfactory results were the same as for the z-score.
It was found that the standard uncertainty for both methods and all elements (except Lu by ICP-MS) was estimated correctly. Only for Lu, determined by ICP-MS, was the zeta-score outside the acceptable range and was the uncertainty value recognized as “questionable”. Additionally, the measurement uncertainty was underestimated. In the case of a rich inorganic matrix and low analyte content, it was necessary to increase the uncertainty value originating from the sample dilution more accurately.

3.3. Elemental Content of Ash Samples

Table 3 lists the trace element determinations in the collected samples, obtained by ICP-MS and INAA. The ash samples originated from one municipality location with an area of approx. 90 km2 in the Lublin Voivodeship, and the coal was purchased from a local trader. Therefore, it was assumed that the ash taken for testing came from the same batch of raw materials. It was reflected in the results, where the differences between the analysis results for ash derived from coal from the respective countries were max. 20%.
The Ba, Cd, Cr, Cs, Ni, Sb, and V content in all analyzed samples was very similar (relative standard deviation, RSD < 25%). For other elements, significant differences were observed between Kazakh coal ash and Polish and Colombian ash. The difference between Polish and Colombian ash was less significant (for most elements RSD < 20%). The biggest differences between Polish and Colombian ash were observed for arsenic. The high arsenic content is attributed to the pyrite present in Colombian coal [54]. Arsenic is a prevalent impurity in pyrite, as widely acknowledged. Kazakhstan has deposits of over 72 different natural resources, including oil, gas, gold, coal, Fe, U, Mn, bauxite, and Cr [55]. The highest trace element contents were observed in ash from Kazakhstan coal combustion. Coal from Kazakhstan was contaminated in many associated elements, which were later visible in the ash, coal soot, slag, etc. The relatively high U content in ash from Kazakhstan coal compared to Poland or Colombia was related to the occurrence of coal–U deposits.
The obtained results for Polish ash for some of the elements, As, Pb, and Ni, were consistent with the results obtained by Smolka [56]. In the case of Cd, Th, and U, differences were observable, but it may be noted that for Cd and U in both experiments, the obtained values were below 10 ppm, and for Th, it was 10–15 ppm. The largest difference was observed for Ba at 1200 ppm, compared to 101.4 ppm obtained by Smolka. The high Ba content in the ash was related to its low volatility and the formation of insoluble BaSO4, which was dependent on the amount of sulfur present in the coal. One possible reason for this was that the coal used was of poorer quality than that tested previously, i.e., it contained a higher sulfur content. The differences in ash composition may also suggest that the coal available on the market did not come from Polish mines but that it was a mixture of, e.g., Polish and Russian coal. In recent years, until 2022, Poland imported a great amount of coal from Russia, the price of which was considerably lower than that of coal mined in Poland. There was a possibility that coal from Russia was sold as domestic coal.
The leachability of trace elements is strongly dependent on the pH. The materials tested were alkaline in nature: the pH was in the range of 10.01–11.6. The alkaline nature of the ash means that most elements were precipitated/co-precipitated. Macro-content iron in ashes forms insoluble hydroxide in alkaline pH, and other divalent metals (Cu, Zn, Pb, Cd, and Co) were co-precipitated together with Fe(OH)3. The leaching of these elements was practically negligible (below 5%). Elements present as oxyanions were partially removed (Table 4). No significant differences were observed during the time of the leaching process, regardless of the number of days: 1, 4, or 7. The obtained results differed by approx. 5%.
Therefore, for determined elements, the potential risk of soil contamination due to ash dumping around the house and its surroundings was not significant.

4. Conclusions

The comparison performed in this study indicated that both methods could be used in the chemical analysis of ashes, slags, soot, etc. INAA had the advantage of being non-destructive, which in the case of the samples that were difficult to quantify, was the only source of reliable analytical information. However, this technique was limited (mainly due to the need for a nuclear reactor and the analysis time). Thus, its role in routine analysis was not important; however, its importance from a quality control/quality assurance QC/QA point of view could not be overestimated: as a basic method in chemical metrology, it could serve as a control method for results obtained by other methods, e.g., in disruption analyses, during the validation of newly developed analytical procedures, and for the production and certification of new certified reference materials.
In the case of destructive analyses, such as ICP-MS, the source of uncertainty was mainly the sample dilution and the occurrence of spectral interferences, which were considered in the uncertainty budget and in decision making for the use/storage of ashes.
Given the chemical composition of the ashes, it was impossible to distinguish the country of origin of the coal. The majority of elements had a similar concentration independent of coal origin. The significantly higher U content of Kazakh coal suggests that the deposit from which the coal originated was in the southern part of Kazakhstan, where U deposits are known.
The leaching experiments showed that ashes from coal combustion in domestic furnaces did not indicate any significant water contamination (for investigated constituents). The value of toxic elements in the leachate was below maximum levels for drinking water. However, the potential impact of heavy elements on the waters should be monitored.

Author Contributions

Conceptualization, methodology, E.C.; validation, E.C. and P.K.; formal analysis, E.C.; investigation, E.C.; resources, E.C.; data curation, P.K.; writing—original draft preparation, E.C.; writing—review and editing, E.C.; visualization, P.K. All authors have read and agreed to the published version of the manuscript.

Funding

This research received no external funding.

Data Availability Statement

The data that have been used for the research were presented in the article.

Conflicts of Interest

The authors declare no conflict of interest.

References

  1. Gopinathan, P.; Santosh, M.S.; Dileepkumar, V.G.; Subramani, T.; Reddy, R.; Masto, R.E.; Maity, S. Geochemical, mineralogical and toxicological characteristics of coal fly ash and its environmental impacts. Chemosphere 2022, 307, 135710. [Google Scholar] [CrossRef]
  2. Sandeep, P.; Maity, S.; Mishra, S.; Chaudhary, D.P.; Dusane, C.B.; Pillai, A.S.; Vinod Kumar, A. Estimation of rare earth elements in Indian coal fly ashes for recovery feasibility as a secondary source. J. Hazard. Mater. Advan. 2023, 10, 100257. [Google Scholar] [CrossRef]
  3. Lu, X.; Liu, B.; Zhang, Q.; Wen, Q.; Wang, S.; Xiao, K.; Zhang, S. Recycling of Coal Fly Ash in Building Materials: A Review. Minerals 2023, 13, 25. [Google Scholar] [CrossRef]
  4. Taggart, R.K.; Hower, J.C.; Dwyer, G.S.; Hsu-Kim, H. Trends in the rare earth element content of US-based coal combustion fly ashes. Environ. Sci. Technol. 2016, 50, 5919–5926. [Google Scholar] [CrossRef]
  5. Available online: https://ec.europa.eu/eurostat/statistics-explained/index.php?title=Coal_production_and_consumption_statistics (accessed on 6 November 2023).
  6. Wasielewski, R.; Radko, T. Problem zagospodarowania odpadów z palenisk domowych. Ecol. Eng. Environ. Technol. 2018, 19, 36–44. [Google Scholar] [CrossRef]
  7. Coal from Colombia, Mozambique, South Africa … Despite Embargo, Imports of Raw Material to Poland Grow. Available online: https://gospodarka.dziennik.pl/news/artykuly/8523681,embargo-wegiel-polska-rosja-ukraina.html (accessed on 24 September 2023).
  8. Waste Classification Defined by the Regulation of the Ministry of Climate (in Polish). Available online: https://isap.sejm.gov.pl/isap.nsf/DocDetails.xsp?id=WDU20200000010 (accessed on 6 November 2023).
  9. Satayeva, A.; Baimenov, A.; Azat, S.; Zhantikeyev, U.; Seisenova, A.; Tauanov, Z. Review on coal fly ash generation and utilization for resolving mercury contamination issues in Central Asia: Kazakhstan. Environ. Rev. 2022, 30, 418–437. [Google Scholar] [CrossRef]
  10. Santos, A.C.; Cruz, C.; Font, E.; French, D.; Guedes, A.; Moreira, K.; Sant’Ovaia, H.; Vieira, B.J.C.; Waerenborgh, J.C.; Valentim, B. Physicochemical Properties of Fe-Bearing Phases from Commercial Colombian Coal Ash. Minerals 2023, 13, 1055. [Google Scholar] [CrossRef]
  11. Pöykiö, R.; Manskinen, K.; Nurmesniemi, H.; Dahl, O. Comparison of Trace Elements in Bottom Ash and Fly Ash from a Large-Sized (77 MW) Multi-Fuel Boiler at the Power Plant of a Fluting Board Mill, Finland. Energy Explor. Exploit. 2011, 29, 217–234. [Google Scholar] [CrossRef]
  12. Pan, J.; Zhao, X.; Zhou, C.; Yang, F.; Ji, W. Study on Solvent Extraction of Rare Earth Elements from Leaching Solution of Coal Fly Ash by P204. Minerals 2022, 12, 1547. [Google Scholar] [CrossRef]
  13. Abd Manan, T.S.B.; Beddu, S.; Mohd Kamal, N.L.; Mohamad, D.; Itam, Z.; Khan, T.; Machmudah, A.; Dutykh, D.; Mohtar, W.H.M.W.; Jusoh, H.; et al. Ecological Risk Indicators for Leached Heavy Metals from Coal Ash Generated at a Malaysian Power Plant. Sustainability 2021, 13, 10222. [Google Scholar] [CrossRef]
  14. Kalembkiewicz, J.; Sitarz-Palczak, E. Efficiency of leaching tests in the context of the influence of the fly ash on the environment. J. Ecol. Eng. 2015, 16, 67–80. [Google Scholar] [CrossRef]
  15. Banerjee, R.; Chakladar, S.; Mohanty, A.; Chattopadhyay, S.K.; Chakravarty, S. Leaching characteristics of rare earth elements from coal ash using organosulphonic acids. Miner. Eng. 2022, 185, 107664. [Google Scholar] [CrossRef]
  16. Pan, J.; Hassas, B.V.; Rezaee, M.; Zhou, C.; Sarma, V. Recovery of rare earth elements from coal fly ash through sequential chemical roasting, water leaching, and acid leaching processes. J. Clean. Product 2021, 284, 124725. [Google Scholar] [CrossRef]
  17. Eze, C.P.; Fatoba, O.; Madzivire, G.; Ostrovnaya, T.M.; Petrik, L.F.; Frontasyeva, M.V.; Nechaev, A.N. Elemental composition of fly ash: A comparative study using nuclear and related analytical techniques. Chem. Didact. Ecol. Metrol. 2013, 18, 19–28. [Google Scholar] [CrossRef]
  18. Wilschefski, S.C.; Baxter, M.R. Inductively Coupled Plasma Mass Spectrometry: Introduction to Analytical Aspects. Clin. Biochem. Rev. 2019, 40, 115–133. [Google Scholar] [CrossRef]
  19. Bulska, E.; Wagner, B. Quantitative aspects of inductively coupled plasma mass spectrometry. Philos. Trans. R. Soc. A Math. Phys. Eng. Sci. 2016, 374, 20150369. [Google Scholar] [CrossRef]
  20. Hamidatou, L.; Slamene, H.; Akhal, T.; Zouranen, B. Concepts, instrumentation and techniques of neutron activation analysis. Imaging Radioanal. Tech. Interdiscip. Res. Fundam. Cut. Edge Appl. 2013, 141–178. [Google Scholar] [CrossRef]
  21. Kafala, S.I.; MacMahon, T.D. Comparison of neutron activation analysis methods. J. Radioanal. Nucl. Chem. 2007, 271, 507–516. [Google Scholar] [CrossRef]
  22. Lim, J.M.; Jeong, J.H.; Lee, J.H. Instrumental neutron activation analysis of coal and its combustion residues from a power plant. J. Radioanal. Nucl. Chem. 2013, 298, 201–208. [Google Scholar] [CrossRef]
  23. Chung, Y.S.; Moon, J.H.; Kim, S.H.; Kang, S.H.; Kim, Y.J. Determination of the elemental composition of the bottom ash of a municipal incinerator by instrumental neutron activation analysis. J. Radioanal. Nucl. Chem. 2007, 271, 339–344. [Google Scholar] [CrossRef]
  24. Rietz, B.; Heydorn, K.; Pritzl, G. Determination of aluminium in fish tissues by means of INAA and ICP-MS. J. Radioanal. Nucl. Chem. 1997, 216, 113–116. [Google Scholar] [CrossRef]
  25. Freitas, M.C.; Pacheco, A.M.G.; Dionísio, I.; Sarmento, S.; Baptista, M.S.; Vasconcelos, M.T.S.D.; Cabral, J.P. Multianalytical determination of trace elements in atmospheric biomonitors by k0-INAA, ICP-MS and AAS. Nucl. Instrum. Methods Phys. Res. B 2006, 564, 733–742. [Google Scholar] [CrossRef]
  26. Bédard, L.P.; Barnes, S.J. A comparison of the capacity of FA-ICP-MS and FA-INAA. J. Radioanal. Nucl. Chem. 2002, 254, 319–329. [Google Scholar] [CrossRef]
  27. Wallis, N.J.; Kamenov, G.D. Challenges in the Analysis of Heterogeneous Pottery by LA–ICP–MS: A Comparison with INAA. Archaeometry 2013, 55, 893–909. [Google Scholar] [CrossRef]
  28. Bedregal, P.; Ubillus, M.; Cáceres-Rivero, C.; Olivera, P.; Garay, R.; Rojas, J.; Zafra, R.; Urdanivia, R. Determination of atmospheric aerosol components in an urban area to evaluate the air quality and identify the sources of contamination. J. Radioanal. Nucl. Chem. 2022, 332, 3507–3514. [Google Scholar] [CrossRef]
  29. Weilert, T.M.; Ray, C.L.; Gawenis, J.A.; Brockman, J.D. Neutron activation analysis and ICP-MS for provenance of honey collected from American Midwest region. J. Radioanal. Nucl. Chem. 2022, 331, 4971–4981. [Google Scholar] [CrossRef]
  30. Ebihara, M.; Hayano, K.; Shirai, N. Determination of trace rare earth elements in rock samples including meteorites by ICP-MS coupled with isotope dilution and comparison methods. Anal. Chim. Acta 2020, 1101, 81–89. [Google Scholar] [CrossRef]
  31. Yagob, T.; van de Wiel, A.; Bode, P.; Demir, A.; van der Wagt, B.; Krystek, P.; Wolterbeek, B. Measurement of the enriched stable isotope 58Fe in iron related disorders-comparison of INAA and MC-ICP-MS. J. Trace Elem. Med. Biol. 2019, 53, 77–83. [Google Scholar] [CrossRef]
  32. Chajduk, E.; Polkowska-Motrenko, H. Application of ICP-MS, INAA and RNAA to the determination of some “difficult” elements in infant formulas. J. Radioanal. Nucl. Chem. 2017, 311, 1347–1353. [Google Scholar] [CrossRef]
  33. Chajduk, E.; Polkowska-Motrenko, H. The use of HPLC-NAA and HPLC-ICP-MS for the speciation of As in infant food. Food Chem. 2019, 292, 129–133. [Google Scholar] [CrossRef]
  34. Chajduk, E.; Kalbarczyk, P.; Dudek, J.; Pyszynska, M.; Bojanowska-Czajka, A.; Samczyński, Z. Development of Analytical Procedures for Chemical Characterization of Substrates for the Production of TRISO Coated Particles as Nuclear Fuel in High Temperature Gas-Cooled Reactors. Sustainability 2020, 12, 7221. [Google Scholar] [CrossRef]
  35. Ugurlu, A. Leaching characteristics of fly ash. Environ. Geol. 2004, 46, 890–895. [Google Scholar] [CrossRef]
  36. Kolker, A.; Scott, C.; Hower, J.C.; Vazquez, J.A.; Lopano, C.L.; Dai, S. Distribution of rare earth elements in coal combustion fly ash, determined by SHRIMP-RG ion microprobe. Int. J. Coal Geol. 2017, 184, 1–10. [Google Scholar] [CrossRef]
  37. Wang, Z.; Dai, S.; Zou, J.; French, D.; Graham, I.T. Rare earth elements and yttrium in coal ash from the Luzhou power plant in Sichuan, Southwest China: Concentration, characterization and optimized extraction. Int. J. Coal Geol. 2019, 203, 1–14. [Google Scholar] [CrossRef]
  38. Baranowska, I. Handbook of trace analysis. In Handbook of Trace Analysis: Fundamentals and Applications, 1st ed.; Springer: Basel, Switzerland, 2016. [Google Scholar]
  39. Hossain, M.; Karmakar, D.; Begum, S.N.; Ali, S.Y.; Patra, P.K. Recent trends in the analysis of trace elements in the field of environmental research: A review. Microchem. J. 2021, 165, 106086. [Google Scholar] [CrossRef]
  40. Gaudino, S.; Galas, C.; Belli, M.; Barbizzi, S.; de Zorzi, P.; Jaćimović, R.; Jeran, Z.; Pati, A.; Sansone, U. The role of different soil sample digestion methods on trace elements analysis: A comparison of ICP-MS and INAA measurement results. Accredit. Qual. Assur. 2007, 12, 84–93. [Google Scholar] [CrossRef]
  41. Conrey, R.M.; Bailey, D.G.; Singer, J.W.; Wagoner, L.J.; Parfitt, B.; Hay, J.; Keh, O.; Chang, Z.; Huang, S. Combined use of multiple external and internal standards in LA-ICP-MS analysis of bulk geological samples using lithium borate fused glass. Geochem. Explor. Env. A. 2023, 23, geochem2023-001. [Google Scholar] [CrossRef]
  42. Yu, Z.; Norman, M.D.; Robinson, P. Major and trace element analysis of silicate rocks by XRF and laser ablation ICP-MS using lithium borate fused glasses: Matrix effects, instrument response and results for international reference materials. Geostand. Newsl. 2003, 27, 67–89. [Google Scholar] [CrossRef]
  43. ASTM D6357-11; Test Methods for Determination of Trace Elements in Coal, Coke, & Combustion Residues from Coal Utilization Processes by Inductively Coupled Plasma Atomic Emission, Inductively Coupled Plasma Mass, & Graphite Furnace Atomic Absorption Spectrometry. ASTM: West Conshohocken, PA, USA, 2019.
  44. ASTM D6357-21b; Standard Test Methods for Determination of Trace Elements in Coal, Coke, and Combustion Residues from Coal Utilization Processes by Inductively Coupled Plasma Atomic Emission Spectrometry, Inductively Coupled Plasma Mass Spectrometry, and Graphite Furnace Atomic Absorption Spectrometry. ASTM: West Conshohocken, PA, USA, 2021.
  45. Saiki, M.; Alves, E.R.; Jaluul, O. Determination of trace elements in scalp hair of an elderly population by neutron activation analysis. J. Radioanal. Nucl. Chem. 2008, 276, 53–57. [Google Scholar] [CrossRef]
  46. van der Veen, A.; Cox, M.; Possolo, A. GUM guidance on developing and using measurement models. Accredit. Qual. Assur. 2022, 27, 295–297. [Google Scholar] [CrossRef]
  47. IAEA-TECDOC-1401: Quantifying Uncertainty in Nuclear Analytical Measurements; IAEA: Vienna, Austria, 2004.
  48. Greenberg, R.R.; Bode, P.; Fernandes, E.A.D.N. Neutron activation analysis: A primary method of measument. Spectrochim. Acta B At. Spectrosc. 2011, 66, 193–241. [Google Scholar] [CrossRef]
  49. Balla, M.; Molnár, Z.; Kőrös, Á. Uncertainty budget and validation of NAA using Reference Materials. J. Radioanal. Nucl. Chem. 2004, 259, 395–400. [Google Scholar] [CrossRef]
  50. Cho, H.; Dasari, K.B.; Jaćimović, R.; Zeisler, R.; Sharp, N.E.; Kim, S.H.; Sun, G.M.; Yim, Y.H. Application of the INAA methods for KRISS infant formula CRM analysis: Standardization of INAA at KRISS. J. Radioanal. Nucl. Chem. 2019, 322, 1537–1547. [Google Scholar] [CrossRef]
  51. Barwick, V.J.; Ellison, S.L.R.; Fairman, B. Estimation of uncertainties in ICP-MS analysis: A practical methodology. Anal. Chim. Acta 1999, 394, 281–291. [Google Scholar] [CrossRef]
  52. Thompson, R.L.; Bank, T.; Roth, E.; Granite, E. Resolution of rare earth element interferences in fossil energy by-product samples using sector-field ICP-MS. Fuel 2016, 185, 94–101. [Google Scholar] [CrossRef]
  53. Yenisoy-Karakaş, S. Estimation of uncertainties of the method to determine the concentrations of Cd, Cu, Fe, Pb, Sn and Zn in tomato paste samples analysed by high resolution ICP-MS. Food Chem. 2012, 132, 1555–1561. [Google Scholar] [CrossRef]
  54. Levine, R.M.; Brininstool, M.; Wallace, G.J. The mineral industry of Kazakhstan. In Minerals Yearbook 2009; USGS Publications Warehouse: Reston, VA, USA, 2001. [Google Scholar]
  55. Akinyemi, S.A.; Bohórquez, F.; Islam, N.; Saikia, B.K.; Sampaio, C.H.; Crissien, T.J.; Silva, L.F. Petrography and geochemistry of exported Colombian coals: Implications from correlation and regression analyses. Energy Geosci. 2021, 2, 201–210. [Google Scholar] [CrossRef]
  56. Smołka-Danielowska, D.; Jabłońska, M.; Godziek, S. The Influence of Hard Coal Combustion in Individual Household Furnaces on the Atmosphere Quality in Pszczyna (Poland). Minerals 2021, 11, 1155. [Google Scholar] [CrossRef]
Figure 1. REE recovery dependent on the applied microwave digestion procedure.
Minerals 13 01484 g001
Figure 2. The z-score bar graph related to results obtained by two used methods and certified values.
Minerals 13 01484 g002
Figure 3. The Ishikawa diagram for the analytical procedure in which the INAA technique was applied. Cx is the content of the given analyte in the analyzed material [34].
Minerals 13 01484 g003
Figure 4. The Ishikawa diagram for the analytical procedure applying the ICP-MS technique. Cx is the content of the given analyte in the analyzed material [34].
Minerals 13 01484 g004
Figure 5. The zeta-score bar graph related to results obtained by two used methods and certified values.
Minerals 13 01484 g005
Table 1. Analysis of CTA-FFA-1, comparison of obtained results by ICP-MS and INAA; results given in mg/kg, for Al, Fe, Na, Si- w.t.%.
ElementCertified ValueICP-MSINAA
Al14.87 ± 0.3915.5 ± 1.0-
As53.6 ± 2.756.1 ± 8.454.7 ± 4.2
Ba835 ± 56860 ± 64850 ± 50
Ce120 ± 7110 ± 11127 ± 16
Co39.9 ± 1.742.5 ± 2.038.5 ± 0.8
Cr156 ± 8140 ± 17165 ± 16
Cs48.2 ± 2.650.1 ± 3.250.0 ± 2.6
Cu158 ± 9167 ± 15153 ± 12
Dy9.09 ± 1.458.02 ± 0.80-
Er4.52 ± 1.124.15 ± 0.42-
Eu2.39 ± 0.062.18 ± 0.222.38 ± 0.01
Fe4.89 ± 0.144.82 ± 0.304.83 ± 0.24
Gd10.0 ± 2.68.7 ± 0.99.2 ± 0.9
Hf6.0 ± 0.456.2 ± 0.65.4 ± 0.5
La60.7 ± 4.057.1 ± 5.563.7 ± 2.0
Lu0.658 ± 0.0430.572 ± 0.060.630 ± 0.090
Mn1066 ± 411073 ± 50-
Na2.19 ± 0.082.28 ± 0.152.13 ± 0.15
Nd56.8 ± 3.752.1 ± 5.354.6 ± 5.5
Pb369 ± 19378 ± 18-
Rb185 ± 5178 ± 9186 ± 9
Sb17.6 ± 2.515.8 ± 1.616.2 ± 1.0
Sc24.2 ± 1.125.2 ± 1.724.0 ± 0.2
Si22.48 ± 0.9221.60 ± 2.00-
Sm10.9 ± 0.69.8 ± 1.011.1 ± 0.5
Tb1.38 ± 0.141.26 ± 0.131.41 ± 0.10
Th29.4 ± 0.729.5 ± 0.929.2 ± 1.4
Tm0.705 ± 0.2000.92 ± 0.22-
U15.1 ± 0.814.9 ± 0.414.6 ± 1.2
Yb4.24 ± 0.194.00 ± 0.434.30 ± 0.30
Zn569 ± 58580 ± 41545 ± 28
Table 2. Determination of selected impurities in H3BO3 reagents.
IonReagent 1Reagent 2Reagent 3
K+, µg/g129180076
SO42−, µg/g47511,8004790
Mn, ng/g9.828.42.72
Table 3. Determination of selected trace elements in ash originating from Polish, Columbian, and Kazakh coal combustion (ppm).
PolandColumbiaKazakhstan
As20.465.215.1
Ba142217511185
Cd2.082.532.58
Co36.320.332.5
Cr13710186.5
Cs14.212.78.2
Cu91.957.1353
Hf6.217.228.3
Mn5644501070
Ni93.177.8105
Pb44.863.685.7
Sb8.087.136.3
Sc87.235.160.5
∑La-Gd264394125
∑Tb-Lu21.734.210.2
U9.3813.224.4
Th14.730.555.6
V293354380
Zn275285875
Table 4. Leaching of selected metals with deionized water.
Element% of Elution
As35 ± 5
Cd<5
Co<5
Cr<10
Cu<5
Fe<5
Mn<5
Mo45 ± 10
Ni<5
Sb55 ± 10
Se45 ± 10
Zn<5
Disclaimer/Publisher’s Note: The statements, opinions and data contained in all publications are solely those of the individual author(s) and contributor(s) and not of MDPI and/or the editor(s). MDPI and/or the editor(s) disclaim responsibility for any injury to people or property resulting from any ideas, methods, instructions or products referred to in the content.

