Article

Physicochemical Properties of Fe-Bearing Phases from Commercial Colombian Coal Ash

1
Earth Science Institute—Porto Pole, Department of Geosciences, Environment and Spatial Plannings, Faculty of Sciences, University of Porto, Rua do Campo Alegre s/n, 4169-007 Porto, Portugal
2
Department of Earth Sciences, University of Coimbra, 3030-790 Coimbra, Portugal
3
Instituto Dom Luís (IDL), Faculdade de Ciências, Universidade de Lisboa, 1749-026 Lisboa, Portugal
4
School of Biological, Earth and Environmental Sciences, University of New South Wales, Sydney, NSW 2052, Australia
5
Centro de Ciências e Tecnologias Nucleares, DECN, Instituto Superior Técnico, Universidade de Lisboa, 2695-066 Bobadela LRS, Portugal
*
Author to whom correspondence should be addressed.
Minerals 2023, 13(8), 1055; https://doi.org/10.3390/min13081055
Submission received: 22 June 2023 / Revised: 26 July 2023 / Accepted: 2 August 2023 / Published: 9 August 2023
(This article belongs to the Special Issue Ashes: Characterisation, Recovery and Utilization)

Abstract

:
High amounts of coal combustion products, such as fly ash and bottom ash, are generated every year; however, only 64% are used, which means that a significant part is landfilled despite containing valuable materials such as ferrospheres, which may be used as catalysts, substituting critical raw materials (e.g., platinoids). In commercial coals, pyrite contents are reduced as a pre-combustion S-emissions control measure, so low amounts of ferrospheres are expected in the respective ashes. However, given the large amounts of ash being generated from these coals, it may provide a reliable source of catalysts, with ferrospheres being easily recovered via magnetic separation. Several studies have been conducted regarding these morphotypes; however, there is a lack of investigation considering the ash derived from highly beneficiated coals and the variations with location and time. In this study, bottom ash, economizer grits, and fly ash samples from a Portuguese power plant burning Colombian commercial coal were fractionated using ferrite (Fe-MC fraction) and Nd (Nd-MC fraction) magnets, and a multi-technique approach was used to assess their properties (magnetic parameters, particle size distribution, mineralogy, particle morphology, microtexture, and chemical composition). The Fe-MC presented higher Fe concentrations (up to 44 wt.% Fe2O4) than the Nd-MC (up to 7 wt.% Fe2O4). Once it was a sequential process, Nd magnets essentially collected Fe-bearing aluminosilicate glass, and Fe-bearing minerals were residual when compared to the Fe-MC, where magnetite, magnesioferrite, hematite, and maghemite accounted for up to 30 wt.%. Among the Fe-MC, the sample collected from electrostatic precipitator fly ash (ESP FA), despite having a lower yield, presented higher Fe concentrations than the ones from bottom ash and economizer grits, which was related to the mode of occurrence of Fe-bearing phases: in the Fe-MC from ESP FA, discrete ferrospheres predominated, while in the remaining Fe-bearing phases, they were often embedded in aluminosilicate glass. All Fe-MC samples showed an increase of Fe-substituting elements (e.g., Mn and Ni) and their concentration tended to increase with decreasing particle size along with Fe. The integrated study of cross-sections enabled the identification of oxidation rims, martitization aspects, and the co-existence of hematite and magnesioferrite.

Graphical Abstract

1. Introduction

Despite global warming concerns, coal remains an important source of energy in many countries (e.g., China and India), and more than 1200 Mt/year of coal combustion products (CCP) are generated, including two types of ash: fly ash (FA; 70–85%) and bottom ash (BA; 15–30%), with a global utilization rate of 64% ([1,2,3]). The ash has as main application in construction industry, but there has been a growing interest on its use as secondary source of metals (e.g., Ge, Ga, Al, REE), and carbonaceous (char) and Fe-rich materials ([4,5,6,7,8,9,10]).
Iron is a common non-critical element and its occurrence in coal ashes is associated with Fe-bearing minerals in coals, such as sulfides (e.g., pyrite—FeS2), sulphates (e.g., jarosite—(Na,K)Fe3(SO4)2(OH)6), aluminosilicates (e.g., illite—(K,H3O)(Al,Mg,Fe)2(Si,Al)4O10[(OH)2,(H2O)), carbonates (e.g., siderite—FeCO3) and iron oxides [11,12,13,14,15,16,17,18,19,20,21,22], which transforms into a variety of Fe-bearing minerals/phases (e.g., magnetite -Fe3O4, hematite -Fe2O3, magnesioferrite -MgFe2O4, maghemite -Fe2O3, wüstite -FeO, and Ca and Ca–Mg ferrite spinels; [23,24,25,26,27,28,29,30]) during coal combustion. These may be dispersed in aluminosilicate glass or form ferrospheres, i.e., spherical particles (morphotypes), up to 300 µm, essentially composed by micrometric Fe-bearing minerals and variable amounts of a glassy aluminosilicate matrix [26,29,31,32].
Ferrospheres have been tested as potential substitute material for critical metals (e.g., Pt) in catalytic reactions such as deep oxidation, oxidative coupling of methane and 4-nitrophenol reduction reaction (e.g., [33,34,35,36,37,38,39]). However, these reactions are influenced by ferrospheres properties, such as elements incorporation in spinel structure, amount of amorphous phase, Fe-crystals size, among others, being therefore their characterization extremely important before its application [26].
The Fe-bearing morphotypes can be easily recovered from coal ashes as magnetic concentrates (MC), usually yielding between 0.5 to 18.1 wt.%, with a Fe content ranging from approximately 20 to 88% [23,24,27,29,40,41]. Narrower fractions of the MC with stable composition and reproducible magnetic properties can be obtained via beneficiation flow processes, which may include size-classification, hydrodynamics, and density separation [9,35,36,42,43,44,45,46,47]. Ferrospheres are expected to occur in low amounts in ashes derived from commercial coal since pyrite (main Fe-bearing mineral in coals) contents are reduced as pre-combustion S-emissions control measure. However, given the high amounts of ashes being generated from commercial coals large quantities of these materials can easily be recovered consistently via magnetic separation. Several research have been carried to characterize ferrospheres but they were mainly focused on ashes derived from power plants burning local non-beneficiated coals, exhibiting high sulfur contents, and not considering space-time variations (e.g., [30,46,48]).
To study the Fe-morphotypes properties as function of sample location and time, ashes from a Colombian commercial burned under pulverized fuel conditions, were collected in different locations (bottom ash, economizer grits and electrostatic precipitator), and their magnetic and paramagnetic fractions recovered using Fe- and a Nd-magnets in sequence. These were then characterized using a multi-technique approach to assess particle size distribution (sieving), morphology and microtexture (scanning electron microscopy with energy dispersive X-ray spectroscopy—SEM/EDS), chemical composition (X-ray fluorescence—XRF, and inductively coupled plasma mass spectrometry—ICP-MS) magnetic parameters (magnetic susceptibility and isothermal remanent magnetization—IRM) and mineralogy and iron oxidation state (X-ray diffraction, Raman microspectroscopy and Mössbauer spectroscopy) in order to assess relevant characteristics for further potential applications.

2. Materials and Methods

2.1. Samples

The coal combustion ashes were provided by a Portuguese pulverized-coal thermoelectric power plant that burns low-sulfur Colombian commercial coals [49]. Proximate analysis, gross calorific value, and mineralogy of feed coals from the corresponding sampling campaigns (S1 and S4) previously published in [49] are summarized in Table 1.
The magnetic concentrates (MC) were recovered via wet magnetic separation according to the method described in [49] from six ash samples: 2 bottom ashes (BA), 2 economizer (ECO) grits, and 2 fly ashes (FA) from the electrostatic precipitator (ESP). Each group of three samples (BA, ECO, and ESP) corresponds to a different sampling campaign (S1 and S4) collected one year apart (details can be found in [49]). In the samples from campaign S1, a sequential separation was carried out using two different magnets: a ferrite (Fe) magnet to collect ferromagnetic particles and a neodymium (Nd) magnet to recover paramagnetic particles and Fe-poor morphotypes. The MC obtained from the referred sequential process were later dry sieved (same methodology as used by [49]) to obtain subsamples for chemical analysis.

2.2. Analytical Methodologies

2.2.1. Chemical Analysis

The determination of LOI, major oxide and trace elements was carried out at Bureau Veritas Minerals, Vancouver, Canada (an Accredited laboratory by ISO/IEC 17025, 2017, using Inhouse Certified Reference Material or, in its absence, samples certified against internationally certified reference materials such as CANMET and USGS standards). The LOI was determined by roasting at 1000 °C. For major and minor oxide determination via X-ray fluorescence (XRF), the samples were prepared as fused glass discs by lithium borate fusion (XF702). The minor and trace elements were analyzed via Inductively coupled plasma mass spectrometry (ICP-MS), and samples were prepared using a multi-acid digestion method (MA200).

2.2.2. X-ray Diffraction (XRD)

The identification of the mineral phases and quantification of the amorphous phase were carried out by XRD in the School of Biological, Earth, and Environmental Sciences—University of South Wales (Australia).
The samples were analyzed using a Panalytical Empyrean X-ray diffractometer (Malvern Panalytical, Worcestershire, UK), using cobalt K-alpha radiation at tube settings of 45 kV and 40 mA. The acquisition was made over an angular range of 3° 2θ to 80° 2θ at a step interval of 0.013° 2θ for a scan time of 45 min. Before quantification, the phases were identified using Panalytical High Score Plus in conjunction with the ICCD pattern diffraction database. The quantitative analyses were performed using Siroquant™ (Sietronics Pty. Ltd., Canberra, Australia), a least squares full pattern matching Rietveld procedure developed by CSIRO [50]. Siroquant presents the advantage of using “observed HKL files” to analyze poorly crystalline phases and determine amorphous content. In this study, a calculated pattern of metakaolinite was used to determine the amorphous content in the ash samples.

2.2.3. Magnetic Susceptibility and Isothermal Remanent Magnetization (IRM)

The nature and concentration of the magnetic particles contained in the ash samples selected to obtain the magnetic concentrates were characterized based on the measurement of mass-specific magnetic susceptibility (χ) and the acquisition of Isothermal Remanent Magnetization (IRM) curve. Powered samples were placed into 8 cm3 plastic boxes. Magnetic susceptibility was measured using a KLY-4S Kappabridge instrument in the Institute of Earth Sciences—Porto Pole, FCUP, University of Porto (Portugal). At least three susceptibility measurements of each sample were taken, and the average value was calculated. The mean value of the magnetic susceptibility was then divided by the mass and expressed in mass-specific magnetic susceptibility, χ, in m3/kg.
IRM curves were acquired in the laboratory of paleomagnetism of the Department of Earth Sciences, University of Coimbra (Portugal). Stepwise IRM (typically 30 steps) was acquired up to 1 T with an impulse magnetizer (model IM-30; ASC Scientific, Narragansett, RI, USA), and the remanence was measured with a Minispin magnetometer (Molspin Ltd., Oxfordshire, UK). IRM acquisition curves were unmixed into several components based on cumulative log-Gaussian (CLG) functions with the software of [51] or on skewed generalized (log) Gaussian functions (SGG) with the MaxUnMix program [52] to isolate the contributions of magnetite and hematite (denoted here as SIRM of component 1 and component 2, respectively). The S-ratio parameter (S ratio = −IRM − 300mT/IRM1T) was used to assess the relative contribution of low versus high coercivity ferromagnetic minerals [53,54,55]. A S-ratio close to unity indicates that the remanence is dominated by magnetite-like structures, whereas in samples dominated by high coercivity particles (ex. Hematite), the S-ratio tends to 0 [56].

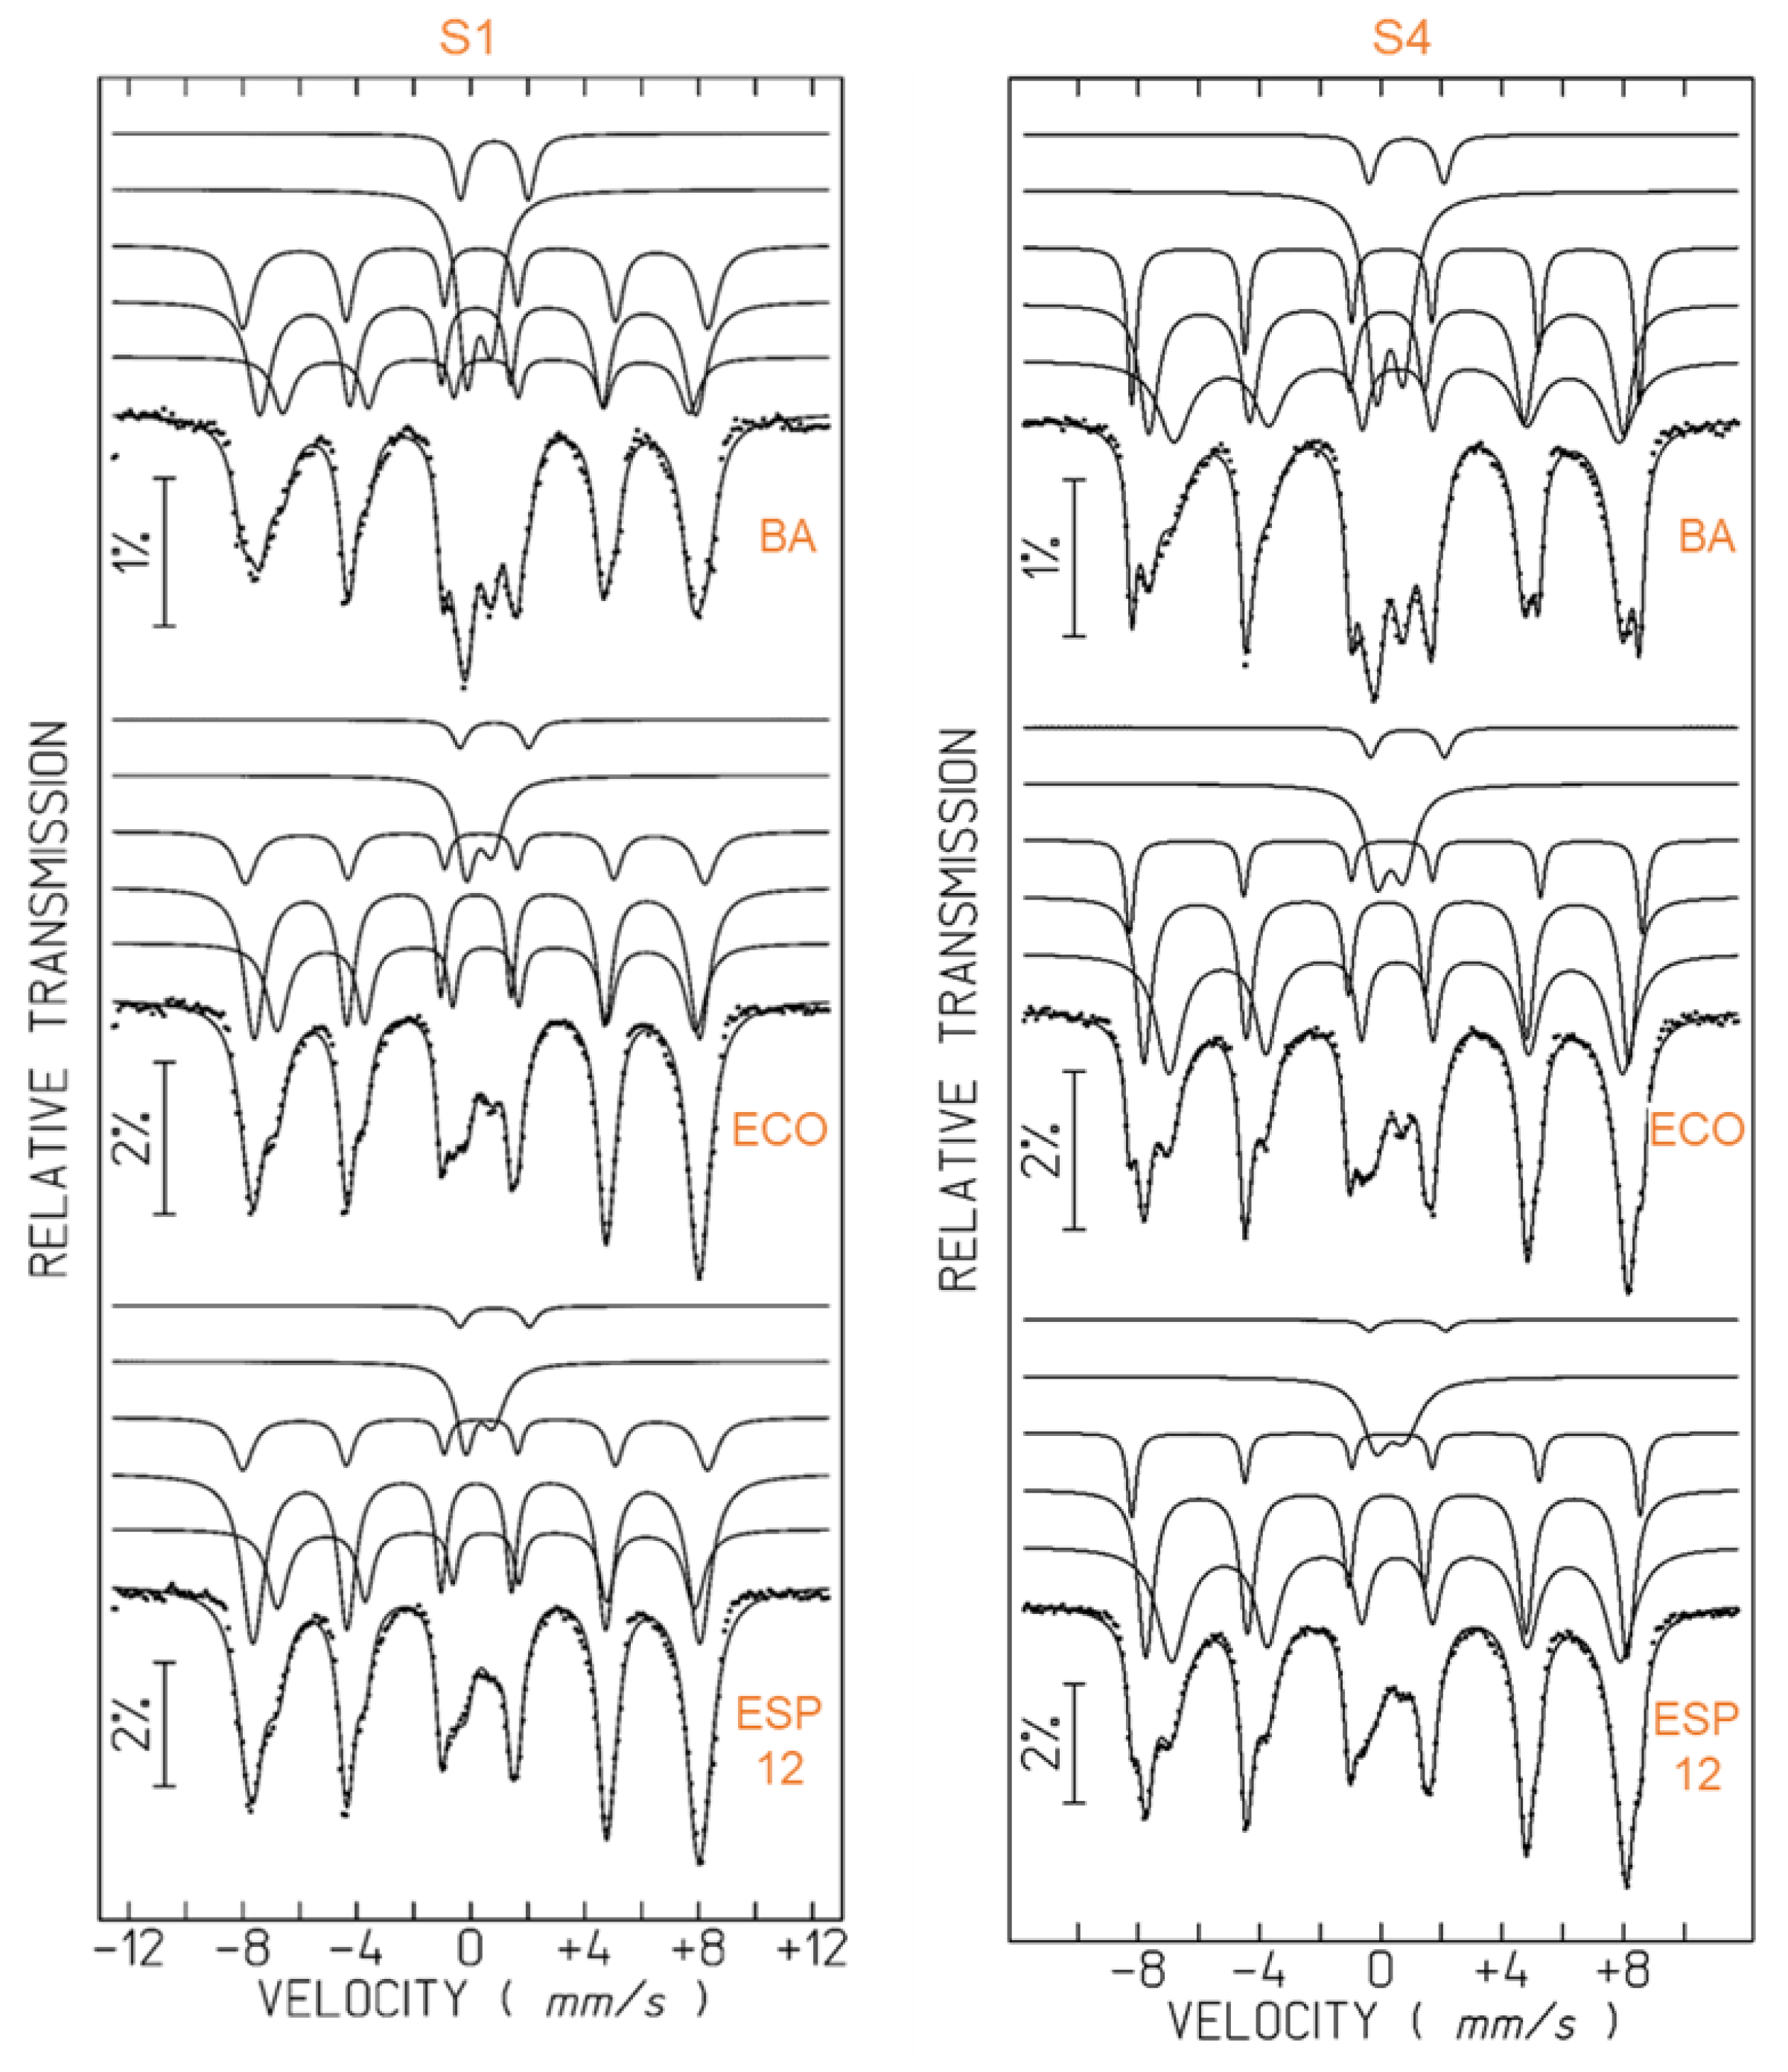
2.2.4. Mössbauer Spectroscopy

Mössbauer spectroscopy was used to investigate the Fe oxidation degree and the Fe-bearing phases present in the magnetic concentrates. The analyses were carried out at the Center of Nuclear Sciences and Technologies at the Instituto Superior Técnico (University of Lisbon, Portugal). The spectra were collected in transmission mode using a conventional constant-acceleration spectrometer and a 25 mCi 57Co source in a Rh matrix. The velocity scale was calibrated using α-Fe foil. Isomer shifts (IS) are given relative to this standard. The absorbers were obtained by packing the powdered samples into Perspex holders. The absorber thickness was calculated based on the corresponding electronic mass-absorption coefficients for the 14.4 keV radiation [57]. The spectra were fitted to Lorentzian lines using a non-linear least-squares method [58].

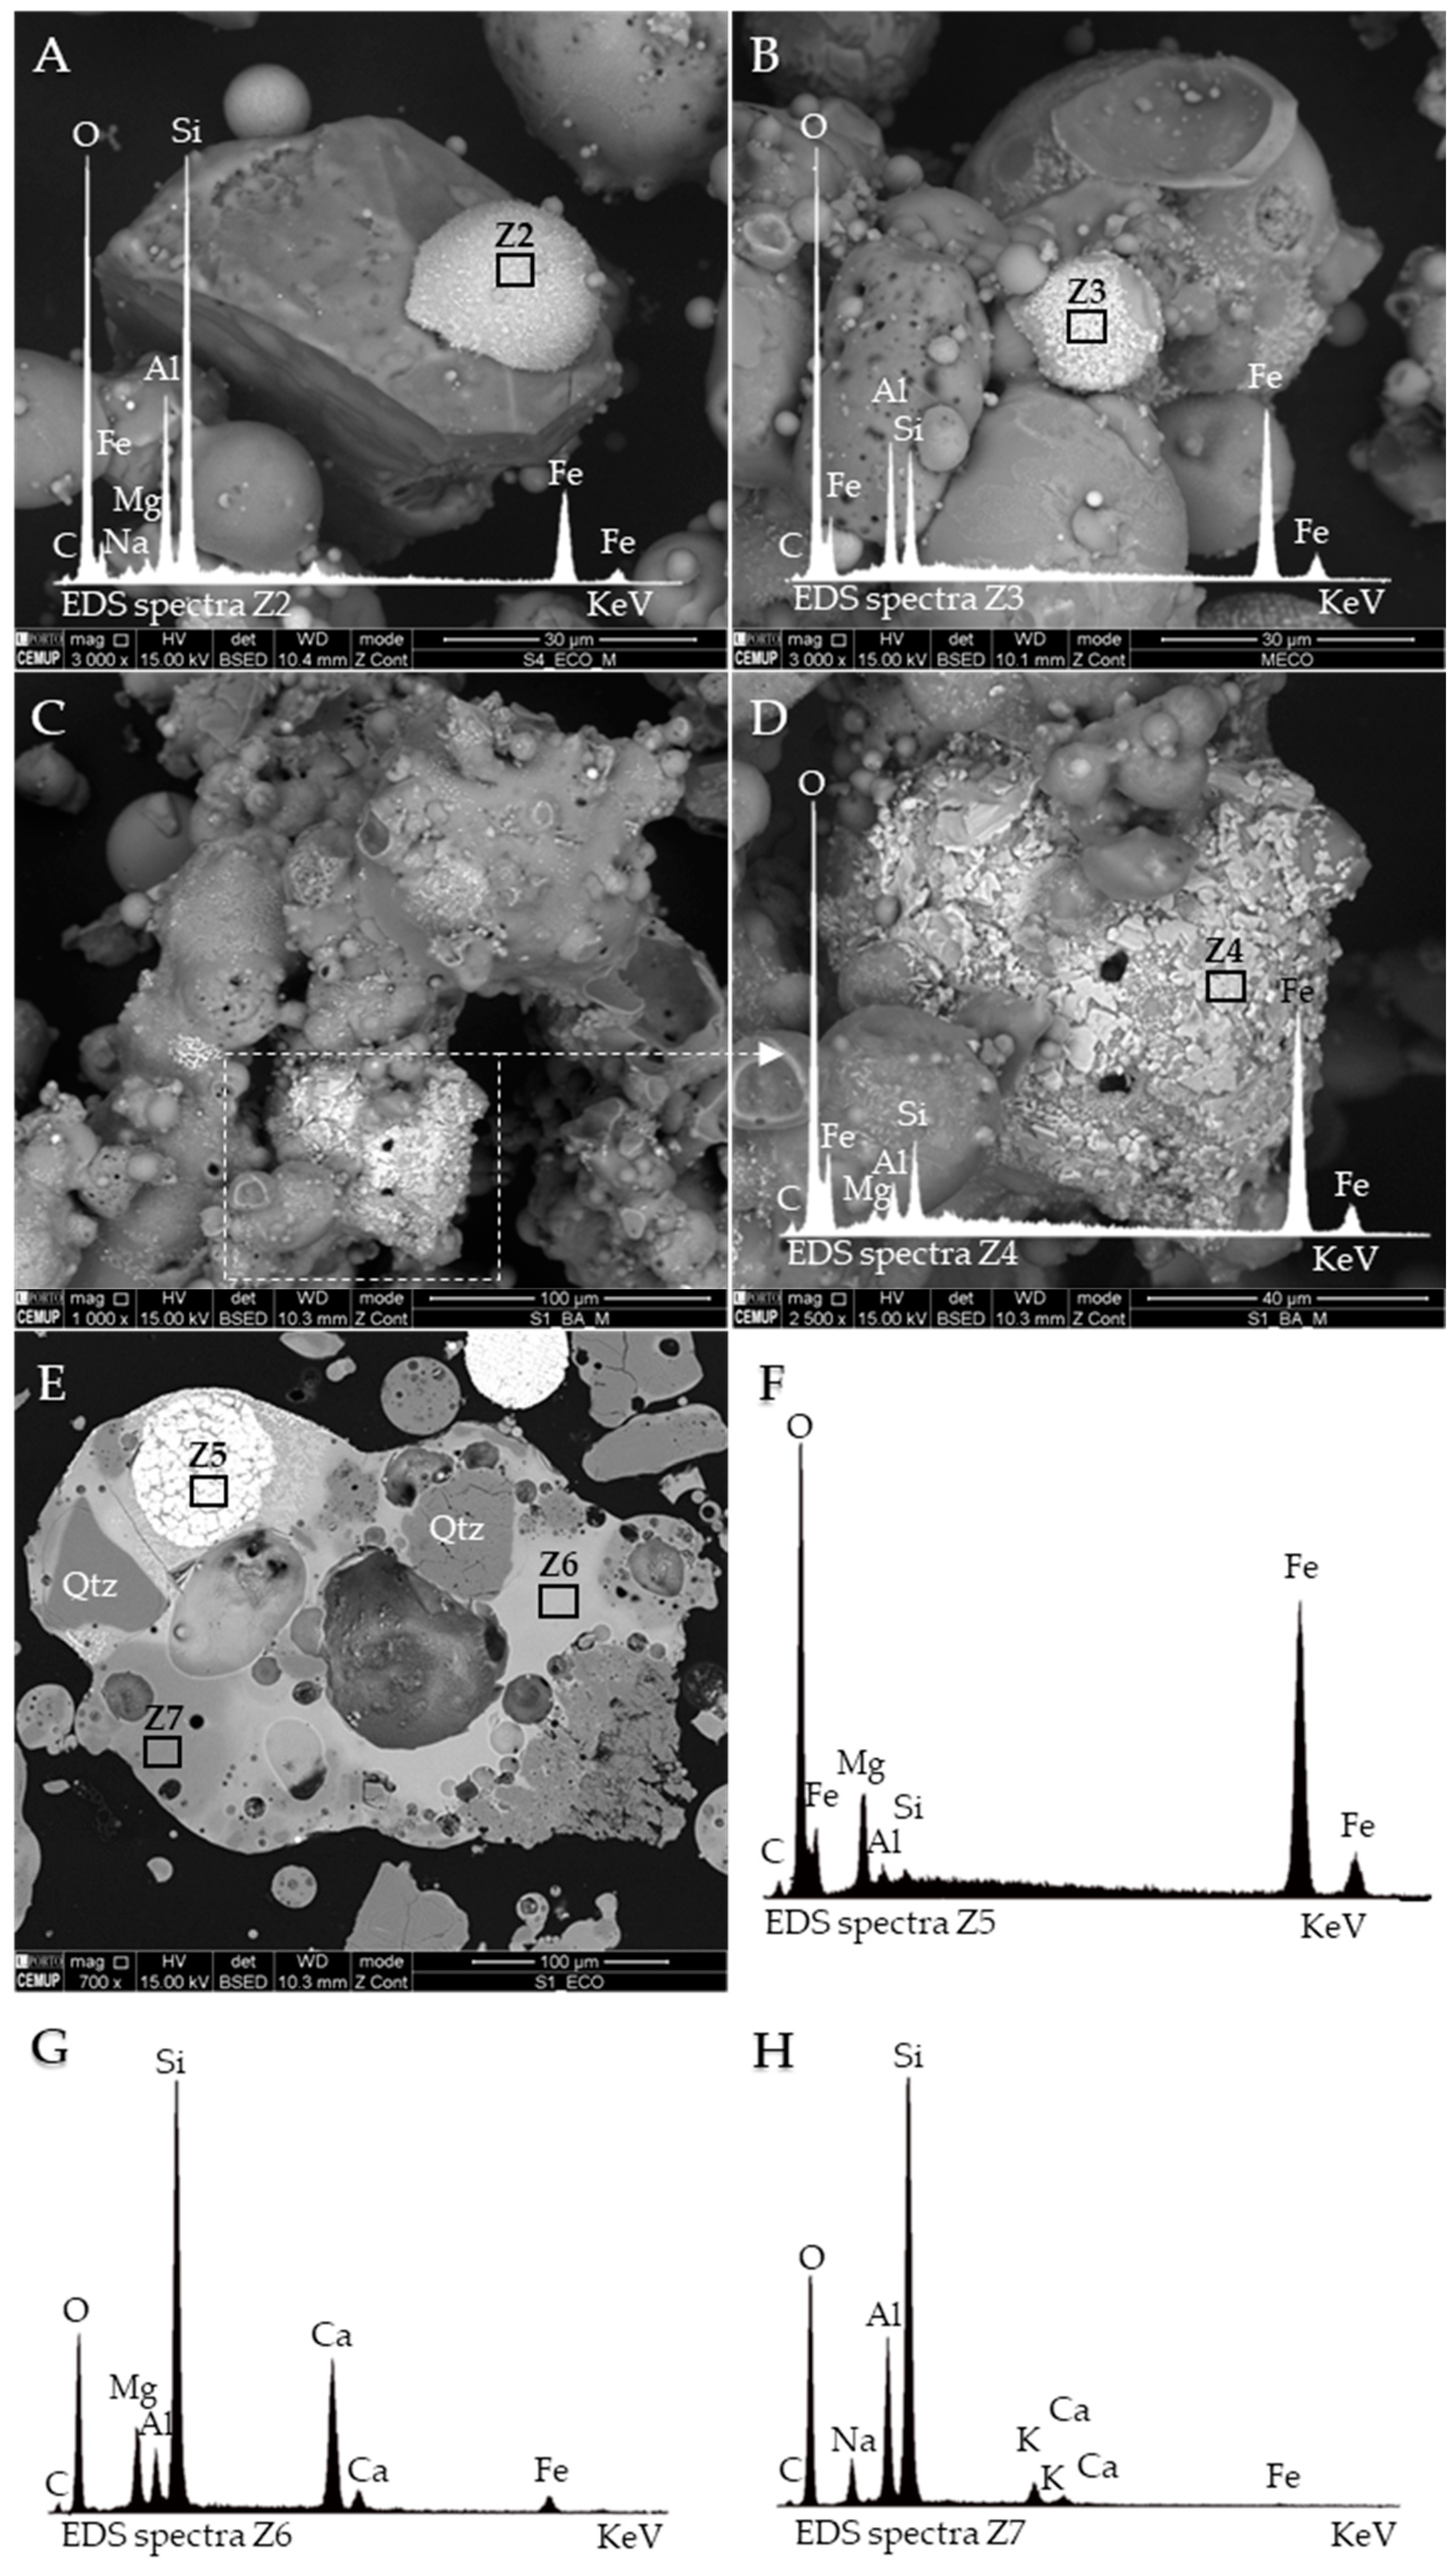
2.2.5. Scanning Electron Microscopy with Energy Dispersive Spectroscopy (SEM/EDS)

The analysis of SEM/EDS was carried out at the Materials Centre of the University of Porto, Portugal (CEMUP). An FEI Quanta 400 FEGESEM/EDAX Genesis X4M was operated at 15 kV in high vacuum mode with a manual aperture and an instrument-specific 4.5 beam spot-size setting [49]. The backscattered electron (BSE) mode was mainly used for detailed imaging of the inorganic phase morphology/texture and its identification since it is highly sensitive to changes in atomic number, and where necessary, X-ray microanalysis (EDS) was made for semiquantitative chemical analysis.

2.2.6. Optical Microscopy

Petrographic analysis analyses were made on polished blocks with randomly oriented particles prepared following the standard procedures of ISO 7404-2 (2009) using a Microscope Leica DM4500P (Leica Microsystems GmbH, Wetzlar, Germany) equipped with a ×50 oil objective (combined magnification of ×500), controlled by the software Fossil (Hilgers Technisches Büro, Königswinter, Germany).

2.2.7. Raman Microspectroscopy

The Raman microspectroscopy analyzes were performed using a LabRaman spectrometer (Jobin–Yvon, Horiba Scientific, Kyoto, Japan) equipped with a CCD camera and a He–Ne laser at an excitation wavelength of 632.8 nm. An optical microscope from Olympus (Shinjuku, Tokyo, Japan) with a ×100 objective lens (NA = 0.95) was used to focus the laser beam onto the sample surface and collect the scattered radiation. A neutral density filter was used to reduce the power of the laser by 75% to avoid laser-induced transformation of the Fe-bearing phases. Scans from 100 cm−1 to 1000 cm−1 were performed on the particle surface. The acquisition time and respective accumulations were individually adjusted to acquire an optimized spectrum at spectral resolutions near 1 cm−1.

3. Results and Discussion

3.1. Magnetic Parameters

Mass-specific magnetic susceptibility (χ) results from the relative contribution of the magnetic susceptibilities of all the constituent minerals. Ferromagnetic minerals, such as magnetite, have a major contribution to the bulk susceptibility due to their strong intrinsic magnetic susceptibility compared to paramagnetic and diamagnetic minerals, e.g., clay and quartz (e.g., [53,54,59,60]).
Magnetic susceptibility ranges from 834.79 × 10⁻⁸ m3/kg to 2375.18 × 10−8 m3/kg and the average values decrease as follows: ECO (2200.06 × 10−8 m3/kg) > ESP FA (1245.43 × 10−8 m3/kg) > BA (853.79× 10⁻⁸ m3/kg) (Table 2). The values obtained are within the range formerly reported for coal combustion ashes [41,61,62]. Veneva et al., (2004) noted differences in the magnetic susceptibility of ash with sampling locations (mechanical collectors vs. electrostatic precipitators) and attributed them to differences in combustion technologies, which is not the case in the current research. Although no significant linear correlations were found between magnetic susceptibility and ferromagnetic mineral content, bulk ECO grits had higher contents of ferromagnetic minerals [49], explaining the observed higher magnetic susceptibilities.
Examples of isothermal remanent magnetization (IRM) curves and their respective analysis using the CLG and SGG functions are shown in Figure 1 and Table 2. IRM depends on the relative concentrations of low-coercivity minerals (e.g., magnetite) vs. high-coercivity minerals (e.g., hematite), and its deconvolution can provide information about the contributions of the different components to the total remanence [51,55].
The value at saturation (SIRM) provides information about the relative concentration of the different magnetic populations, whereas B1/2 and DP represent the mean coercivity and the dispersion parameter, respectively. After unmixing, all samples show the contribution of two magnetic components (Figure 1). Because most of the coercivity distributions are skewed, we opted to unmix the IRM curves using the SGG function of the MaxUnmix software. Component 1 is a low coercive phase with B1/2 in the range 36–49 mT, typical of magnetite/maghemite [63], while component 2 corresponds to a high coercive phase with B1/2 355–562 mT, interpreted to be hematite [51,64]. Component 1 contributes to 92–96% of the total remanence in all samples (Table 2, Figure 1). DP varies from 0.29 to 0.33, indicating moderate variability in the physical and chemical parameters affecting microcoercivity [63]. The presence of magnetite and hematite is corroborated by the mineralogical composition determined by XRD [49]. The S-ratio close to 1 (Table 2) indicates a predominance of low coercivity magnetic phases such as magnetite and maghemite [56]; however, the lack of saturation at the field applied indicates the presence of high coercive phases such as hematite and goethite.

3.2. Yield and Particle-Size Distribution

The yields using the Fe magnet ranged between 4.5 and 13.1 wt.%, while those using the Nd magnet ranged between 8.9 and 53.4 wt.% (Table 6). In both cases, the highest yields were obtained for the economizer grits, although this does not linearly correlate with the Fe2O3 content in bulk ash (Table 6).
Sieving results show substantial differences in the particle-size distribution of the MC related to the type of sample and the type of magnet used. In general, the MC collected from the BA is significantly coarser than the ones collected from ECO and ESP (Figure 2), mirroring the coarser nature of BA bulk ash [49]. The Nd-MC from BA and ECO are coarser than the corresponding Fe-MC, with the fraction > 150 µm representing 60.3 wt.% and 28.5 wt.%, respectively (Figure 2). The detailed imaging analysis of the referred MC (Figure 3A–D) shows a greater occurrence of particles with dimensions > 1 mm, which are mainly agglomerates, corroborating the differences found by sieving. Furthermore, in the Fe-MC, agglomerates are more often observed in BA than ECO, where discrete Fe-rich morphotypes such as ferrospheres are more common (Figure 3A,C). On the other hand, the particle size distribution of the MC collected from the ESP FA samples studied is similar, with more than 40 wt.% of the particles being <25 µm in size (Figure 2), which agrees with reported data [23,29,32].
Given the coarser nature of MC from BA, it was decided to sieve the fraction > 150 µm (sieves 4, 2, 1, and 0.5 mm) and select representative size-fractions for chemical characterization.

3.3. Mineralogy and Iron Oxidation State

The minerals and phases present in the MC were assessed using XRD and Mössbauer spectroscopy, and the results are listed in Table 3, Table 4 and Table 5.
All MCs are mainly composed of an amorphous phase (46.2–77.1 wt.%, Table 3), and Nd-MC have on average 15 wt.% more amorphous than Fe-MC (Table 3). The amorphous phase is mainly attributed to the aluminosilicate glass but also includes char. The parameters obtained from Mössbauer spectra confirm that some iron is found associated with aluminosilicate glass in the form of Fe2+ and Fe3+ (Table 4), in agreement with what was previously verified using SEM/EDS and corroborating other authors’ work [26,30,41,65,66,67].
The main crystalline phases (>10 wt.% avg.) composing Fe-MC are quartz (5.5–17.4 wt.%), magnetite (4.4–19.9 wt.%), and mullite (6.2–14.2 wt.%), while minor phases (1–10 wt.% avg.) comprise magnesioferrite (0.8–8.3 wt.%), hematite (2.0–1 wt.%), diopside (0.9–5.5 wt.%), albite (1.3–2.4 wt.%), and maghemite (up to 2.3 wt.%) (Table 3). Accessory minerals (<1 wt.%) include rutile, hercynite, calcite, gypsum, calcium aluminate, cordierite, anhydrite, and cristobalite. The association of non-magnetic minerals/phases in the MC was previously reported, and it was generally assigned to intrinsic features of the material, i.e., Fe-oxide crystallization on an aluminosilicate matrix and intimate association between different particles [23,24,26,29,30,41,68]. However, the power station’s particulate filtration equipment also plays a role in the distribution of these phases. For example, magnesioferrite occurs in higher amounts in the MC recovered from ECO FA, 8.3 wt.%, which may be due to larger size and higher density particles being mostly captured at this intermediate point.
In the Nd-MC, quartz (11.4–29.6 wt.%) and mullite (5.4–13.2 wt.%) are the major crystalline phases, followed by albite (0.9–2.0 wt.%) (Table 3), while magnesioferrite is absent and the remaining Fe-crystalline phases detected occur below 1 wt.%.
Overall, the predominant Fe-bearing minerals in Fe-MC are magnetite, hematite, and magnesioferrite (Table 3), which are in agreement with previous works (e.g., [29]). These phases derive from the thermochemical conversion of Fe-bearing minerals present in feed coals (e.g., pyrite, siderite, and illite; [44]) during combustion producing melts of complex composition (FeO-SiO2-Al2O3-CaO-MgO) that will subsequently cool and crystallize [34,67,69]. During the cooling of the molten particles, the oxidation potential increases, and Fe2+ partially oxidizes to Fe3+ leading to the precipitation of magnetite or a mixture of magnetite and hematite [26], as observed in the studied MC. Magnesioferrite is the highest temperature mineral in the magnetite spinel series, and its occurrence suggests the involvement of other minerals rather than pyrite since Mg tends to be associated with silicates or dolomite in coal [26,68].
Mössbauer spectra of the Fe-MC are shown in Figure 3. Three sextets are necessary to fit the outer peaks of the spectra, which is particularly clear in the spectra from ECO and FA Fe-MC (Figure 4). The estimated parameters (Table 4) are typical of Fe3+ in hematite, magnetite/maghemite and Fe2.5+ on the octahedral sites of magnetite [70,71]. The sextet attributed to Fe3+ in magnetite/maghemite results from the contribution of Fe3+ in magnetite phases with different oxidation degrees that may reach almost complete oxidation, corresponding to maghemite. It should be noted that Fe in MgFe2O4 detected by XRD (Table 3) has hyperfine parameters very similar to those of Fe3+ in magnetite, maghemite, or hematite [70,71,72]. Therefore, when present, the MgFe2O4 spectrum is not resolved from those of the binary Fe oxides.
The remaining resonant absorption may be fitted with two doublets, which represent the average spectra of Fe3+ and Fe2+ in paramagnetic phases. Considering the phases detected by XRD, Fe3+ is present in aluminosilicates, Fe2+ in silicates, and hercynite [73]. Both Fe3+ and Fe2+ are also present in the Fe-containing silicate glasses, as observed by SEM/EDS [49,74,75]. The asymmetry of the Fe3+ doublet is typical of distributions of quadrupole splittings in amorphous phases [74,75]. The composition of the Fe-MC deduced from the present Mössbauer data is comparable with other examples reported in the literature [30,66,76,77].
Assuming that the recoil free fractions are similar for all the Fe species in these samples [74], the relative areas of the doublets and sextets fitted to the spectra are a good approximation of the fraction of Fe atoms contributing to them. The Fe3+/total Fe ratios for each sample (Table 5) are calculated considering that half of the Fe cations giving rise to the Fe2.5+ sextet of magnetite are in the 3+ oxidation state and the other half in the 2+ oxidation state.
The Fe-MC from campaign S1 has a higher content of hematite (Table 4) and a higher Fe3+/total Fe ratio (Table 5) than the samples from campaign S4. In Fe-MC from both sampling campaigns, the fraction of Fe in magnetically ordered oxides increased along the series BA < ECO < ESP12, corroborating the XRD results obtained for Fe-MC from S1 (Table 3).

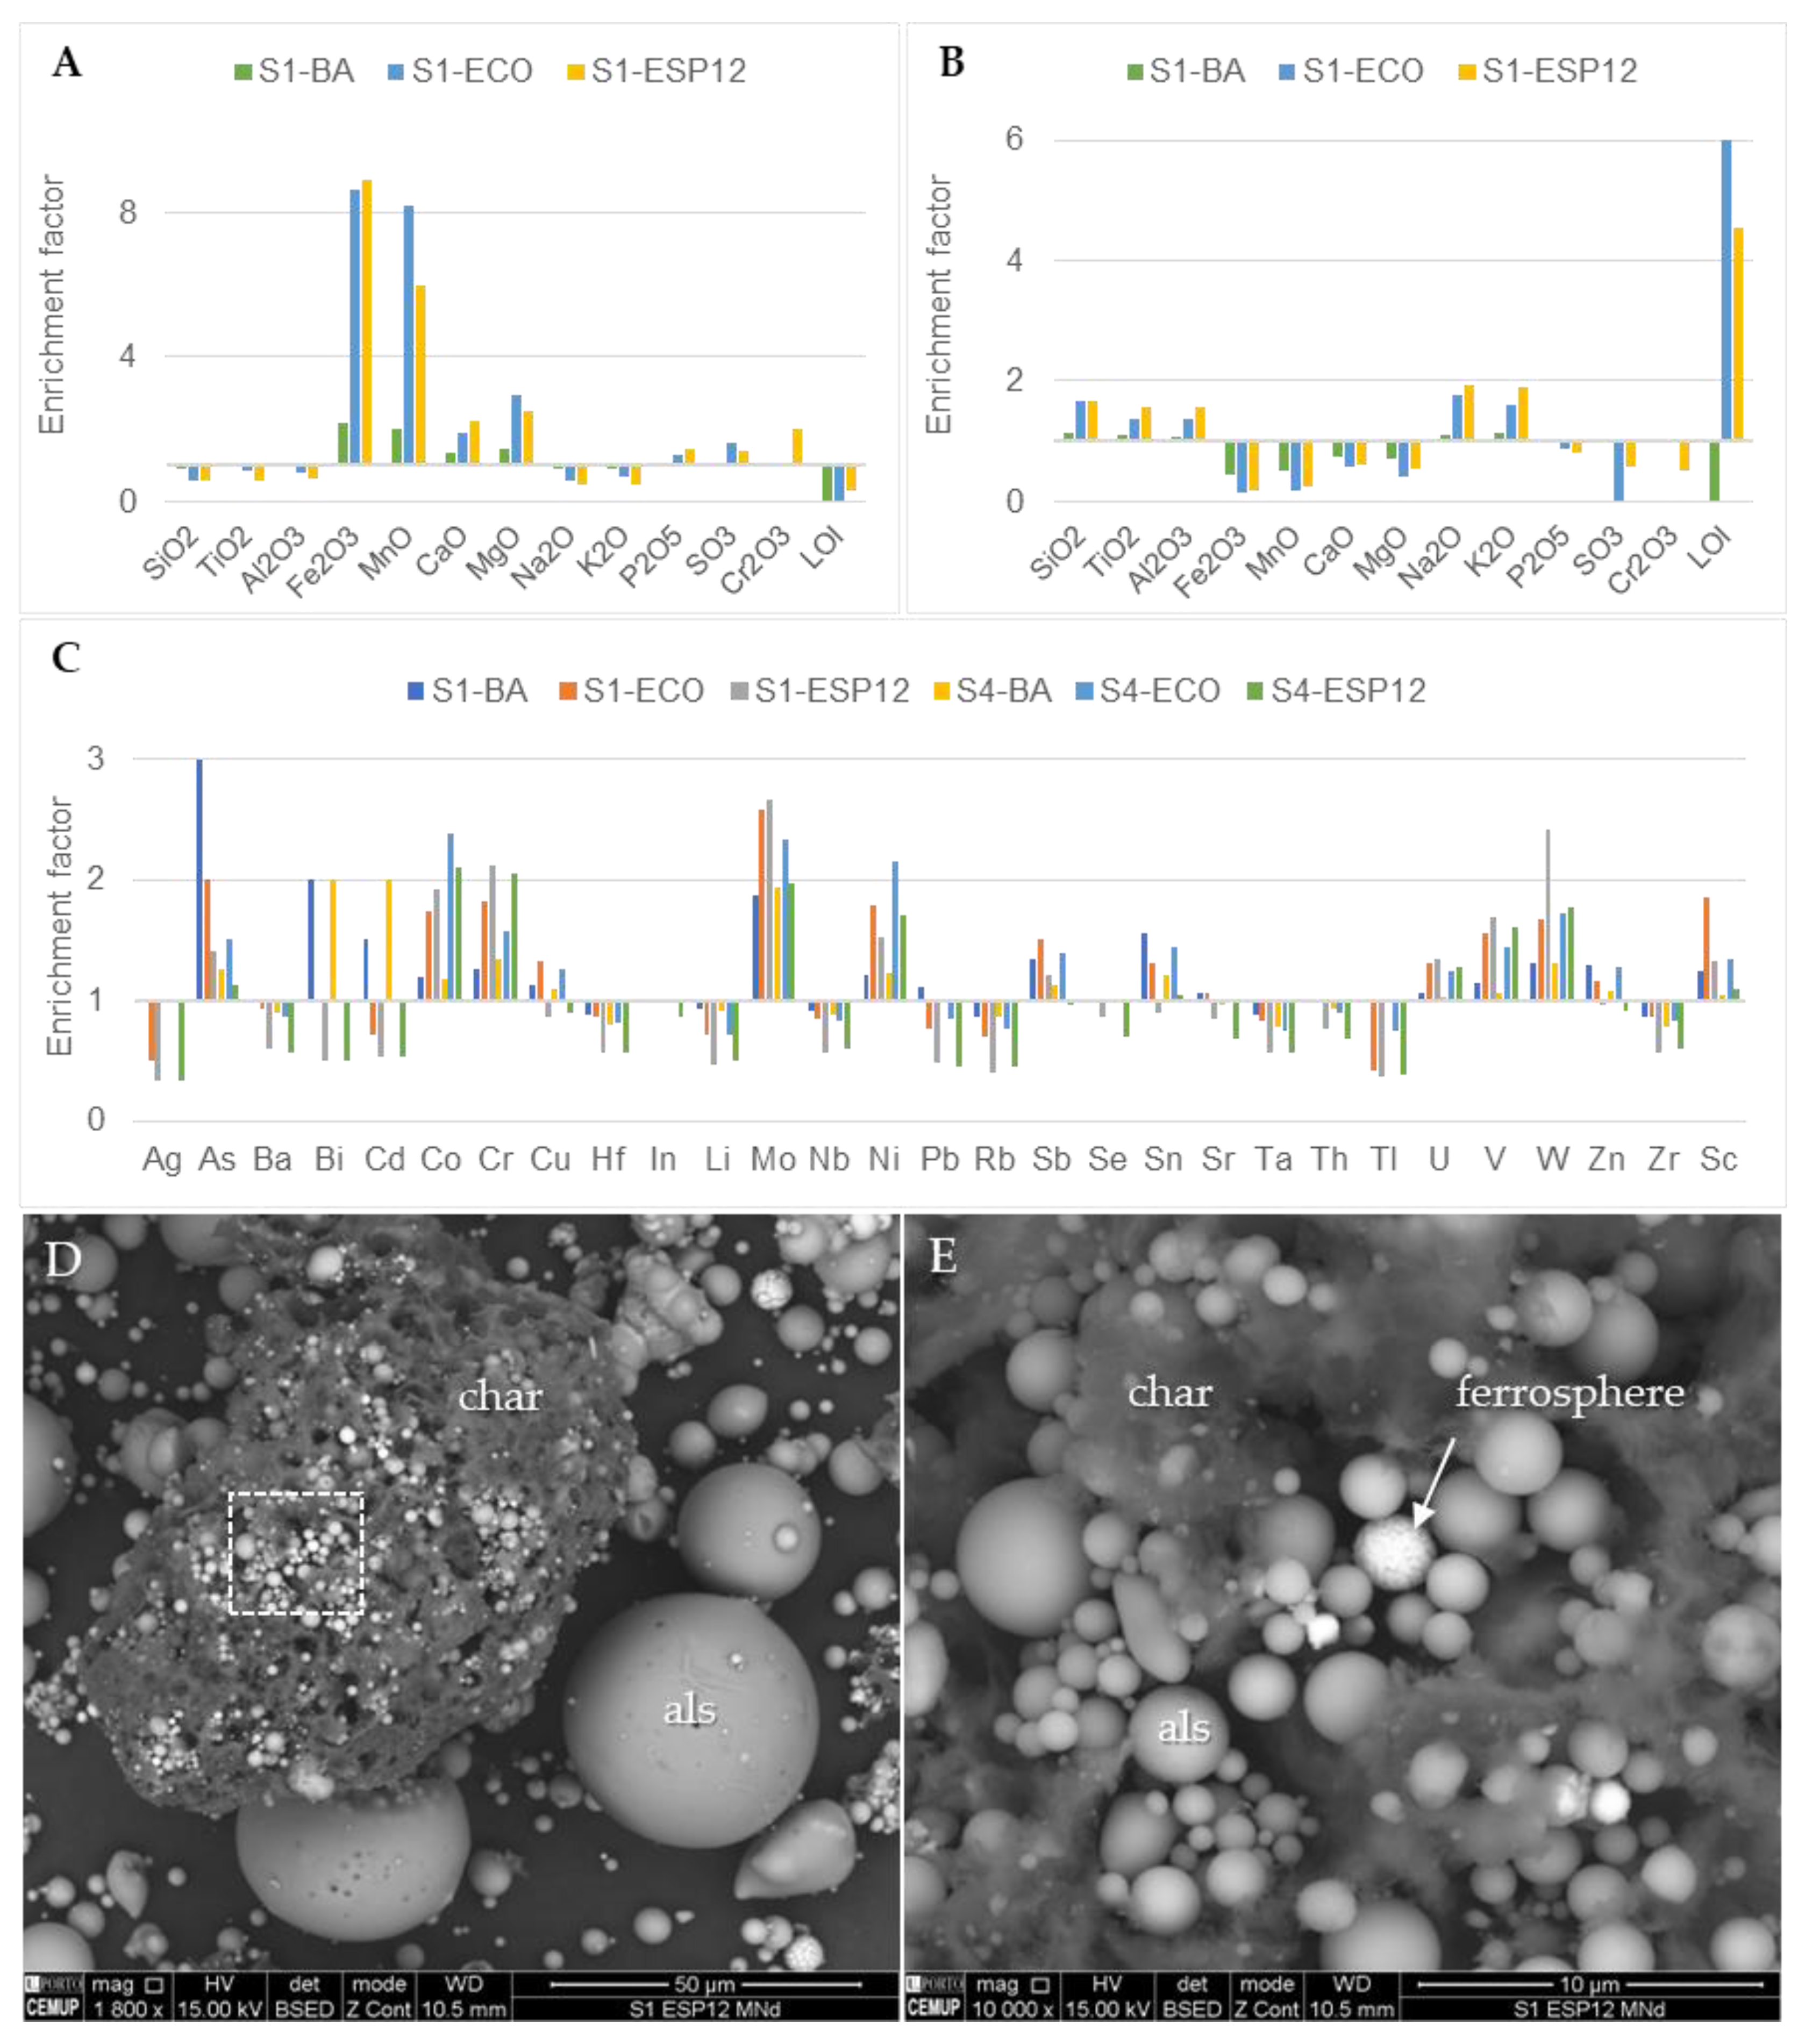
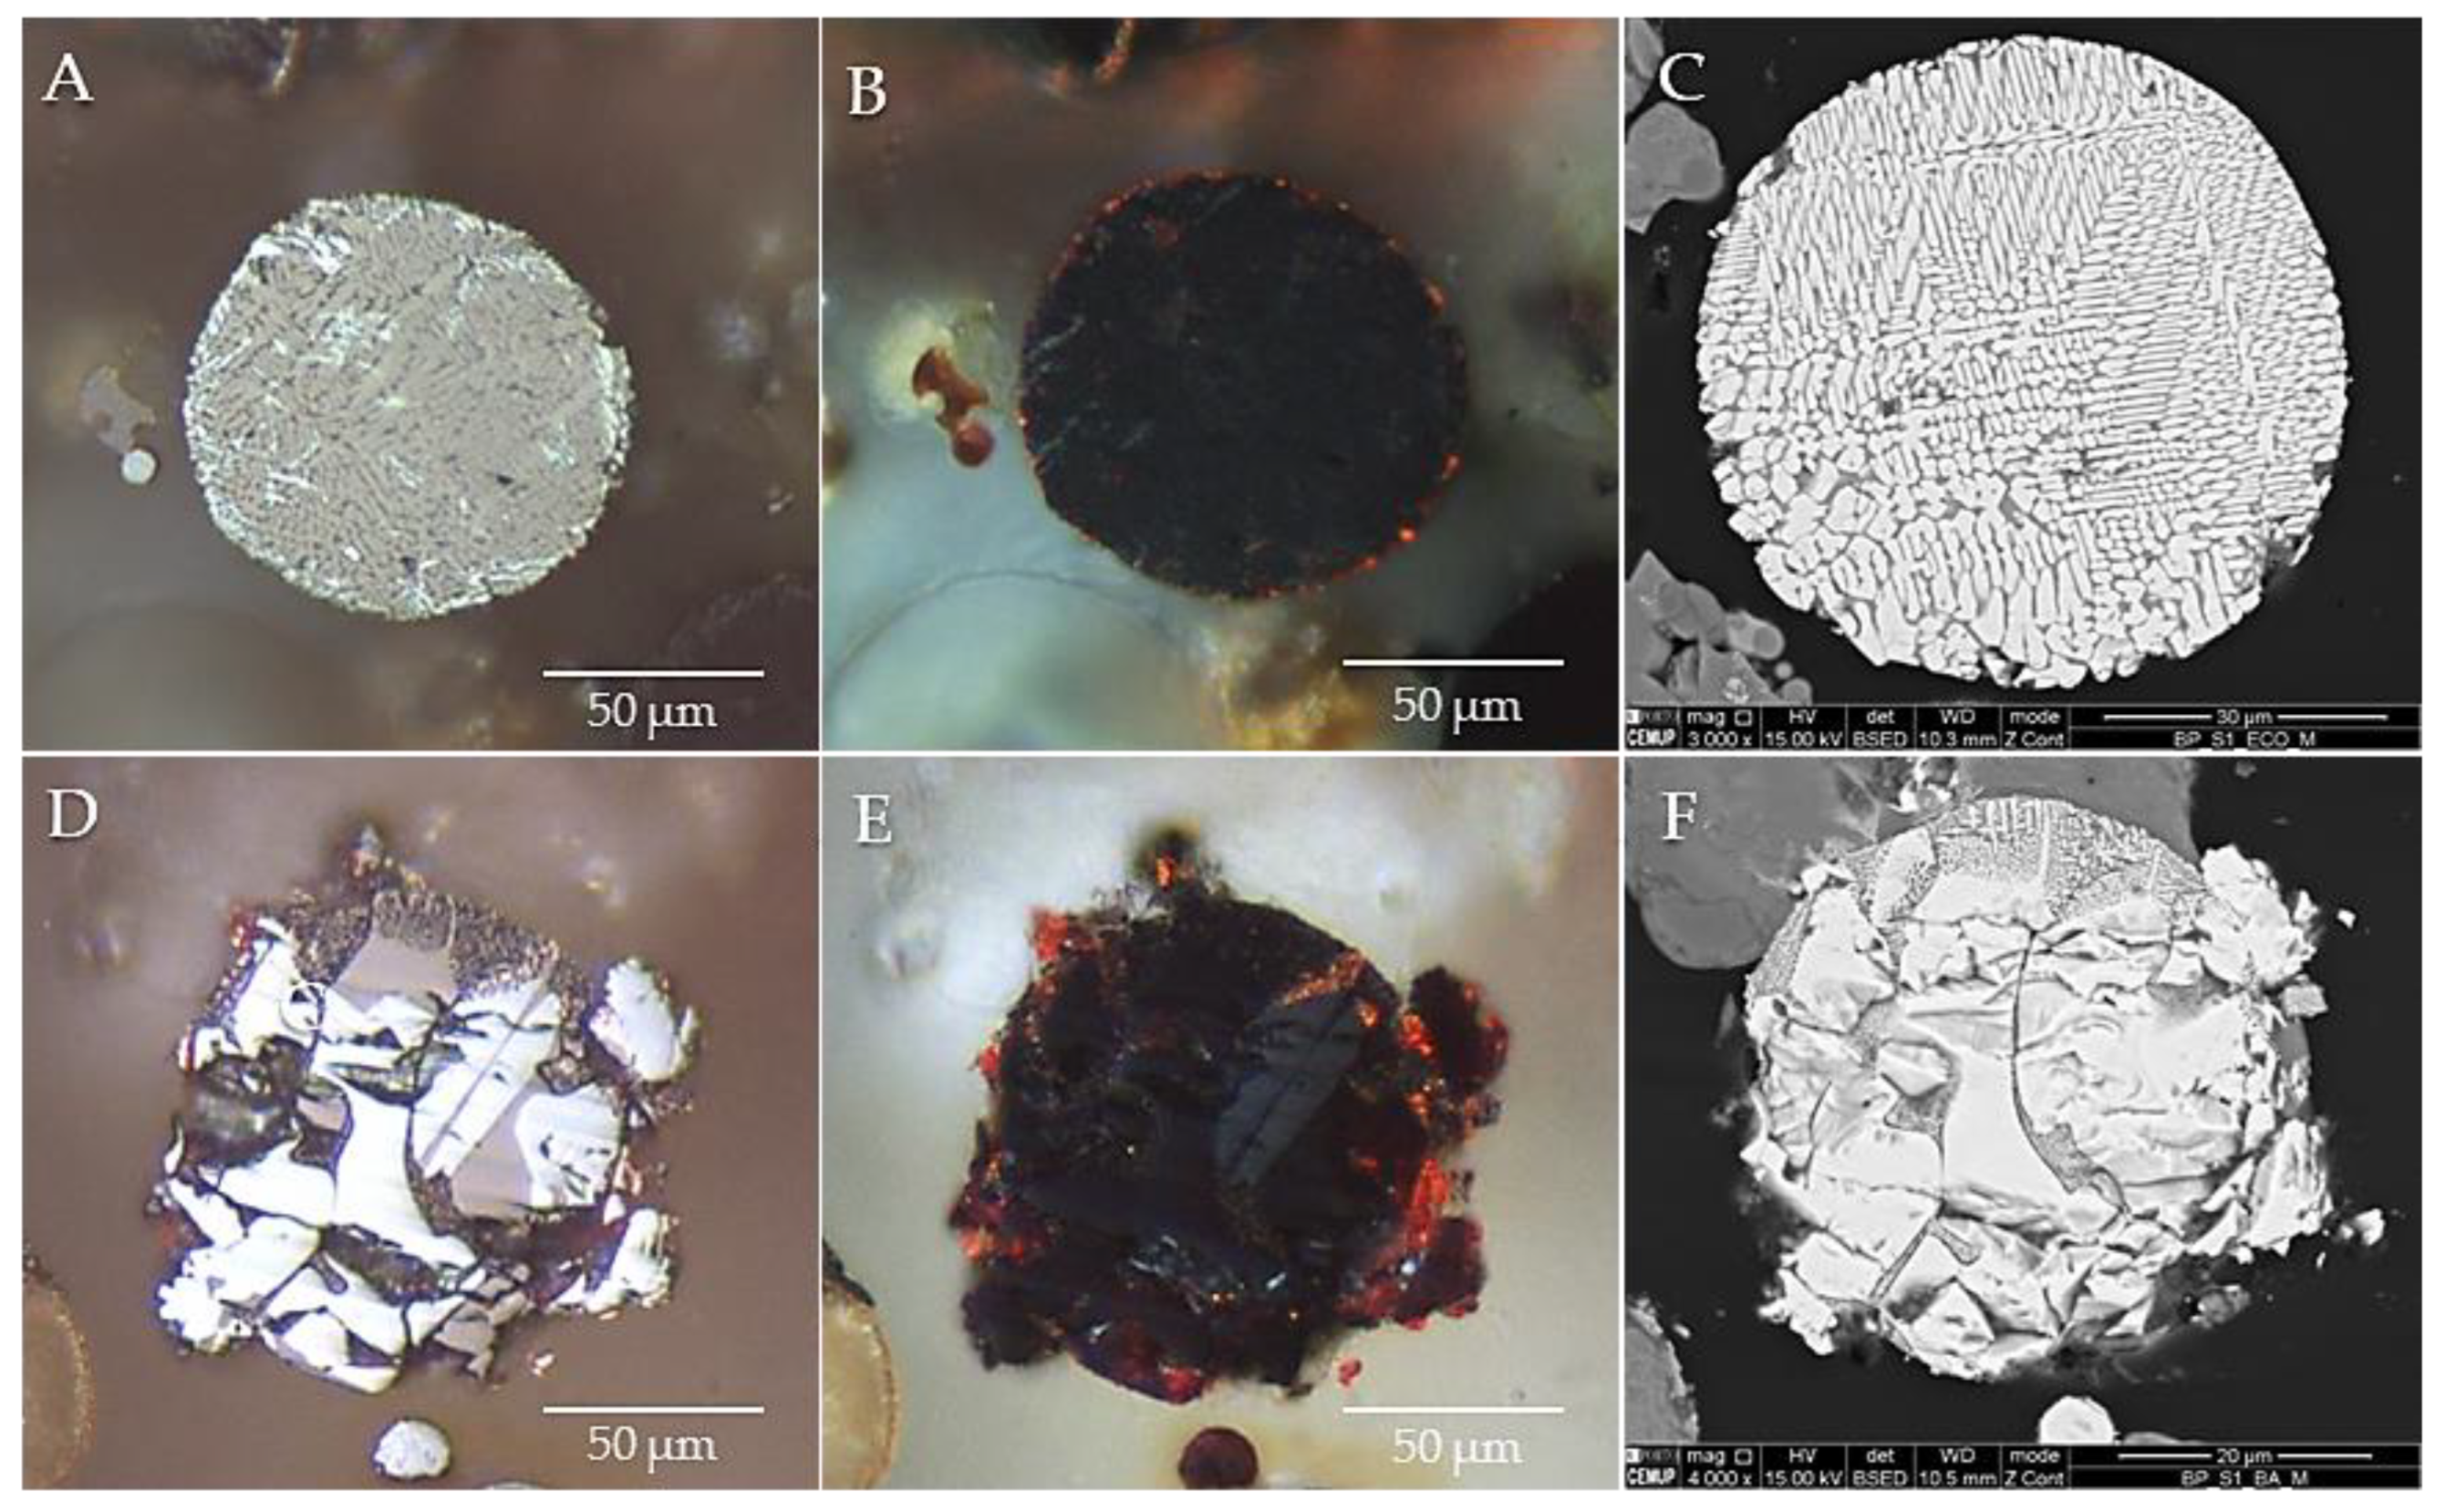
3.4. Occurrence, Morphology and Microtexture

The SEM/EDS was employed to obtain detailed imaging of powder MC samples to assess Fe-bearing phases’ modes of occurrence (i.e., spatial relations), morphology, and microtexture.
In magnetic concentrates collected from BA and ECO FA, the Fe-bearing phases are often found embedded in agglomerates, especially in the coarser fractions (>150 μm; Figure 4). The occurrence of agglomerates in coal combustion ash has been reported previously [78,79,80,81,82]. These are essentially composed of micrometric particles with variable composition bonded either directly to each other (interrupted coalescence) or through an aluminosilicate matrix (weld pool) [78,82]. Hence, Fe-bearing phases in MC from BA and ECO are found bonded to other particles (Figure 5A,B), as crystalline phases within an amorphous matrix (Figure 5C,D) and as discrete Fe-bearing morphotypes embedded in the aluminosilicate matrix (Figure 5E). The aluminosilicate glass matrix itself contains variable amounts of iron, as confirmed by EDS spectra (Figure 5), which was also observed in the bulk ash samples [49] and agrees with Mössbauer’s results (Table 4).
Most of the Fe-morphotypes in FA MC and finer fractions of ECO and BA MC occur as spherical particles, close to ideal spheres, with sizes ranging from a few micrometers up to 100 μm and containing variable amounts of glass matrix (Figure 6). A wide range of microtextures are observed and can frequently be directly attributed to the spinel crystal facets [26]. That is the case of the sphere shown in Figure 6A, where the octahedral crystals have the appearance of triangles. Skeletal and dendritic (Figure 6B) are the most common microtextures in the studied MC. These microtextures, along with the predominance of Fe in the EDS spectra (Figure 6A,B), are distinctive features of the morphotypes designated as ferrospheres [26,28,31,48]. Therefore, it can be assumed that they are predominant in the studied MC. Nevertheless, monoblock spheres consisting of large crystals without an evident glass matrix (Figure 6C) and blocklike structures exhibiting regular polygons embedded in an aluminosilicate matrix (Figure 6D) are also observed. Molten drops (Figure 6E), mixed microtextures (Figure 6F), solid shells (no aluminosilicate glass matrix, Figure 6G), and fragments (Figure 6H) are less frequently observed. No partially decomposed material or relics (e.g., pyrite) were observed in opposition to what have been reported for ashes derived from non-benefited coals, e.g., fly ashes derived from Indian coals studied by [48].
The Fe-bearing morphotypes’ internal and external structure have been related by some researchers to the formation conditions, namely furnace design, coal composition, temperature, and cooling conditions [83,84]. Sokol et al. (2002) attributed skeletal and dentritic microtextures to the crystallization under drastic supercooling and related the high catalytic activity of these morphotypes to the high-index facets formed during the process, which are absent in slow-forming natural crystals. However, recent systematic research conducted in narrow fractions of magnetic concentrates correlating major elements and specific microtextures through SEM/EDS analysis suggests that specific minerals may act as precursors of the studied microtextures; e.g., illite is the precursor of skeletal-dendritic microtextures [42,43,46].
The MC collected with the Nd magnet is significantly different from the Fe-MC as aluminosilicate glass is the predominant phase, and the Fe-bearing phases are mostly associated with agglomerates while Fe-discrete particles are scarce. This is because the iron-rich particles were previously collected by the ferrite magnet, and the final stage with the neodymium magnet mainly collects paramagnetic particles, Fe-poor glass, and glass agglomerates with ferrospheres attached (Figure 5).

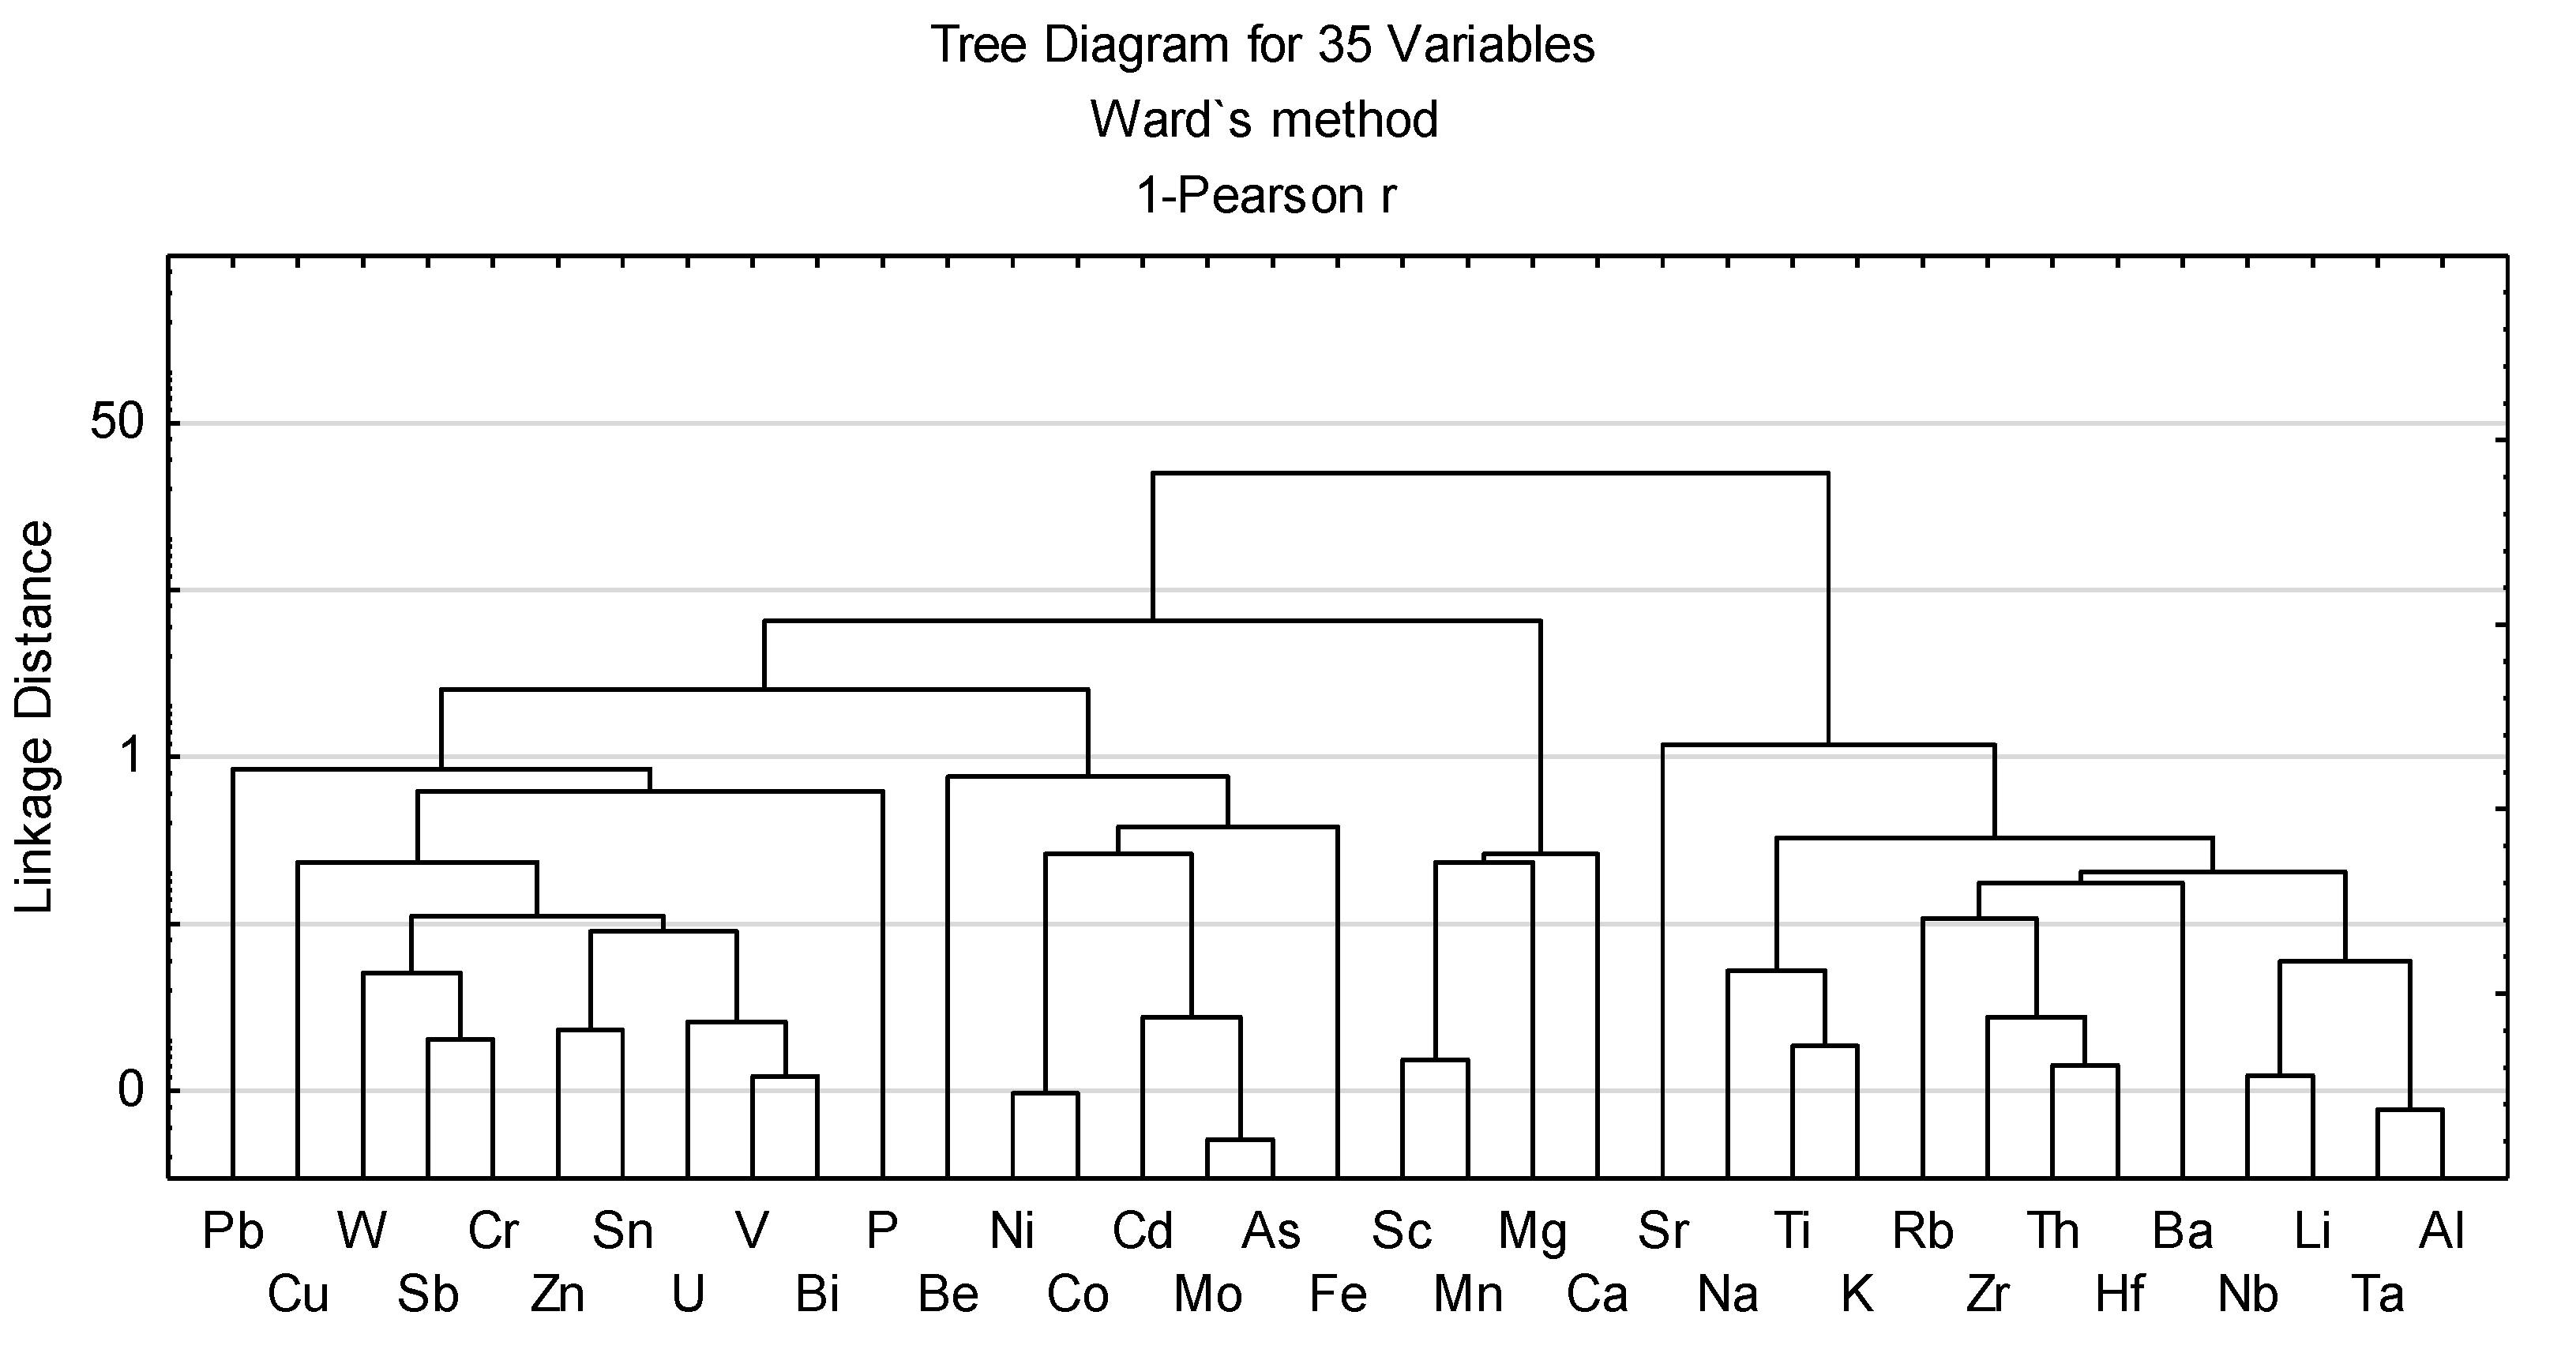
3.5. Chemical Composition

The chemical composition of the magnetic concentrates (MC) and respective size fractions obtained by dry sieving is listed in Table 6 and Table S1 (bulk ashes added for comparison purposes).
The Fe-MC presents a Fe-rich (14.87 to 44.16 wt.% Fe2O3) aluminosilicate composition (SiO2 plus Al2O3 in the range 45.67–76.59 wt.%), agreeing with the previous reported data (e.g., [29,41]), enriched in MnO, CaO, MgO, Na2O, and P2O5 comparatively to the respective tailings (Figure 7A). The enrichment factors (EF) of MnO are the closest to the ones found for Fe2O3 (Figure 7A), which is most likely related to Mn’s ability to substitute for Fe in the spinel structure (e.g., [85]). The average Fe2O3 content among the Fe-MC decreases as follows: ESP12 (43.07 wt.%) > ECO (35.43 wt.%) > BA (15.88 wt.%). This is related to the mode of occurrence of the Fe-bearing morphotypes as assessed by SEM/EDS (Section 3.2).
Contrasting with the Fe-MC, the Nd-MC are mainly composed of SiO2 and Al2O3 (average of 63.83 and 18.76 wt.%, respectively), with higher contents of NaO, K2O2, and TiO2 (Figure 7B), which is in agreement with mineralogical data (Table 3) and observations under SEM/EDS (Section 3.2). Nevertheless, it is interesting to note that Nd-MC has higher carbon contents than Fe-MC (Table S1). In bulk ash samples, carbon occurs mainly as char [49], and the particles were most probably collected by the Nd-magnet due to Fe-bearing phases infilling its pores (Figure 7D,E). The tailings after sequential separation using ferrite and Nd magnets are mainly composed of SiO2 and Al2O3 (Table 6). The sharpest decrease in Fe2O3 compared to the bulk ash sample is verified for ECO FA, at approx. 75 wt.% (Table 6).
In general, the elemental composition of major elements determined via ICP-MS linearly correlates with results obtained via XRF, with stronger correlations found for Fe and Mn (r = 0.99). The weaker linear correlation is found for Cr (r = 0.53), whose values as oxide obtained via XRF are close to the detection limit (0.01 wt.%), making its determination via ICP-MS more accurate. Except for Cr, the enrichments assessed above are similar using XRF and ICP-MS results. In this sense, XRF could be used for a fast and cheaper assessment of major elements of the studied samples however, information regarding trace elements, discussed below, would be omitted.
The Fe-MC presents slight enrichments in the following elements relative to the respective tailings (average EF: 2.2–1.2): Mo > Co > As > W > Cr > Ni > V > Sc > Sb > Sn > U (Figure 7C). Other elements, such as Cu and Zn, are enriched in Fe-MC from BA and ECO (EF 1.2–1.3), while Bi, Cd, and Pb are enriched in BA Fe-MC (EF 1.0–2.0) (Figure 7C). Compared to the average values for world coal ashes (WCA, [86]), only V is slightly enriched in Fe-MC from ESP FA (concentration coefficient, CC, between 2 and 5), and it could be concluded that FA could be a secondary source of this element, which is a critical raw material [87]; however, the contents found are below the economic cut-off (1000 ppm; [88]). Regarding the Nd-MC, all trace elements analyzed are depleted or close to the average values for WCA and CC up to 2 (Table 6).
Although some objections have been reported recently [89,90,91], hierarchical cluster analysis and Pearson’s correlation coefficients were used to obtain information concerning organic and inorganic affinities and potential relations between the elements [92,93,94]. Elements with more than 10% of the values below the detection limit (bdl) were excluded to avoid skewness in the results. The bdl values considered for the analysis were replaced by bdl/2.
The associations between major and trace elements in Fe-MC are broadly indicated by the dendrogram in Figure 6, and the correlation coefficients (CC) are presented in Table S2. Iron has significant positive correlations (at ρ < 0.05) with Mo and Sc (r > 0.92), Mn and As (r > 0.90), Cd (0.86), and Ni (r > 0.85) (Table S2, Figure 8). Among these elements, two groups are distinguished based on their positive relations (r > 0.9, at ρ < 0.05), which suggest a common occurrence: (a) Mn and Sc; (b) Mo, As, Cd, and Ni (Figure 8). On the other hand, Fe is negatively correlated with elements usually associated with the glass phase such as Al, K, Na, and Ti (r > −0.94 at ρ < 0.05) (Table S2). This negative relationship does not mean that Fe does not exist within the aluminosilicate phase (which Mössbauer and SEM/EDS analysis have shown it to do), only that there is no relationship. Most likely, however, the Fe-originating from pyrite decomposition present in feed coals (Table 1) is the main source of Fe in these ashes, which explains its weak correlation with aluminosilicates.
Transition metals such as Mn and Ni that were found to be significantly correlated with Fe in MC have long been reported to be enriched in magnetic fractions from coal combustion ashes, which was mainly due to their ability to isomorphically replace Fe ions in the crystal lattice of spinels [24,25,27,29,41,68,69,85]. Nevertheless, these elements may also be found absorbed on particle surfaces, in the aluminosilicate matrix, or in discrete minerals associated with Fe-bearing morphotypes in agglomerates [69].
The Fe-MC size fractions show that the content of Fe and the elements associated with it (e.g., Mg, Co, Cr, Cu, Mo, and Ni) increase with decreasing particle size (Table S1). A similar trend was observed by [23] for Fe, Cr, and Ni in MC collected from FA derived from high-sulfur coal from the Illinois Basin. The highest variation in the Fe content is observed for the ECO Fe-MC sample, which triples from the >150 μm to the >45 μm fraction, from 7.04 to 23.39% (Table S1). Pearson’s correlation coefficients based on size-fraction geochemistry reinforce the Fe positive correlations found in bulk MC (Table S2; Figure 8) and reveal other significant positive correlations (at ρ < 0.05) with Mg (r = 0.97), Co (r = 0.81), Ca (r = 0.72), Cr (r = 0.64), Sb and U (r = 0.60), and V (r = 0.64) (Table S3). Except for Ca, the referred elements exhibit positive correlations, suggesting a common source. The Co, Cr, and V, as previously noted for Mn and Ni, can substitute for Fe in the spinel structure, which may justify the correlations found. Calcium appears positively correlated (r >0.57, at ρ < 0.05) with Mg, Mn, and Sc (Table S3), which was subsequently explained by their occurrence in morphotypes such as the one later presented in Figure 12. The negative correlation of Fe with Al, although significant at ρ < 0.05, is not as strong as observed for bulk Fe-MC (r = −0.68, Table S3).
Elements concentrations in the Nd-MC size-fractions vary within a narrower range, revealing a more homogeneous composition than in the Fe-MC (Table S1), which is in agreement with observations under SEM/EDS. Nevertheless, an increase in Fe content is observed with the decreasing particle size in Nd-MC <150 μm size-fractions from ECO grits, 1.5% on average (Table S1). By contrast, in Nd-MC from BA, the Fe content, along with Mg and Mn, decreases with decreasing particle size by approximately 1% (Table 6).

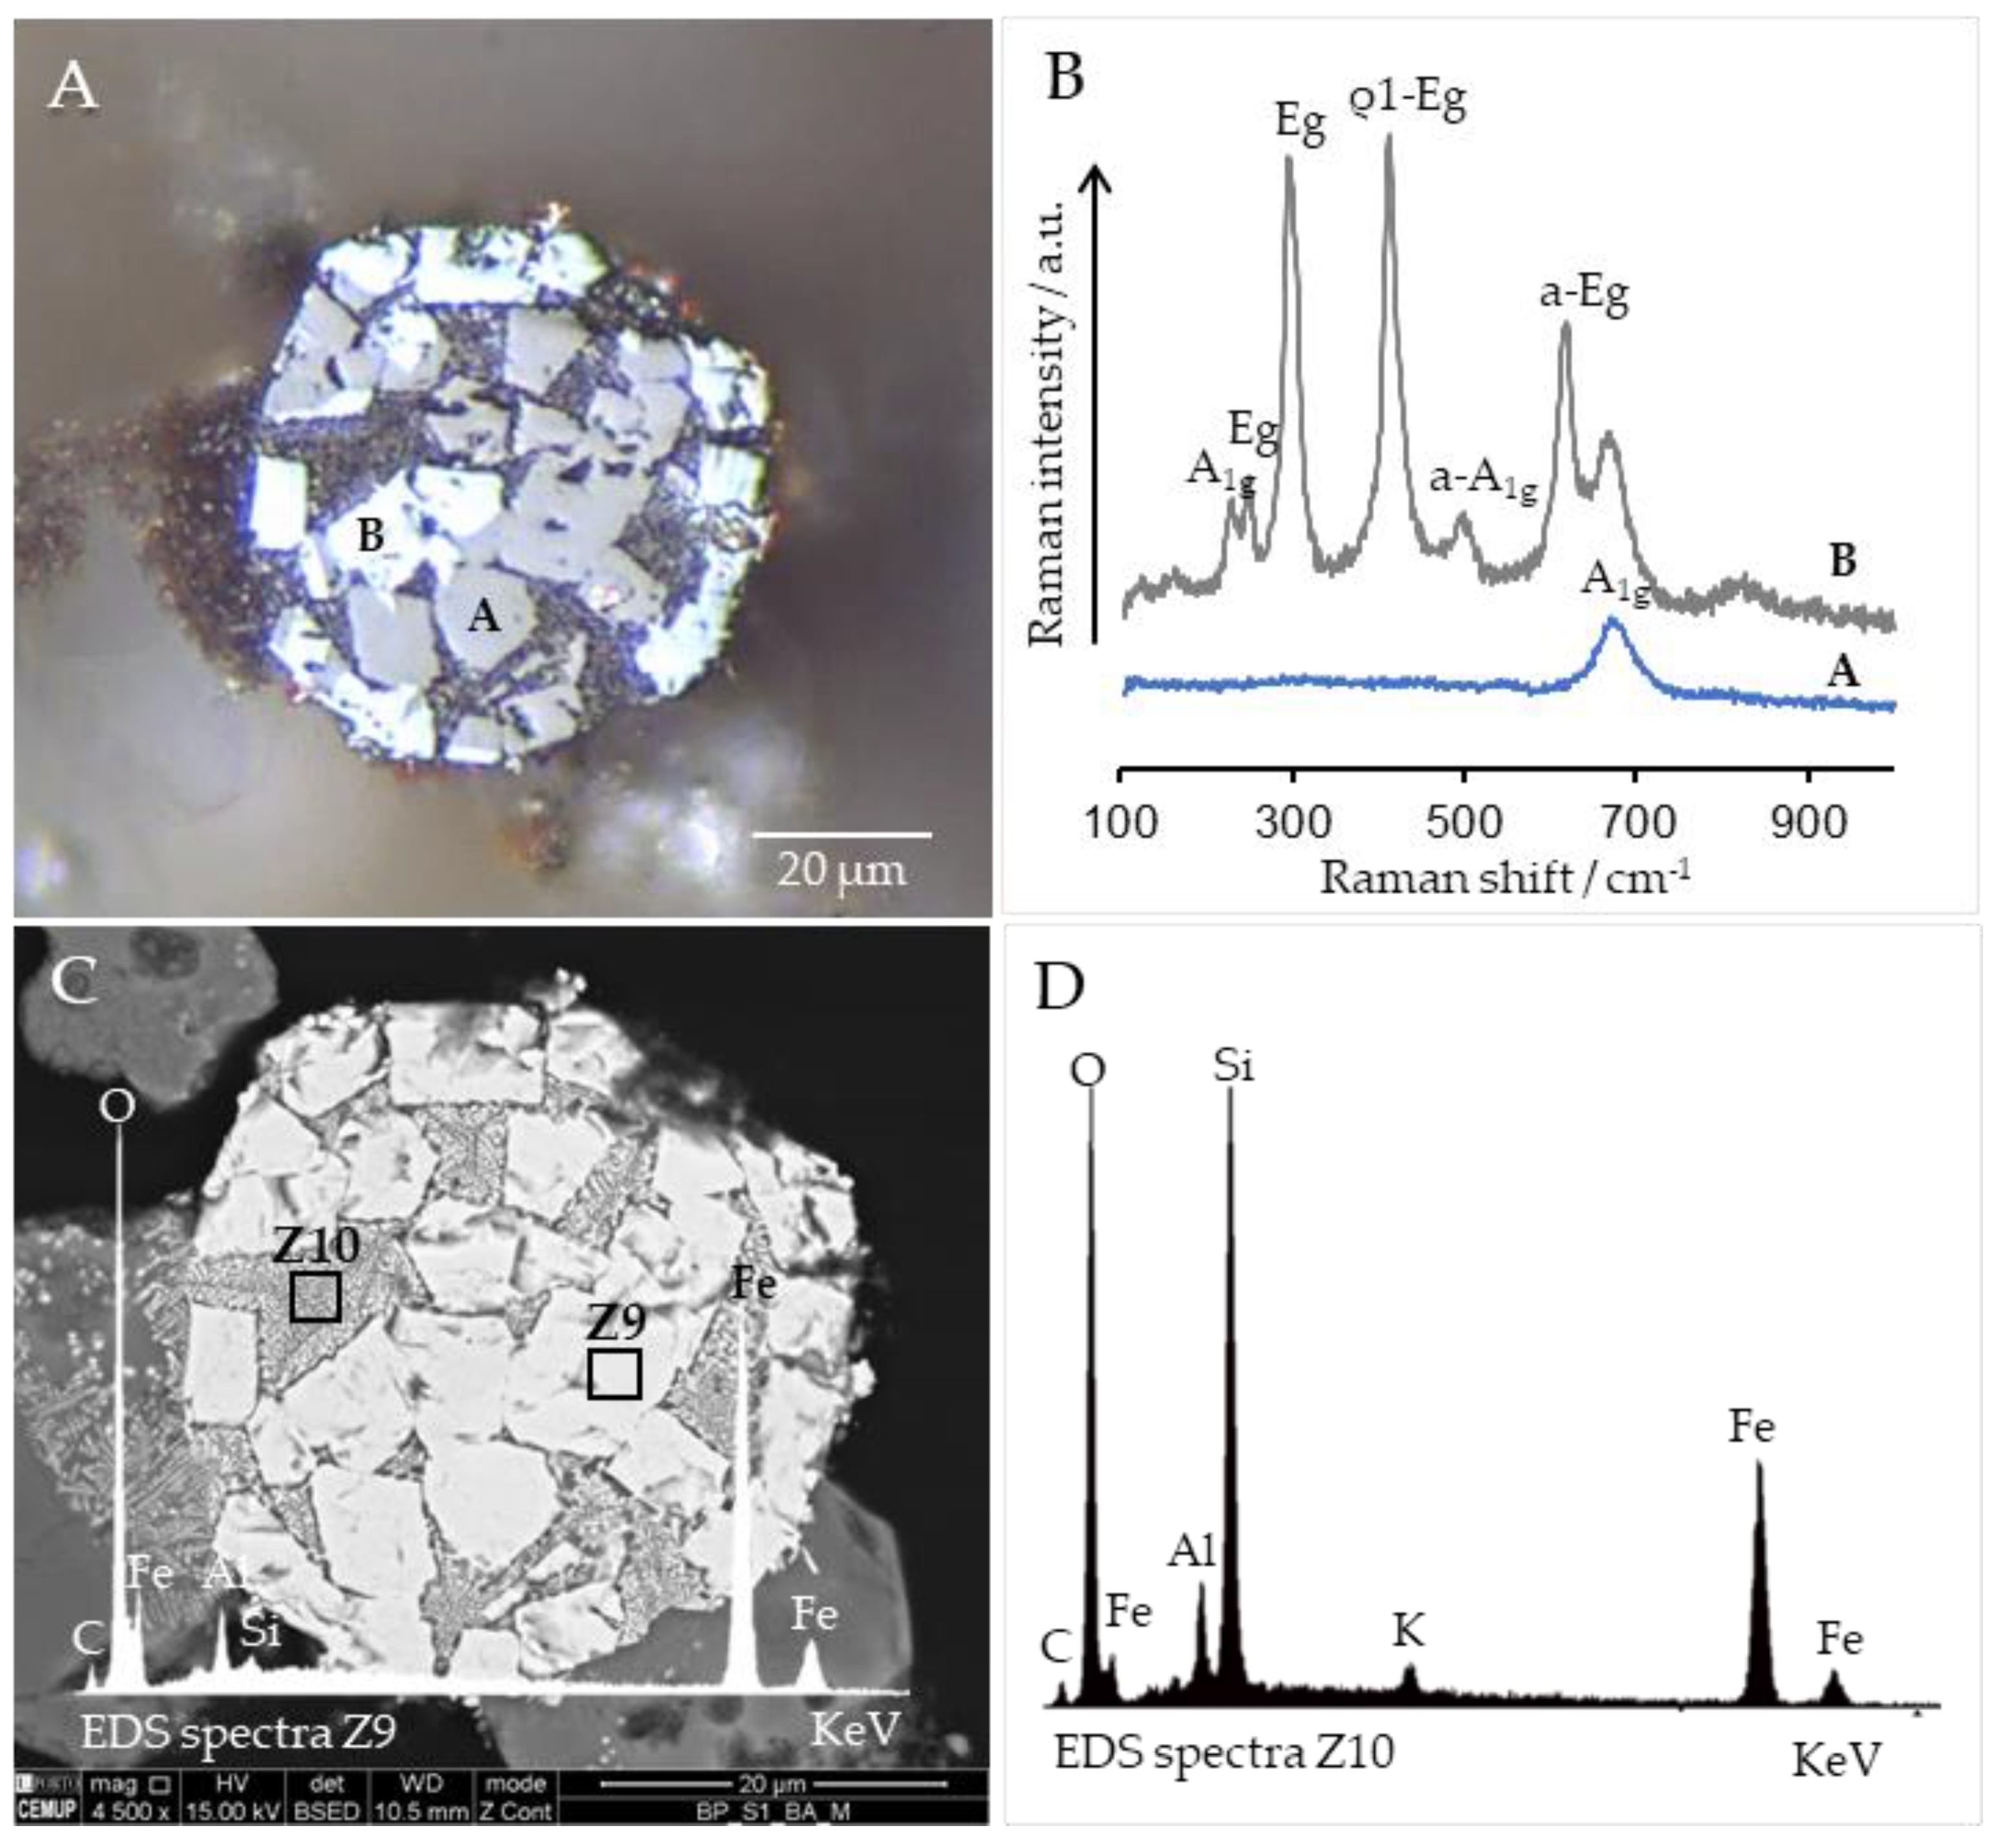
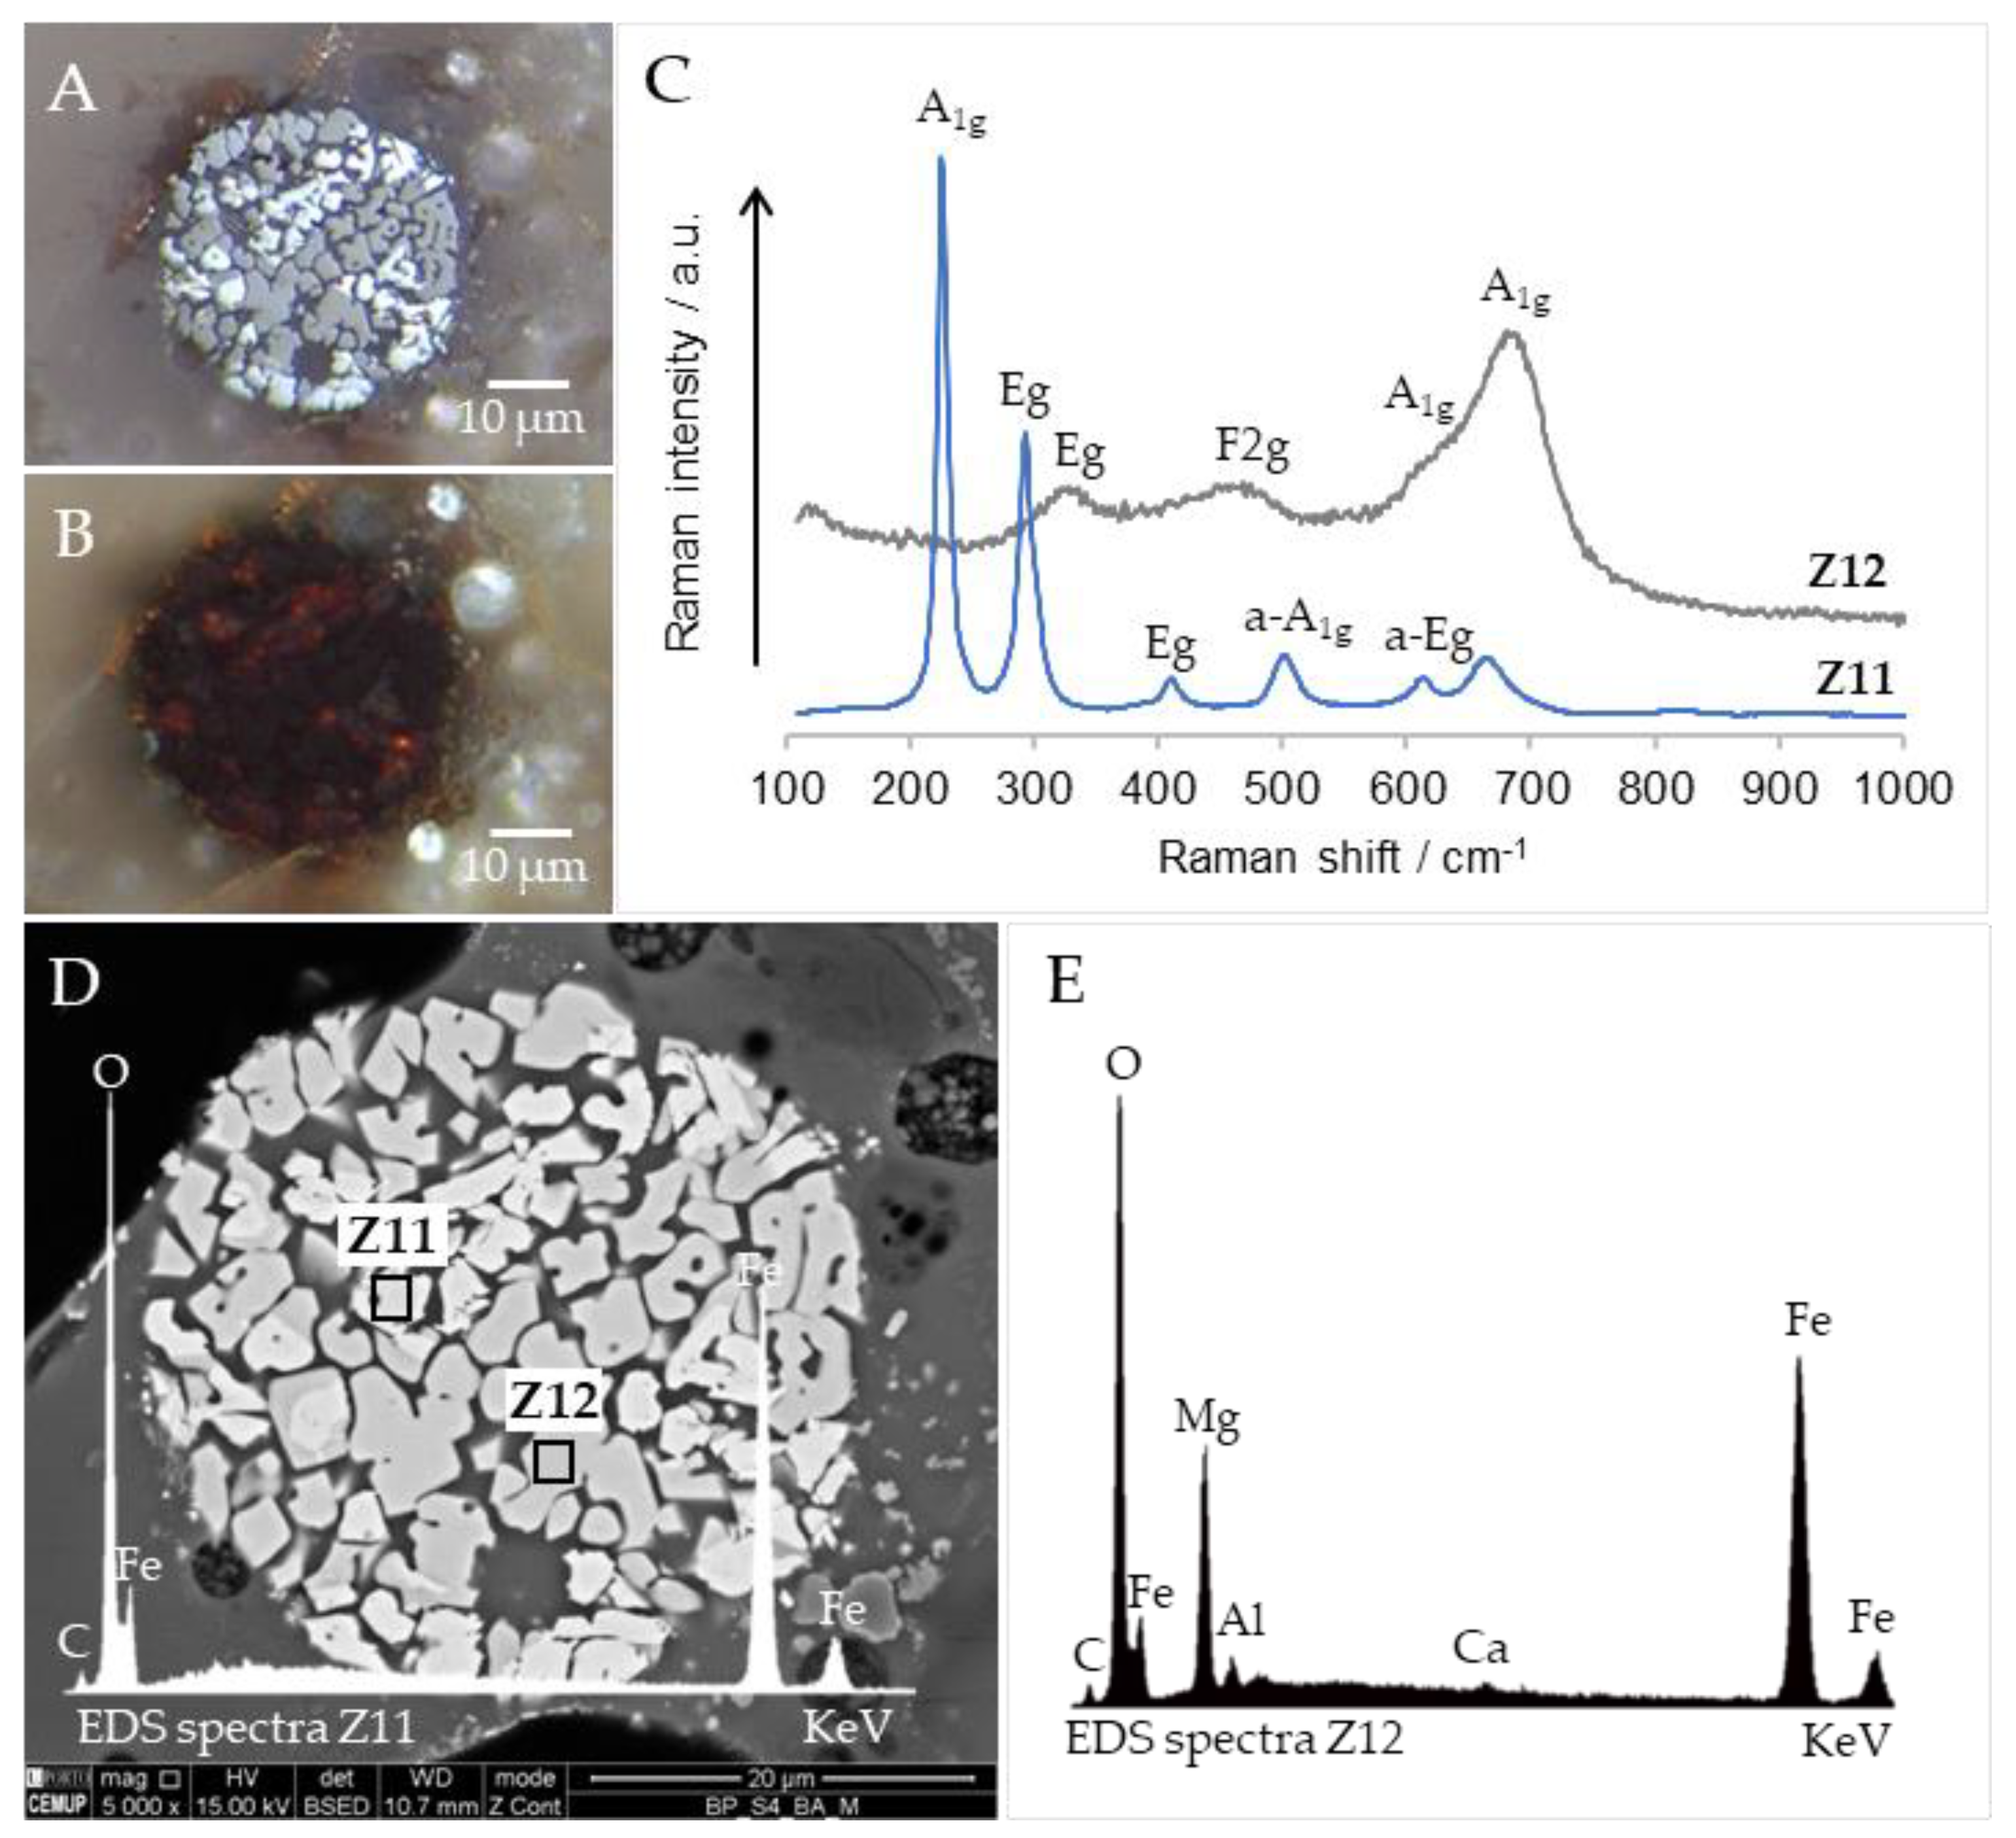
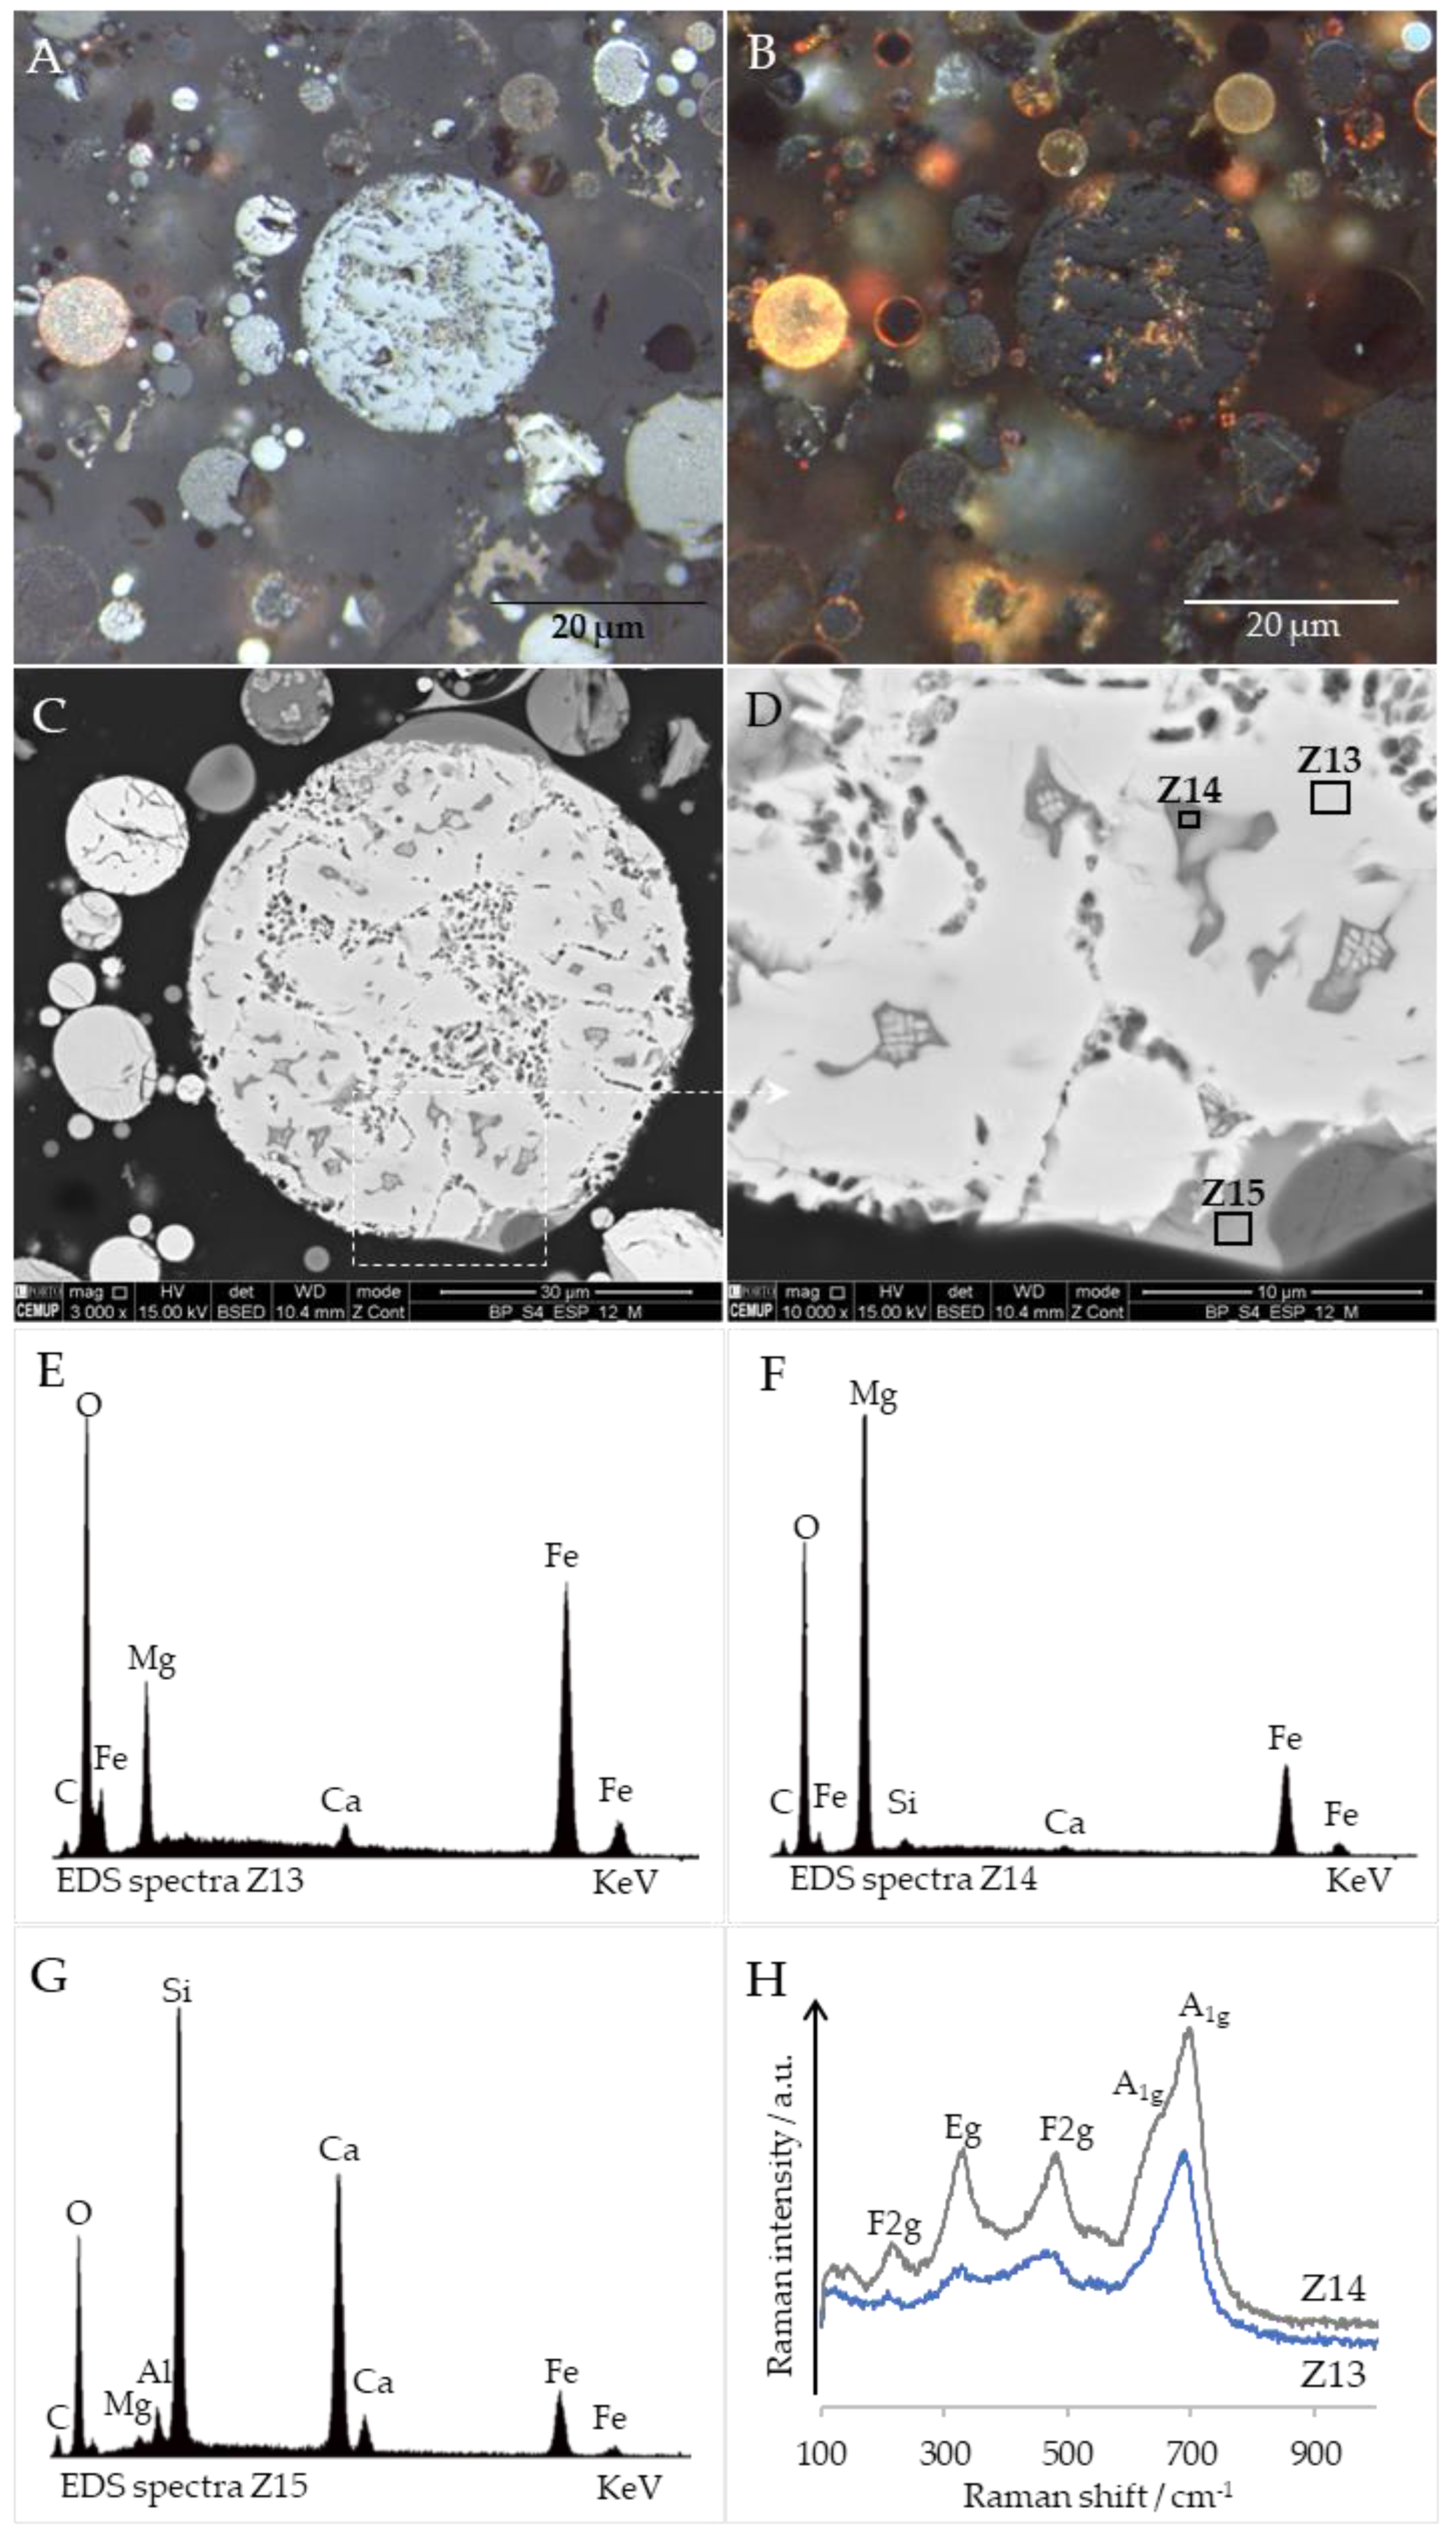
3.6. Cross-Sections Integrated Characterization: Petrography, SEM/EDS, and Raman Microspectroscopy

Taking into consideration the geochemical and mineralogical data, random areas of polished blocks were characterized combining petrography, SEM/EDS, and Raman microspectroscopy to assess features within Fe-bearing morphotypes.
In general, examination of the Fe-bearing morphotypes cross-sections shows that the character of surface microtextures (e.g., skeletal, dendritic, etc.) observed in the powder samples often extends across the entire spheres (Figure 9). Moreover, Fe-morphotypes are predominantly massive, suggesting that they originated from low viscosity melts, i.e., melts enriched in basic elements such as Mg [34,67]. As observed in powder samples, ferrospheres exhibiting skeletal-dendritic microtextures with a variable amount of aluminosilicate glass (usually with a composition similar to illite) are the most common morphotypes.
The observations under reflected light microscopy (oil immersion) highlighted aspects that went unnoticed using SEM/EDS (Figure 9). One example is the presence of oxidation rims with red internal reflections that are often observed on the particle’s outer surface (Figure 9B,E). Furthermore, ferrospheres frequently exhibit martitization textures, i.e., the replacement of magnetite by pseudomorphic hematite (martite). High reflectance martite often presents a blue hue and appears as a substitute for spinel crystals and as lamellae (Figure 9A,D and Figure 10A). These aspects were not restricted to a particular type of microstructure, as observed by [9,95].
Martitization in Fe-rich morphotypes from coal combustion ashes has been previously reported by several authors [27,48,69,83]; however, the mechanism beneath this transformation is yet to be understood. In natural conditions, the transformation from magnetite to hematite can be direct or through maghemite (γ-Fe2O3), an intermediate stage, and has been attributed to several processes such as dissolution-precipitation and deformation ([96] and references therein). The oxidation state of the Fe-bearing phases on the surface of the particles may explain some Mössbauer results, such as the higher content of hematite in Fe-MC from campaign S1, and potentially limit the use of the iron-rich morphotypes in further applications, such as their use as catalysts since chemical reactions occur on surface active sites.
Raman microspectroscopy enabled the confirmation of the martization process. The magnetite spectrum shows a high-intensity Raman shift at 671–688 cm−1 (A1g) (Figure 10B), and less frequently, low-intensity peaks at 300–338 cm−1 (Eg), 424–458 cm−1 (T2g) and 522–553 cm−1 (T2g) are also detected [97]. Hematite (α-Fe2O3) exhibits peaks corresponding to the phonon modes A1g (Fe3+ displacements, 224–229 cm−1), Eg (Fe3+ displacements, 245–250 and 290–295 cm−1), ρ1—Eg (O = displacements, 406–413 cm−1), a—A1g (O = displacements, 495–500 cm−1), and a—Eg (O = displacements, 608–618 cm−1) (Figure 10B) [97]. An additional peak identified at 658–667 cm−1, may be attributed to the incomplete transformation of magnetite [98,99,100,101] or to a longitudinal optical (LO) Eu mode, which is very sensitive to the crystallite size [102,103,104].
Nevertheless, there are particles presenting a chemical zonation that is distinguishable using SEM/EDS (Figure 11D,E), and under reflected light, it looks like a martitization aspect (Figure 11A,B). Indeed, the Fe-rich phase without Mg presents red internal reflections, and the Raman spectra confirm that it is oxidized to hematite (Figure 11C—Z11)). The spectra corresponding to the Mg-rich phase present a strong Raman shift at 686 cm−1 with a shoulder at 621 cm−1 and low intensity peaks at 333 and 459 cm−1 (Figure 11C—Z12). The splitting of the A1g phonon mode observed in the spectra is typical of magnesioferrite and occurs due to the substitution of Fe3+ by Mg2+ in the spinel structure [105,106].
Apart from the occurrence of magnesioferrite sensu stricto, the EDS spectra of many magnetite particles also indicate the presence of minor magnesium contents. The association of Mg to magnetite and the occurrence of magnesioferrite corroborates the slight enrichment of Mg observed in MC (Figure 7).
Figure 12 shows an example of a magnesiaferrosphere [28] analyzed. Although not the most common morphotype, it was selected given that magnesioferrite has suitable properties for being used as a heterogeneous catalyst [107]. The morphotype is mainly composed of magnesioferrite crystals (Figure 12F) embedded in a Ca-rich matrix with typical yellow reflections (Figure 12B,G) and containing MgO nodules (Figure 12F). The presence of matrix over particle surfaces blocking active sites (magnesioferrite crystals) may affect the efficiency of these morphotypes as catalysts. The Raman spectra obtained (Figure 12H) are similar to those assigned by [105,106] to magnesioferrite, and the differences among the spectra obtained are probably related to variations in Mg-content.
A Ca-rich morphotype stand out in Figure 12 (left side of magnesiaferrosphere) by its yellow internal reflections and Ca-sugar texture [28]. Due to the low amounts of Ca-bearing phases in the feed coals (Table 1), these morphotypes are residual in the coal ashes studied and in the respective MC. Figure 13 shows an example of a calcimagnesiasphere in which the different components were analyzed. The main phase is a (Ca, Mg)-silicate (Figure 13C) embedded in a matrix with Al–Si–Ca–(Mg–Fe-Mn) composition (Figure 13D), where exsolutions of (Al-Si)-Ca are found (Figure 13E) together with (Mg-Ca)-silicate nodules (Figure 13F). The coexistence of Ca, Mn, and Mg corroborates the geochemical associations previously found through statistical analysis (Figure 8).

4. Conclusions

In the present study, magnetic concentrates collected using ferrite (Fe-MC) and neodymium (Nd-MC) magnets from different types of commercial Colombian coal combustion ashes (bottom ash, economizer grits, and fly ash from electrostatic precipitators) were characterized using a multi-technique approach to assess Fe-bearing morphotype properties.
Sequential separation using both magnets was useful to collect a large amount of material, up to 60 wt.%, and reduce the Fe-content in the ashes (up to 75 wt.%), which can increase their recyclability. The yields using the Nd magnet (up to 53 wt.%) were superior to those using the ferrite magnet (up to 13 wt.%). However, as the separation was sequential, the Nd magnet mainly captured Fe-bearing aluminosilicate glass, and Fe-bearing minerals were residual. In this sense, the Nd magnet can be a prompt method to recover Fe-bearing phases from ash, however, its low selectivity may compromise the application of the materials being recovered, namely as catalysts.
In the magnetic concentrates recovered with ferrite magnet, the Fe-bearing minerals, such as magnetite, hematite, and magnesioferrite, are the main Fe-carriers, although a minor amount of Fe2+ and Fe3+ has been found associated with aluminosilicates. However, these MC also contained non-magnetic materials, such as quartz and mullite, most likely due to their intimate association with Fe-bearing phases or even the low efficiency of the magnetic separation process. The highest Fe-contents (>40 wt.% Fe2O3) were consistently found in the Fe-MC collected from ESP FA, which was related to the predominance of discrete iron-rich particles (ferrospheres), especially <25 µm, often presenting skeletal-dendritic microtextures.
Several elements such as Mo, Sc, Mn, As, Cd, and Ni were found to be enriched in Fe-MC and significantly correlated to iron, which can be attributed to their ability to substitute Fe in the spinel structure. The content of Fe as well as the elements associated with it increase with decreasing particle size. Seemingly, the finer fractions could be considered more promising to be used as industrial catalysts due to their higher Fe-content. Furthermore, smaller melt droplets suffer rapid cooling that quenches Fe-mineral growth and may generate defective structures with high catalytic performances. However, it must be considered that to act as a catalyst, Fe must be available on the particle surface, which is not the case in most of the Fe-bearing morphotypes from BA Fe-MC. Thus, the Fe-MC from ESP and the finer fractions from ECO might be more promising catalysts.
The integrated characterization of ferrospheres’ internal structure provided new chemical and mineralogical insights regarding local variations within Fe-morphotypes, namely the occurrence of oxidation rims, martitization aspects and the co-existence of hematite and magnesioferrite, which were not homogeneously distributed or strictly associated with a specific microtexture.
The information gathered under the scope of this research shows that magnetic concentrates obtained from beneficiated coal ash present physicochemical properties similar to those generated from non-beneficiated coals that have been the subject of several studies suggesting they might have been undervalued. Future work may include comparative studies and catalytic trials using the most promising magnetic fractions.

Supplementary Materials

The following supporting information can be downloaded at: https://www.mdpi.com/article/10.3390/min13081055/s1, Table S1: Trace element results for magnetic concentrates and respective size-fractions. World coal ash (WCA; Ketris and Yudovich, 2009), added for comparison, in Table S2: Pearson’s correlation coefficients for bulk Fe-MC and Table S3: Pearson´s correlation coefficients for size-fractions of Fe-MC.

Author Contributions

Conceptualization, A.C.S., A.G. and B.V.; methodology, A.C.S., C.C., E.F., H.S., D.F., B.J.C.V. and J.C.W.; formal analysis, A.C.S., E.F., D.F., K.M., B.J.C.V. and J.C.W.; data curation, A.C.S., E.F., D.F., B.J.C.V. and J.C.W.; writing—original draft preparation, A.C.S.; writing—review and editing, all authors; supervision, A.G. and B.V. supervised A.C.S.; project administration, B.V.; funding acquisition, A.G., B.V.; H.S., B.J.C.V. and J.C.W. All authors have read and agreed to the published version of the manuscript.

Funding

The authors thanks to Fundação para a Ciência e Tecnologia (FCT) and Ministério da Ciência, Tecnologia, e Ensino Superior (MCTES) for this work support through the projects UIDB/04683/2020, UIDP/04683/2020, CHARPHITE of the 3rd ERA-MIN Program 2015 (FCT ref. ERA-MIN/0005/2015), INSUB (FCT ref. DRI-India/0315/2020) and PhD scholarship (SFRH/BD/131713/2017 and COVID/BD/151941/2021) provided to the author A.C.S. J.C.W. and B.J.C.V. acknowledges FCT support through the UID/Multi/04349/2019. C. C. acknowledge FCT support through the research contract under the UIDP/04683/2020 project.

Data Availability Statement

The data presented in this study are available in article and supplementary material.

Acknowledgments

The authors thank PEGOP—Energia Elétrica S.A. for the samples supplied.

Conflicts of Interest

The authors declare no conflict of interest.

References

  1. Harris, D.; Feuerborn, J.; Heidrich, C.; Feuerborn Kurzfassung, J. Global Aspects on Coal Combustion Products. In Proceedings of the World of Coal Ash (WOCA), St. Louis, MO, USA, 13 May 2019; Volume 10. [Google Scholar]
  2. IEA. Coal 2022; IEA: Paris, France, 2022. [Google Scholar]
  3. Zhou, H.; Bhattarai, R.; Li, Y.; Si, B.; Dong, X.; Wang, T.; Yao, Z. Towards Sustainable Coal Industry: Turning Coal Bottom Ash into Wealth. Sci. Total Environ. 2022, 804, 149985. [Google Scholar] [CrossRef] [PubMed]
  4. Fu, B.; Hower, J.C.; Zhang, W.; Luo, G.; Hu, H.; Yao, H. A Review of Rare Earth Elements and Yttrium in Coal Ash: Content, Modes of Occurrences, Combustion Behavior, and Extraction Methods. Prog. Energy Combust. Sci. 2022, 88, 100954. [Google Scholar] [CrossRef]
  5. Badenhorst, C.; Santos, C.; Lázaro-Martínez, J.; Białecka, B.; Cruceru, M.; Guedes, A.; Guimarães, R.; Moreira, K.; Predeanu, G.; Suárez-Ruíz, I.; et al. Assessment of Graphitized Coal Ash Char Concentrates as a Potential Synthetic Graphite Source. Minerals 2020, 10, 986. [Google Scholar] [CrossRef]
  6. Fang, Z.; Gesser, H.D. Recovery of Gallium from Coal Fly Ash. Hydrometallurgy 1996, 41, 187–200. [Google Scholar] [CrossRef]
  7. Dai, S.; Seredin, V.V.; Ward, C.R.; Jiang, J.; Hower, J.C.; Song, X.; Jiang, Y.; Wang, X.; Gornostaeva, T.; Li, X.; et al. Composition and Modes of Occurrence of Minerals and Elements in Coal Combustion Products Derived from High-Ge Coals. Int. J. Coal Geol. 2014, 121, 79–97. [Google Scholar] [CrossRef]
  8. Valeev, D.; Bobylev, P.; Osokin, N.; Zolotova, I.; Rodionov, I.; Salazar-Concha, C.; Verichev, K. A Review of the Alumina Production from Coal Fly Ash, with a Focus in Russia. J. Clean. Prod. 2022, 363, 132360. [Google Scholar] [CrossRef]
  9. Sharonova, O.M.; Anshits, N.N.; Fedorchak, M.A.; Zhizhaev, A.M.; Anshits, A.G. Characterization of Ferrospheres Recovered from High-Calcium Fly Ash. Energy Fuels 2015, 29, 5404–5414. [Google Scholar] [CrossRef]
  10. Yao, Z.T.; Ji, X.S.; Sarker, P.K.; Tang, J.H.; Ge, L.Q.; Xia, M.S.; Xi, Y.Q. A Comprehensive Review on the Applications of Coal Fly Ash. Earth Sci. Rev. 2015, 141, 105–121. [Google Scholar] [CrossRef] [Green Version]
  11. Ehlers, E.G.; Stiles, D.V. Melanterite-Rozenite Equilibrium. Am. Mineral. 1965, 50, 1457–1458. [Google Scholar]
  12. Gluskoter, H.J. Inorganic Sulfur in Coal. Energy Sources 1977, 3, 125–131. [Google Scholar] [CrossRef]
  13. Gruner, D.; Hood, W.C. Three Iron Sulfate Minerals from Coal Mine Refuse Dumps in Perry County, Illinois. Trans. Ill. State Acad. Sci. 1971, 156–158. [Google Scholar]
  14. Dai, S.; Li, T.; Seredin, V.V.; Ward, C.R.; Hower, J.C.; Zhou, Y.; Zhang, M.; Song, X.; Song, W.; Zhao, C. Origin of Minerals and Elements in the Late Permian Coals, Tonsteins, and Host Rocks of the Xinde Mine, Xuanwei, Eastern Yunnan, China. Int. J. Coal Geol. 2014, 121, 53–78. [Google Scholar] [CrossRef]
  15. Dai, S.; Chou, C.-L. Occurrence and Origin of Minerals in a Chamosite-Bearing Coal of Late Permian Age, Zhaotong, Yunnan, China. Am. Mineral. 2007, 92, 1253–1261. [Google Scholar] [CrossRef]
  16. Kossenberg, M.; Cook, A.C. Weathering of Sulphide Minerals in Coal: Production of Ferrous Sulphate Heptahydrate. Mineral. Mag. J. Mineral. Soc. 1961, 32, 829–830. [Google Scholar] [CrossRef]
  17. Rao, C.P.; Gluskoter, H.J. Occurrence and Distribution of Minerals in Illinois Coals; Illinois State Geological Survey: Urbana, IL, USA, 1973. [Google Scholar]
  18. Raask, E. Mineral Impurities in Coal Combustion: Behavior, Problems, and Remedial Measures; Hemisphere Pub: Washington, DC, USA, 1985; ISBN 089116362X. [Google Scholar]
  19. Permana, A.K.; Ward, C.R.; Li, Z.; Gurba, L.W. Distribution and Origin of Minerals in High-Rank Coals of the South Walker Creek Area, Bowen Basin, Australia. Int. J. Coal Geol. 2013, 116–117, 185–207. [Google Scholar] [CrossRef]
  20. Stach, E.; Mackowsky, M.-T.; Teichmuller, M.; Taylor, G.H.; Chandra, D.; Teichmuller, R. Stach’s Textbook of Coal Petrology; Gebruder Borntraeger: Berlin, Germany, 1982; 535p. [Google Scholar]
  21. Ward, C.R. Analysis, Origin and Significance of Mineral Matter in Coal: An Updated Review. Int. J. Coal Geol. 2016, 165, 1–27. [Google Scholar] [CrossRef]
  22. Çelik, Y.; Karayigit, A.I.; Oskay, R.G.; Kayseri-Özer, M.S.; Christanis, K.; Hower, J.C.; Querol, X. A Multidisciplinary Study and Palaeoenvironmental Interpretation of Middle Miocene Keles Lignite (Harmancık Basin, NW Turkey), with Emphasis on Syngenetic Zeolite Formation. Int. J. Coal Geol. 2021, 237, 103691. [Google Scholar] [CrossRef]
  23. Hower, J.C.; Rathbone, R.F.; Robertson, J.D.; Peterson, G.; Trimble, A.S. Petrology, Mineralogy, and Chemistry of Magnetically-Separated Sized Fly Ash. Fuel 1999, 78, 197–203. [Google Scholar] [CrossRef]
  24. Kukier, U.; Ishak, C.F.; Sumner, M.E.; Miller, W.P. Composition and Element Solubility of Magnetic and Non-Magnetic Fly Ash Fractions. Environ. Pollut. 2003, 123, 255–266. [Google Scholar] [CrossRef] [PubMed]
  25. Querol, X.; Fernández-Turiel, J.; López-Soler, A. Trace Elements in Coal and Their Behaviour during Combustion in a Large Power Station. Fuel 1995, 74, 331–343. [Google Scholar] [CrossRef]
  26. Sokol, E.V.; Kalugin, V.M.; Nigmatulina, E.N.; Volkova, N.I.; Frenkel, A.E.; Maksimova, N.V. Ferrospheres from Fly Ashes of Chelyabinsk Coals: Chemical Composition, Morphology and Formation Conditions. Fuel 2002, 81, 867–876. [Google Scholar] [CrossRef]
  27. Strzałkowska, E. Morphology, Chemical and Mineralogical Composition of Magnetic Fraction of Coal Fly Ash. Int. J. Coal Geol. 2021, 240, 103746. [Google Scholar] [CrossRef]
  28. Valentim, B.; Białecka, B.; Gonçalves, P.A.; Guedes, A.; Guimarães, R.; Cruceru, M.; Całus-Moszko, J.; Popescu, L.G.; Predeanu, G.; Santos, A.C. Undifferentiated Inorganics in Coal Fly Ash and Bottom Ash: Calcispheres, Magnesiacalcispheres, and Magnesiaspheres. Minerals 2018, 8, 140. [Google Scholar] [CrossRef] [Green Version]
  29. Vassilev, S.V.; Menendez, R.; Borrego, A.G.; Diaz-Somoano, M.; Rosa Martinez-Tarazona, M. Phase-Mineral and Chemical Composition of Coal Fly Ashes as a Basis for Their Multicomponent Utilization. 3. Characterization of Magnetic and Char Concentrates. Fuel 2004, 83, 1563–1583. [Google Scholar] [CrossRef]
  30. Zhao, Y.; Zhang, J.; Sun, J.; Bai, X.; Zheng, C. Mineralogy, Chemical Composition, and Microstructure of Ferrospheres in Fly Ashes from Coal Combustion. Energy Fuels 2006, 20, 1490–1497. [Google Scholar] [CrossRef]
  31. Lauf, R.J. Microstructures of Coal Fly Ash Particles. Am. Ceram. Soc. Bull. 1982, 61, 4. [Google Scholar]
  32. Lauf, R.J.; Harris, L.A.; Rawlston, S.S. Pyrite Framboids as the Source of Magnetite Spheres in Fly Ash. Environ. Sci. Technol. 1982, 16, 218–220. [Google Scholar] [CrossRef]
  33. Anshits, A.G.; Bayukov, O.A.; Kondratenko, E.V.; Anshits, N.N.; Pletnev, O.N.; Rabchevskii, E.V.; Solovyov, L.A. Catalytic Properties and Nature of Active Centers of Ferrospheres in Oxidative Coupling of Methane. Appl. Catal. A Gen. 2016, 524, 192–199. [Google Scholar] [CrossRef]
  34. Anshits, A.G.; Kondratenko, E.V.; Fomenko, E.V.; Kovalev, A.M.; Anshits, N.N.; Bajukov, O.A.; Sokol, E.V.; Salanov, A.N. Novel Glass Crystal Catalysts for the Processes of Methane Oxidation. Catal. Today 2001, 64, 59–67. [Google Scholar] [CrossRef]
  35. Vereshchagin, S.N.; Kondratenko, E.V.; Rabchevskii, E.V.; Anshits, N.N.; Solov’ev, L.A.; Anshits, A.G. New Approach to the Preparation of Catalysts for the Oxidative Coupling of Methane. Kinet. Catal. 2012, 53, 449–455. [Google Scholar] [CrossRef]
  36. Anshits, A.G.; Kondratenko, E.V.; Fomenko, E.V.; Kovalev, A.M.; Bajukov, O.A.; Anshits, N.N.; Sokol, E.V.; Kochubey, D.I.; Boronin, A.I.; Salanov, A.N.; et al. Physicochemical and Catalytic Properties of Glass Crystal Catalysts for the Oxidation of Methane. J. Mol. Catal. A Chem. 2000, 158, 209–214. [Google Scholar] [CrossRef]
  37. Anshits, A.G.; Sharonova, O.M.; Anshits, N.N.; Vereshchagin, S.N.; Rabchevskii, E.V.; Solovjev, L.A. Ferrospheres from Fly Ashes: Composition and Catalytic Proprieties in High-Temperature Oxidation of Methane. In Proceedings of the World of Coal Ash, Denver, CO, USA, 9–12 May 2011. [Google Scholar]
  38. Kirik, N.P.; Anshits, N.N.; Rabchevskii, E.V.; Solov’ev, L.A.; Anshits, A.G. Effect of HF Modification on the Catalytic Properties of Ferrospheres in the Oxidative Coupling of Methane. Kinet. Catal. 2019, 60, 196–204. [Google Scholar] [CrossRef]
  39. Kuźniarska-Biernacka, I.; Santos, A.C.; Jarrais, B.; Valentim, B.; Guedes, A.; Freire, C.; Peixoto, A.F. Application of Fe-Rich Coal Fly Ashes to Enhanced Reduction of 4-Nitrophenol. Clean. Chem. Eng. 2022, 2, 100019. [Google Scholar] [CrossRef]
  40. Bibby, D. Composition and Variation of Pulverized Fuel Ash Obtained from the Combustion of Sub-Bituminous Coals, New Zealand. Fuel 1977, 56, 427–431. [Google Scholar] [CrossRef]
  41. Lu, S.G.; Chen, Y.Y.; Shan, H.D.; Bai, S.Q. Mineralogy and Heavy Metal Leachability of Magnetic Fractions Separated from Some Chinese Coal Fly Ashes. J. Hazard. Mater. 2009, 169, 246–255. [Google Scholar] [CrossRef]
  42. Anshits, N.N.; Fomenko, E.V.; Anshits, A.G. Composition–Structure Relationship and Routes of Formation of Blocklike Ferrospheres Produced by Pulverized Combustion of Two Coal Types. ACS Omega 2021, 6, 26004–26015. [Google Scholar] [CrossRef] [PubMed]
  43. Anshits, N.N.; Fedorchak, M.A.; Zhizhaev, A.M.; Anshits, A.G. Composition–Structure Relationship of Skeletal–Dendritic Ferrospheres Formed during Industrial Combustion of Lignite and Coal. Energy Fuels 2019, 33, 6788–6796. [Google Scholar] [CrossRef]
  44. Sharonova, O.M.; Anshits, N.N.; Yumashev, V.V.; Anshits, A.G. Composition and Morphology of Char Particles of Fly Ashes from Industrial Burning of High-Ash Coals with Different Reactivity. Fuel 2008, 87, 1989–1997. [Google Scholar] [CrossRef]
  45. Sharonova, O.M.; Anshits, N.N.; Solovyov, L.A.; Salanov, A.N.; Anshits, A.G. Relationship between Composition and Structure of Globules in Narrow Fractions of Ferrospheres. Fuel 2013, 111, 332–343. [Google Scholar] [CrossRef]
  46. Anshits, N.N.; Fedorchak, M.A.; Fomenko, E.V.; Mazurova, E.V.; Anshits, A.G. Composition, Structure, and Formation Routes of Blocklike Ferrospheres Separated from Coal and Lignite Fly Ashes. Energy Fuels 2020, 34, 3743–3754. [Google Scholar] [CrossRef]
  47. Anshits, N.N.; Fedorchak, M.A.; Zhizhaev, A.M.; Sharonova, O.M.; Anshits, A.G. Composition and Structure of Block-Type Ferrospheres Isolated from Calcium-Rich Power Plant Ash. Inorg. Mater. 2018, 54, 187–194. [Google Scholar] [CrossRef]
  48. Valentim, B.; Shreya, N.; Paul, B.; Gomes, C.S.; Sant’Ovaia, H.; Guedes, A.; Ribeiro, J.; Flores, D.; Pinho, S.; Suárez-Ruiz, I.; et al. Characteristics of Ferrospheres in Fly Ashes Derived from Bokaro and Jharia (Jharkand, India) Coals. Int. J. Coal Geol. 2016, 153, 52–74. [Google Scholar] [CrossRef]
  49. Santos, A.C.; Guedes, A.; French, D.; Futuro, A.; Valentim, B. Integrative Study Assessing Space and Time Variations with Emphasis on Rare Earth Element (REE) Distribution and Their Potential on Ashes from Commercial (Colombian) Coal. Minerals 2022, 12, 194. [Google Scholar] [CrossRef]
  50. Taylor, J.C. Computer Programs for Standardless Quantitative Analysis of Minerals Using the Full Powder Diffraction Profile. Powder Diffr. 1991, 6, 2–9. [Google Scholar] [CrossRef] [Green Version]
  51. Kruiver, P.P.; Dekkers, M.J.; Heslop, D. Quantification of Magnetic Coercivity Components by the Analysis of Acquisition Curves of Isothermal Remanent Magnetisation. Earth Planet. Sci. Lett. 2001, 189, 269–276. [Google Scholar] [CrossRef]
  52. Maxbauer, D.P.; Feinberg, J.M.; Fox, D.L. MAX UnMix: A Web Application for Unmixing Magnetic Coercivity Distributions. Comput. Geosci. 2016, 95, 140–145. [Google Scholar] [CrossRef]
  53. Evans, M.E.; Heller, F. Environmental Magnetism: Principles and Applications of Enviromagnetics; Academic Press: Cambridge, MA, USA, 2003. [Google Scholar]
  54. Maher, B.A.; Thompson, R. Quaternary Climates, Environments, and Magnetism; Cambridge University Press: Cambridge, UK, 1999. [Google Scholar]
  55. Thompson, R.; Oldfield, F. Environmental Magnetism; Springer: Dordrecht, The Netherlands, 1986; ISBN 978-94-011-8038-2. [Google Scholar]
  56. Bloemendal, J.; Lamb, B.; King, J. Paleoenvironmental Implications of Rock-Magnetic Properties of Late Quaternary Sediment Cores from the Eastern Equatorial Atlantic. Paleoceanography 1988, 3, 61–87. [Google Scholar] [CrossRef]
  57. Long, G.J.; Cranshaw, T.E.; Longworth, G. The Ideal Mössbauer Effect Absorber Thickness. Mössbauer Eff. Ref. Data J. 1983, 43–49. [Google Scholar]
  58. Waerenborgh, J.C.; Salamakha, P.; Sologub, O.; Gonçalves, A.P.; Cardoso, C.; Sério, S.; Godinho, M.; Almeida, M. Influence of Thermal Treatment and Crystal Growth on the Final Composition and Magnetic Properties of the YFexAl12−x (4 ≤ x ≤ 4.2) Intermetallics. Chem. Mater. 2000, 12, 1743–1749. [Google Scholar] [CrossRef]
  59. Verosub, K.L.; Roberts, A.P. Environmental Magnetism: Past, Present, and Future. J. Geophys. Res. Solid Earth 1995, 100, 2175–2192. [Google Scholar] [CrossRef]
  60. Dekkers, M.J. Environmental Magnetism: An Introduction. Geol. Mijnb. (Geol. Min.) 1997, 76, 163–182. [Google Scholar] [CrossRef]
  61. Veneva, L.; Hoffmann, V.; Jordanova, D.; Jordanova, N.; Fehr, T. Rock Magnetic, Mineralogical and Microstructural Characterization of Fly Ashes from Bulgarian Power Plants and the Nearby Anthropogenic Soils. Phys. Chem. Earth Parts A/B/C 2004, 29, 1011–1023. [Google Scholar] [CrossRef]
  62. Kapicka, A.; Jordanova, N.; Petrovský, E.; Ustjak, S. Effect of Different Soil Conditions on Magnetic Parameters of Power-Plant Fly Ashes. J. Appl. Geophy. 2001, 48, 93–102. [Google Scholar] [CrossRef]
  63. Egli, R. Characterization of Individual Rock Magnetic Components by Analysis of Remanence Curves, 1. Unmixing Natural Sediments. Stud. Geophys. Et Geod. 2004, 48, 391–446. [Google Scholar] [CrossRef]
  64. Abrajevitch, A.; Kodama, K. Diagenetic Sensitivity of Paleoenvironmental Proxies: A Rock Magnetic Study of Australian Continental Margin Sediments. Geochem. Geophys. Geosystems 2011, 12. [Google Scholar] [CrossRef]
  65. Matjie, R.H.; French, D.; Ward, C.R.; Pistorius, P.C.; Li, Z. Behaviour of Coal Mineral Matter in Sintering and Slagging of Ash during the Gasification Process. Fuel Process. Technol. 2011, 92, 1426–1433. [Google Scholar] [CrossRef] [Green Version]
  66. Wang, X.S. Mineralogical and Chemical Composition of Magnetic Fly Ash Fraction. Environ. Earth Sci. 2014, 71, 1673–1681. [Google Scholar] [CrossRef]
  67. Sokol, E.V.; Maksimova, N.V.; Volkova, N.I.; Nigmatulina, E.N.; Frenkel, A.E. Hollow Silicate Microspheres from Fly Ashes of the Chelyabinsk Brown Coals (South Urals, Russia). Fuel Process. Technol. 2000, 67, 35–52. [Google Scholar] [CrossRef]
  68. Hansen, L.D.; Silberman, D.; Fisher, G.L. Crystalline Components of Stack-Collected, Size-Fractionated Coal Fly Ash. Environ. Sci. Technol. 1981, 15, 1057–1062. [Google Scholar] [CrossRef]
  69. Vassilev, S.V.; Vassileva, C.G. Mineralogy of Combustion Wastes from Coal-Fired Power Stations. Fuel Process. Technol. 1996, 47, 261–280. [Google Scholar] [CrossRef]
  70. Murad, E. Clays and Clay Minerals: What Can Mössbauer Spectroscopy Do to Help Understand Them? Hyperfine Interact 1998, 117, 39–70. [Google Scholar] [CrossRef]
  71. Vandenberghe, R.E.; Barrero, C.A.; da Costa, G.M.; van San, E.; de Grave, E. Mössbauer Characterization of Iron Oxides and (Oxy)Hydroxides: The Present State of the Art. Hyperfine Interact 2000, 126, 247–259. [Google Scholar] [CrossRef]
  72. de Grave, E.; Vanleerberghe, R.; Dauwe, C.; de Sitter, J.; Govaert, A. Magnetic Hyperfine Field Distributions in Ferrimagnetic Spinels Fe2(1-y)Mg1+yTiyO4 with y ≤ 0.5. J. Phys. Colloq. 1976, 37, C6-97–C6-100. [Google Scholar] [CrossRef]
  73. Waerenborgh, J.C.; Figueiredo, M.O.; Cabral, J.M.P.; Pereira, L.C.J. Powder XRD Structure Refinements and 57Fe Mössbauer Effect Study of Synthetic Zn1−XFexAl2O4 (0 < x ≦ 1) Spinels Annealed at Different Temperatures. Phys. Chem. Min. 1994, 21, 460–468. [Google Scholar] [CrossRef]
  74. Jayasuriya, K.D.; O’Neill, H.S.C.; Berry, A.J.; Campbell, S.J. A Mössbauer Study of the Oxidation State of Fe in Silicate Melts. Am. Mineral. 2004, 89, 1597–1609. [Google Scholar] [CrossRef]
  75. Ferreira, N.M.; Kovalevsky, A.V.; Valente, M.A.; Waerenborgh, J.C.; Frade, J.R.; Costa, F.M. Structural and Redox Effects in Iron-Doped Magnesium Aluminosilicates. J. Cryst. Growth 2017, 457, 19–23. [Google Scholar] [CrossRef]
  76. Vandenberghe, R.E.; de Resende, V.G.; de Grave, E. Mössbauer Effect Study of Fly and Bottom Ashes from an Electric Generating Plant. In ISIAME 2008; Springer: Berlin/Heidelberg, Germany, 2009; pp. 341–346. [Google Scholar]
  77. Szumiata, T.; Brzózka, K.; Górka, B.; Gawroński, M.; Gzik-Szumiata, M.; Świetlik, R.; Trojanowska, M. Iron Speciation in Coal Fly Ashes—Chemical and Mössbauer Analysis. Hyperfine Interact 2014, 226, 483–487. [Google Scholar] [CrossRef] [Green Version]
  78. Fisher, G.L.; Chang, D.P.Y.; Brummer, M. Fly Ash Collected from Electrostatic Precipitators: Microcrystalline Structures and the Mystery of the Spheres. Science 1976, 192, 553–555. [Google Scholar] [CrossRef]
  79. Miller, S.F.; Schobert, H.H. Effect of Fuel Particle and Droplet Size Distribution on Particle Size Distribution of Char and Ash during Pilot-Scale Combustion of Pulverized Coal and Coal-Water Slurry Fuels. Energy Fuels 1993, 7, 520–531. [Google Scholar] [CrossRef]
  80. Miller, S.F.; Schobert, H.H. Effect of the Occurrence and Composition of Silicate and Aluminosilicate Compounds on Ash Formation in Pilot-Scale Combustion of Pulverized Coal and Coal-Water Slurry Fuels. Energy Fuels 1994, 8, 1197–1207. [Google Scholar] [CrossRef]
  81. Kutchko, B.; Kim, A. Fly Ash Characterization by SEM–EDS. Fuel 2006, 85, 2537–2544. [Google Scholar] [CrossRef]
  82. Valentim, B.; Hower, J.C.; Guedes, A.; Flores, D. Scanning Electron Miccroscopy and Energy-Dispersive X-Ray Spectroscopy of Low-Sulfur Coal Fly Ash. Int. J. Energy A Clean Environ. 2009, 10, 147–166. [Google Scholar] [CrossRef]
  83. Ramsden, A.R.; Shibaoka, M. Characterization and Analysis of Individual Fly-Ash Particles from Coal-Fired Power Stations by a Combination of Optical Microscopy, Electron Microscopy and Quantitative Electron Microprobe Analysis. Atmos. Environ. 1982, 16, 2191–2206. [Google Scholar] [CrossRef]
  84. Blaha, U.; Sapkota, B.; Appel, E.; Stanjek, H.; Rosler, W. Micro-Scale Grain-Size Analysis and Magnetic Properties of Coal-Fired Power Plant Fly Ash and Its Relevance for Environmental Magnetic Pollution Studies. Atmos. Environ. 2008, 42, 8359–8370. [Google Scholar] [CrossRef]
  85. Hulett, L.D.; Weinberger, A.J.; Northcutt, K.J.; Ferguson, M. Chemical Species in Fly Ash from Coal-Burning Power Plants. Science 1980, 210, 1356–1358. [Google Scholar] [CrossRef]
  86. Ketris, M.P.; Yudovich, Y.E. Estimations of Clarkes for Carbonaceous Biolithes: World Averages for Trace Element Contents in Black Shales and Coals. Int. J. Coal Geol. 2009, 78, 135–148. [Google Scholar] [CrossRef]
  87. European Commission Critical Raw Materials Resilience: Charting a Path towards Greater Security and Sustainability; European Economic and Social Committee: Brussels, Belgium, 2020.
  88. Dai, S.; Finkelman, R.B. Coal as a Promising Source of Critical Elements: Progress and Future Prospects. Int. J. Coal Geol. 2018, 186, 155–164. [Google Scholar] [CrossRef]
  89. Xu, N.; Xu, C.; Finkelman, R.B.; Engle, M.A.; Li, Q.; Peng, M.; He, L.; Huang, B.; Yang, Y. Coal Elemental (Compositional) Data Analysis with Hierarchical Clustering Algorithms. Int. J. Coal Geol. 2022, 249, 103892. [Google Scholar] [CrossRef]
  90. Xu, N.; Finkelman, R.B.; Dai, S.; Xu, C.; Peng, M. Average Linkage Hierarchical Clustering Algorithm for Determining the Relationships between Elements in Coal. ACS Omega 2021, 6, 6206–6217. [Google Scholar] [CrossRef] [PubMed]
  91. Eminagaoglu, M.; Oskay, R.G.; Karayigit, A.I. Evaluation of Elemental Affinities in Coal Using Agglomerative Hierarchical Clustering Algorithm: A Case Study in a Thick and Mineable Coal Seam (KM2) from Soma Basin (W. Turkey). Int. J. Coal Geol. 2022, 259, 104045. [Google Scholar] [CrossRef]
  92. Eskanazy, G.; Finkelman, R.B.; Chattarjee, S. Some Considerations Concerning the Use of Correlation Coefficients and Cluster Analysis in Interpreting Coal Geochemistry Data. Int. J. Coal Geol. 2010, 83, 491–493. [Google Scholar] [CrossRef]
  93. Gürdal, G. Abundances and Modes of Occurrence of Trace Elements in the Çan Coals (Miocene), Çanakkale-Turkey. Int. J. Coal Geol. 2011, 87, 157–173. [Google Scholar] [CrossRef]
  94. Zhao, L.; Ward, C.R.; French, D.; Graham, I. Major and Trace Element Geochemistry of Coals and Intra-Seam Claystones from the Songzao Coalfield, SW China. Minerals 2015, 5, 870–893. [Google Scholar] [CrossRef]
  95. Sharonova, O.M.; Fedorchak, M.A.; Zhizhaev, A.M.; Mazurova, E.V.; Anshits, A.G. Composition of Individual Ferrospheres of Different Morphological Types. Inorg. Mater. 2015, 51, 1143–1150. [Google Scholar] [CrossRef]
  96. Orberger, B.; Wagner, C.; Tudryn, A.; Wirth, R.; Morgan, R.; Fabris, J.D.; Greneche, J.M.; Rosière, C. Micro- to Nano-Scale Characterization of Martite from a Banded Iron Formation in India and a Lateritic Soil in Brazil. Phys. Chem. Min. 2014, 41, 651–667. [Google Scholar] [CrossRef] [Green Version]
  97. Guedes, A.; Valentim, B.; Prieto, A.C.; Sanz, A.; Flores, D.; Noronha, F. Characterization of Fly Ash from a Power Plant and Surroundings by Micro-Raman Spectroscopy. Int. J. Coal Geol. 2008, 73, 359–370. [Google Scholar] [CrossRef]
  98. Owens, F.J.; Orosz, J. Effect of Nanosizing on Lattice and Magnon Modes of Hematite. Solid State Commun. 2006, 138, 95–98. [Google Scholar] [CrossRef]
  99. Minitti, M.E.; Lane, M.D.; Bishop, J.L. A New Hematite Formation Mechanism for Mars. Meteorit. Planet. Sci. 2005, 40, 55–69. [Google Scholar] [CrossRef]
  100. de Faria, D.L.A.; Lopes, F.N. Heated Goethite and Natural Hematite: Can Raman Spectroscopy Be Used to Differentiate Them? Vib. Spectrosc. 2007, 45, 117–121. [Google Scholar] [CrossRef]
  101. Chourpa, I.; Douziech-Eyrolles, L.; Ngaboni-Okassa, L.; Fouquenet, J.-F.; Cohen-Jonathan, S.; Soucé, M.; Marchais, H.; Dubois, P. Molecular Composition of Iron Oxide Nanoparticles, Precursors for Magnetic Drug Targeting, as Characterized by Confocal Raman Microspectroscopy. Analyst 2005, 130, 1395. [Google Scholar] [CrossRef] [PubMed]
  102. Xu, Y.Y.; Zhao, D.; Zhang, X.J.; Jin, W.T.; Kashkarov, P.; Zhang, H. Synthesis and Characterization of Single-Crystalline α-Fe2O3 Nanoleaves. Phys. E Low Dimens. Syst. Nanostruct. 2009, 41, 806–811. [Google Scholar] [CrossRef]
  103. Lopez, L.B.M.; Pasteris, J.D.; Biswas, P. Sensitivity of Micro-Raman Spectrum to Crystallite Size of Electrospray-Deposited and Post-Annealed Films of Iron-Oxide Nanoparticle Suspensions. Appl. Spectrosc. 2009, 63, 627–635. [Google Scholar] [CrossRef]
  104. Chernyshova, I.V.; Hochella Jr, M.F.; Madden, A.S. Size-Dependent Structural Transformations of Hematite Nanoparticles. 1. Phase Transition. Phys. Chem. Chem. Phys. 2007, 9, 1736. [Google Scholar] [CrossRef] [PubMed]
  105. D’Ippolito, V.; Andreozzi, G.B.; Bersani, D.; Lottici, P.P. Raman Fingerprint of Chromate, Aluminate and Ferrite Spinels. J. Raman Spectrosc. 2015, 46, 1255–1264. [Google Scholar] [CrossRef]
  106. Nakagomi, F.; da Silva, S.W.; Garg, V.K.; Oliveira, A.C.; Morais, P.C.; Franco, A. Influence of the Mg-Content on the Cation Distribution in Cubic Mg Fe3O4 Nanoparticles. J. Solid State Chem. 2009, 182, 2423–2429. [Google Scholar] [CrossRef]
  107. Yang, B.L.; Cheng, D.S.; Lee, S.B. Effect of Steam on the Oxidative Dehydrogenation of Butene over Magnesium Ferrites with and without Chromium Substitution. Appl. Catal. 1991, 70, 161–173. [Google Scholar] [CrossRef]
Figure 1. (A) IRM curves unmixed using [51]; and (B) coercivity distribution derived from IRM curves obtained unmixed using the Max UnMix application [52].
Minerals 13 01055 g001
Figure 2. Particle size distribution of magnetic concentrates collected from S1–BA, S1–ECO, and S1–ESP12 samples with ferrite (A) and neodymium (B) magnets (standard deviation included as error bar).
Minerals 13 01055 g002
Figure 3. Detailed imaging of magnetic concentrates collected from S1–BA (A,B) and S1–ECO (C,D) (BSE mode): magnetic concentrates collected with ferrite magnets (A,C) present a finer grain size than those collected with neodymium magnets (C,D), where agglomerates, agl, larger than 1 mm are frequent. The MC collected from BA (A,B) is coarser than the MC from ECO FA (C,D).
Minerals 13 01055 g003
Figure 4. Mössbauer spectra of magnetic concentrates collected with a ferrite magnet. The lines over the experimental points are the sum of sextets and doublets (shown slightly shifted for clarity) corresponding to Fe atoms on different sites and in different phases. The estimated parameters for these sextets and doublets are collected in Table 4.
Minerals 13 01055 g004
Figure 5. Fe-bearing phases in magnetic concentrates (SEM/EDS, BSE mode): (A) ferrosphere bonded to quartz particle with molten surface (×3000); (B) ferrosphere bonded to aluminosilicate in an agglomerate (×3000); (C) aluminosilicate agglomerate with Fe-crystallites (×1000); (D) magnification of dashed square in (C) and respective EDS spectra of the iron-rich phase: Fe-crystallites; (E) ferrosphere embedded in aluminosilicate glass; (FH) EDS corresponding to EDS Z locations marked in (E).
Minerals 13 01055 g005
Figure 6. Microstructures of ferrospheres and other Fe-morphotypes in magnetic concentrates (SEM/EDS, BSE mode, EDS): (A) skeletal (×3500); (B) dendritic (×5000); (C) monoblock (×2500); (D) blocklike (×1300); (E) molten drop (×3500); (F) mixed (×7500); (G) solid shell (×1500); (H) ferrosphere fragment (×3500).
Minerals 13 01055 g006
Figure 7. Enrichment factor relative to the tailings: (A) Fe-MC major oxides, (B) Nd-MC major oxides, (C) trace elements Fe-MC. Detail imaging of a char particle from ECO Nd-MC (D) with char pores mainly infilled with aluminosilicate, als, and glassy spheres (BSE mode, ×1800) and (E) magnification of the dashed square in “(D)” showing a ferrosphere intermixed with aluminosilicate glass spheres infilling char pores.
Minerals 13 01055 g007
Figure 8. Dendrogram from cluster analysis on the geochemical data from bulk Fe-MC (cluster method, Ward’s method; interval, Pearson’s correlation values).
Minerals 13 01055 g008
Figure 9. Ferrospheres presenting oxidation rims and martitization textures were observed under reflected microscopy (oil immersion), parallel and crossed nicols, respectively (A,B,D,E), and SEM/EDS, BSE mode (C,F).
Minerals 13 01055 g009
Figure 10. Ferrosphere under reflected light: (A) exhibiting martitization aspect; (B) Raman spectra corresponding to the letters signed in “(A)”; (C) ferrosphere under SEM/EDS (BSE mode; ×4500) and spectra corresponding to Z9; (D) spectra corresponding to Z10 marked in ”(C)”.
Minerals 13 01055 g010
Figure 11. Magnesiaferrosphere observed under (A,B) reflected microscopy (oil immersion), parallel and crossed nicols, respectively; (C) Raman spectra corresponding to Z11 and Z12; (D,E) SEM (BSE mode, ×5000); and EDS spectra obtained on areas marked (Z11 and Z12).
Minerals 13 01055 g011
Figure 12. Magnesiaferrosphere observed under (A,B) reflected microscopy (oil immersion), parallel and crossed nicols, respectively, and (C,D) SEM (BSE mode, ×5000) and (EG) EDS spectra obtained on areas marked (Z13 and Z14); (H) Raman spectra corresponding to Z11 and Z12.
Minerals 13 01055 g012
Figure 13. Detailed imaging of a (A) calcimagnesiasphere (BSE mode, ×3500), (B) magnification of the dashed square in “(A)” showing the locations where spectra were acquired (BSE mode, ×10,000). (CF) Z14-Z17 EDS spectra.
Minerals 13 01055 g013
Table 1. Proximate and ultimate analyses (wt.%), gross calorific values (GCV, MJ/Kg), and mineralogy of feed coals.
S1-CS4-C1S4-C2
Proximate analysis
 Ad3.2810.19.01
 Vdaf39.8241.740.44
Ultimate analysis
 Sd0.520.730.72
 Cdaf80.3478.5380.3
 Hdaf6.26.076.08
 Ndaf1.641.61.57
 Odaf11.2812.9811.25
GCVd29.1929.6629.78
Mineralogy
 Quartz3138.7n.d.
 Albite0.60.7n.d.
 Hornblende0.80.4n.d.
 Muscovite48.4n.d.
 Illite4.27.9n.d.
 Kaolinite 45.525.6n.d.
 Montmorillonite 0.30n.d.
 Chlorite0.30.3n.d.
 Anatase 0.30.7n.d.
 Boehmite 0.20.1n.d.
 Calcite 00n.d.
 Siderite 0.30n.d.
 Bassanite 0.71.2n.d.
 Gypsum 3.43.5n.d.
 Hexahydrite 2.34.2n.d.
 Jarosite 1.12.3n.d.
 Alunogen 3.34n.d.
 Tschermigite00n.d.
 Apatite 0.60.5n.d.
 Pyrite1.21.7n.d.
SX-C, coal sample (C) corresponding to the X sampling campaign; M, moisture; A, ash yield; V, volatile matter; daf, dry-ash-free basis; GCV, gross calorific value; n.d.—not determined.
Table 2. Magnetic susceptibility, χ and Isothermal remanent magnetization (IRM) parameters obtained from IRM curve deconvolution.
X
(×10−8 m3/kg)
MethodS RatioComponent
12
SIRM (A/m)B1/2 (mT)DPCont. (%)SSIRM (A/m)B1/2 (mT)DPCont. (%)S
S1BA872.79CLG0.943146,000360.3296n.a.60005010.284n.a.
Max UnMixn.a.n.a.370.33971.09n.a.5780.2131.11
ECO2375.18CLG0.921227,000400.3194n.a.15,0005620.306n.a.
Max UnMixn.a.n.a.400.31950.99n.a.5730.2750.77
ESP121164.99CLG0.923114,000460.2994n.a.70005620.306n.a.
Max UnMixn.a.n.a.440.30930.87n.a.5270.5771.09
S4BA834.79CLG0.925133,000340.3393n.a.95003550.307n.a.
Max UnMixn.a.n.a.350.35951.11n.a.4600.2850.92
ECO2024.94CLG0.909176,000470.3192n.a.15,0005620.298n.a.
Max UnMixn.a.n.a.470.32940.97n.a.6320.2561.14
ESP121325.87CLG0.944145,500490.2896n.a.60005620.284n.a.
Max UnMixn.a.n.a.480.29960.85n.a.4220.2240.94
BA; bottom ash; ECO, economizer grits; ESP, electrostatic precipitator; S-ratio (I’-IRM-0.3T/IRM1T); SIRM, saturation of isothermal remanent magnetization; B1/2, field at which half of the SIRM was reached; DP, dispersion parameter; S, skewness; n.a.—not attributed value.
Table 3. XRD results for MC collected from S1 ash samples (wt.%).
S1–BAS1–ECOS1–ESP-12
Bulk *FeNdBulk *FeNdBulk *FeNd
Quartz (SiO2)11.517.418.124.811.229.612.55.511.4
Cristobalite (SiO2)0.30.10.10.10.20.1000.1
Mullite (Al6Si2O13)6.614.213.28.37.611.44.76.25.4
Cordierite (Mg2Al4Si5O18)0.20.30.10.10.20.20.20.10
Albite (NaAlSi3O8)01.31.61.41.40.90.92.42.0
Diopside ((Ca,Mg,Fe)2Si2O6))0.10.90.30.73.90.90.85.50
Calcium aluminate (Ca3Al2O6) 00.50.20.50.20.00.100.3
Rutile (TiO2)00.70.30.50.80.30.30.40.5
Hematite (Fe2O3)0.72.00.50.65.00.60.75.10.7
Maghemite (Fe2O3)0.92.30.71.200.60.21.90.8
Magnetite (Fe3O4)04.40.82.08.60.40.919.90.7
Magnesioferrite (MgFe2O4)00.800.28.300.45.50
Hercynite (FeAl2O4)00.70.20.40.70000.4
Calcite (CaCO3)00.20.10.10.70.20.10.70.6
Gypsum (CaSO4·2H2O)1.40.20.50.40.600.30.50.1
Anhydrite (CaSO4)0000.1000.10.20.1
Amorphous78.354.163.458.550.854.978.046.277.1
* Data published in [49]; S1, sampling campaign 1; BA, Bottom ash; ECO, Economizer grits; ESP-12, fly ash from the first row (bin 12) of the electrostatic precipitator.
Table 4. Mössbauer results for MC collected from S1 ash samples (wt.%).
Fe-MCFe SpeciesIS, mm/sQS, ε, mm/sBhf, TeslaI
S1–BAFe2.5+ magnetite0.65044.215%
Fe3+ magnetite + maghemite0.330.0647.535%
Fe3+ hematite0.37−0.250.623%
Fe3+ aluminosilicate phases0.410.87-21%
Fe2+ aluminosilicate phases0.942.38-6%
S1–ECOFe2.5+ magnetite0.65−0.0245.526%
Fe3+ magnetite + maghemite0.310.0448.544%
Fe3+ hematite0.37−0.25015%
Fe3+ aluminosilicate phases0.410.91-12%
Fe2+ aluminosilicate phases0.942.42-3%
S1–ESP12Fe2.5+ magnetite0.65045.323%
Fe3+ magnetite + maghemite0.31048.649%
Fe3+ hematite0.37−0.250.417%
Fe3+ aluminosilicate phases0.490.93-8%
Fe2+ aluminosilicate phases0.952.56-3%
S4–BAFe2.5+ magnetite0.65−0.0345.529%
Fe3+ magnetite + maghemite0.3−0.0348.531%
Fe3+ hematite0.37−0.251.916%
Fe3+ aluminosilicate phases0.410.87-20%
Fe2+ aluminosilicate phases0.962.47-4%
S4–ECOFe2.5+ magnetite0.63−0.0546.339%
Fe3+ magnetite + maghemite0.3−0.0149.635%
Fe3+ hematite0.38−0.252.410%
Fe3+ aluminosilicate phases0.420.88-13%
Fe2+ aluminosilicate phases0.992.44-3%
S4–ESP12Fe2.5+ magnetite0.62−0.0445.843%
Fe3+ magnetite + maghemite0.3−0.0149.237%
Fe3+ hematite0.38−0.1950.49%
Fe3+ aluminosilicate phases0.420.95-10%
Fe2+ aluminosilicate phases0.992.61-1%
IS (mm/s) isomer shift relative to metallic a-Fe at 295 K; QS (mm/s) quadrupole splitting; and ε (mm/s) quadrupole shift estimated for quadrupole doublets and magnetic sextets, respectively. Bhf (tesla) magnetic hyperfine field; I relative area. Estimated errors 0.02 mm/s for IS, QS, ε, <0.2 T for Bhf, and <2% for I.
Table 5. Parameters calculated from the relative areas estimated from the Mössbauer spectra of Fe-MC.
S1–BAS1–ECOS1–ESP12S4–BAS4–ECOS4–ESP12
Fe fraction in Fe oxides (MgFe2O4 included when present)73%85%89%76%84%89%
Fe3+/total Fe86.5%84%85.5%81.5%77.5%77.5%
Table 6. Yield, major and minor oxides, and loss on ignition (LOI) of the bulk ash, magnetic concentrates (MC), and respective size-fractions (wt.%) and tailings.
Yield wt.%SiO2TiO2Al2O3Fe2O3MnOCaOMgONa2OK2OP2O5SO3Cr2O3LOI
S1–BA Bulk 66.070.8118.287.950.081.501.871.042.110.140.030.020.10
Fe (mm)MC5.458.850.7917.7314.870.141.922.590.961.970.15<0.0020.020.00
>5009.065.570.8418.807.780.071.621.931.092.130.15<0.0020.010.00
500–15026.863.430.8418.689.380.101.912.181.072.110.16<0.0020.040.10
150–7532.960.650.8118.0512.770.131.892.490.992.040.16<0.0020.010.00
75–4521.757.090.8117.9116.450.151.752.750.921.990.16<0.0020.020.00
<4516.452.500.7917.9521.000.161.612.910.861.940.15<0.0020.020.10
TL94.266.850.8318.606.880.071.461.771.062.130.14<0.0020.020.20
Nd (mm)MC38.366.150.8719.256.740.071.451.811.082.230.15<0.0020.020.20
>200020.965.690.8619.437.240.071.481.861.072.230.15<0.0020.02−0.10
2000–50020.065.040.8819.787.350.071.541.921.092.270.15<0.0020.02−0.10
500–15019.365.660.8518.917.190.071.691.891.092.180.15<0.0020.020.30
150–7516.669.170.7817.525.920.061.461.631.062.040.14<0.0020.010.20
75–4513.668.490.8418.875.270.051.201.581.052.200.14<0.0020.010.30
<4513.865.850.9520.535.580.051.081.641.082.400.13<0.0020.020.70
TL54.566.780.7918.067.410.071.451.771.052.050.130.310.020.10
S1–ECO Bulk 67.770.6615.158.130.081.811.861.101.720.130.070.021.51
Fe (μm)MC11.641.400.5712.5935.490.333.034.370.661.230.170.050.020.10
>15012.858.860.8218.6610.900.112.222.481.112.080.180.030.022.54
150–7533.248.970.6013.5926.420.293.063.810.811.420.170.040.010.80
75–4531.543.890.5813.1632.960.302.844.210.691.290.160.010.01−0.10
<45µm22.541.270.6514.4334.440.262.564.230.671.370.200.010.02−0.10
TL87.771.050.6815.634.110.041.611.491.141.770.130.030.022.30
Nd (μm)MC53.468.670.7817.225.620.061.791.851.151.980.15<0.0020.020.69
>15028.564.660.8819.576.800.071.651.991.182.220.16<0.0020.020.81
150–7529.374.520.5613.144.700.061.891.641.141.530.12<0.0020.010.69
75–4524.369.940.7616.815.050.061.851.821.111.950.15<0.0020.010.50
<4517.964.390.9720.475.920.061.782.051.142.340.17<0.0020.020.70
TL38.075.460.5613.212.010.021.300.971.151.500.120.010.003.70
S1–ESP12 Bulk 59.650.8820.226.360.061.341.831.072.370.160.130.025.89
Fe (μm)MC4.534.030.5512.7141.950.302.494.240.501.130.230.140.041.69
>7511.344.520.5814.5821.750.242.743.120.741.560.160.430.019.58
75–4519.042.130.5713.5632.590.272.513.730.621.310.160.150.022.39
45–2523.036.780.5512.7640.590.272.404.030.491.110.180.100.030.71
<2546.636.210.6214.6338.780.262.244.210.561.290.310.150.050.69
TL94.160.630.9121.014.710.051.111.691.072.460.160.100.026.07
Nd (μm)MC8.956.660.8519.827.700.071.522.240.962.170.180.080.027.72
>7513.753.460.6916.115.560.071.431.760.971.840.14<0.0020.0117.95
75−4519.656.710.7517.415.200.061.461.820.941.960.15<0.0020.0213.52
45–2523.059.350.8619.616.470.071.822.100.962.150.18<0.0020.026.40
<2543.757.230.9822.309.340.091.522.691.032.450.210.010.032.11
TL82.961.170.9321.213.880.041.051.591.092.490.150.020.016.37
S4–BA Bulk 66.560.7917.609.010.071.561.650.941.880.100.030.02−0.20
FeMC5.558.990.7416.4716.880.141.972.240.841.690.120.010.02−0.10
TL94.167.200.8017.738.160.061.521.590.951.870.10<0.0020.020.00
S4–ECO Bulk 63.110.7016.238.370.071.761.630.871.700.110.050.015.38
FeMC13.140.980.5712.9635.370.262.442.990.581.200.130.120.022.39
TL85.765.770.7116.684.350.041.581.400.901.740.100.080.026.61
S4–ESP 12 Bulk 58.710.8318.977.820.061.571.761.062.080.130.340.026.66
FeMC5.933.680.5111.9944.190.252.163.150.491.000.170.100.032.29
TL93.260.390.8619.764.750.051.331.651.082.180.130.130.027.67
BA, bottom ash; ECO, economizer grits; ESP, electrostatic precipitator; MC, magnetic concentrate; TL, tailings.
Disclaimer/Publisher’s Note: The statements, opinions and data contained in all publications are solely those of the individual author(s) and contributor(s) and not of MDPI and/or the editor(s). MDPI and/or the editor(s) disclaim responsibility for any injury to people or property resulting from any ideas, methods, instructions or products referred to in the content.

