Next Article in Journal
Innovative Structural Characterization of Natural Villiaumite Crystal
Next Article in Special Issue
Comment on Zhou et al. Adsorption Behaviors of Lanthanum (III) and Yttrium (III) Ions on Gibbsite. Minerals 2023, 13, 1530
Previous Article in Journal
Precious-Metal Mineralization and Formation Conditions of the Biche-Kadyr-Oos Epithermal Au-Ag Ore Occurrence (Eastern Sayan, Russia)
 
 
Comment published on 11 November 2024, see Minerals 2024, 14(11), 1137.
Article

Adsorption Behaviors of Lanthanum (III) and Yttrium (III) Ions on Gibbsite

1
State Key Laboratory of Ore Deposit Geochemistry, Institute of Geochemistry, Chinese Academy of Sciences, Guiyang 550051, China
2
CAS Center for Excellence in Comparative Planetology, Hefei 230026, China
*
Author to whom correspondence should be addressed.
Minerals 2023, 13(12), 1530; https://doi.org/10.3390/min13121530
Submission received: 17 October 2023 / Revised: 25 November 2023 / Accepted: 1 December 2023 / Published: 9 December 2023
(This article belongs to the Special Issue Surface Chemistry of Minerals)

Abstract

:
The enrichment process of rare earth elements in ion-adsorbed rare earth ores and bauxite is potentially related to the adsorption of rare earth elements by gibbsite. In this paper, lanthanum and yttrium were selected as surrogates of light rare earth elements and heavy rare earth elements, respectively. The effects of adsorption time, solution pH, and background electrolyte concentration on the adsorption of rare earth ions by gibbsite were investigated through batch adsorption experiments. The results showed that the adsorption of rare earth ions by gibbsite can approach equilibrium in 72 h. There is mainly electrostatic repulsion between gibbsite and rare earth ions at pH 4–7, and the adsorption efficiency increases with the increase in solution pH value and background electrolyte concentration. The adsorption process of rare earth ions by gibbsite is more consistent with the pseudo-second-order kinetic and Langmuir single-layer adsorption models. Moreover, based on the structural correlation between clay minerals and gibbsite, the causes for the differences in the adsorption behaviors of rare earth elements on the minerals are discussed. The results of this study help to understand the role of aluminum hydroxide in the migration and fate of rare earth elements in epigenetic environments.

1. Introduction

Rare earth elements (REE) include 15 lanthanides as well as scandium (Sc) and yttrium (Y). REE are usually divided into light rare earth elements (LREE, also known as the cerium group) and heavy rare earth elements (HREE, also known as the yttrium group). LREE range from lanthanum to europium. HREE range from gadolinium to lutetium, as well as scandium and yttrium. Because of their unique properties, they have a wide range of applications in energy, electronics, aerospace, materials and chemicals, which are listed as critical raw materials by the European Commission [1,2,3]. The vital role in advanced technology and economic development has led to an increasing demand for rare earth resources. In order to alleviate the supply problem of rare earth resources, it is of great significance to find new alternative sources of rare earth resources on a global scale [4].
As the main source of HREE, ion-adsorbed rare earth ores account for approximately 80% of the world’s reserves. They are mainly distributed in southern China [5]. Due to the importance of ion-adsorption-type rare earth ores, the study of the adsorption of rare earth ions on clay minerals has become a hot research area in recent years. Some clay minerals can show good adsorption properties for rare earth ions, such as kaolinite and halloysite [6,7]. Borst et al. found through experimental studies that rare earth ions can be adsorbed on clay minerals such as kaolinite in the form of inner- or outer-sphere complexes [8]. Some studies suggest that the primary adsorption active sites during the adsorption of rare earth ions by clay minerals are on the surface of the aluminum–oxygen octahedral layer [9]. Ishida et al. compared the fluorescence lifetime and intensity of Eu3+ on kaolinite and gibbsite through time-resolved fluorescence spectroscopy measurements. They found that Eu3+ can form an inner-sphere complex on the edge surface of the kaolinite’s aluminum–oxygen layer under high pH, high background electrolyte concentration, and low Eu3+ concentration [10]. In addition, by comparing the structures of clay minerals such as kaolinite and montmorillonite with that of gibbsite, it was found that whether 1:1 or 2:1 type clay mineral, its aluminum–oxygen octahedral layer structure is similar to that of gibbsite [11], and this is why the aluminum–oxygen octahedral layer of clay mineral is often called the “gibbsite” layer. Therefore, exploring the adsorption behavior of rare earth ions by gibbsite will help to explain the adsorption mechanism of rare earth ions on clay minerals.
At the same time, REE are also enriched in bauxite, which have been discovered by more and more exploration studies in recent years [12,13,14]. The REE in some bauxite ores can even reach the industrial mining grade and have colossal resource potential. Specifically, the REE in those bauxite show the characteristics of being more enriched in LREE [15,16,17,18]. For example, the aluminum mineral in the bauxite deposit of Yongjiang basin (SW China) is dominated by gibbsite, in which the average content of REE is 763 ppm, with prominent light rare earth enrichment characteristics [19]. The Las Mercedes bauxite deposit in the Dominican Republic mainly comprises gibbsite, clay minerals, and iron minerals, where the REE concentration is generally higher than 1400 ppm [20]. The Samar Island bauxite in the Philippines is mainly composed of gibbsite, boehmite, and iron minerals, with concentrations of REE ranging from 369 ppm to 634 ppm [17]. The aluminum minerals in the bauxite deposits of the Zagros Mountain Belt in Iran are mainly boehmite and gibbsite and a REE content of up to 730 ppm [21]. At present, there have been many speculations on the reason for the enrichment of REE in bauxite. However, the interaction mechanism between aluminum hydroxide minerals and rare earth ions in bauxite is not yet precise. Since the surface of gibbsite is very rich in oxygen and hydroxyl functional groups, studies have confirmed that gibbsite has a specific adsorption capacity for metal ions [22,23,24], and it is possible that the gibbsite can also adsorb rare earth cations. Therefore, exploring the adsorption of rare earth ions by aluminum hydroxide minerals will help to understand the interaction between aluminum hydroxide minerals and REE in bauxite and then has a guiding significance for explaining the enrichment and differentiation mechanism of REE in bauxite.
In this paper, lanthanum and yttrium as surrogates of LREE and HREE were selected, respectively. Then, a batch experiment method was used to explore the effects of adsorption time, solution pH, background electrolyte concentration, and initial rare earth ion concentration on the adsorption of rare earth ions by gibbsite. Finally, the kinetic and thermodynamic model fitting analyses were proceeded, and a preliminary discussion on the adsorption mechanism was conducted. Based on experimental exploration of the adsorption behavior and mechanism of REE on gibbsite, a preliminary understanding of the role of gibbsite in the enrichment process of REE in bauxite would be obtained.

2. Materials and Methods

2.1. Characterization of Samples

The phases of the sample were analyzed using a powder X-ray diffractometer with PIXcel3D detector (Empyrean, PANalytical, Almelo, The Netherlands). The scanning mode is continuous, scanning range is 4~80° (2θ), the scan speed is 0.22°/s and the total scanning time is approximately 6 min, and Cu-Kα (λ = 0.154 nm) radiation is used to measure at 40 kV and 40 mA.
The morphology of the samples was observed using a field emission scanning electron microscope (SCIOS, FEI Company, Hillsboro, OR, USA). The accelerating voltage is 2 kV. Before the test, the ethanol dispersion of the sample was dropped onto the monocrystalline silicon wafer, and then dried naturally. Finally, the sample was sprayed with gold.
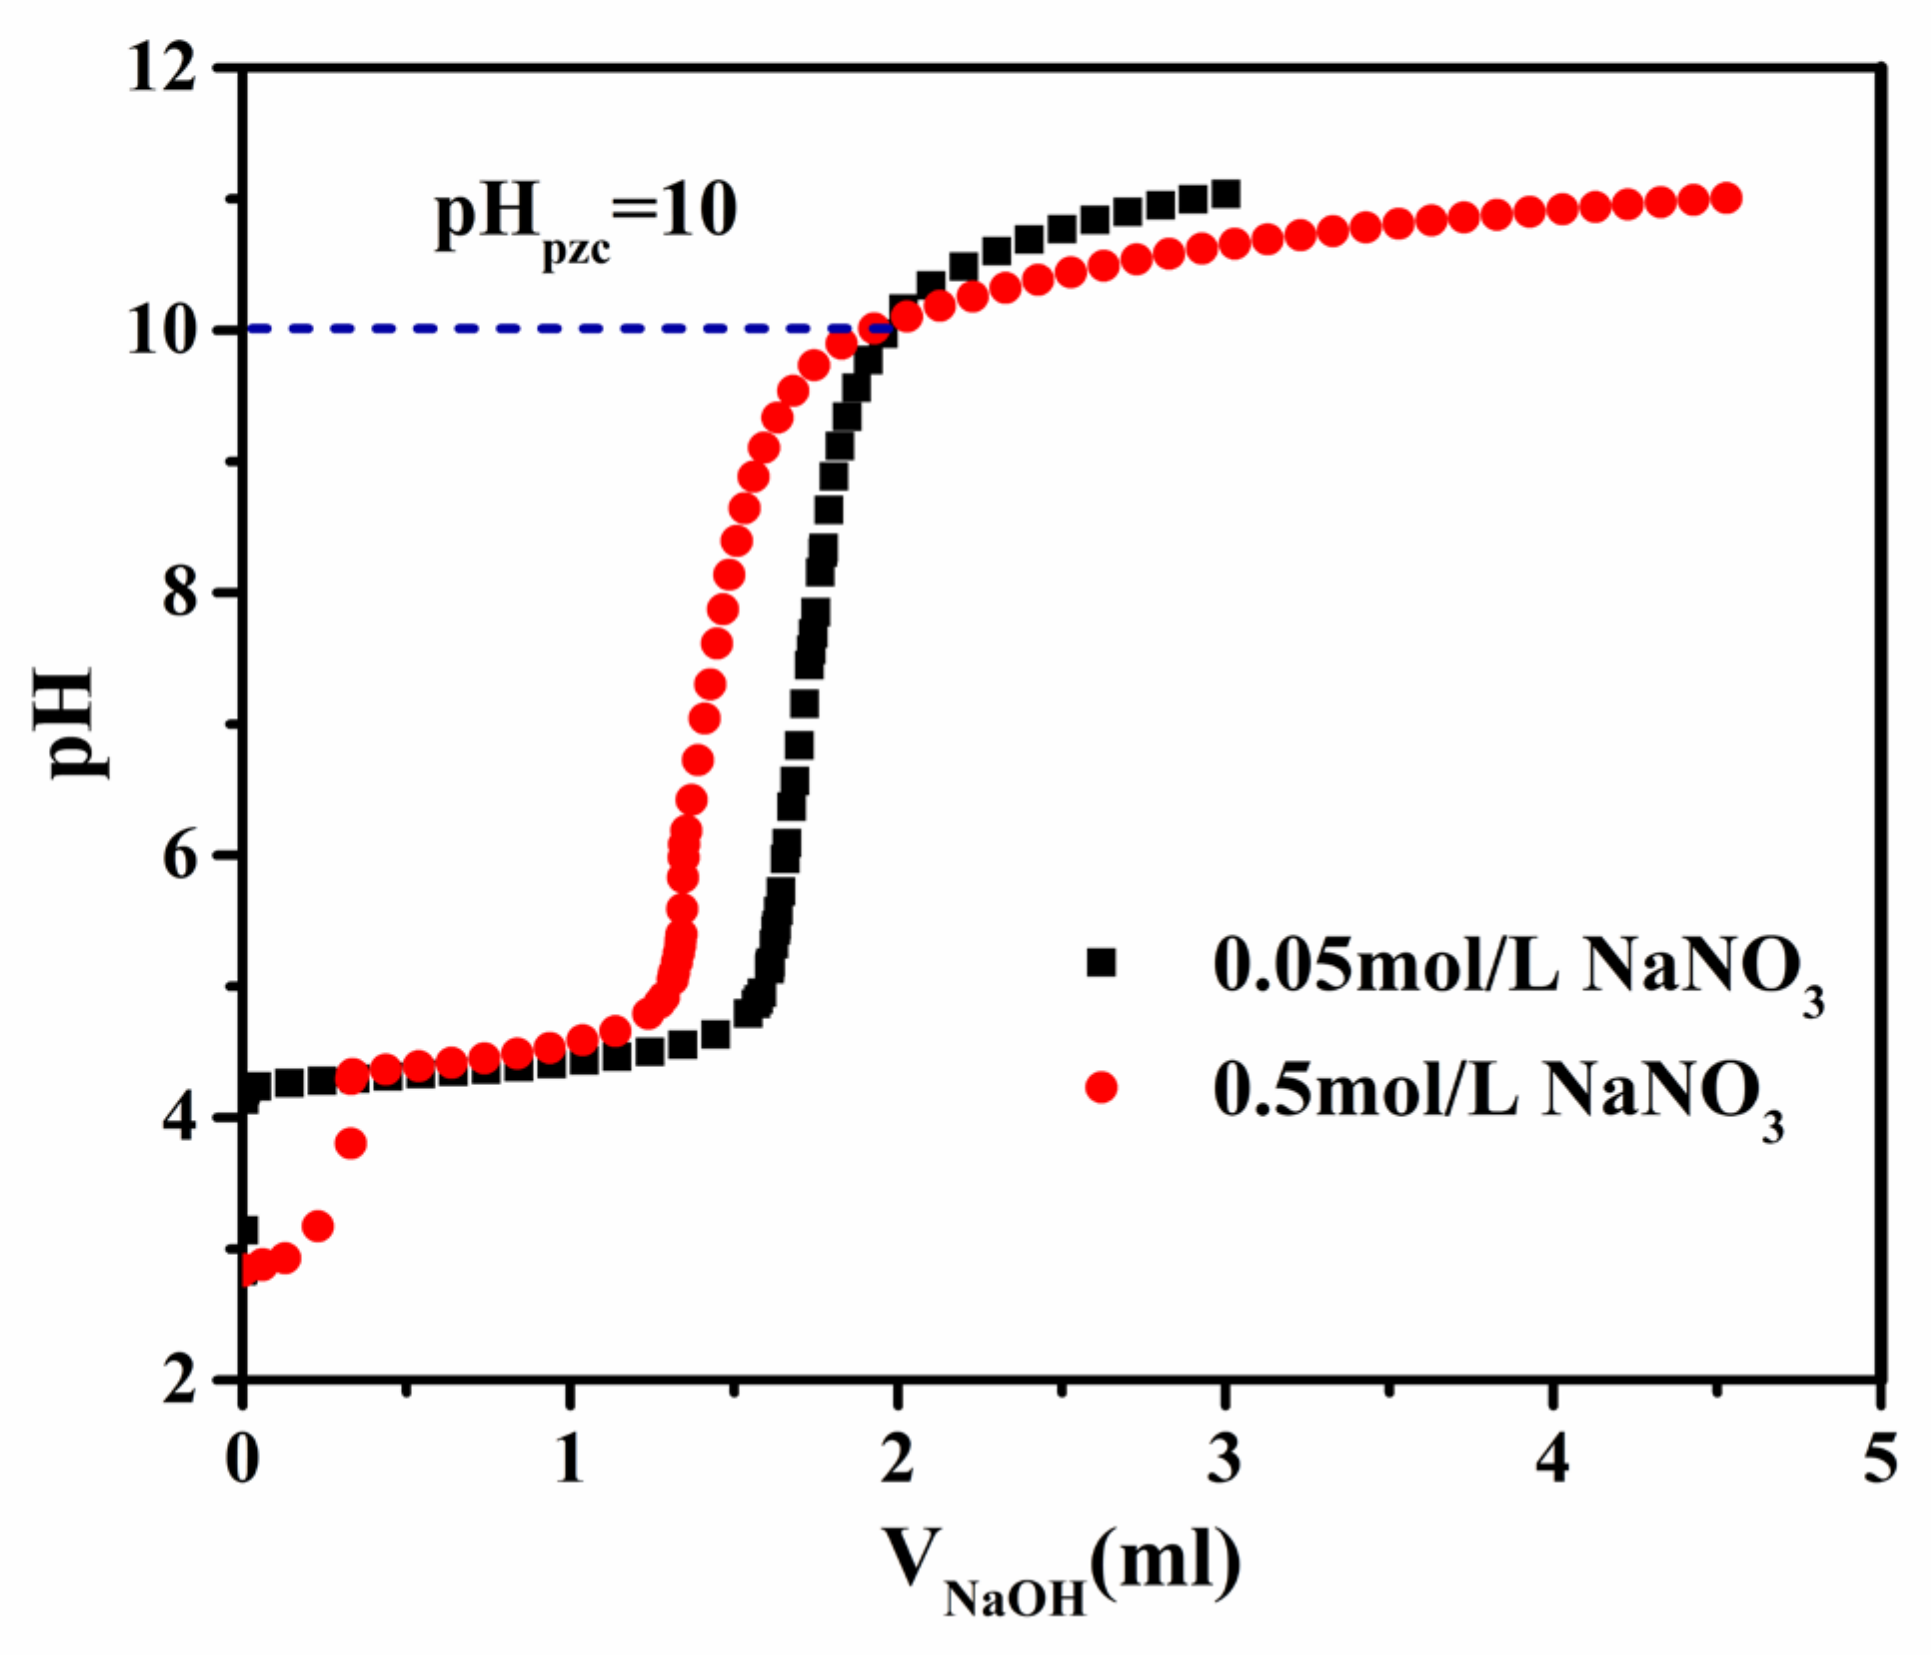
The sample’s point of zero charge was determined using a fully automatic potentiometric titrator (T50, Mettler-Toledo, Greifensee, Switzerland) equipped with a glass electrode (DGill-SC, Mettler-Toledo). 120 mL of NaNO3 solution with concentrations of 0.05 and 0.5 mol/L was poured into a 250 mL conical flask containing 3 g of gibbsite. Then, the flask was shaken in a shaker at 25 °C at 200 revolutions per minute (rpm) for 72 h. After shaking, 100 mL of the suspension was added into a titration cup and vented with argon gas until the suspension pH remained unchanged. Subsequently, 0.1 mol/L HNO3 solution was used to adjust the suspension pH to below 3. After the pH is stable, the suspension was slowly titrated to pH = 11 with 0.1 mol/L NaOH. The intersection of the suspension’s titration curves with different background electrolyte concentrations is the point of zero charge (PZC) of the sample.

2.2. Adsorption Experiment

The gibbsite sample was purchased from Shanghai Macklin Biochemical Technology Co., Ltd. (Shanghai, China). La(NO3)3, Y(NO3)3, and arsenazo III were purchased from Aladdin Scientific Corp. (Cambridge, UK).
For the batch adsorption experiment, a certain amount of La(NO3)3 or Y(NO3)3 solution was poured into a 50 mL stoppered conical flask containing the gibbsite sample. The solid/liquid ratio is 2 g/20 mL, and the initial concentration of rare earth ions is 3.5 × 10⁻⁴ mol/L. Use 0.1 mol/L NaOH and HNO3 to adjust the solution pH. In order to prevent the precipitation of rare earth ions and the dissolution of gibbsite in alkaline solutions, the pH of the solution was selected as 4, 5, 6, and 7 in the experiment. Different amounts of NaNO3 were added to control the background electrolyte concentration (0.005, 0.050, 0.500 mol/L). The conical flask was sealed and shaken in a shaker at 25 °C and 200 rpm, and then the suspension was filtered through a polyethersulfone (PES) membrane with a pore size of 0.45 μm. The concentrations of rare earth ions in the filtrate were measured using spectrophotometry with arsenazo III [25,26] and calculated by measuring the absorbance at 652 nm with a UV-visible spectrophotometer (UV-vis, Carry 300, Agilent Technologies, Santa Clara, CA, USA). A working curve on the relationship between UV-vis absorbance and REE concentration was measured before each batch of sample testing. For each working curve, R2 should be greater than 0.995.
When the adsorption time is t, the adsorption efficiency At (%) for rare earth ions on gibbsite is:
A t = C 0 C t C 0 × 100 %
where C0 is the initial concentration of REE (mol/L); Ct is the concentration of the unadsorbed REE (mol/L) when the adsorption time is t. When adsorption reaches equilibrium, Ct = Ce. When the adsorption time is t, the adsorption capacity Qt (mg/g) is:
Q t = VM C 0 C t m
where V is the volume of solution (mL); M is the moμlar mass of rare earth ions (g/mol); m is the mass of gibbsite (g). When adsorption reaches equilibrium, Qt = Qe at t = te.

2.3. Adsorption Kinetics

The initial REE concentration was 3.5 × 10⁻⁴ mol/L, the initial pH was 7, and the background electrolyte concentration was 0 mol/L. The experimental data within 2 h after the beginning of adsorption were used for the fitting according to pseudo-first-order kinetics and pseudo-second-order kinetics models [27,28]. The nonlinear forms of the pseudo-first-order and pseudo-second-order models are shown in Equations (3) and (4), respectively.
Q t = Q e 1 e k 1 t
Q t = k 2 Q e 2 t 1 + k 2 Q e t
where Qt and Qe (mg/g) are the adsorption capacities of REE by gibbsite at the time t and equilibrium, respectively. k1 (1/h) and k2 (g/(mg∙min)) are the adsorption rate constants of pseudo-first-order kinetics and pseudo-second-order kinetics, respectively.

2.4. Adsorption Isotherm and Thermodynamics

The adsorption isotherms of La3+ and Y3+ by gibbsite were obtained through batch experiments. The initial rare earth ion concentrations were 2 × 10⁻⁴, 3 × 10⁻⁴, 4 × 10⁻⁴, 6 × 10⁻⁴, 8 × 10⁻⁴, 10 × 10−4, 12 × 10−4, and 14 × 10−4 mol/L, respectively. The initial suspension pH is 7; the background electrolyte concentration is 0 mol/L; the adsorption time is 72 h. By calculating the adsorption capacities of REE by gibbsite under different initial rare earth concentrations, the adsorption isotherm was obtained and then fitted using the Langmuir and Freundlich models [29,30].
The Langmuir model describes single-layer adsorption on a uniform surface, and the linear expression is:
  C e Q e = 1 K Q max + C e Q max
where Ce is the equilibrium concentration of La3+ or Y3+, mg/L; Qe is the adsorption capacity, mg/g; K is the Langmuir constant, L/mg; Qmax is the maximum adsorption capacity, mg/g.
The Freundlich adsorption isotherm is an empirical formula summarized based on a large amount of experimental data. It is suitable for multi-molecular layer physisorption on non-uniform surfaces. The linear expression is:
lg Q e = lg K F + 1 n lg C e
where KF is the Freundlich adsorption coefficient, and n is a constant.

3. Results and Discussions

3.1. Characterization of Gibbsite Samples

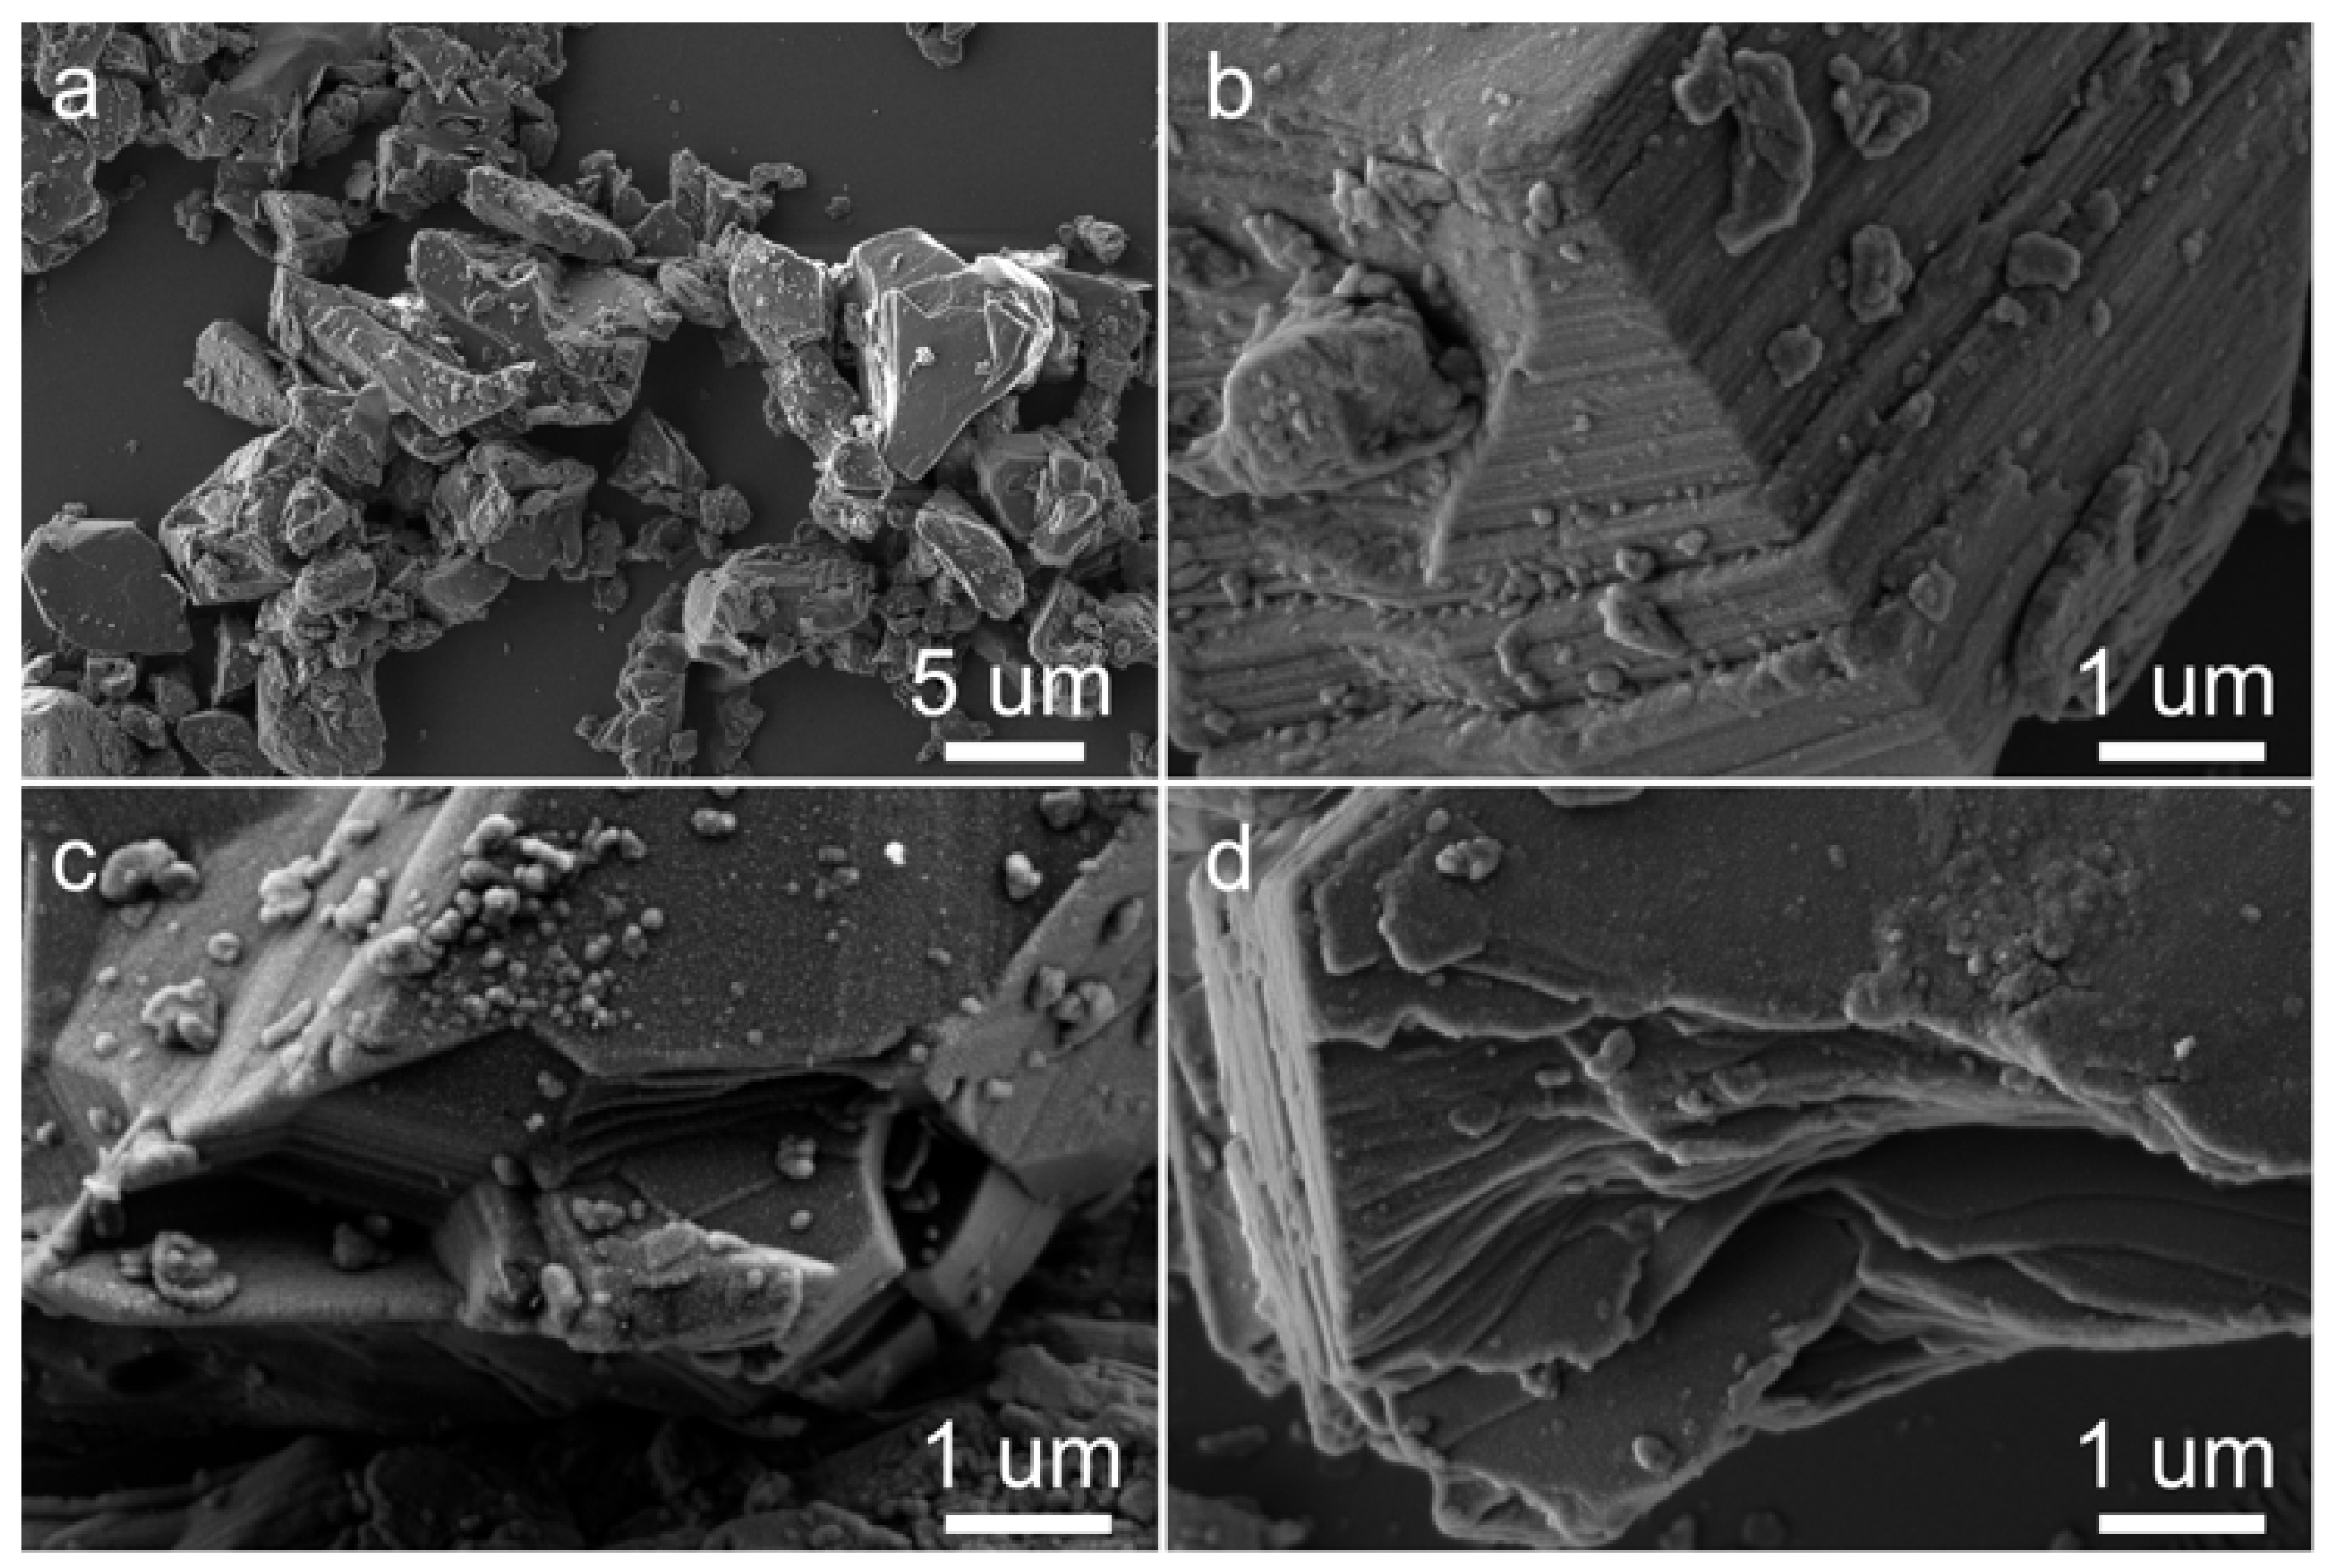
The X-ray diffraction pattern of the gibbsite sample is shown in Figure 1. It can be seen from the figure that no other phases except gibbsite are found within the detection range, the characteristic peaks are sharp and narrow, and the sample has good crystallinity. From the scanning electron microscope images of the gibbsite sample (Figure 2), it can be seen that the gibbsite exhibits a typical layered structure. By comparing the morphology of the gibbsite sample before and after the adsorption of REE, it is found that no noticeable changes have occurred in the morphology of the gibbsite.
When the surface charge of a mineral solid is zero, the suspension’s pH is the point of zero charge (PZC), and the PZC of an oxide or hydroxide with a uniform surface charge does not change with the background electrolyte concentration [31]. The potentiometric titration curves of the gibbsite under different background electrolyte concentrations (Figure 3) show that the PZC of the gibbsite sample (i.e., the pH at the intersection of the titration curve) is 10.

3.2. Effect of Adsorption Time

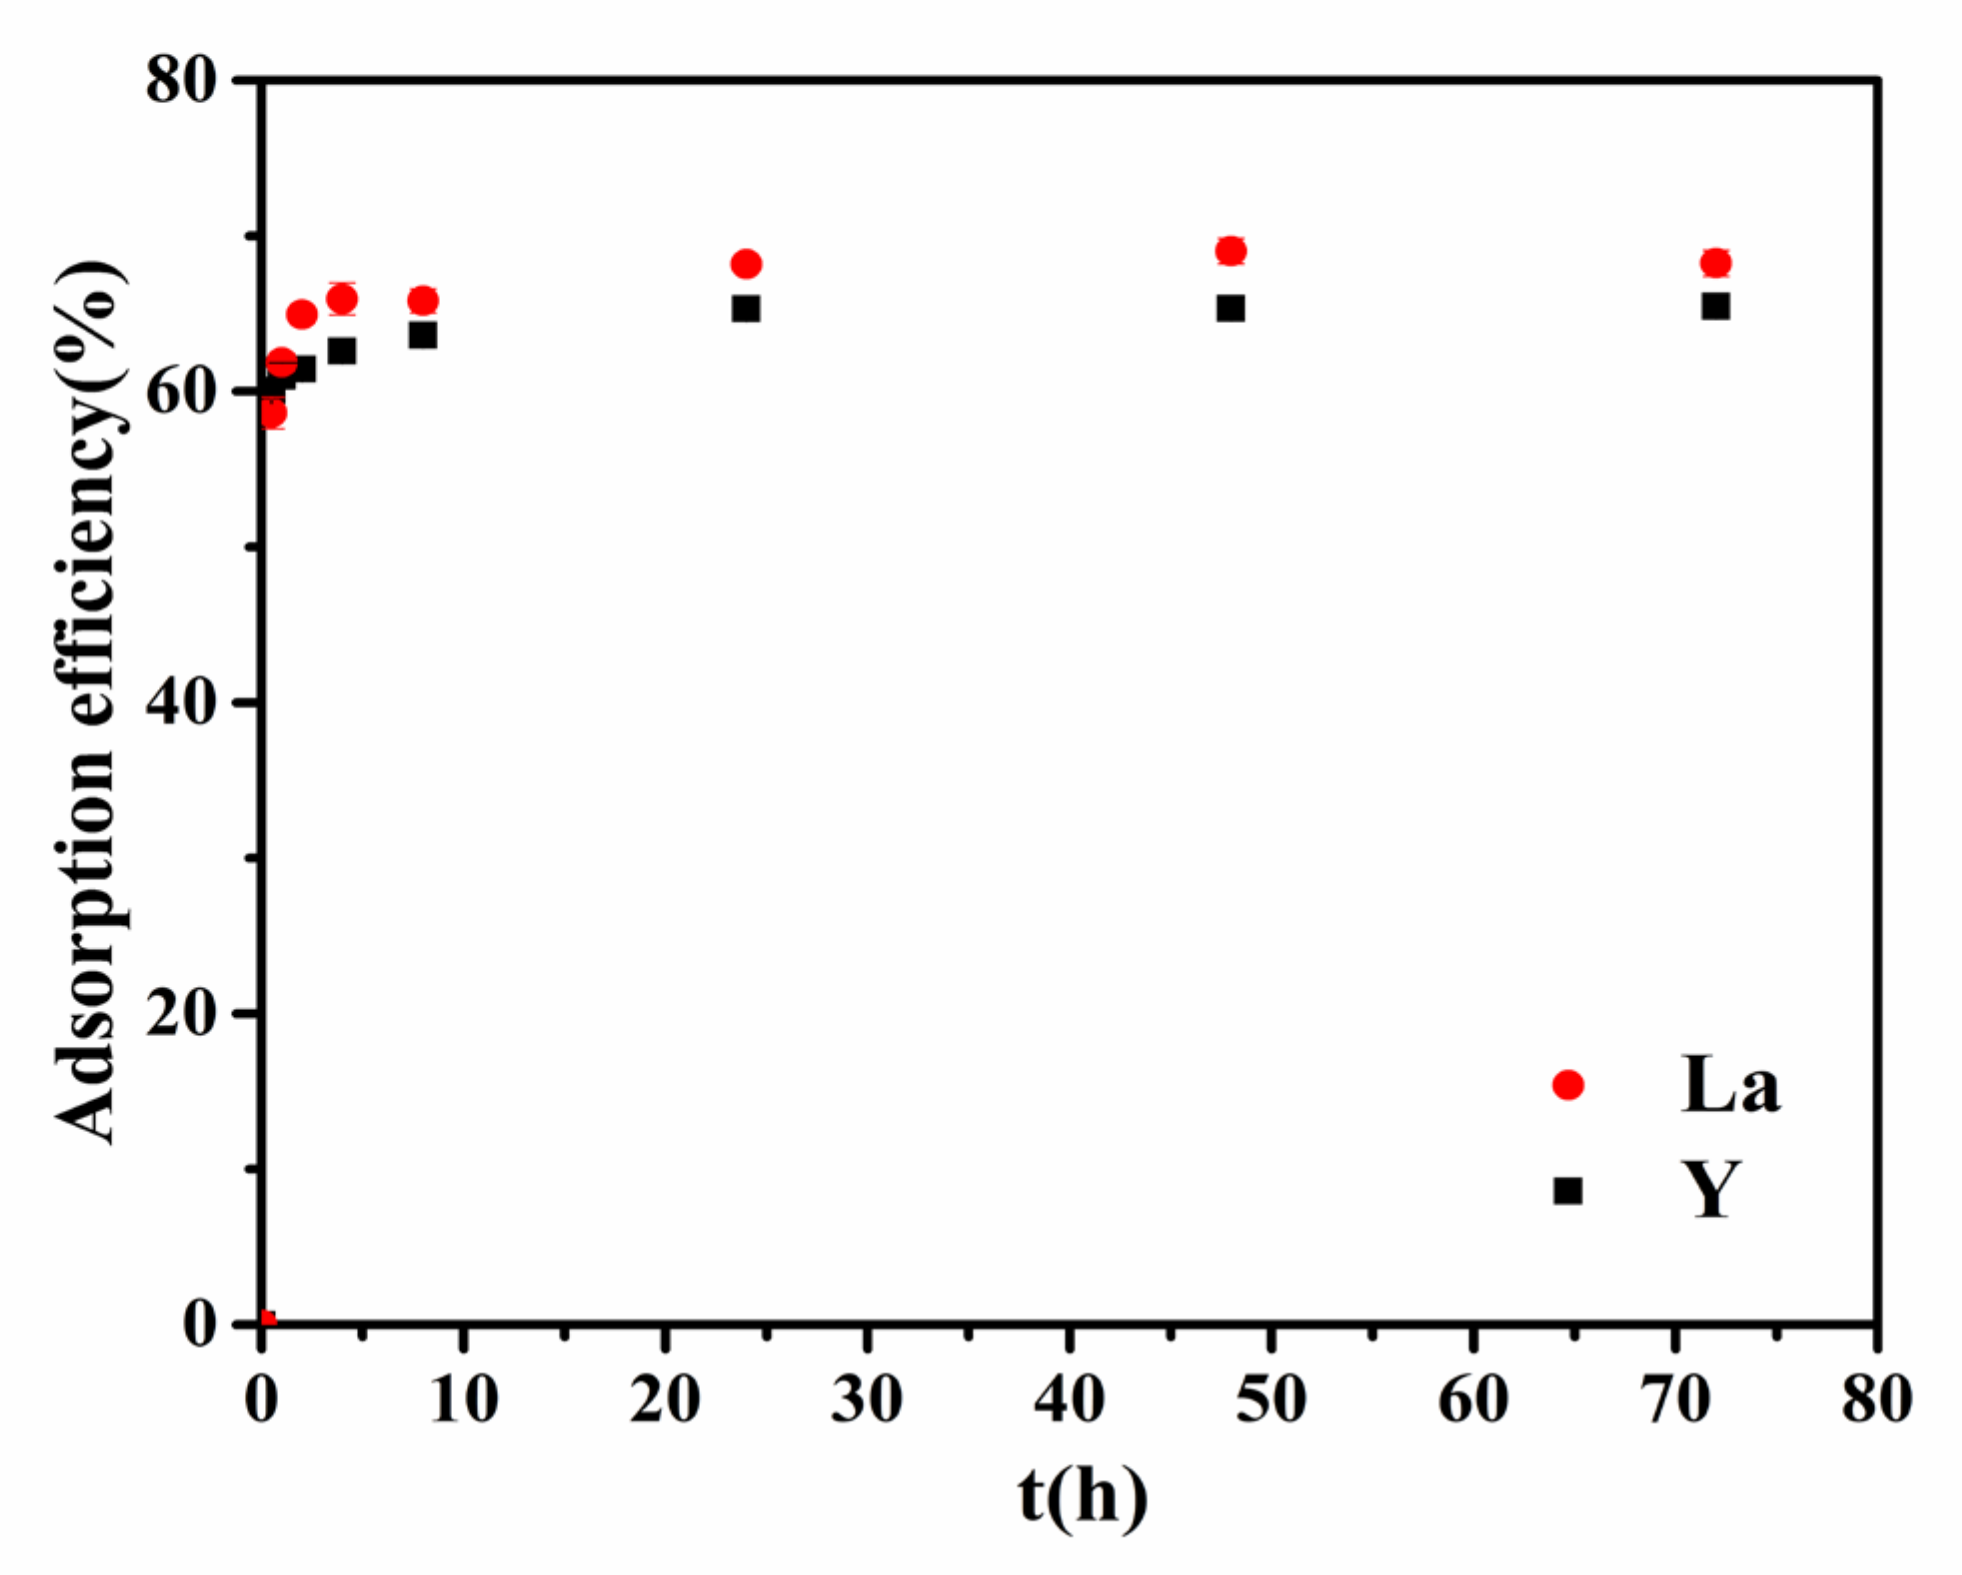
Under the conditions of pH 7 and no added background electrolyte, the adsorption efficiency of REE by gibbsite changes with the adsorption time, as shown in Figure 4. The adsorption efficiency surges within the first 2 h and then increases slowly until it approaches equilibrium at 72 h. At 72 h, the adsorption efficiencies of La3+ and Y3+ by gibbsite are approximately 70% and 65%, respectively, indicating that the adsorption capacity of gibbsite for LREE is higher than that of HREE. This phenomenon is consistent with the fact that the LREE are more abundant in bauxite [19]. The subsequent adsorption experiments in this study are all conducted for 72 h.

3.3. Effect of pH and Background Electrolyte Concentration

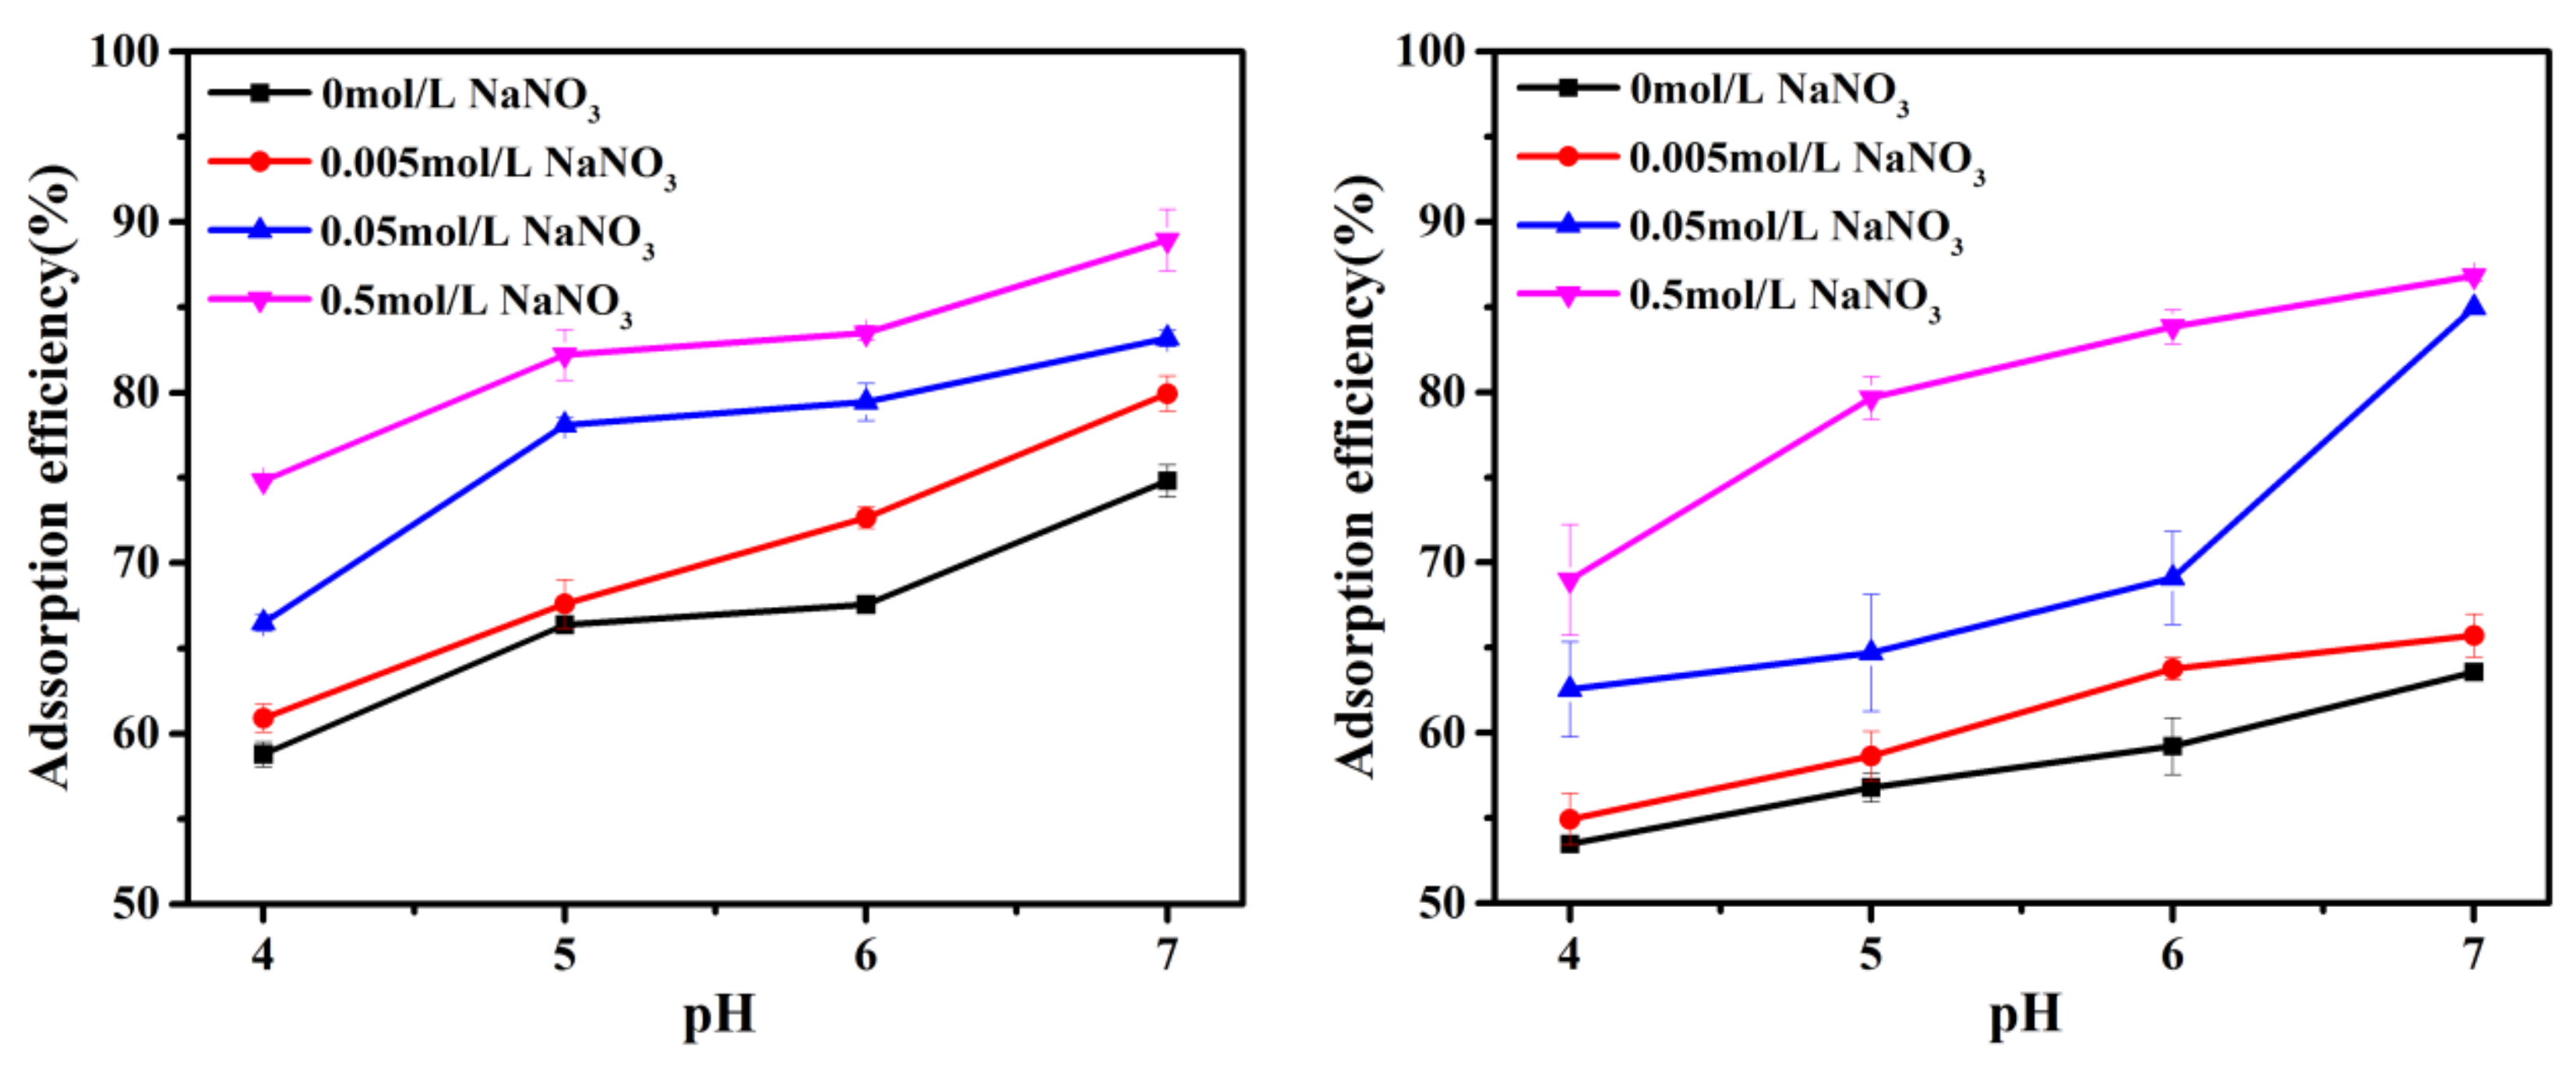
The effects of solution pH and background electrolyte concentration on adsorption are shown in Figure 5. The adsorption behaviors of La3+ and Y3+ show similar patterns. Under the same pH conditions, the adsorption efficiency of rare earth cations by gibbsite rises with the increase in background electrolyte concentration; under the same background electrolyte concentration, the adsorption efficiency shows an increasing trend as the pH ascends.
According to the results of potentiometric titration, the PZC of gibbsite is approximately 10. Therefore, the surface of gibbsite is positively charged due to the protonation effect at pH between 4 and 7. Meanwhile, lanthanum and yttrium mainly exist in the solution in the form of trivalent cations within this pH range. So there is electrostatic repulsion between rare earth cations and gibbsite. As the pH increases, the number of positive charges on the gibbsite surface gradually decreases, and the electrostatic repulsion between the adsorbate and the adsorbent also decreases, which is beneficial to the approach of these cations to the surface. On the other hand, the H+ concentration decreases with the increasing pH, and the competitive adsorption of hydronium ions with rare earth cations weaken, which is also conducive to the adsorption of rare earth ions by gibbsite. The effect of background electrolyte on adsorption may be attributed to the fact that the increase in background electrolyte concentration in the solution will compress the electric double layer on the surface of gibbsite, weaken the electrostatic repulsion between gibbsite and rare earth ions, and promote the adsorption between gibbsite and REE. These phenomena are similar to the adsorption behavior of gibbsite to other metal cations [32,33,34].

3.4. Adsorption Kinetics

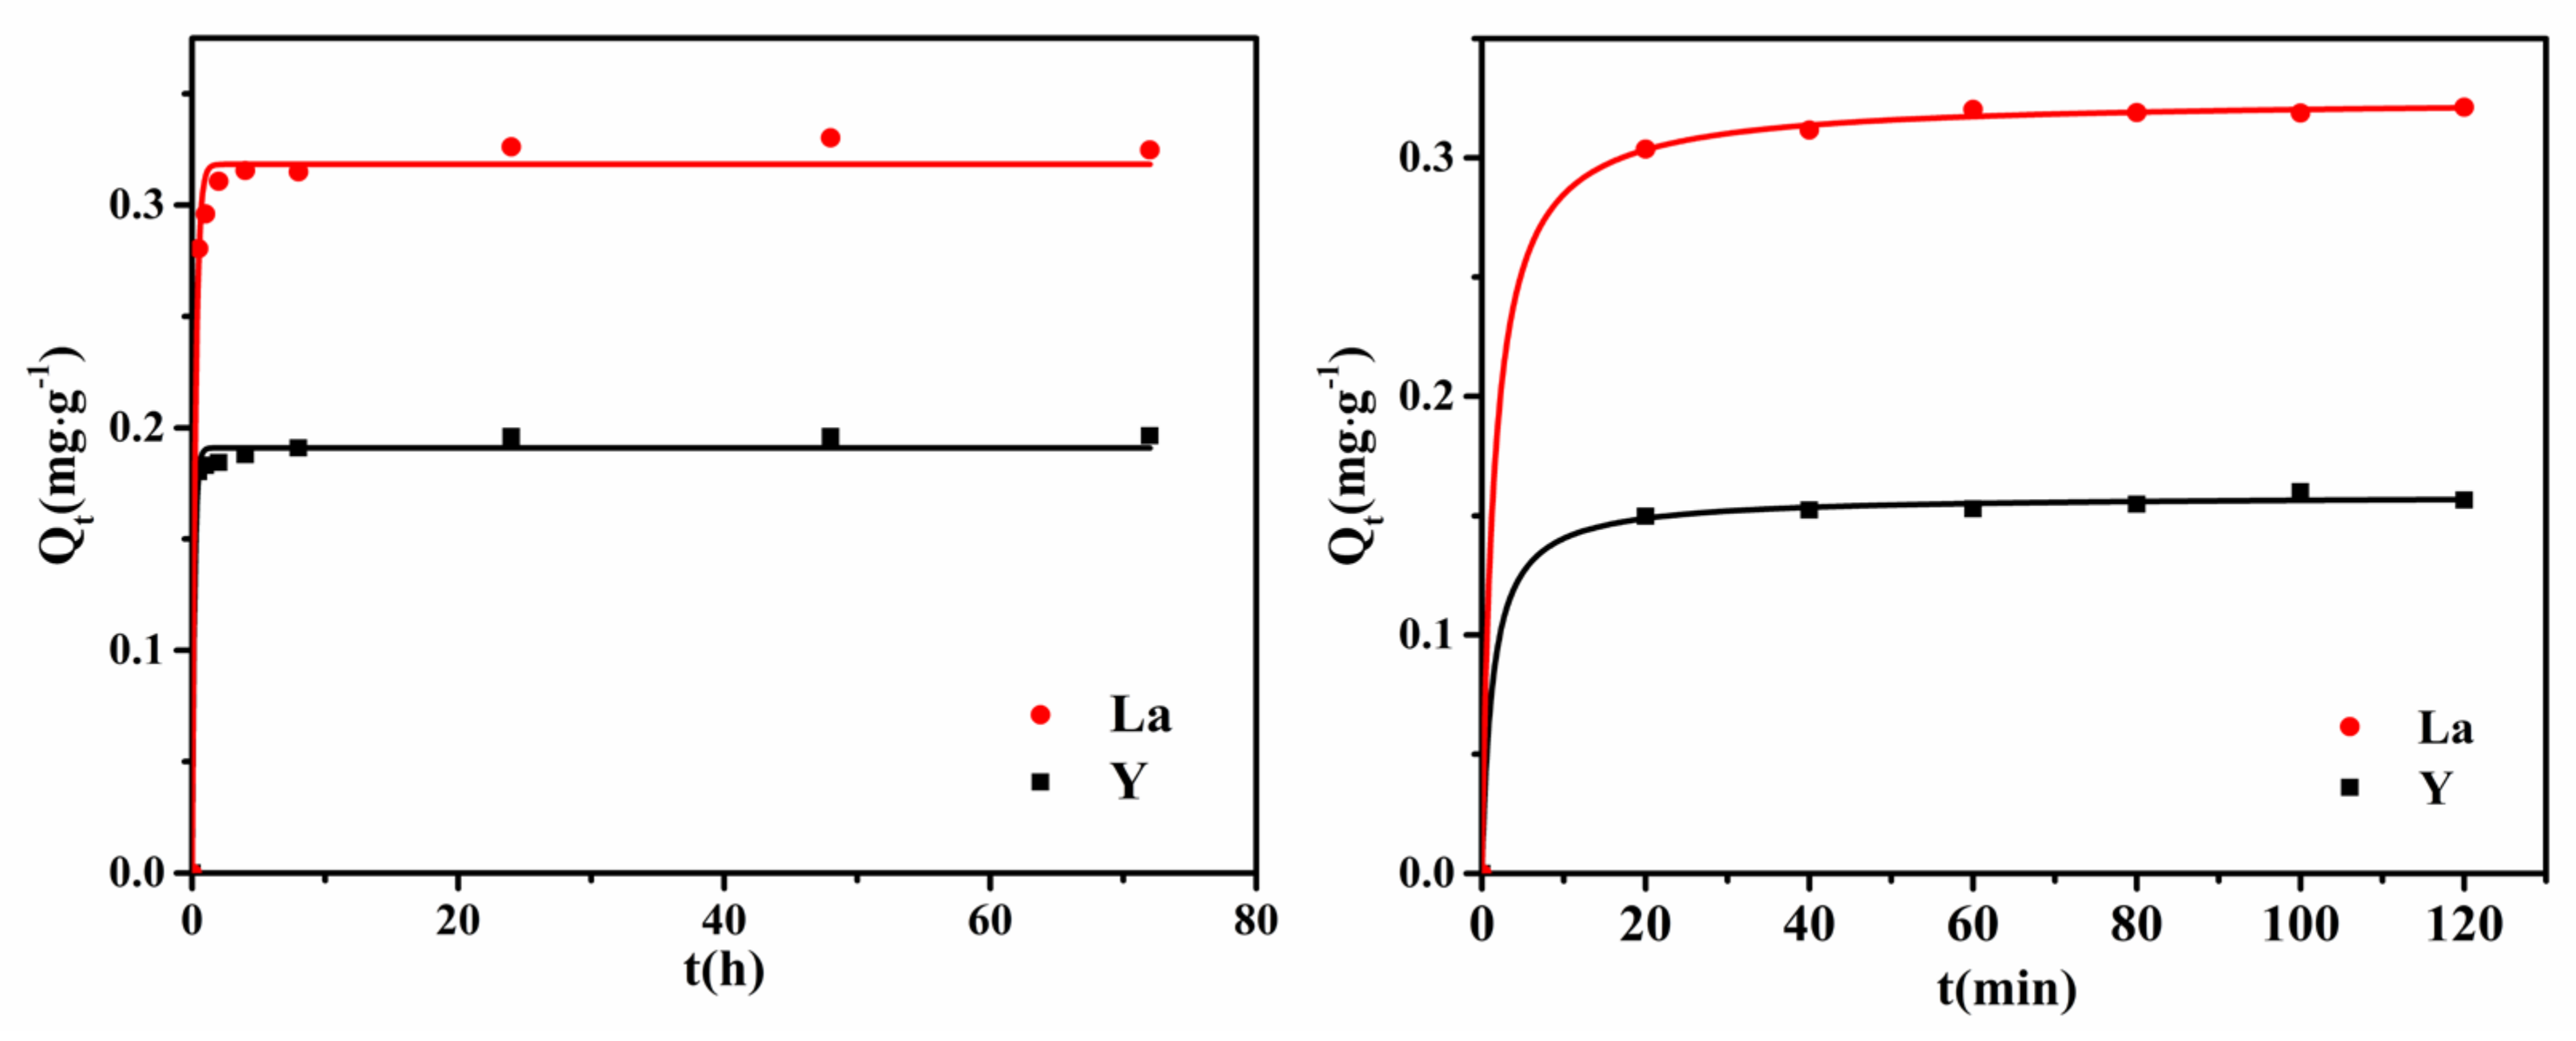
The adsorption kinetics of La3+ and Y3+ by gibbsite were analyzed based on pseudo-first-order and pseudo-second-order models, shown in Figure 6. The kinetic parameters were calculated separately according to the fitting equations, and the results are listed in Table 1. By comparing the correlation coefficients of pseudo-first-order and pseudo-second-order kinetic equations, it was found that the pseudo-second-order kinetic model can better fit the adsorption process of La3+ and Y3+ on gibbsite. According to the assumptions of the pseudo-second-order kinetic model, the adsorption rate of rare earth ions by gibbsite is jointly affected by the concentration of rare earth ion and the amount of gibbsite during the adsorption process.

3.5. Adsorption Isotherms and Thermodynamics

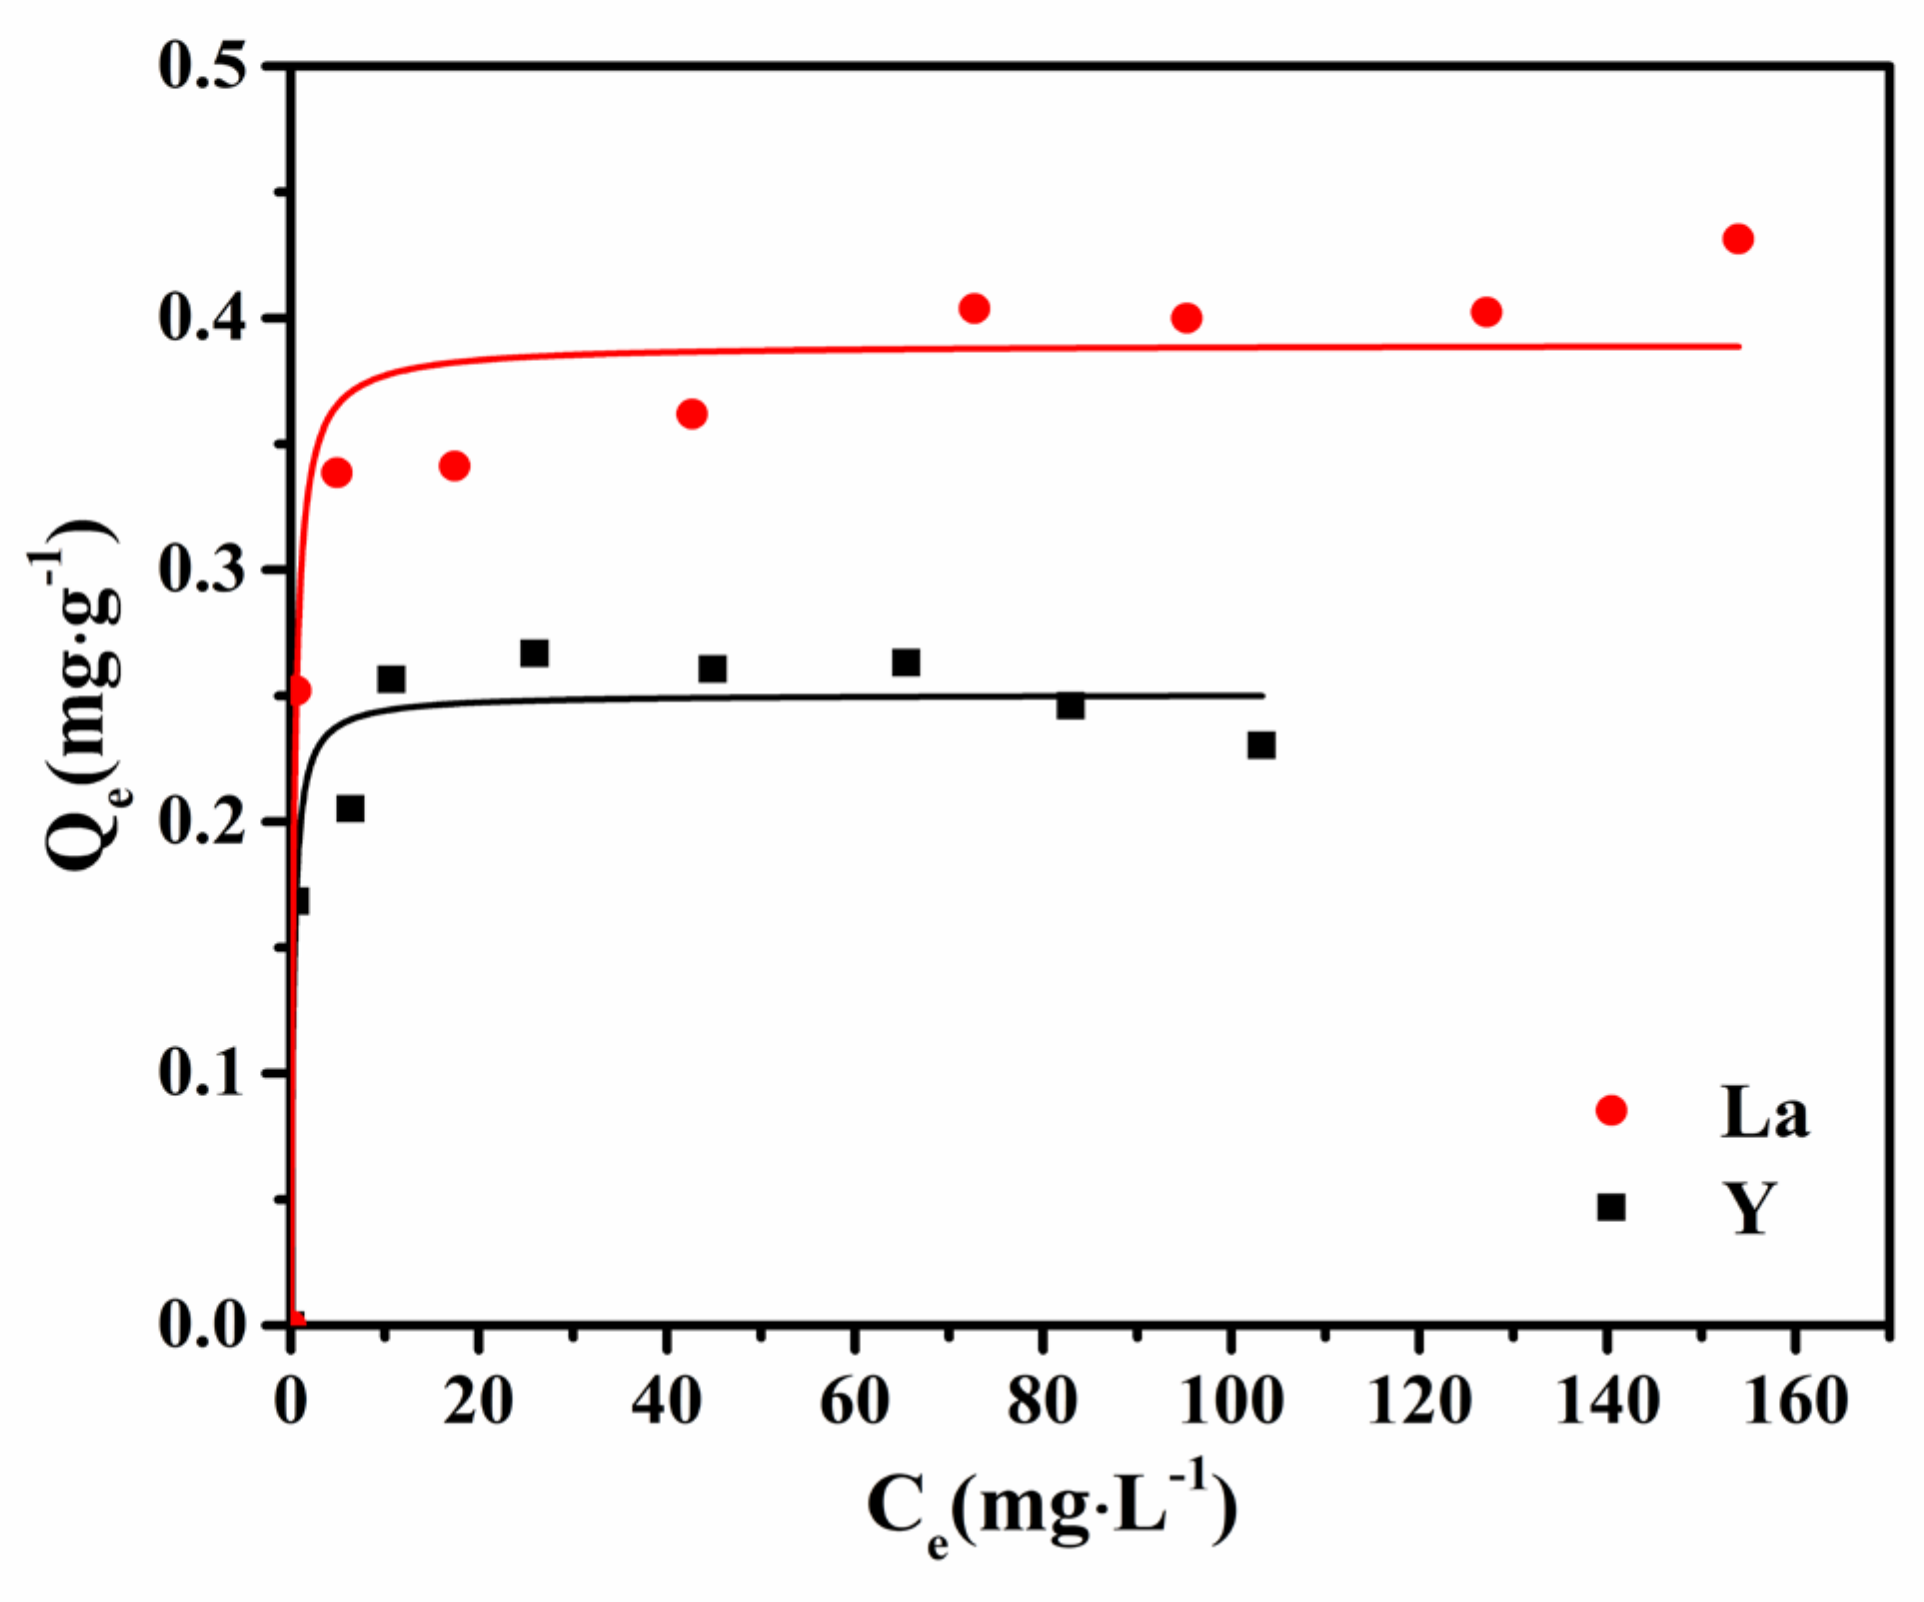
Figure 7 shows the adsorption isotherms of La3+ and Y3+ by gibbsite. The equilibrium adsorption capacities of rare earth ions by gibbsite increase sharply at low equilibrium concentrations of REE, and then these isotherms tend to flatten at higher cation concentrations, which suggest the approaching of equilibrium.
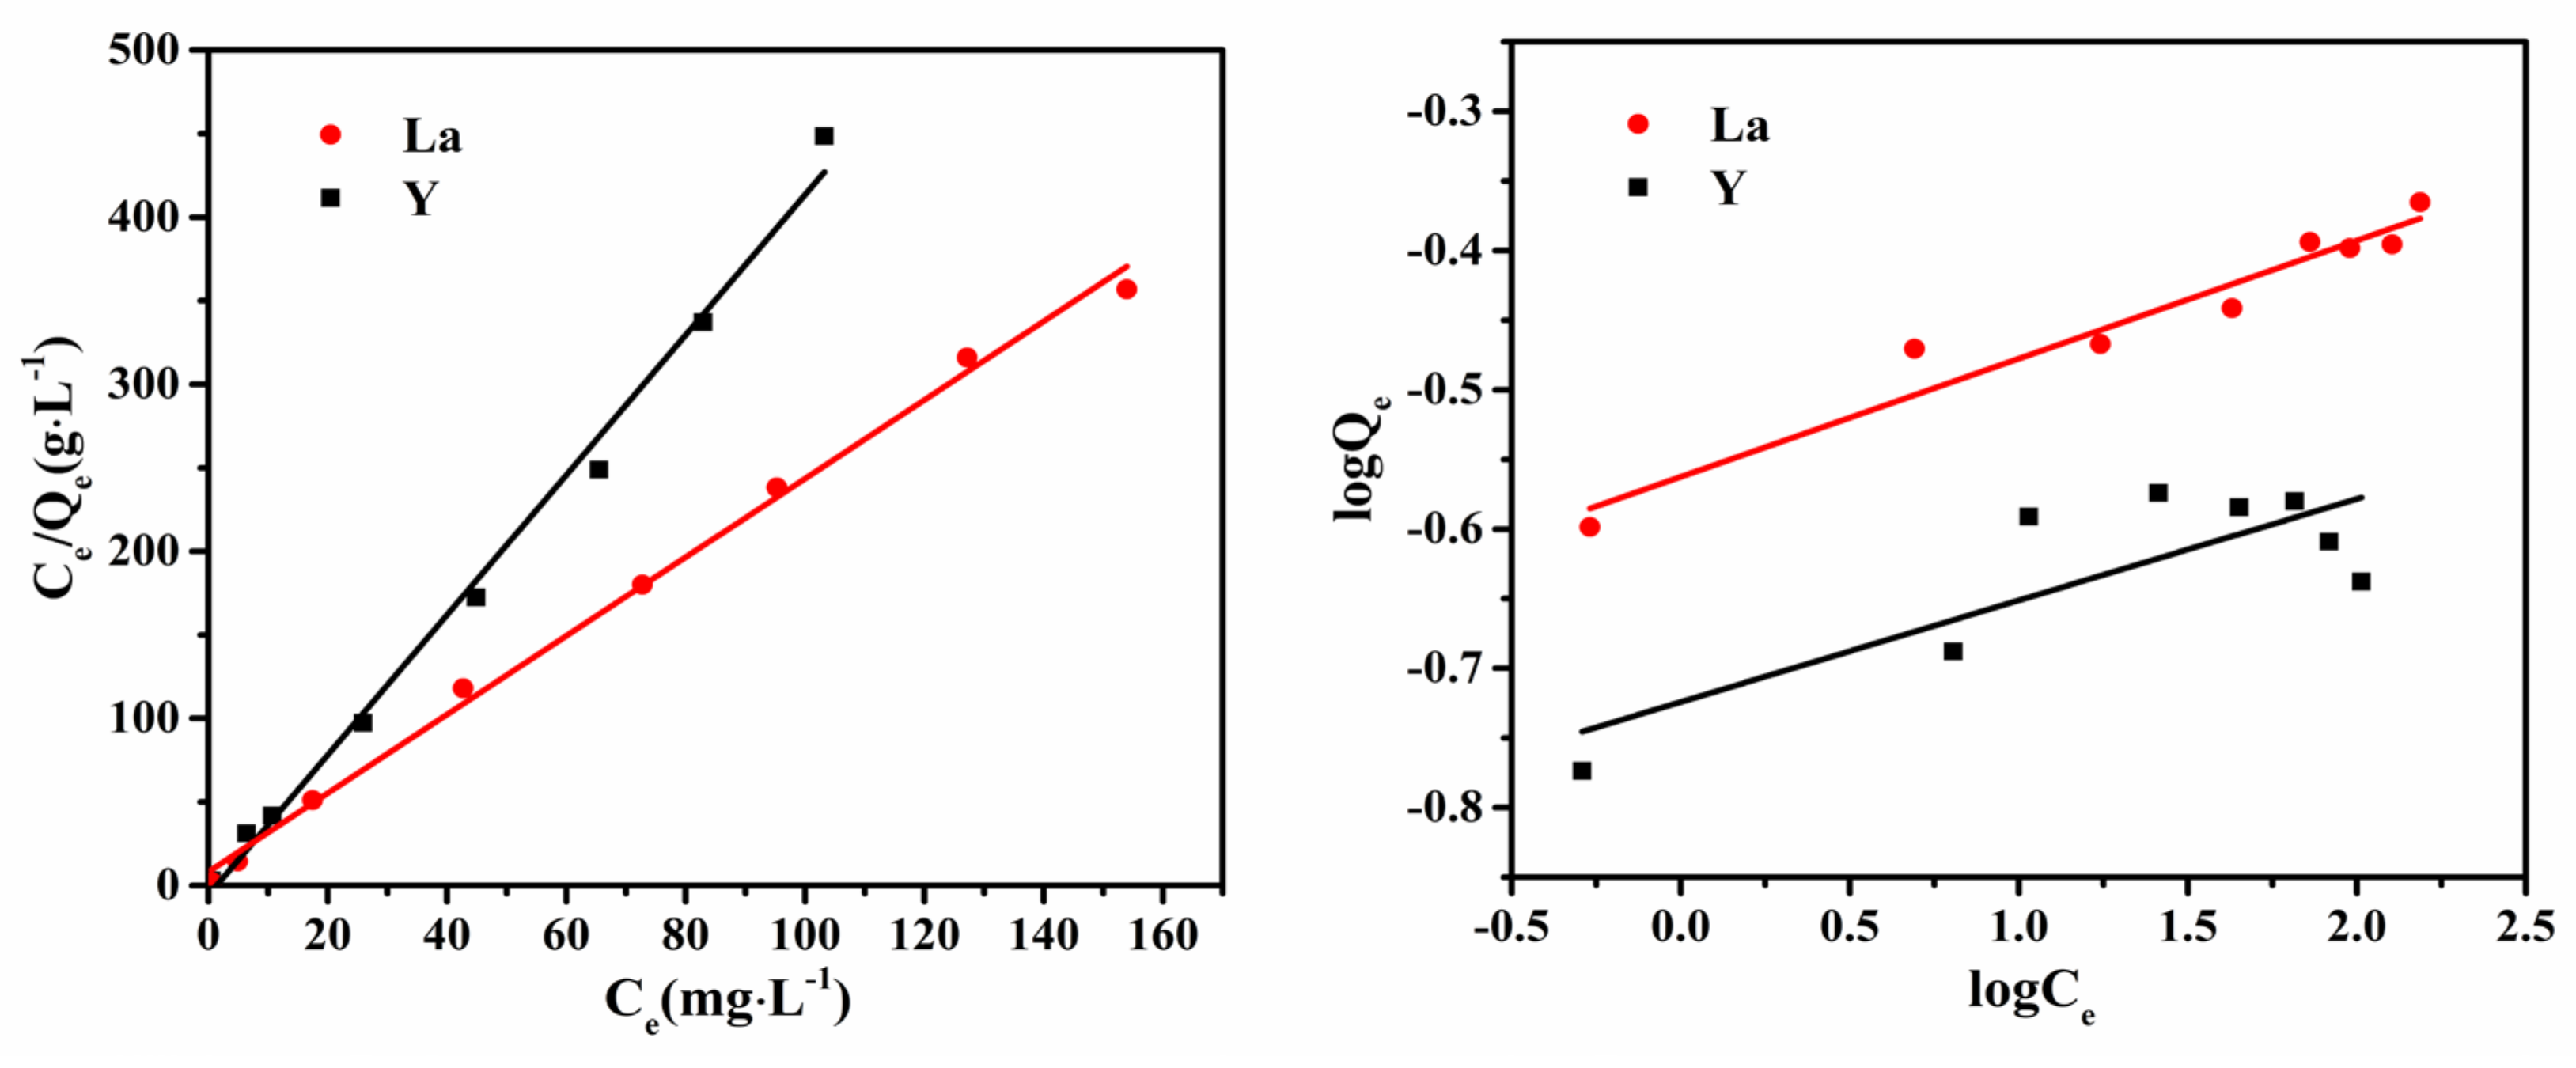
The adsorption isotherms are fitted based on the thermodynamic equilibrium model, and the resulting graph is shown in Figure 8. The thermodynamic parameters were calculated based on the linear fitting expressions listed in Table 2. By comparing the correlation coefficients (R2) of the fitting results, it is found that the adsorption processes of La3+ and Y3+ on gibbsite are both more consistent with the Langmuir model. Hence, the adsorption process is probably a single-layer adsorption. This is consistent with previous speculations about the formation of inner-sphere complexes between gibbsite and rare earth ions [10]. Therefore, according to the fitting parameters of the Langmuir model, it can also be seen that the maximum adsorption capacity (Qmax) of gibbsite for La3+ is approximately 424.9 ppm, and the maximum adsorption capacity (Qmax) for Y3+ is approximately 261.4 ppm. The adsorption amount of La3+ by gibbsite is more significant than that of Y3+, probably because La3+ has a larger hydrated ionic radius than Y3+. Cations in solution usually exist in the form of hydrated ions. For rare earth cations, light rare earth cations are generally nine-coordinated, while heavy rare earth cations tend to be eight-coordinated [8,35,36], making La3+ have a larger hydrated ionic radius than Y3+ radius (2.52 Å for La–O distance and 2.36 Å for Y–O distance) [37]. Therefore, the surface charge density of La3+ is lower than that of Y3+, and the electrostatic repulsion between La3+ and the mineral surface is weaker than that of Y3+, which is more conducive to the adsorption of La3+ compared with Y3+.

3.6. Comparison with Adsorption Behavior of Clay Minerals

Clay minerals are usually composed of silicon–oxygen tetrahedral sheets and aluminum–oxygen octahedral sheets. The structure of the aluminum–oxygen octahedral sheets in clay minerals and gibbsite is similar. It is generally considered that the activity of the silanol group is weak (SiOH = SiO + H+, lgK at 25 °C is −7.7 for kaolinite and −7.9 for montmorillonite [9]). However, the enrichment capacities of clay minerals for REE [38] are significantly higher than that of gibbsite.
Take kaolinite as an example, which is a 1:1 type clay mineral and the main occurrence mineral of REE in ion-adsorbed rare earth minerals. Since the isomorphous substitution in the structure is very deficient, it is generally considered to possess little permanent charge, and its active sites for adsorption are mainly surface hydroxyl groups (silanol and aluminol groups). According to our experimental results, the gibbsite’s point of zero charge is approximately 10, so the surface of gibbsite is positively charged within the pH range from 4 to 7. From the structure of clay minerals, it can be inferred that the combination of silicon–oxygen sheets makes the structure layers more electronegative. It can be confirmed from the PZCs of kaolinite and montmorillonite (usually <3) [39], which are both higher than gibbsite. This may be one of the reasons for the difference in adsorption behavior of rare earth cations between gibbsite and clay minerals.
On the other hand, other common clay minerals in supergene environments such as montmorillonite and illite have permanently negative charges due to isomorphic substitution in the mineral structure (low-valent cations such as Al3+ or Mg2+ replace high-valent cations such as Si4+ and Al3+ in the lattice) [40], which can electrostatically attract rare earth cations in a weakly acidic environment and then form surface complexations [41,42]. On the contrary, the gibbsite generally has little permanent negative charge in the layers, and it can be deduced from the adsorption experiment that there is electrostatic repulsion between gibbsite and rare earth ions in a weakly acidic environment. So, the adsorption capacities of REE by clay minerals are significantly more than that of gibbsite. In addition, there are exchangeable interlayer cations in some clay minerals (such as montmorillonite). The interlayer cations can exchange with rare earth ions in the solution during the adsorption process, which is also benefits the adsorption of rare earth ions [43].
It can be seen that unlike gibbsite, the surface of clay minerals is overall negatively charged at weakly acidic pH, and there is electrostatic attraction between it and rare earth cations. Therefore, as the background ion concentration increases, the adsorption capacity decreases; as the pH increases, the protonation effect weakens, and the variable negative charge increases, so the adsorption capacity increases.

4. Conclusions

This paper used batch experiments to explore the adsorption behaviors of REE on gibbsite. The adsorption efficiencies of rare earth ions surge within the first 2 h, then increase slowly until close to equilibrium at 72 h. According to the results of potentiometric titration experiments, the interaction between gibbsite and rare earth ions is mainly electrostatic repulsion within the pH range of this study, and the adsorption capacity of rare earth ions rises with the increase in pH and background electrolyte concentration in the solution. These may suggest that rare earth ions may form an inner-sphere complex with the surface aluminols of gibbsite. Through model fitting of the kinetics and thermodynamics of the adsorption process, it was found that the adsorption process of rare earth ions by gibbsite is more consistent with the pseudo-second-order kinetic model and the Langmuir single-layer adsorption model. The adsorption capacity of light rare earths by gibbsite is higher than that of heavy rare earths, possibly because light REE have larger hydrated ionic radii. This phenomenon is consistent with the fact that LREE are more enriched than HREE in bauxite. Therefore, based on the experimental results, gibbsite may contribute to the enrichment and differentiation process of REE in bauxite. Moreover, clay minerals are generally more negatively charged, resulting from the combination of silicon–oxygen sheets and the isomorphic substitution in the layers compared with gibbsite, which causes the high capacity of REE adsorbed on clay minerals. The results of this study would help to understand the role of aluminum hydroxide in the migration and fate of REE in epigenetic environments.

Author Contributions

Conceptualization, Z.Q., W.Y., X.N. and Q.W.; methodology, Z.Q. and Z.Z.; investigation, Z.Q. and Z.Z.; resources, Z.Q. and Q.W.; funding acquisition, Z.Q. and Q.W.; data curation, Z.Q. and Z.Z.; project administration, S.Y. (Shuguang Yang) and S.Y. (Shuqin Yang); writing—original draft preparation, Z.Q. and Z.Z.; writing—review and editing, Z.Q. and Q.W.; visualization, Z.Q.; supervision, Z.Q. and Q.W. All authors have read and agreed to the published version of the manuscript.

Funding

This work was financially supported by the National Natural Science Foundation of China (41872046), the B-type Strategic Priority Program of the Chinese Academy of Sciences (XDB41000000), the Guizhou Provincial Basic Research Program (Natural Science): [2019]1460, and the Frontier Program of State Key Laboratory of Ore Deposit Geochemistry (SKLODG-2018-01).

Data Availability Statement

Data will be made available on request.

Conflicts of Interest

The authors declare no conflict of interest.

References

  1. Patel, K.S.; Sharma, S.; Maity, J.P.; Martin-Ramos, P.; Fiket, Z.; Bhattacharya, P.; Zhu, Y.B. Occurrence of uranium, thorium and rare earth elements in the environment: A review. Front. Environ. Sci. 2023, 10, 1058053. [Google Scholar] [CrossRef]
  2. Balaram, V. Potential Future Alternative Resources for Rare Earth Elements: Opportunities and Challenges. Minerals 2023, 13, 425. [Google Scholar] [CrossRef]
  3. Swain, B. Red mud: An environmental challenge but overlooked treasure for critical rare earth metals. MRS Bull. 2022, 47, 289–302. [Google Scholar] [CrossRef]
  4. Dushyantha, N.; Ratnayake, N.; Premasiri, R.; Batapola, N.; Panagoda, H.; Jayawardena, C.; Chandrajith, R.; Ilankoon, I.; Rohitha, S.; Ratnayake, A.S.; et al. Geochemical exploration for prospecting new rare earth elements (REEs) sources: REE potential in lake sediments around Eppawala Phosphate Deposit, Sri Lanka. J. Asian Earth Sci. 2023, 243, 105515. [Google Scholar] [CrossRef]
  5. Mancheri, N.A.; Sprecher, B.; Bailey, G.; Ge, J.; Tukker, A. Effect of Chinese policies on rare earth supply chain resilience. Resour. Conserv. Recycl. 2019, 142, 101–112. [Google Scholar] [CrossRef]
  6. Yang, M.J.; Liang, X.L.; Ma, L.Y.; Huang, J.; He, H.P.; Zhu, J.X. Adsorption of REEs on kaolinite and halloysite: A link to the REE distribution on clays in the weathering crust of granite. Chem. Geol. 2019, 525, 210–217. [Google Scholar] [CrossRef]
  7. Alshameri, A.; He, H.; Xin, C.; Zhu, J.; Xinghu, W.; Zhu, R.; Wang, H. Understanding the role of natural clay minerals as effective adsorbents and alternative source of rare earth elements: Adsorption operative parameters. Hydrometallurgy 2019, 185, 149–161. [Google Scholar] [CrossRef]
  8. Borst, A.M.; Smith, M.P.; Finch, A.A.; Estrade, G.; Villanova-de-Benavent, C.; Nason, P.; Marquis, E.; Horsburgh, N.J.; Goodenough, K.M.; Xu, C.; et al. Adsorption of rare earth elements in regolith-hosted clay deposits. Nat. Commun. 2020, 11, 4386. [Google Scholar] [CrossRef]
  9. Tertre, E.; Berger, G.; Simoni, E.; Castet, S.; Giffaut, E.; Loubet, M.; Catalette, H. Europium retention onto clay minerals from 25 to 150 °C: Experimental measurements, spectroscopic features and sorption modelling. Geochim. Cosmochim. Acta 2006, 70, 4563–4578. [Google Scholar] [CrossRef]
  10. Ishida, K.; Saito, T.; Aoyagi, N.; Kimura, T.; Nagaishi, R.; Nagasaki, S.; Tanaka, S. Surface speciation of Eu3+ adsorbed on kaolinite by time-resolved laser fluorescence spectroscopy (TRLFS) and parallel factor analysis (PARAFAC). J. Colloid Interface Sci. 2012, 374, 258–266. [Google Scholar] [CrossRef]
  11. Brigatti, M.F.; Galán, E.; Theng, B.K.G. Structure and mineralogy of clay minerals. In Handbook of Clay Science, 2nd ed.; Bergaya, F., Lagaly, G., Eds.; Developments in Clay Science; Elsevier: Amsterdam, The Netherlands, 2013; pp. 21–81. [Google Scholar]
  12. Abedini, A.; Mongelli, G.; Khosravi, M.; Sinisi, R. Geochemistry and secular trends in the middle-late Permian karst bauxite deposits, northwestern Iran. Ore Geol. Rev. 2020, 124, 103660. [Google Scholar] [CrossRef]
  13. Mondillo, N.; Di Nuzzo, M.; Kalaitzidis, S.; Boni, M.; Santoro, L.; Balassone, G. Petrographic and geochemical features of the B3 bauxite horizon (Cenomanian-Turonian) in the Parnassos-Ghiona area: A contribution towards the genesis of the Greek karst bauxites. Ore Geol. Rev. 2022, 143, 104759. [Google Scholar] [CrossRef]
  14. Abedini, A.; Khosravi, M. REE Geochemical Characteristics of the Huri Karst-Type Bauxite Deposit, Irano-Himalayan Belt, Northwestern Iran. Minerals 2023, 13, 926. [Google Scholar] [CrossRef]
  15. Gamaletsos, P.N.; Godelitsas, A.; Filippidis, A.; Pontikes, Y. The Rare Earth Elements Potential of Greek Bauxite Active Mines in the Light of a Sustainable REE Demand. J. Sustain. Metall. 2019, 5, 20–47. [Google Scholar] [CrossRef]
  16. Deady, E.A.; Mouchos, E.; Goodenough, K.; Williamson, B.J.; Wall, F. A review of the potential for rare-earth element resources from European red muds: Examples from Seydisehir, Turkey and Parnassus-Giona, Greece. Mineral. Mag. 2016, 80, 43–61. [Google Scholar] [CrossRef]
  17. Gibaga, C.R.L.; Samaniego, J.O.; Tanciongco, A.M.; Quierrez, R.N.M.; Montano, M.O.; Gervasio, J.H.C.; Reyes, R.C.G.; Peralta, M.J.V. The rare earth element (REE) potential of the Philippines. J. Geochem. Explor. 2022, 242, 107082. [Google Scholar] [CrossRef]
  18. Long, K.; Fu, Y.; Long, Z.; Tian, J.; Zheng, J. Resource potential analysis of REE and Sc in global bauxite. Acta Geol. Sin. 2019, 93, 1279–1295. [Google Scholar]
  19. Chen, J.; Wang, Q.; Zhang, Q.; Carranza, E.J.M.; Wang, J. Mineralogical and geochemical investigations on the iron-rich gibbsitic bauxite in Yongjiang basin, SW China. J. Geochem. Explor. 2018, 188, 413–426. [Google Scholar] [CrossRef]
  20. Torró, L.; Proenza, J.A.; Aiglsperger, T.; Bover-Arnal, T.; Villanova-de-Benavent, C.; Rodríguez-García, D.; Ramírez, A.; Rodríguez, J.; Mosquea, L.A.; Salas, R. Geological, geochemical and mineralogical characteristics of REE-bearing Las Mercedes bauxite deposit, Dominican Republic. Ore Geol. Rev. 2017, 89, 114–131. [Google Scholar] [CrossRef]
  21. Zarasvandi, A.; Charchi, A.; Carranza, E.J.M.; Alizadeh, B. Karst bauxite deposits in the Zagros Mountain Belt, Iran. Ore Geol. Rev. 2008, 34, 521–532. [Google Scholar] [CrossRef]
  22. Baumer, T.; Kay, P.; Hixon, A.E. Comparison of europium and neptunium adsorption to aluminum (hydr)oxide minerals. Chem. Geol. 2017, 464, 84–90. [Google Scholar] [CrossRef]
  23. Tokoro, C.; Sakakibara, T.; Suzuki, S. Mechanism investigation and surface complexation modeling of zinc sorption on aluminum hydroxide in adsorption/coprecipitation processes. Chem. Eng. J. 2015, 279, 86–92. [Google Scholar] [CrossRef]
  24. Ogata, F.; Tominaga, H.; Yabutani, H.; Taga, A.; Kawasaki, N. Granulation of gibbsite with inorganic binder and its ability to adsorb Mo(VI) from aqueous solution. Toxicol. Environ. Chem. 2012, 94, 650–659. [Google Scholar] [CrossRef]
  25. Guo, X.M.; Yan, Q.C.; Meng, X.T.; Ma, R.X. UV-Visible Spectrophotometry with Arsenazo III for the Determination of Samarium. J. Appl. Spectrosc. 2019, 86, 542–548. [Google Scholar] [CrossRef]
  26. Savvin, S.B. Analytical use of arsenazo III: Determination of thorium, zirconium, uranium and rare earth elements. Talanta 1961, 8, 673–685. [Google Scholar] [CrossRef]
  27. Revellame, E.D.; Fortela, D.L.; Sharp, W.; Hernandez, R.; Zappi, M.E. Adsorption kinetic modeling using pseudo-first order and pseudo-second order rate laws: A review. Clean. Eng. Technol. 2020, 1, 100032. [Google Scholar] [CrossRef]
  28. Sen Gupta, S.; Bhattacharyya, K.G. Kinetics of adsorption of metal ions on inorganic materials: A review. Adv. Colloid Interface Sci. 2011, 162, 39–58. [Google Scholar] [CrossRef]
  29. Al-Ghouti, M.A.; Da’ana, D.A. Guidelines for the use and interpretation of adsorption isotherm models: A review. J. Hazard. Mater. 2020, 393, 122383. [Google Scholar] [CrossRef]
  30. Foo, K.Y.; Hameed, B.H. Insights into the modeling of adsorption isotherm systems. Chem. Eng. J. 2010, 156, 2–10. [Google Scholar] [CrossRef]
  31. Pechenyuk, S.I. The use of the pH at the point of zero charge for characterizing the properties of oxide hydroxides. Russ. Chem. Bull. 1999, 48, 1017–1023. [Google Scholar] [CrossRef]
  32. Tochiyama, O.; Yamazaki, H.; Li, N. Effect of the concentration of metal ions on their adsorption on various hydrous iron and aluminum oxides. J. Nucl. Sci. Technol. 1996, 33, 846–851. [Google Scholar] [CrossRef]
  33. Ahmed, A.; Yujun, W.; Johannes, L.; Marcelo Eduardo, A. Calcium Uptake on Kaolinite and Gibbsite: Effects of Sulfate, pH, and Salt Concentration with Additional Insight from Second Harmonic Generation on Temperature Dependencies with Sapphire-Basal Planes and the Potential Relevance to Ice Nucleation. In Advanced Sorption Process Applications; Serpil, E., Ed.; IntechOpen: Rijeka, Croatia, 2018; pp. 1–22. [Google Scholar]
  34. Saeki, K. Adsorption of Fe2+ and Mn2+ on silica, gibbsite, and humic acids. Soil Sci. 2004, 169, 832–840. [Google Scholar] [CrossRef]
  35. Persson, I.; D’Angelo, P.; De Panfilis, S.; Sandström, M.; Eriksson, L. Hydration of Lanthanoid(III) Ions in Aqueous Solution and Crystalline Hydrates Studied by EXAFS Spectroscopy and Crystallography: The Myth of the “Gadolinium Break”. Chem. Eur. J. 2008, 14, 3056–3066. [Google Scholar] [CrossRef] [PubMed]
  36. Peters, J.A.; Djanashvili, K.; Geraldes, C.F.G.C.; Platas-Iglesias, C. The chemical consequences of the gradual decrease of the ionic radius along the Ln-series. Coord. Chem. Rev. 2020, 406, 213146. [Google Scholar] [CrossRef]
  37. Persson, I. Hydrated metal ions in aqueous solution: How regular are their structures? Pure Appl. Chem. 2010, 82, 1901–1917. [Google Scholar] [CrossRef]
  38. Coppin, F.; Berger, G.; Bauer, A.; Castet, S.; Loubet, M. Sorption of lanthanides on smectite and kaolinite. Chem. Geol. 2002, 182, 57–68. [Google Scholar] [CrossRef]
  39. Kosmulski, M. The pH dependent surface charging and points of zero charge. X. Update. Adv. Colloid Interface Sci. 2023, 319, 102973. [Google Scholar] [CrossRef]
  40. Hirst, C.; Andersson, P.S.; Shaw, S.; Burke, I.T.; Kutscher, L.; Murphy, M.J.; Maximov, T.; Pokrovsky, O.S.; Morth, C.-M.; Porcelli, D. Characterisation of Fe-bearing particles and colloids in the Lena River basin, NE Russia. Geochim. Cosmochim. Acta 2017, 213, 553–573. [Google Scholar] [CrossRef]
  41. Wainipee, W.; Cuadros, J.; Sephton, M.A.; Unsworth, C.; Gill, M.G.; Strekopytov, S.; Weiss, D.J. The effects of oil on As(V) adsorption on illite, kaolinite, montmorillonite and chlorite. Geochim. Cosmochim. Acta 2013, 121, 487–502. [Google Scholar] [CrossRef]
  42. Yusoff, Z.M.; Ngwenya, B.T.; Parsons, I. Mobility and fractionation of REEs during deep weathering of geochemically contrasting granites in a tropical setting, Malaysia. Chem. Geol. 2013, 349, 71–86. [Google Scholar] [CrossRef]
  43. Granados-Correa, F.; Vilchis-Granados, J.; Jimenez-Reyes, M.; Quiroz-Granados, L.A. Adsorption Behaviour of La(III) and Eu(III) Ions from Aqueous Solutions by Hydroxyapatite: Kinetic, Isotherm, and Thermodynamic Studies. J. Chem. 2013, 2013, 751696. [Google Scholar] [CrossRef]
Figure 1. X-ray diffraction pattern of gibbsite sample.
Minerals 13 01530 g001
Figure 2. Scanning electron microscope images of gibbsite samples ((a,b) Gibbsite; (c) Gibbsite after the adsorption of La3+; (d) Gibbsite after the adsorption of Y3+).
Minerals 13 01530 g002
Figure 3. Potentiometric titration curves of gibbsite suspensions under different background electrolyte concentrations.
Minerals 13 01530 g003
Figure 4. Variations in the adsorption efficiencies of La3+ and Y3+ on gibbsite with time.
Minerals 13 01530 g004
Figure 5. Effects of solution pH and background ion concentration on the adsorption efficiency of La3+ (left) and Y3+ (right) on gibbsite.
Minerals 13 01530 g005
Figure 6. Pseudo-first-order (left) and pseudo-second-order (right) kinetic fittings of the adsorption of La3+ and Y3+ on gibbsite.
Minerals 13 01530 g006
Figure 7. Adsorption isotherms of rare earth cations adsorbed by gibbsite.
Minerals 13 01530 g007
Figure 8. Linear fittings of the adsorption isotherms of La3+ and Y3+ on gibbsite with the Langmuir thermodynamic model (left) and the Freundlich thermodynamic model (right).
Minerals 13 01530 g008
Table 1. Fitting parameters of kinetic model for the adsorption of La3+ and Y3+ on gibbsite.
Kinetics ModelPseudo-First-Order Kinetics ModelPseudo-Second-Order Kinetics Model
Qe/(mg∙g−1)k1/(1/h)R2Qe/(mg∙g−1)k2/(g/mg·min−1)R2
La0.31834.03530.99300.32472.19070.9999
Y0.19095.60900.99420.15844.91500.9987
Table 2. Fitting parameters of the thermodynamic models for the adsorption of La3+ and Y3+ on gibbsite.
Thermodynamic ModelLangmuir ModelFreundlich Model
Qmax/(mg∙g−1)K/(L∙mg−1)R2KF1/nR2
La0.42490.05170.99640.27390.08480.9456
Y0.26141.08210.99360.22070.03880.6537
Disclaimer/Publisher’s Note: The statements, opinions and data contained in all publications are solely those of the individual author(s) and contributor(s) and not of MDPI and/or the editor(s). MDPI and/or the editor(s) disclaim responsibility for any injury to people or property resulting from any ideas, methods, instructions or products referred to in the content.