Article

Effect of Al2O3 on the Structural Properties of Water-Quenched Copper Slag Related to Pozzolanic Activity

School of Resource and Safety Engineering, Central South University, Changsha 410083, China
*
Author to whom correspondence should be addressed.
Minerals 2023, 13(2), 174; https://doi.org/10.3390/min13020174
Submission received: 18 December 2022 / Revised: 15 January 2023 / Accepted: 20 January 2023 / Published: 25 January 2023
(This article belongs to the Section Mineral Processing and Extractive Metallurgy)

Abstract

:
Water-quenched copper slag (WCS) modified with alumina (Al2O3) has been proven as a cement substitute; however, the effect of Al2O3 on structural properties of WCS related to pozzolanic activity has not been well investigated. The structural properties and the pozzolanic activity of WCS with different amounts of Al2O3 are characterized by X-ray diffraction, differential scanning calorimetry, Fourier-transform infrared spectroscopy, X-ray photoelectron spectroscopy, and the uniaxial compressive strength test. The results show that only amorphous exists in copper slag, and the stability of amorphous first increases and then decreases with the increase in the alumina content. The addition of alumina significantly improves the pozzolanic activity of WCS at 7 and 28 days, but it has little effect on the pozzolanic activity of WCS when the slag’s curing age is 3 days. The results also show the increase in the non-bridging oxygen content, the decrease in the degree of polymerization, and the transition from Q2 and Q4 to Q3 with the increase of alumina content. Moreover, the addition of aluminum will convert Si-O-Si into Si-O-Al. These experimental results show that the addition of alumina can improve the pozzolanic activity of WCS, which can be used to partially replace cement.

1. Introduction

Environmental problems caused by a large amount of waste generated in the industrial production process are worrying. Copper slag is a solid waste and is generated during the smelting of copper [1]. According to relevant studies, 2.2 tons of copper slag are generated for each ton of copper during the smelting of copper, and 40 million tons of copper are produced every year [2]. At present, a large amount of copper slag is piled up on the land, occupying the land, and there is still the danger of heavy metal leaching [3,4,5].
Based on its formation process, copper slag can be divided into air-cooled copper slag and water-cooled copper slag [6]. Compared with air-cooled copper slag, more glassy phases and pores due to the fast cooling process in water-cooled copper slag, which enables it to exhibit pozzolanic activity [7]. Many experts have experimentally demonstrated the pozzolanic activity of copper slag and made attempts to use it as SCMs to reduce carbon dioxide emissions [8,9,10].
However, the lower pozzolanic activity of copper slag will reduce the strength of the mixed cement. S. R. Mirhosseini et al. [7] found through experiments that the strength of cement paste can be reduced by more than 25% at different ages with adding 30% copper slag. Maria C.G. Juenger’s study [9] and Y. Feng’s study [2] showed that the activity of copper slag was related to the degree of polymerization (DP) of the glass phase and amorphous content, and the lower the DP, the higher the activity. Therefore, the main principle of improving the pozzolanic activity of copper slag is to reduce the degree of polymerization and increase the amount of non-bridging oxygen (NBO) [2].
Compared with fly ash, copper slag contains a small amount of Al [4,11], which plays an important role in improving the pozzolanic reactivity of copper slag. Junwei Song’s research [4] showed that the role of alumina in the pozzolanic reaction was similar to that of SiO2, reacting with Ca(OH)2 to form C-S(A)-H gel. Leon Black et al. [12] proved through experiments that the addition of Al2O3 would form aluminosilicates, and at the same time, the silicate chains would be broken to form Si2O7 groups, which could reduce the DP of the glass phase. Dao lin Wang et al. [13] found that alumina could improve the pozzolanic reactivity of copper slag, and analyzed the reason in terms of hydration heat and reaction products. In addition, Zhang Bingyi et al. [14] modified copper slag by adding 10 wt.% of calcium oxide(CaO) and alumina(Al2O3), and mixed them with cement to prepare a blended cement paste. The results showed that calcium oxide and alumina could significantly improve the pozzolanic activity of copper slag, and the strength of the blended cement paste was improved for 28 days. However, this paper studied the combined effects of alumina and calcium oxide on the pozzolanic activity of copper slag, and did not study the effects of alumina or calcium oxide separately. All these studies show that alumina can improve the pozzolanic activity of copper slag; however, the effect of Al2O3 on structural properties of WCS related to pozzolanic activity has not been well investigated. Alumina is second only to silicon oxide in the Earth’s crust and has a variety of transition states and a heat stable state α-Al2O3, which is a rhomboid or hexagonal cell structure with stable chemical properties. At present, the main preparation method of alumina in the world is improved Bayer process [15]. Alumina is widely used in ceramics, abrasives, pigments, plastics, rubber, gems, cement, and other fields [16,17]. The aluminate cement made by bauxite (mainly alumina) and limestone has a fast hardening speed and high early strength, which also shows that Al2O3 may be used to improve the pozzolanic activity of copper slag.
Therefore, this study aims to study the effects of different content of alumina on pozzolanic activity of copper slag. In order to achieve this research objective, the method is to add alumina to the molten copper slag, and then quickly water cooling to obtain the water-quenched copper slag (WCS). Fourier-transform infrared spectroscopy (FTIR) and X-ray photoelectron spectroscopy (XPS) are used to detect the chemical structure of WCS with different contents of Al2O3. The strength activity index (SAI) is applied to evaluate the pozzolanic activity of WCS. X-ray diffraction (XRD) and differential scanning calorimetry (DSC) are used to evaluate the thermal stability of the amorphous state of the glass.

2. Materials and Methods

2.1. Preparation of WCS

The cement used was Portland cement (PC 42.5) produced by the Hunan Conch Cement Production Factory. The original copper slag (OCS) used in this study was from a copper smelter in China.
The original copper slag was divided into three groups, one group without Al2O3 and the other two groups mixed with 5% and 10% Al2O3. The production of WCS was completed in an induction furnace as shown in Figure 1 [1]. The copper slag without or with different alumina contents was placed in an alumina crucible and heated to a molten state by heat from an inductive coil. The induction furnace was filled with nitrogen to prevent air from entering the furnace. Then, each molten sample was taken out and quenched by a high-speed water jet to obtain granular WCS. The rapidly cooled granular copper slag was dried and ground with a vibrating ball mill for 1 h to make it into a powder for subsequent tests. The three groups of WCS were named as WCSA0, WCSA5, and WCSA10, respectively. The chemical composition of WCS was detected using X-ray fluorescence spectrometry (XRF, Bruker AXS, Karlsruhe, Germany) [18]. Table 1 lists the main chemical composition and physical characteristics of WCS and cement.

2.2. Characterization and Tests

The content of the amorphous state of the WCS was determined using XRD with Cu (40 kV, 40 mA) radiation. The analytical range was between 5° and 70° (2θ) at a rate of 1°/min. The thermal stability of the amorphous state of WCS was analyzed through a DSC experiment in which the samples were heated from room temperature (25 °C) to 1300 °C at a heating rate of 10 °C/min in an argon atmosphere.
According to relevant research and standards [14,19,20], three groups of WCS and cement were mixed at a WCS to cement ratio of 3:7 to prepare mixed cement, and the mixed cement was mixed with water to make cement paste with a water to cement ratio of 0.5. After thoroughly mixing the ingredients, the samples were mechanically stirred and then cast into a 4 cm × 4 cm × 4 cm mold. After 24 h, the mold was released and the samples were placed in a curing box for different numbers of days. The curing temperature was set at 20 °C and the humidity was 98%. To make it easier to release the molds, they were first brushed with oil [21]. According to the amount of alumina added in WCS, the three groups of blended cement pastes were named CSA0, CSA5, and CSA10. After curing for 3, 7, and 28 days, the uniaxial compressive strength (UCS) of the blended cement pastes were tested. The experiment was repeated thrice for each curing time, and the average value of the results was taken. The pozzolanic activity of WCS was described using the SAI, in accordance with Chinese national standard GB/T 12957-2005 [2,22]. The SAI is the ratio of the strength of the blended cement pastes to the strength of pure cement mortar of the same age in percentage.
The chemical structure of WCS was characterized by FTIR and XPS experiments. A Nicolet Nexus 470 spectrometer with a KBr wafer was used to render the FTIR spectrum in the wavenumber range between 400–1700 cm−1. The XPS measurements were conducted using a Thermo Fisher Scientific (Waltham, MA, USA) ESCALAB 250Xi spectrometer with an Al Ka X-ray source (1486.6 eV) [23,24,25].

3. Experimental Results and Analysist

3.1. Amorphous Thermal Stability Analysis

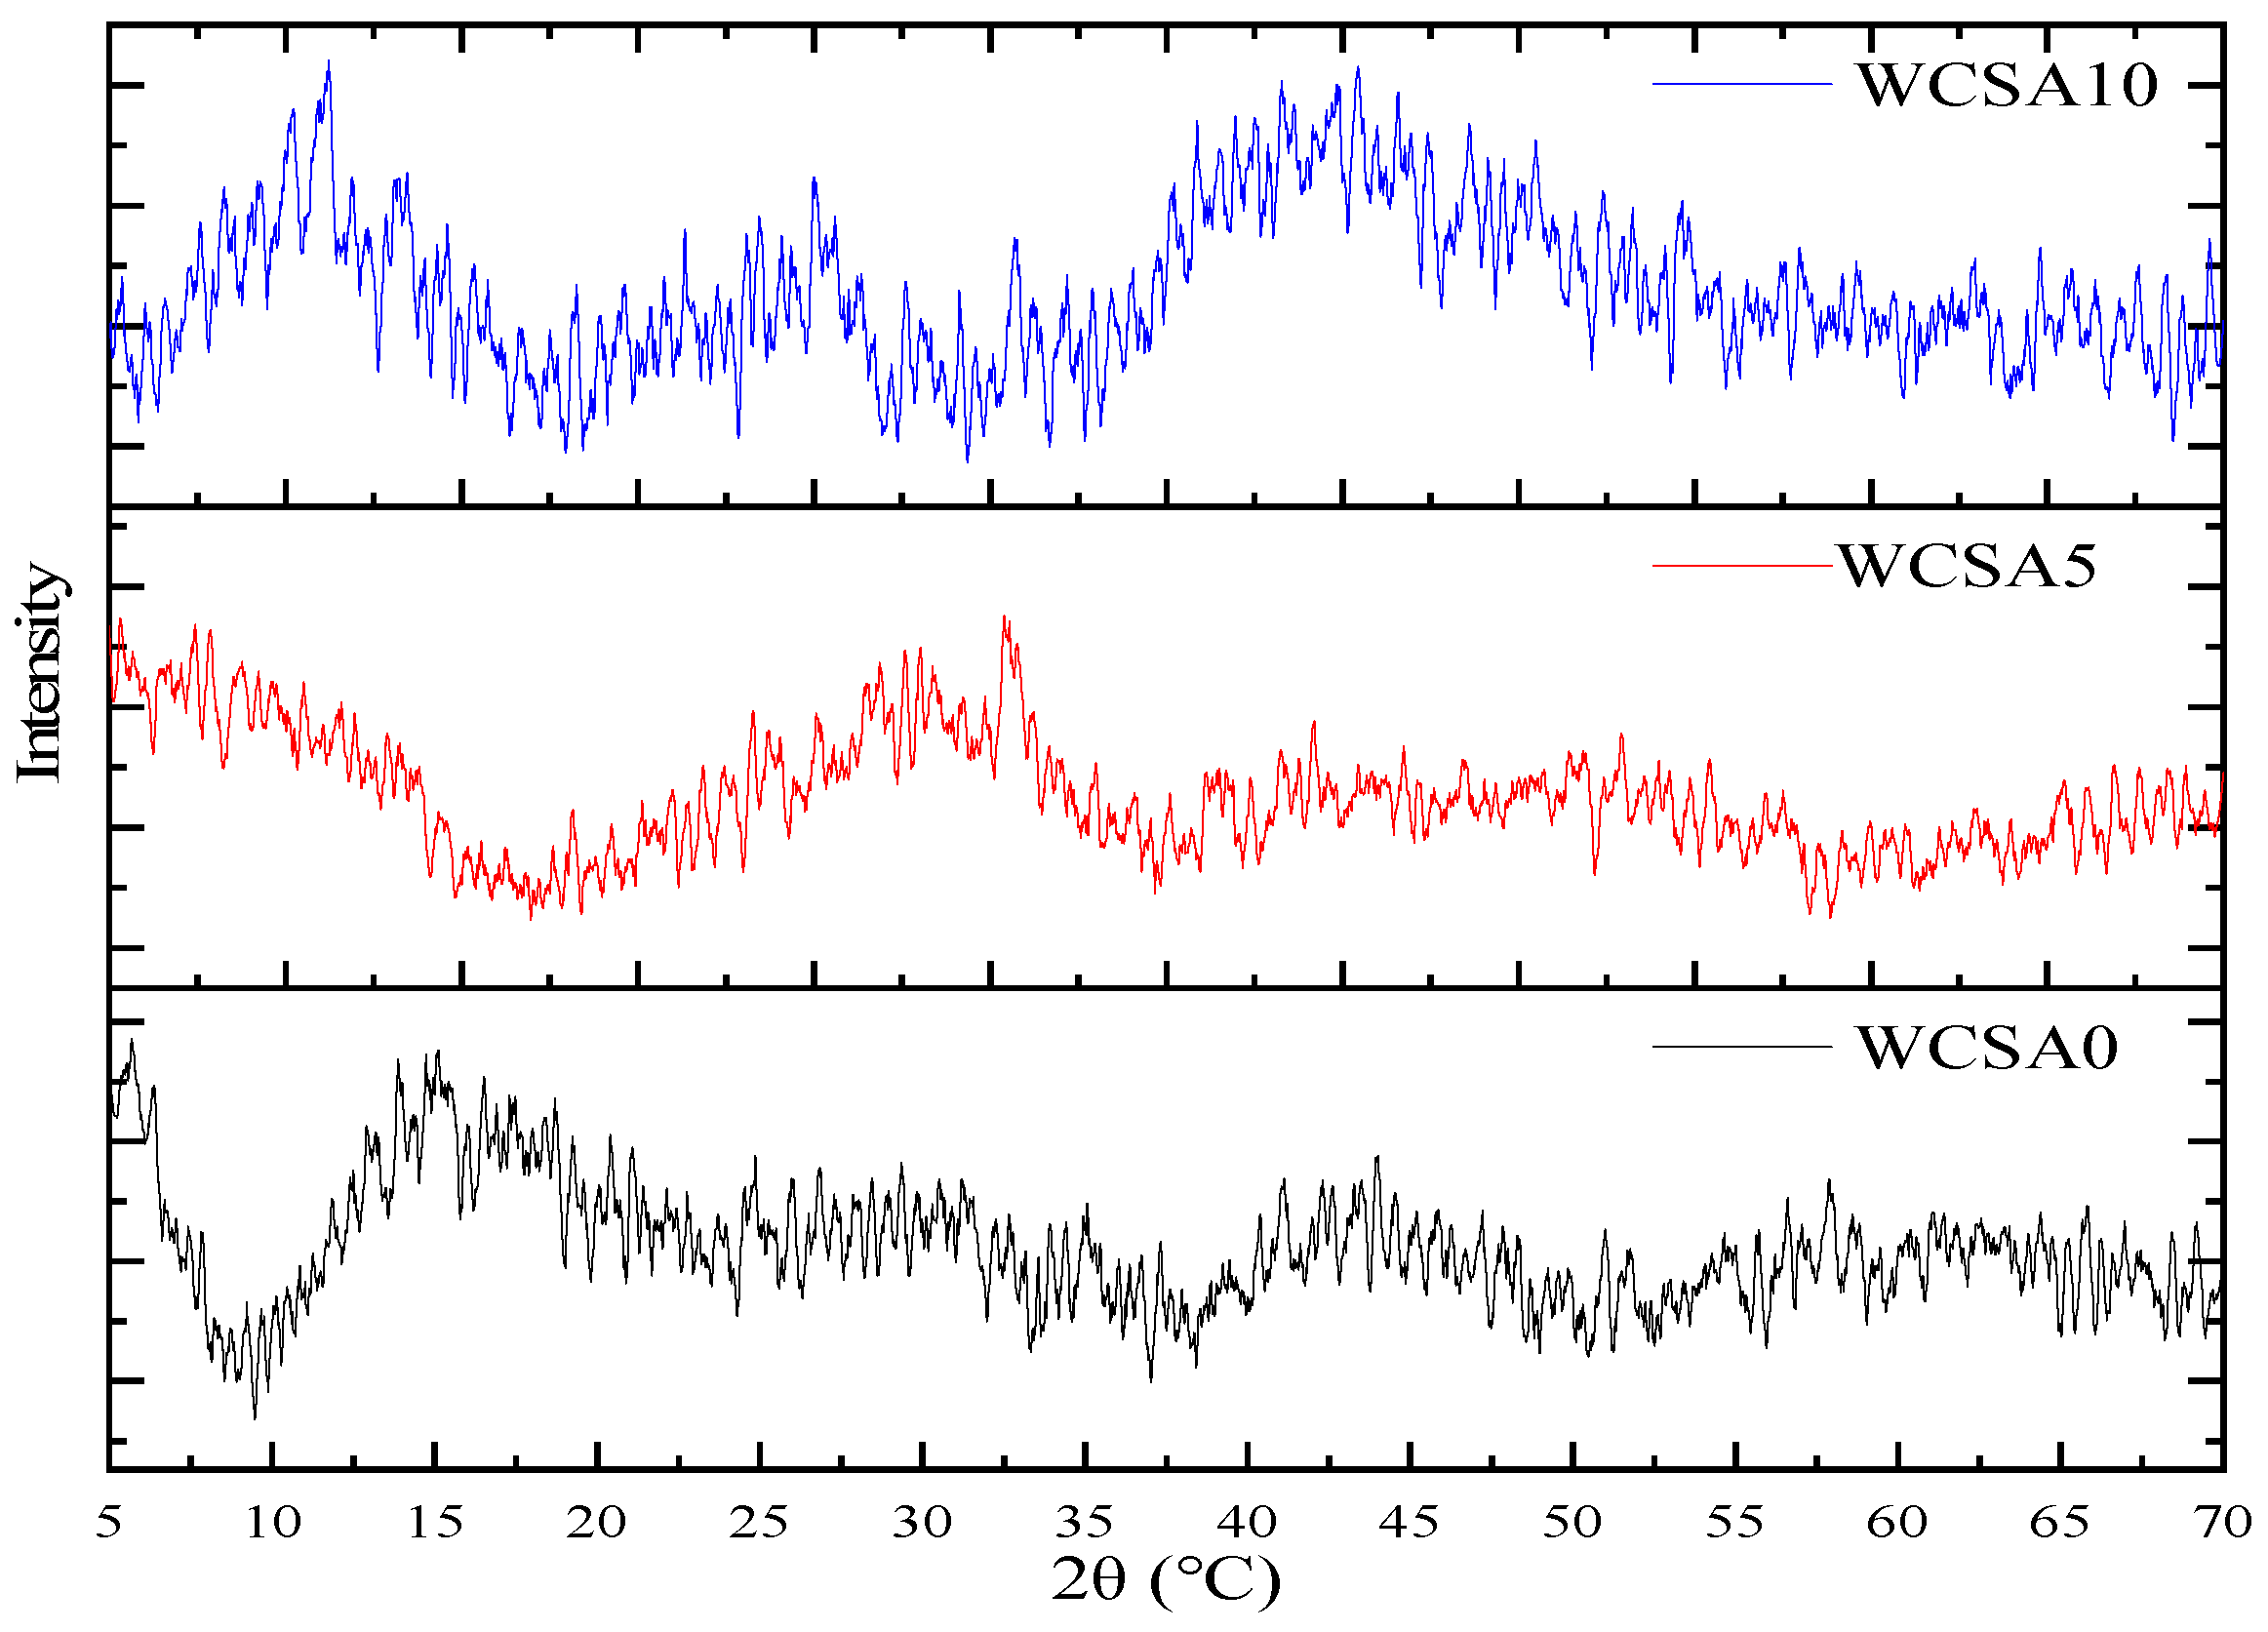
The XRD curves for WCS are depicted in Figure 2. There is no crystallization peak in the XRD, indicating that there were a lot of amorphous substances in WCS [1,26] and that the alumina content did not affect the content of the glass phase. The DSC curves recorded for the three groups of WCS are depicted in Figure 3. The glass transition temperature (Tg), the onset crystallization temperature (Tc), and the crystallization peak temperature (Tp) were obtained and analyzed from the DSC curves and the results are shown in Table 2. However, melting peaks do not appear in the DSC curves of the three samples. According to relevant research [27,28], the crystallization resistance of amorphous materials can be expressed by ΔT and S, and the higher the ΔT and S, the better the crystallization resistance. The formula of S and ΔT are as follows, and the results are shown in Table 2:
Δ T = T c T g
S = T p T c T c T g / T g
Interestingly, Table 2 illustrates that ΔT increased while S decreased with the increase in the alumina content. When the two values change differently, S shall prevail, because S is more sensitive and comprehensive [29]. Therefore, the crystallization resistance of WCS decreases when the content of Al2O3 increases from 0 to 5% according to the result of S. The crystallization process’s reaction enthalpy (ΔHc) is the area under the crystallization endothermic peak in the DSC curves [30], and the results are shown in Table 2. The higher the enthalpy, the lower the resistance to crystallization [31]. Therefore, the result of DSC illustrates that the amorphous stability of WCS first decreases and then increases with the increase of alumina content.

3.2. The Analysis of SAI and UCS of Blended Cement Paste

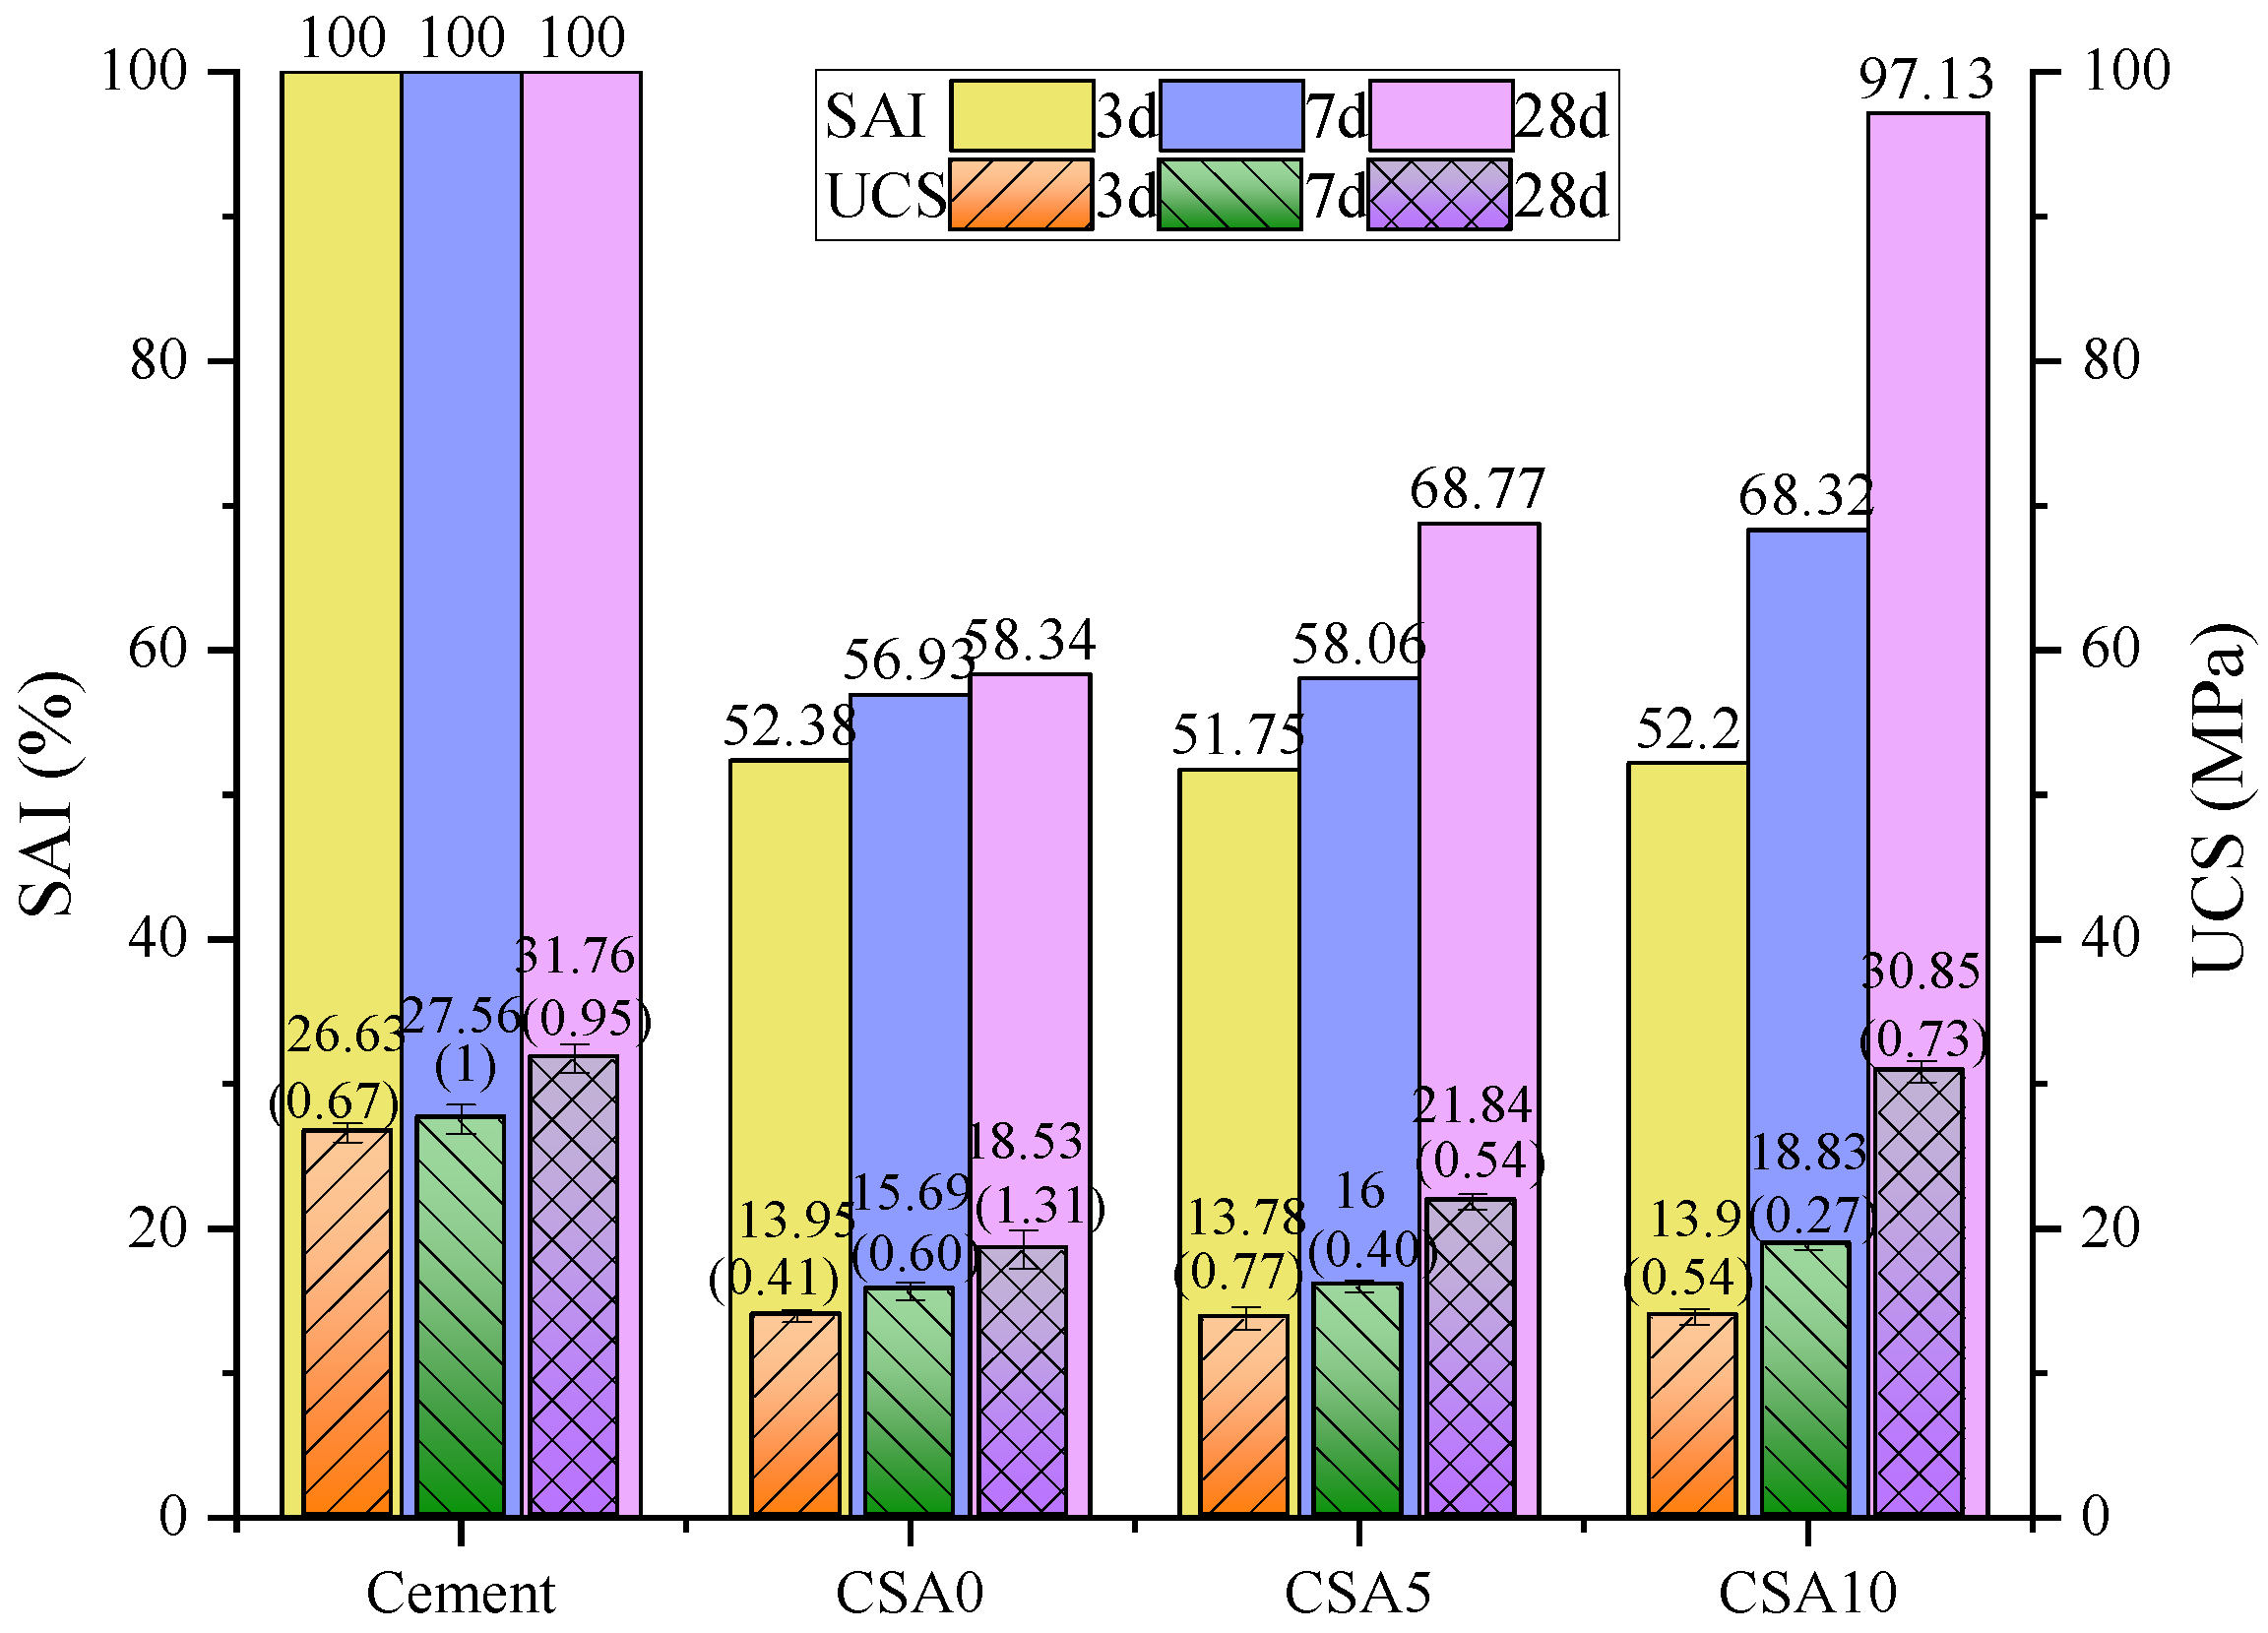
Figure 4 shows the results of the UCS and the SAI. SAI is affected by both curing time and alumina content. Under the same alumina concentration, the SAI and UCS values increase with increasing curing time. Under the same curing time, the effect of alumina on the UCS and SAI is related to alumina content. The alumina content has little effect on the SAI and the UCS after curing for 3 days. The SAI and UCS increase with increasing alumina content after curing for 7 and 28 days. It is noteworthy that the SAI of CSA10 after curing for 28 days reached 97%. The strength development rate of 3–7 days and 7–28 days increased with increasing Al2O3 content. The strength development rate at 7–28 days for CSA5 and CSA10 was greater than that of the cement pastes. This phenomenon is called “the retardation of strength development” [19].
This retardation effect can be explained by studying the process and feedstock of the pozzolanic activity. The pozzolanic reaction is the reaction of active SiO2 and active Al2O3 with Ca(OH)2 to form C-S-H or C-A-S-H. Copper slag has extremely low reactivity and can undergo pozzolanic reactions only after being activated [32]. In addition, OH can activate the pozzolanic reaction of copper slag [33]. Thus, at 3 days, the copper slag is not sufficiently activated by the alkaline environment, resulting in a lower pozzolanic reaction ability, and the strength development of blended cement pastes mainly depends on the hydration reaction of the cement [34]. This can help to explain why strength values of blended cement pastes with the different content of Al2O3 after curing for 3 days were almost the same. At the same time, the addition of copper slag reduces the cement content and dilutes the cement, therefore, the strength values of blended cement pastes are only half that of cement pastes.
The strength development rate of 0–3, 3–7 days, and 7–28 days in cement pastes are 8.88, 0.23, and 0.2 MPa/d respectively, which indicate that pozzolanic reaction is strong in the first three days and consumed more hydration reactants [19]. Moreover, Ca(OH)2 produced by cement hydration reaction is the raw material for copper slag pozzolanic reaction. In blended cement pastes, the strength on day 3 day is mainly from the cement hydration reaction, while the strength on days 7 and 28 is mainly from the pozzolanic reaction. The lower strength development rate of blended cement pastes in the curing period of 7–28 days is due to the earlier intense pozzolanic reaction consuming more reactants. In the same curing time, the higher the Al2O3 content in the copper slag in blended cement pastes, the higher the SAI value of blended cement pastes, which is due to Al2O3 acting as the active substance driving the pozzolanic reaction of the copper slag [14].

3.3. FTIR Spectroscopy

(1)
Changes in the chain structure
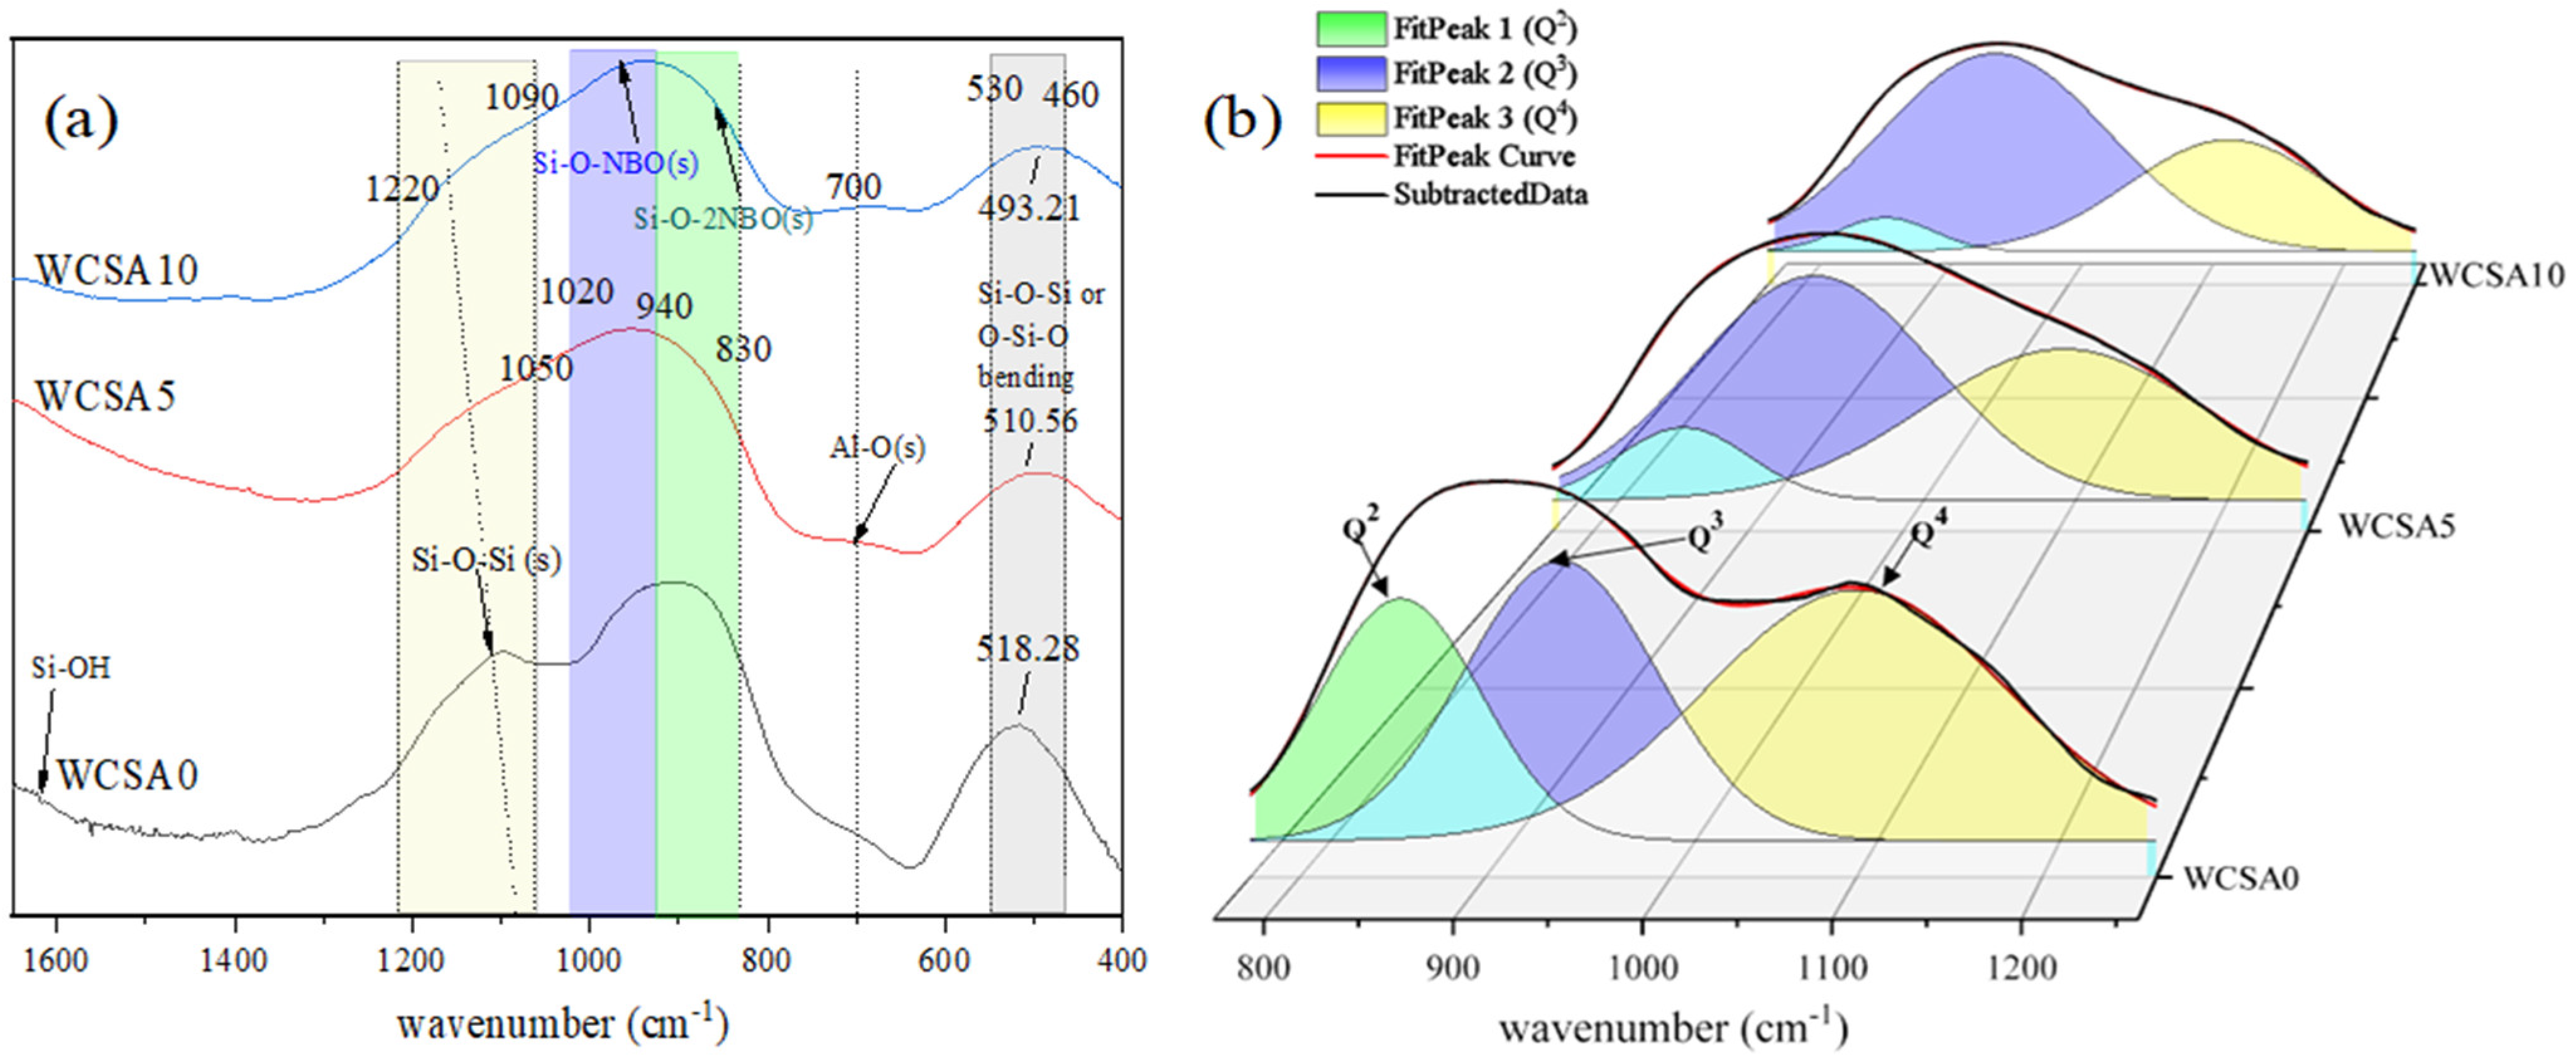
Figure 5a shows the FTIR spectra of the WCS samples WCSA0, WCSA5, and WCSA10 in the range of 400–1650 cm−1.
The peaks around the range of 450–1200 cm−1 reflect the influence of the Al2O3 on the amorphous structure of the amorphous silicate. The peaks at about 500 cm−1 assigned to the bending vibration of Si-O-Si or O-Si-O move to lower wavenumbers, indicating that the DP of the silicate network goes down, which increases the pozzolanic activity of the copper slag and UCS of blended cement pastes [35,36]. The peak at 700 cm−1 assigned to the stretching vibration of the Al-O bond in the AlO4 tetrahedron means that the added Al is embedded in the network structure and would generate C-A-S-H in blended cement pastes, which increases the strength of blended cement pastes [37,38].
With the increase in the Al2O3 content, the absorption peaks at around 940 cm−1 for WCSA0 move to a higher wavenumber direction. There is an absorption peak at around 1095 cm−1 assigned to the asymmetrical stretching vibration of Si-O-T (T = Si, Al) on the spectrum of WCSA0, which can represent the DP of the material to a certain extent [39,40]. From Figure 5a, the intensity of the absorption peak assigned to the Si-O-Si bond in the FTIR spectra is weakened when the Al2O3 content increases to 10%. This can be explained by the properties of Al that it can replace the Si ion in a SiO4 tetrahedron to form AlO4, which can then convert Si-O-Si to Si-O-Al. The weak absorption peak at 1635cm−1 is assigned to the bending vibration of O-H from the bound water in the copper slag due to the drying of the test sample [39]. The XRF experiment of the original copper slag shows that the copper slag contains a large number of ferrous ions, which act as a network former in a glass structure [2]. Fe2+ acts as a former in the silicate network, but it is worth noting that there is no vibration absorption peak of FeO4 units around 560 cm−1 in the FTIR [37].
(2)
The changes in the percent of Qn
Deconvolution of the peaks in FTIR is needed to analyze the influence of the addition of Al2O3 on the DP of the copper slag since the FTIR spectrum often has multiple overlapping peaks [37]. The DP is denoted by Qn, where n is the bridging oxygen (BO) number of each tetrahedral cation. The broad bands of 773–1250 cm−1 in the fingerprint region were deconvoluted by the Gaussian peak fit method [35] and the results are shown in Figure 5b. All the fitting peaks are characterized by the center (C) and relative area (A). The centers and the relative areas of the fitting peaks are shown in Table 3. The spectral deconvolution in the range of 773–1250 cm−1 shows high goodness of fit with three component bands, and the R2 of all the deconvolution graphs is over 0.999. The obtained three deconvoluted bands are distributed in 1100.0–1120.3 cm−1, 940.6–944.1 cm−1, and 854.4–861.8 cm−1, corresponding to the asymmetric stretching vibration of the Si-O-Si bond in the Q4 structural, asymmetric stretching vibration of Si-O-(NBO) in Q3, and Si-O(BO)-Si asymmetric stretching vibration in Q2, respectively [2,27,35,41]. The shift of these peaks to higher frequency region indicates an enhanced glass structure [27,42].
With the increase in the Al2O3 content, the three absorption peaks show obvious monotonic changes. The Q3 structure concentration presents an increasing trend while the Q2 and Q4 structure concentrations presents a decreasing trend, which shows that with the addition of Al2O3, the number of NBO increases. The change in Q2, Q3, and Q4 suggests that Q3 increases at the expense of Q2 and Q4, indicating that the DP of the silicate decreased and the pozzolanic activity of WCS increases.

3.4. XPS Result

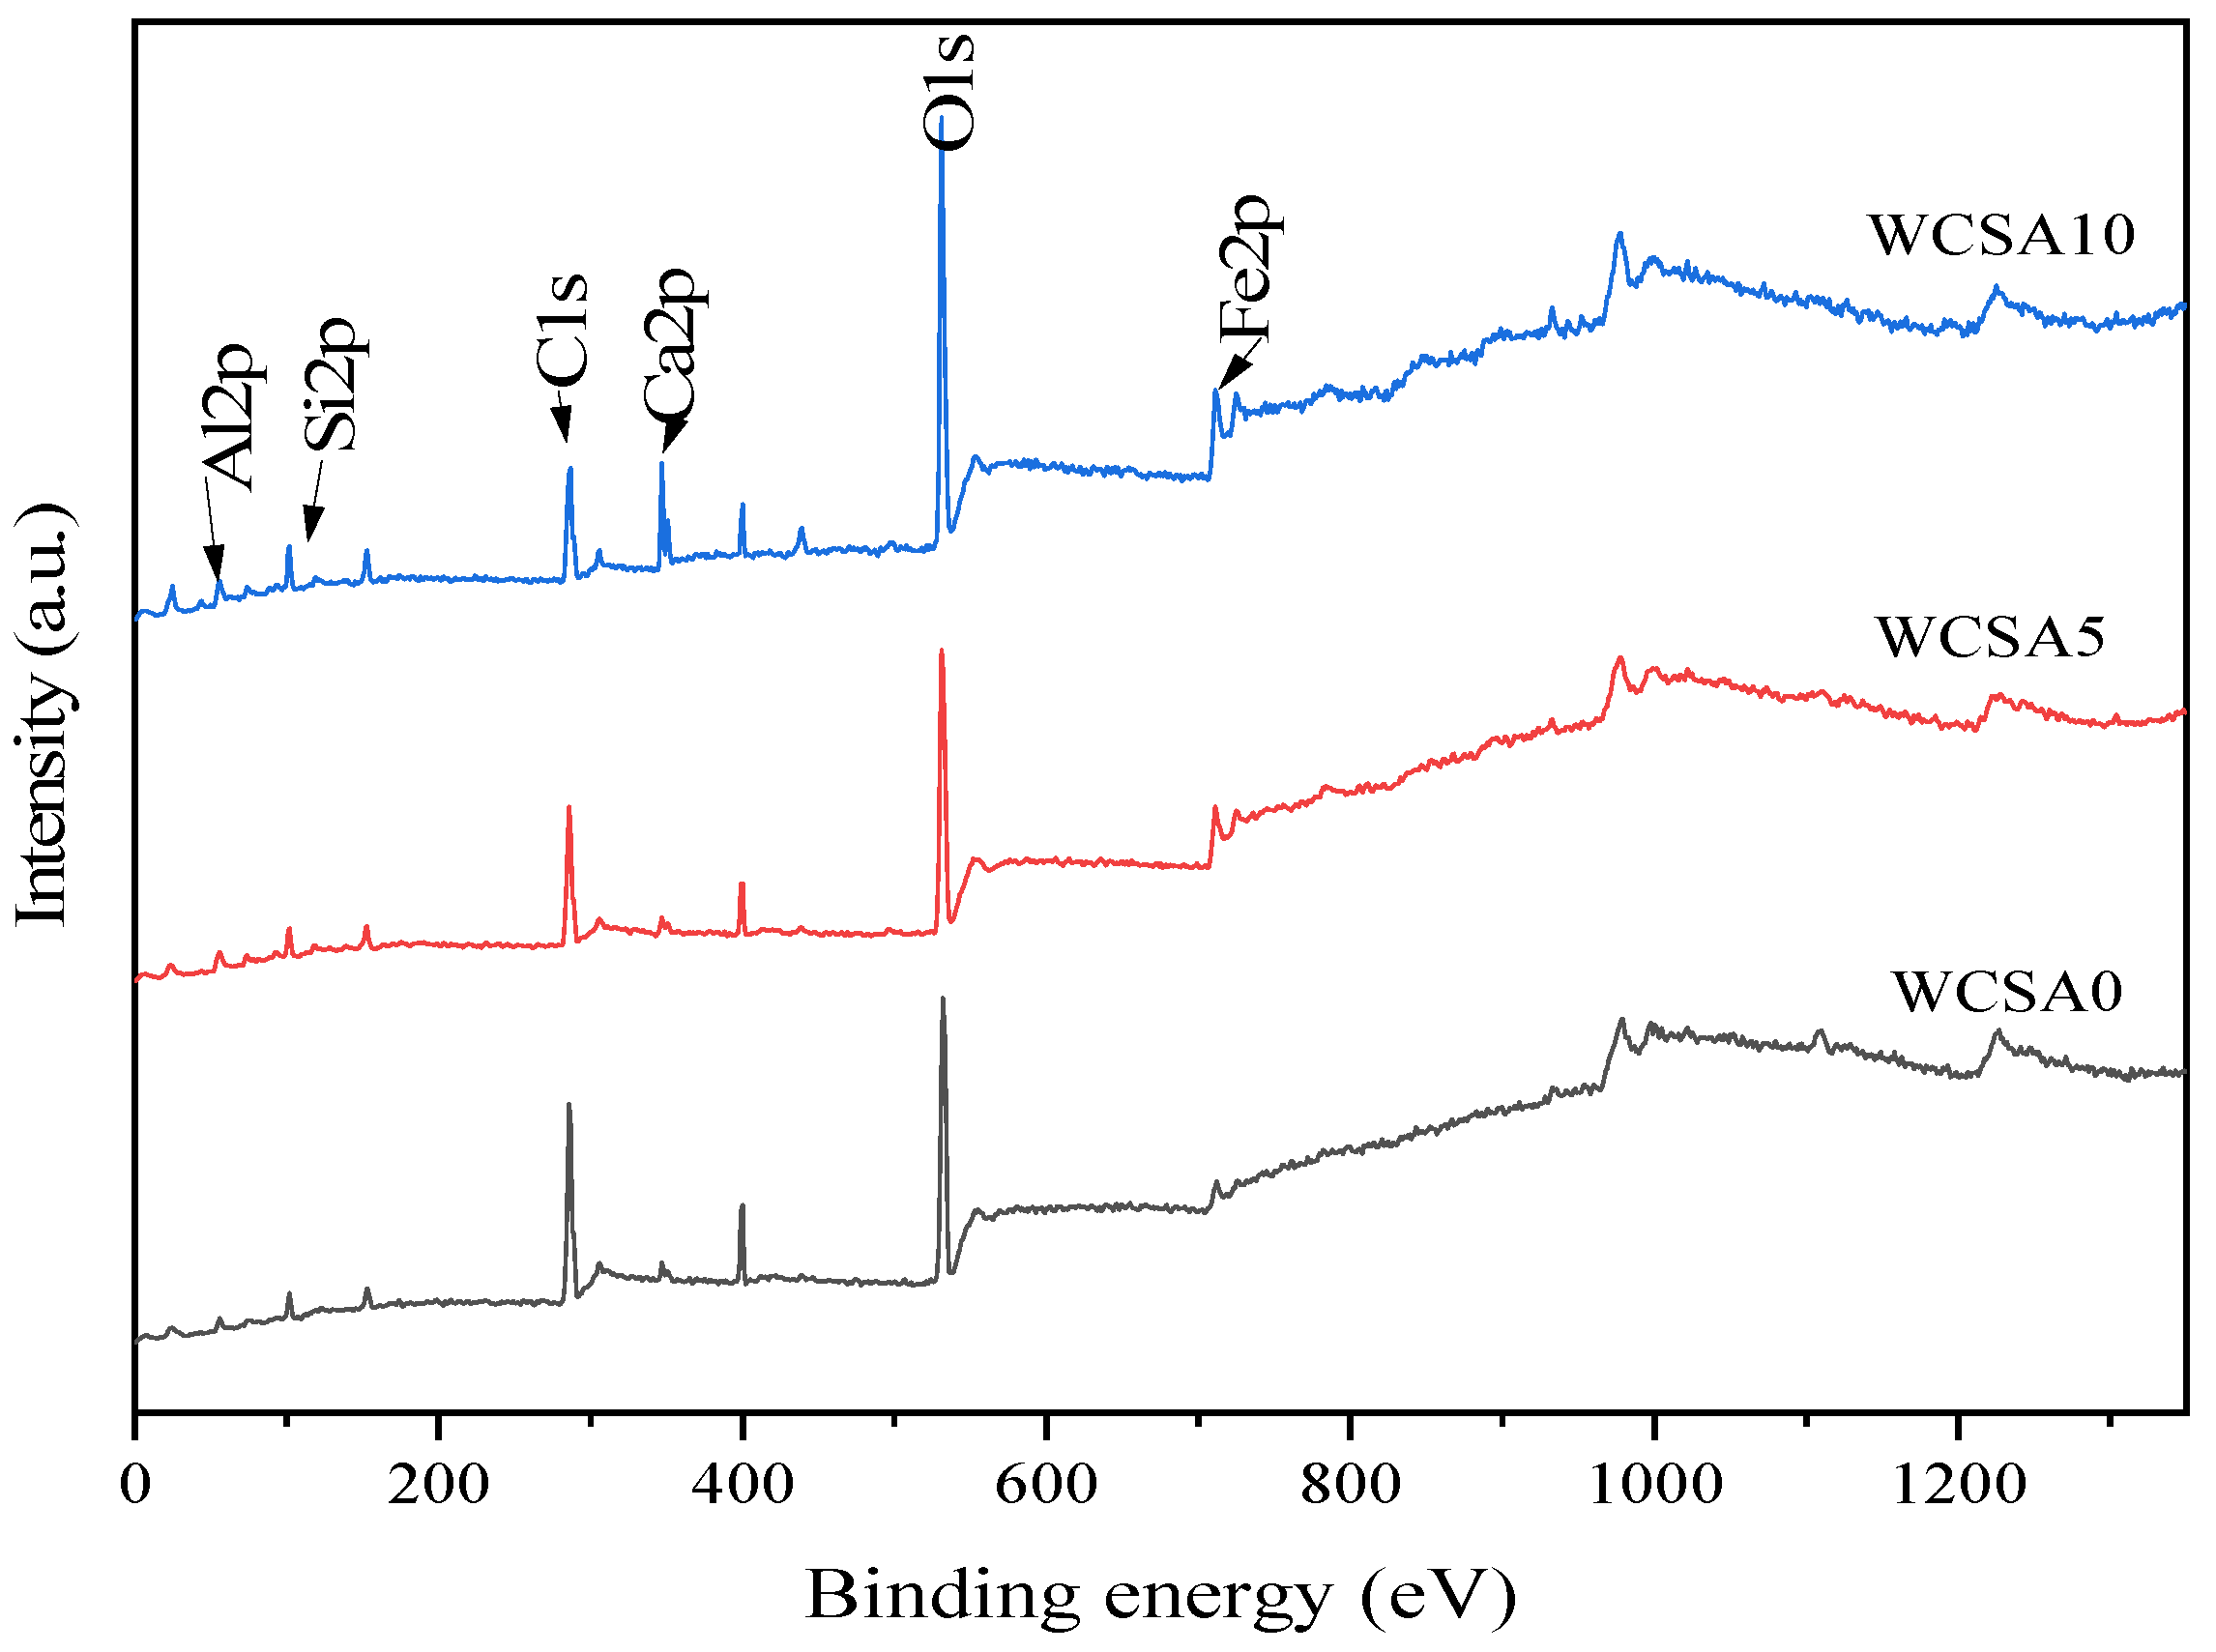
The XPS measurement spectrum of WCS containing different amounts of Al2O3 is shown in Figure 6. The Al2p, Ca2p, Fe2p, O1s, and Si2p spectra of WCS were recorded to obtain the elemental and chemical structure information of the slag. The peak of C1s appears near 284.6 eV. To correct the sample charging, the peak of C1s was used for binding energy calibration by setting its binding energy at 285 eV for the adsorption of hydrocarbon pollutants [2,43].

3.4.1. Fe2p

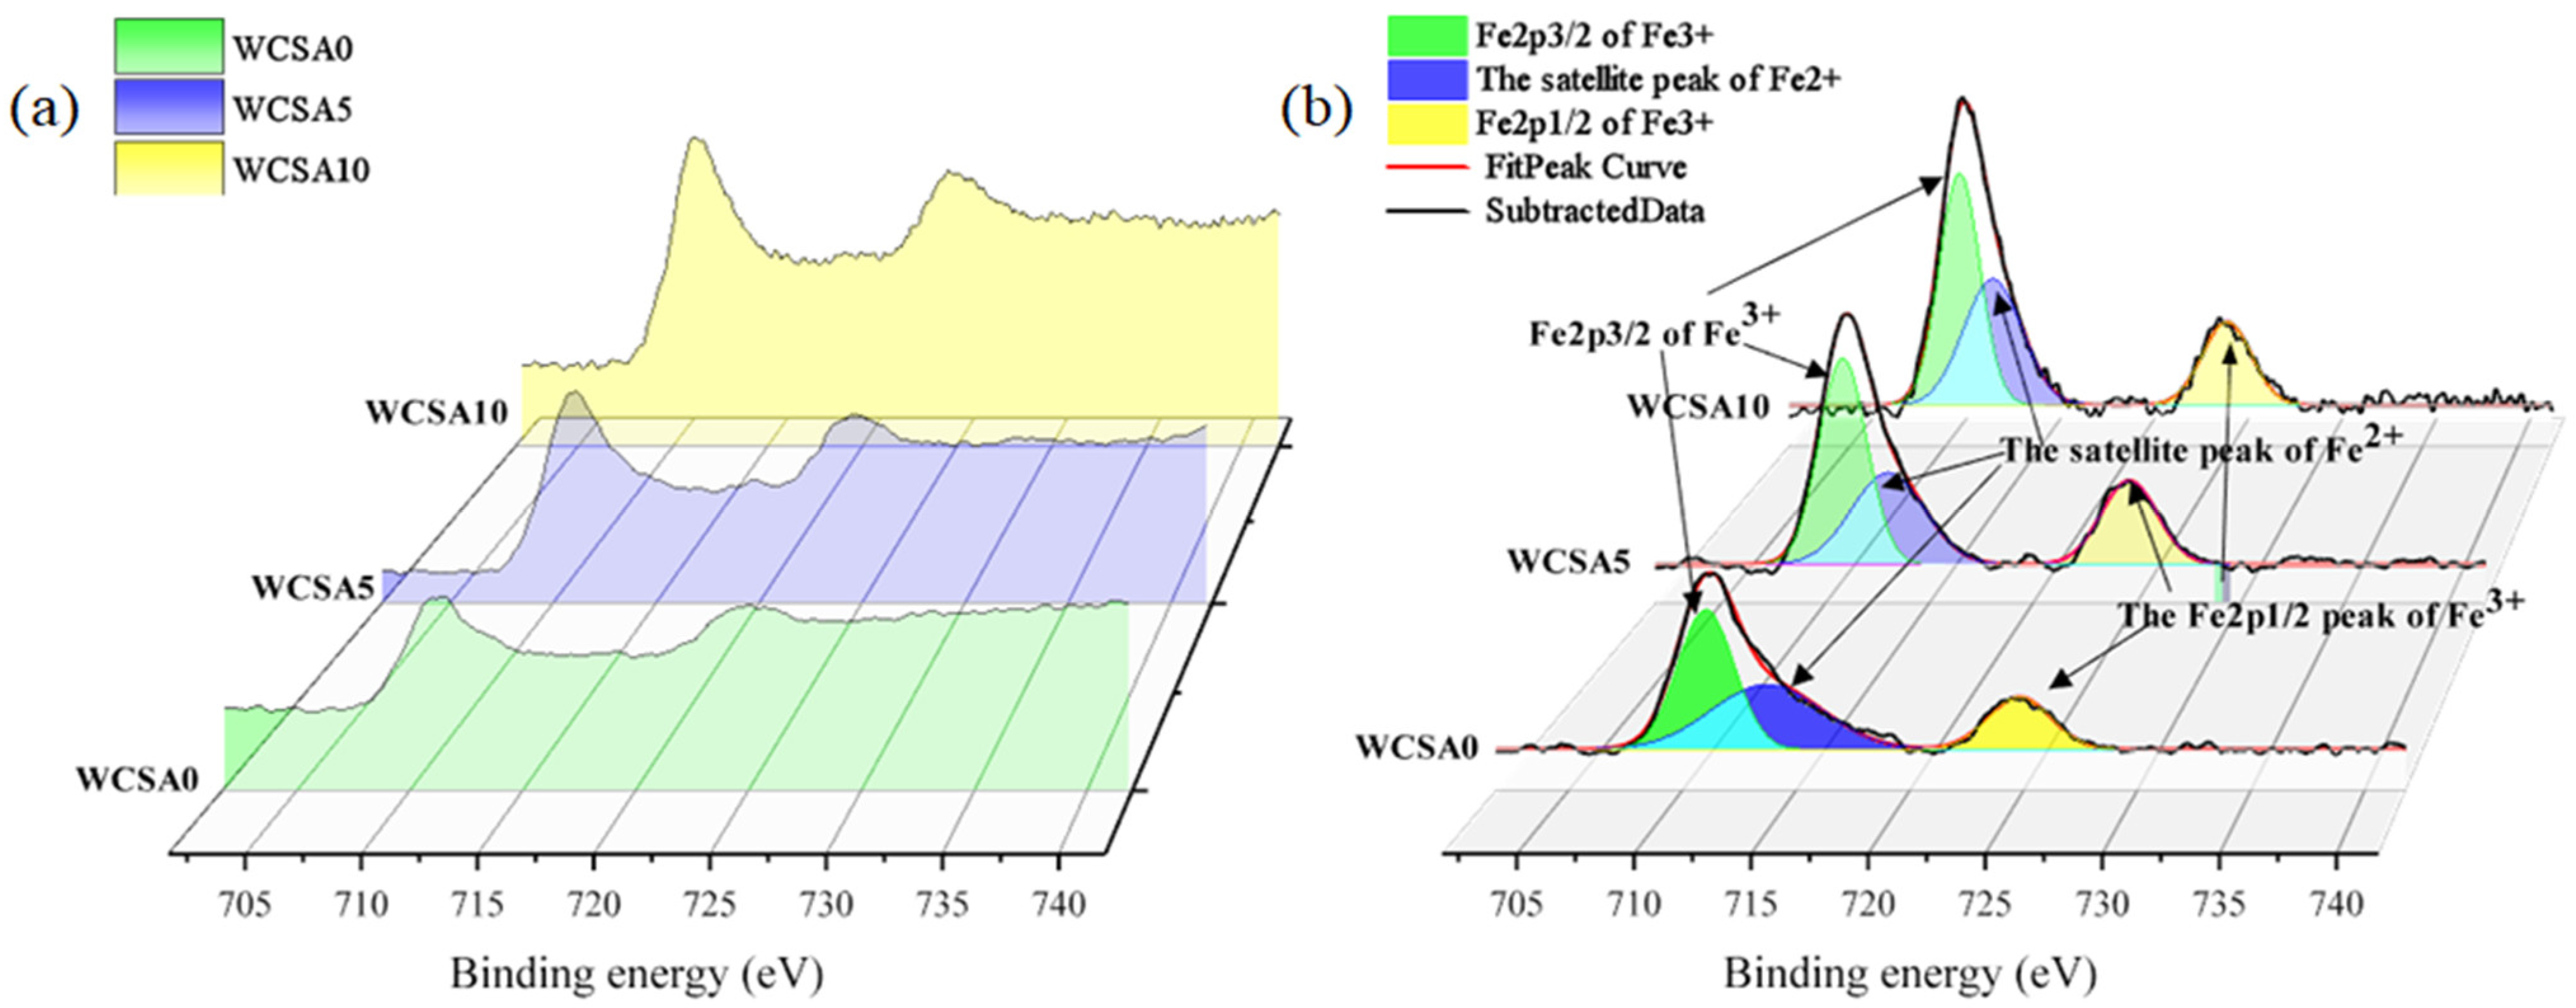
Figure 7a shows the Fe2p spectra. The Fe2p spectra of each sample with different contents of Al2O3 consist of two peaks, located near 710 and 724 eV, respectively. Meanwhile, the peaks around 710 eV overlap. Hence, deconvolution using Gaussian peak fitting of the Fe2p spectrum was conducted to analyze the change in the chemical environment of Fe, and the determination coefficients (R2) were all greater than 0.992. Figure 7b and Table 4 show the Fe2p deconvolved peaks and the parameters of the fitting results, respectively. Each sample shows three fitted peaks, located at around 711, 713, and 724 eV, which are assigned to the Fe2p3/2 peak of Fe3+, the satellite peak of Fe2+, and the Fe2p1/2 peak of Fe3+, respectively [44,45]. Because the Fe2p1/2 and Fe2p3/2 peaks of Fe2+ were not detected, Fe mainly exists in the silicate network as Fe3+, and the content of Fe2+ is very little. It can be seen from Table 1 that there is less Fe2O3 and more FeO component in WCS, indicating that Fe2+ is oxidized into Fe3+ and Fe acts as a network modifier in the silicate network [2,46].

3.4.2. O1s

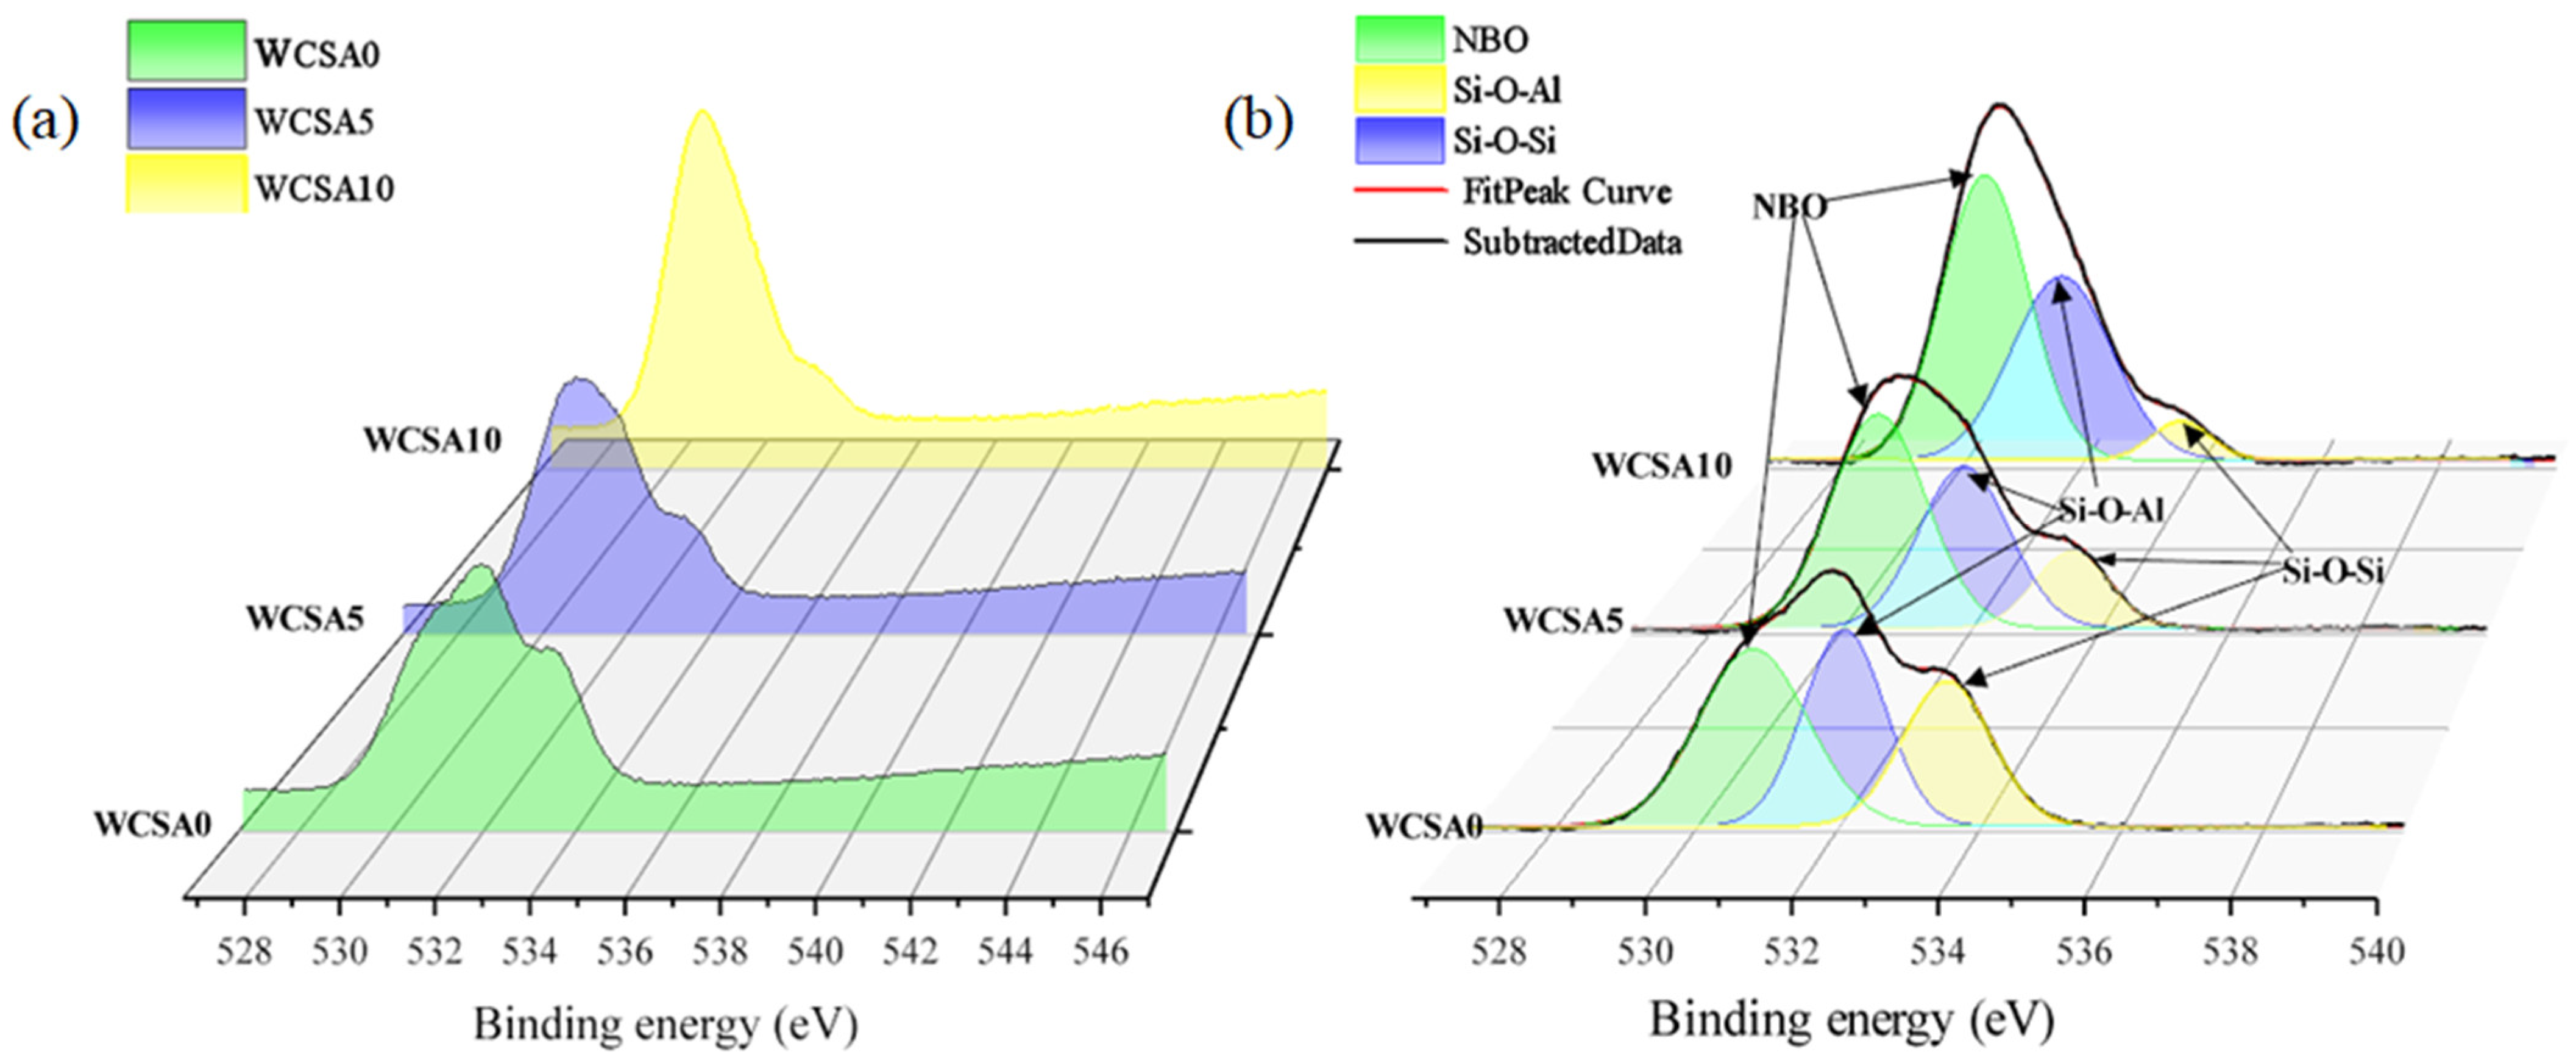
Figure 8a shows the O1s spectrum of WCS containing different amounts of Al2O3. When the content of Al2O3 increases, the peak becomes sharper, and the binding energy moves to a lower binding energy value, which is related to the chemical bond states of oxide atoms. Three overlapping peaks appear in the range of 527–538 eV. Thus, deconvolution and fitting of the O1s spectrum are necessary to analyze the different bonding states of the oxide ions. Figure 8b shows the curve fitting of the O1s photoelectron spectrum and all the fitted peaks are characterized by the center (C), full width at half maxima (FWHM), and relative area (A) as shown in Table 5. Because the sample production process cannot completely isolate the air, the samples will be carbonized to produce the peak of C1s.
According to Figure 8b and Table 5, the O1s spectrum of the samples with different contents of Al2O3 has three fitting peaks located at about 530.82–530.42 eV, 532.11–531.71 eV, and 533.56–533.71 eV, respectively. Oxygen atoms exist in three main forms: non-bridging oxygen, Si-O-Si, and Si-O-Al. According to relevant studies [35,47], the binding energy of bridging oxygen is higher than that of NBO. According to Bollinder’s electronegativity theory, the binding energy of the oxygen atoms in Si-O-Si is greater than that in Si-O-Al [48,49]. Therefore, it can determine that the peaks at about 530.82–530.42 eV, 532.11–531.71 eV, and 533.56–533.71 eV are assigned to NBO, Si-O-Al, and Si-O-Si, respectively.
With the increase in Al2O3 content, the binding energy of the NBO and the binding energy of the Si-O-Al decreases, from 530.82 eV and 532.11 eV of WCSA0 to 530.41 eV and 531.71 eV of WCSA10, respectively. However, the binding energy of Si-O-Si increases with increasing Al2O3 content. The difference between the binding energy of Si-O-Si and the NBO (BESi-O-Si-BENBO) increased with the increase in the Al2O3 content, indicating that the concentration or the field strength of alkali metal ions (Ca2+, Fe3+, Mg2+, etc.) decreased [35,47] and that more alkali ions were fixed to the aluminosilicate network to form Si-O-Me and Al-O-Me (Me = Ca2+, Fe3+, Mg2+, etc.) with NBO. This can be explained by the fact that the aluminum oxygen tetrahedron has one more negative charge than the silicon oxygen tetrahedron. At the same time, the concentration of Si-O-Al increases while that of Si-O-Si decreases with increasing alumina content. This trend is due to the substitution of aluminum for silicon in the silicon-oxygen tetrahedron to form Si-O-Al. The increase in the concentration of NBO indicates that Al2O3 will increase the depolymerization degree of the silicate network, which is conducive to improving the pozzolanic activity of copper slag [1].

3.4.3. Si2p

Figure 9 is the Si2p spectrum, which illustrates that only one peak located at 101 eV appears in the binding energy curve of Si2p. The center of the peak moves to a lower binding energy while the FWHM increases with increasing alumina content as show in Table 6. The theory of electronegativity can explain the decrease in the binding energy of Si. The electronegativity of Si is greater than that of aluminum and alkali metal ions. When the Si-O-Si bonds are transformed into Si-O-Al and Si-O-Me (Me being an alkali metal), more electrons move towards the Si atoms from the oxygen atoms. Then, the increase in the electron cloud density around the silicon atom increases the shielding effect of the core electrons, which reduces the measured binding energy [27,43]. Further, the decrease in the binding energy illustrates the reduction in the DP and the increase in the amount of NBO with the increase in Al2O3 content, which is consistent with the change in the FTIR spectra and the O1s spectra and improve the pozzolanic activity of copper slag [12,43]. The addition of Al leads to an increase in the FWHM of Si2p, which indicates that the silicate network becomes more disordered, and new chemical bonds are formed [12,50].

4. Conclusions

This study investigates the effect of alumina on WCS. The uniaxial compressive strength experiments and SAI are used to evaluate the pozzolanic activity of WCS. FTIR, XPS, XRD, and DSC are used to study the structural changes of the copper slag. The conclusions can be summarized as follows:
(1)
The results of the XRD and DSC experiments illustrate that the WCS contained an abundant glass phase. In the DSC heating curve, the changes in the thermal stability parameter S and the enthalpy (ΔHc) show that the effect of alumina content on the thermal stability of the glass phase in the copper slag first decreases and then increases.
(2)
The uniaxial compressive test and SAI results show that the influence of Al2O3 content on the uniaxial compressive strength and the strength activity index (SAI) of blended cement pastes is related to the curing age. When the age is 3 days, the alumina’s addition hardly affects the pastes’ strength. When the age is 7 and 28 days, the uniaxial compressive strength and SAI of blended cement pastes are proportional to the Al2O3 content, and the strength growth of blended cement pastes showed a “the retardation of strength development”.
(3)
The FTIR spectrum showed that Q3 increases at the expense of Q2 and Q4 with the increase in the Al2O3 content. The O-Si-O or Si-O-Si bending vibration frequency moved to a low frequency and the number of Q4 decreased, indicating that the DP of the silicate network decreased with the increase in the Al2O3 content. The presence of the Al-O peak indicates that Al exists in the form of aluminum oxide tetrahedrons. The aluminum oxide tetrahedron replaces the silicon-oxygen tetrahedron in the silicate network to form aluminosilicate. It should be noted that, the results were obtained using FTIR, which may be more accurate using Raman spectroscopy.
(4)
The results of the XPS experiment show that aluminum-oxygen tetrahedrons substitute the silicon-oxygen tetrahedrons in the silicate network to form aluminosilicate. The addition of aluminum reduces the DP of the silicate network and enhances the pozzolanic activity of WCS. Fe act as a modifier in the silicate network.
(5)
This study shows that WCS can partially replace cement and reduce the amount of cement. In order to further study the effect of alumina, the different hydration products of blended cement pastes with different alumina contents will be investigated in follow-up research.

Author Contributions

Conceptualization, Y.F. and Q.Z.; methodology, D.W., Q.C., and Y.F.; writing—original draft preparation, D.W. and D.D.; writing—reviewing and editing, D.D., Y.F., and B.L.; funding acquisition, Q.Z. and Y.F. All authors have read and agreed to the published version of the manuscript.

Funding

This research was supported by the National Natural Science Foundations of China (No. 52204166, No. 52104156, No. 52074351, and No. 52004330), and the State Key Laboratory of Safety and Health for Metal Mines (2021-JSKSSYS-05).

Data Availability Statement

All data in this paper are obtained from our experiments and are authentic and reliable. All authors consented to the publication of the data.

Conflicts of Interest

The authors declare no conflict of interest.

References

  1. Chen, Q.; Tao, Y.; Feng, Y.; Zhang, Q.; Liu, Y. Utilization of modified copper slag activated by Na2SO4 and CaO for unclassified lead/zinc mine tailings based cemented paste backfill. J. Environ. Manag. 2021, 290, 112608. [Google Scholar] [CrossRef] [PubMed]
  2. Feng, Y.; Chen, Q.; Zhou, Y.; Yang, Q.; Zhang, Q.; Jiang, L.; Guo, H. Modification of glass structure via CaO addition in granulated copper slag to enhance its pozzolanic activity. Constr. Build. Mater. 2020, 240, 117970. [Google Scholar] [CrossRef]
  3. Kierczak, J.; Potysz, A.; Pietranik, A.; Tyszka, R.; Modelska, M.; Néel, C.; Ettler, V.; Mihaljevič, M. Environmental impact of the historical Cu smelting in the Rudawy Janowickie Mountains (south-western Poland). J. Geochem. Explor. 2013, 124, 183–194. [Google Scholar] [CrossRef]
  4. Song, J.; Feng, S.; Xiong, R.; Ouyang, Y.; Zeng, Q.; Zhu, J.; Zhang, C. Mechanical properties, pozzolanic activity and volume stability of copper slag-filled cementitious materials. Mater. Sci. Medzg. 2020, 26, 218–224. [Google Scholar] [CrossRef] [Green Version]
  5. Jiao, H.; Chen, W.; Wu, A.; Yu, Y.; Ruan, Z.; Honaker, R.; Chen, X.; Yu, J. Flocculated unclassified tailings settling efficiency improvement by particle collision optimization in the feedwell. Int. J. Miner. Metall. Mater. 2022, 29, 2126–2135. [Google Scholar] [CrossRef]
  6. Nazer, A.; Payá, J.; Borrachero, M.V.; Monzó, J. Use of ancient copper slags in Portland cement and alkali activated cement matrices. J. Environ. Manag. 2016, 167, 115–123. [Google Scholar] [CrossRef]
  7. Mirhosseini, S.R.; Fadaee, M.; Tabatabaei, R.; Fadaee, M.J. Mechanical properties of concrete with Sarcheshmeh mineral complex copper slag as a part of cementitious materials. Constr. Build. Mater. 2017, 134, 44–49. [Google Scholar] [CrossRef]
  8. He, R.X.; Zhang, S.Y.; Zhang, X.L.; Zhang, Z.H.; Zhao, Y.L.; Ding, H.X. Copper slag: The leaching behavior of heavy metals and its applicability as a supplementary cementitious material. J. Environ. Chem. Eng. 2021, 9, 105132. [Google Scholar] [CrossRef]
  9. Juenger, M.C.G.; Siddique, R. Recent advances in understanding the role of supplementary cementitious materials in concrete. Cem. Concr. Res. 2015, 78, 71–80. [Google Scholar] [CrossRef]
  10. Feng, Y.; Yang, Q.; Chen, Q.; Kero, J.; Andersson, A.; Ahmed, H.; Engström, F.; Samuelsson, C. Characterization and evaluation of the pozzolanic activity of granulated copper slag modified with CaO. J. Clean. Prod. 2019, 232, 1112–1120. [Google Scholar] [CrossRef]
  11. Dhengare, S.; Sharma, R.L.; Sobti, J.; Gajbhiye, A.R.; Bhagat, R. Binary concrete expansion by means of copper slag, fly ash, sugarcane bagasse ash, and rice husk ash as partial replacement of cement. Int. J. Adv. Sci. Technol. 2020, 29, 9973–9993. [Google Scholar]
  12. Black, L.; Stumm, A.; Garbev, K.; Stemmermann, P.; Hallam, K.R.; Allen, G.C. X-ray photoelectron spectroscopy of aluminium-substituted tobermorite. Cem. Concr. Res. 2005, 35, 51–55. [Google Scholar] [CrossRef]
  13. Wang, D.; Zhang, Q.; Feng, Y.; Chen, Q.; Xiao, C.; Li, H.; Xiang, Y.; Qi, C. Hydration and mechanical properties of blended cement with copper slag pretreated by thermochemical modification. Materials 2022, 15, 3477. [Google Scholar] [CrossRef] [PubMed]
  14. Zhang, Q.; Zhang, B.; Feng, Y.; Qi, C.; Chen, Q.; Xiao, C. Hydration development of blended cement paste with granulated copper slag modified with CaO and Al2O3. J. Mater. Res. Technol. 2022, 18, 909–920. [Google Scholar] [CrossRef]
  15. Erdemoğlu, M.; Birinci, M.; Uysal, T. Alumina Production from Clay Minerals: Current Reviews. J. Polytech. 2018, 21, 387–396. [Google Scholar] [CrossRef] [Green Version]
  16. Kashcheev, I.D.; Zemlyanoi, K.G.; Stepanova, K.O. Acidic Methods of Alumina Production (Review). Refract. Ind. Ceram. 2019, 60, 237–242. [Google Scholar] [CrossRef]
  17. Klym, H.; Karbovnyk, I.; Piskunov, S.; Popov, A.I. Positron Annihilation Lifetime Spectroscopy Insight on Free Volume Conversion of Nanostructured MgAl2O4 Ceramics. Nanomaterials 2021, 11, 3373. [Google Scholar] [CrossRef]
  18. Bechar, S.; Zerrouki, D. Effect of natural pozzolan on the fresh and hardened cement slurry properties for cementing oil well. World J. Eng. 2018, 15, 513–519. [Google Scholar] [CrossRef]
  19. Feng, Y.; Kero, J.; Yang, Q.; Chen, Q.; Engström, F.; Samuelsson, C.; Qi, C. Mechanical activation of granulated copper slag and its influence on hydration heat and compressive strength of blended cement. Materials 2019, 12, 772. [Google Scholar] [CrossRef] [Green Version]
  20. de Rojas, M.I.S.; Rivera, J.; Frías, M.; Marín, F. Use of recycled copper slag for blended cements. J. Chem. Technol. Biotechnol. 2008, 83, 209–217. [Google Scholar] [CrossRef]
  21. Mucsi, G.; Kumar, S.; Csőke, B.; Kumar, R.; Molnár, Z.; Rácz, Á.; Mádai, F.; Debreczeni, Á. Control of geopolymer properties by grinding of land filled fly ash. Int. J. Miner. Process. 2015, 143, 50–58. [Google Scholar] [CrossRef]
  22. GB/T 12957-2005; Test Method for Activity of Industrial Waste Slag Used as Addition to Cement. China National Intellectual Property Administration: Beijng, China, 2005.
  23. Chen, Q.; Sun, S.; Wang, Y.; Zhang, Q.; Zhu, L.; Liu, Y. In-situ remediation of phosphogypsum in a cement-free pathway: Utilization of ground granulated blast furnace slag and NaOH pretreatment. Chemosphere 2023, 313, 137412. [Google Scholar] [CrossRef] [PubMed]
  24. Chen, Q.; Zhu, L.; Wang, Y.; Chen, J.; Qi, C. The carbon uptake and mechanical property of cemented paste backfill carbonation curing for low concentration of CO2. Sci. Total Environ. 2022, 852, 158516. [Google Scholar] [CrossRef] [PubMed]
  25. Chen, Q.; Zhang, Q.; Wang, Y.; Zhang, Q.; Liu, Y. Highly-efficient fluoride retention in on-site solidification/stabilization of phosphogypsum: Cemented paste backfill synergizes with poly-aluminum chloride activation. Chemosphere 2022, 309, 136652. [Google Scholar] [CrossRef] [PubMed]
  26. Wang, W.; Dai, S.; Zhou, L.; Zhang, J.; Tian, W.; Xu, J. Viscosity and structure of MgO–SiO2-based slag melt with varying B2O3 content. Ceram. Int. 2020, 46, 3631–3636. [Google Scholar] [CrossRef]
  27. Zhao, Z.W.; Chai, L.Y.; Peng, B.; Liang, Y.J.; He, Y.; Yan, Z.H. Arsenic vitrification by copper slag based glass: Mechanism and stability studies. J. Non-Cryst. Solids 2017, 466–467, 21–28. [Google Scholar] [CrossRef]
  28. Madhuri, J.H.; Chanakya, N.; Satyavardhan, D.; Ramesh, C.; Upender, G. XPS, FTIR, DSC and optical absorption investigations on 55B2O3–20ZnO–(25-x)Li2O–xBi2O3 (0≤x≤25 mol%) glass system. J. Non-Cryst. Solids 2023, 600, 82–98. [Google Scholar] [CrossRef]
  29. Liao, M.; Sun, H.; Wen, L.; Fang, Y.; Hu, L. Effect of alkali and alkaline earth fluoride introduction on thermal stability and structure of fluorophosphate glasses. Mater. Chem. Phys. 2006, 98, 154–158. [Google Scholar] [CrossRef]
  30. Wang, Z.; Zhao, Z.; Zhang, L.; Liu, F.; Peng, B.; Chai, L.; Liu, D.; Liu, D.; Wang, T.; Liu, H.; et al. Formation mechanism of zinc-doped fayalite (Fe2-xZnxSiO4) slag during copper smelting. J. Hazard. Mater. 2019, 364, 488–498. [Google Scholar] [CrossRef]
  31. Imran, M.M.; Bhandari, D.; Saxena, N.S. Glass transition phenomena, crystallization kinetics and thermodynamic properties of ternary Se80Te20−xInx (x = 2, 4, 6, 8 and 10) semiconducting glasses: Theoretical and experimental aspects. Mater. Sci. Eng. 2000, 292, 56–65. [Google Scholar] [CrossRef]
  32. Yao, G.; Cui, T.; Zhang, J.; Wang, J.; Lyu, X. Effects of mechanical grinding on pozzolanic activity and hydration properties of quartz. Adv. Powder Technol. 2020, 31, 4500–4509. [Google Scholar] [CrossRef]
  33. Wang, Y.; He, X.; Su, Y.; Tan, H.; Yang, J.; Lan, M.; Ma, M.; Strnadel, B. Self-hydration characteristics of ground granulated blast-furnace slag (GGBFS) by wet-grinding treatment. Constr. Build. Mater. 2018, 167, 96–105. [Google Scholar] [CrossRef]
  34. Liu, R.; Han, F.; Yan, P. Characteristics of two types of C-S-H gel in hardened complex binder pastes blended with slag. Sci. China Technol. Sci. 2013, 56, 1395–1402. [Google Scholar] [CrossRef]
  35. Zhao, Z.; Song, Y.; Min, X.; Liang, Y.; Chai, L.; Shi, M. XPS and FTIR studies of sodium arsenate vitrification by cullet. J. Non-Cryst. Solids 2016, 452, 238–244. [Google Scholar] [CrossRef]
  36. Ibrahim, M.M.; A.Fanny, M.; Hassaan, M.Y.; ElBatal, H.A. Optical, FTIR and DC Conductivity of Soda Lime Silicate Glass Containing Cement Dust and Transition Metal Ions. Silicon 2015, 8, 443–453. [Google Scholar] [CrossRef]
  37. Hassaan, M.Y.; Saudi, H.A.; Saad, H.M.H.; Mostafa, A.G.; Ahmed, M.A.; Iida, Y.; Kubuki, S.; Nishida, T. Structural study of glass and glass ceramics prepared with Egyptian Basalt. Silicon 2015, 7, 383–391. [Google Scholar] [CrossRef]
  38. Lothenbach, B.; Scrivener, K.; Hooton, R.D. Supplementary cementitious materials. Cem. Concr. Res. 2011, 41, 1244–1256. [Google Scholar] [CrossRef]
  39. Li, N.; Farzadnia, N.; Shi, C. Microstructural changes in alkali-activated slag mortars induced by accelerated carbonation. Cem. Concr. Res. 2017, 100, 214–226. [Google Scholar] [CrossRef]
  40. Kapeluszna, E.; Kotwica, Ł.; Rózycka, A.; Gołek, Ł. Incorporation of Al in C-A-S-H gels with various Ca/Si and Al/Si ratio: Microstructural and structural characteristics with DTA/TG, XRD, FTIR and TEM analysis. Constr. Build. Mater. 2017, 155, 643–653. [Google Scholar] [CrossRef]
  41. Aguiar, H.; Serra, J.; González, P.; León, B. Structural study of sol–gel silicate glasses by IR and Raman spectroscopies. J. Non-Cryst. Solids 2009, 355, 475–480. [Google Scholar] [CrossRef]
  42. Mansour, E. Semi-quantitative analysis for FTIR spectra of Al2O3-PbO-B2O3-SiO2 glasses. J. Non-Cryst. Solids 2012, 358, 454–460. [Google Scholar] [CrossRef]
  43. Nesbitt, H.; Bancroft, G.; Henderson, G.; Ho, R.; Dalby, K.; Huang, Y.; Yan, Z. Bridging, non-bridging and free (O2–) oxygen in Na2O-SiO2 glasses: An X-ray Photoelectron Spectroscopic (XPS) and Nuclear Magnetic Resonance (NMR) study. J. Non-Cryst. Solids 2011, 357, 170–180. [Google Scholar] [CrossRef]
  44. Yamashita, T.; Hayes, P. Analysis of XPS spectra of Fe2+ and Fe3+ ions in oxide materials. Appl. Surf. Sci. 2008, 254, 2441–2449. [Google Scholar] [CrossRef]
  45. Shaharyar, Y.; Cheng, J.Y.; Han, E.; Maron, A.; Weaver, J.; Marcial, J.; McCloy, J.S.; Goel, A. Elucidating the effect of Iron speciation (Fe2+/Fe3+) on crystallization Kinetics of sodium aluminosilicate glasses. J. Am. Ceram. Soc. 2016, 99, 2306–2315. [Google Scholar] [CrossRef]
  46. Rada, S.; Dehelean, A.; Stan, M.; Chelcea, R.; Culea, E. Structural studies on iron–tellurite glasses prepared by sol–gel method. J. Alloy. Compd. 2011, 509, 147–151. [Google Scholar] [CrossRef]
  47. Simonsen, M.E.; Sønderby, C.; Li, Z.; Søgaard, E.G. XPS and FT-IR investigation of silicate polymers. J. Mater. Sci. 2009, 44, 2079–2088. [Google Scholar] [CrossRef] [Green Version]
  48. Qing, M.; Yang, Y.; Wu, B.; Xu, J.; Zhang, C.; Gao, P.; Li, Y. Modification of Fe–SiO2 interaction with zirconia for iron-based Fischer–Tropsch catalysts. J. Catal. 2011, 279, 111–122. [Google Scholar] [CrossRef]
  49. Li, K.; Xue, D. Estimation of electronegativity values of elements in different valence states. J. Phys. Chem. A 2006, 110, 11332–11337. [Google Scholar] [CrossRef]
  50. Tognonvi, M.T.; Zidol, A.; Aïtcin, P.-C.; Tagnit-Hamou, A. Aging of glass powder surface. J. Non-Cryst. Solids 2015, 427, 175–183. [Google Scholar] [CrossRef]
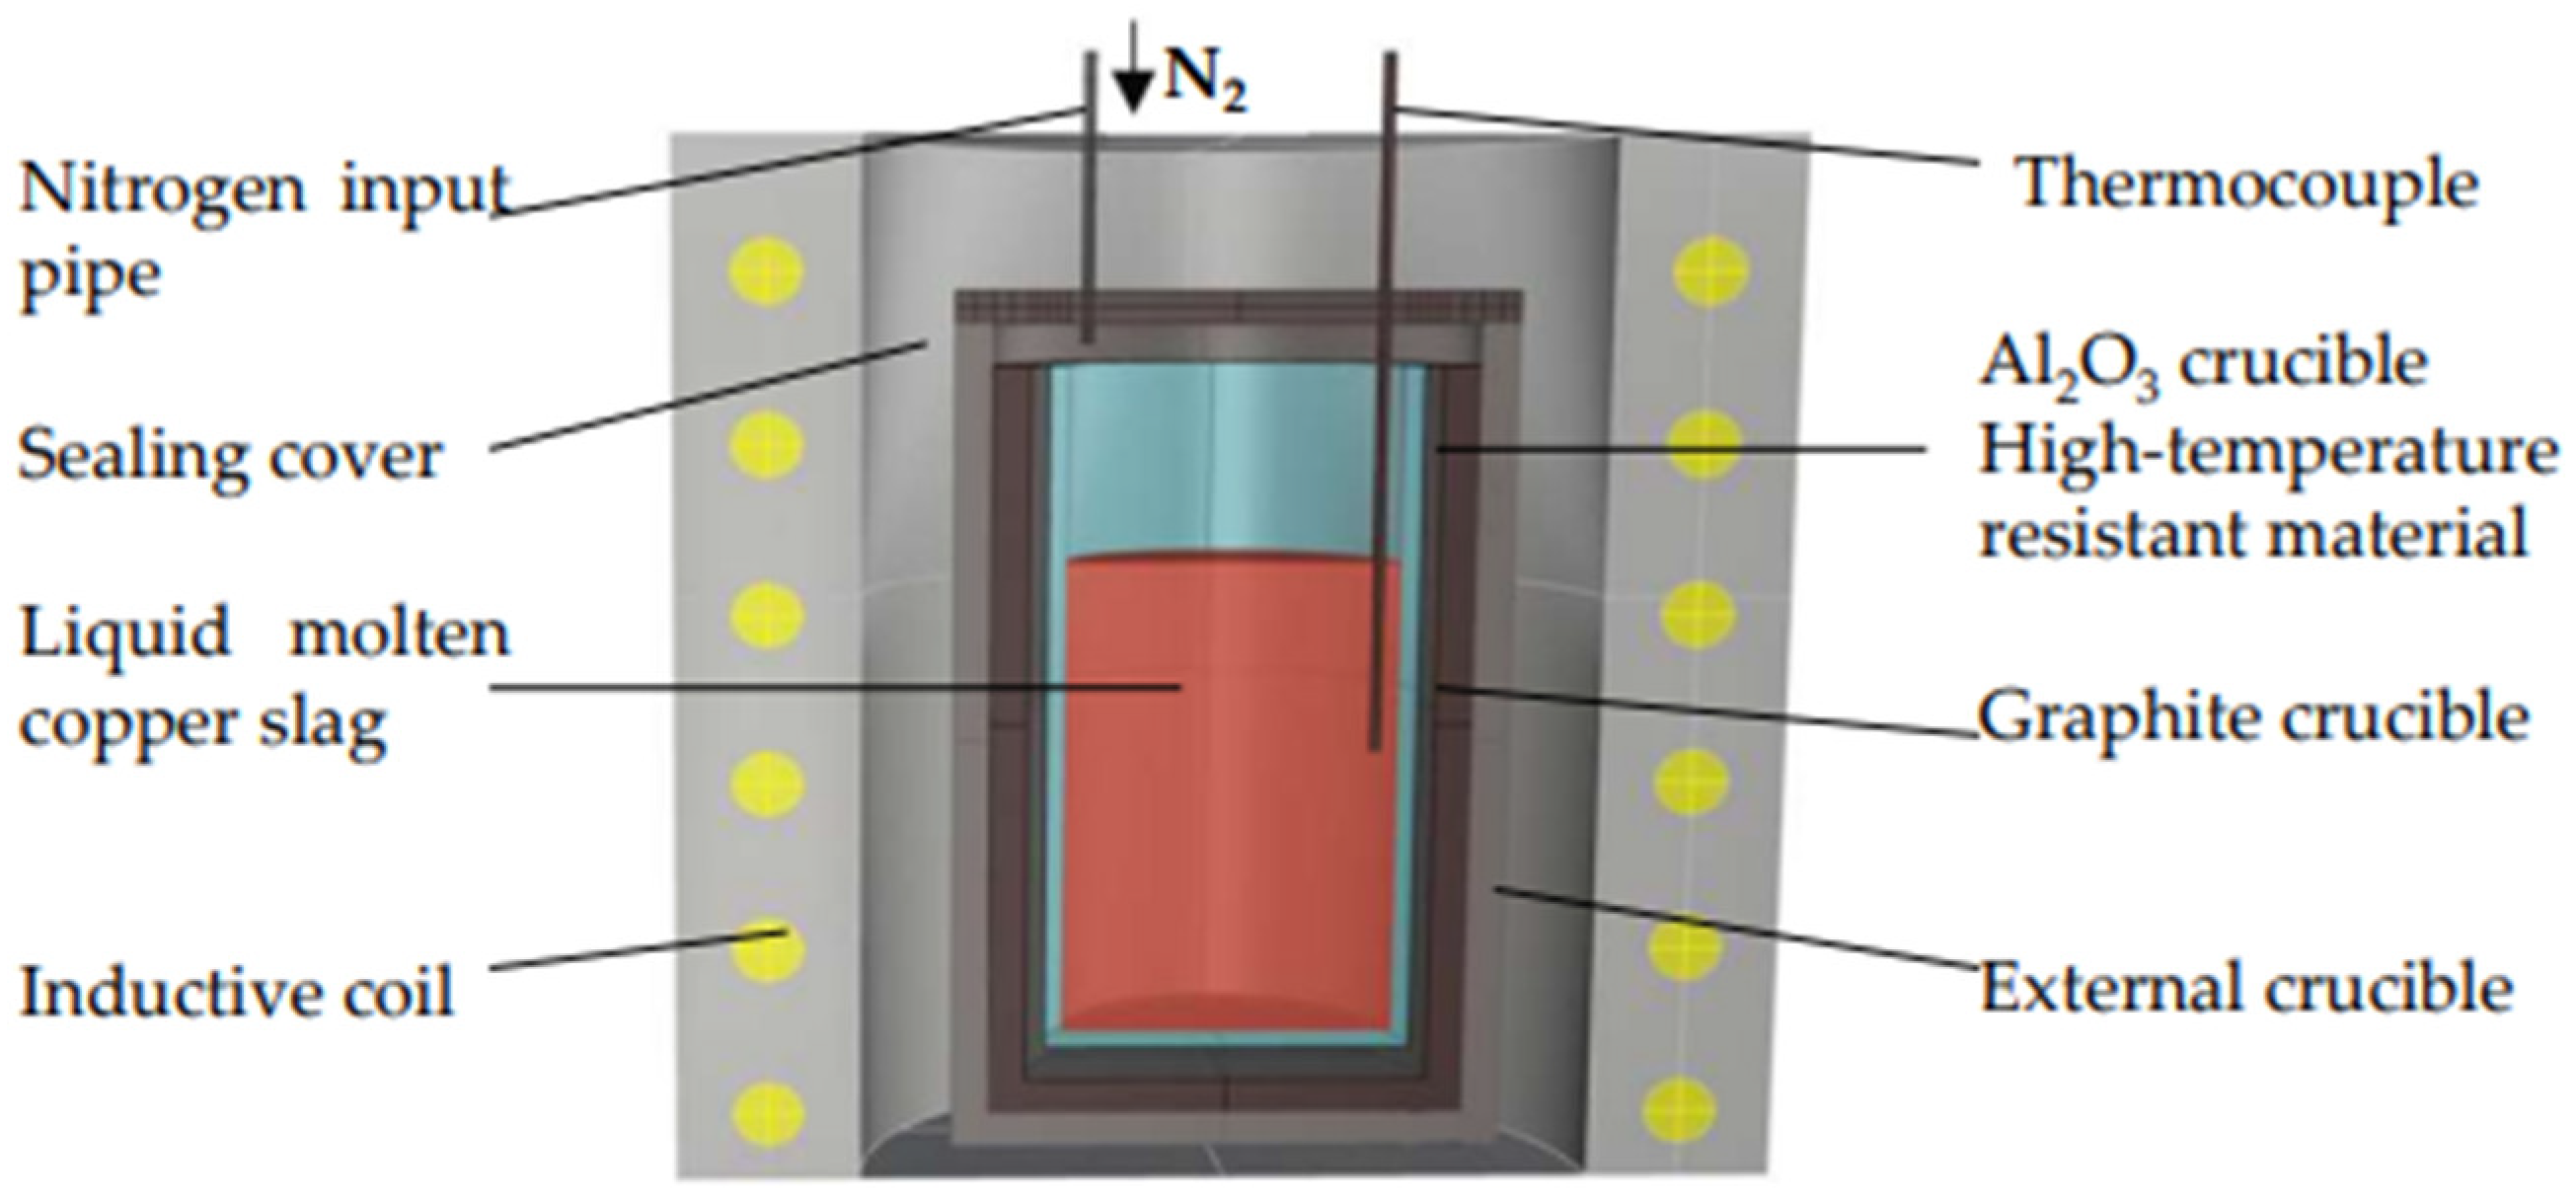
Figure 1. Hydration granulation system.
Minerals 13 00174 g001
Figure 2. XRD patterns for the three groups of WCS.
Minerals 13 00174 g002
Figure 3. DSC curves for the three groups of WCS.
Minerals 13 00174 g003
Figure 4. SAI and UCS of blended cement pastes.
Minerals 13 00174 g004
Figure 5. FTIR spectra of WCS; (a) original spectra and (b) deconvoluted spectra in the range of 773–1260 cm−1.
Minerals 13 00174 g005
Figure 6. XPS measurement spectrum of WCS containing different Al2O3.
Minerals 13 00174 g006
Figure 7. Fe2p spectra for WCS: WCSA0, WCSA5, and WCSA10; (a) original spectra and (b) deconvolved peaks.
Minerals 13 00174 g007
Figure 8. O1s spectra for WCS: WCSA0, WCSA5, and WCSA10; (a) original spectra and (b) deconvolved peaks.
Minerals 13 00174 g008
Figure 9. Si2p spectra of three groups of WCS.
Minerals 13 00174 g009
Table 1. The main chemical composition (wt.%) of WCS.
SampleThe Main Chemical Composition (wt.%)Physical Characteristics
FeOSiO2CaOFe2O3Al2O3MgOZnOCu2OK2OBET Surface Area (m2·g−1)Density (g·cm−3)
WCSA035.8933.404.007.143.501.391.351.65-0.673.56
WCSA533.9132.73.99.16.60.821.020.68-0.673.49
WCSA1032.1432.73.79.479.80.820.950.64-0.693.46
PC-18.162.12.84.91.2--2.30.473.08
Table 2. DSC parameter value for WCS.
SampleTg (°C)Tc (°C)Tp (°C)ΔT = Tc − Tg (°C)SΔHc (J/g)
WCSA0652.17975.261026.17323.0925.22869.24
WCSA5691.501073.181089.50381.689.015782.6
WCSA101081.501090.17267.13
Table 3. Peak center (C) and relative area (A) from the curve fitting in the range of 773–1250cm−1.
SampleQ2Q3Q4
CACACA
WCSA0854.423.0940.632.61100.044.5
WCSA5858.19.1943.051.01104.039.6
WCSA10861.84.7944.163.71120.331.6
Table 4. Peak center (C), FWHM, and relative area (A) from the curve fitting of Fe2p.
SampleFe2p3/2 of Fe3+The Satellite Peak of Fe2+Fe2p1/2 of Fe3+
C
(eV)
FWHM
(eV)
A
(%)
C
(eV)
FWHM
(eV)
A
(%)
C
(eV)
FWHM
(eV)
A
(%)
WCSA0711.02.9442.90713.725.7739.10724.823.3018.00
WCSA5710.842.7046.37713.034.1231.43724.643.1922.20
WCSA10710.742.5245.19712.493.6235.21724.743.0419.60
Table 5. Peak center (C), FWHM, and relative area (A) from the curve fitting of O1s.
SampleNBOSi-O-AlSi-O-SiBESi-O-Si-BENBO
(eV)
C
(eV)
FWHM
(eV)
A
(%)
C
(eV)
FWHM
(eV)
A
(%)
C
(eV)
FWHM
(eV)
A
(%)
WCSA0530.821.8240.14532.111.3533.13533.561.4826.732.74
WCSA5530.611.7450.12531.931.6435.85533.591.3614.032.98
WCSA10530.421.7054.38531.711.9740.52533.711.175.103.29
Table 6. Peak center (C) and FWHM from the curve fitting of Si2p.
SampleC (eV)FWHM (eV)
WCSA0101.88321.68478
WCSA5101.64241.69039
WCSA10101.50111.70077
Disclaimer/Publisher’s Note: The statements, opinions and data contained in all publications are solely those of the individual author(s) and contributor(s) and not of MDPI and/or the editor(s). MDPI and/or the editor(s) disclaim responsibility for any injury to people or property resulting from any ideas, methods, instructions or products referred to in the content.