Abstract
The in-situ X-ray diffraction (XRD) and Raman spectra of synthetic (Mg, Fe, Mn)CO3 single crystals for (Mg0.37Fe0.31Mn0.32)CO3, (Mg0.49Fe0.51)CO3, (Fe0.47Mn0.53)CO3, and (Mg0.50Mn0.50)CO3 were investigated up to 871 K. Lattice parameters and the volumetric thermal expansion coefficients were achieved, demonstrating an inherent anisotropy of c/a near to 3.0. The Raman spectra of our intermediate components all exhibit a negative temperature dependence similar to that of the end members. The temperature dependence of the external modes T, L, anti-symmetric stretching mode ν3, and out-of-plane bending mode 2ν2 is generally more prominent than the in-plane bending mode ν4 and symmetric stretching mode ν1 except for siderite FeCO3. Combining thermal expansion coefficients αV with the relative changes in frequency δνi/δT of Raman spectra, the average thermodynamic Grüneisen parameters (γth) for (Mg0.37Fe0.31Mn0.32)CO3, (Fe0.47Mn0.53)CO3, (Mg0.50Mn0.50)CO3, MgCO3, and MnCO3 were obtained as 1.18, 1.36, 1.34, 1.13, and 1.53, respectively. The relationship between Fe2+ and Mn2+ contents and γth illustrates that the concentration of Fe2+ causes a negative effect while the concentration of Mn2+ causes a positive effect on γth. These results could provide a reference for the contribution of Fe2+ and Mn2+ on the structural and thermodynamic properties of (Mg, Fe, Mn)CO3 carbonates.
1. Introduction
As the most abundant carbon storage, carbonates are widely distributed on the surface of the earth, accounting for 1.7% of the total mass of the crust. Carbonates (such as calcite, dolomite, ankerite, iron-bearing magnesite, etc.) are formed in the oceanic lithosphere through low-temperature hydrothermal alteration and enter the Earth’s interior through oceanic crust subduction [1], which are thus considered as the most potential hosts for subducted carbon within the deep Earth [2]. In nature, carbonates frequently take the form of complex isomorphic substitution, resulting in a multiple system such as CaCO3-MgCO3-FeCO3-MnCO3. Among them, the complete solid solution series of the MgCO3-FeCO3-MnCO3 system has long been predicted due to the relatively small ion radius difference between divalent magnesium, manganese, and iron according to mineral analysis [3,4].
However, previous studies mainly focused on the crystal structural, thermodynamic, and elastic properties of end members of MgCO3-FeCO3-MnCO3 [5,6,7,8]. Experiments on binary or ternary systems have rarely been conducted except for MgCO3-FeCO3 binary systems [9,10,11,12]. It has been reported that the structural stability of rhodochrosite and siderite is influenced by the local electronic structures attributed to transition metal ions with unfilled valence layer d orbitals [13,14,15,16,17,18]. Zhang et al. (1998) found an inverse bulk modulus–volume relationship in the MgCO3-FeCO3 carbonates that deviates from the empirical prediction of a constant product of K0 and V0, indicating that the substitution of alkaline earth elements by the 3d transition metals may lead to changes in crystal structural and vibrational properties [9]. Liang et al. (2020) determined the thermal expansion coefficient of the synthesized MnCO3 single crystal and clarified the anomaly of thermal property anisotropy from previous reports [19]. In addition, regarding the performance of Fe2+ and Mn2+ in dolomite, the Fe-analogue of dolomite is unstable and unknown in nature [20], while the substitution of the larger cation Mn2+ to form CaMn(CO3)2 is complete and extensive [21]. More importantly, as a transition metal element containing 3d electrons, Fe2+ could undergo spin transition under high pressure [22,23]. In this regard, the interaction of Fe2+ and Mn2+ in the (Mg, Fe, Mn)CO3 solid solutions is still unclear. In this paper, we synthesized single crystals of (Mg, Fe, Mn)CO3 via fixing to the middle component and determined the composition and crystal structure for (Mg0.37Fe0.31Mn0.32)CO3, (Mg0.49Fe0.51)CO3, (Fe0.47Mn0.53)CO3, and (Mg0.50Mn0.50)CO3. The linear relationship between them conforms to Vegard’s law. Subsequently, the interaction and the coupling effects of Fe2+ and Mn2+ for the average thermodynamic Grüneisen parameters γth were modeled according to the thermal expansion and Raman vibrational properties.
2. Materials and Methods
2.1. Sample Preparation and Characterization
The single crystals of (Mg, Fe, Mn)CO3 carbonates were prepared via high P-T annealing as reported by Liang et al. (2018a), and the details are presented in the Supplementary Materials [24]. The chemical composition of carbonates were determined as (Mg0.37Fe0.31Mn0.32)CO3, (Mg0.49Fe0.51)CO3, (Fe0.47Mn0.53)CO3, and (Mg0.50Mn0.50)CO3 (hereinafter referred to as MFM, MF, FM, and MM), respectively, with a JEOL JXA-8230 electron microprobe at the Shandong Institute of Geological Sciences, as shown in Supplementary Figure S1 and Supplementary Table S1. The operating conditions were 15 kV accelerating voltage, 1 × 10⁻⁸ A beam current, and 5 μm beam spot. Standards used were natural minerals and synthetic compounds. Matrix effects were corrected using the ZAF software provided by JEOL Ltd. (Tokyo, Japan).
2.2. Single Crystal X-ray Diffraction at Variable Temperature
Single crystal X-ray diffraction data of MFM, MF, FM, and MM were collected on a Rigaku XtaLAB Synergy-DW diffractometer (AXT Pty Ltd., NSW, Australia) using Mo Kα radiation (λ = 0.71073 Å). The experiments were conducted from high temperature to low temperature with a temperature range of 100–500 K and a step of 100 K. Data reduction and empirical absorption correction were performed using the CrysAlisPro.39 program. The initial structure solutions of carbonates were obtained via direct methods and refined via full-matrix least-squares with the SHELXT by SHELXTL package. All the heaviest atoms were unambiguously located in the Fourier maps, and then O atoms were found in the subsequent difference maps. All atoms were refined with anisotropic displacement parameters. The final cycles of the least-squares refinement including atomic coordinates and anisotropic thermal parameters for atoms (I > 2sigma(I)) for the MFM, MF, FM, and MM compounds converged at R1 = 0.018, 0.016, 0.017, 0.017 and wR2 = 0.057, 0.040, 0.041, 0.045, respectively.
2.3. High-Temperature Raman Spectroscopy
High-temperature Raman spectra of MFM, MF, FM, MM, FeCO3, MgCO3, and MnCO3 were collected from 150–1300 cm−1 with a Renishaw inVia Reflex system in back-scattering geometry at China University of Geosciences (Wuhan). The Raman signal was excited using the 532 nm wavelength of a diode-pumped solid-state laser, delivering an emission power of ~50 mW focused onto an approximately 2.5 μm spot using a 20 × long-distance objective. The spectral resolution was about 1 cm–1 with a holographic diffraction grating of 1800 lines/mm. The spectra were calibrated using a silicon wafer. All Raman data were collected on the same single crystal with invariant orientation. The temperature range is from room temperature (296 K) to sample decomposition temperature (up to 871 K). For measurements at ambient and high temperatures, spectra were taken with a temperature interval of 50 K, and the cooling and heating rates were set to be 20 K·min−1, as controlled via an automatic temperature controlling unit. At each step, the target temperature was maintained for at least 5 mins to allow for thermal equilibrium before measurement, and the uncertainties of temperature were less than 1 K. The Raman frequencies were recorded in the range of 50–1600 cm−1, and a silicon single crystal was used as the reference for calibrating the spectrometer.
3. Results and Discussion
3.1. Single Crystal XRD and Thermal Expansion of (Mg, Fe, Mn)CO3 at Various Temperatures
The crystal structures of MFM, MF, FM, and MM were achieved under variable temperatures from 100 K to 500 K, whereas no structural transition was identified. The crystal data and structural refinement, including the lattice parameters, bond length, and bond angle, are summarized in Supplementary Table S2. The lattice parameters of MFM, MF, FM, and MM as functions of the average ion radius are plotted in Figure 1, combining with the present results of MgCO3 and MnCO3 for comparison. In the crystal structure of calcite-type ACO3, the [CO3]2− groups are characterized by strong, internal, nearly uniform C–O bonds, interlinked with the metal cations A2+ via weaker A–O bonds. The central ion A2+ is six-coordinated in a slightly tilting (AO6) octahedron with six equal A–O bond lengths. The magnitude of either of the two non-equivalent O–A–O bond angles could be used to characterize the degree of polyhedral distortion. The hybridization of A and O valence electron orbitals will lead to the formation of a distorted octahedron with a variable O–A–O angle. In (Mg, Fe, Mn)CO3 solid solutions, the lattice parameters a, c, and unit cell volume are directly proportional to the average ion radius, basically obeying Vegard’s law. Since the (AO6) octahedral geometry is mainly dominated by A-site cation substitution, a similar linear relationship between the A–O bond length and ionic radius occurs. Instead, the C–O bond length varies slightly because the C–O bonds behave more rigidly and are less affected [25,26]. In addition, the O–A–O bond angles exhibit an obvious regularity whereby the bond angle of Fe-bearing carbonates is relatively small while that of Mn-bearing carbonates is large, which is completely consistent with the previous study of FeCO3 and MnCO3 end members [19,27]. Lattice parameters of a, c, A–O bond length, and unit cell volume as functions of Shannon effective ionic radius were fitted as
where r is the Shannon effective ionic radius, in the unit of Å. la, lc, and lA-O are the a, c, and A-O bond length, in the unit of Å. Vunitcell is the unit cell volume, in the unit of Å3. The linear relationships comply with Vegard’s law. Thus, the lattice parameters and theoretical densities could be estimated conveniently according to the different chemical compositions of (Mg, Fe, Mn)CO3.
la = 3.6330 + 0.0138 × r (R2 = 0.9971)
lc = 10.6092 + 0.0610 × r (R2 = 0.9903)
lA-O = 1.4549 + 0.0089 × r (R2 = 0.9974)
Vunitcell = 69.87 + 2.89 × r (R2 = 0.9973)
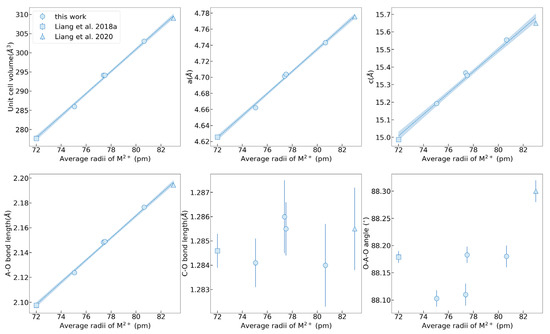
Figure 1.
The single crystal lattice parameters of MFM, MF, FM, and MM compared with literature data of MgCO3 and MnCO3 with the change of the average ion radii. Data from Liang et al., 2018a, and Liang et al., 2020 [19,24].
The variations of the lattice parameters of MFM, MF, FM, and MM at 100–500 K are shown in Figure 2. The lattice parameters, including a, c, unit cell volume V, A–O bond length, and AO6 octahedral volume, increase as the temperatures rise, and instead, the C–O bond lengths and O–A–O bond angles decrease. It reveals that the octahedron of AO6 expands during the process of thermal expansion, resulting in the extrusion of adjacent [CO3]2− groups and the shortening of the C–O bond length. The decrease of the O–A–O bond angle with temperature indicates that the (AO6) octahedron becomes more tilted with lattice expansion. The thermal expansion coefficient α is defined as α = 1/V(∂V/∂T)P = α0 + α1T + α2T2 + …, and here only α0 is reserved to describe the linear variations of volume or length with temperature when the temperature is not very high; that is, V = V300(1 + α0(T − 300)) and the V300 is volume or length at 300 K. The thermal expansion coefficients of MFM, MF, FM, MM, MgCO3, and MnCO3 with the average ion radius are listed in Table 1 [24,28]. The cation substitution of Fe2+ and Mn2+ mainly affects the thermal expansion coefficient by changing the bond length in the octahedral configuration. Therefore, the bond length expansion coefficient αA–O is regarded as a value inversely proportional to the A–O bond length. In general, the bond-length expansion coefficient αA–O has a tendency to decrease with the substitution of cations with a larger radius. However, the Fe- and Mn-bearing samples (MFM and FM) exhibit an abnormally high value of the bond-length expansion coefficient αA–O. The anomaly also suggests that the simultaneous substitution of Fe2+ and Mn2+ affects their thermal expansion properties. Given that the rigid [CO3]2− groups on the a–b plane have an obvious influence on the anisotropy, the thermal expansion along the c-axis in our samples is approximately 2.95–3.55 times greater than that along the a-axis. An approximate relationship of αV ≈ 2αa + αc is observed and is consistent with the inherent calcite-type crystal structure.
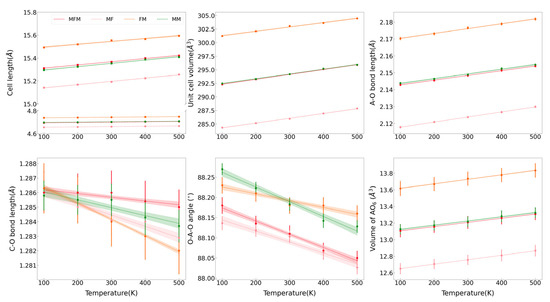
Figure 2.
The variations of lattice parameters in MFM, MF, FM, and MM at the different temperatures.

Table 1.
Thermal expansion coefficient of calcite-type ACO3 carbonates at ambient pressure.
3.2. Raman Spectra of (Mg, Mn, Fe)CO3 Carbonates at High Temperatures
Raman spectra are deemed as the complementary information about the crystal structure because they are derived from the fundamental vibrations of chemical bonds. The (Mg, Mn, Fe)CO3 carbonates belong to the calcite-type ACO3 with the Rc space group and the rhombohedral symmetry. According to factor group analysis, there are 30 vibrational modes classified by the symmetry of each vibrational mode as follows: (1) vibrational mode with Raman activity: A1g + 4Eg; (2) vibrational mode with infrared activity: 3A2u + 5Eu; (3) acoustic mode: 1A2u + 1Eu; (4) inactive mode: 3A2g + 2A1u. Among them, six Raman vibrational modes of ACO3 are expected, including the translational (T) and librational (L) modes, ν4 (in-plane bend), ν1 (symmetric stretch), ν3 (anti-symmetric stretch), and 2ν2 (out-of-plane bend, overtone mode of the silent, IR-active ν2 mode). The first two modes are external or lattice vibrations of the (CO3)2− group relative to the A2+ cation, while the remaining four modes represent internal vibrations of the (CO3)2− group [6,29,30]. Raman spectrums of seven samples, MMF, FM, MF, MM, FeCO3, MgCO3, and MnCO3, were recorded to the decomposition temperatures (up to 871 K), as shown in Figure 3 and Supplementary Figure S2. The thermal decomposition of the samples under ambient pressure was detected in the spectra via a sudden disappearance of the strongest Raman bands, revealing 671 K for MMF, 621 K for FM, 871 K for MF, 721 K for MM, 596 K for FeCO3, 796 K for MgCO3, and 696 K for MnCO3. All 6 modes can be observed in MMF, MF, MM, MgCO3, and MnCO3, listed in Table 2. In contrast, the intensity of ν3 mode is too weak to be observed in MF and FeCO3, essentially in agreement with results from Rutt and Nicola (1974) and Lin et al. (2012) [22,29]. The wide peaks at around 1581 cm−1 are independent on the compositions, which may be assigned to stress generated in high-pressure synthesis.
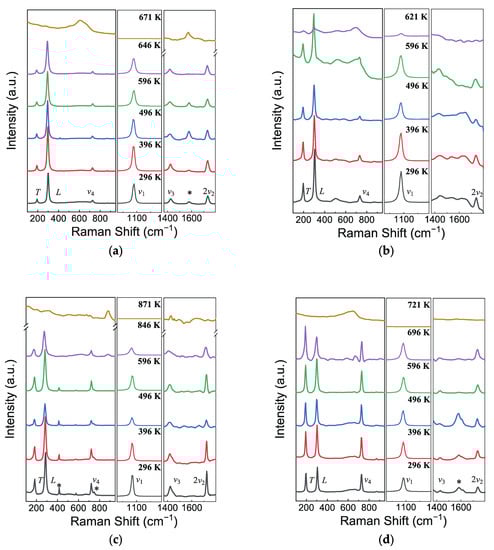
Figure 3.
Representative Raman spectra of (a) MFM, (b) MF, (c) FM, and (d) MM at high temperature. The asterisks (*) symbolize the unassigned Raman peaks.
Table 2.
Modeled vibrational parameters and thermal Grüneisen parameters of MFM, MF, FM, MM, FeCO3, MgCO3, and MnCO3 at high temperature. Data from Farsang et al., 2018, Gillet et al., 1993 and Wang et al., 2022 [6,8,30].
Cation substitutions in the calcite-type ACO3 structure induce the variations of the chemical bound strengths and the atomic masses, which are primarily embodied as shifts in vibration frequencies. With lager-radius substitution of Fe2+/Mn2+ ions for Mg2+, the vibrational frequency exhibits a decreasing trend (Figure 4), because Raman shifts of [CO3]2− ions are not only related to C–O bond lengths strictly but also affected by the surrounding bond environments. Despite the differences between the ionic radii of Mn2+ and Fe2+, the variations in positions of the different Raman bands of FeCO3 and MnCO3 are not particularly obvious—the difference is only significant in the ν4 mode (Table 2). The difference of vibration position in ν4 mode can be regarded as the main difference of the Raman spectra of calcite-type carbonates between Fe- and Mn-bearing end members. In particular, the Raman shift of FeCO3 exhibits a deviation from linearity with a lower Raman shift in the T, L, ν1, and 2ν2 modes as well as a higher Raman shift in the ν4 mode (Supplementary Figure S3).
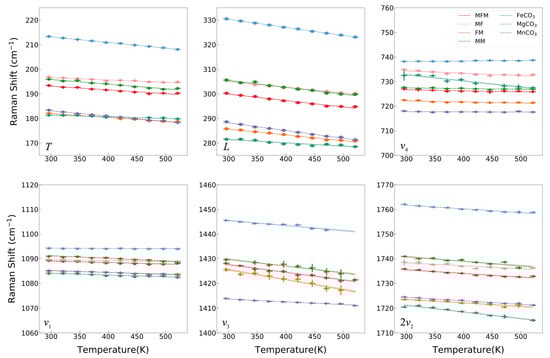
Figure 4.
Raman shifts of MFM, MF, FM, MM, FeCO3, MgCO3, and MnCO3 of each mode as a function of temperature can be modeled via a linear fit from 296 K to 521 K.
The variations of Raman shift with temperature for all observed modes are illustrated in Figure 4, and the Raman modes recorded a linear peak shift as a function of temperature and the relative changes in frequency δνi/δT are listed in Table 1. The observed Raman bands shift to lower wavenumber regions with increasing temperature from 296 K to 521 K, with the exception of the ν4 mode of MgCO3 shifting to higher wavenumber regions. However, Gillet et al. (1993) reported an unchanged ν4 vibrational band with increasing temperature, but Farsang et al. (2018) reported a negative temperature dependence of the ν4 Raman mode in MgCO3 [6,30]. The discrepancy between our result and the previous studies in the ν4 mode of MgCO3 may be caused by errors since this vibrational mode is only slightly affected by temperature (less than 0.5 cm−1 within 225 K). The negative temperature dependence of the Raman modes in FeCO3 and MnCO3 in our experiment is consistent with Wang et al. (2022) [8]. In contrast to this, Farsang et al. (2018) reported a positive temperature dependence of the ν4 mode in MnCO3 and the T mode in FeCO3 [6]. The inconsistency may come from the large fluctuation of the Raman shifts with the poor R2 owing to a large temperature gradient in their heating stage. The four samples of our intermediate components all exhibit a negative temperature dependence similar to that of the end members. The sensitivity of temperature dependence of intermediate components also shows a similar regular pattern to the end members. The temperature dependence of the T, L, ν3, and 2ν2 modes (the order of magnitude of δνi/δT is 10−2 cm−1/K) is generally more prominent than those of ν1 and ν4 (the order of magnitude of δνi/δT is 10−3 or 10−4 cm−1/K) for MMF, MF, FM, MM, MgCO3, and MnCO3. However, the pure iron end member FeCO3 is the only exception. The ν4 and 2ν2 modes of FeCO3 exhibit maximum sensitivity to temperature with a coefficient of −2.5 × 10⁻² cm−1/K and −2.67 × 10⁻² cm−1/K, respectively. Similarly, the ν4 mode of MF is quite sensitive to temperature. It is worth mentioning that the ternary components MFM and ferromanganese FM are barely affected by iron. It may be that manganese inhibits the iron distortion in the octahedral configuration.
3.3. Thermodynamic Grüneisen Parameters of the (Mg, Fe, Mn)CO3
The thermodynamic Grüneisen parameters of minerals are derived from Grüneisen’s law, which states that the coefficient of thermal expansion of solids is proportional to heat capacity, and it reflects the dependence of the mode frequency of lattice vibration on the volume change on the micro level. Combining the temperature dependence of the different modes with the coefficient of thermal expansion at high temperatures in this study and previous literature, the isobaric mode Grüneisen parameter γi,P [31] for each vibrational mode was derived according to the following equation:
where α is the thermal expansion coefficient, and νi is the vibrational frequency of the ith band at ambient conditions.
Here, we use αV = 3.85 × 10⁻⁵ K−1, 2.85 × 10⁻⁵ K−1, 2.80 × 10⁻⁵ K−1 for magnesite [32], rhodochrosite [33], and siderite [9] as well as the thermal expansion coefficients of MFM, MF, FM, and MM obtained from this work for the calculation. The values of the derived isobaric mode Grüneisen parameter γi,P for each vibrational mode are listed in Table 2, together with previous results for comparison. The values of the isobaric mode Grüneisen parameter γi,P are in the range of 0.02–1.05 for the internal modes and 1.11–4.15 for the external modes. The values of the isobaric mode Grüneisen parameters of two external vibrational modes (T and L) are much greater than the values of the internal vibrational modes (ν4, ν1, ν3, and 2ν2), revealing that the high-temperature expansion of carbonate is mainly dominated by the [AO6]6− coordinated octahedron linking the [CO3]2− groups to the cations [34]. The smaller isobaric mode Grüneisen parameter γi,P of the internal modes may be due to the rigidity of C−O bonds in the [CO3]2− units.
For the end members of MgCO3, MnCO3, and FeCO3, γiP values have already been reported in plenty of previous research, and our results are measured simultaneously with synthetic single crystals without impurities with a good goodness of fit statistic, which ensures high reliability. Basically, the data are in good agreement with previous results on internal and external vibration trends, however, there are still differences in some Raman-active modes between our results and previous studies. For instance, the ν4 mode of FeCO3 exhibits a relatively large mode Grüneisen parameter. Individual differences are mainly the result of the following reasons: (1) The primary reason for the differences is probably that the samples used in previous studies were natural carbonate samples containing some trace elements, such as Ca2+. (2) Another possible reason is that the differences in δνi/δT were caused by the poor goodness of fit due to the temperature gradient in the heating stage as mentioned above and consequently led to the differences in γiP values. (3) The application of different thermal expansion coefficients to different research is also the reason for different Grüneisen parameters. Farsang et al. (2018) used a thermal expansion coefficient of 1.93 × 10⁻⁵ K−1 for calculations in magnesite [6], which is a relatively low coefficient of thermal expansion—almost half of the value of the thermal expansion coefficient we used for magnesite: 3.85 × 10⁻⁵ K−1 [32]. This could explain why Farsang et al. (2018) reported a relatively larger mode Grüneisen parameter for magnesite [6].
Moreover, previous work mainly focused on the Grüneisen parameter γi,P of end members, whereas the measurement of the Grüneisen parameter of the solid solution composition has not been done yet. Our results show that the characteristics of intermediate components of iron- or manganese-bearing samples are slightly different from those of the end members. The ν3 mode in MFM, FM, and MM, in particular, has abnormally high mode Grüneisen parameters of 0.7, 1.05 and 0.64, which are not between but greater than any end members.
Finally, according to the Grüneisen parameters of each variational mode, we calculated the average thermal Grüneisen parameters (γth) of five samples: MFM, FM, MM, MgCO3, and MnCO3. Due to the lack of the ν3 variational mode in Raman spectra, it is impossible to calculate the average thermodynamic Grüneisen parameters of iron containing samples MF and FeCO3 (Table 2):
where γi is the mode Grüneisen parameter of variational mode i, and Cv,i is the contribution for contrast heat of variational mode i.
Cv is the lattice-specific heat capacity, which is related to the lattice vibration frequency and temperature.
where Boltzmann constant kB = 1.380649 × 10⁻²³ J/K, reduced Planck constant ℏ = h/(2π) = 1.054573 × 10⁻³⁴ J·s, and ωj is the angular frequency of variational mode j.
The calculated average thermodynamic Grüneisen parameters for MFM, FM, MM, MgCO3, and MnCO3 were 1.18, 1.36, 1.34, 1.13, and 1.53, respectively. The Grüneisen parameters of the MgCO3-FeCO3-MnCO3 ternary system have a nonlinear relationship with the change of the average ion radius, especially for the Fe- or Mn-bearing carbonates MFM and FM, which obviously deviate from the linear relationship between MgCO3 and MnCO3 end members.
3.4. The Effect of Fe2+ and Mn2+ Cation Substitution on (Mg, Fe, Mn)CO3
In spite of the fact that the ionic radii of Mg2+, Fe2+, and Mn2+ are not significantly different in (Mg, Fe, Mn)CO3 solid solutions, Fe2+ and Mn2+ transition metal ions with unfilled valence layer d orbitals exhibit special ionic properties and local electronic structures, thereby affecting the crystal structure, vibration characteristics, and thermodynamic properties.
The members of (Mg, Fe, Mn)CO3 solid solutions have been predicted via factor group analysis to have similar Raman spectra to the end members and a continuous shift in Raman wavenumbers with cation substitution. Therefore, we further compared the values of the frequencies of different bands of solid solution composition with different ion radii at ambient conditions in Supplementary Figure S3. Despite there being a trend that the Raman shift decreases with the increase of the ion radius, the iron-containing end member deviates from linearity. For MgCO3-FeCO3-MnCO3 solid solutions, T, L, and 2ν2 modes exhibit a large range of Raman wavenumbers and are greatly affected by metal cations. Hence, we compared the changes in Raman shifts of T, L, and 2ν2 modes of solid solution composition with cation substitution. The equation of the relationship between Fe2+ and Mn2+ contents and the Raman shift of mode T, L, and 2ν2 at 300 K is derived as ZT = −31(1) × XFe − 30(1) × YMn + 212.5(8), ZL = −47(2) × XFe − 42(2) × YMn + 329(1), and Z2ν2 = −39(1) × XFe − 36(1) × YMn + 1760(1) using multiple linear regression. The seven data points with errors basically fall on the 1:1 line of the measured value and the calculated value obtained via the equation in Supplementary Figure S4a–c. It is obvious that the substitution of Fe2+ and Mn2+ will reduce the T, L, and 2ν2 mode Raman shifts, and the effect of iron is slightly greater. In Supplementary Figure S4d–f, the thermal diagram of Raman shifts with respect to Fe2+ and Mn2+ contents also exhibits a similar relationship: the magnesium-rich end member has a relatively high Raman shift, and the Raman shift decreases with the substitution of Fe2+ and Mn2+. This provides more intuitive insights into the contributions of Fe2+ and Mn2+ in Raman shifts and can be expected for in-situ mineralogical chemical quantification via Raman spectra in future planetary explorations.
Similarly, in order to characterize the contribution of Fe2+ and Mn2+ on the thermal expansion property of samples, the thermal expansion coefficients of MFM, MF, FM, MM, MgCO3, and MnCO3 with the average ion radius are plotted for comparison in Figure 5a. Overall, the thermal expansion coefficients αa, αc, αV, and αA-O have an inverse trend with the average ionic radius; however, there are some exceptions: the FM sample shows a relatively low c-axis thermal expansion coefficient and a relatively low volumetric expansion coefficient αV as a result, whereas MFM shows a relatively high a-axis thermal expansion coefficient and a relatively high volumetric expansion coefficient αV as a result. In addition, MFM and FM both have a relatively higher bond-length expansion coefficient αA-O as mentioned in 3.1. The thermal expansion mechanism cannot be simply characterized by the ionic radius or bond length, but also may be related to the properties of cations. It is likely that the main force applied during expansion is not merely electrostatic forces and radial symmetric repulsion forces but other spherical effects of the bond between metal cations and oxygen, especially for transition metals Fe2+ and Mn2+. The linear relationship of thermal expansion αV as a function of Fe2+ and Mn2+ contents, Zα = −0.8(3) × XFe − 0.8(2) × YMn + 3.5(1), is presented in Figure 5b. Megaw (1971) noted that the thermal expansion of the three-dimensional crystal structure of rhombohedral carbonates is a combined effect of bond length expansion and octahedral tilting [35]. Previous studies assumed that the thermal expansion property of calcite-type carbonates would follow a linear or quadratic curve as the radius increased; the effects of simultaneous or separate cation substitutions of Fe2+ and Mn2+ are rarely discussed. Our result indicates that although Mn2+ has a larger ion radius, that is, a longer bond length, the lattice distortion effect caused by Fe2+ substitution has the same effect on the thermal expansion coefficient. The specific thermal expansion mechanism related to the cation substitution of Fe2+ and Mn2+ in MgCO3-FeCO3-MnCO3 solid solution needs further investigation.
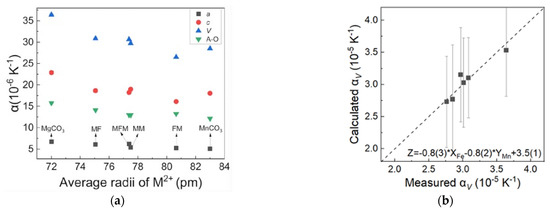
Figure 5.
(a) Thermal expansion of MFM, MF, FM, MM, MgCO3, and MnCO3 with the change of the average ion radii. Data from Markgraf and Reeder, 1985, and Liang et al., 2020 [19,35]. (b) The equation of the relationship between the content of Fe2+ and Mn2+ and the thermal expansion αV with the change of the average ion radius of MFM, MF, FM, MM.
The Grüneisen parameter is a constant related to the nonlinear vibration of the lattice, which can be used to characterize the temperature dependence of the volume expansion of crystals on the constant volume heat capacity. The derived isobaric mode Grüneisen parameter γi,P for each vibrational mode are plotted in Figure 6a. Compared with internal modes, external modes T and L are more significant. The equations of Fe2+ and Mn2+ contents and the mode Grüneisen parameters of modes T and L are listed in Supplementary Figure S5a. Contrary to the thermal expansion coefficient, Fe2+ and Mn2+ have opposite effects on the mode Grüneisen parameters of T and L modes. With the increase of iron content, the Grüneisen parameters decrease, and with the increase of manganese content, the Grüneisen parameters increase. Correspondingly, we determined the equation of the Grüneisen parameters related to Fe2+ and Mn2+ contents in T and L modes using multiple linear regression. Supplementary Figure S5a shows the difference between the measured and calculated Grüneisen parameters; all points with errors fall on the 1:1 line. In addition, this is also verified by the data plotted in the heat map of Supplementary Figure S5b,c, which show the distribution of the Grüneisen parameter value has a higher trend near the manganese end member while becoming lower near the iron end member.
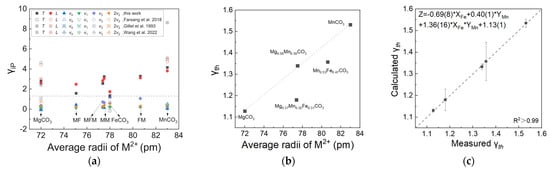
Figure 6.
(a) The mode Grüneisen parameters γi,P of each variational mode of MFM, MF, FM, MM, MgCO3, FeCO3, and MnCO3 in this work and literature. Data from Farsang et al., 2018, Gillet et al., 1993, and Wang et al., 2022 [6,8,29]. The values of the mode Grüneisen parameters γi,P of external lattice vibrations (T, L mode) are greater than the internal vibrations (below the grey dash line), except for the ν4 mode of FeCO3. (b) The thermal Grüneisen parameters with the change of the average ion radius of MFM, FM, MM, MgCO3, and MnCO3. (c) The equation of Fe2+ and Mn2+ contents and the thermal Grüneisen parameters.
The equation of Fe2+ and Mn2+ contents and thermodynamic Grüneisen parameters γth was established for a quantitative comparison. Since we cannot obtain a relatively high goodness of fit with only two parameters—the Fe2+ and Mn2+ contents used for fitting—three key indicators are used to measure the influence of iron content and manganese substitution, including iron content, manganese content, and the product of Fe2+ and Mn2+ contents used to characterize the influence of iron manganese interaction. The linear relationship of γth as a function of Fe2+ and Mn2+ contents is listed in Figure 6b as Zγth = −0.69(8) × XFe + 0.40(1) × YMn + 1.36(16) × XFe × YMn + 1.13(1). The goodness of fit R2 is greater than 99.7%, and the calculated and measured values fall on a 1:1 line (Figure 6c), which suggests a fairly good applicability. This indicates that the contribution of iron is greater, and the interaction between Fe2+ and Mn2+ cannot be ignored.
4. Conclusions
The thermodynamic Grüneisen parameters of (Mg, Fe, Mn)CO3 carbonates were determined via the thermal property measurements, including the thermal expansion coefficients and high-temperature Raman spectra. They indicate that the Fe2+ and Mn2+ substitutions in magnesite have a negative and positive contribution, respectively to the thermodynamic properties, whereas the coupling effects of Fe2+ and Mn2+ are mainly embodied in FM and MFM. These new combined results expand the previous knowledge of end member phases and thereby further offer new perspectives for carbon storage in the deep Earth. Likewise, the mode Grüneisen parameters of (Fe, Mn)− bearing magnesite could be strongly dependent on the solid solubility of Fe2+ and Mn2+. The Fe2+ and Mn2+ interaction effects from the coupling of the d electronic orbital in (Mg, Fe, Mn)CO3 carbonates might cause the abnormality of the high pressure properties. It is also worth conducting further research concerning these aspects.
Supplementary Materials
The following supporting information can be downloaded at: https://www.mdpi.com/article/10.3390/min13020207/s1, Figure S1: The backscattered electronic (BSE) image of single crystal thin sections of (a) (Mg0.37Mn0.32Fe0.31)CO3, (b) (Fe0.51Mg0.49)CO3, (c) (Mn0.53Fe0.47)CO3, and (d) (Mg0.50Mn0.50)CO3; Figure S2: Representative Raman spectra of (a) FeCO3, (b) MgCO3 and (c) MnCO3 at high temperature; Figure S3: Raman shifts of (Mg0.37Mn0.32Fe0.31)CO3, (Fe0.51Mg0.49)CO3, (Mn0.53Fe0.47)CO3, (Mg0.50Mn0.50)CO3, FeCO3, MgCO3 and MnCO3 of each mode with the change of average ion radii. Figure S4: The relationship between content of iron and manganese and the Raman shift of mode (a) T, (b) L and (c) 2v2 and the thermal diagram of iron and manganese on the Raman shift of mode (d) T, (e) L and (f) 2v2 at 300K. Figure S5: (a) The relationship between content of iron and manganese and the mode Grüneisen parameters of mode T and L. The effect of iron and manganese on the mode Grüneisen parameters of mode (b) T and (c) L. Table S1: Results of electron probe analysis of single crystal thin sections of Mg-Fe-Mn carbonates; Table S2: Single-crystal XRD parameters of (Mg0.37Mn0.32Fe0.31)CO3, (Fe0.51Mg0.49)CO3, (Mn0.53Fe0.47)CO3 and (Mg0.50Mn0.50)CO3 at varied temperatures.
Author Contributions
Conceptualization, L.L. and S.Q.; methodology, L.L., W.L. and H.S.; software, L.L. and X.B.; formal analysis, L.L. and X.B.; investigation, L.L.; data curation, L.L., X.B. and W.L.; writing—original draft preparation, L.L.; writing—review and editing, S.Q. and X.W.; supervision, S.Q.; funding acquisition, S.Q. All authors have read and agreed to the published version of the manuscript.
Funding
This research was funded by grants from the National Natural Science Foundation of China (NSFC) (42072047 and 41772034) to S. Qin and from the National Science Foundation for Young Scientists of China (41802044) to W. Liang.
Data Availability Statement
We have added our cif files in the supplementary material file.
Conflicts of Interest
The authors declare no conflict of interest.
References
- Alderton, D. Carbonates (Ca, Mg, Fe, Mn). In Reference Module in Earth Systems and Environmental Sciences; Elsevier: Amsterdam, The Netherlands, 2020; pp. 382–394. [Google Scholar] [CrossRef]
- Dasgupta, R.; Hirschmann, M.M. The deep carbon cycle and melting in Earth’s interior. Earth Planet. Sci. Lett. 2010, 298, 1–13. [Google Scholar] [CrossRef]
- Goldsmith, J.R.; Graf, D.L. Subsolidus Relations in the System CaCO3-MgCO3-MnCO3. J. Geol. 1960, 68, 324–335. [Google Scholar] [CrossRef]
- Palache, C.H.; Berman, H.; Frondel, H. Dana’s System of Mineralogy, 7th ed.; John Wiley & Sons: New York, NY, USA, 1951; Volume 2. [Google Scholar]
- Merlini, M.; Sapelli, F.; Fumagalli, P.; Gatta, G.D.; Lotti, P.; Tumiati, S.; Abdellatief, M.; Lausi, A.; Plaisier, J.; Hanfland, M.; et al. High-temperature and high-pressure behavior of carbonates in the ternary diagram CaCO3-MgCO3-FeCO3. Am. Miner. 2016, 101, 1423–1430. [Google Scholar] [CrossRef]
- Farsang, S.; Facq, S.; Redfern, S.A.T. Raman modes of carbonate minerals as pressure and temperature gauges up to 6 GPa and 500 degrees. Am. Miner. 2018, 103, 1988–1998. [Google Scholar] [CrossRef]
- Zhu, Y.; Li, Y.; Ding, H.; Lu, A.; Li, Y.; Wang, C. Multifactor-controlled mid-infrared spectral and emission characteristic of carbonate minerals (MCO3, M = Mg, Ca, Mn, Fe). Phys. Chem. Miner. 2021, 48, 15. [Google Scholar] [CrossRef]
- Wang, C.; Ren, L.; Walter, J.; Zhang, L.; Tao, R. In situ Raman vibrational spectra of siderite (FeCO3) and rhodochrosite (MnCO3) up to 47 GPa and 1100 K. Am. Miner. 2022. [Google Scholar] [CrossRef]
- Zhang, J.; Martinez, I.; Guyot, F.; Reeder, R.J. Effects of Mg-Fe2+ substitution in calcite-structure carbonates: Thermoelastic properties. Am. Miner. 1998, 83, 280–287. [Google Scholar] [CrossRef]
- Lavina, B.; Dera, P.; Downs, R.T.; Tschauner, O.; Yang, W.; Shebanova, O.; Shen, G. Effect of dilution on the spin pairing transition in rhombohedral carbonates. High Press. Res. 2010, 30, 224–229. [Google Scholar] [CrossRef]
- Spivak, A.; Solopova, N.; Cerantola, V.; Bykova, E.; Zakharchenko, E.; Dubrovinsky, L.; Litvin, Y. Raman study of MgCO3–FeCO3 carbonate solid solution at high pressures up to 55 GPa. Phys. Chem. Miner. 2014, 41, 633–638. [Google Scholar] [CrossRef]
- Chariton, S.; McCammon, C.; Vasiukov, D.M.; Stekiel, M.; Kantor, A.; Cerantola, V.; Kupenko, I.; Fedotenko, T.; Koemets, E.; Hanfland, M.; et al. Seismic detectability of carbonates in the deep Earth: A nuclear inelastic scattering study. Am. Miner. 2020, 105, 325–332. [Google Scholar] [CrossRef]
- Farfan, G.; Wang, S.; Ma, H.; Caracas, R.; Mao, W.L. Bonding and structural changes in siderite at high pressure. Am. Miner. 2012, 97, 1421–1426. [Google Scholar] [CrossRef]
- Farfan, G.; Boulard, E.; Wang, S.B.; Mao, W.L. Bonding and electronic changes in rhodochrosite at high pressure. Am. Miner. 2013, 98, 1817–1823. [Google Scholar] [CrossRef]
- Boulard, E.; Gloter, A.; Blanchard, M.; Mao, W.L. Pressure induced phase transition in MnCO3 and its implications on the deep carbon cycle: High Pressure Phase Transition in MnCO3. J. Geophys Res. Solid Earth 2015, 120, 4069–4079. [Google Scholar] [CrossRef]
- Hsu, H.; Huang, S.C. Spin crossover and hyperfine interactions of iron in (Mg, Fe)CO3 ferromagnesite. Phys. Rev. B 2016, 94, 060404. [Google Scholar] [CrossRef]
- Liu, J.; Fu, S.; Lin, J.F. Spin transition of iron in deep-mantle ferromagnesite. In Carbon in Earth’s Interior; American Geophysical Union: Washington, DC, USA, 2020. [Google Scholar] [CrossRef]
- Lobanov, S.S.; Goncharov, A.F. Pressure-induced sp2-sp3 transitions in carbon-bearing phases. In Carbon in Earth’s Interior; American Geophysical Union: Washington, DC, USA, 2020. [Google Scholar] [CrossRef]
- Liang, W.; Li, L.; Li, R.; Yin, Y.; Li, Z.M.; Liu, X.; Shan, S.; He, Y.; Meng, Y.; Li, Z.; et al. Crystal structure of impurity-free rhodochrosite (MnCO3) and thermal expansion properties. Phys. Chem. Miner. 2020, 45, 831–842. [Google Scholar] [CrossRef]
- Rosenberg, P.E. Synthetic solid solutions in the systems MgCO3-FeCO3 and MnCO3-FeCO3. Am. Miner. 1963, 48, 1396–1400. [Google Scholar]
- Goldsmith, J.R.; Graf, D.L.; Witters, J.; Northrop, D.A. Studies in the system CaCO3–MgCO3–FeCO3. J. Geol. 1962, 70, 659–688. [Google Scholar] [CrossRef]
- Lin, J.F.; Liu, J.; Jacobs, C.; Prakapenka, V.B. Vibrational and elastic properties of ferromagnesite across the electronic spin-pairing transition of iron. Am. Miner. 2012, 97, 583–591. [Google Scholar] [CrossRef]
- Liu, J.; Lin, J.F.; Mao, Z.; Prakapenka, V.B. Thermal equation of state and spin transition of magnesiosiderite at high pressure and temperature. Am. Miner. 2014, 99, 84–93. [Google Scholar] [CrossRef]
- Liang, W.; Li, Z.M.; Yin, Y.; Li, R.; Chen, L.; He, Y.; Dong, H.N.; Dai, L.D.; Li, H.P. Single crystal growth, characterization and high-pressure Raman spectroscopy of impurity-free magnesite (MgCO3). Phys. Chem. Miner. 2018, 45, 423–434. [Google Scholar] [CrossRef]
- Balarew, C.; Markov, L.; Petrov, K. On the crystal structure stability of calcite-type carbonates. Cryst. Res. Technol. 1985, 20, 1079–1084. [Google Scholar] [CrossRef]
- Effenberger, H.; Mereiter, K.; Zemann, J. Crystal structure refinements of magnesite, calcite, rhodochrosite, siderite, smithonite, and dolomite, with discussion of some aspects of the stereochemistry of calcite type carbonates. Z. Für Krist. Cryst. Mater. 1981, 156, 233–243. [Google Scholar] [CrossRef]
- Kyono, A.; Gramsch, S.A.; Yamanaka, T.; Ikuta, D.; Ahart, M.; Mysen, B.O.; Mao, H.K.; Hemley, R.J. The influence of the Jahn–Teller effect at Fe2+ on the structure of chromite at high pressure. Phys. Chem. Miner. 2012, 39, 131–141. [Google Scholar] [CrossRef]
- Markgraf, S.A.; Reeder, R.J. High-temperature structure refinements of calcite and magnesite. Am. Miner. 1985, 70, 590–600. [Google Scholar]
- Rutt, H.N.; Nicola, J.H. Raman spectra of carbonates of calcite structure. J. Phys. C Solid State Phys. 1974, 7, 4522–4528. [Google Scholar] [CrossRef]
- Gillet, P.; Biellmann, C.; Reynard, B.; Paul, M.M. Raman spectroscopic studies of carbonates part I: High-pressure and high-temperature behaviour of calcite, magnesite, dolomite and aragonite. Phys. Chem. Miner. 1993, 20, 1–18. [Google Scholar] [CrossRef]
- Gillet, P.; Guyot, F.; Malezieux, J. High-pressure and high-temperature Raman spectroscopy of Ca2GeO4: Some insights on anharmonicity. Phys. Earth Planet. Inter. 1989, 58, 141–154. [Google Scholar] [CrossRef]
- Zhang, J.; Martinez, I.; Guyot, F.; Gillet, P.; Saxena, S.K. X-ray diffraction study of magnesite at high pressure and high temperature. Phys. Chem. Miner. 1997, 24, 122–130. [Google Scholar] [CrossRef]
- Krishna Rao, K.V.; Satyanaryana Murthy, K. Thermal expansion of manganese carbonate. J. Mater. Sci. 1970, 5, 82–83. [Google Scholar] [CrossRef]
- Williams, Q.; Collerson, B.; Knittle, E. Vibrational spectra of magnesite (MgCO3) and calcite-III at high pressures. Am. Miner. 1992, 77, 1158–1165. [Google Scholar] [CrossRef]
- Megaw, H.D. Crystal structures and thermal expansion. Mater. Res. Bull. 1971, 6, 1007–1018. [Google Scholar] [CrossRef]


Disclaimer/Publisher’s Note: The statements, opinions and data contained in all publications are solely those of the individual author(s) and contributor(s) and not of MDPI and/or the editor(s). MDPI and/or the editor(s) disclaim responsibility for any injury to people or property resulting from any ideas, methods, instructions or products referred to in the content. |
© 2023 by the authors. Licensee MDPI, Basel, Switzerland. This article is an open access article distributed under the terms and conditions of the Creative Commons Attribution (CC BY) license (https://creativecommons.org/licenses/by/4.0/).