Abstract
Mineral segmentation is an equally important and difficult task in the quantification of mineral composition. Difficulties come from the process of determining boundaries of distinctive mineral grains necessary for further analysis and mineral identification. Done by hand, the task is very time-consuming and higher accuracies are burdened with the possible human fatigue factor. The presented method is a fully automated solution to the problem that uses a superpixel approach and feature-based merging. The method is validated by comparison with the manual approach. Analyzed data consist of photos taken by a Nikon Eclipse LV100N POL polarizing microscope at 200× magnification, in transmitted light, with crossed polarizers. Images are first prepared by Gaussian filter and meanshift operations, then the initial segmentation is provided by the superpixel algorithm. Oversegmentation is resolved by feature-based merging. The last step consists of counting the individual grain boundaries and preparing the results as easily readable visual data.
1. Introduction
The process of mineral recognition and classification is of high importance to mineralogical research. The classification of rocks is performed during laboratory study, after extraction from the earth depth or being described in a rock outcrop. The identification of the distinctive minerals making up the rock is based on a set of possible features: size, shape, arrangement in the space, and intrinsic properties, such as refractive index, birefringence, cleavage, and twins. Such a task is important in many fields: petrology, deposit geology, rock mechanics, mining engineering, construction, and material engineering, see [1,2,3,4,5].
1.1. Mineral Analysis
Optical properties of minerals make the identification possible due to the visibility of distinctive minerals and therefore already mentioned size, shape, and distribution of their components. To estimate the quantitative composition of the rock by optical microscopy, it is important to accurately determine the boundaries between all components of the rock [6,7]. Sandstones are composed of mineral grains and rock fragments, which form the so-called framework grain of the rock. The free spaces between the grains of the framework are filled to varying degrees by a mass of the so-called matrix and cement [8]. The matrix is made up of detrital components, mainly clay minerals and fine grains of quartz and feldspar under 30 mm in diameter. Due to their size, individual matrix components are often difficult to identify under an optical microscope.
The cement is chemically precipitated in empty spaces in the rock and binds the sandstone grains together, but not all the spaces are always filled, so sandstones usually show porosity. During this process, the surfaces of the grains are often partially etched by the cement and become uneven [9]. The presence of matrix, cement, and rock pores in the intergranular spaces and partially over-digested framework grains with indistinct boundaries is a common feature of sandstones [10]. This often causes, in contrast to magmatic rocks and high-grade metamorphic rocks, difficulties in determining the exact boundaries between individual rock components by optical microscopy. This negatively affects the quantitative composition determinations of sandstones.
In geology, it is important to know the porosity and open porosity as these determine the flow of fluids through the rock medium. Thus, the importance of reservoir parameters of rocks and their characterization in sandstone layers where water, oil, and gas accumulate [11,12].
A quantitative analysis of porosity can be performed with an optical microscope by creating a set (more than a dozen) of thin section samples. The composition expressed in percentages by volume is then measured (usually) by manual counting of points, with one of the specified methods: planimetric, linear, or point.
In the point counting method, the image is covered in a planimetric grid of points that cover the entire surface of the prepared thin section. These points are then counted separately inside each of the previously identified elements. In the case of sandstones, these are framework grains, matrix and cement, and pore space (Figure 1a). Individual elements are identified using microscopic methods. The boundaries between them are hand drawn (Figure 1b) and a number is given to identify the components (Figure 1c). The percentage share of individual areas is calculated after hand-drawing the boundaries between them. This non-automated method is a very time-consuming process. Based on the complexity of the rock structure and density of the measurement grid, it can take approximately 3 to 8 h of manual work. The smaller-sized the mineral grains in a rock thin section image, the higher the density of the grid necessary to obtain correct results. In the case of bigger grains size, grid density (and therefore time) can be reduced with the downside of lesser accuracy.

Figure 1.
(a) Photograph of a part of a thin section of sandstone under an optical microscope, under transmitted light with crossed polarizers, (b) thin section with drawn-by-hand borders of individual elements, (c) thin section with the numbered components for which the area will be counted.
The mineral composition is another element used in the rock reservoir mineral description. Individual minerals, their forms of occurrence, inclusions, and boundaries between mineral grains are identified [13,14]. The disintegration of the primary rocks into smaller particles is a result of weathering and erosion, which is later transported to the sites of final sedimentation.
1.2. Device-Based Methods
Qualitative and quantitative analyses of the minerals form the base for basic rock classification. Standard analysis is complemented by a range of different, more advanced techniques that might require the presence of specialized personnel. Among these, we can mention electron microscopy (SEM, scanning electron microscopy; TEM, transmission electron microscopy), microarea chemical analysis (EPMA, electron probe microanalyzer; SEM-EDS, SEM with energy-dispersive X-ray spectroscopy), and X-ray diffraction (XRD) [15].
SEM is one of the most extensively researched methods that find application in geo and material sciences. More commonly used in practice, SEM-AM (scanning electron microscopy-based automated mineralogy) can be described as a combination of hardware platform, processing software, and image analysis algorithms. The image analysis component of this system is based on the assesment of the backscattered electron image [16]. Examples of its possible application can be seen in [17], where mineralogy was quantified with the use of SEM meaning generating fast and automated profiling of soil samples in huge quantities, that later allow us to determine if the sample indicates an unnatural origin.
SEM is often combined with energy-dispersive X-ray spectrometry (EDS), which allows for high-resolution measurement and, thanks to the very comprehensive data, can be supported with a variety of clustering algorithms, such as in [18]. Simultaneously with the applications, are developed solutions to the problems existing internally to the method. An example can be seen in [19], where the authors propose a multilayered approach to make SAM-EDS available for investigation of submicrometer-sized grains. Additionally, due to the increasing amount of obtainable data, there is an increased importance in studying the associated statistical topics. The importance of uncertainties in quantitative mineralogy and the approach towards a reduction of the statistical errors is discussed in [20]. Authors based the research on a case of study of the Bolcana Au-Cu porphyry deposit in the South Apuseni Mountains in Romania.
1.3. Image Analysis-Based Methods
To obtain fast and repeatable results in a large number of experiments, manual parts of the process are consistently replaced with more automatic approaches. The counting of points is supported by mechanical measuring devices and more advanced methods based on computer analysis [15].
The problem of segmentation in image analysis can be approached in different ways. The first important distinction is whether neural networks (NN) were used. Methods that do not rely on NN usually focus on feature extraction such as color edge detection or gradient filtering [21,22]. In [23], the authors proposed an ore image segmentation algorithm based on a histogram accumulation moment. In [24], authors proposed froth segmentation based on implementing an improved Harris corner detection algorithm, after which the images are segmented by automatically choosing the corresponding parameters for identifying bubble edge points through extracting the local gray value minima.
Some of the image processing methods suitable for mineral segmentation should also be mentioned, such as image segmentation through the MATLAB environment. These methods can be divided into several categories: treshold-based segmentation, edge-based segmentation, watershed segmentation, and region-based segmentation [25]. The effectiveness of the individual methods is often determined by its application. As an example, watershed segmentation is especially useful for dividing objects that are in contact with each other, while simple edge-based segmentation would provide comparable, but much faster results in less complicated tasks. At the same time, all the mentioned methods have significantly less accuracy in comparison to the methods supported by machine learning.
Machine learning, especially in the form of neural networks, is currently the most popular method of solving any segmentation task due to its easy implementation and high performance. At the same time, solutions based on neural networks are very task specific and often need a significant number of available training data. Some possible approaches consist of using convolutional neural networks [26,27,28,29] and superpixels [30,31].
In this article, we present a method for fully automatic grain border recognition of a sandstone thin section. The method is based on the application of superpixels. Meanshift operations were used as initial image preparation with color and histogram-based merging of superpixels before the final steps. The end result consists of a set of contours each with a calculated percentage of the whole image area.
2. Experiment Description
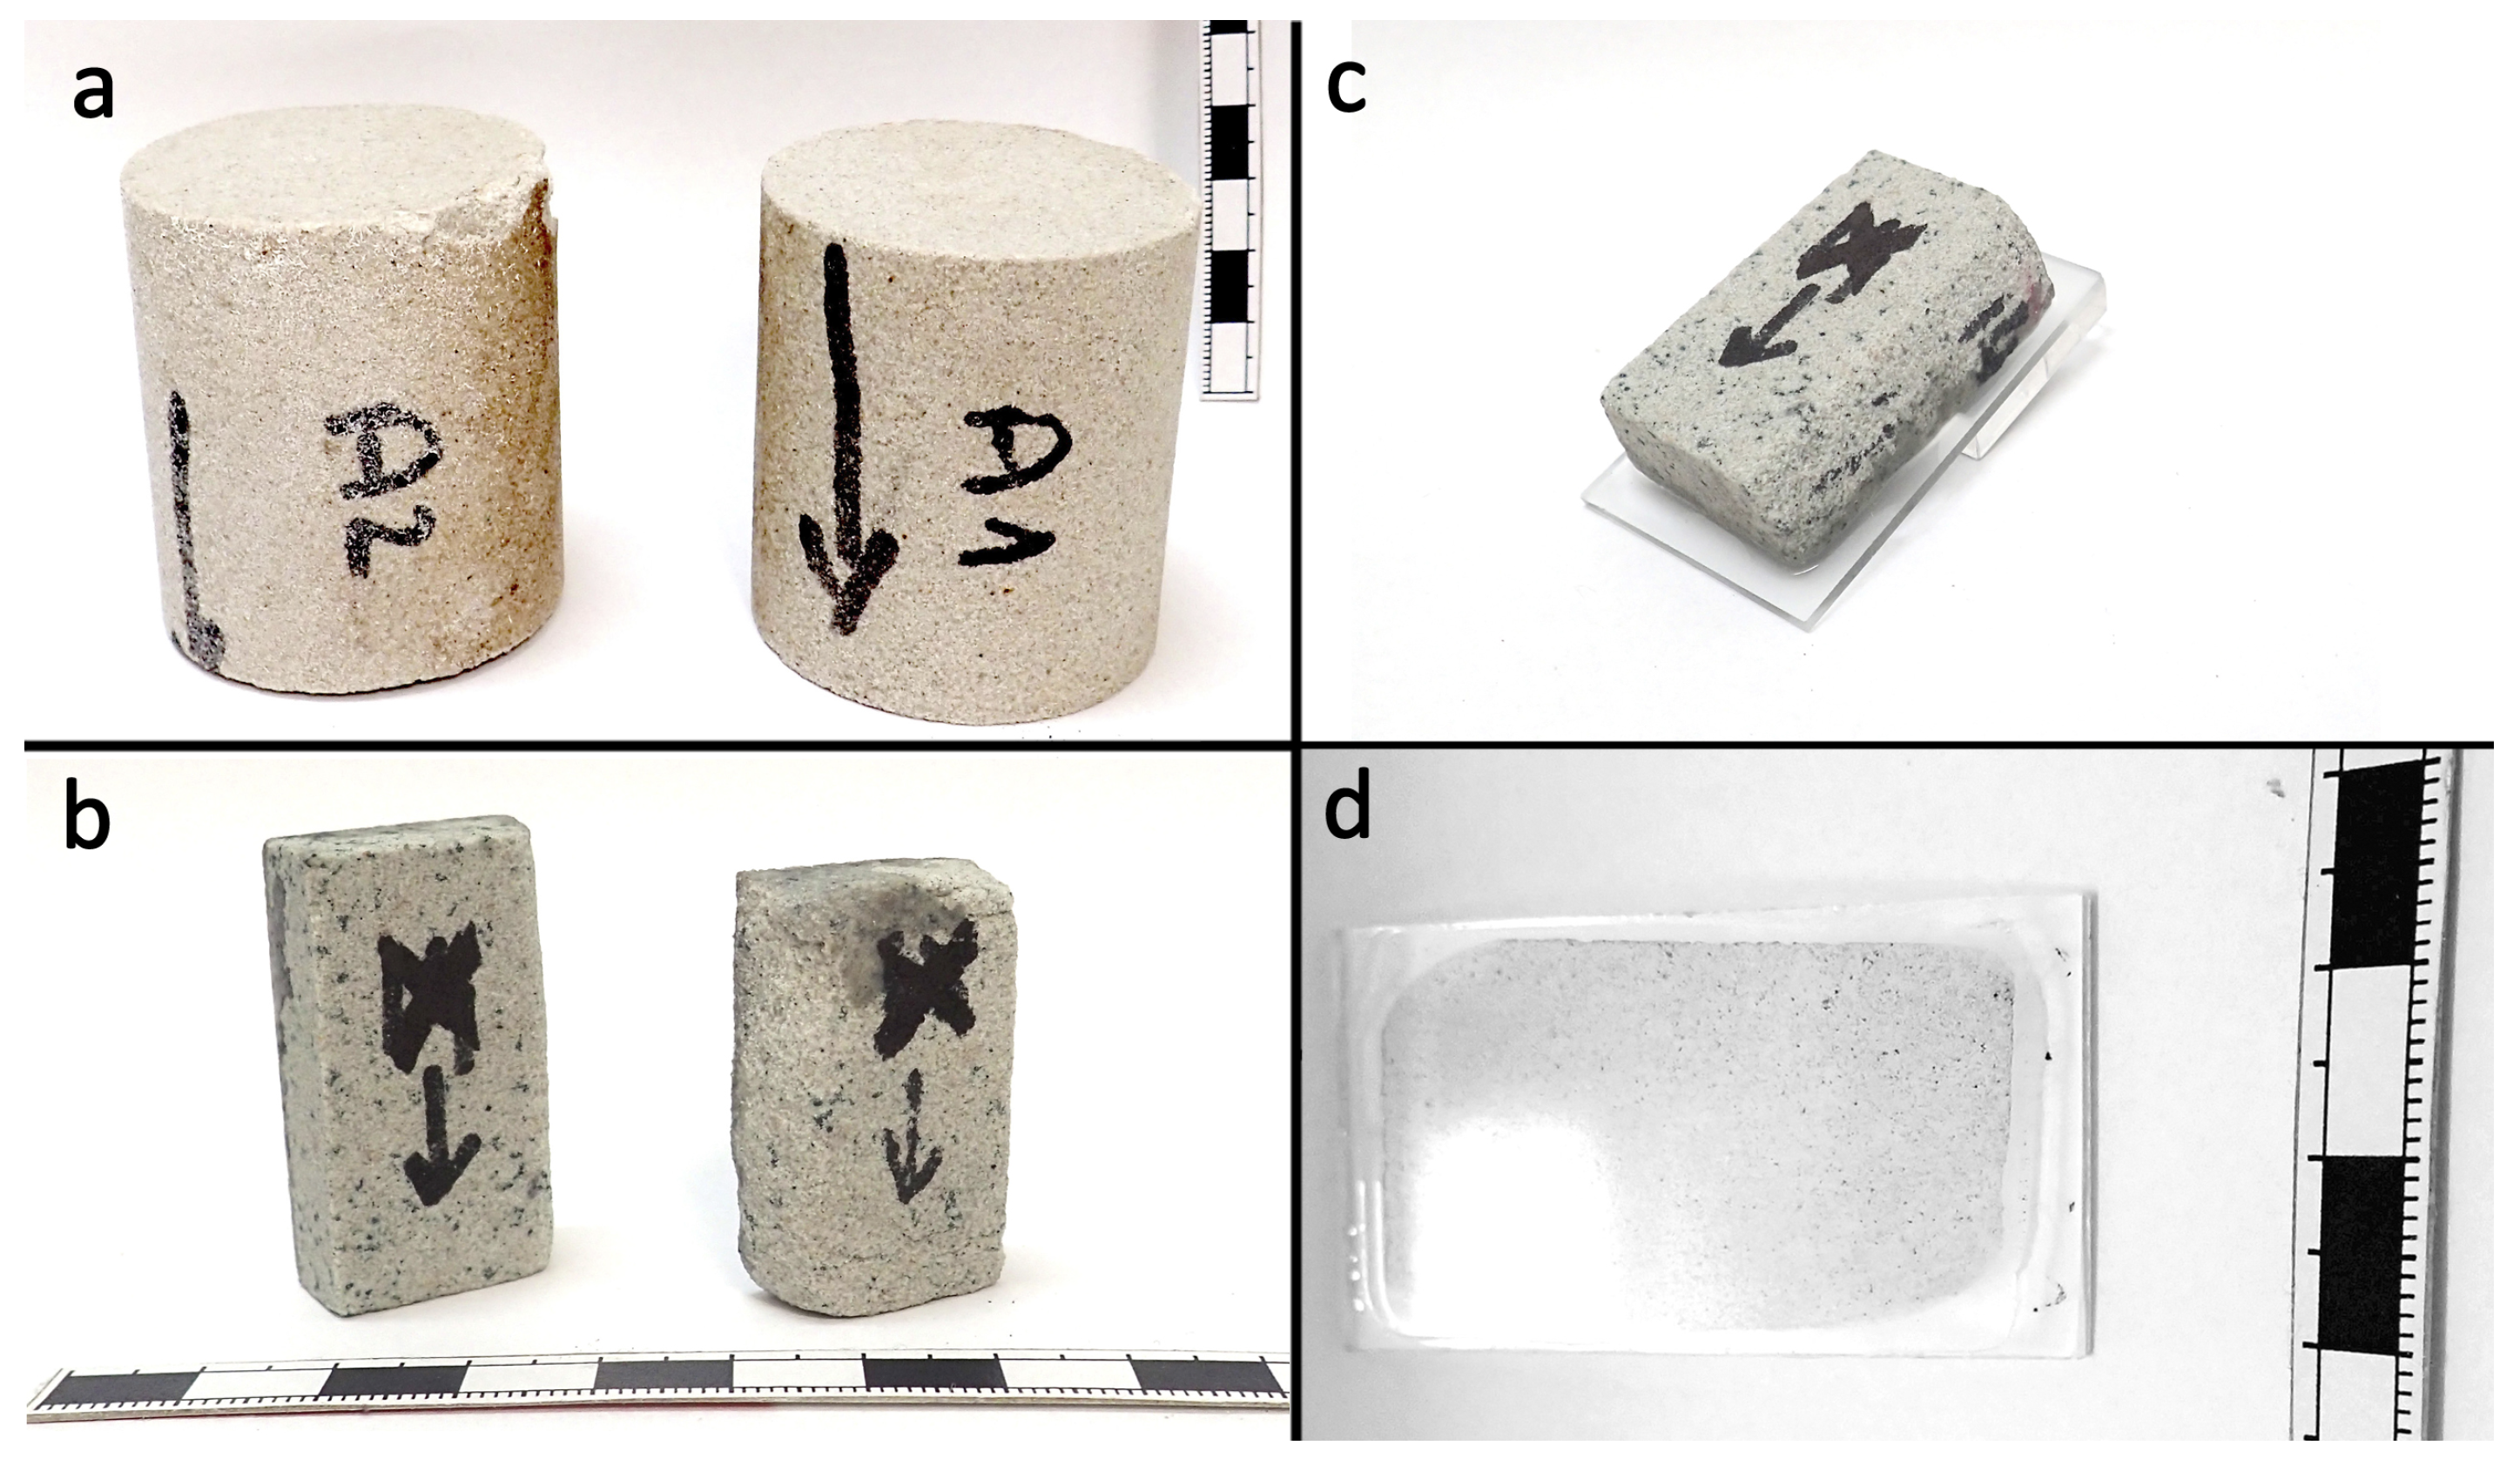
Research begins with the preparation of a thin section from the collected sandstone sample. This process consisted of a few consecutive steps: A small cuboid-shaped chip of sandstone rock was cut from a drill core (Figure 2a,b) and then a thin slice of rock was cut using a diamond saw to fit onto a standard petrographic microscope slide (28 × 48 mm). This slice of the rock was glued to the glass slide using epoxy (Figure 2c) and ground until it was optically flat using progressively finer abrasive grit. This means that light passes through the slice of rock sliver of material. The standard thickness for a thin section in an optical microscope study is 30 microns. Finally (Figure 2d), a coverslip was glued onto the surface of the thin section when only optical microscope studies were planned. On the other hand, if further chemical analysis of minerals was planned, the final step was polishing the surface of the grind with diamond pastes until the surface was smooth, flat, and free of deformation and scratches, which is bright, shiny, and has a mirror-like appearance with sharp edges and good distinction between mineral grains. When observing a sandstone thin section in an optical microscope under polarized light, optical features of minerals, including pleochroism, light extinction, cleavage, and interference colors are visible. Because individual minerals vary in their optical properties, most rock-forming minerals can be easily identified by polarized light in optical microscopy.
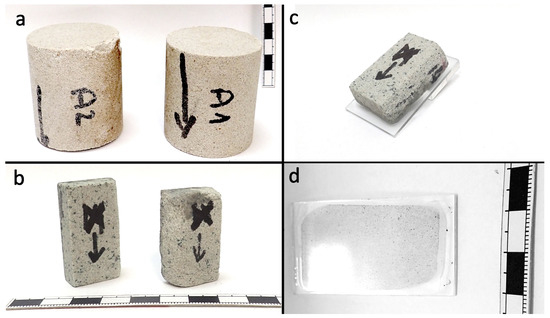
Figure 2.
Steps in preparation of rock (sandstone) thin section. (a) Samples of a drill core, (b) cuboid-shaped chips of rock, (c) smaller slice of rock in a cuboid shape mounted in a glass-slide, (d) final sandstone thin section.
Photos of a sandstone thin section were taken using a Nikon Eclipse LV100N POL polarizing microscope (Nikon Corporation, Tokyo, Japan), at 200× magnification in transmitted light with crossed polarizers. All of the rock-forming minerals were identified.
Then, to determine the borders of distinctive grains, the fully automated algorithm described in the next section was applied.
3. Methodology
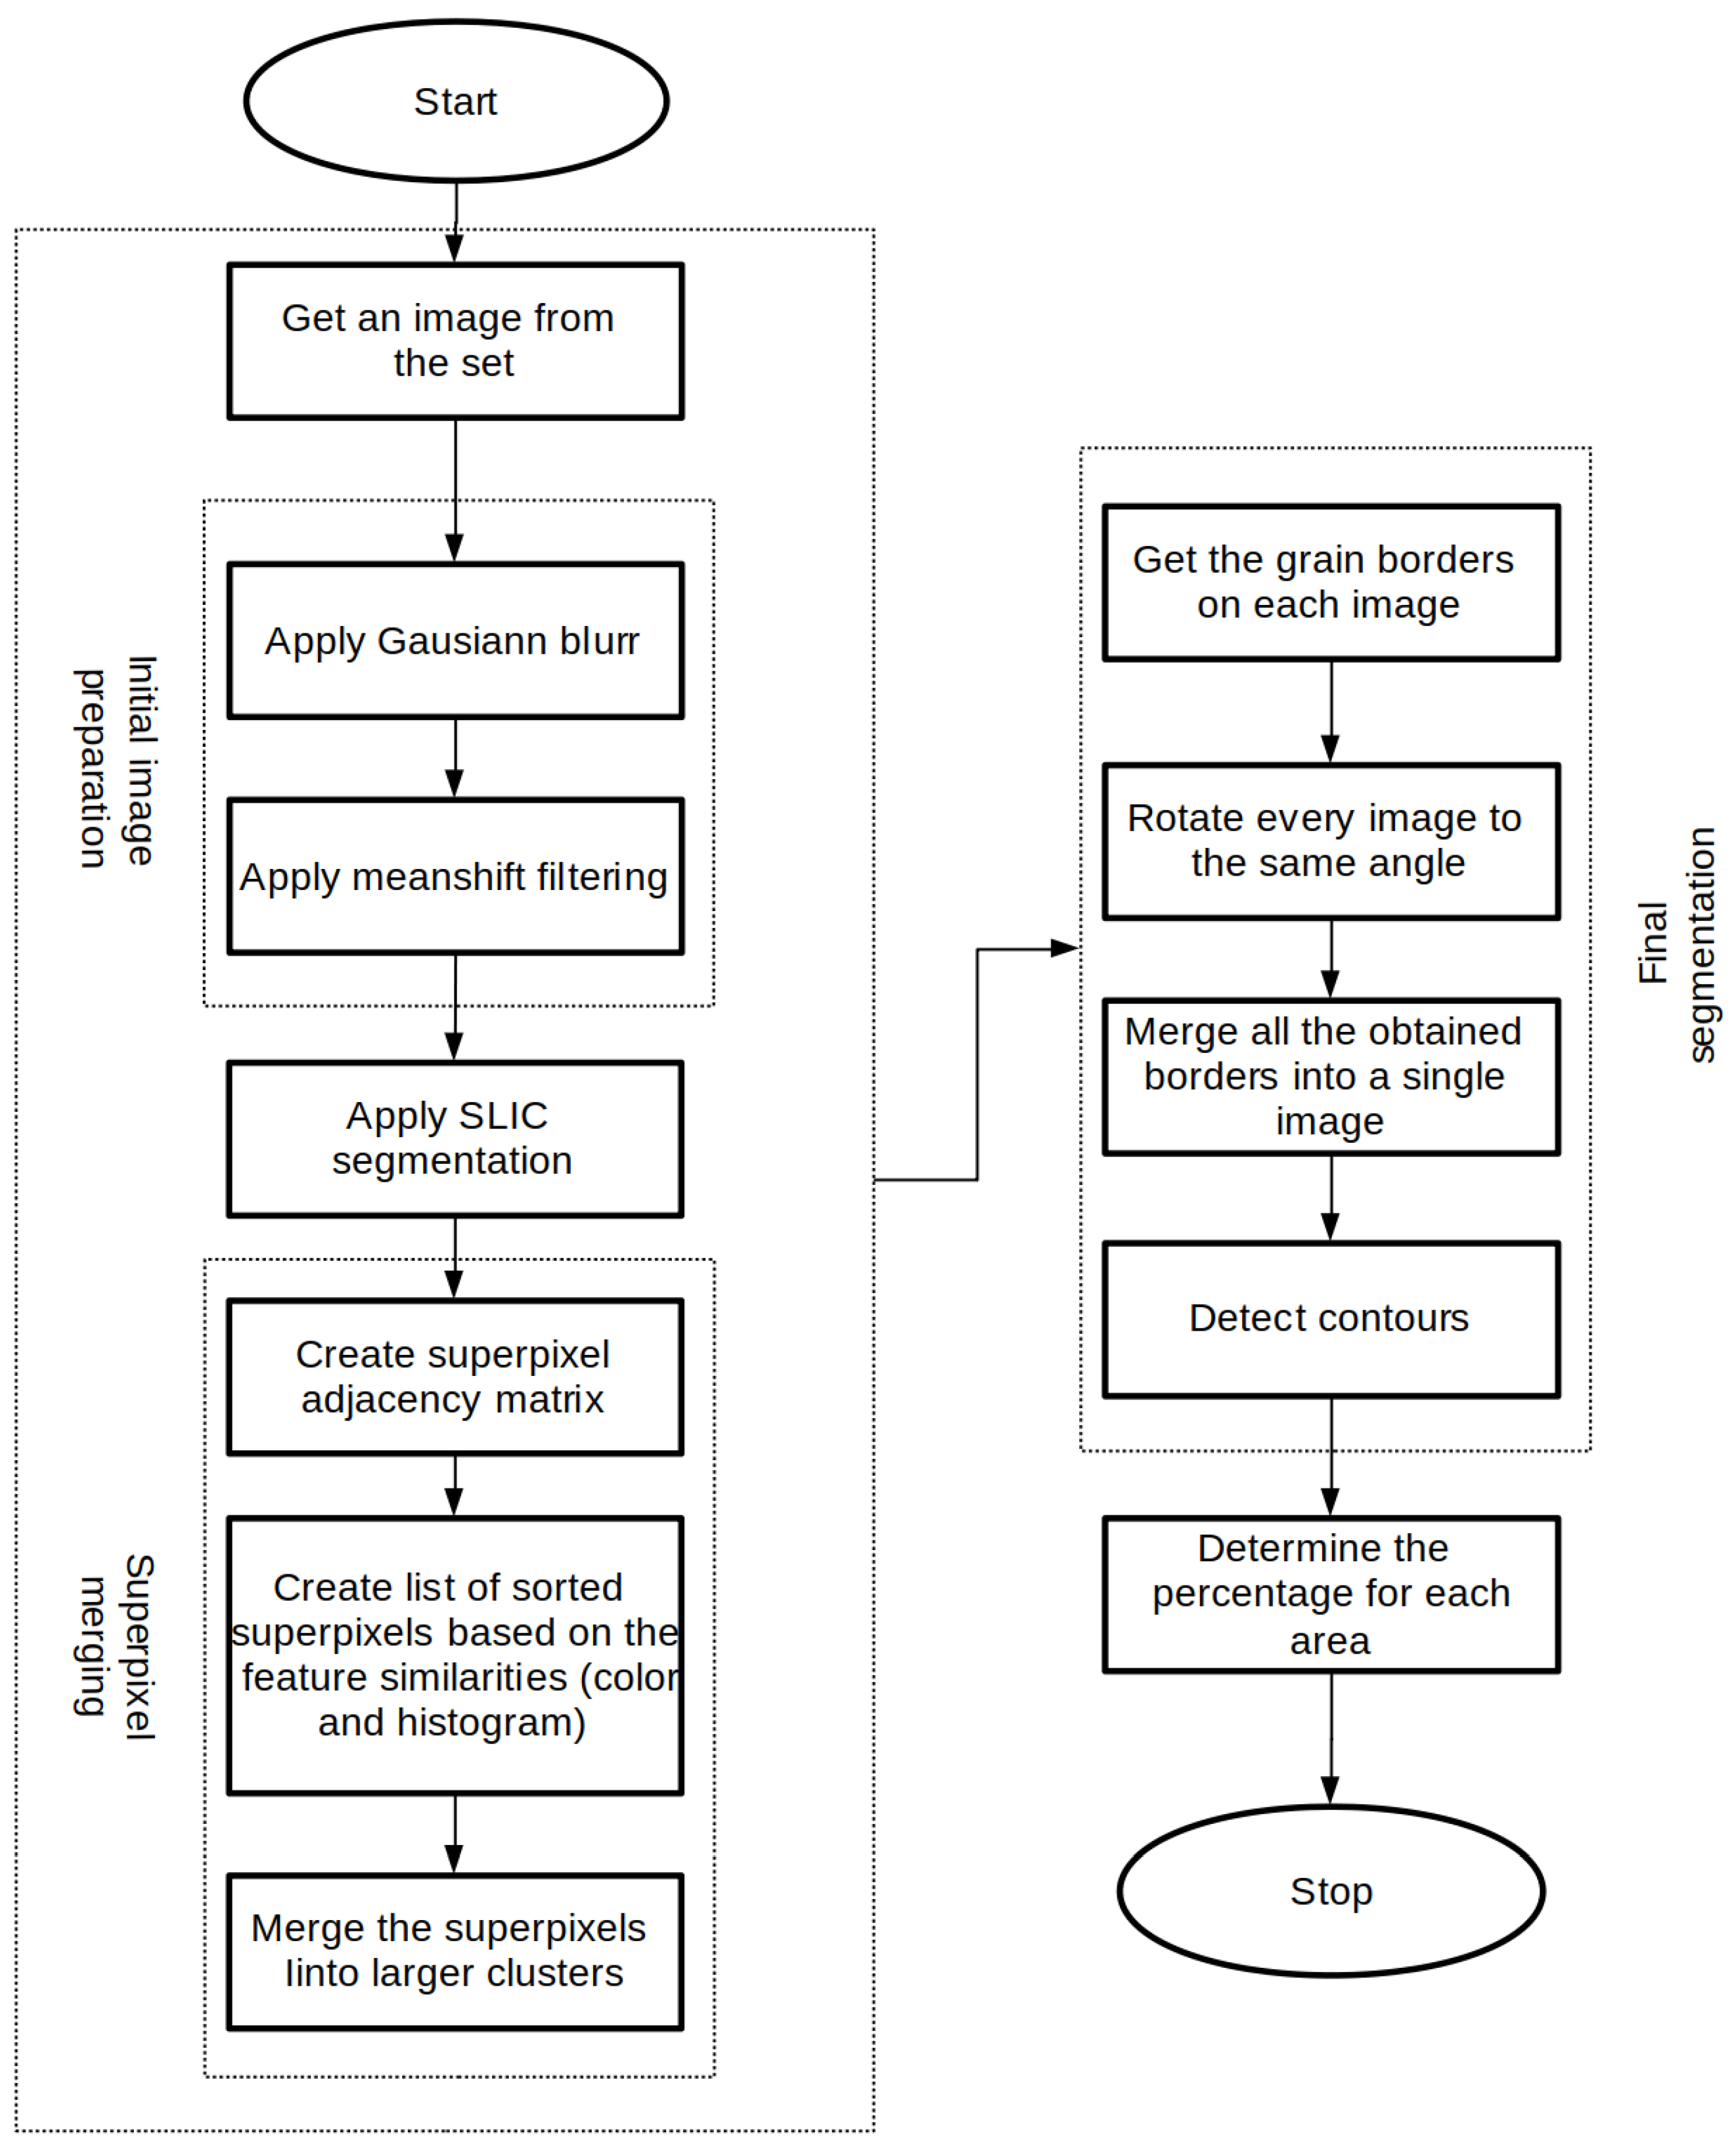
The presented methodology is best described by dividing into four sections: initial image preparation, implementation of SLIC (simple linear iterative clustering) algorithm, superpixel merging, and detection of the final borders with area calculation afterward. Consecutive steps of the presented algorithm can be seen in Figure 3.
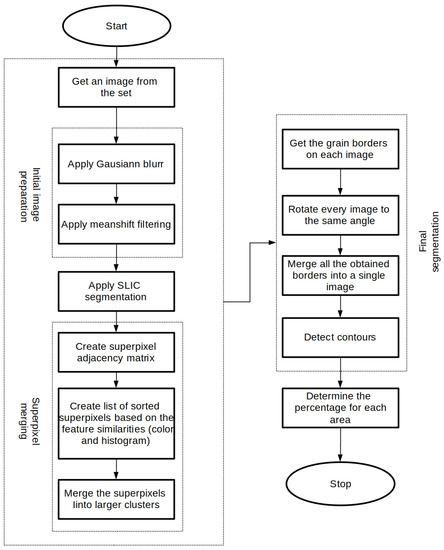
Figure 3.
Flow-chart of the algorithm.
3.1. Initial Image Preparation
To obtain the best possible results, some initial operations had to be conducted. First, an image was blurred by a Gaussian filter with a small kernel size. Then, the image was filtered with color gradients and texture flattened by using the meanshift iterations on every pixel (x, y). The pixel neighborhood (X, Y) in the joint space–color hyperspace is considered:
where sp is the spatial window radius, sr is the color window radius, (R, G, B) and (r, g, b) are the vectors of color components at (X, Y) and (x, y). Over the neighborhood, the average spatial value and average color vector were found and act as the neighborhood center on the next iteration.
After the iterations, the color components of the initial pixel (that is, the pixel from where the iterations started) were set to the final value (average color at the last iteration):
Although it is a time-consuming process, the described filtering is helpful in regard to removing the small particle influence during later steps of the algorithm together with creating sharper boundaries on the color region edges.
3.2. Superpixel Implementation
Superpixels can be described as a collection of points (pixels) that represent a unified region of the image. They are defined by a set of features, including Gestalt cues of contour, texture, brightness, and good continuation [32].
SLIC is one of many algorithms designed to create superpixels, which can be described as adaptation of k-means for superpixel generation [33].
The SLIC algorithm is widely used in tasks of visual recognition, with examples such as tracking [34,35], prostate segmentation on magnetic resonance images [36], diseased leaf segmentation, and recognition [37].
The SLIC implementation in the algorithm presented in this paper is used for segmentation purposes. Its task is to create initial borders on the edges of the mineral grains, while creating regions with similar properties that can be further modified or merged with each other, based on the features described in Section 3.3.
The basic parameter of the SLIC algorithm can be either the number of superpixels with relatively similar or the same sizes, as they directly describe the same property of the region and can be deduced alternately.
The clustering procedure begins with an initialization step where k initial cluster centers are sampled on a regular grid spaced S pixels apart. The grid interval can be described as:
with N being the overall number of pixels in the image. The centers are moved to seed locations corresponding to the lowest gradient position in a defined neighborhood. Then, SLIC computes distances from each cluster center to pixels within a 2S × 2S region. Once each pixel has been associated with the nearest cluster center, an update step adjusts the cluster centers to the mean vector of all the pixels belonging to the cluster.
To represent the position of the clusters, the distance between the pixel and cluster center must be measured, in both the spatial and color spaces.
where l, a, b are parameters of CIELAB color space, and x, y represent the coordinates of spatial position.
Then, after simplification, the maximum distance between the pixel members of the cluster can be described by:
where S stands for spatial sampling interval, m represents a fixed constant of maximum color distance, dc and ds are understood, respectively, as normalized color and spatial proximity.
The final step of the SLIC algorithm consists of assigning the label of a nearest cluster to the pixels that did not fit anywhere during the segmentation process. The end result of the algorithm comes in the form of an oversegmented image that needs further processing.
3.3. Superpixel Merging
To merge the superpixels into larger clusters resembling the exact borders of the distinctive objects (different minerals in the case of this paper), some properties must be obtained. Adjacency is the first, as it allows for a reduction of computational time by extracting and comparing only the data from the superpixels that have common borders.
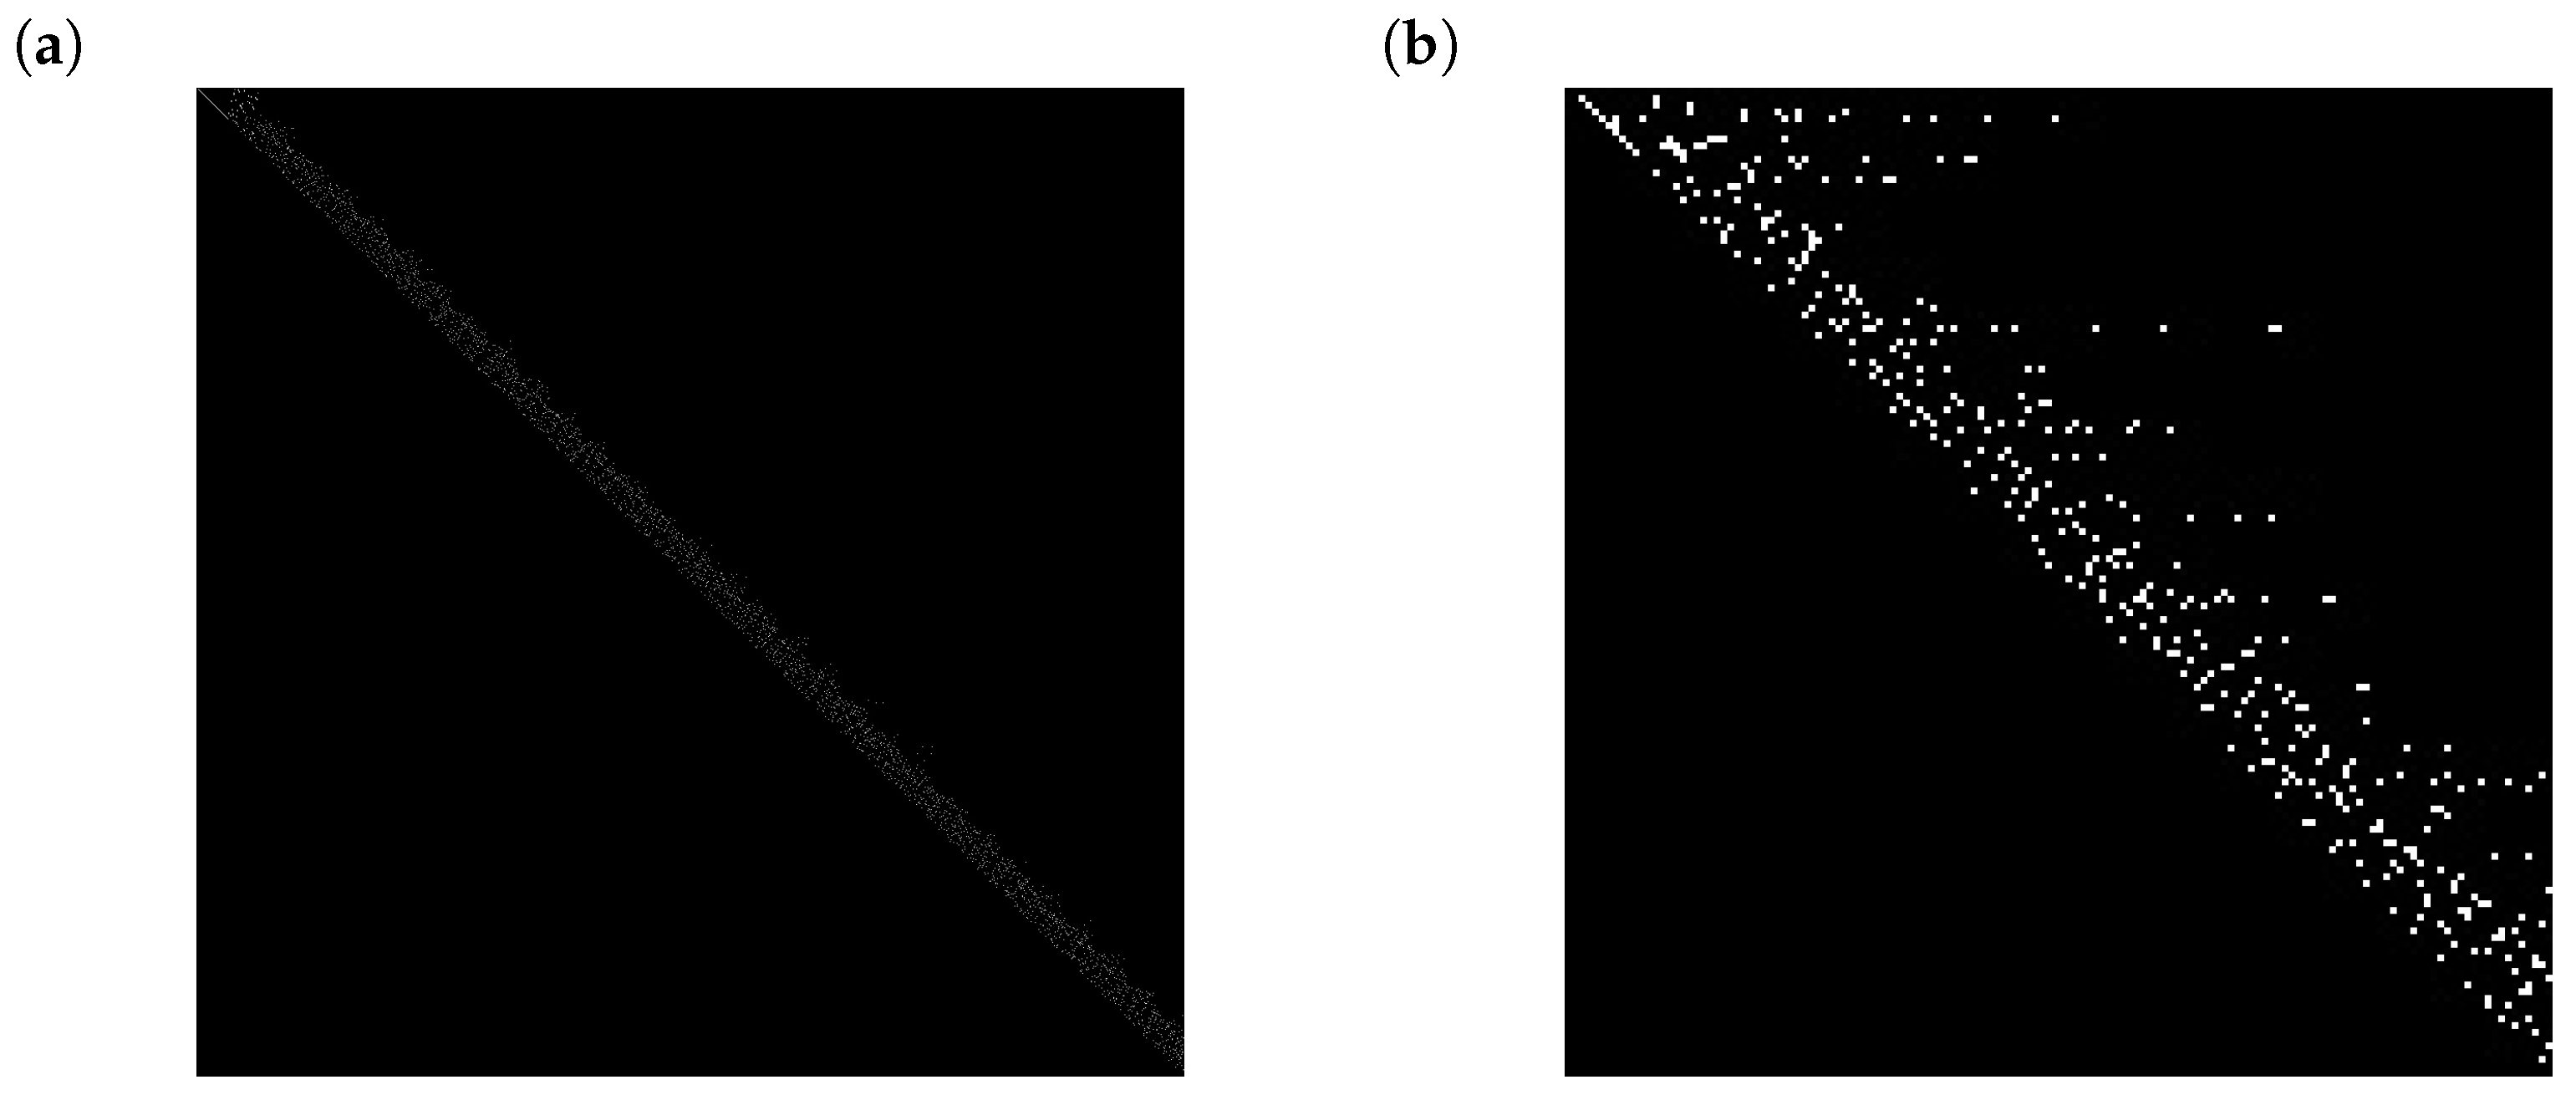
To determine the superpixels adjacency, a simple algorithm was used. First, one superpixel from each possible pair was dilated with the use of the smallest kernel. Then, the superpixels in the checked pair are compared bitwise. With enough overlapping pixels inside the masks, the pair is written into an adjacency matrix with a non-zero value.
The matrix size is determined by the number of generated superpixels and can be written as N × N, where each coordinate stands for a separate pair of pixels. Only half of the matrix is filled and taken into consideration in later steps since the other half is mirrored with the same superpixels paired in reverse order.
In the next step, determined by the pair of superpixels, two separate features are compared: mean color value and color histogram. Only one of the two needs to check positively for the superpixels to be merged.
The mean color value is determined based on the mean value of each HSV (hue, saturation, value)channel thresholded separately instead of thresholding its values compressed into single-channel grayscale. This way, saturation can be given a bigger window of acceptable difference. A similar approach was taken in the case of the histograms. For the comparison metric, a correlation described by the below equation was used.
where N is the number of histogram bins.
Histograms were created with three dimensions, each one based on the HSV image ranges (hue {0–180}, value and saturation {0–255}), and 15 bins each (except the hue that was given 10 bins). Bins can be understood as a subdivision that decide the separation thresholds inside a defined range.
Labeled superpixels that were identified as having similiar properties were merged afterwards by pushing them into a set of vectors with their numerical identifiers. Each superpixel from the vector was then printed on the grayscale matrix with edge identification afterwards. That result was stored on a separate matrix with other contours added by each consecutive vector of IDs. At the end of the process, the matrix of all detected mineral borders was obtained.
3.4. Area Detection and Calculation
The last step consists of simply detecting and calculating distinctive areas. Before contour detection, a simple morphological closing was performed to eliminate potential holes in the edges detected in previous steps. The found contour topologies were stored in another set of vectors storing the hierarchy and points. Based on the information about the number of points inside each contour, their percentage share of the image area can be easily calculated and printed afterward over the original image. The centers of each contour (necessary to display the results in a readable way) are based on the calculation of contour moments. This way each label, together with the percentage value, is displayed inside the described area and can be easily used for later comparisons. This information can be easily obtained (and therefore integrated into) during the superpixel merging step of the algorithm, but the presented approach allows for better control over the data.
4. Results
To maintain clarity of the consecutive steps, only four images from the set are presented with the step-by-step algorithm, with the last step of the algorithm compiling the results of the grain borders information gained from the whole set.
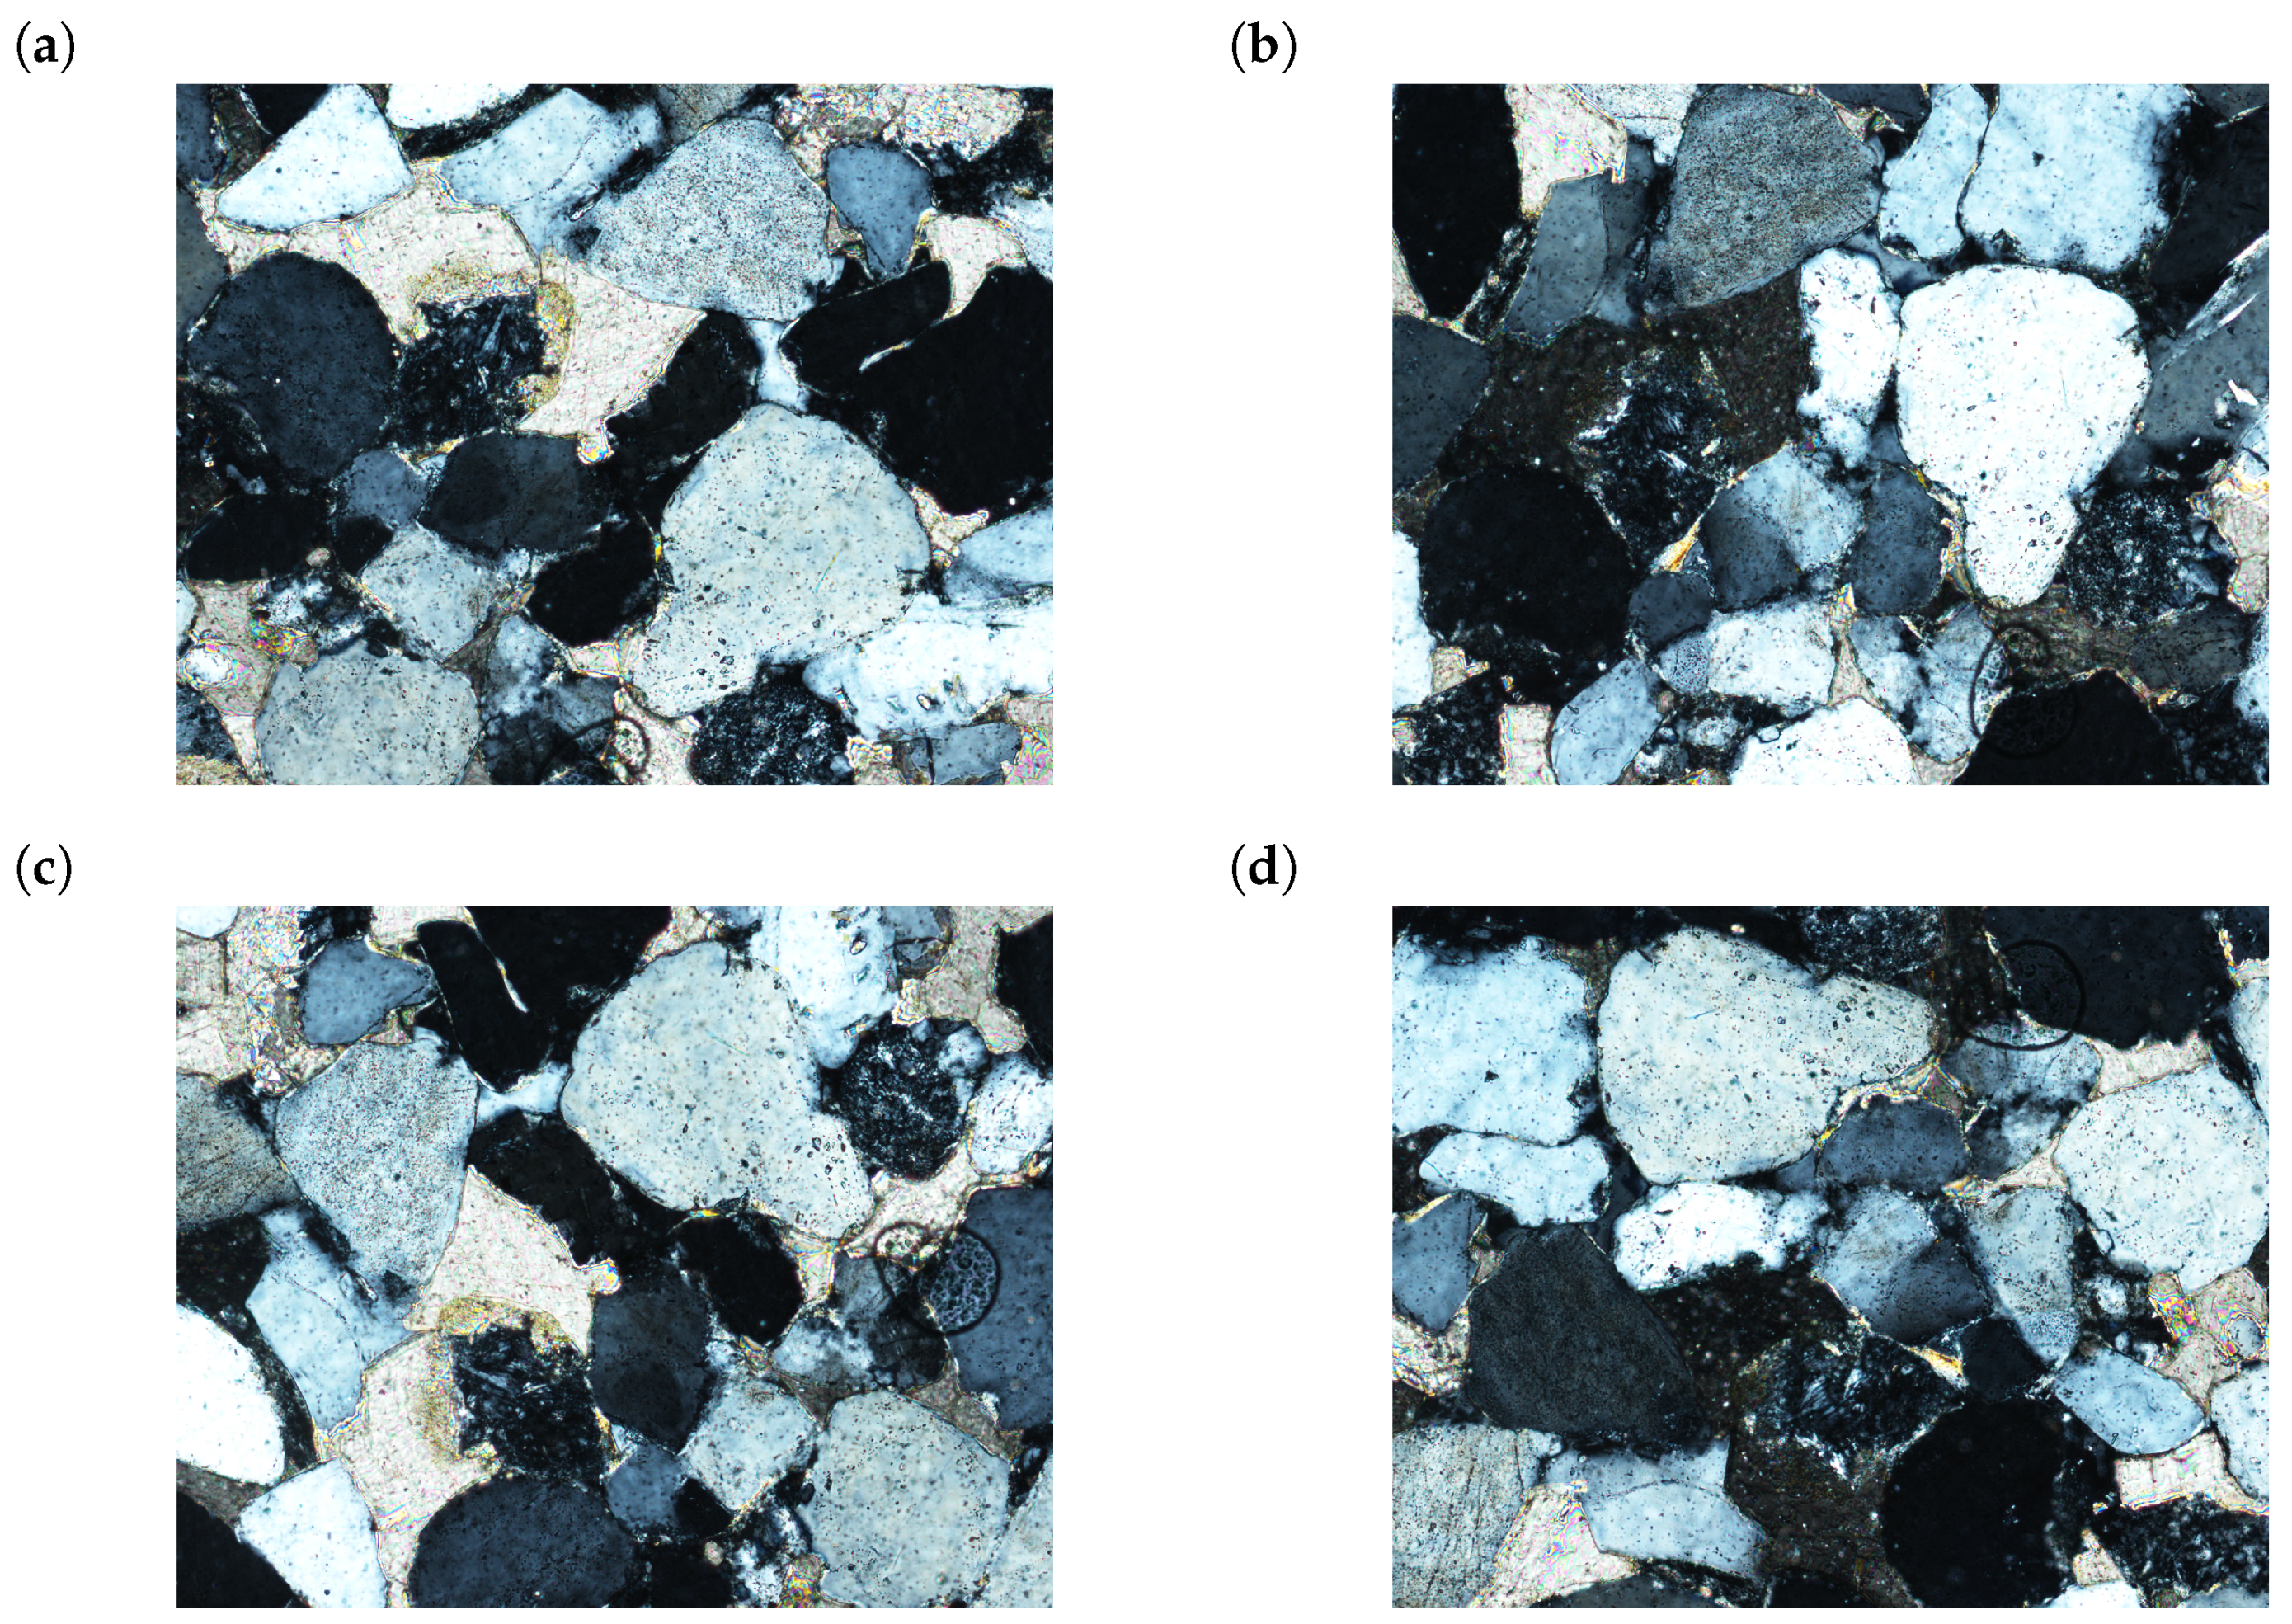
For the purposes of presentation, four images were picked with a consecutive angle difference of 50°. The picked set of original images can be seen in Figure 4. A change in color of distinctive minerals is clearly visible witha change of the light angle.
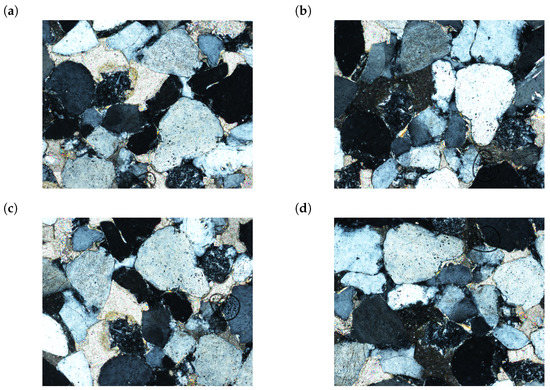
Figure 4.
Part of the original set of images: (a) Angle 0°, (b) Angle 40°, (c) Angle 90°, (d) Angle 140°.
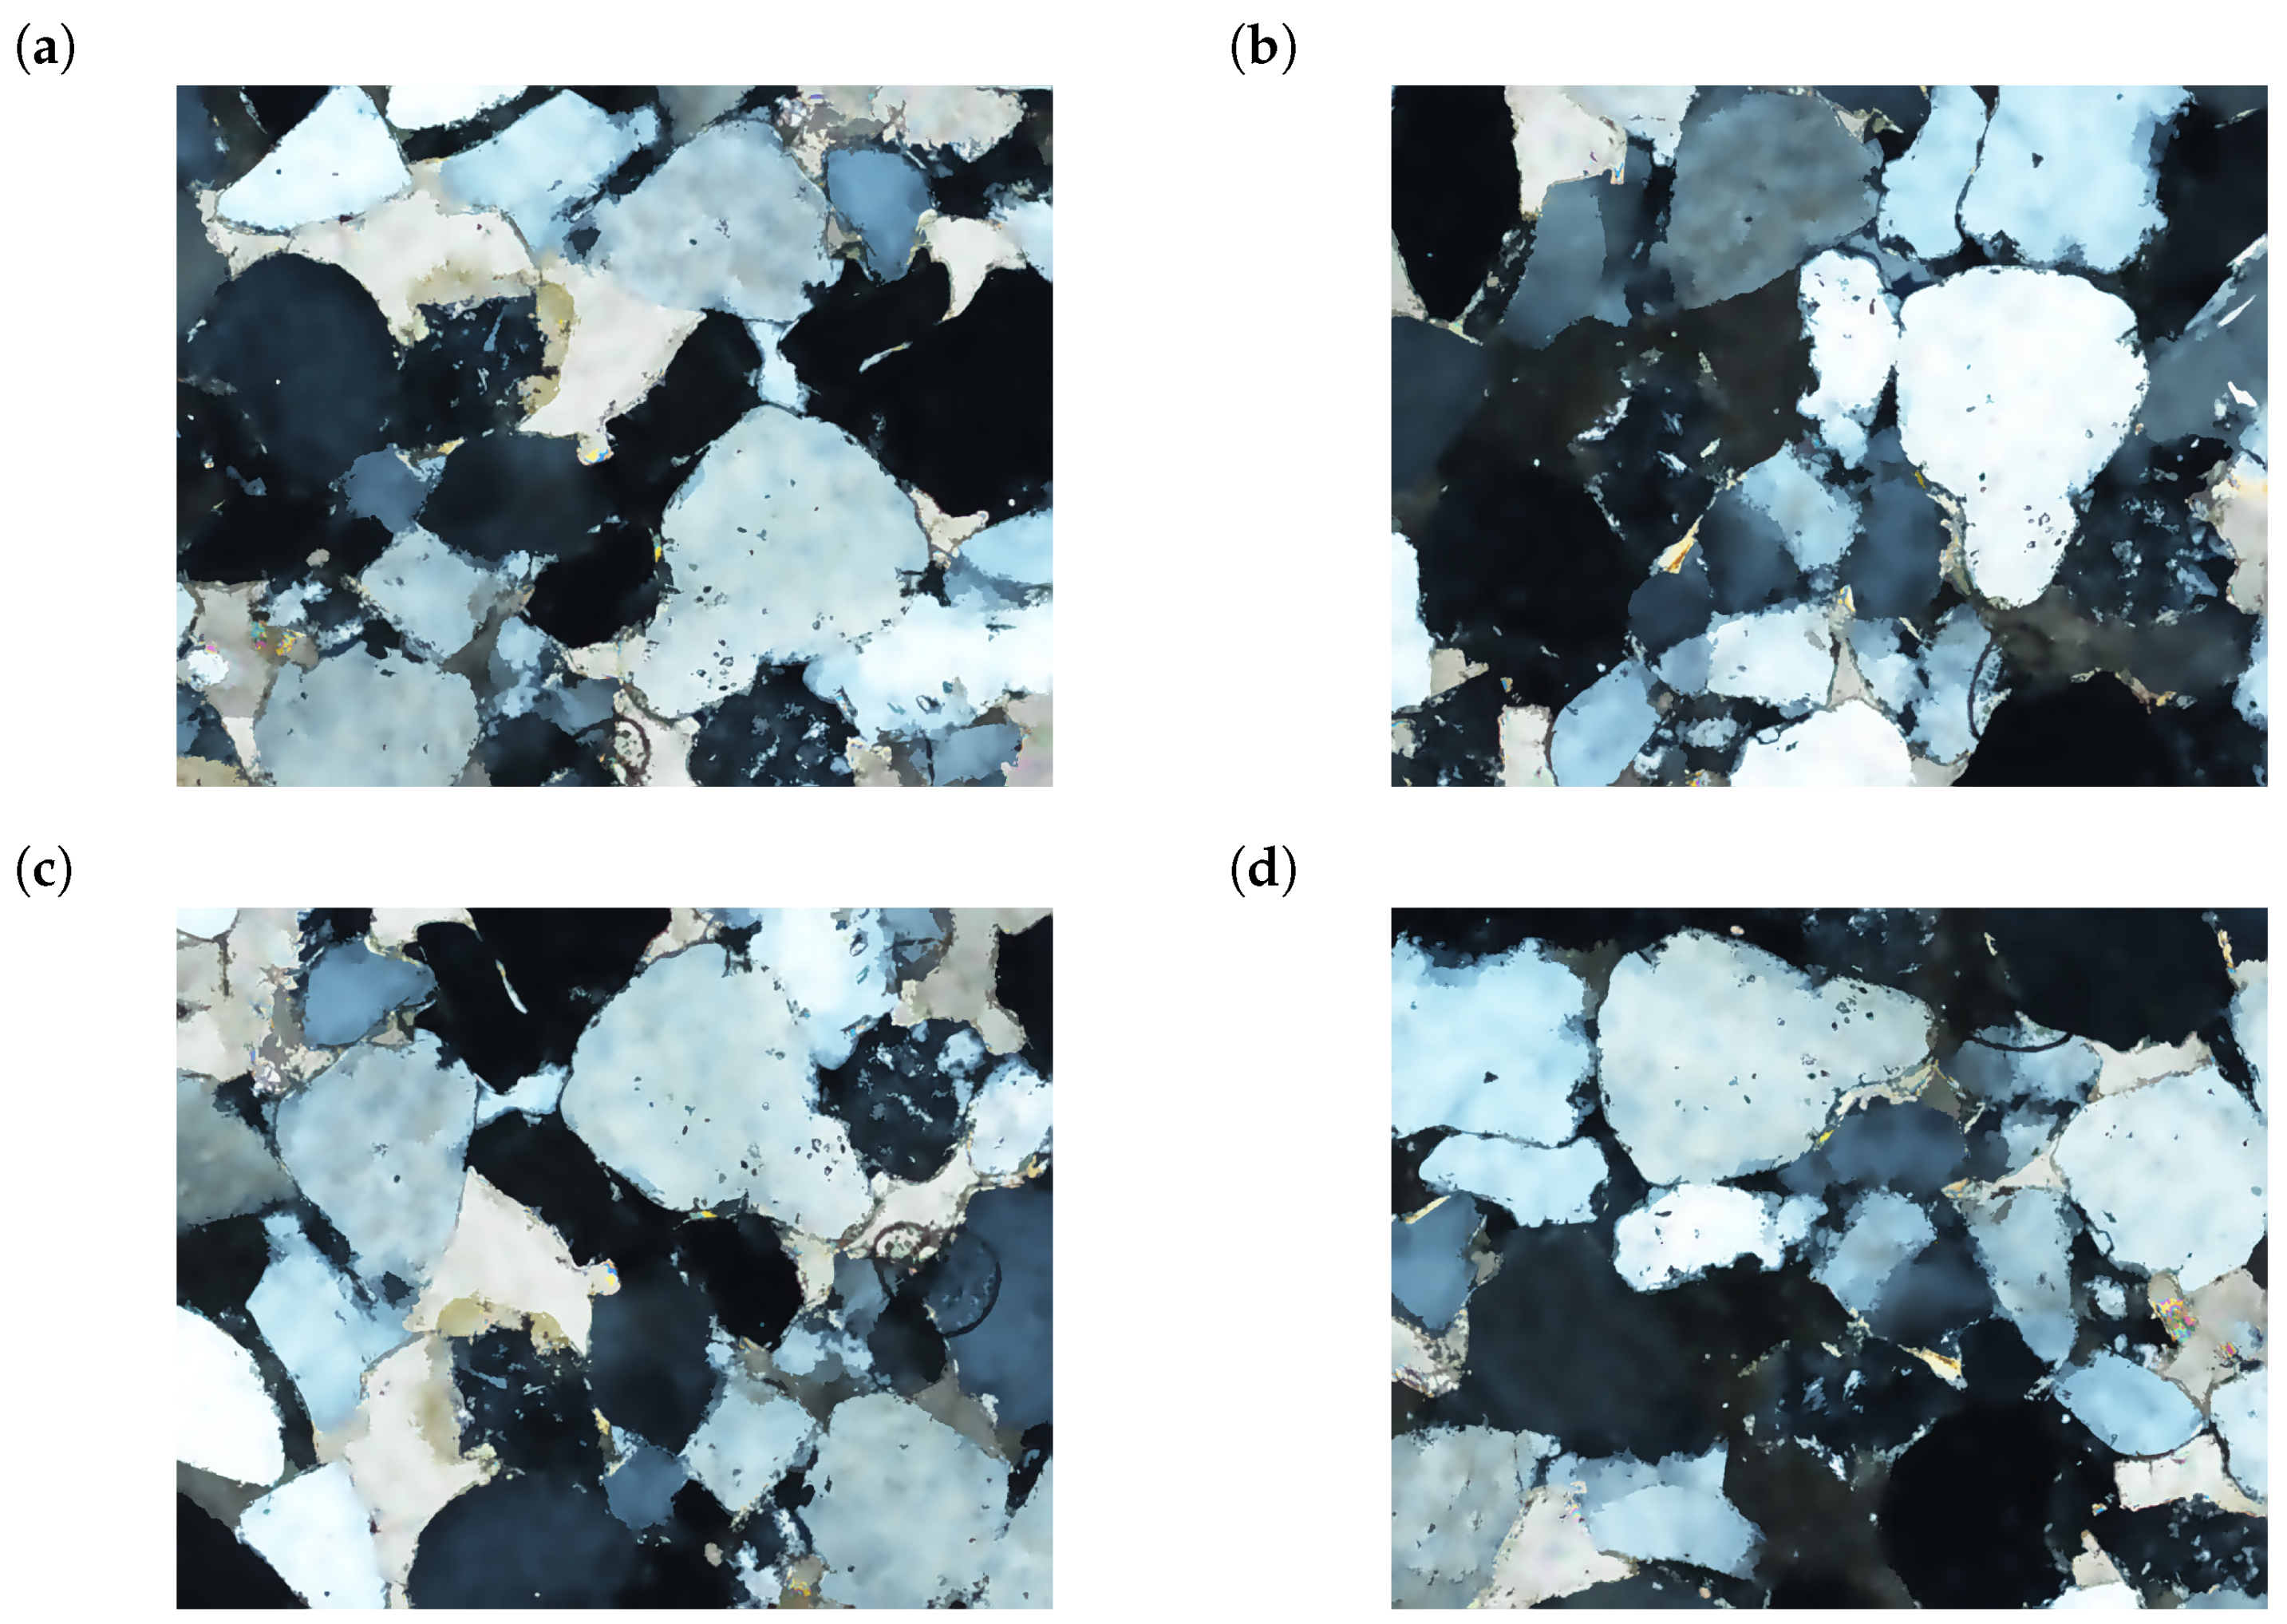
The set of the images after the applied filters can be seen in Figure 5. It mostly accomplished a more coherent surface (both in terms of color and edge clarity) of each mineral. Impact of dirt from mineral, dirt from the camera, small dots, and other impurities were also minimized.
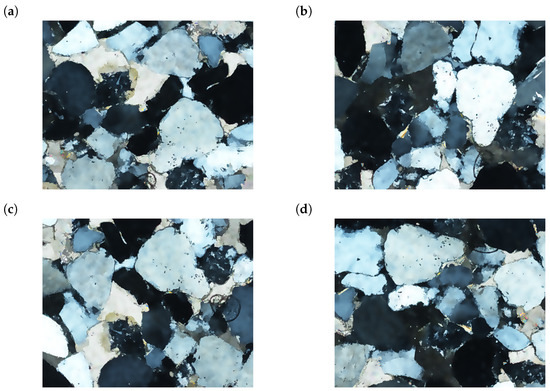
Figure 5.
Filtered images: (a) Angle 0°, (b) Angle 40°, (c) Angle 90°, (d) Angle 140°.
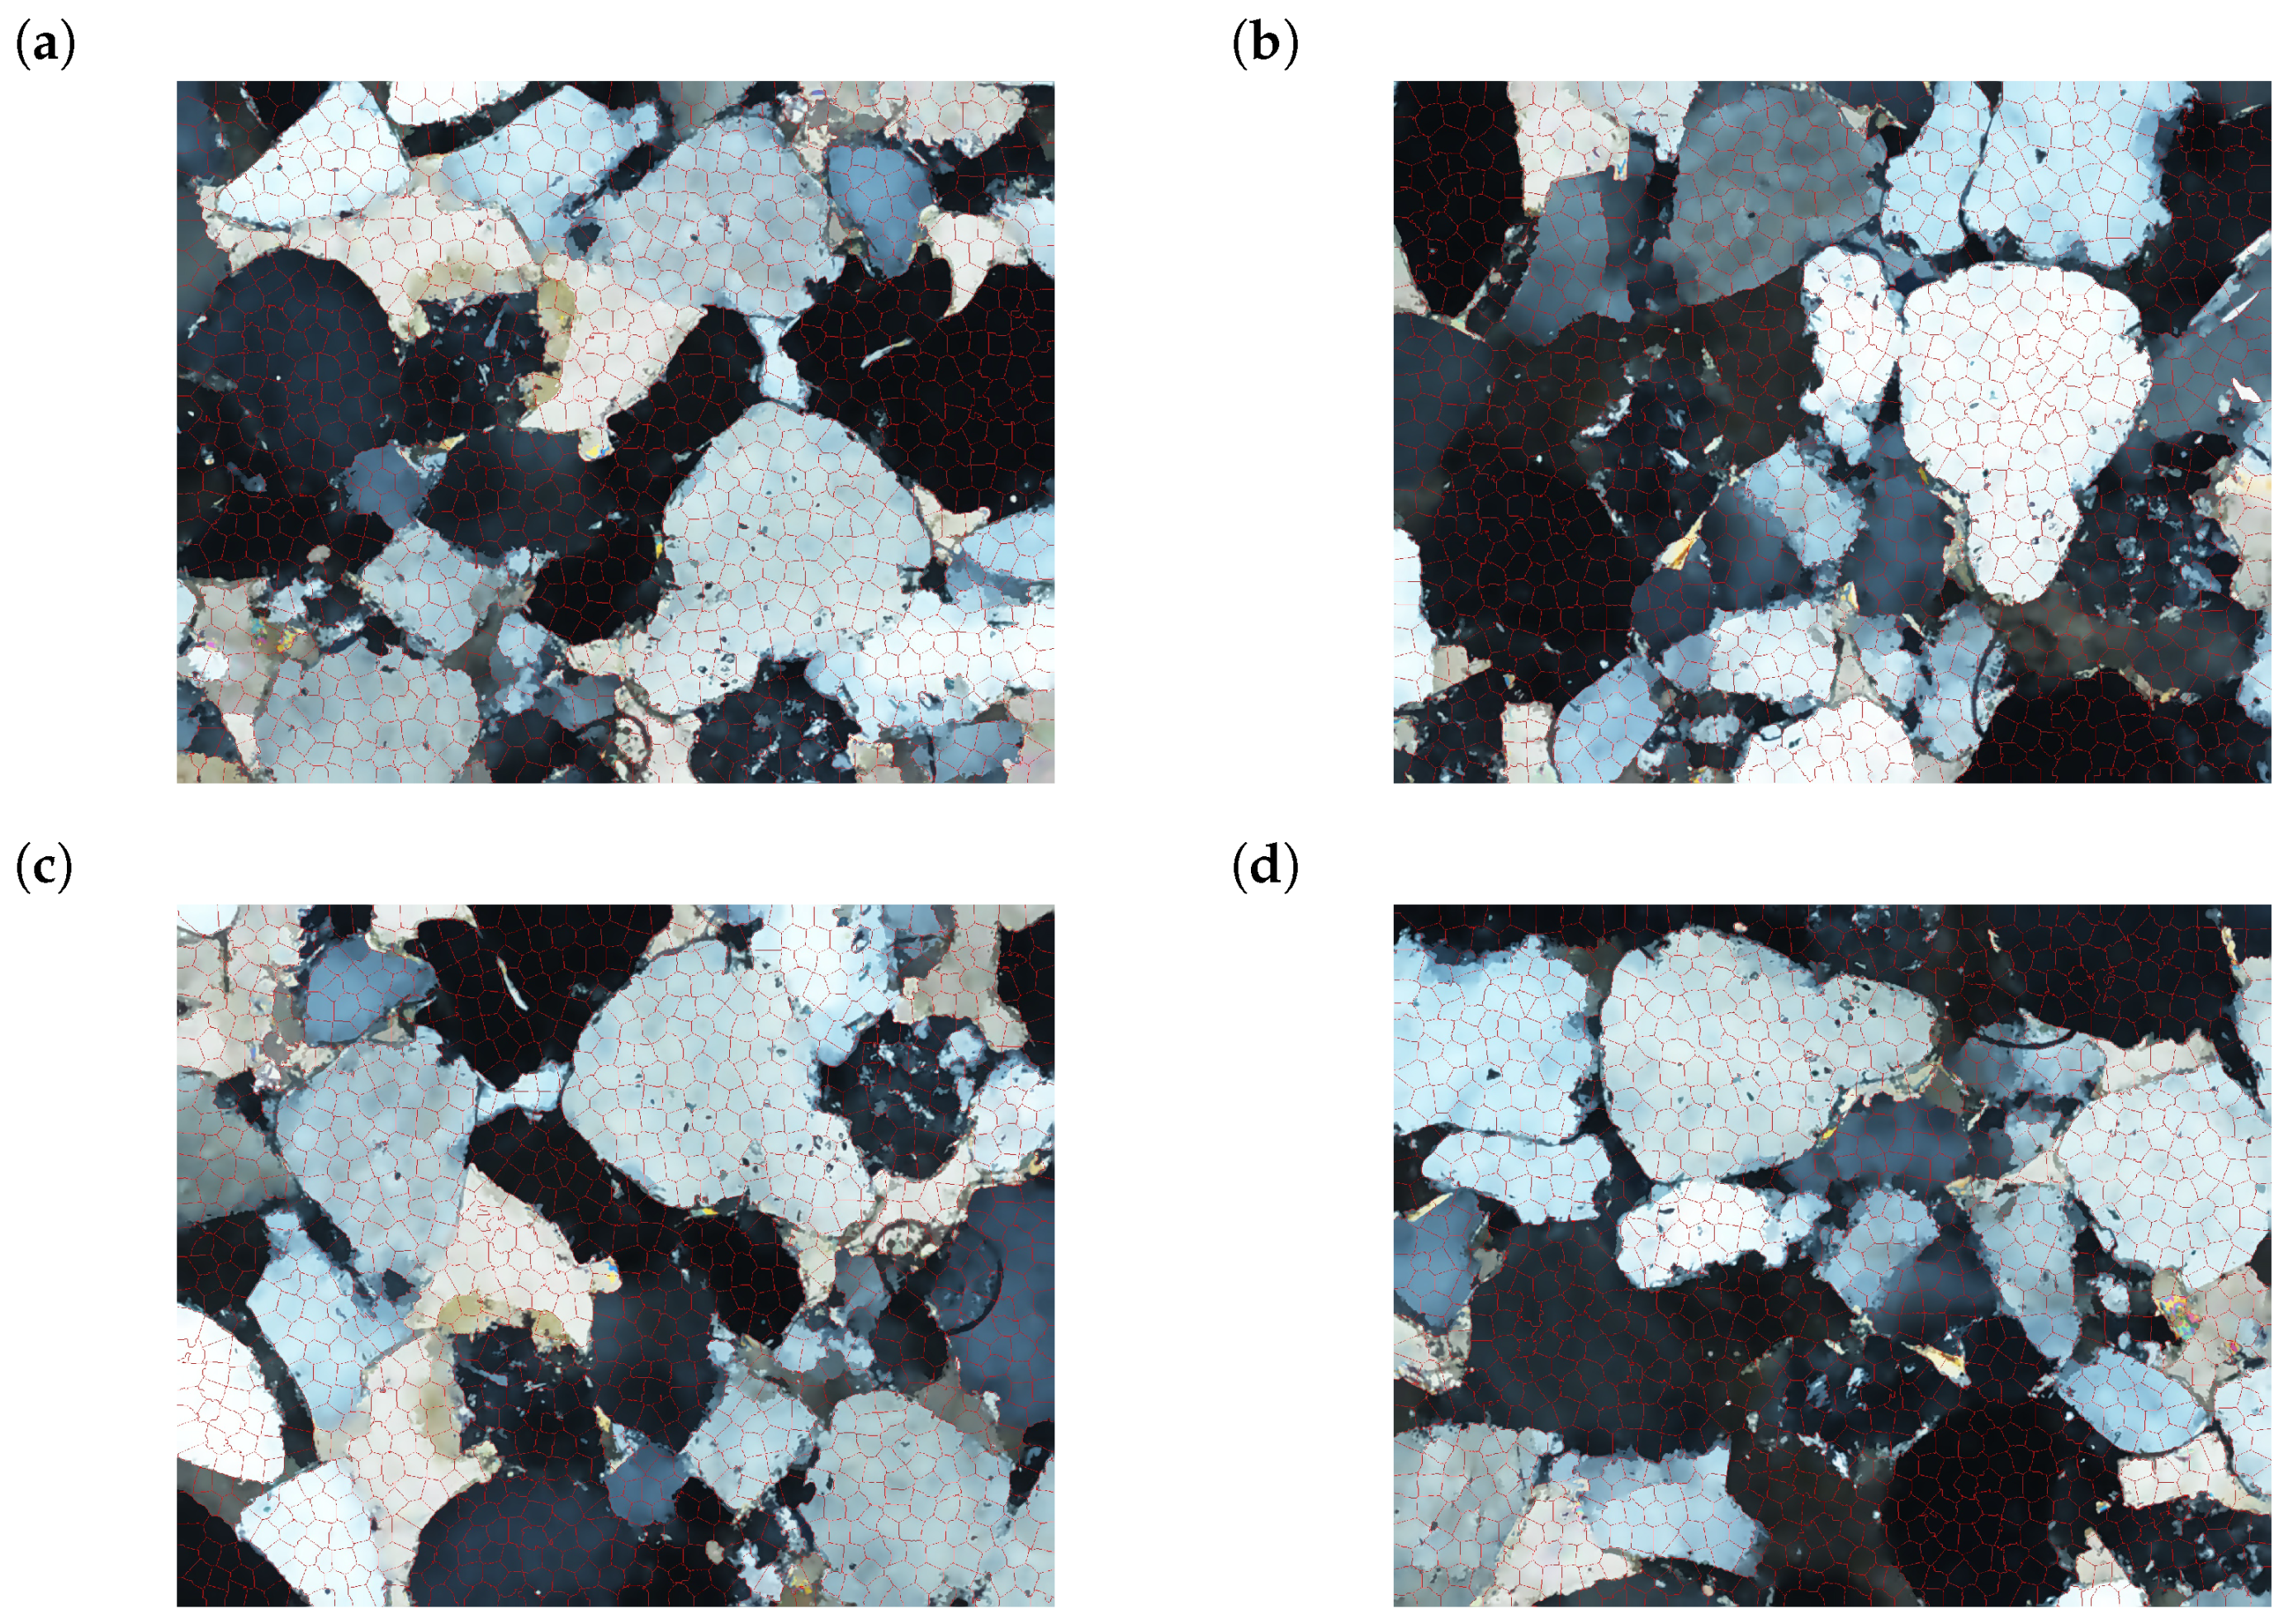
In Figure 6, the results of the SLIC algorithm with 1147 created superpixels, which is based on the pixel size of each of the distinctive areas and the maximum image size.
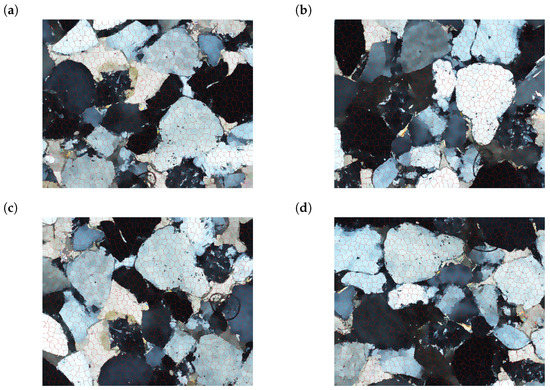
Figure 6.
Images segmented by SLIC algorithm: (a) Angle 0°, (b) Angle 40°, (c) Angle 90°, (d) Angle 140°.
Examples of the obtained adjacency matrixes can be seen in Figure 7. A lesser number of superpixels results in faster computing time but with a significant sacrifice in accuracy. The higher number of superpixels would be even more necessary in cases with smaller mineral grains.
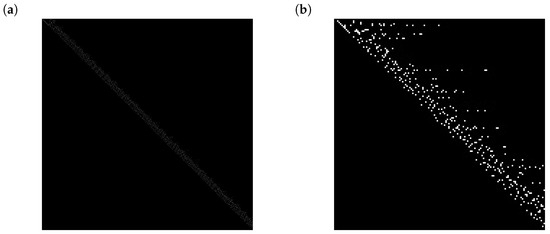
Figure 7.
Example of the single image adjacency matrix: (a) with 1147 created superpixels, (b) with 146 created superpixels.
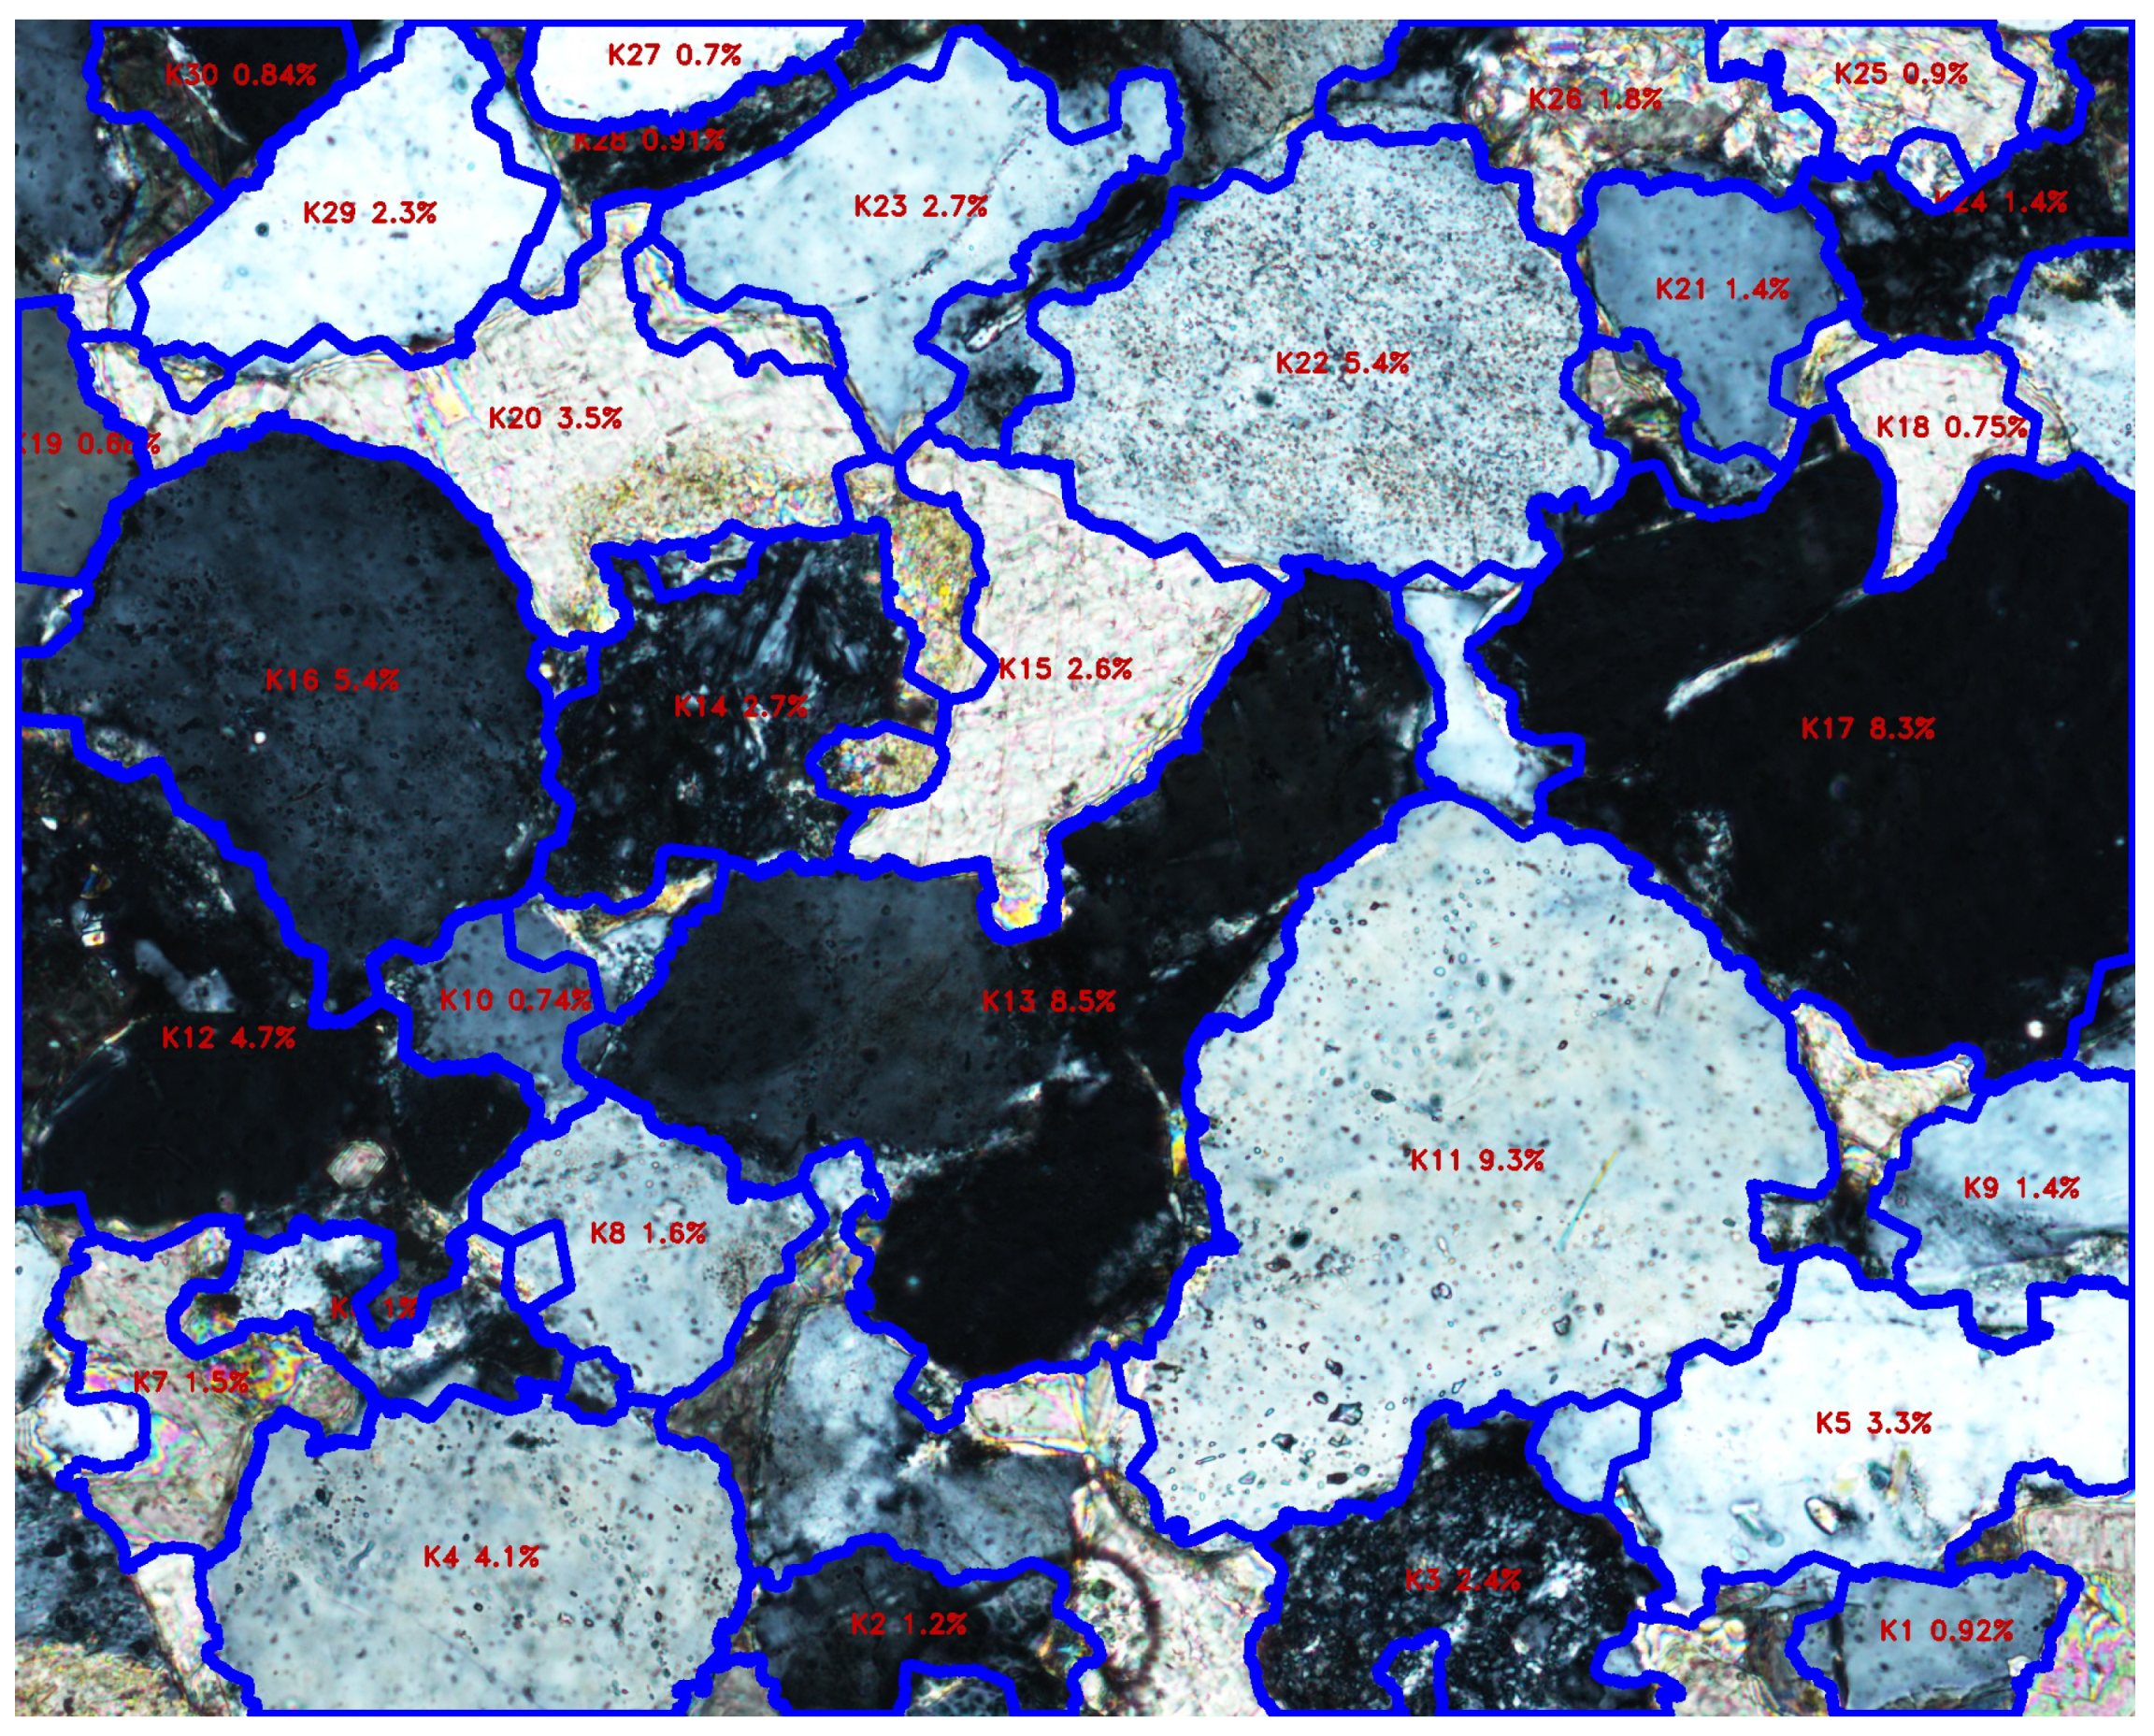
The result for the first image (labeled in previous figures as 0 angle) can be seen in Figure 8 with the labeled contour (which is automatic and therefore with a degree of randomness in the order) and the percentage of its area is relative to the overall image size. Connected areas with less than 0.5 percent of the image size were not considered in the final results, as these are hard to evaluate and can be discoloured fragments of the bigger grains. Connectivity was forced only to a certain degree.
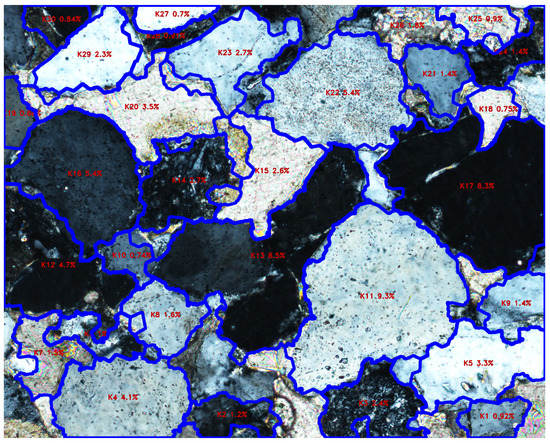
Figure 8.
Final result of the area calculation for 0° angle.
In terms of time, a single photo takes up to one-half of a minute, based on the image resolution, to perform the full task with the end result in the form presented in Figure 8. The algorithm was not optimized timewise, therefore, time consumption can be significantly reduced both inside the written code and by running it with the use of graphic processors and software dedicated for that purpose (such as NVIDIA’s CUDA).
5. Validation
The obtained results were validated in two ways. First, they can be compared directly to the by-hand method, both in terms of accuracy and time consumption. The problem with that comparison is the by-hand method’s small precision, especially for lesser resolution (necessary to reduce the time-consumption to bearable levels). Therefore, although it gives good comparison for the time required to obtain the results, in terms of precision, another benchmark is necessary.
In the case of this paper, the benchmark in the form of a single image from the same set is discussed in [38]. The method presented there is based on a semi-automatic approach, drawing the actual borders on the graphic application with simple program assessing the grain’s area percentage afterward. Due to the nature of this method, it’s precision corresponds to the precision of the person drawing the borders with all other calculations performed afterwards. The validation is done on a single image from the set, not an end result of the set of processed images. The result of that experiment can be summarized in Figure 9.
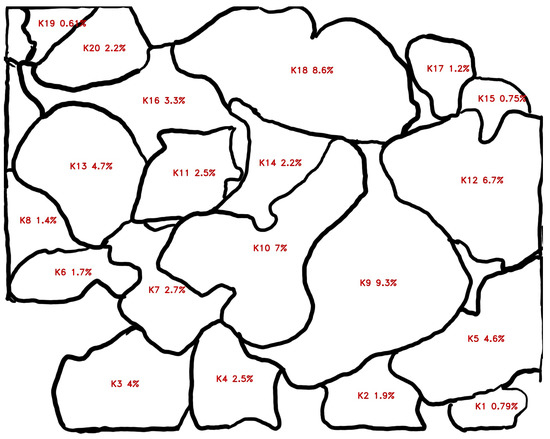
Figure 9.
Simple contour detection benchmark.
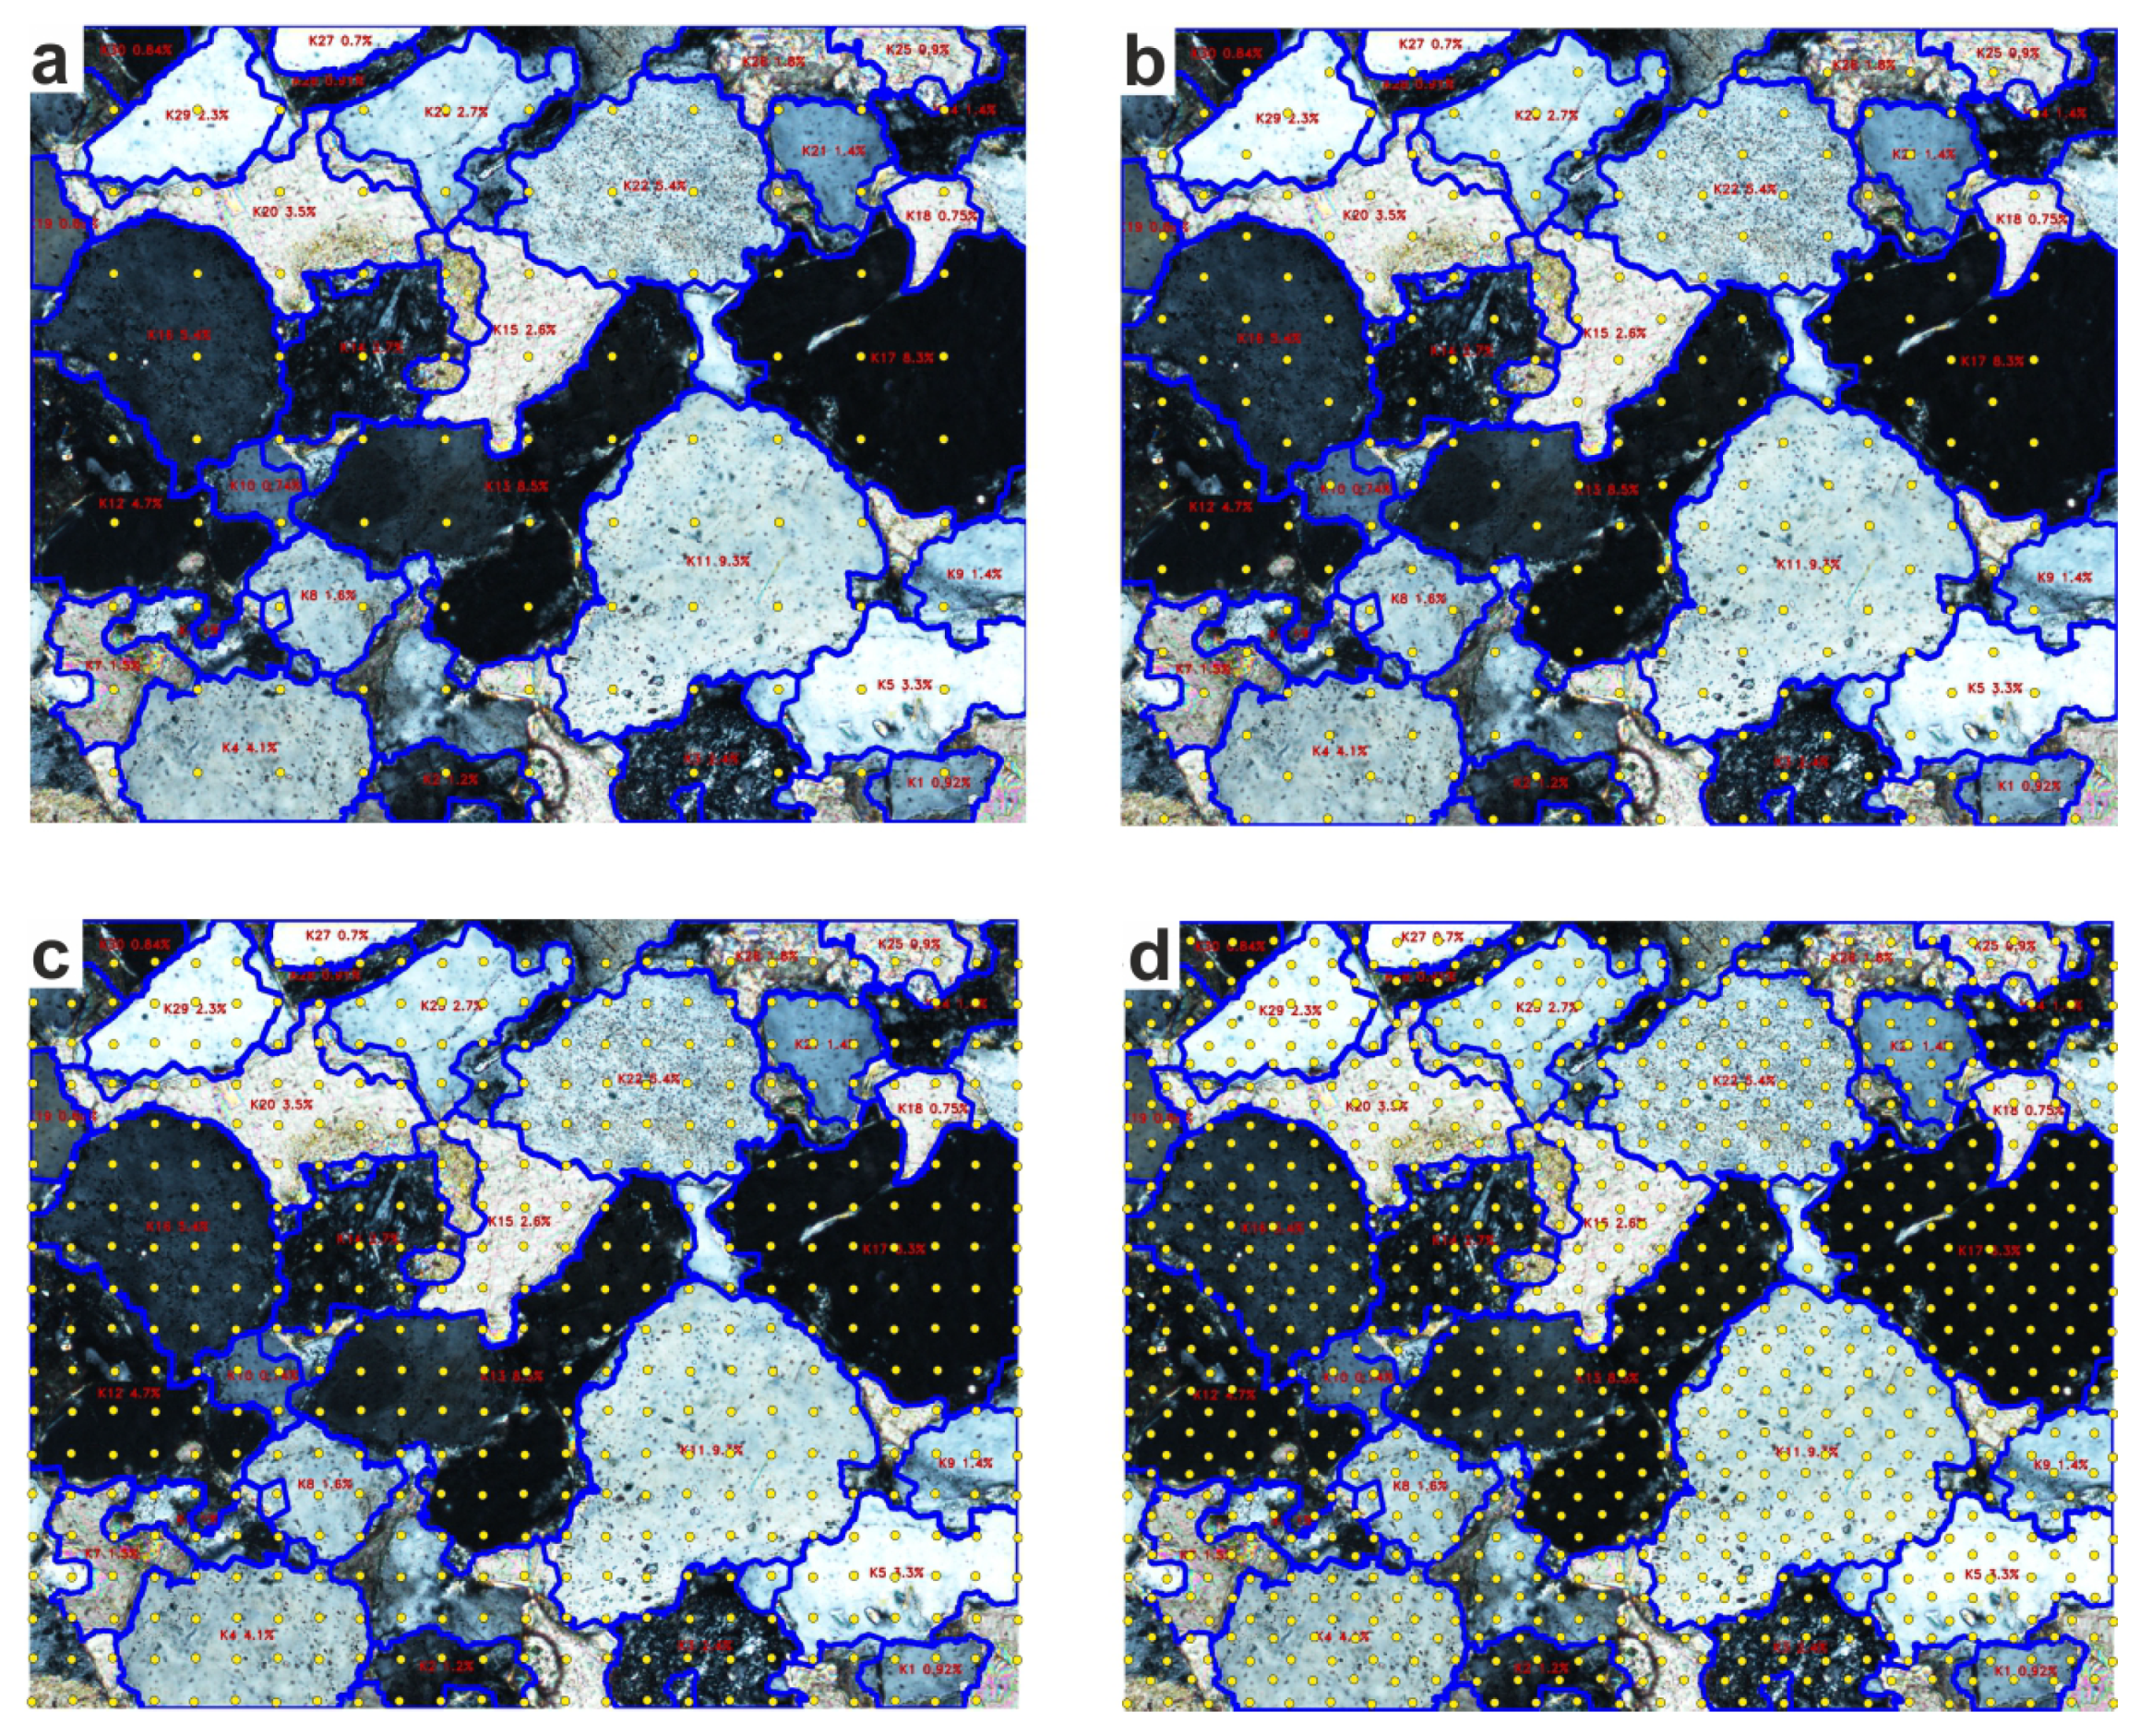
The same calculations were made using the manual method described at the beginning of the article. The individual elements were marked out (Figure 1b) and given individual identifiers (Figure 1c). This process takes up to 30%–40% of the total measurement time. The planimetric grid was then applied and the points in the individual fields were manually counted. The choice of the density of the planimetric grid influences the accuracy of the calculation of the occupied area. Four planimetric grid densities were adopted for the calculations: case I n = 100, case II n = 210, case III n = 474, case IV n = 930 (Figure 10).
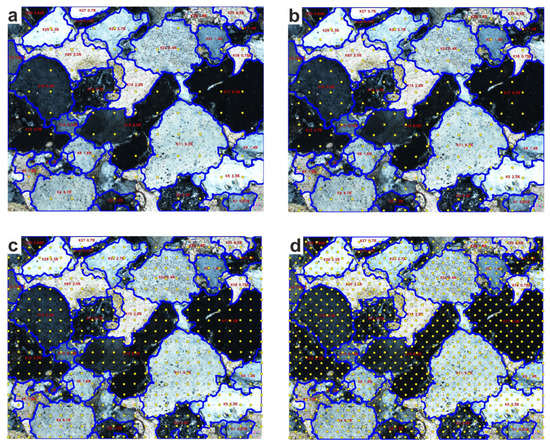
Figure 10.
Four planimetric grid densities: (a) case I n = 100, (b) case II n = 210, (c) case III n = 474, (d) case IV n = 930.
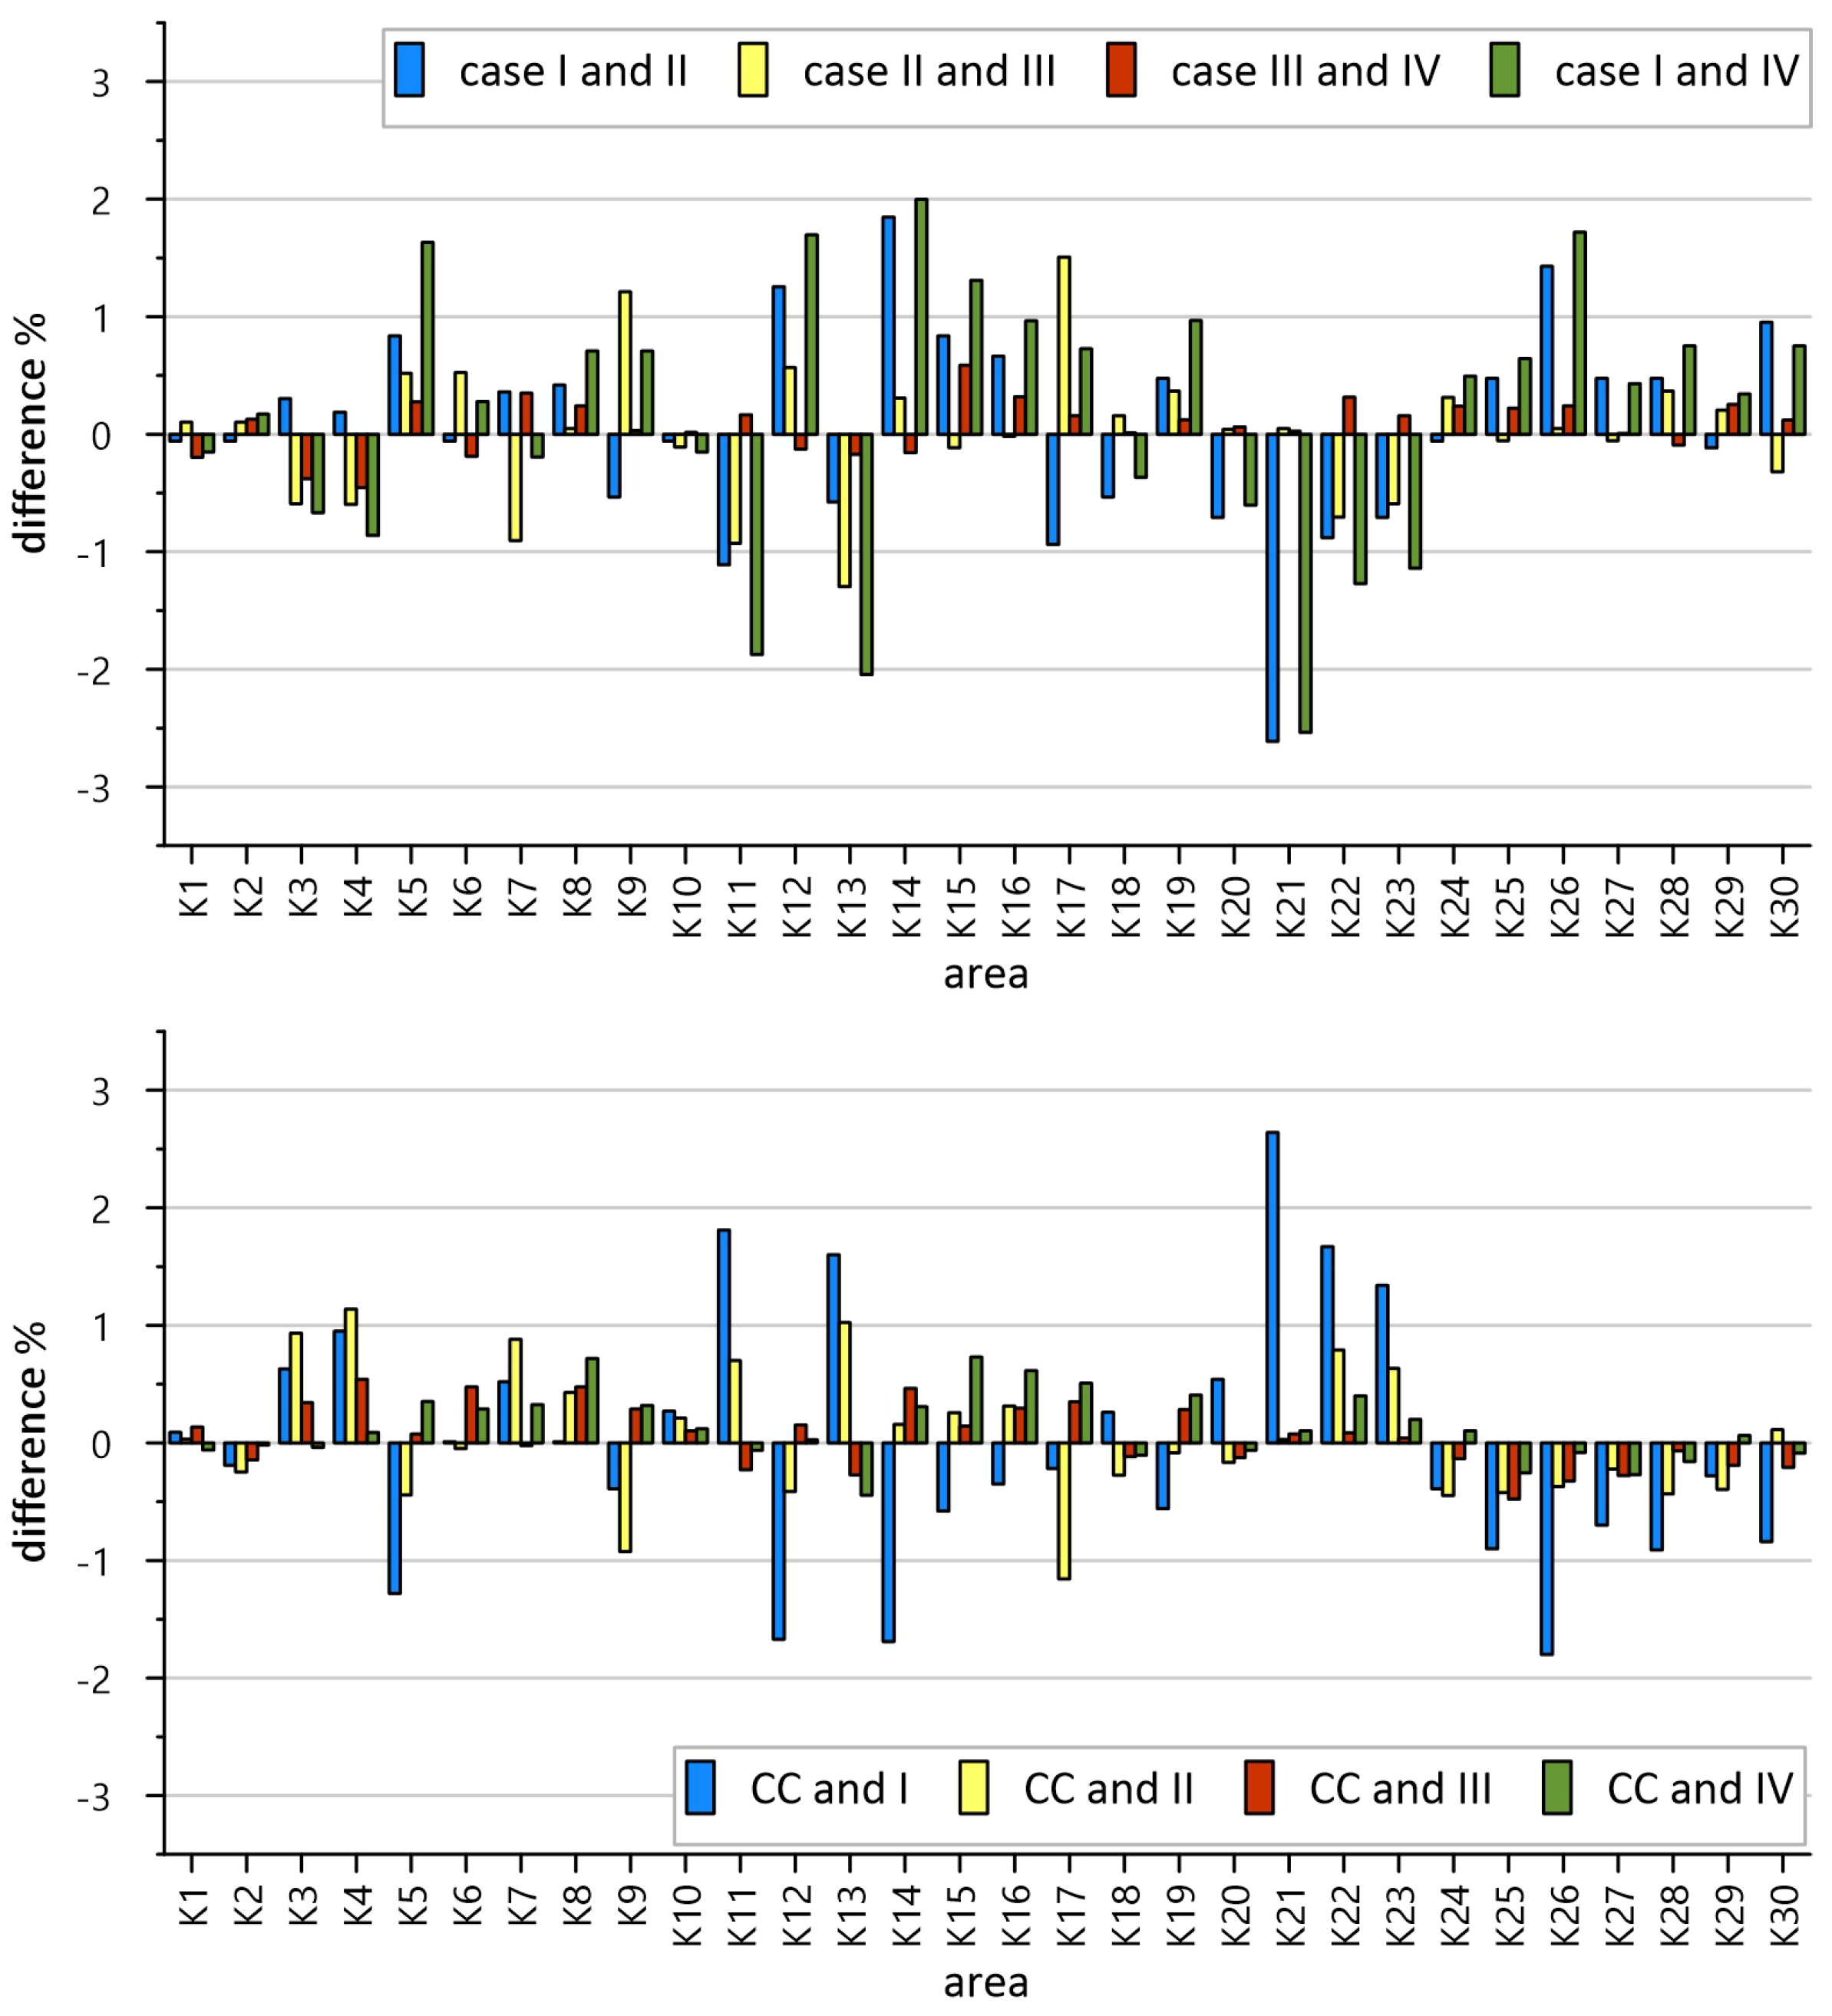
After counting the points in each field, the surface area covered (in %) was calculated for each field highlighted at an earlier stage. Due to the sparse grid, no calculation point (F = 0) was found in the six smallest fields (minerals). The lowest value for Case I was obtained for areas K1, K2, K6, K8, K9, K10, K14, K18, and K24 of 1.01%, the highest 11.11% for K11. The low density of the planimetric grid results in a low resolution of the measured parameter and the existence of the same values for several areas. As the grid became denser, this problem was eliminated. The difference in calculated area (%) was compared between the different densities of the planimetric grid. As the grid became denser, the percentage of large grains relative to smaller grains decreased. Differences in a few cases between the least compacted grid and the most reached up to 3% (Figure 11). Differences in the calculated mineral area from the ratio using the algorithm to manual calculations were up to 1.8% for the lowest density grid (case I), and up to 0.5% for the densest calculation grid (case IV).
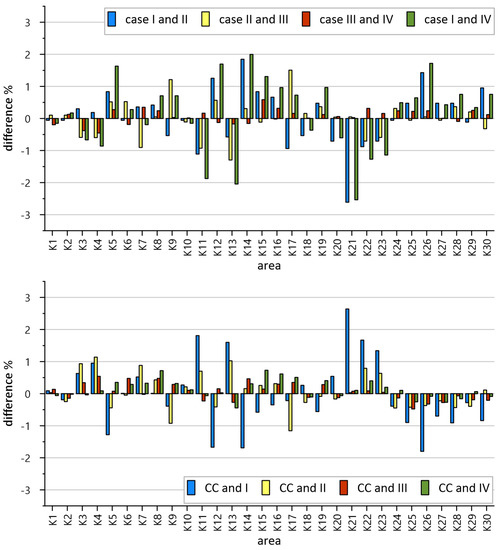
Figure 11.
Difference in area (%) between individual measurement cases (CC, computer calculation).
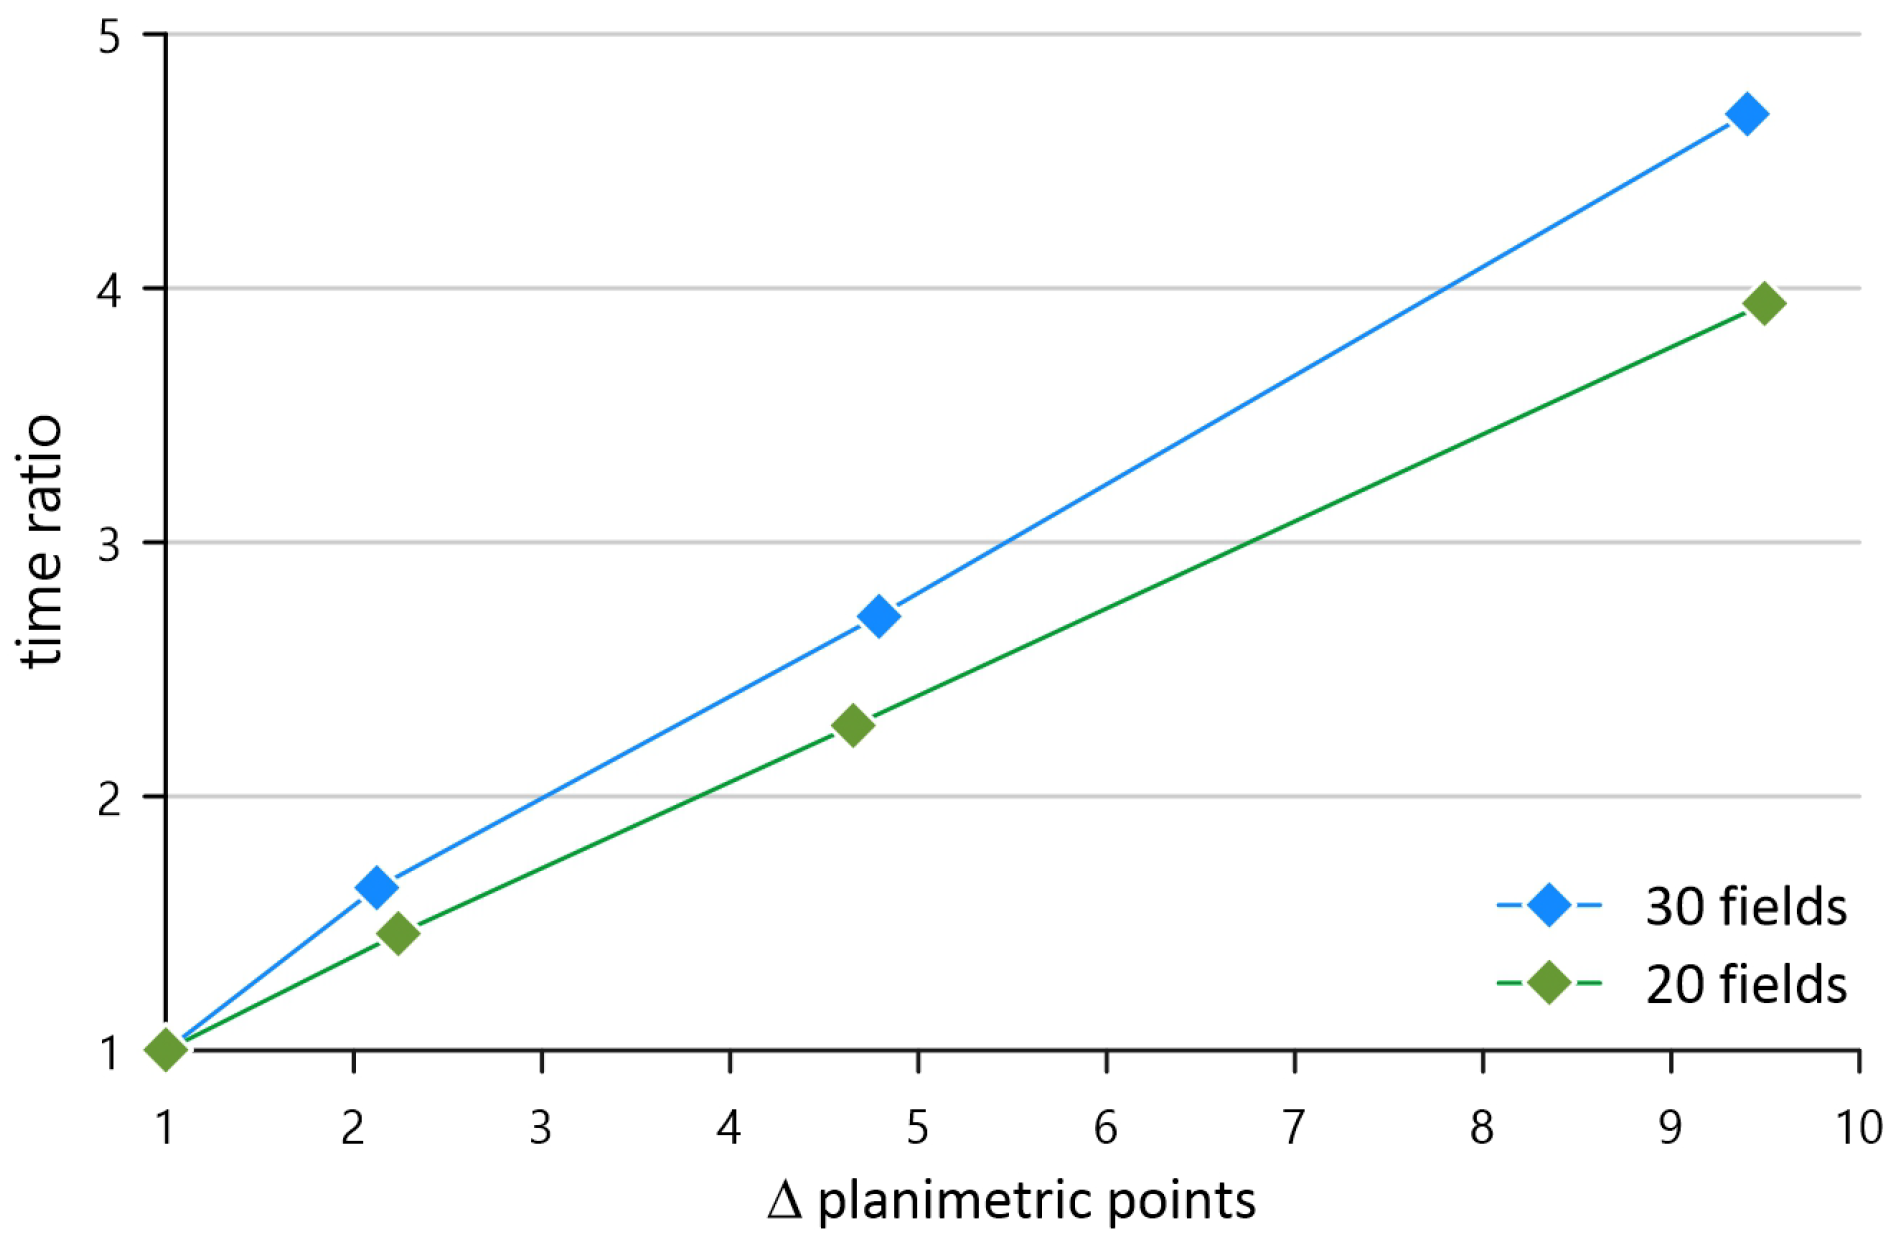
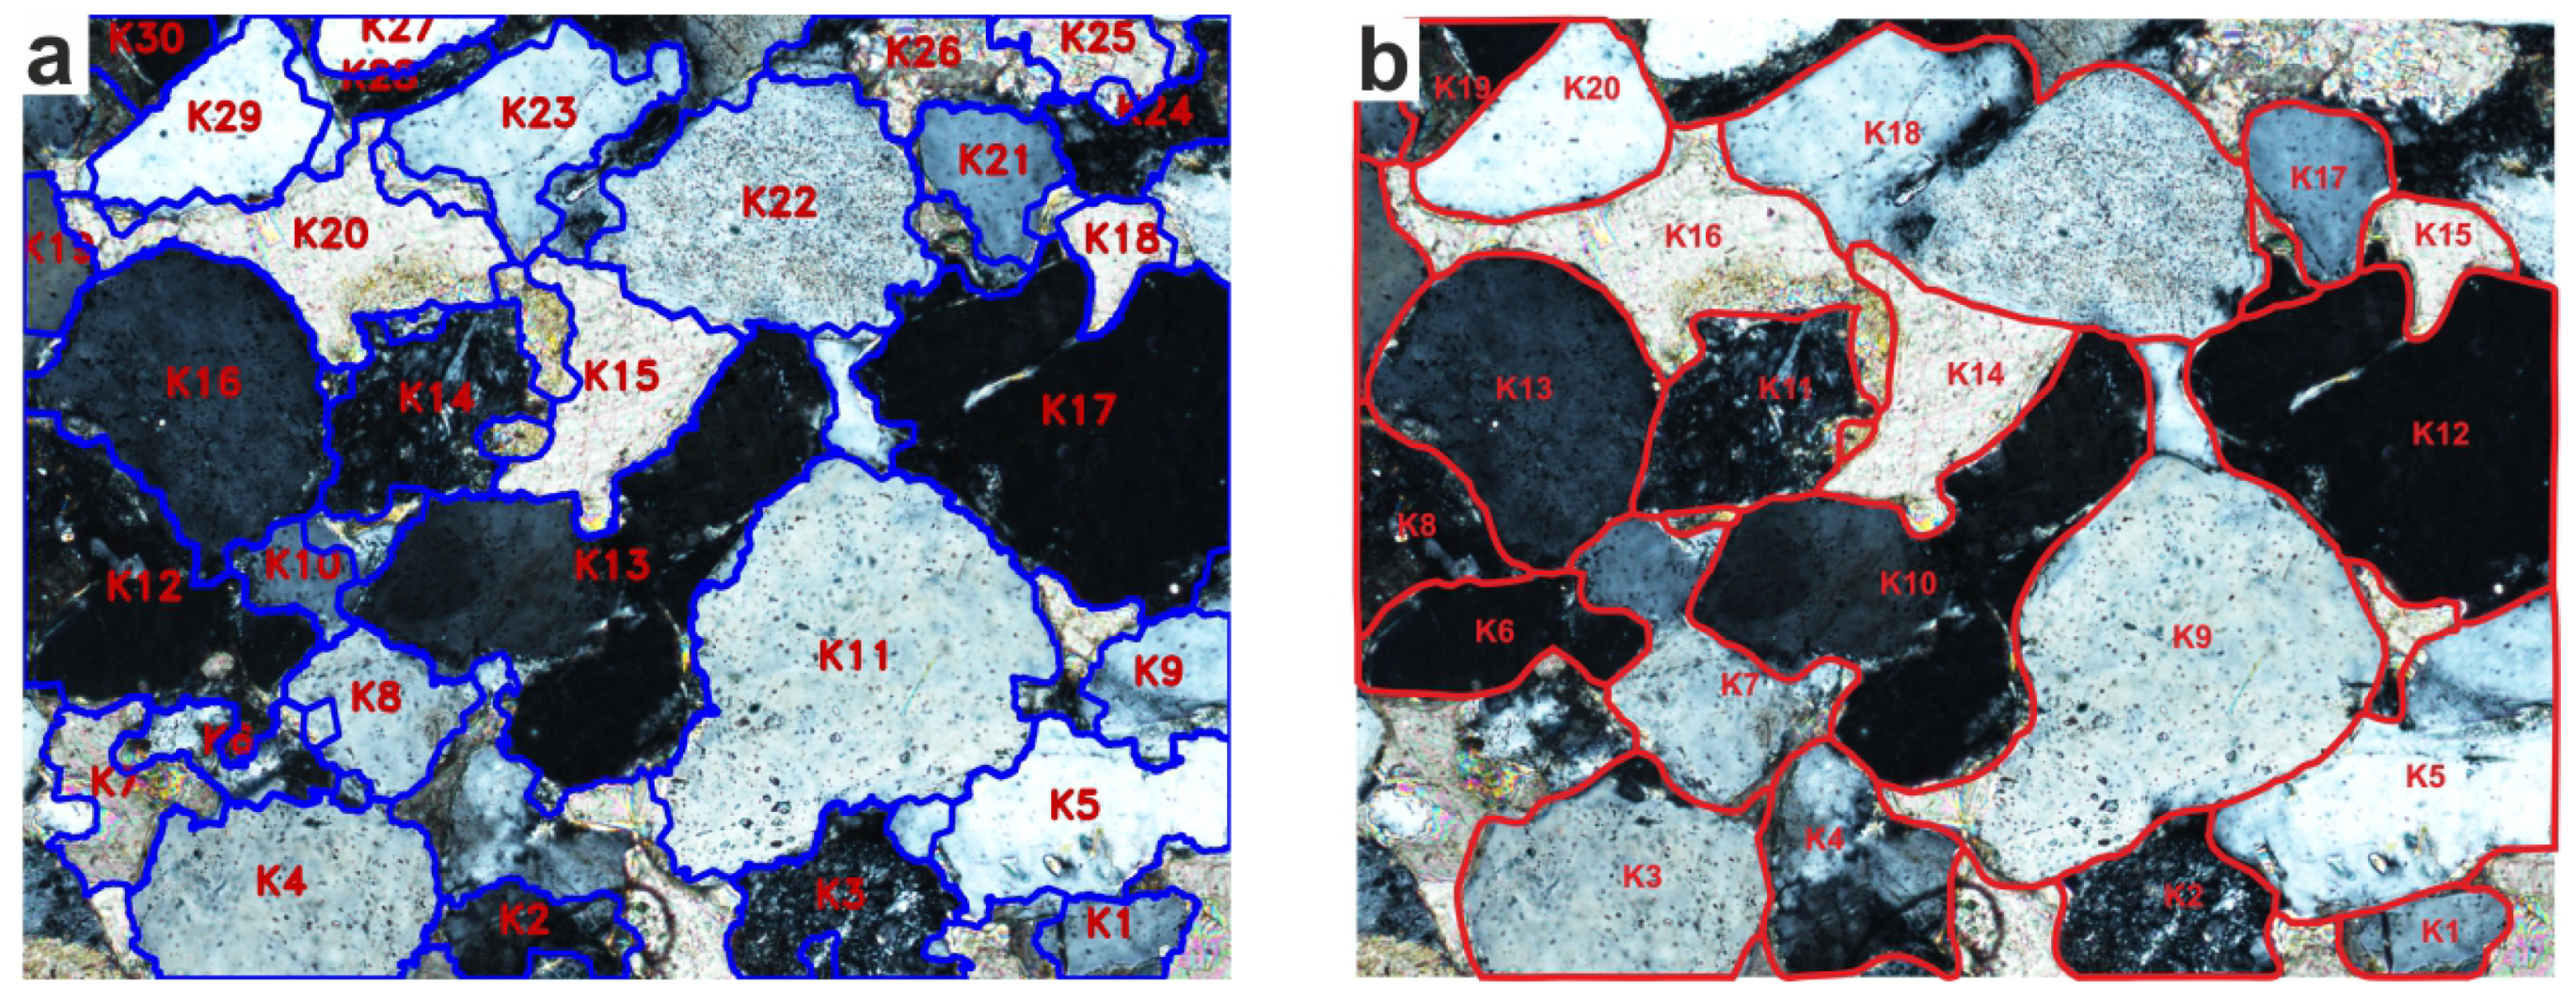
The timing of the measurements remains important. As mentioned earlier, this can take several hours. For the described thin section, it took about 2 h to recognize the components that build up the sandstone, to classify them petrographically and to identify the boundaries. The next step was to count the planimetric grid points in each area. This took between a few and several minutes depending on the case. Assuming a time of 1 (t = 1) for case 1, a graph was plotted of the increment of counting time to the increment of planimetric grid points (Figure 12). It was shown that a 9.4-fold increase in points results in a 4.7-fold increase in the time required to perform the count. In addition, this procedure was repeated for a less complex division (20 areas/minerals) (Figure 13). The complexity of the internal structure (number of calculation fields) also significantly affects the length of the calculation process. The disadvantages of manual counting are that with complex thin grinds, with a large number of calculation fields, there is a human fatigue factor (e.g., work stoppage) and problems with the subjective assignment of planimetric grid points lying on the boundary of the fields. These problems are not present in computerized methods. In addition, other parameters, e.g., the ratio of the longest to shortest grain axis, which are indicative of the processes of the sedimentary rock formation environment, can be read from the analysis of the fine grind image.
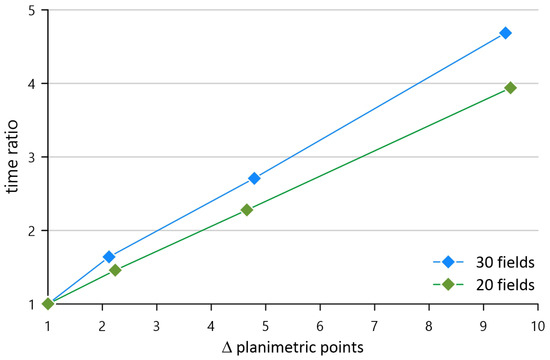
Figure 12.
Time increment for measurement to planimetric grid density and number of calculation fields.
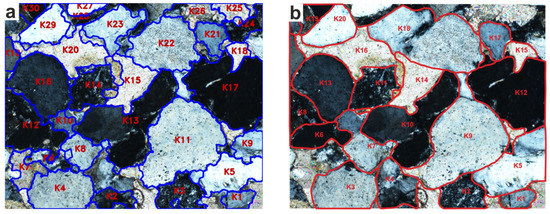
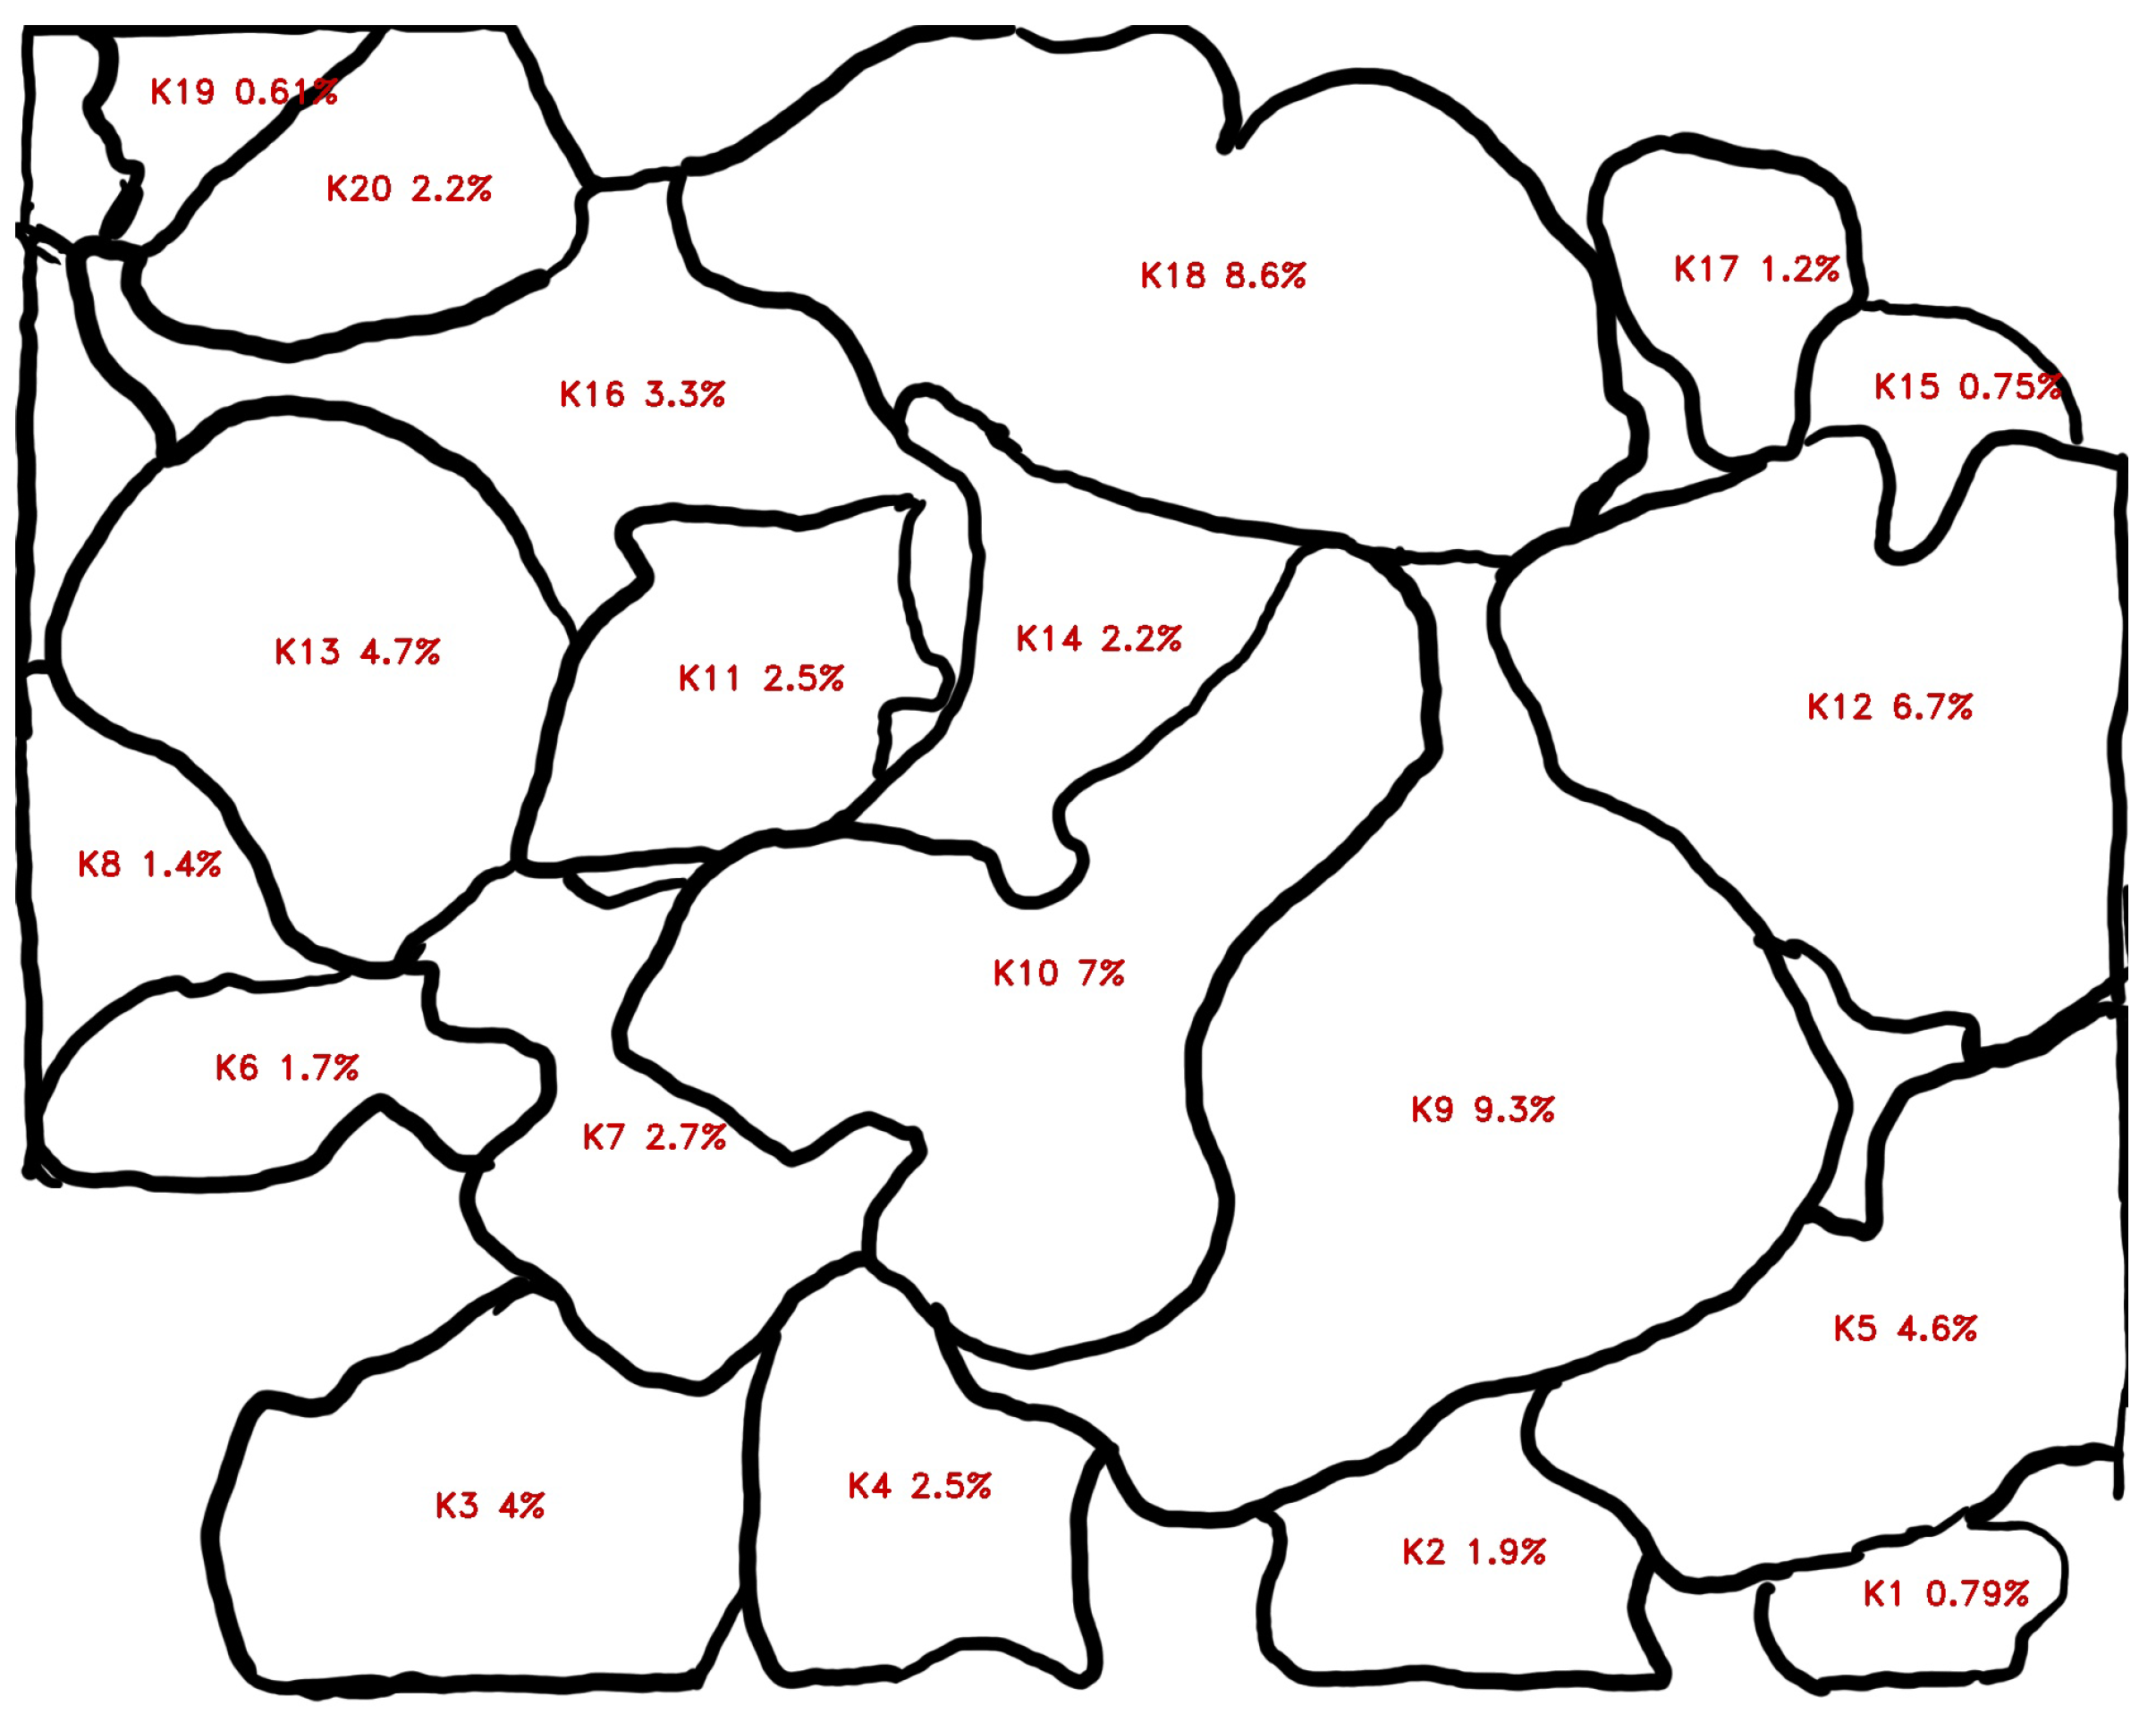
Figure 13.
Subdivision of the thin section image into areas: (a) 30 areas (minerals), (b) 20 areas (minerals).
6. Conclusions
A set of sandstone photos was taken and analyzed to extract the individual grain boundaries. To streamline the process and decrease the time required in the manual method, a fully automated algorithm was proposed, focused on detecting the boundaries of individual sandstone elements. This consists of the following tasks: individual grain boundary detection, area calculation, and various output possibilities, such as images with applied data or tabularized results.
Obtained results were compared on the same dataset with a manual method and semi-automatic methods based on borders drawn by hand over the existing image with use of graphic software. The semi-automated method can be taken as a precision benchmark since it omits problems with boundary detection by allowing the human to draw over the image with the results coming right after. In both cases (semi- and fully-automated methods), the precision of the area calculation is based on the image resolution, instead of the manually applied grid as in the case of manual counting.
In direct comparison with manual counting, differences were most visible in the case of the lowest grid density (up to 1.8% for 100 points) and decreased with growing density (down to 0.5% for 930 points). Although higher density allows for more accurate results, it also significantly extends the time necessary to perform the task; therefore, time can be optimized by lowering the density, while still achieving sufficient results. It is also important to notice the fatigue error that, in the case of multiple sample analyses, can influence the results, especially in the case of higher density grids that require constant focus during manual counting. In some cases, fully automated algorithms can separate a single big element into separate areas, based on its shape. That can be corrected manually by adding the results of the appropriate contours during the supervision and can be a part of the future improvements of the algorithm.
The time required for the non-optimized program presented in this paper to perform the described task takes up to one-half of a minute with unoptimized code, hardware, and software, which is a significant reduction compared to the manual method. Multiple samples can also be analyzed simultaneously, which further improves the time factor.
Other advantages of the fully automated method are: easily stored and represented data, readiness for further analysis (such as determining the mean color of each distinctive grain), easily changed calculation parameters, and possibility for the integration with other steps of the mineral analysis process. Additional improvements of the algorithm could be made in terms of additional feature detection during superpixel merging and improving the run-time by preparing the code to be used with graphic processors.
Future work consists of proceeding with the analysis after correct clusterization. Part of it is tracking the variation of parameters (change of color, intensity during light extinction, etc.) for a given cluster, as this allows for preliminary classification according to specific groups or processes. Further steps would focus on the use of methods related to machine learning to recognize particular groups of clusters and then assign them to the elements identified during the petrographic description of the sandstone studies.
Author Contributions
P.D.: conceptualization, methodology, software, formal analysis, visualization; K.C.: investigation, data curation, writing—original draft preparation, validation; I.N.: investigation, resources, writing—original draft preparation; R.Z.: supervision, project administration, funding acquisition, writing—review and editing. All authors have read and agreed to the published version of the manuscript.
Funding
This research received no external funding.
Data Availability Statement
Data available by request.
Conflicts of Interest
The authors declare no conflict of interest.
References
- Dirnerová, D.; Farkašovský, R. Sedimentary record comparison of the piwniczna and poprad sandstones (Magura unit, outer carpathians)—A study from the border area of eastern Slovakia and Poland. Geol. Q. 2018, 62, 881–895. [Google Scholar] [CrossRef]
- Fahy, M.; Guccione, M. Estimating strength of sandstone using petrographic thin-section data. Bull. Assoc. Eng. Geol. 1979, 16, 467–485. [Google Scholar] [CrossRef]
- Montana, G. Ceramic raw materials: How to recognize them and locate the supply basins—Mineralogy, petrography. Archaeol. Anthropol. Sci. 2020, 12, 175. [Google Scholar] [CrossRef]
- Saxena, N.; Mavko, G.; Hofmann, R.; Srisutthiyakorn, N. Estimating permeability from thin sections without reconstruction: Digital rock study of 3D properties from 2D images. Comput. Geosci. 2017, 102, 79–99. [Google Scholar] [CrossRef]
- Wirska, M. Metoda mikroskopowej analizy cienkich szlifów w badaniach zabytków ceramicznych. Ochr. Zabyt. 1967, 39–45. Available online: https://bibliotekanauki.pl/api/full-texts/2020/12/13/6a7699b5-fc70-4738-aa35-98fa950e0022.pdf (accessed on 30 January 2023).
- Moreno Chávez, G.; Castillo Rivera, F.; Sarocchi, D.; Borselli, L.; Rodríguez-Sedano, L. FabricS: A user-friendly, complete and robust software for particle shape-fabric analysis. Comput. Geosci. 2018, 115, 20–30. [Google Scholar] [CrossRef]
- de Lima Camêlo, D.; Gilkes, R.J.; Leopold, M.; Silva, A.C.; Vidal-Torrado, P. The application of quartz grain morphology measurements to studying iron-rich duricrusts. Catena 2018, 170, 397–408. [Google Scholar] [CrossRef]
- Baiyegunhi, C.; Liu, K.; Gwavava, O. Diagenesis and Reservoir Properties of the Permian Ecca Group Sandstones and Mudrocks in the Eastern Cape Province, South Africa. Minerals 2017, 7, 88. [Google Scholar] [CrossRef]
- MacKenzie, W.; Adams, A.; Brodie, K. Rocks and Minerals in Thin Section, 2nd ed.; CRC Press: Boca Raton, FL, USA, 2017. [Google Scholar]
- Schäfer, A.; Teyssen, T. Size, shape and orientation of grains in sands and sandstones—Image analysis applied to rock thin-sections. Sediment. Geol. 1987, 52, 251–271. [Google Scholar] [CrossRef]
- Scherer, M. Parameters Influencing Porosity in Sandstones: A Model for Sandstone Porosity Prediction. AAPG Bull. 1987, 71, 485–491. [Google Scholar] [CrossRef]
- Ehrenberg, S.N.; Nadeau, P.H. Sandstone vs. carbonate petroleum reservoirs: A global perspective on porosity-depth and porosity-permeability relationships. AAPG Bull. 2005, 89, 435–445. [Google Scholar] [CrossRef]
- Barwis, J.H.; McPherson, J.G.; Studlick, J.R. Sandstone Petroleum Reservoirs; Springer Science & Business Media: Berlin/Heidelberg, Germany, 2012. [Google Scholar] [CrossRef]
- Sneider, R.M. Reservoir Description of Sandstones. In Sandstone Petroleum Reservoirs; Springer: Berlin/Heidelberg, Germany, 1990; pp. 1–3. [Google Scholar]
- Cady, J.G.; Wilding, L.P.; Drees, L.R. Petrographic Microscope Techniques. In Methods of Soil Analysis, Part 1: Physical and Mineralogical Methods; John Wiley & Sons, Ltd.: Hoboken, NJ, USA, 2018; pp. 185–218. [Google Scholar] [CrossRef]
- Schulz, B.; Sandmann, D.; Gilbricht, S. SEM-Based Automated Mineralogy and Its Application in Geo- and Material Sciences. Minerals 2020, 10, 1004. [Google Scholar] [CrossRef]
- Pirrie, D.; Crean, D.E.; Pidduck, A.J.; Nicholls, T.M.; Awbery, R.P.; Shail, R.K. Automated mineralogical profiling of soils as an indicator of local bedrock lithology: A tool for predictive forensic geolocation. Geol. Soc. Lond. Spec. Publ. 2021, 492, 261–280. [Google Scholar] [CrossRef]
- Hrstka, T.; Gottlieb, P.; Skála, R.; Breiter, K.; Motl, D. Automated mineralogy and petrology - applications of TESCAN Integrated Mineral Analyzer (TIMA). J. Geosci. 2018, 63, 47–63. [Google Scholar] [CrossRef]
- Graham, S.; Keulen, N. Nanoscale Automated Quantitative Mineralogy: A 200-nm Quantitative Mineralogy Assessment of Fault Gouge Using Mineralogic. Minerals 2019, 9, 665. [Google Scholar] [CrossRef]
- Blannin, R.; Frenzel, M.; Tuşa, L.; Birtel, S.; Ivăşcanu, P.; Baker, T.; Gutzmer, J. Uncertainties in quantitative mineralogical studies using scanning electron microscope-based image analysis. Miner. Eng. 2021, 167, 106836. [Google Scholar] [CrossRef]
- Heilbronner, R. Automatic grain boundary detection and grain size analysis using polarization micrographs or orientation images. J. Struct. Geol. 2000, 22, 969–981. [Google Scholar] [CrossRef]
- van den Berg, E.; Meesters, A.; Kenter, J.; Schlager, W. Automated separation of touching grains in digital images of thin sections. Comput. Geosci. 2002, 28, 179–190. [Google Scholar] [CrossRef]
- Zhan, Y.; Zhang, G. An Improved OTSU Algorithm Using Histogram Accumulation Moment for Ore Segmentation. Symmetry 2019, 11, 431. [Google Scholar] [CrossRef]
- Wang, W.; Chen, L. Flotation Bubble Delineation Based on Harris Corner Detection and Local Gray Value Minima. Minerals 2015, 5, 142–163. [Google Scholar] [CrossRef]
- Abdulrahman, A.; Varol, S. A Review of Image Segmentation Using MATLAB Environment. In Proceedings of the 2020 8th International Symposium on Digital Forensics and Security (ISDFS), Beirut, Lebanon, 1–2 June 2020; pp. 1–5. [Google Scholar] [CrossRef]
- Ma, X.; Zhang, P.; Man, X.; Ou, L. A New Belt Ore Image Segmentation Method Based on the Convolutional Neural Network and the Image-Processing Technology. Minerals 2020, 10, 1115. [Google Scholar] [CrossRef]
- Liu, Y.; Zhang, Z.; Liu, X.; Wang, L.; Xia, X. Efficient image segmentation based on deep learning for mineral image classification. Adv. Powder Technol. 2021, 32, 3885–3903. [Google Scholar] [CrossRef]
- Niu, Y.; Mostaghimi, P.; Shabaninejad, M.; Swietojanski, P.; Armstrong, R.T. Digital Rock Segmentation for Petrophysical Analysis With Reduced User Bias Using Convolutional Neural Networks. Water Resour. Res. 2020, 56, e2019WR026597. [Google Scholar] [CrossRef]
- Wang, Y.D.; Shabaninejad, M.; Armstrong, R.T.; Mostaghimi, P. Deep neural networks for improving physical accuracy of 2D and 3D multi-mineral segmentation of rock micro-CT images. Appl. Soft Comput. 2021, 104, 107185. [Google Scholar] [CrossRef]
- Maitre, J.; Bouchard, K.; Bédard, L.P. Mineral grains recognition using computer vision and machine learning. Comput. Geosci. 2019, 130, 84–93. [Google Scholar] [CrossRef]
- Jiang, F.; Gu, Q.; Hao, H.; Li, N.; Wang, B.; Hu, X. A method for automatic grain segmentation of multi-angle cross-polarized microscopic images of sandstone. Comput. Geosci. 2018, 115, 143–153. [Google Scholar] [CrossRef]
- Ren, X.; Malik, J. Learning a classification model for segmentation. In Proceedings of the Ninth IEEE International Conference on Computer Vision, Nice, France, 13–16 October 2003; Volume 1, pp. 10–17. [Google Scholar] [CrossRef]
- Achanta, R.; Shaji, A.; Smith, K.; Lucchi, A.; Fua, P.; Süsstrunk, S. SLIC Superpixels Compared to State-of-the-Art Superpixel Methods. IEEE Trans. Pattern Anal. Mach. Intell. 2012, 34, 2274–2282. [Google Scholar] [CrossRef]
- Wang, S.; Lu, H.; Yang, F.; Yang, M.H. Superpixel tracking. In Proceedings of the 2011 International Conference on Computer Vision, Barcelona, Spain, 6–13 November 2011; pp. 1323–1330. [Google Scholar]
- Wang, L.; Lu, H.; Yang, M.H. Constrained Superpixel Tracking. IEEE Trans. Cybern. 2018, 48, 1030–1041. [Google Scholar] [CrossRef]
- Tian, Z.; Liu, L.; Zhang, Z.; Fei, B. Superpixel-Based Segmentation for 3D Prostate MR Images. IEEE Trans. Med. Imaging 2016, 35, 791–801. [Google Scholar] [CrossRef]
- Zhang, S.; Wang, H.; Huang, W.; You, Z. Plant diseased leaf segmentation and recognition by fusion of superpixel, K-means and PHOG. Optik 2018, 157, 866–872. [Google Scholar] [CrossRef]
- Dabek, P.; Chudy, K.; Nowak, I.; Zimroz, R. Grain segmentation in sandstone thin-section based on computer analysis of microscopic images. IOP Publishing 2022. submitted. [Google Scholar]
Disclaimer/Publisher’s Note: The statements, opinions and data contained in all publications are solely those of the individual author(s) and contributor(s) and not of MDPI and/or the editor(s). MDPI and/or the editor(s) disclaim responsibility for any injury to people or property resulting from any ideas, methods, instructions or products referred to in the content. |
© 2023 by the authors. Licensee MDPI, Basel, Switzerland. This article is an open access article distributed under the terms and conditions of the Creative Commons Attribution (CC BY) license (https://creativecommons.org/licenses/by/4.0/).


