Article

Adsorption Difference of Octadecylamine on (002) and (131) Crystal Planes of Fine Muscovite and Its Guidance on Fine Muscovite Flotation

1
School of Resources and Environmental Engineering, Wuhan University of Technology, Wuhan 430070, China
2
Hubei Key Laboratory of Mineral Resources Processing and Environment, Wuhan 430070, China
3
State Environmental Protection Key Laboratory of Mineral Metallurgical Resources Utilization and Pollution Control, Wuhan University of Science and Technology, Wuhan 430081, China
4
Hubei Collaborative Innovation Center for High Efficient Utilization of Vanadium Resources, Wuhan University of Science and Technology, Wuhan 430081, China
*
Author to whom correspondence should be addressed.
Minerals 2023, 13(4), 519; https://doi.org/10.3390/min13040519
Submission received: 20 March 2023 / Revised: 3 April 2023 / Accepted: 4 April 2023 / Published: 6 April 2023
(This article belongs to the Special Issue Advances on Fine Particles and Bubbles Flotation)

Abstract

:
Muscovite has a typical dioctahedral crystal structure. The atoms arranged in different directions of the crystal lattice will cause the anisotropy of the physical and chemical properties of the muscovite crystal planes, which also leads to the anisotropy of these crystal planes in flotation. In this study, Materials Studio 7.0 software was used to optimize muscovite crystal cells, and some properties of the (002) crystal plane and (131) crystal plane were calculated to obtain the anisotropy of these two crystal planes in some aspects, so as to further analyze their influence on flotation behavior. The differences of adsorption between these two crystal planes and octadecamine (ODA) were analyzed by XRD and flotation. The results showed that (002) has higher surface energy and was more easily exposed than (131). Compared with Si-O bond, Al-O bond in muscovite had lower covalent bond composition and was easier to break. O atom was the active site in the flotation of muscovite, and the (131) crystal plane was more likely to adsorb with ODA than (002) crystal plane. Through the simulation results, more (131) crystal planes can be exposed in the grinding stage to improve the flotation efficiency.

1. Introduction

Muscovite is a typical tetrahedron-octahedral-tetrahedral (TOT)-layered silicate mineral [1,2,3], usually in plate or sheet form. It has excellent dielectric properties and high thermal stability, and is widely used in construction, metallurgy, and cosmetics industries [4,5,6,7,8]. Flotation plays a very important role in muscovite beneficiation. Among many flotation agents, the interaction mechanism between cationic collector and muscovite is widely studied. It was concluded that the longer the carbon chain of alkyl primary amines is, the better the surface hydrophobicity of muscovite can be improved [9]. Many scholars have demonstrated this view by combining molecular dynamics simulations. Due to the differences in chemical and physical properties of muscovite crystals, such as surface electrical properties and wettability and adsorption properties [10,11,12,13,14], the anisotropy of each crystal plane of muscovite results in different consequences when it interacts with reagents.
Many complex studies have now become readily available using simulation methods. Materials Studio software enables the inexpensive simulations of certain properties of crystals, and molecular dynamics (MD) simulations [15,16,17,18,19,20,21] are a valuable tool for studying the adsorption of surfactants on solid surfaces at the microscopic level. The molecular dynamics simulation is based on density functional theory. After calculating the electronic properties of mineral crystals by density functional theory, the related properties of mineral crystals and their surfaces can be studied more simply and accurately on this basis, as well as the interaction mechanism between different crystal planes and chemical substances. Gao et al. [22] simulated the total energy of scheelite crystals and the surface energy of different surfaces. The results show that the order of surface energy of scheelite crystal planes is (001) < (112) < (111) < (110) < (100). According to the summary of the crystal anisotropy of phyllosilicate minerals and its relationship with flotation, the order of the fracture bond density of phyllosilicate minerals surface is NAl-O (100) > NAl-O (010) > NAl-O(110), NSi-O (100) > NSi-O (010) > NSi-O(110), and the order of hydrophobicity is (110) plane > (010) plane > (100) plane [23]. MD simulations are also used to simulate and calculate the fracture bond density and surface energy of the different crystal planes of smithite [24], so as to obtain the relationship between them. The simulation results show that the surface energy increases with the increase in fracture bond density. Not only that, MD simulations are also used [25] to research the adsorption equilibrium structure of octadecamine(ODA) on chlorite (001) and plane (100); the results show that chlorite (001) has a strong adsorption on ODA, while chlorite (100) has a weak adsorption on ODA. Although many scholars have simulated the adsorption mechanism of muscovite and agents, most of them focus on a common crystal surface of muscovite crystal, and few people have conducted comparative studies on the effect of a certain agent on different crystal surfaces of muscovite. Before flotation, different media or parameters can be selected for the grinding of muscovite samples [26], so that more crystal planes with strong adsorption of reagents can be exposed, thus improving the flotation efficiency of muscovite. In this study, the surface energy and fracture bond density of the (002) crystal plane and (131) crystal plane of muscovite were simulated by Materials Studio 7.0, and the properties of muscovite crystal were calculated to obtain the difference between the physical and chemical properties of these two crystal planes. The adsorption process of ODA on two crystal planes of muscovite was simulated by molecular dynamics and the differences in ODA adsorption between the two crystal surfaces were verified by flotation tests.

2. Theoretical and Experimental Sections

In the theoretical part, a series of operational processes for calculating muscovite using Materials Studio software are shown in Figure 1. For details, see Section 2.1, Section 2.2 and Section 2.3.

2.1. Models

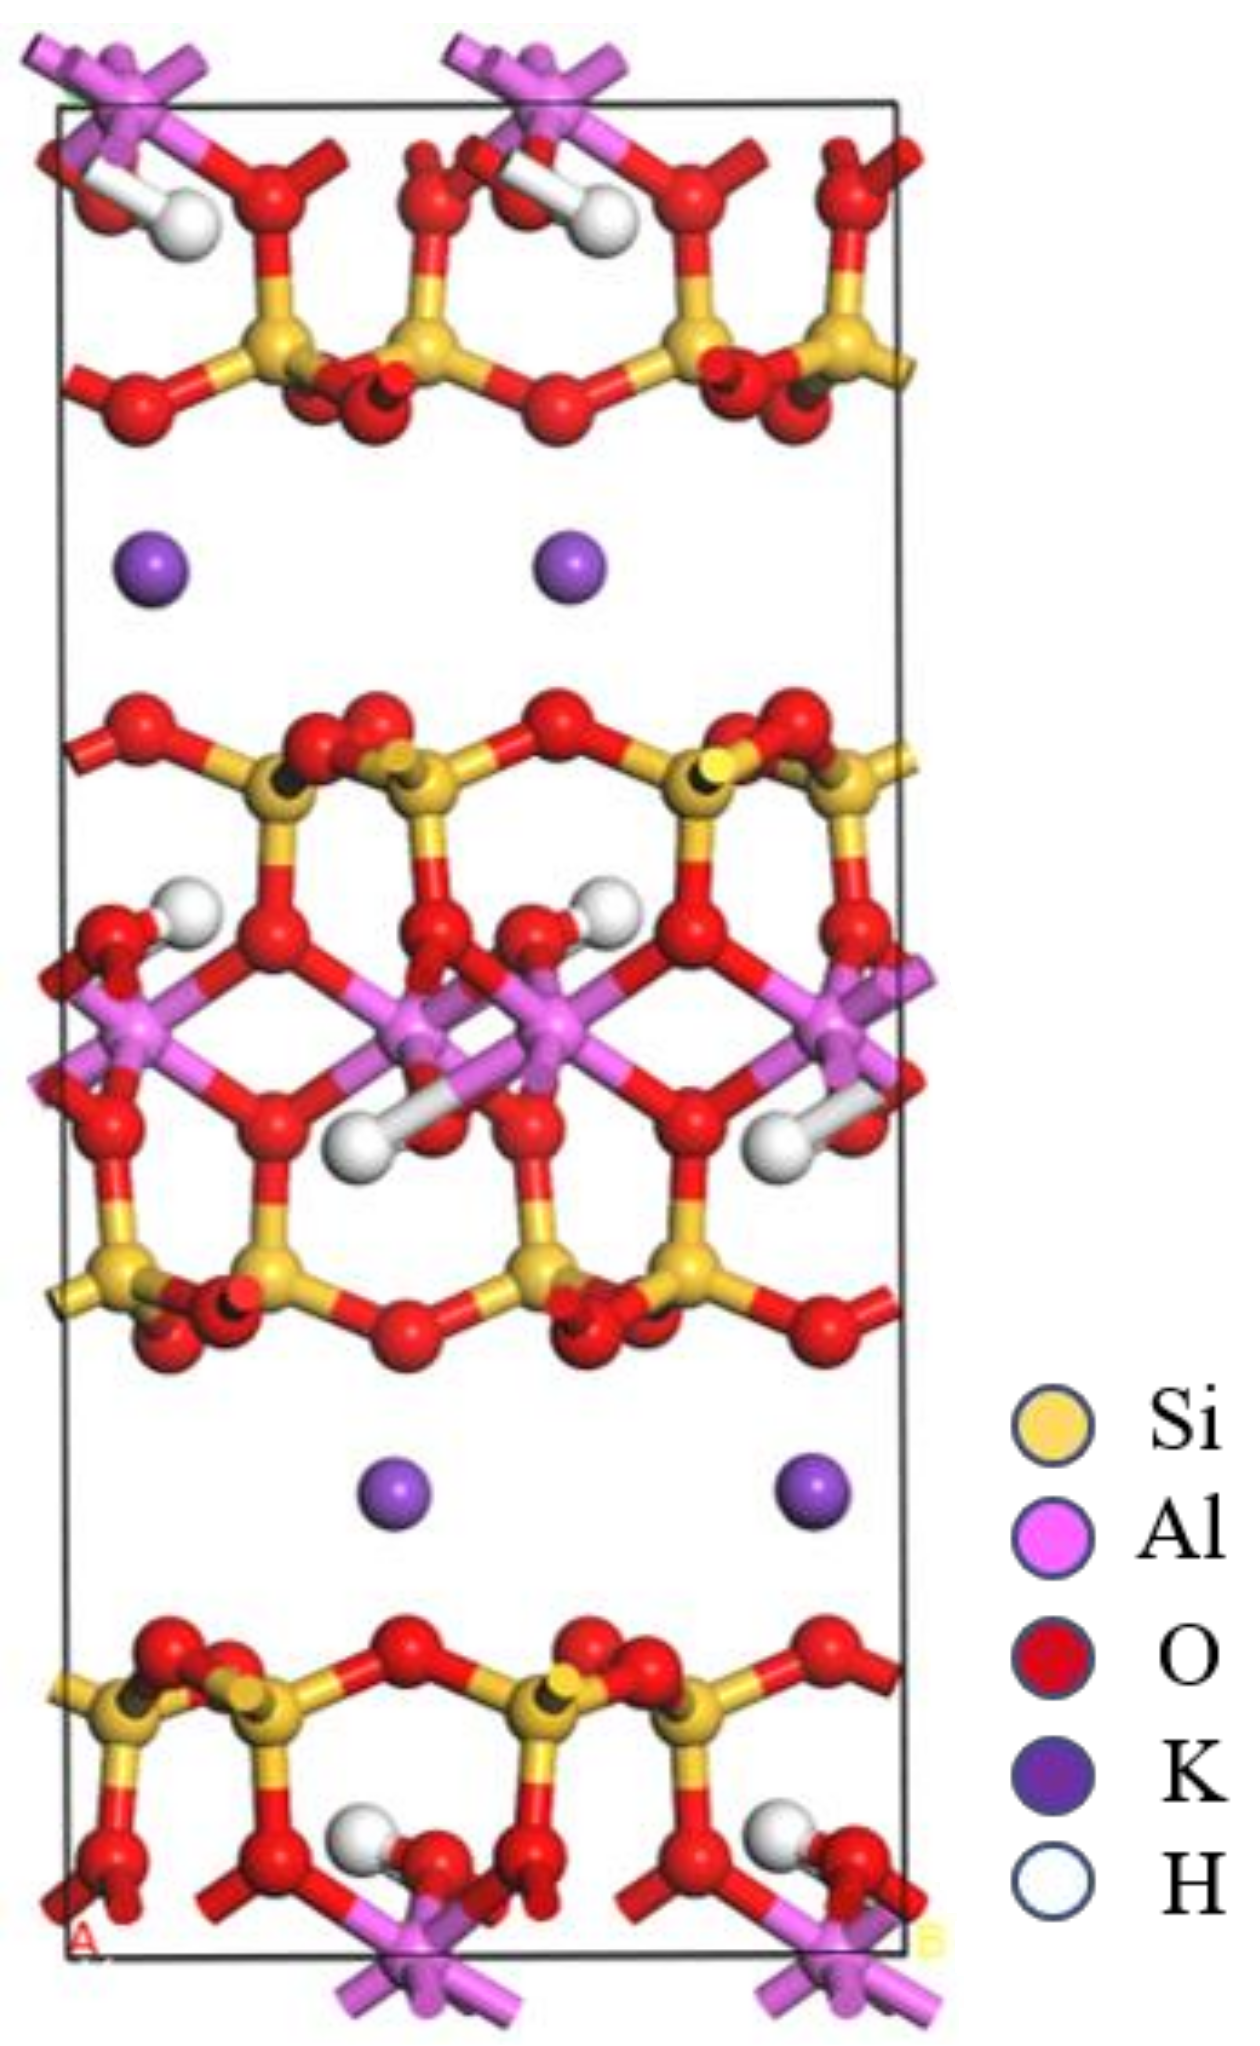
The structural formula of muscovite is KAl2(AlSi3O10)(OH)2, and its crystalline structure is a compound silico-oxygen layer with two silico-oxygen tetrahedrons sandwiched by an alumino-oxygen octahedron [27]. The crystal structure of monoclinic C2/C muscovite (Figure 2), which serves as the initial input structure for the MD simulation, was obtained by analyzing the single crystal diffraction data. Muscovite primitive cell parameters were as follows: a = 5.212 , b = 9.042 , c = 20.084 , alpha = 90°, beta = 95.78°, gamma = 90°.
ODA was used as the collector in the flotation test of muscovite. The molecular formula of ODA is CH3(CH2)16CH2NH2. The optimized structure of ODA is shown in Figure 3.

2.2. Crystal Structure Optimization

MD simulation was performed using Material Studio 7.0 software. Firstly, the CASTEP module was used to optimize the crystal structure of muscovite, and three parameters—function, energy cutoff, and k-points—were tested. The energy cutoff was 400 eV, the k-points were 3 × 2 × 1, the mass was fine precision, and other parameters were not changed. For the generalized gradient approximation under the five density functions optimization calculation of muscovite lattice parameters, the results are shown in Table 1. It showed that when the function was GGA-PBESOL, muscovite phase had the lowest energy and the structure of muscovite was the most stable. Therefore, the function was selected as GGA-PBESOL.
With other parameters unchanged, GGA-PBESOL was selected as the function, and different energy cutoffs were selected to optimize the calculation of muscovite cells. The cell parameters and total energy of muscovite obtained are shown in Figure 4. It shows that the muscovite phase always decreased with the increase in energy cutoff. When the energy cutoff was 550 eV, the total energy of muscovite reached the lowest value and then began to decline. When the energy cutoff was higher than 500 eV, the lattice constant error of muscovite also tended to be stable, at about 0.7, so the optimized energy cutoff of muscovite was selected as 550 eV.
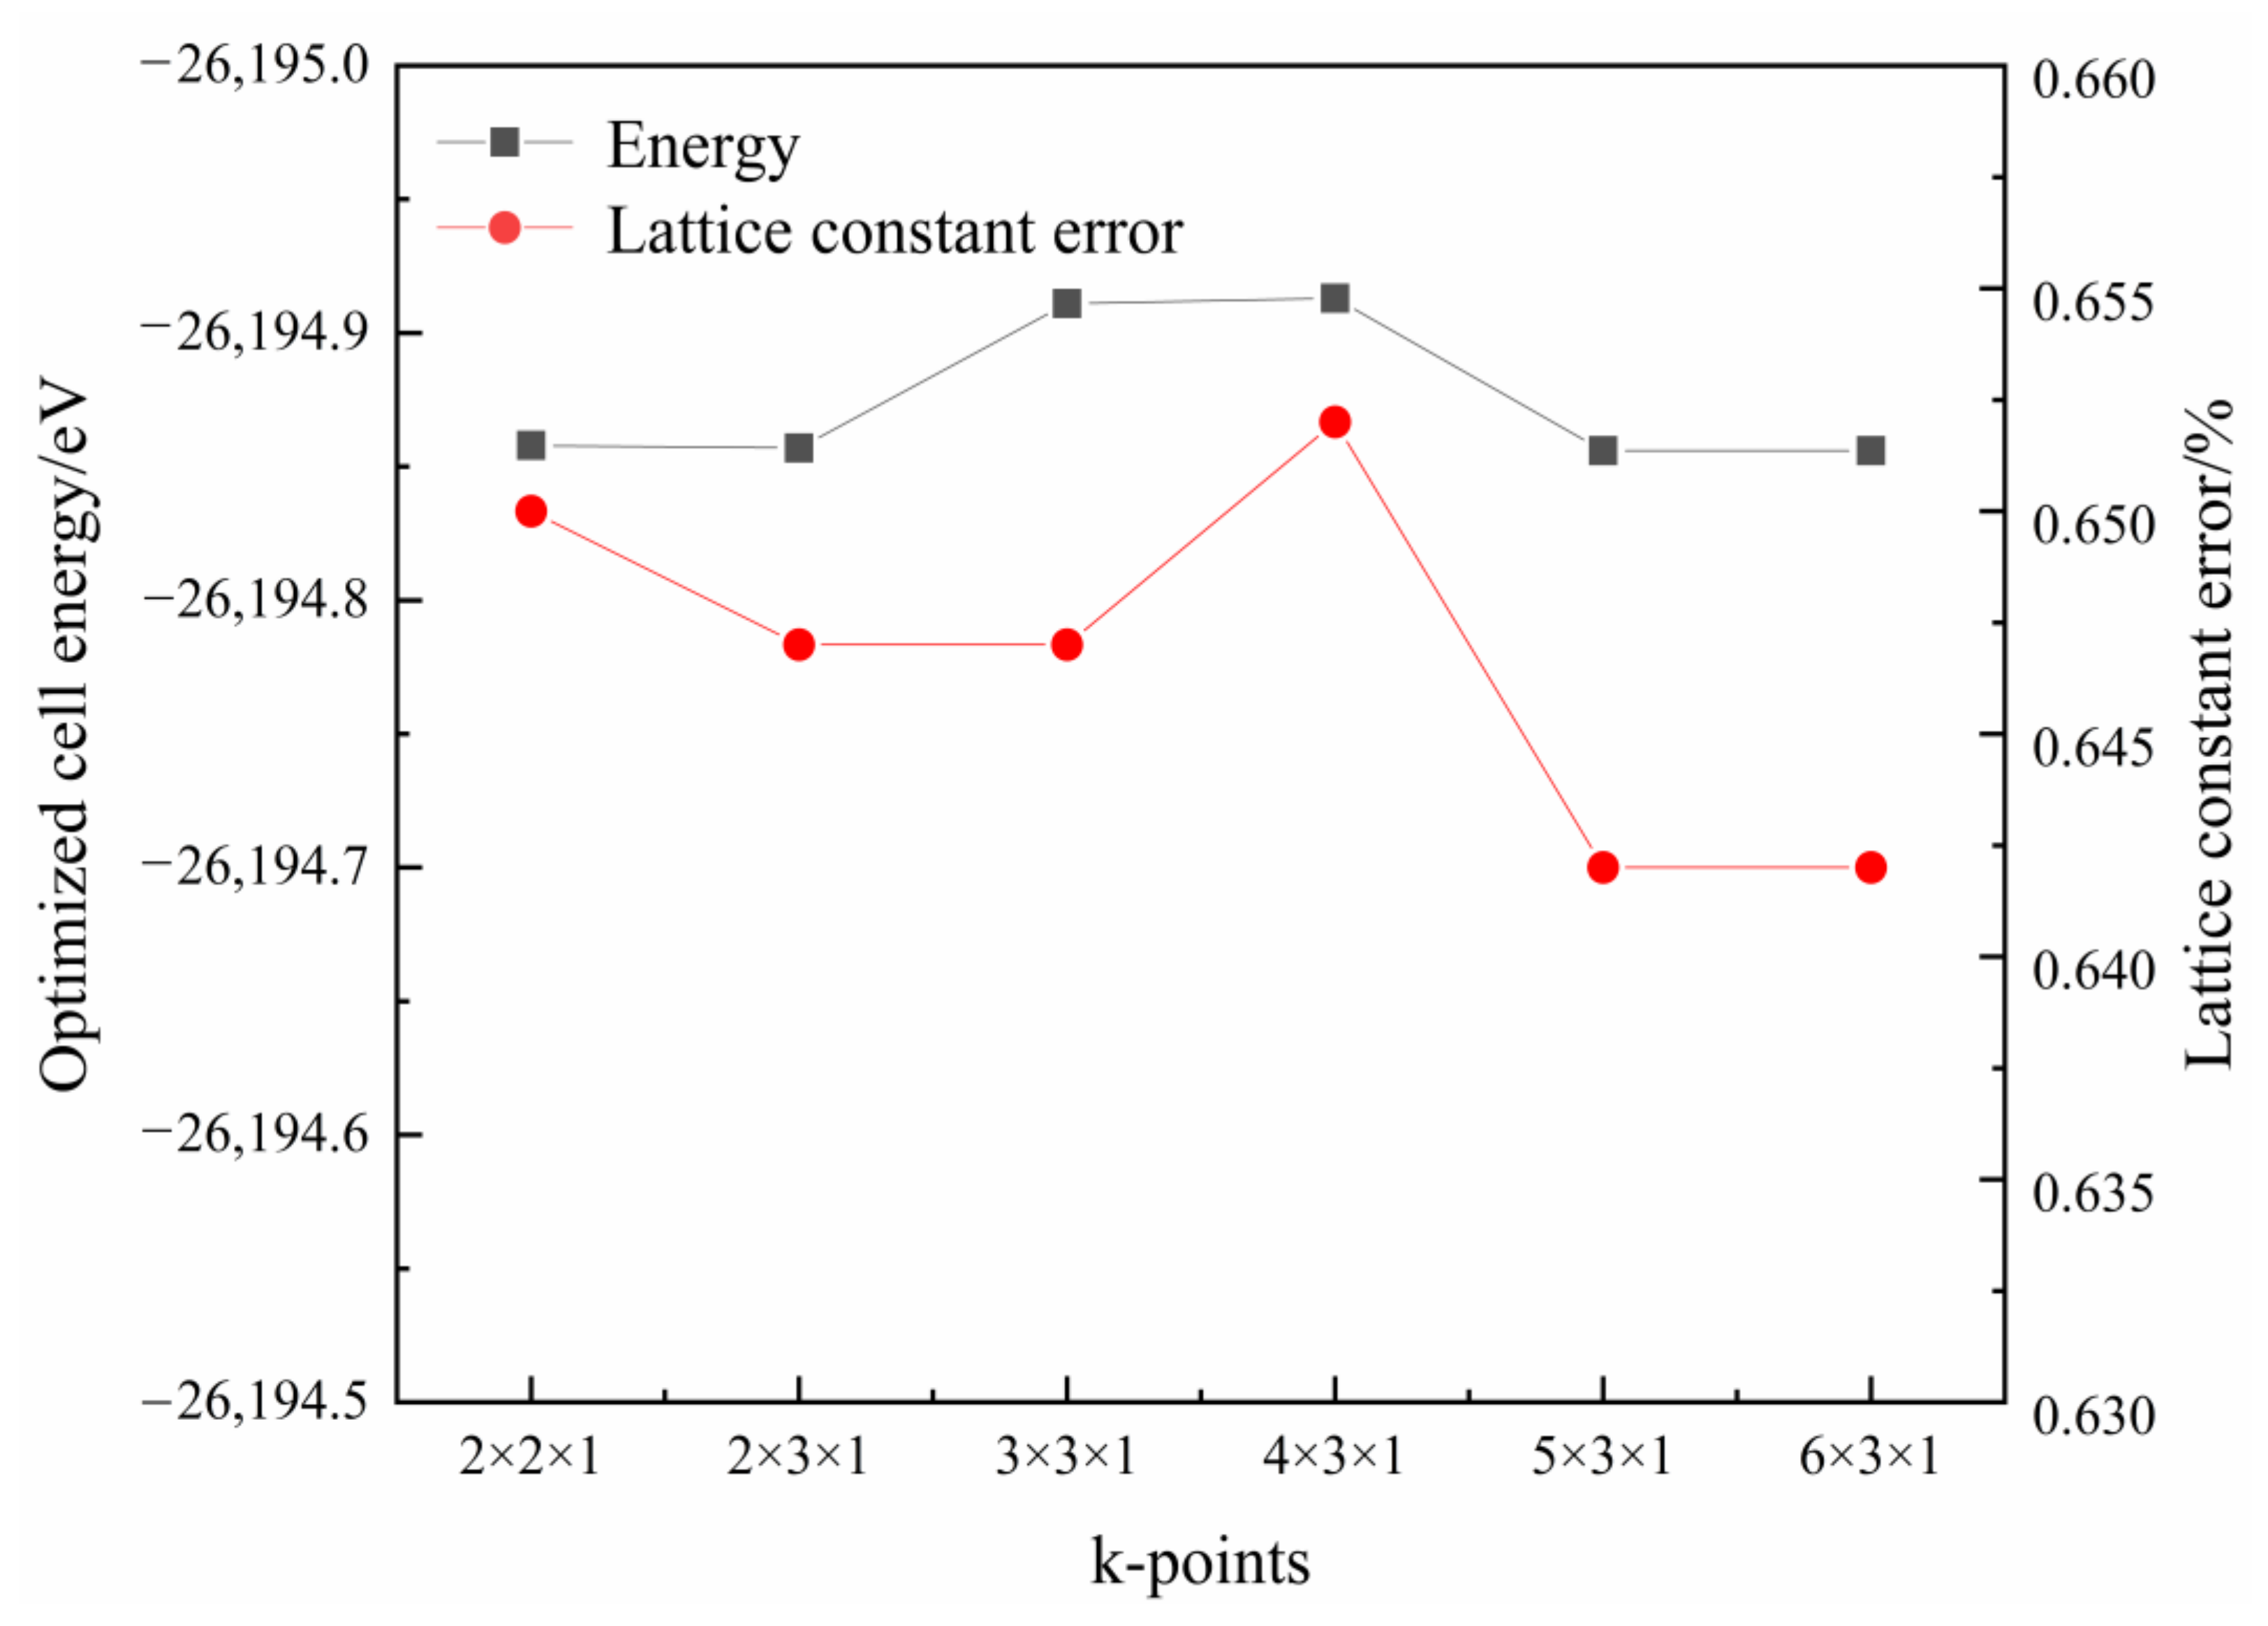
The function was selected as GGA-PBESOL, and the energy cutoff was 550 eV. The k-points convergence tests were conducted, and the obtained muscovite parameter error and total cell energy are shown in Figure 5. After determining the exchange correlation function and truncation energy, the change in k-points had little influence on the total energy of muscovite crystal. The energy changes were all within 0.1 eV, and the lattice constant errors were all less than 1%. When the k-points were 4 × 3 × 1, the total energy of muscovite was the lowest, but when the k-points were 5 × 3 × 1, the lattice error was only 0.642%, and the lattice constant was the closest to the experimental value. Therefore, the k-points chosen for calculating the relevant properties of muscovite were 5 × 3 × 1.
Under these conditions, the calculated total energy of the system was −26,194.856 eV, and the error between the lattice constant and the experimental value was 0.642%. The calculation was reasonable. The method adopted and the parameters selected were reliable.

2.3. Calculation Quantity

2.3.1. Population Analysis

Mulliken population analysis is a data method for analyzing the extranuclear distribution of electrons in atoms, molecules, and crystals, which can be analyzed by atom population valence bond properties, orbital hybridization, and electron transfer in chemical changes [28]. The Mulliken population consists of two parts: the overlapping population and atomic population. The overlap population is a parameter to characterize bond covalence and the Mulliken charge in an atomic population is a parameter to characterize atomic ion properties.
The CASTEP module was used to calculate the performance of the optimized muscovite crystal structure. Properties were selected in the task bar for calculation, and population analysis was selected for specific properties. Other parameters remained unchanged.

2.3.2. Surface Energy and Fracture Bond Density

The number of unsaturated bonds per unit area is called the fracture bonds density [29], which can reflect the degree of mineral cleavage along the direction of a crystal plane. The lower the fracture bond density, the more easily the mineral cleavage along a crystal plane direction. Surface energy [30] is the energy required to break the crystal cleavage into two independent surfaces along the direction of a crystal plane under the action of external forces.
The surface energy and fracture bond density of muscovite were calculated using the CASTEP module. The surfaces were selected for cleaved surfaces in the build to cut the (002) and (131) crystal planes of muscovite. Before the calculation of surface energy, the convergence of layer thickness was tested and the appropriate thickness was selected for surface energy calculation. The calculation methods of fracture bond density and surface energy are shown in Formulas (1) and (2) [31,32].
D b = N b / S
E s u r = [ E s l a b N s l a b / N b u l k E b u l k ] / 2 A  
where Db is the number of unsaturated bonds in the area of 1 nm2, Nb is the number of unsaturated bonds in the range of unit cell, and S is the area of unit cell. Esur is the surface energy, Eslab represents the total energy of the surface structure, Ebulk is the total energy of the unit cell, Nslab is the number of atoms of the surface structure, Nbulk is the number of atoms of the unit cell, and A is the area of the surface structure along the Z axis.

2.3.3. State Density

State density represents the quantity of electrons allowed per unit energy range, that is, the distribution of electrons in a certain energy range. It shows how atoms interact with each other and how electrons are distributed in different orbitals. It also reveals information about chemical bonds. The CASTEP module of Materials Studio was used to select and calculate the state density of muscovite while conducting lattice optimization.

2.3.4. Electron Density

After the cell parameters and atomic coordinates of the crystal model of muscovite were optimized using the CASTEP module, the electron density of muscovite was analyzed. Its computational convergence accuracy was fine. Among electronic parameters, the sampling point setting (k-points set), SCF iteration error (SCF tolerance) and integration accuracy were all set to fine. The core treatment was set as all electron, the basis set as DND, and the atomic orbital radius (orbital cutoff quality) as medium.

2.3.5. Adsorption Energy

When one or more molecules move above the adsorption interface, a certain amount of energy will be released in the process of its velocity changing from large to small and finally will be adsorbed on the adsorption interface. The energy is called adsorption energy. The adsorption energy of different mineral surfaces interacting with the agent varies. As a result, the strength of the combination between the agent and different mineral surfaces can be judged by the adsorption energy. In the Forcite module, the adsorption configuration of ODA on the crystal planes of muscovite (002) and (131) were constructed and optimized. The adsorption energy calculation method of muscovite surface is shown in Equation (3) [33]:
Δ E = E c o m E s u r f E r e a
where ΔE is the adsorption energy; Ecom, Esurf, and Erea are the optimized adsorbed complex, surface structure, and total energy of adsorbed substance, respectively. If the adsorption energy is spontaneous, the adsorption energy result is negative, and the smaller the adsorption energy is, the more stable the adsorption is. When the adsorption energy is 0 or positive, the adsorption cannot be spontaneous.

2.4. XRD

After weighing 0.5 g of muscovite raw ore and muscovite concentrate after flotation under different conditions, an XRD test was carried out to analyze the intensity changes in the (002) crystal plane and (131) crystal plane before and after flotation. The analysis was performed on a Netherlands Empyrean D8 Advance X-ray powder diffractometer with Kα radiation (λ = 0.15406 nm) at a scanning rate of 10°/min.

2.5. Flotation Test

An XFGC suspension flotation machine was used for a single mineral flotation. The mixing speed was kept at 2000 rpm. A total of 2 g muscovite was weighed for each experiment. After adding samples, the pulp was stirred for 3 min until fully mixed. The pH was adjusted and the pulp was stirred for 3 min; then, ODA was added and the pulp was stirred for another 3 min. Finally, the bubbles were aerated and scraped for 4 min. Finally, the concentrate and tailings obtained by flotation were dried, weighed, and the recovery was calculated.
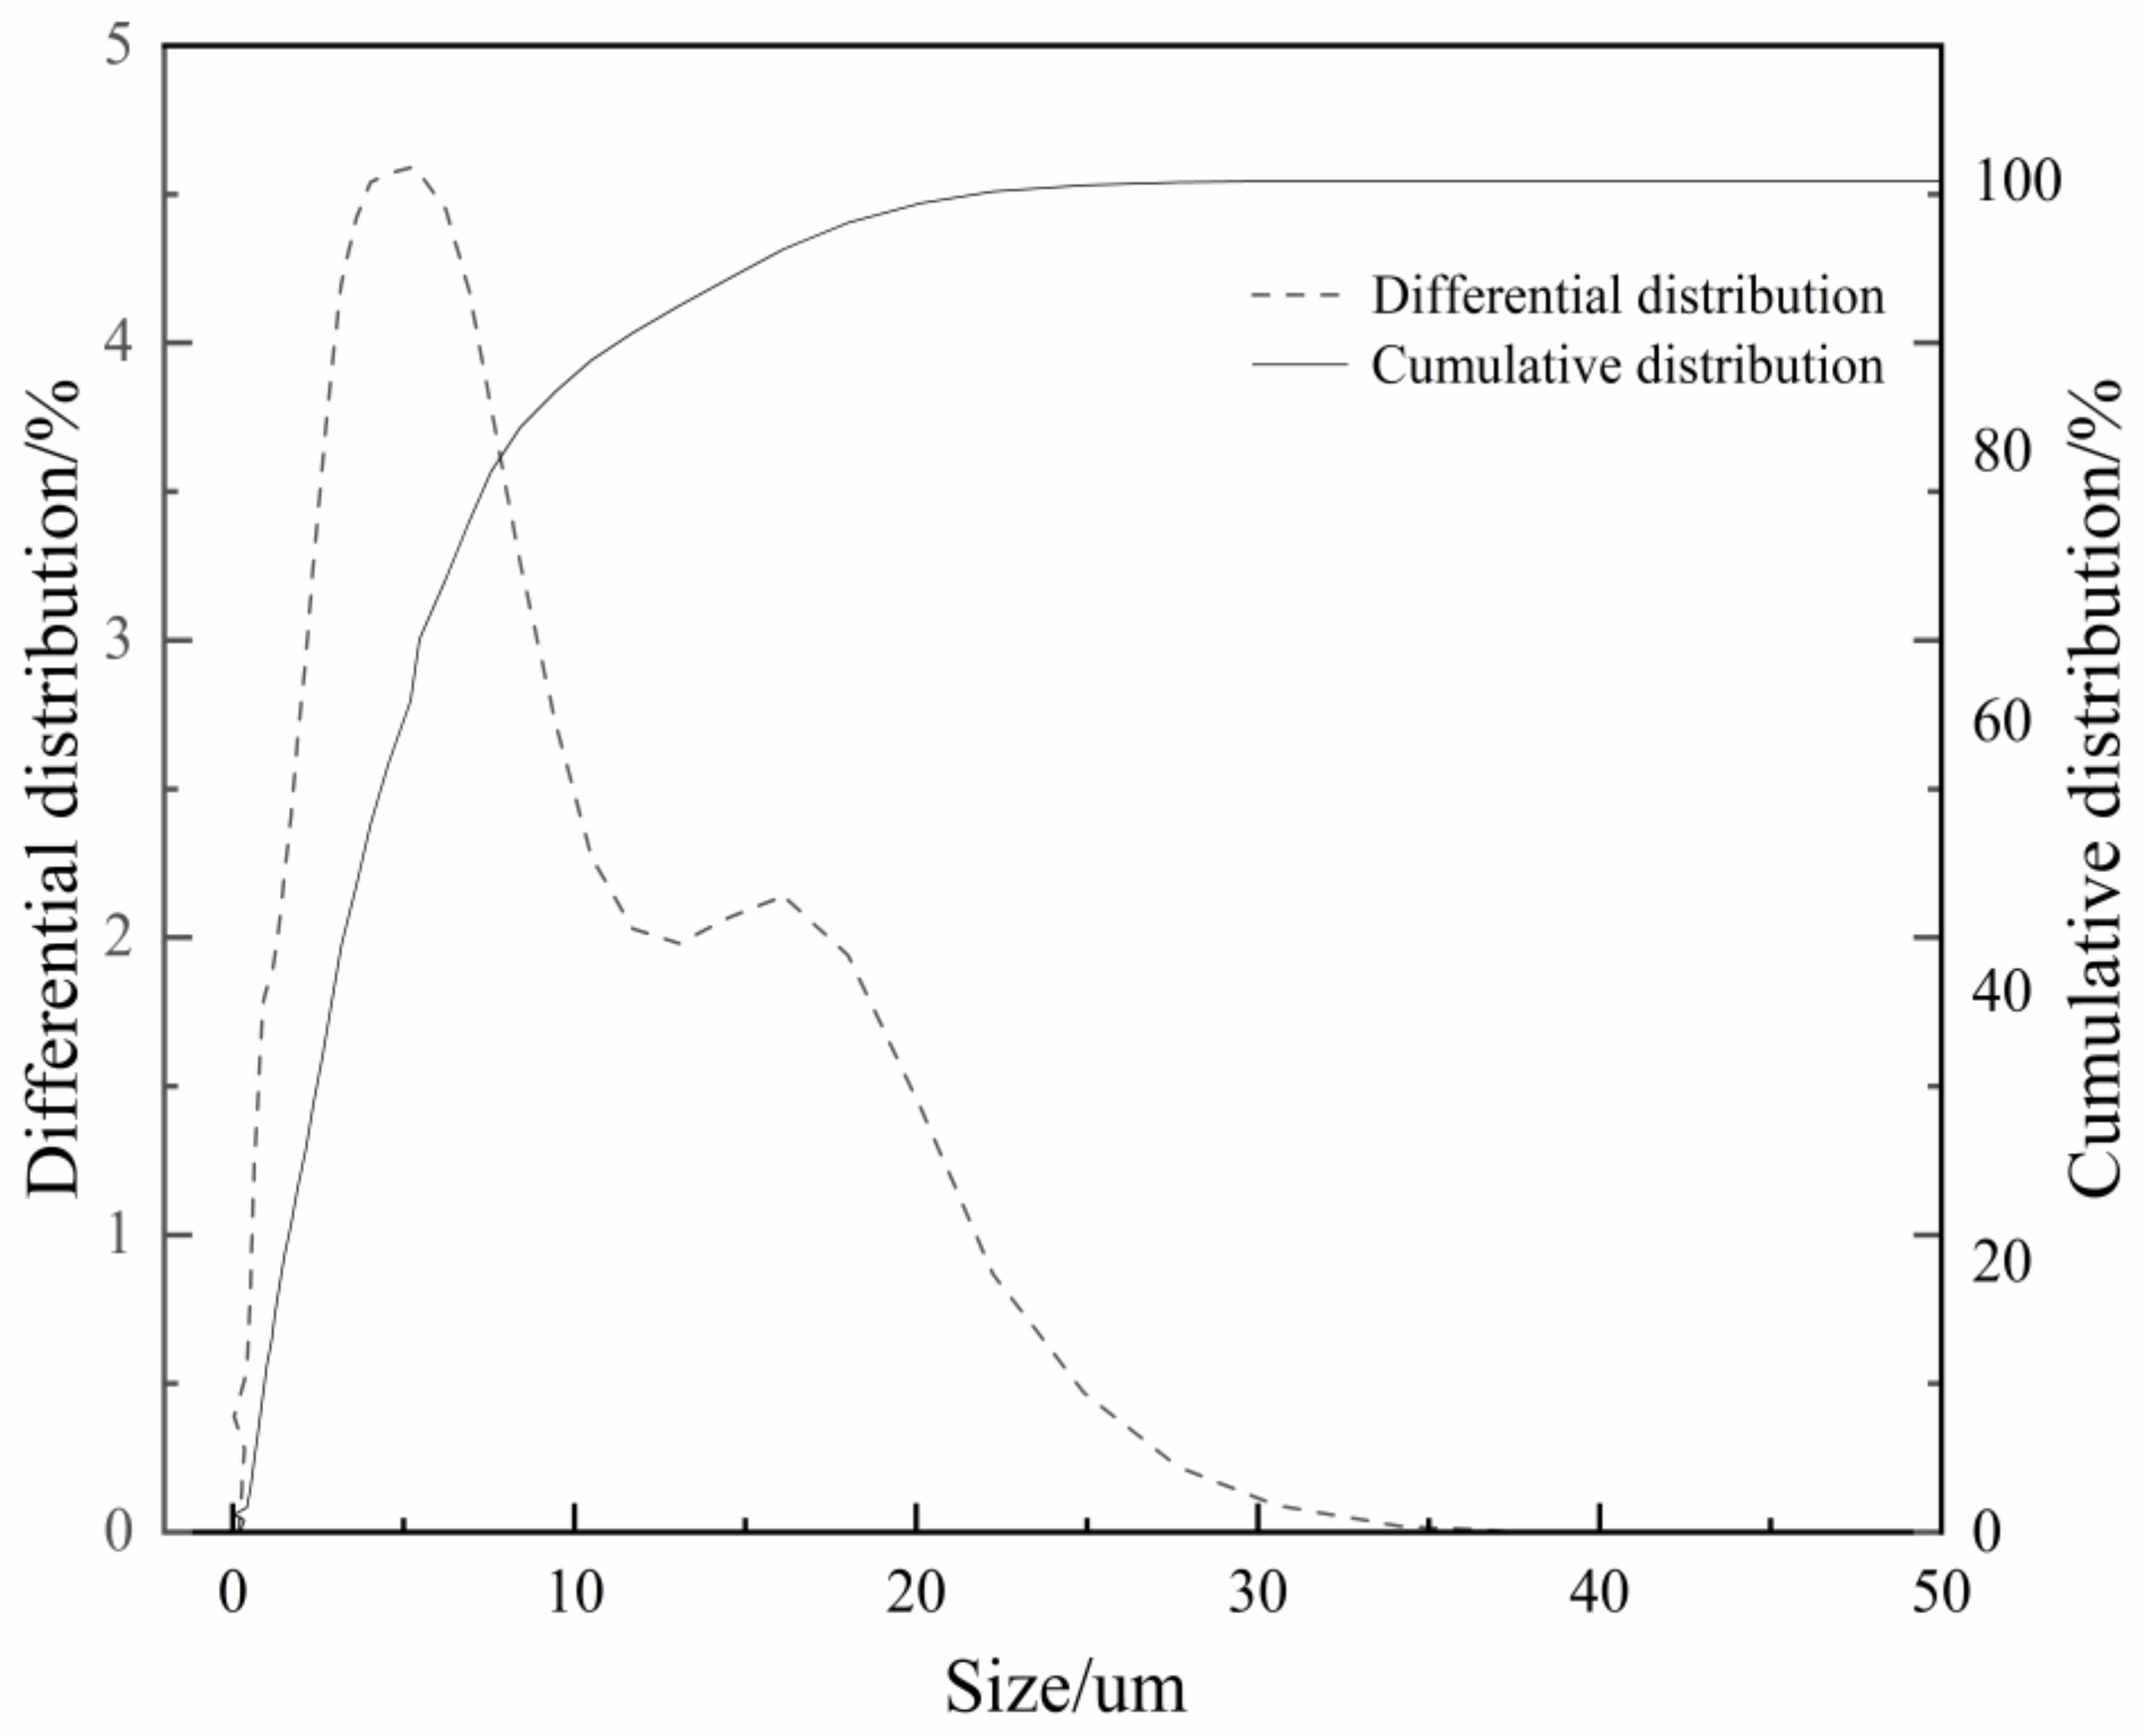
The particle size of muscovite used for flotation is shown in Figure 6. The average of the sample is 4.02 um and P80 is 8.45 um. The particle density of the muscovite sample is 2.86 g/cm3.

3. Results and Discussion

3.1. Population Analysis and Electron Density of Muscovite

The population analysis of the optimized muscovite atoms is shown in Table 2, in which H, Al, and K atoms had two configurations, O atom had seven configurations, and Si atom had three configurations. Although there were many kinds of configurations, the charge changed little and the law was the same. H, Al, Si, and K atoms lost about 0.4, 1.7, 1.9, and 1.5 electrons, respectively, and were electron donors. O obtained about 1.1 electrons and was an electron acceptor.
The ionic and covalent properties of the interatomic bonds of muscovite can be reflected by the Mulliken bond population value. If the population value is greater than 0, the atoms form bonds. The larger the population value, the more covalent components of the bonds, and the smaller the ionic bonds, the more components. Table 3 illustrates that only Al and Si atoms in muscovite bond with oxygen, and the population value between O and Si was 0.61, indicating more covalent components, while the population value between O and Al was 0.30. More O-Al ionic bonding components compared to O-Si, so when muscovite was destroyed, O-Al was more likely to fracture than O-Si.
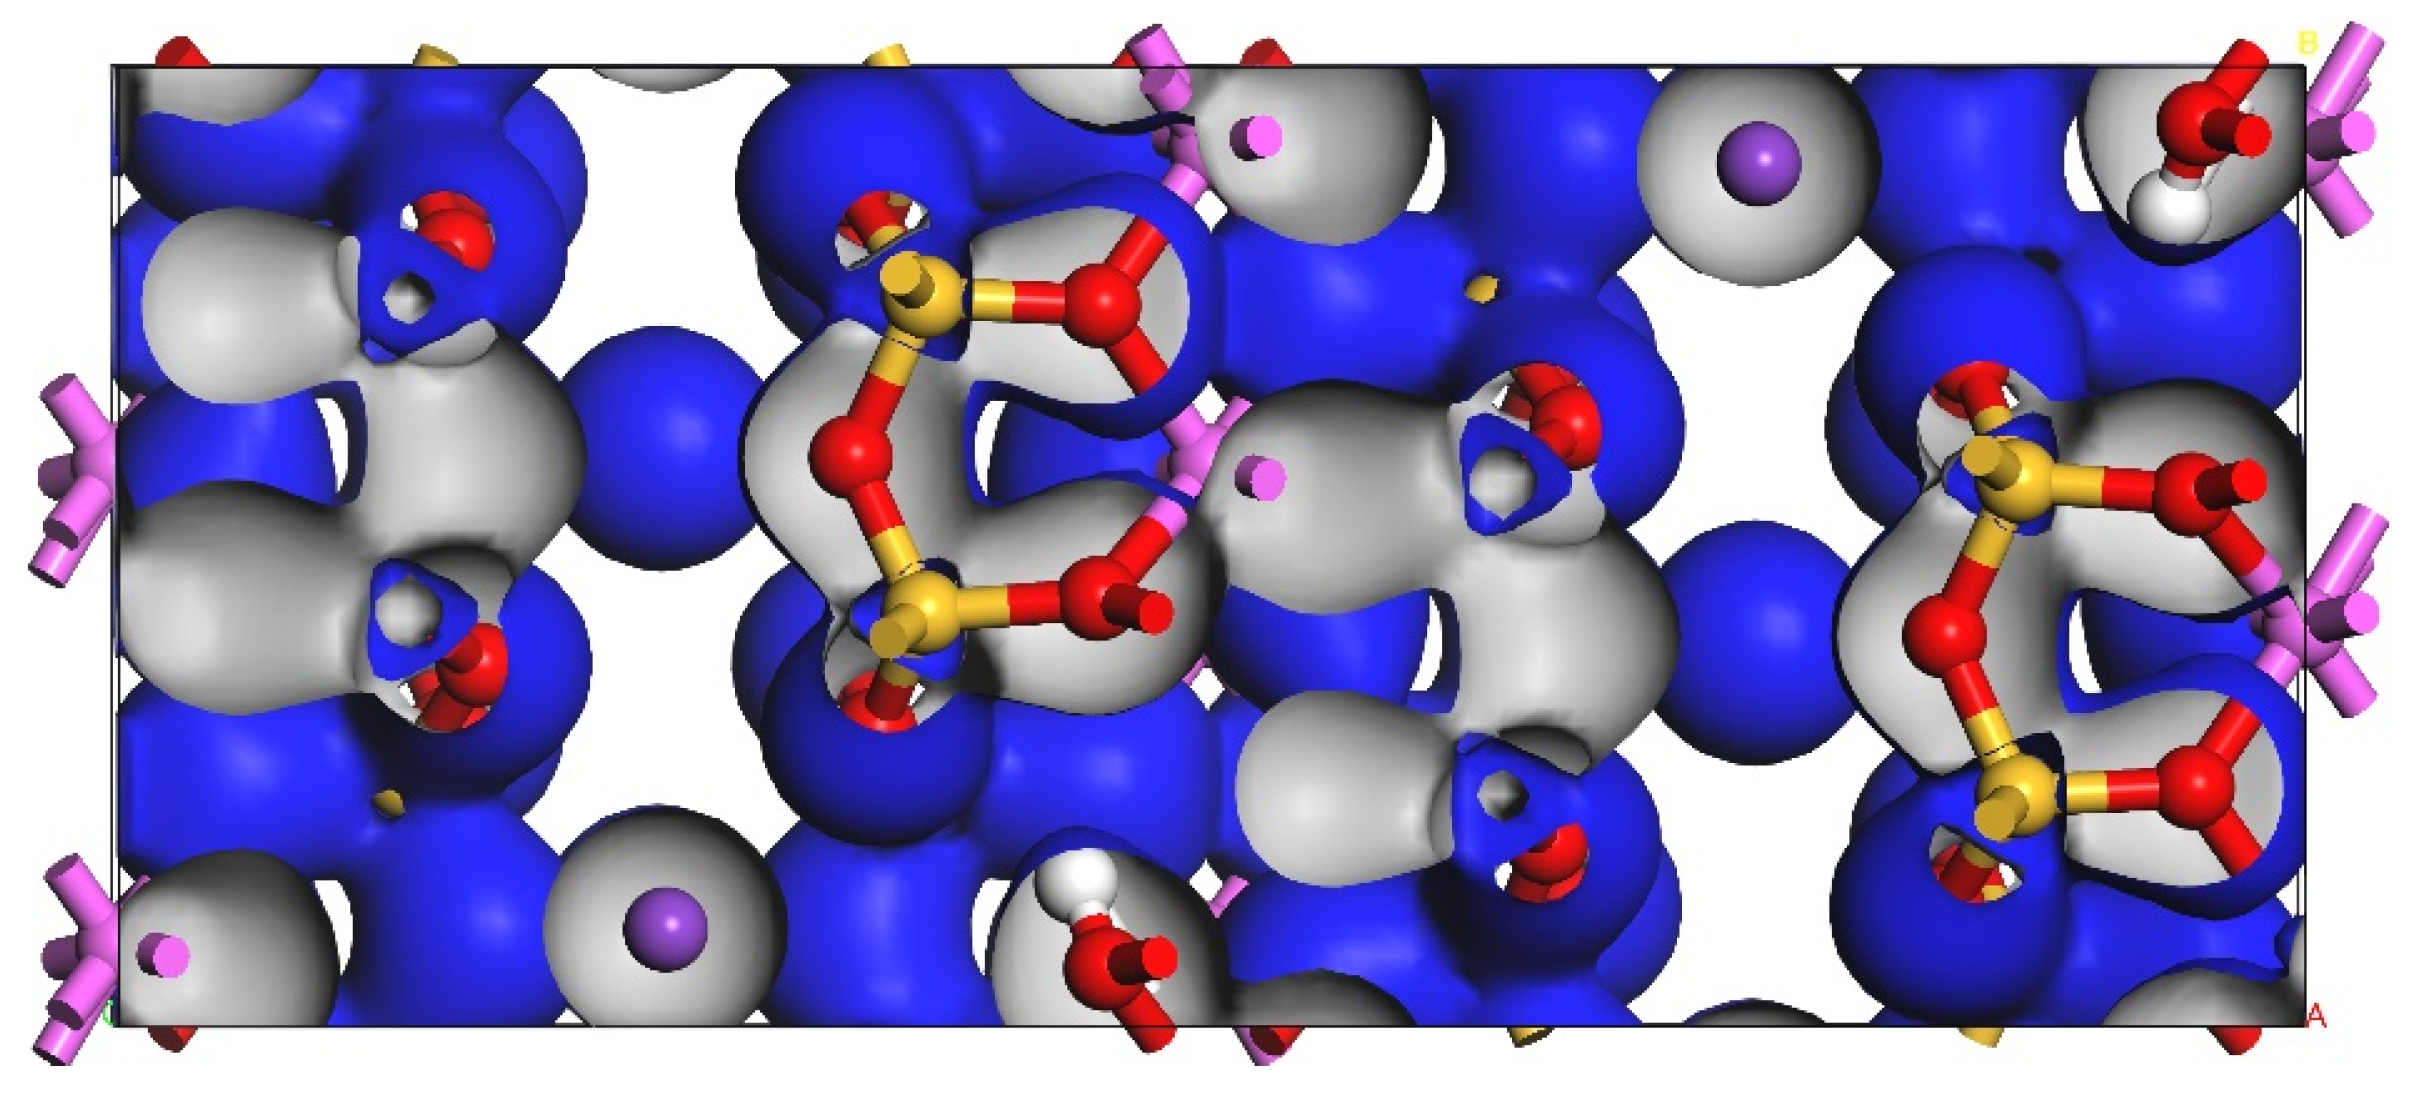
Figure 7 shows the electron density diagram of muscovite simulated by CASTEP. The blue part indicates that the atom lost electrons, while the grey part indicates that the atom gained electrons. As can be seen from Figure 7, in the alumino-oxygen tetrahedron and silico-oxygen octahedron of muscovite, only the oxygen atom has charge and presents a state of negative charge, indicating that the oxygen atom was a relatively active atom in muscovite.

3.2. Anisotropy of Fracture Bond Density and Surface Energy at (002) and (131) Planes of Muscovite

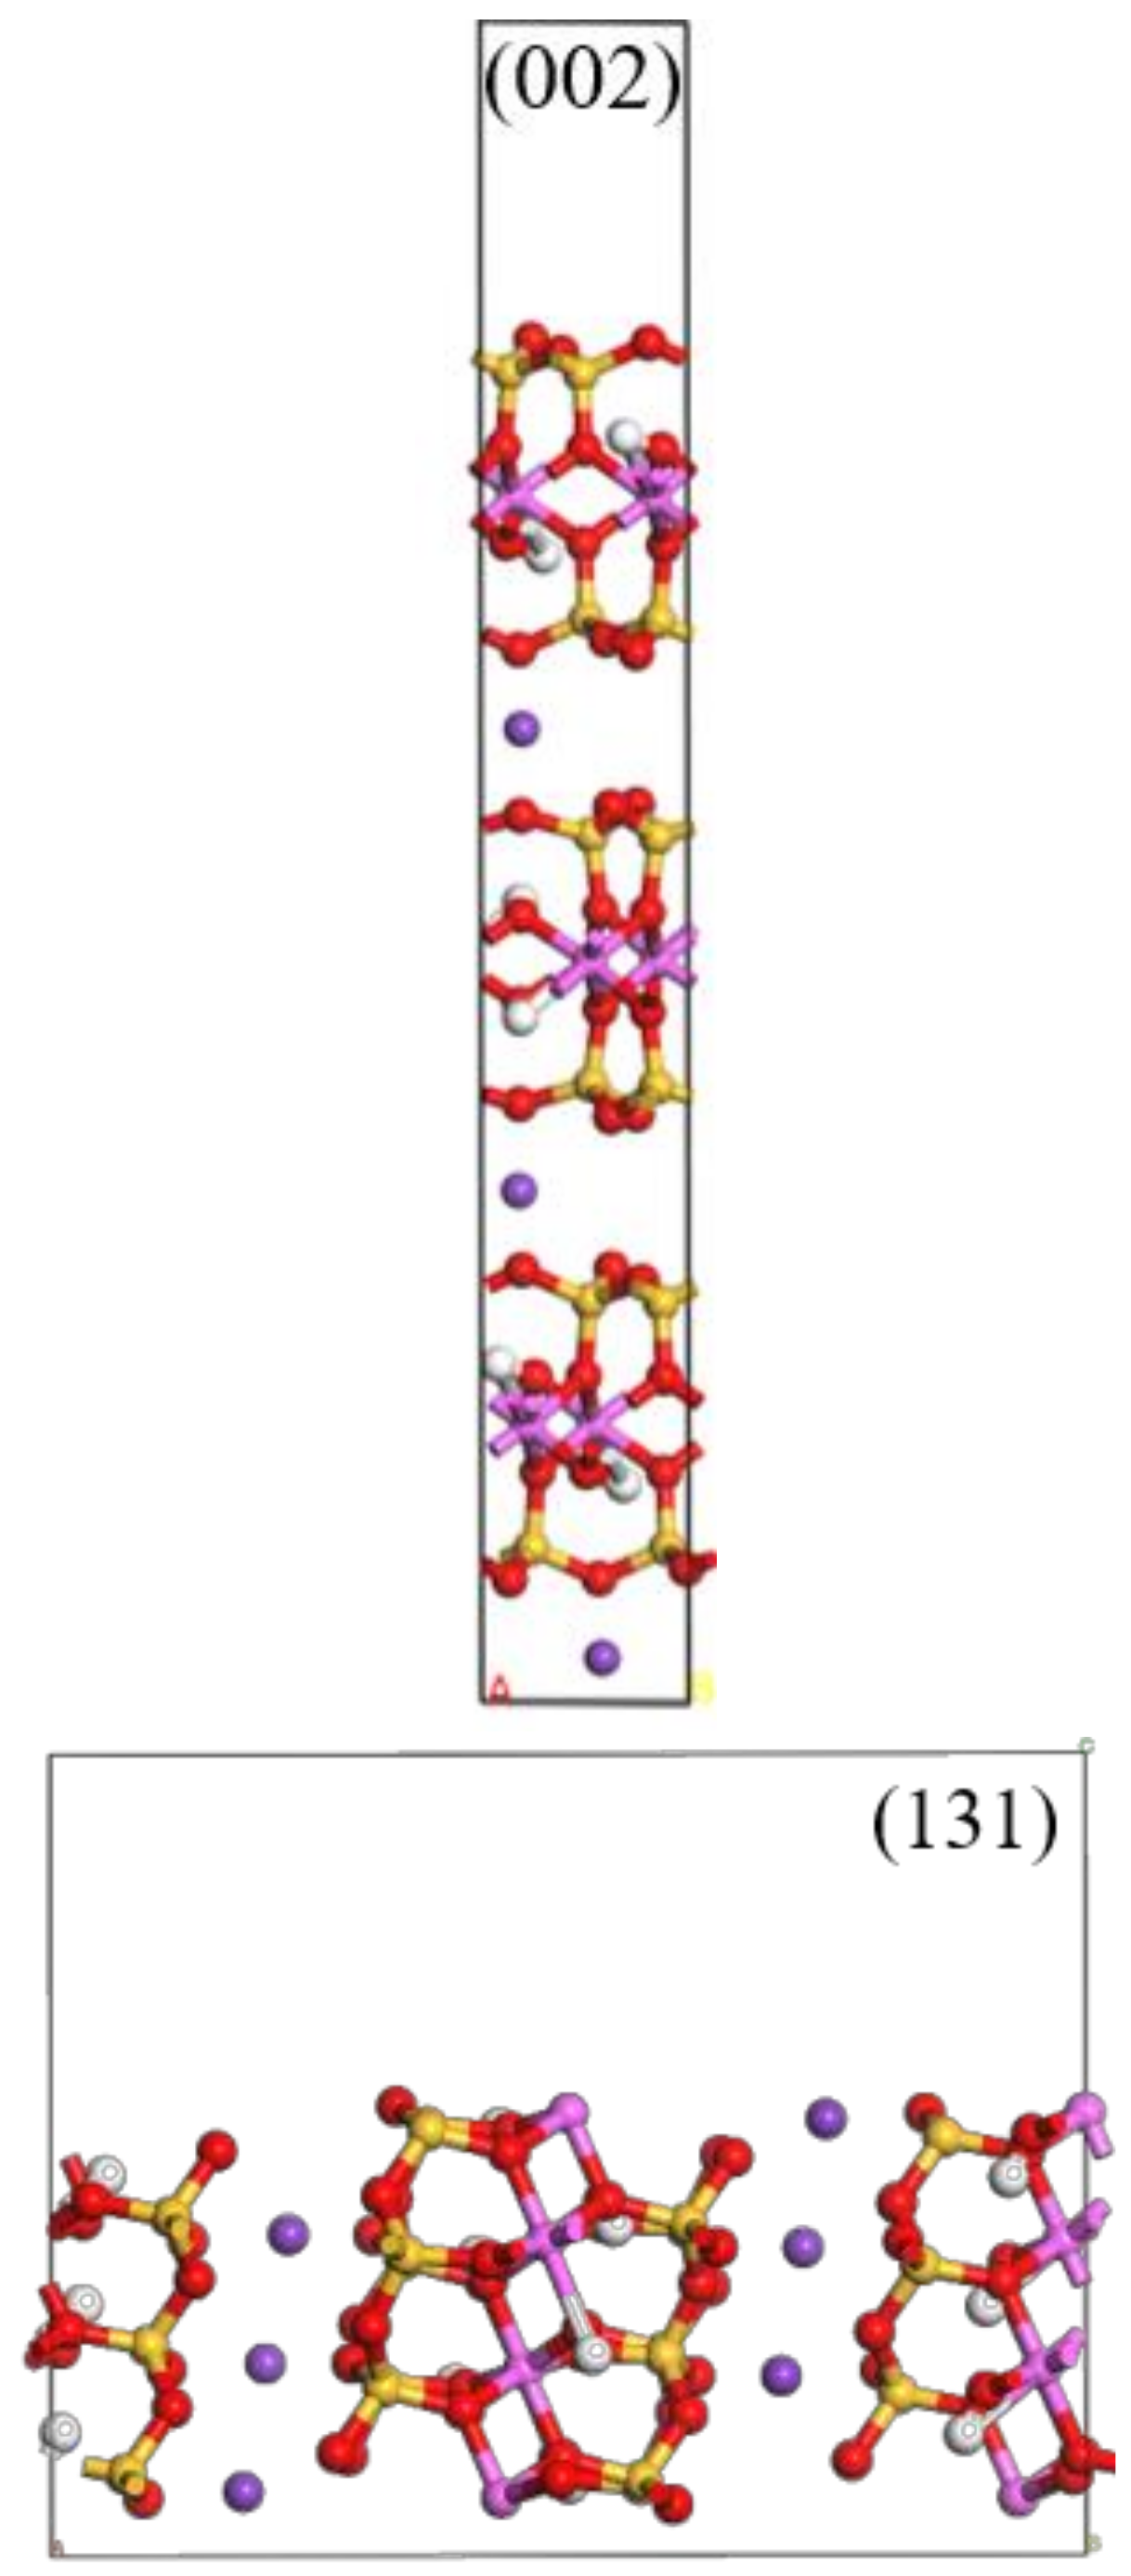
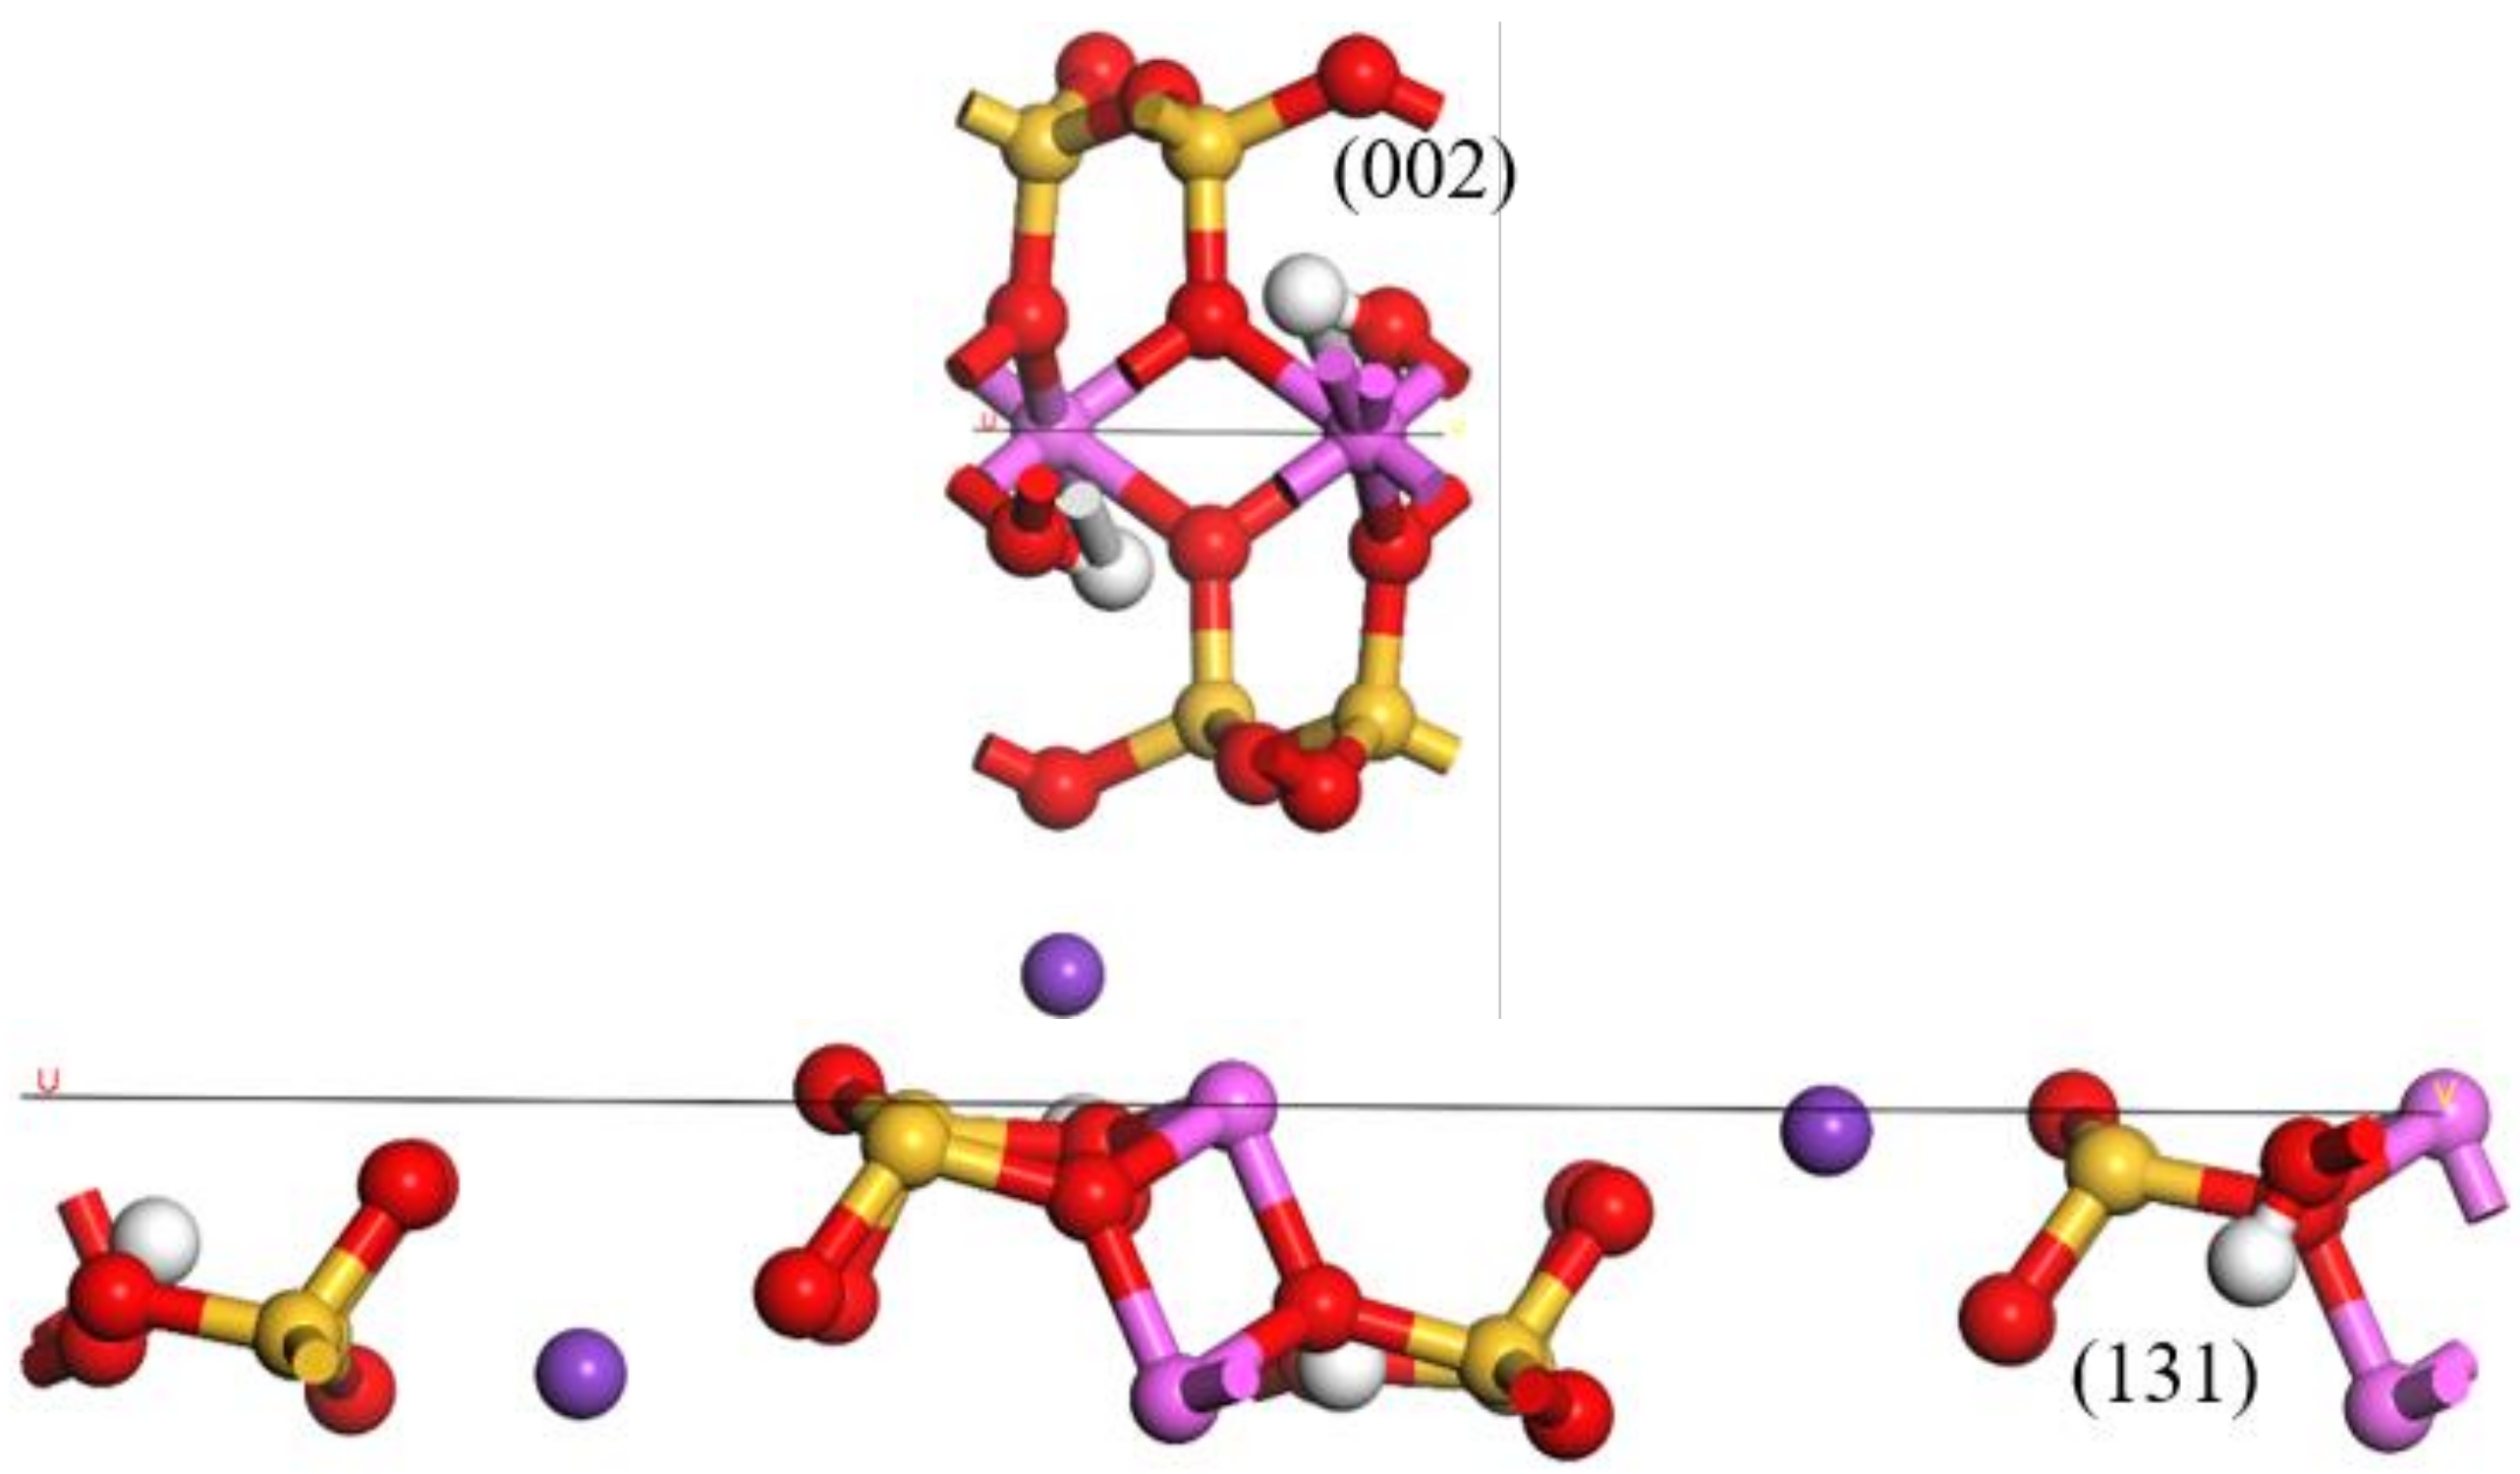
After the convergence test of layer thickness, the atomic layer thickness of 3.877 nm and vacuum layer thickness of 1.400 nm were selected to calculate the surface energy of (002) crystal plane. For (131) crystal plane, an atomic layer thickness of 1.793 nm and vacuum layer thickness of 1.200 nm were selected to calculate the surface energy, as shown in Figure 8. The crystal plane models of (002) and (131) are shown in Figure 9, and the surface energy and fracture bond density calculated according to Formulas (1) and (2) are shown in Table 4.
The energy required to dissociate a mineral crystal along a crystal plane and split into two separate planes under the action of external forces is called surface energy. The smaller the surface energy, the more stable the crystal plane. Cleavage usually occurs along surfaces with relatively low surface energy. According to Table 4, the surface energy of the (002) crystal plane of muscovite was 1.349 J/m2, lower than that of the (131) crystal plane, indicating that the (002) crystal plane was the normal texture plane of muscovite. There was a positive correlation between the fracture bond density and the surface energy of the crystal. The higher the fracture bond density was, the higher the surface energy was. According to the analysis of surface energy and fracture bond density, compared with the (131) crystal plane, the (002) crystal plane of muscovite was more easily exposed when damaged by an external force.

3.3. State Density of Muscovite

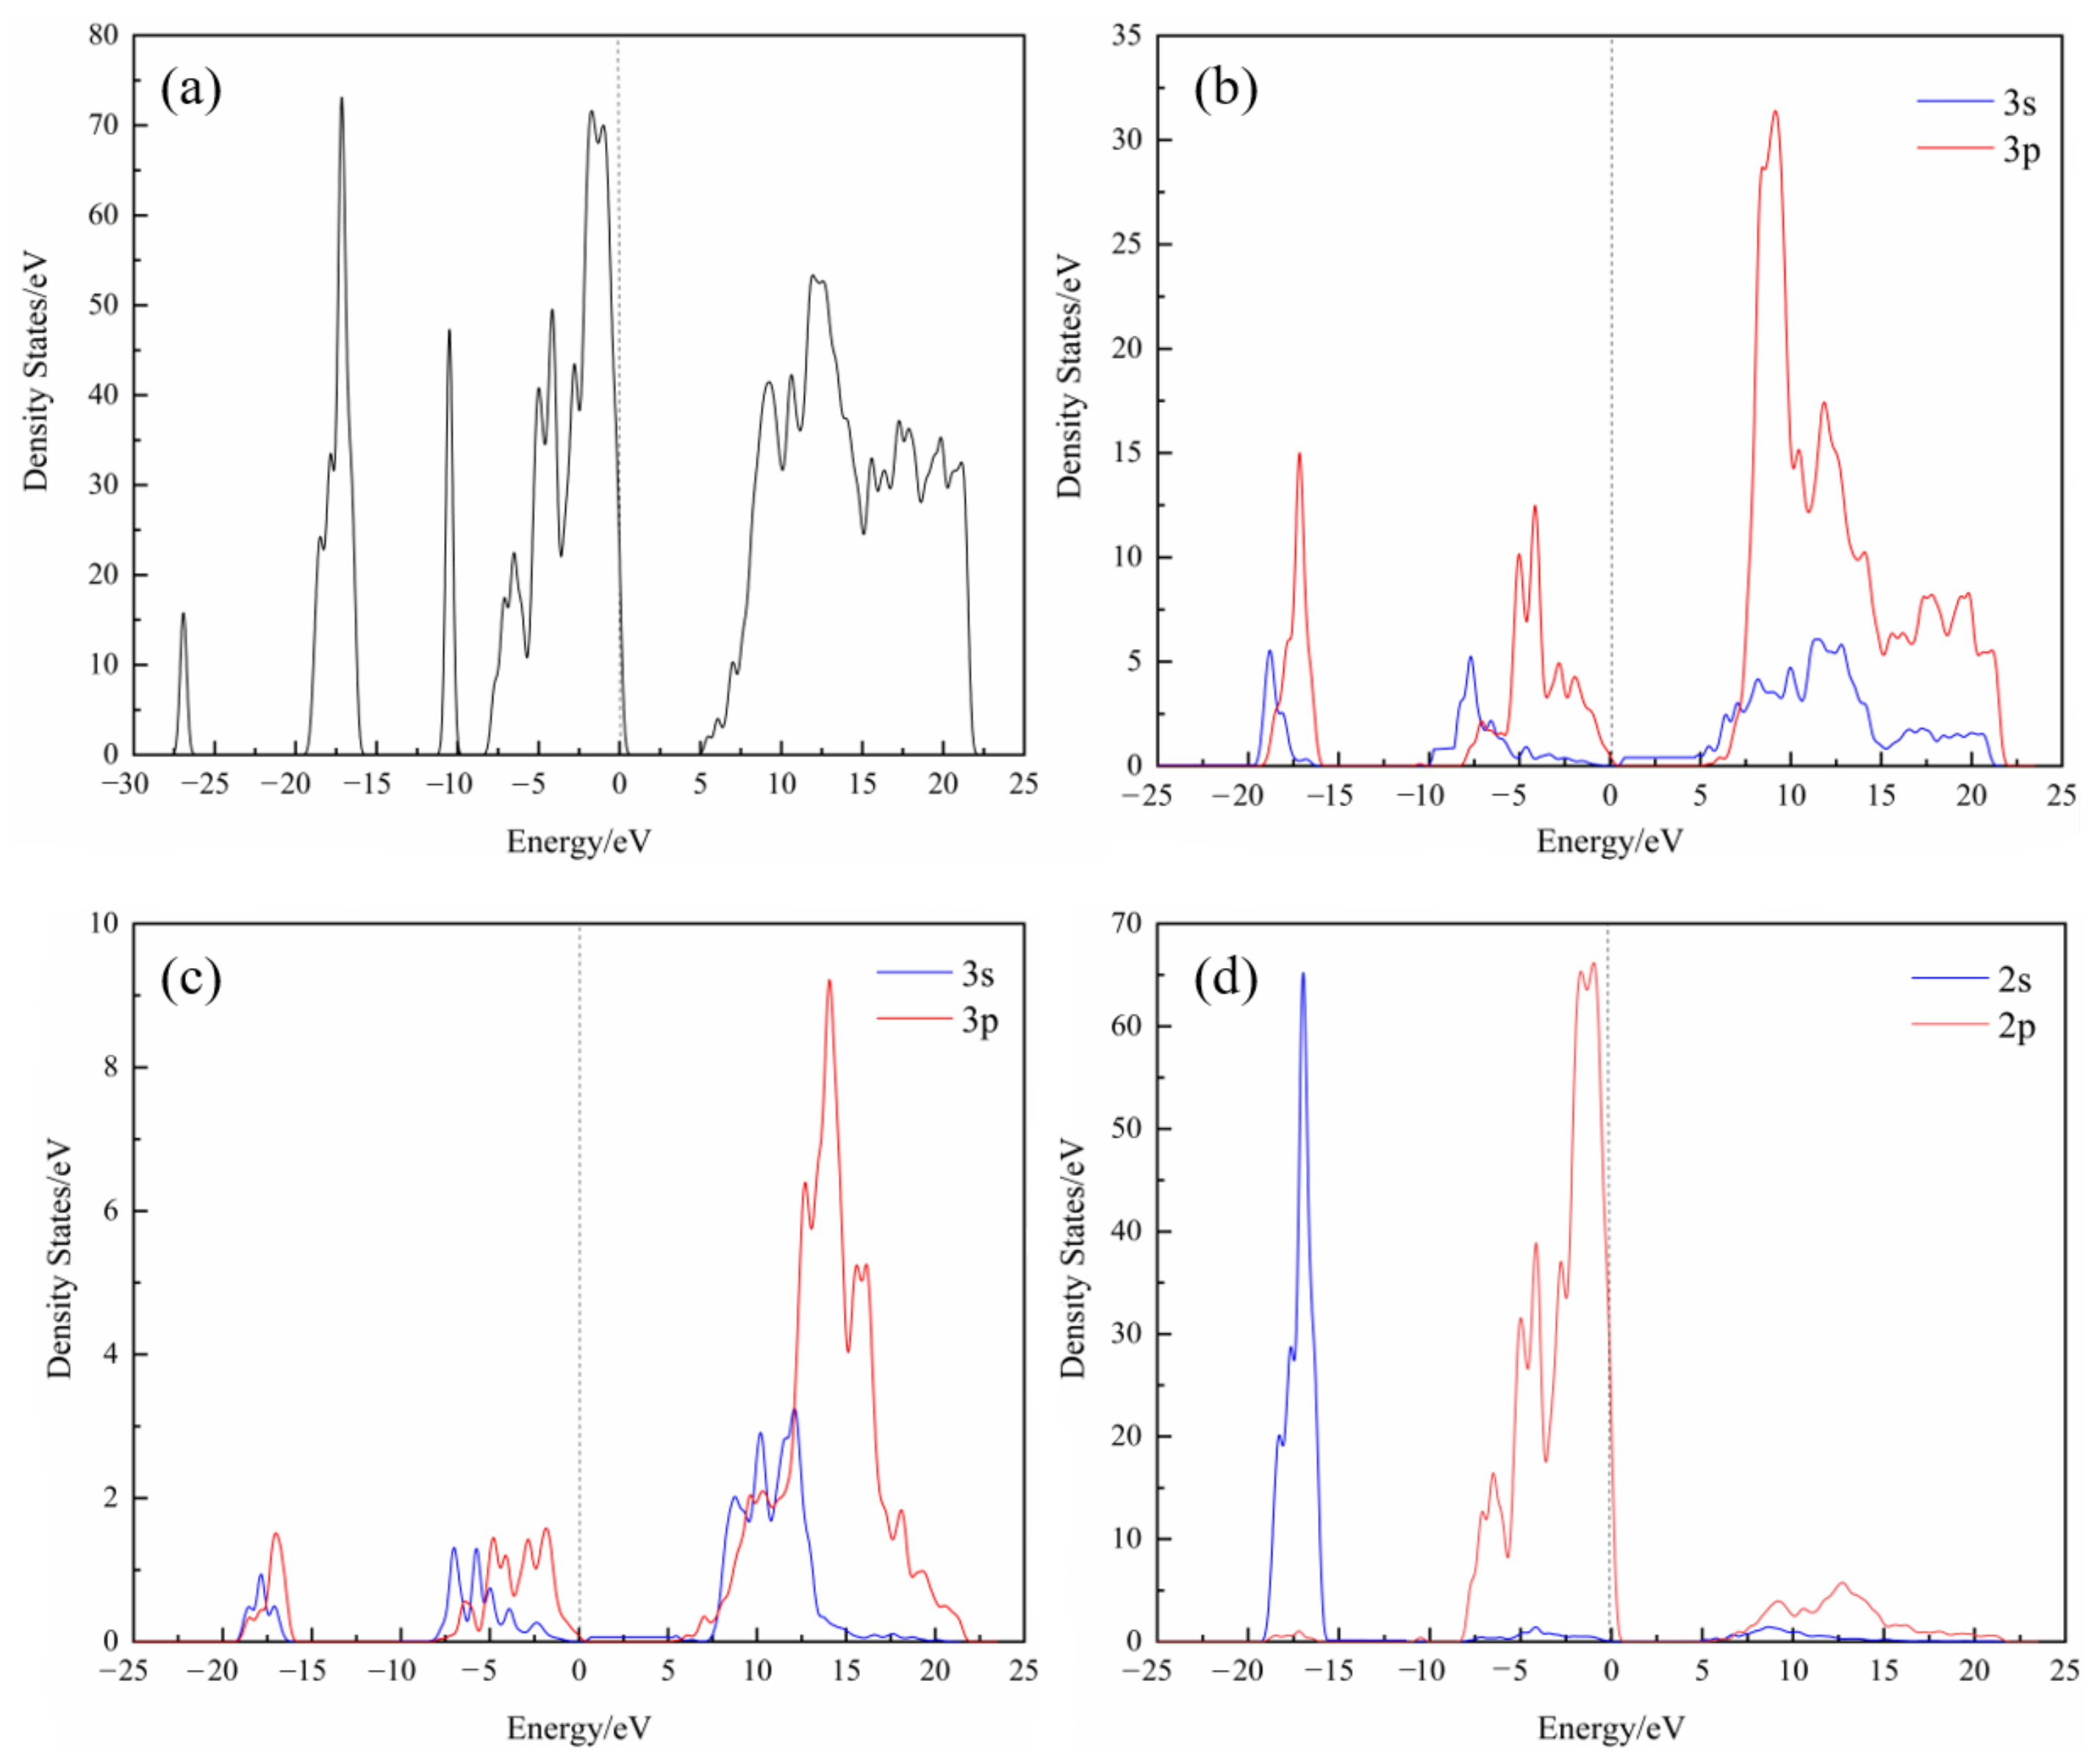
Figure 10 shows the total state density of muscovite crystal and the splitwave state density of each atom. It can be seen that each atom contributed to the total state density of muscovite. In combination with Figure 10b–d, and comparison with Figure 10a, the valence band is mainly composed of the p orbitals of oxygen atoms, and the orbitals of aluminum and silicon atoms contribute less. The conduction band was mainly composed of the p orbitals of silicon and aluminum atoms, and the s and p orbitals of oxygen atoms had little contribution. The main contribution of the adjacent region of the fermi level consists of the p orbital of the oxygen atom, so the oxygen atom had strong activity and was the active part of flotation beneficiation.

3.4. Adsorption Energy of Muscovite (002) and (131) Crystal Planes

The simulated adsorption energy results of the (002) crystal plane and (131) crystal plane with ODA are shown in Table 5. It indicates that the adsorption energy between the two crystal planes and ODA was negative, explaining that ODA can be adsorbed on both crystal planes, and the adsorption energy of the (131) crystal plane was much lower than the (002) crystal plane, showing that compared with the (002) crystal plane, the (131) crystal plane was more likely to adsorb ODA.

3.5. Adsorption Difference of ODA on (002) and (131) Crystal Planes of Muscovite

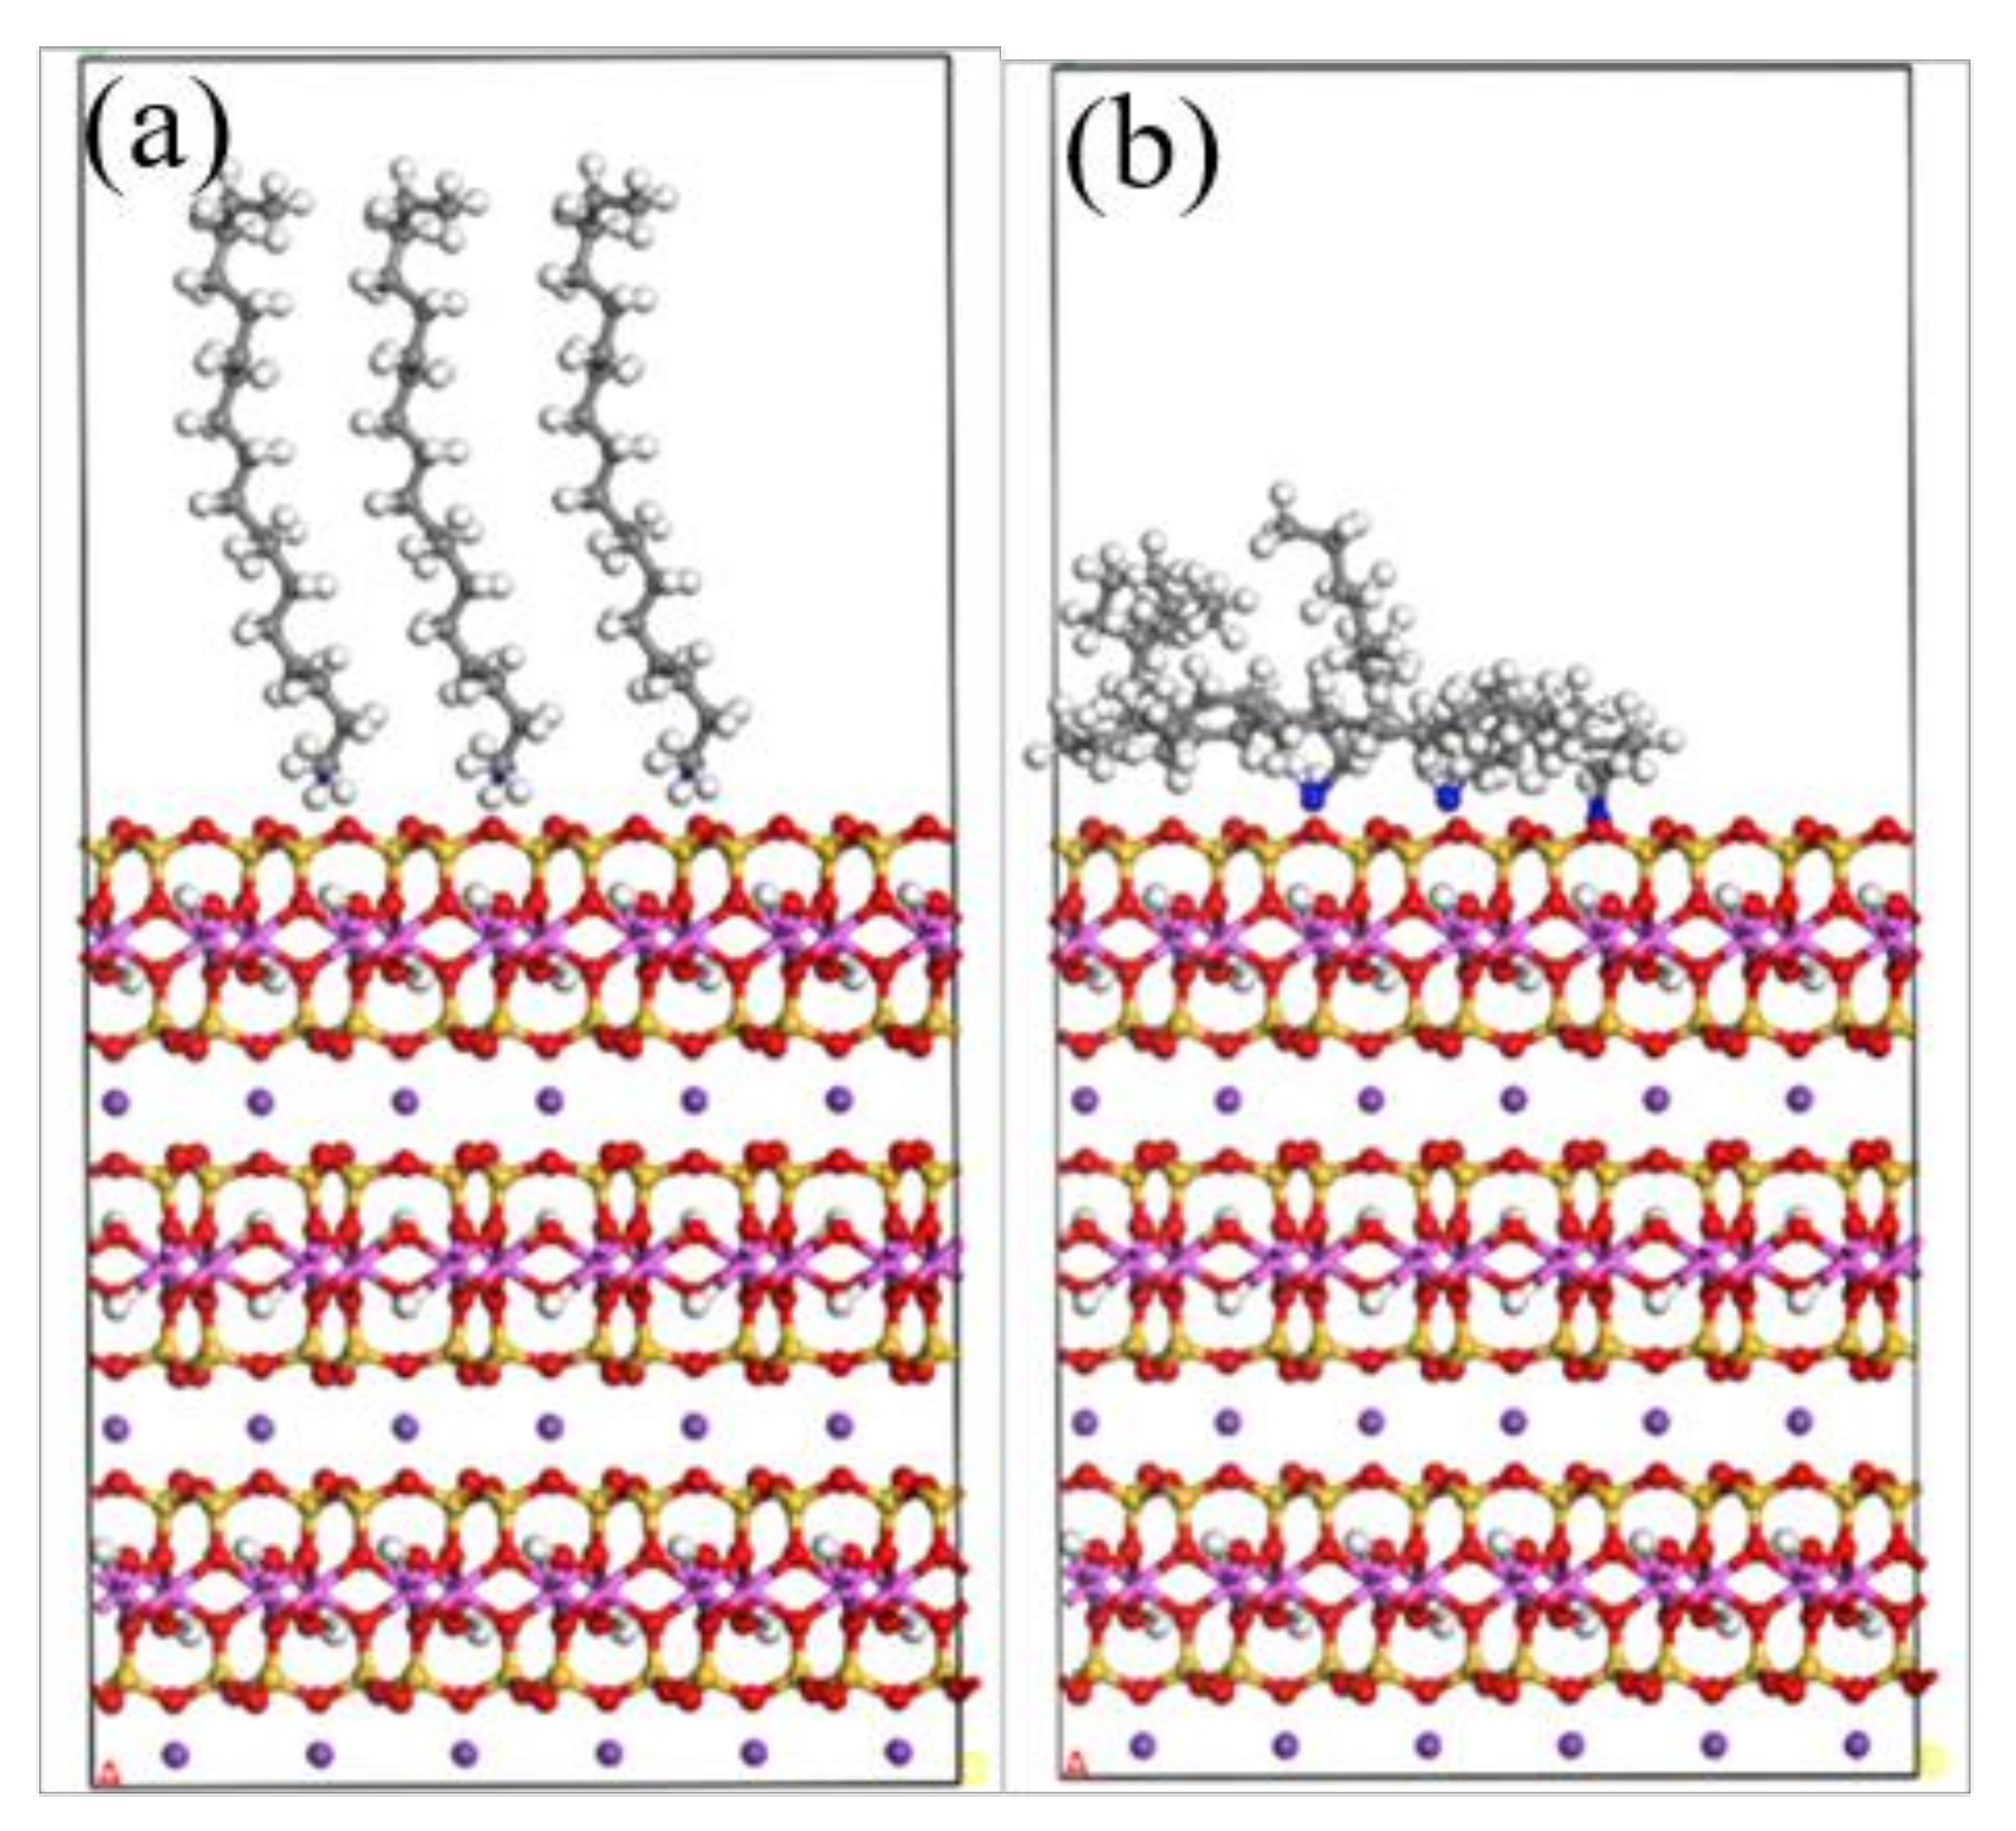
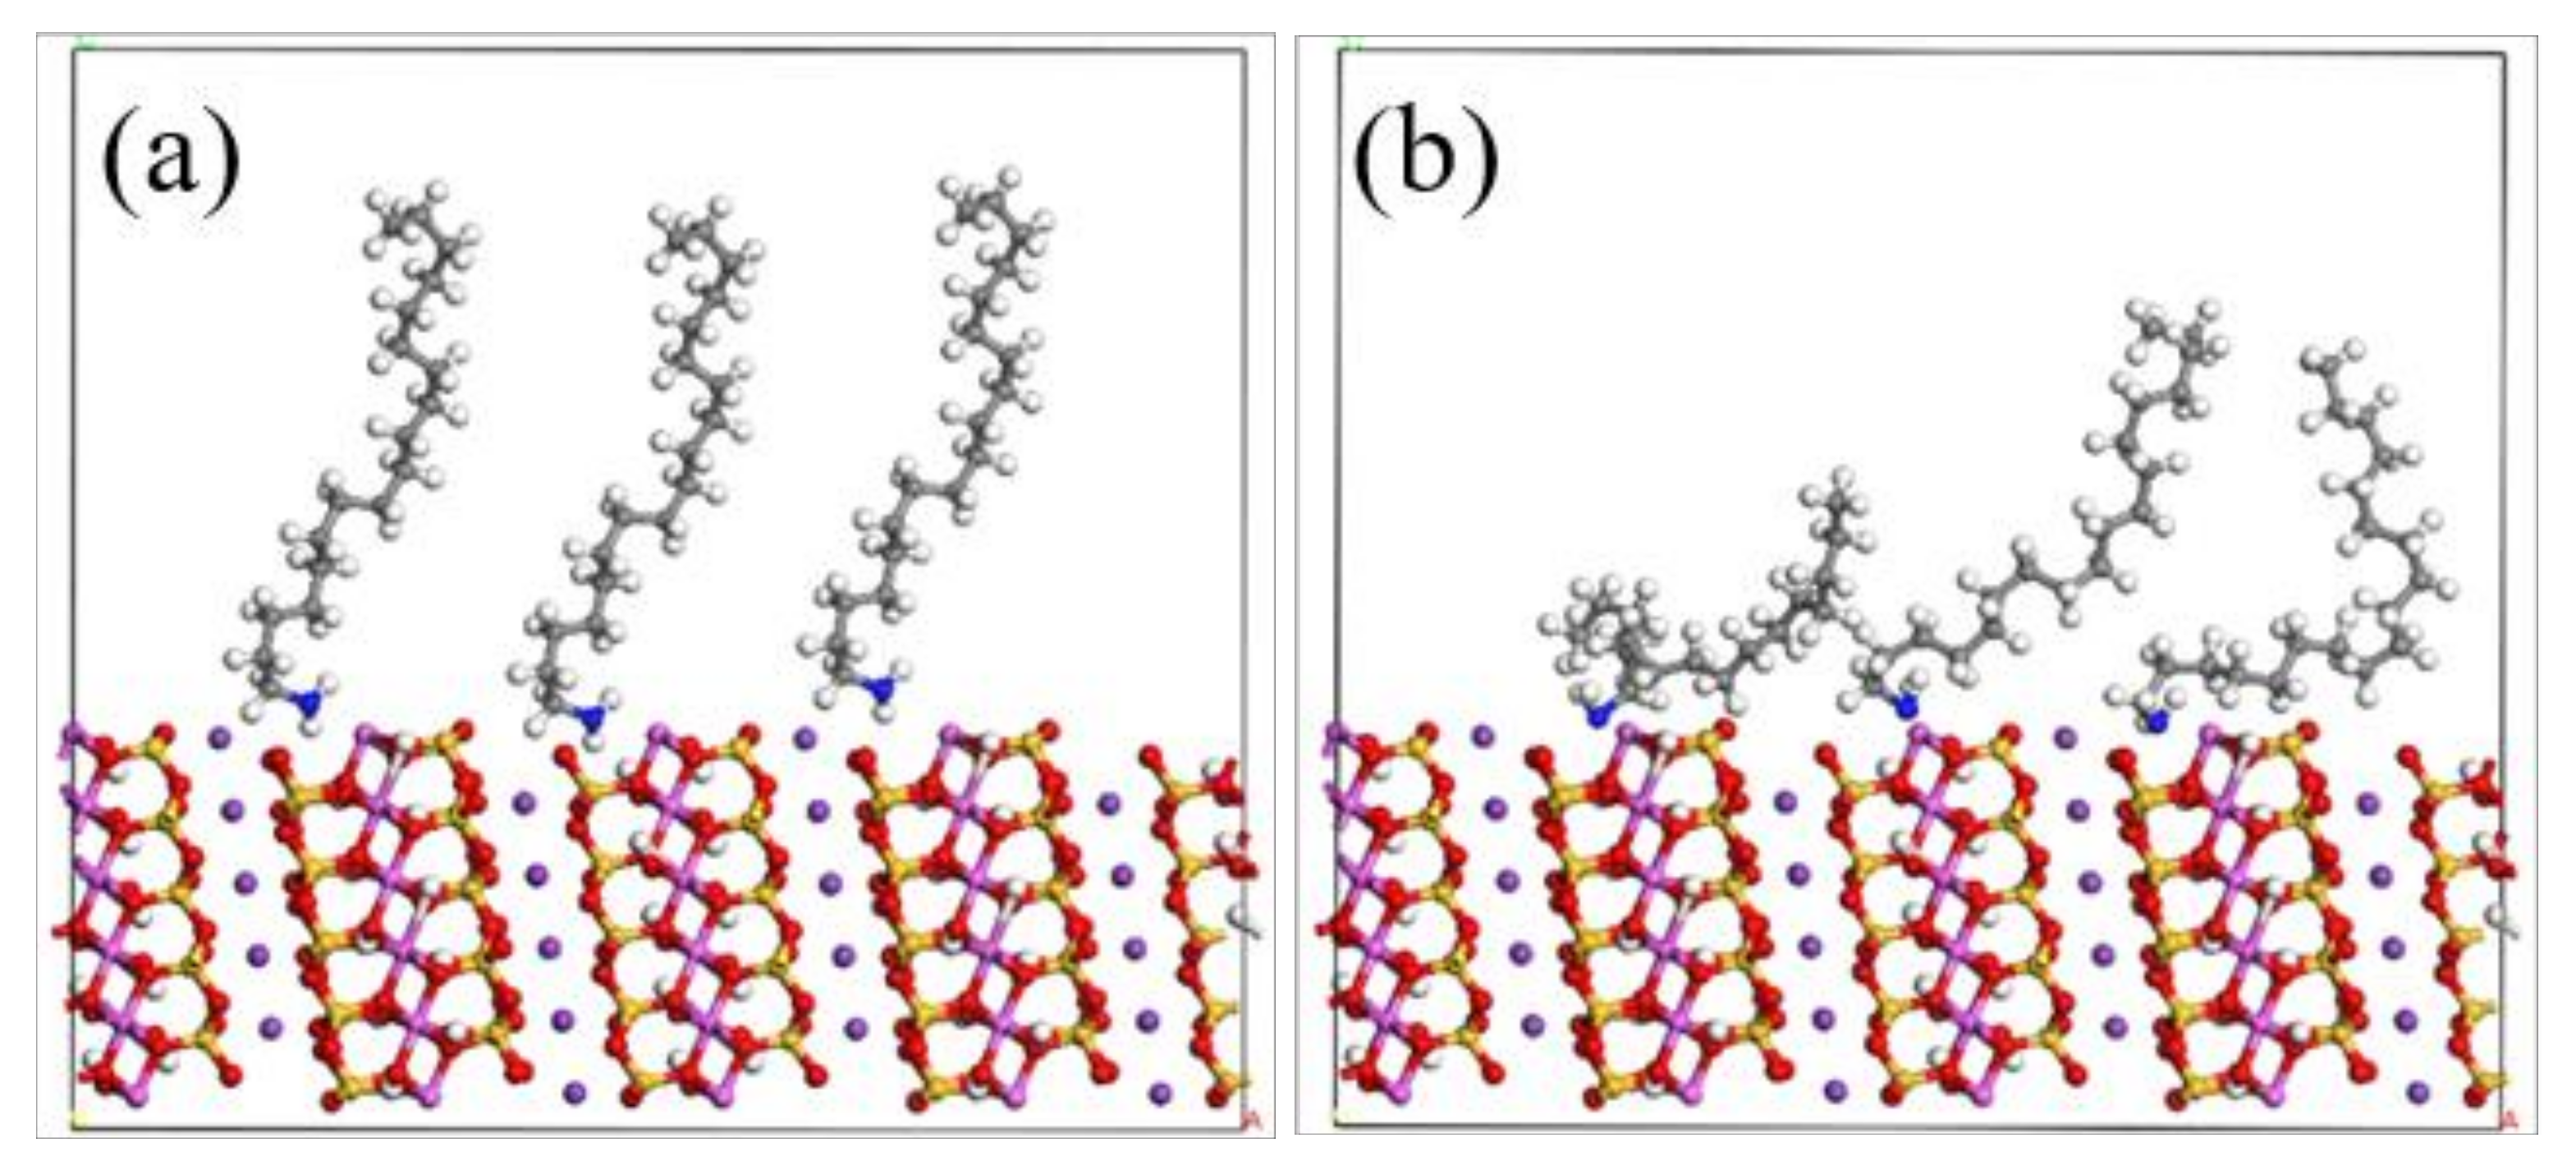
In order to obtain the adsorption morphology of ODA on two crystal planes of muscovite, the dynamic simulation of the interaction between the two crystal planes and the agent was carried out, and the adsorption changes of the agent on the crystal planes were obtained, as shown in Figure 11 and Figure 12. After the adsorption of ODA on muscovite, the amine group head was closer to the crystal plane. The reason for this may be that the potassium ions between muscovite layers would lose part of the cleavage process, resulting in the electronegativity of muscovite (002) and (131) planes. The ammonium ion head group had positive charge and there was electrostatic attraction between it and the negatively charged muscovite surface. The cationic polar head group of the collector would approach muscovite and finally be adsorbed stably on the surface of muscovite. The (131) crystal plane might be more exposed to potassium ions, more electronegative, and easier to adsorb with ODA.

3.6. Flotation Test Results and XRD under Different Flotation Conditions

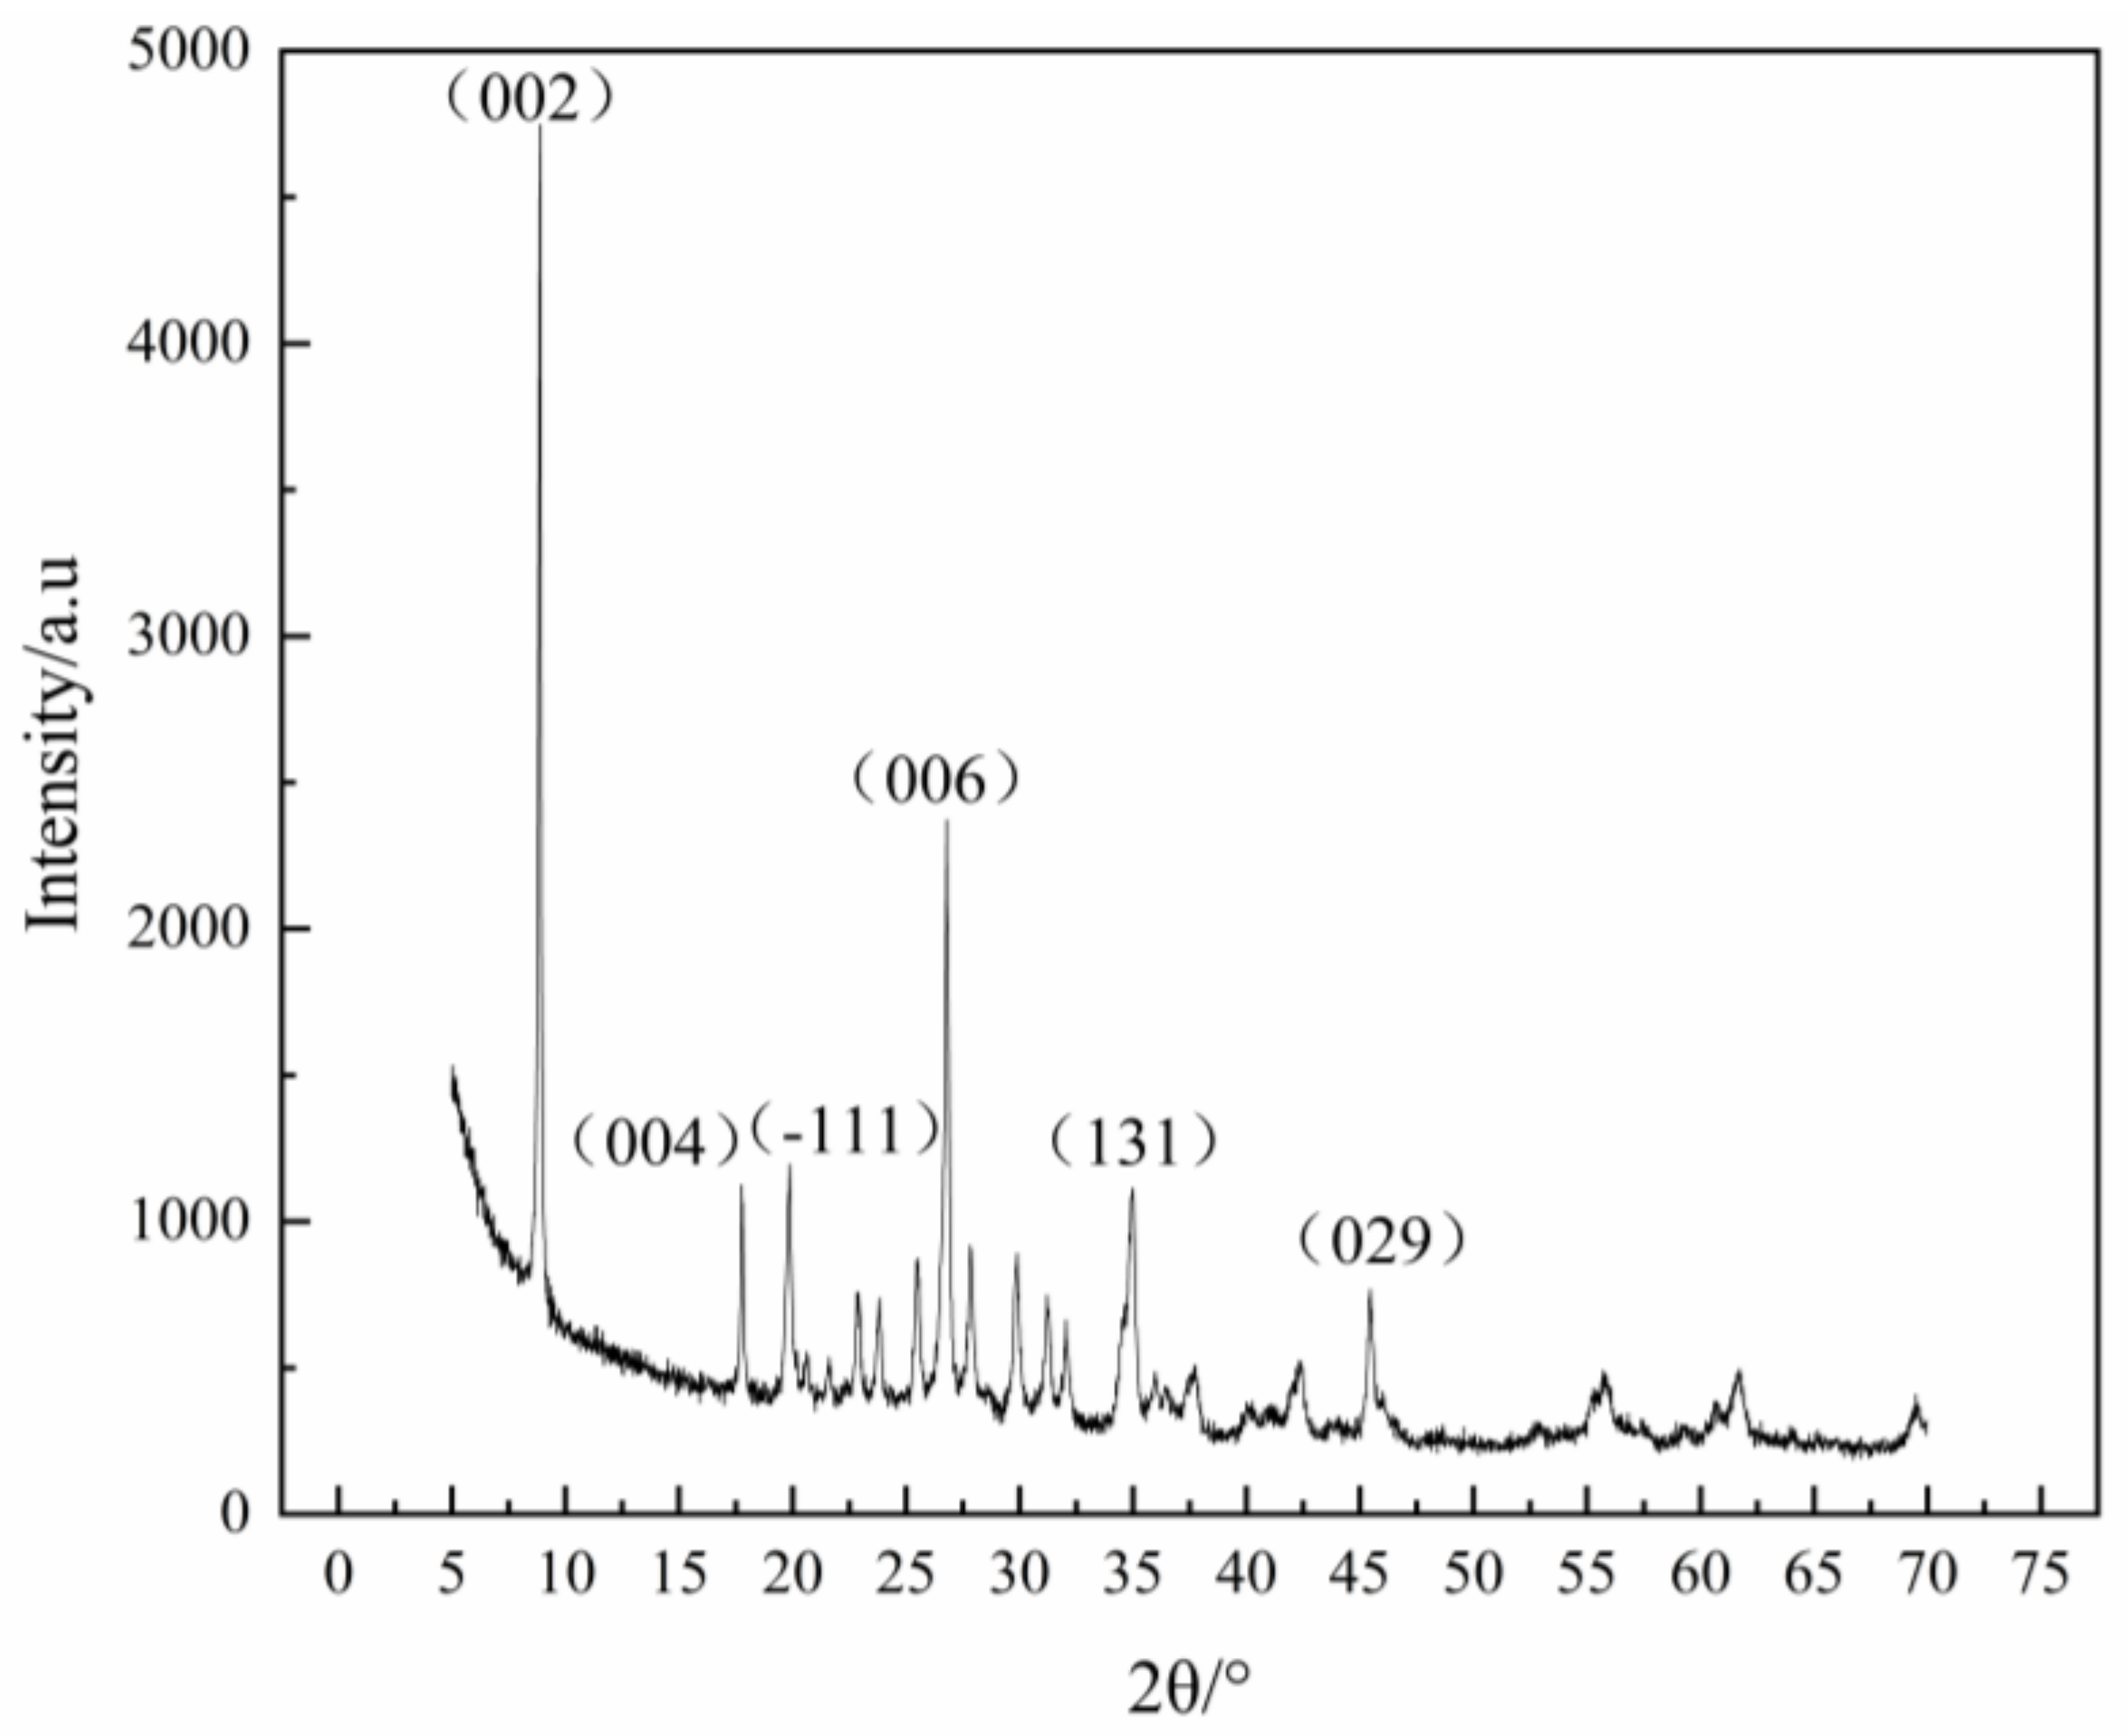
Figure 13 shows the XRD pattern of muscovite, and the crystal plane represented by its peak is labeled. Because the (002) crystal plane of muscovite was more exposed during grinding, the (002) crystal plane had a stronger peak. Among them, (002), (004) and (006) were parallel crystal planes with the same properties. Therefore, crystal planes (002) and (131) of muscovite were selected for subsequent simulation calculation to study the adsorption difference of ODA on these two planes.
When the concentration of ODA was 140 mg/L, under different pH conditions, the flotation recovery of muscovite changed. Figure 14 states that the recovery of muscovite increased significantly when the pH was from 2 to 4, and reached the peak value of 90.23% at pH 4. When the pH continued to rise, the flotation recovery began to decline [34].
Figure 15 illustrates the effect of the ODA concentration on the recovery and contact angle of muscovite at pH 4. The recovery of muscovite increased with the increase in the ODA concentration [35]. In the range of low ODA concentration, the recovery of muscovite showed an upward trend, but when the ODA concentration reached 160 mg/L, the recovery of muscovite reached a relatively stable state. When the concentration of ODA was 180 mg/L, the recovery reached 96.55%. The contact angle of muscovite increased with the increasing concentration of ODA. When the concentration of ODA was 140 mg/L, the contact angle of muscovite was 50.5°. The increasing contact angle proved that the hydrophobicity of muscovite was increasing, which was consistent with the law of recovery.
Based on the previous research results, with a view to further investigate the influence of the difference of crystal plane properties on its flotation behavior, XRD tests were conducted on muscovite under different flotation conditions to observe the changes in the strength of crystal plane after flotation. The results are shown in Figure 16. It showed that the strength of the (002) crystal plane of muscovite decreased after flotation, but the degree of decline varied according to different flotation conditions. When the pH was 4, the decline of the muscovite (002) crystal plane slowed down with the increase in the ODA concentration. When the ODA concentration was 180 mg/L, the decline of the (002) crystal plane was the lowest. When the ODA concentration was 140 mg/L, pH increased from 4 to 8 and the decline of the (002) crystal plane decreased. When pH increased from 8 to 10, the decline of the (002) crystal plane increased. The strength of the muscovite (131) crystal plane increased after flotation, but the strength increased little with the change in conditions. After flotation by ODA, the change law of the two crystal planes of muscovite showed that the strength of the (002) crystal plane decreased and that of the (131) crystal plane increased as a whole, which proved that the adsorption of the (131) crystal plane was stronger than that of the (002) crystal plane during ODA flotation, which was consistent with the simulation results.

4. Conclusions

Some properties of two crystal planes of muscovite (002) and (131) were simulated and explored, and the results showed that the (002) crystal plane had lower surface energy and fracture bond density. The adsorption energy of the (131) crystal plane was lower and more easily adsorbed ODA. Single mineral flotation tests were carried out on muscovite, and the optimum flotation conditions were determined as pH 4, ODA concentration 180 mg/L, and the recovery was 96.55%. The XRD results of the muscovite concentration under different flotation conditions showed that the strength of the (002) crystal plane decreased, while that of the (131) crystal plane increased. This was consistent with the simulation results, proving that in the flotation process, the (131) crystal plane was more likely to interact with ODA. This study has certain guiding significance for the flotation of muscovite, and can expose more of the (131) crystal plane before flotation to improve flotation efficiency.

Author Contributions

Conceptualization, L.R. and Z.J.; methodology, Z.J.; software, Z.J.; validation, L.R.; data curation, Z.J.; writing—original draft preparation, Z.J. and L.R.; writing—review and editing, Z.J., L.R. and S.B.; visualization, Y.Z. and S.B.; supervision, L.R.; project administration, L.R.; funding acquisition, L.R. All authors have read and agreed to the published version of the manuscript.

Funding

This research was funded by the National Natural Science Foundation of China (U2003129, 52274270).

Data Availability Statement

Data sharing not applicable.

Acknowledgments

The financial support provided by the National Natural Science Foundation of China (U2003129, 52274270) is acknowledged.

Conflicts of Interest

The authors declare no conflict of interest.

References

  1. Zhou, S.; Lv, J.; Guo, L.K.; Xu, G.Q.; Wang, D.M.; Zheng, Z.X.; Wu, Y.C. Preparation and photocatalytic properties of N-doped nano-TiO2/muscovite composites. Appl. Surf. Sci. 2012, 258, 6136–6141. [Google Scholar] [CrossRef]
  2. Chen, S.; Chen, F.; Di, Y.; Han, S.; Zhu, X. Preparation and characterisation of exfoliated muscovite/poly(2,3-dimethylaniline) nanocomposites with an enhanced anticorrosive performance. Micro Nano Lett. 2020, 15, 509–513. [Google Scholar] [CrossRef]
  3. Di, Y.; Jiang, A.; Huang, H.; Deng, L.; Zhang, D.; Deng, W.; Wang, R.; Luo, Q.; Chen, S. Molecular Dynamics Simulation Study on the Interactions of Mixed Cationic/Anionic Collectors on Muscovite (001) Surface in Aqueous Solution. Materials 2022, 15, 3816. [Google Scholar] [CrossRef] [PubMed]
  4. Jiang, H.; Gao, Y.; Khoso, A.S.; Ji, W.; Hu, Y. A new approach for characterization of hydrophobization mechanisms of surfactants on muscovite surface. Sep. Purif. Technol. 2019, 209, 936–945. [Google Scholar] [CrossRef]
  5. Wang, L.; Hu, Y.; Liu, J.; Sun, Y.; Sun, W. Flotation and adsorption of muscovite using mixed cationic-nonionic surfactants as collector. Powder Technol. 2015, 276, 26–33. [Google Scholar] [CrossRef]
  6. Wang, L.; Sun, N.; Liu, J.; Tang, H.; Liu, R.; Han, H.; Sun, W.; Hu, Y. Effect of Chain Length Compatibility of Alcohols on Muscovite Flotation by Dodecyl Amine. Minerals 2018, 8, 168. [Google Scholar] [CrossRef] [Green Version]
  7. Wang, L.; Sun, W.; Hu, Y.H.; Xu, L.H. Adsorption mechanism of mixed anionic/cationic collectors in Muscovite-Quartz flotation system. Miner. Eng. 2014, 64, 44–50. [Google Scholar] [CrossRef]
  8. Chen, G.; Ren, L.; Zhang, Y.; Bao, S. Improvement of fine muscovite flotation through nanobubble pretreatment and its mechanism. Miner. Eng. 2022, 189, 107868. [Google Scholar] [CrossRef]
  9. Liu, Z.; Liu, G.-S.; Yu, J.-G. Effect of Primary Alkylamine Adsorption on Muscovite Hydrophobicity. Acta Phys.-Chim. Sin. 2012, 28, 201–207. [Google Scholar] [CrossRef]
  10. Gao, Z.; Li, C.; Sun, W.; Hu, Y. Anisotropic surface properties of calcite: A consideration of surface broken bonds. Colloid Surf. A-Physicochem. Eng. Asp. 2017, 520, 53–61. [Google Scholar] [CrossRef]
  11. Wu, H.; Tian, J.; Xu, L.; Wang, Z.; Xu, Y.; Gao, Z.; Sun, W.; Hu, Y. Anisotropic surface chemistry properties of salt-type and oxide mineral crystals. Miner. Eng. 2020, 154, 106411. [Google Scholar] [CrossRef]
  12. Xu, L.; Peng, T.; Tian, J.; Lu, Z.; Hu, Y.; Sun, W. Anisotropic surface physicochemical properties of spodumene and albite crystals: Implications for flotation separation. Appl. Surf. Sci. 2017, 426, 1005–1022. [Google Scholar] [CrossRef]
  13. Xu, L.; Tian, J.; Wu, H.; Fang, S.; Lu, Z.; Ma, C.; Sun, W.; Hu, Y. Anisotropic surface chemistry properties and adsorption behavior of silicate mineral crystals. Adv. Colloid Interface Sci. 2018, 256, 340–351. [Google Scholar] [CrossRef]
  14. Ren, L.; Zhang, Z.; Zeng, W.N. Adhesion between nanobubbles and fine cassiterite particles. Int. J. Min. Sci. Technol. 2022, in press. [Google Scholar] [CrossRef]
  15. Juarez, F.; Salmazo, D.; Savinova, E.R.; Quaino, P.; Belletti, G.; Santos, E.; Schmickler, W. The initial stage of OH adsorption on Ni(111). J. Electroanal. Chem. 2019, 832, 137–141. [Google Scholar] [CrossRef]
  16. Loncaric, I.; Alducin, M.; Juaristi, J.I. Molecular dynamics simulation of O-2 adsorption on Ag(110) from first principles electronic structure calculations. Phys. Chem. Chem. Phys. 2016, 18, 27366–27376. [Google Scholar] [CrossRef] [PubMed]
  17. Zhang, K.; Li, H.; Li, Z.; Qi, S.; Cui, S.; Chen, W.; Wang, S. Molecular dynamics and density functional theory simulations of cesium and strontium adsorption on illite/smectite. J. Radioanal. Nucl. Chem. 2022, 331, 2983–2992. [Google Scholar] [CrossRef]
  18. Khnifira, M.; Boumya, W.; Attarki, J.; Mahsoune, A.; Abdennouri, M.; Sadiq, M.H.; Kaya, S.; Barka, N. Elucidating the adsorption mechanisms of anionic dyes on chitosan (110) surface in aqueous medium by quantum chemical and molecular dynamics. Mater. Today Commun. 2022, 33, 104488. [Google Scholar] [CrossRef]
  19. Xu, J.; Yuan, Y.; Feng, Z.; Liu, F.; Zhang, Z. Molecular dynamics simulation of adsorption and diffusion of partially hydrolyzed polyacrylamide on kaolinite surface. J. Mol. Liq. 2022, 367, 120377. [Google Scholar] [CrossRef]
  20. Yu, X.; Hu, X.; Zhao, Y.; Feng, Y.; Liu, J.; Dong, H.; Tang, H.; Wang, W.; Ren, W.; Wang, F.; et al. Molecular dynamics simulation of interface adhesion characteristics between dust suppressant and coal. Mater. Today Commun. 2022, 33, 104487. [Google Scholar] [CrossRef]
  21. Hajjaoui, H.; Khnifira, M.; Soufi, A.; Abdennouri, M.; Akkaya, S.; Akkaya, R.; Barka, N. Experimental, DFT and MD simulation studies of Mordant Black 11 dye adsorption onto polyaniline in aqueous solution. J. Mol. Liq. 2022, 364, 120045. [Google Scholar] [CrossRef]
  22. Gao, Z.Y.; Sun, W.; Hu, Y.H.; Liu, X.W. Surface energies and appearances of commonly exposed surfaces of scheelite crystal. Trans. Nonferrous Met. Soc. China 2013, 23, 2147–2152. [Google Scholar] [CrossRef]
  23. Fang, S.; Xu, L.; Wu, H.; Tian, J.; Deng, W.; Chen, H. Research Advance in Anisotropy of Phyllosilicate Minerals and Its Relationship with Flotation. Mod. Min. 2018, 34, 46–53. [Google Scholar]
  24. Wang, J.; Sun, Z.; Bai, J. Research on Crystal Anisotropy and Surface Properties of Smithsonite. Conserv. Util. Miner. Resour. 2021, 41, 1–6. [Google Scholar]
  25. Li, M.; Lian, D.; Li, H.; Chen, W.; Hu, Y.; Gao, X.; Tong, X. Research on Anisotropy of Chlorite and Its Relationship with Floatability. Met. Mine 2020, 2020, 56–61. [Google Scholar]
  26. King, R.P. Butterworth-Heinemann Ltd. Modeling and Simulation of Mineral Processing Systems; Society for Mining, Metallurgy & Exploration, Incorporated: Englewood, CO, USA, 2001; pp. 127–212. [Google Scholar]
  27. Xue, X.; Xu, Z.; Pedruzzi, I.; Ping, L.; Yu, J. Interaction between low molecular weight carboxylic acids and muscovite: Molecular dynamic simulation and experiment study. Colloid Surf. A-Physicochem. Eng. Asp. 2018, 559, 8–17. [Google Scholar] [CrossRef]
  28. Hasan, M.; Hossain, A. First-principles calculations to investigate the structural, electronic, optical anisotropy, and bonding properties of a newly synthesized ThRhGe equiatomic ternary intermetallic superconductor. Results Phys. 2022, 42, 106004. [Google Scholar] [CrossRef]
  29. Kilic, K.I.; Dauskardt, R.H. Mechanically reliable hybrid organosilicate glasses for advanced interconnects. J. Vac. Sci. Technol. B 2020, 38, 060601. [Google Scholar] [CrossRef]
  30. Meiser, J.; Urbassek, H.M. Influence of the Crystal Surface on the Austenitic and Martensitic Phase Transition in Pure Iron. Crystals 2018, 8, 469. [Google Scholar] [CrossRef] [Green Version]
  31. Wu, Y.; Wang, Z.; Wang, D.; Qin, J.; Wan, Z.; Zhong, Y.; Hu, C.; Zhou, H. First-Principles Investigation of Atomic Hydrogen Adsorption and Diffusion on/into Mo-doped Nb (100) Surface. Appl. Sci. 2018, 8, 2466. [Google Scholar] [CrossRef] [Green Version]
  32. Gao, Z.; Fan, R.; Ralston, J.; Sun, W.; Hu, Y. Surface broken bonds: An efficient way to assess the surface behaviour of fluorite. Miner. Eng. 2019, 130, 15–23. [Google Scholar] [CrossRef]
  33. Gao, W.; Chen, Y.; Li, B.; Liu, S.P.; Liu, X.; Jiang, Q. Determining the adsorption energies of small molecules with the intrinsic properties of adsorbates and substrates. Nat. Commun. 2020, 11, 1196. [Google Scholar] [CrossRef] [PubMed] [Green Version]
  34. Gomez, F.; Allan, H.; Graeme, W.; Sadia, K.; Hyunjung. Prediction of grade and recovery in flotation from physicochemical and operational aspects using machine learning models. Miner. Eng. 2022, 183, 107627. [Google Scholar] [CrossRef]
  35. Kyuhyeong, P.; Junhyun, C.; Gomez-Flores, A.; Hyunjung, K. Flotation Behavior of Arsenopyrite and Pyrite, and Their Selective Separation. Mater. Trans. 2015, 56, 435–440. [Google Scholar] [CrossRef] [Green Version]
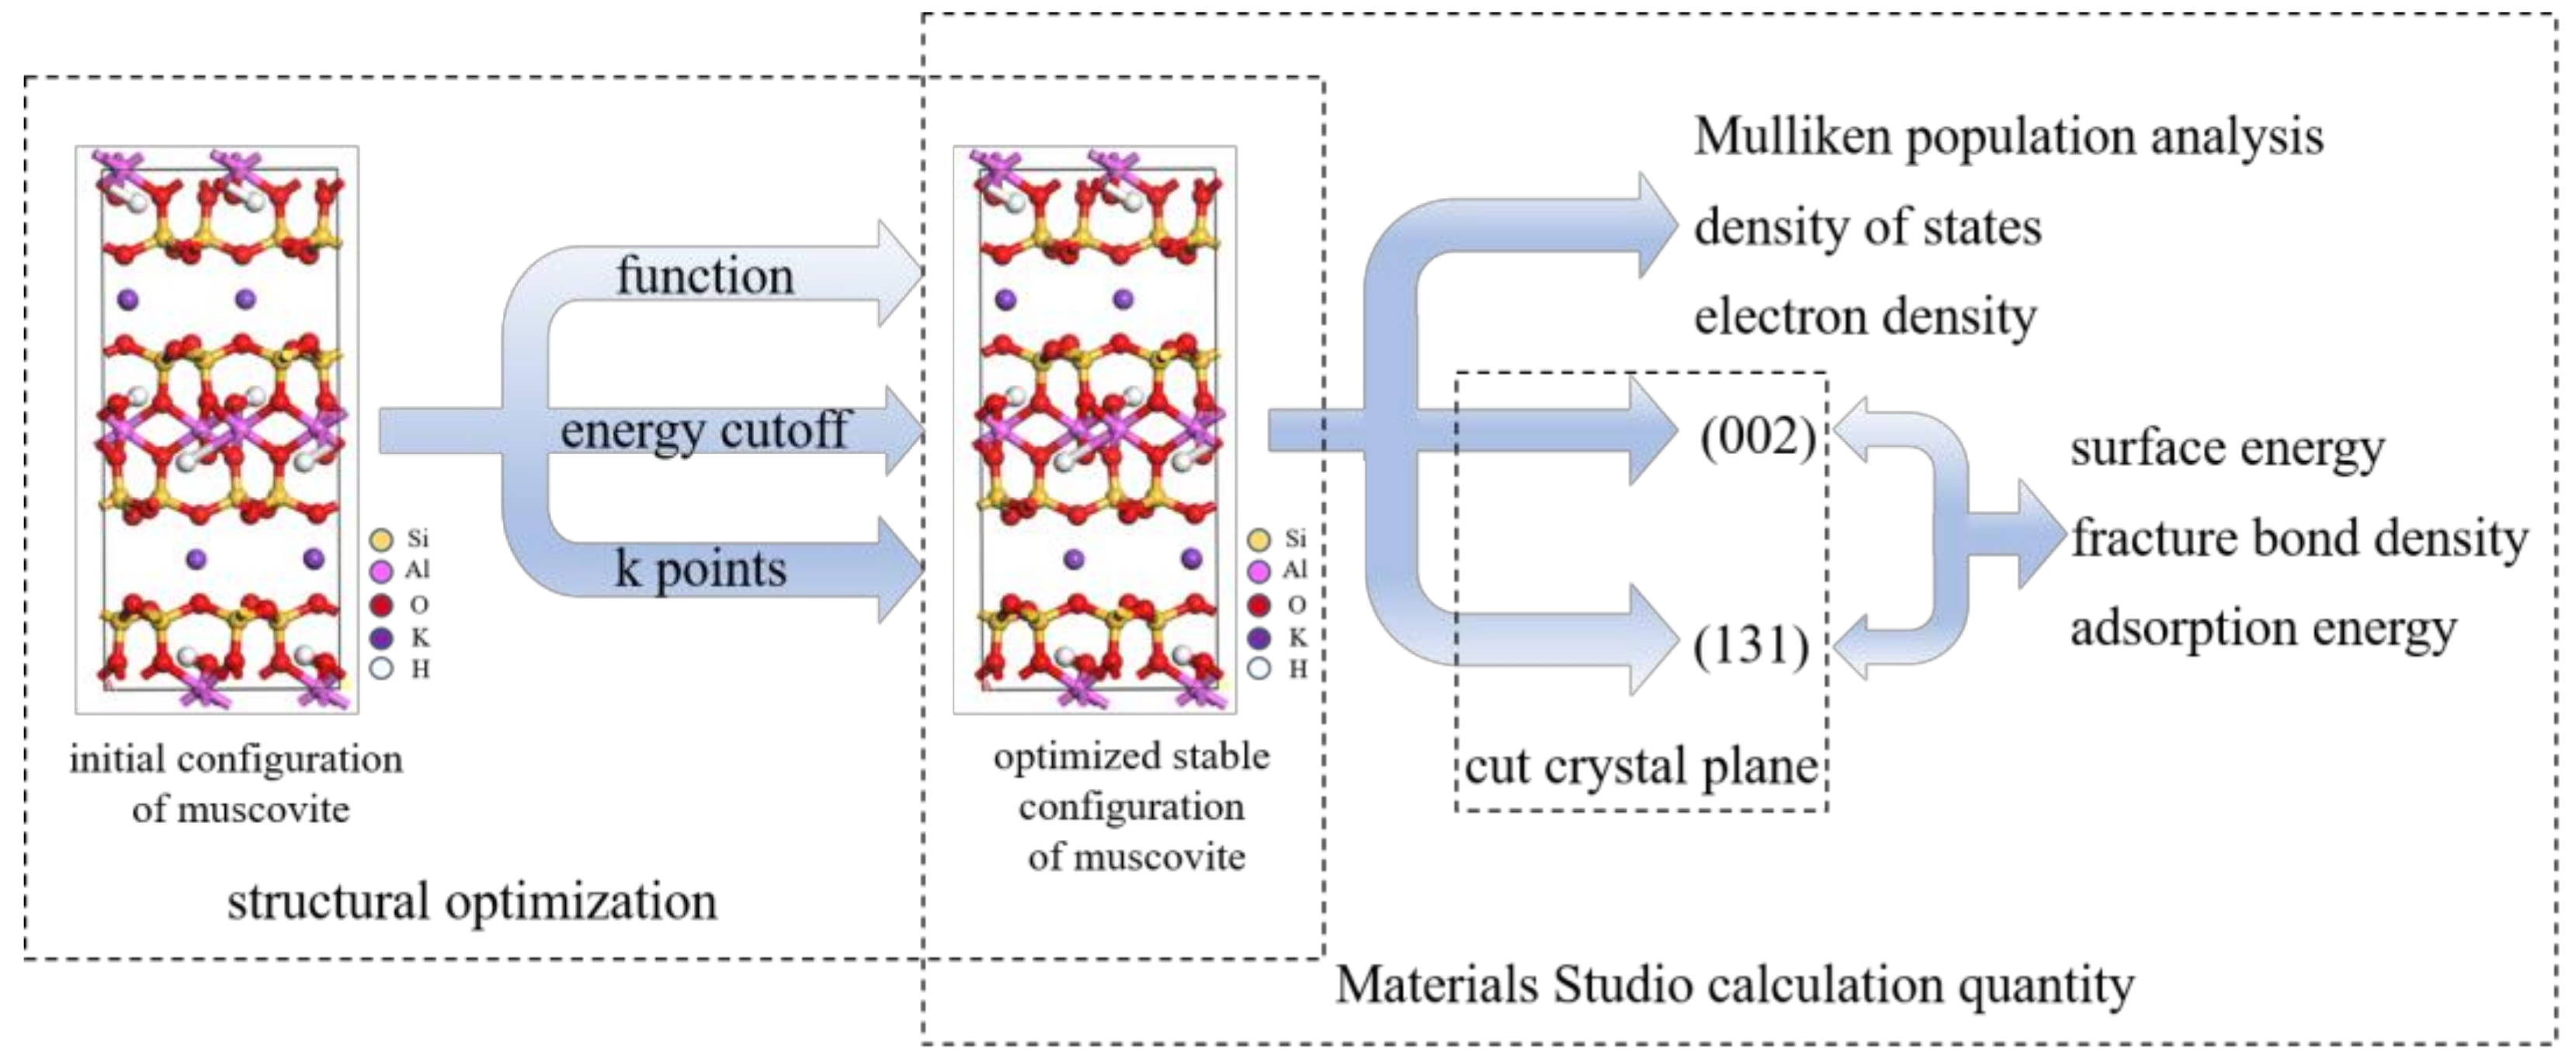
Figure 1. Flow chart of the theoretical part.
Minerals 13 00519 g001
Figure 2. Original unit cell model of muscovite (the color of yellow, pink, red, purple, and white represents silicon, aluminum, oxygen, potassium, and hydrogen atoms, respectively).
Minerals 13 00519 g002
Figure 3. Molecular structure of octadecamine(ODA).
Minerals 13 00519 g003
Figure 4. Total energy and lattice constant errors of muscovite with different energy cutoffs.
Minerals 13 00519 g004
Figure 5. Total energy and lattice constant errors of muscovite at different k-points.
Minerals 13 00519 g005
Figure 6. Grain size of muscovite.
Minerals 13 00519 g006
Figure 7. Electron density of muscovite (the color of yellow, pink, red, purple, and white represents silicon, aluminum, oxygen, potassium, and hydrogen atoms, respectively).
Minerals 13 00519 g007
Figure 8. Surface energy calculation models of muscovite (002) and (131) crystal planes.
Minerals 13 00519 g008
Figure 9. Calculation model of the fracture bond density of muscovite (002) and (131) crystal planes.
Minerals 13 00519 g009
Figure 10. Muscovite state density ((a) total state density diagram (b) Al state density diagram (c) Si state density diagram (d) O state density diagram).
Minerals 13 00519 g010
Figure 11. Changes in ODA before and after adsorption on the muscovite (002) crystal plane ((a) pre-adsorption and (b) post-adsorption).
Minerals 13 00519 g011
Figure 12. Changes in ODA before and after adsorption on the muscovite (131) crystal plane ((a) pre-adsorption (b) post-adsorption).
Minerals 13 00519 g012
Figure 13. The XRD pattern of muscovite.
Minerals 13 00519 g013
Figure 14. Relationship between the flotation recovery of muscovite and pH (concentration of ODA: 140 mg/L).
Minerals 13 00519 g014
Figure 15. Flotation recovery and contact angle of muscovite in relation to ODA concentration (pH = 4).
Minerals 13 00519 g015
Figure 16. The XRD of muscovite (002) and (131) crystal planes under different flotation conditions.
Minerals 13 00519 g016
Table 1. Lattice parameters and total energy of muscovite optimized by different functions.
Functiona/nmb/nmc/nmβ/°Energy/eVMaximum Error/%
GGA-PBE5.2419.07320.93495.423−26,269.6774.232
GGA-PBESOL5.1978.98920.60395.389−26,315.3272.584
GGA-WC5.2008.99720.69695.289−26,228.0423.047
GGA-PW915.2329.05820.76495.430−26,300.0693.386
GGA-RPBE5.2879.16221.29295.667−26,294.0966.015
Table 2. The Mulliken population analysis of muscovite atoms.
SpeciesIons/ep/ed/ef/eTotal/eCharge/e
H10.590.000.000.000.590.41
H20.600.000.000.000.600.40
O11.845.250.000.007.09−1.09
O21.855.290.000.007.15−1.15
O31.845.160.000.007.00−1.00
O41.865.300.000.007.16−1.16
O51.835.310.000.007.14−1.14
O61.845.290.000.007.13−1.13
O301.875.310.000.007.18−1.18
Al10.500.810.000.001.311.69
Al20.470.850.000.001.331.67
Si10.671.340.000.002.011.99
Si50.681.360.000.002.041.96
Si60.661.310.000.001.972.03
K12.025.480.000.007.501.50
K32.025.490.000.007.511.49
Table 3. The Mulliken bond population analysis of muscovite atoms.
BondPopulationLength/Å
Al-Al−0.372.9872
Si-Si−0.172.9872
O-O−0.032.9902
O-K−0.042.9660
H-Si−0.012.9480
Al-Si−0.192.9379
H-Al−0.022.8398
H-O−0.012.8384
O-Al0.301.9618
O-Si0.611.5213
Table 4. Surface energy and the fracture bond density of muscovite (002) and (131) crystal planes.
Crystal PlanesSurface Energy/J·m−2Fracture Bond Density/nm2
(002)1.3498.581
(131)1.4268.642
Table 5. Adsorption energy of muscovite (002) and (131) crystal planes.
Crystal PlaneAdsorbed Complex Energy
/kJ·mol−1
Energy at the Bottom of the Crystal Plane
/kJ·mol−1
Energy of Agent
/kJ·mol−1
Adsorption Energy/kJ·mol−1
(002)86,164.94885,905.960391.248−132.259
(131)49,649.86850,185.72222.052−557.906
Disclaimer/Publisher’s Note: The statements, opinions and data contained in all publications are solely those of the individual author(s) and contributor(s) and not of MDPI and/or the editor(s). MDPI and/or the editor(s) disclaim responsibility for any injury to people or property resulting from any ideas, methods, instructions or products referred to in the content.