Article

Methodological Study on the Full-Range Pore Structure and Fractal Characteristics of the Tight Reservoirs

Ministry of Education Key Laboratory of Orogenic Belts and Crustal Evolution, School of Earth and Space Sciences, Peking University, Beijing 100871, China
*
Author to whom correspondence should be addressed.
Minerals 2023, 13(5), 587; https://doi.org/10.3390/min13050587
Submission received: 7 March 2023 / Revised: 6 April 2023 / Accepted: 21 April 2023 / Published: 23 April 2023
(This article belongs to the Section Mineral Deposits)

Abstract

:
Scholars have used the method of splicing various experimental data to evaluate the full-range pore structure of tight reservoirs, but its applicability has not been discussed. When the fractal theory is used to characterize the heterogeneity of tight reservoirs, there is a lack of research on the controlling factors of segmented fractal pore size (the inflection points in the fractal curve) and the relationship between the fractal dimensions of different dimensions. In this paper, mercury intrusion porosimetry (MIP), N2 adsorption (N2-GA), and large-field splicing scanning electron microscopy (MAPs) were conducted to study the pore structure and full-range pore size distribution (PSD) of tight sandstone, and fractal theory was used to evaluate the heterogeneity of the reservoir. Combining the PSD of MIP and N2-GA, two parameters “cosine similarity” and “data similarity” were introduced to characterize the overlapping pore size range of the two experimental methods; then, the PSD of MAPs was used to verify the rationality of the data splicing. The results show that the characterization of the full-range pore structure should not only be based on simple data splicing but should focus on the data similarity of the overlapping pore size range. The study on the segmented fractal pore size of MIP shows that the segmented fractal pore size increases gradually with an increase in the main skeleton mineral content, the decrease in the clay mineral content, and the increase in the pore radius and porosity. For the same sample, the segmented fractal pore size is fixed and does not change with the calculation model of fractal dimension. Comparing the two-dimensional (2D) fractal dimension with the three-dimensional (3D) fractal dimension, calculating the 3D fractal dimension by +1 directly with the 2D fractal dimension is more applicable for the large pores, but it is not applicable for the small pores due to the influence of the extensive development of linear pores.

1. Introduction

Unconventional reservoirs have a more complex pore structure than conventional reservoirs, where nanoscale pore identification indicates that the tight reservoirs have a full-range PSD [1,2]. Current experimental methods for studying tight reservoirs include qualitative/semi-quantitative and quantitative methods. Qualitative/semi-quantitative methods can evaluate the geometric characteristics of pores and their connectivity via microscopic visualization, such as micro-CT, nano-CT, FIB-SEM, and BSE; the quantitative data on PSD can be obtained by processing the image. Quantitative methods are mainly injection methods, in which the pore structure is quantitatively characterized by measuring the injection or rejection process to derive parameters such as the specific surface area (SSA), pore volume, and PSD.
Zhu et al. [3] highlighted that research on tight reservoirs in China should be developed toward achieving a comprehensive characterization of the pore structure on the nano-microscale. Different experimental methods often have the limitation of test intervals [2,4]. It is challenging to characterize the full-range pore structure via a single experiment; therefore, different methods can be combined to identify pore structure characteristics. Cao et al. [5] comprehensively characterized the pore structure of shale by combining MIP and N2-GA; Xiao et al. [6] comprehensively characterized the pore-throat distribution of tight sandstone by combining MIP and NMR; and Jiang et al. [7], Zhang et al. [8], and Wang et al. [9] comprehensively characterized the pore structure of shale by combining CO2 adsorption, N2-GA, and MIP. The above research provides a method to characterize the full-range PSD; combining different experimental methods has a certain scientific principle and application value, and also lays the foundation for the study of this paper. It is challenging to accurately characterize tight reservoirs with complex microstructures using Euclidean geometry. According to Jia et al. [10], the pore of the reservoir has self-similarity statistically and belongs to fractal structures. By calculating the fractal dimension, the pore structure’s heterogeneity can be characterized. Numerous studies about fractals have been conducted on tight sandstone, shale, and coal using the fractal theory, and the 3D fractal characteristics of mesopores can be derived by using the Frenkel–Halsey–Hill (FHH) model and N2-GA data [11,12,13,14]. The 3D fractal characteristics of mesopores/macropores can be derived by using the capillary bundle model and MIP data [15,16]. The 2D fractal characteristics of pores can be derived by using the image information and box dimensions [17]. Many research results have shown that tight reservoirs exhibit fractal characteristics [16,18,19,20], and the pore structure of tight reservoirs can be well characterized based on the fractal dimension.
However, current studies to characterize the full-range PSD mostly simply employ data splicing, without detailed research on the selection of the splicing point and the applicability of the different methods’ data. Additionally, the research on the fractal characteristics of pores stays in the correlation of the fractal dimension and other parameters, or permeability prediction. When applying fractal theory to characterize the pore structure, the segmented characteristics of the fractal dimension indicate that there are different types of pore structures and pore-throat configurations in the experimentally tested pore size range, and this difference will also lead to different transport characteristics of oil and gas in them; however, studies on the segmented fractal characteristics of pores and the relationship of fractal dimensions between different dimensions are limited.

2. Materials and Methods

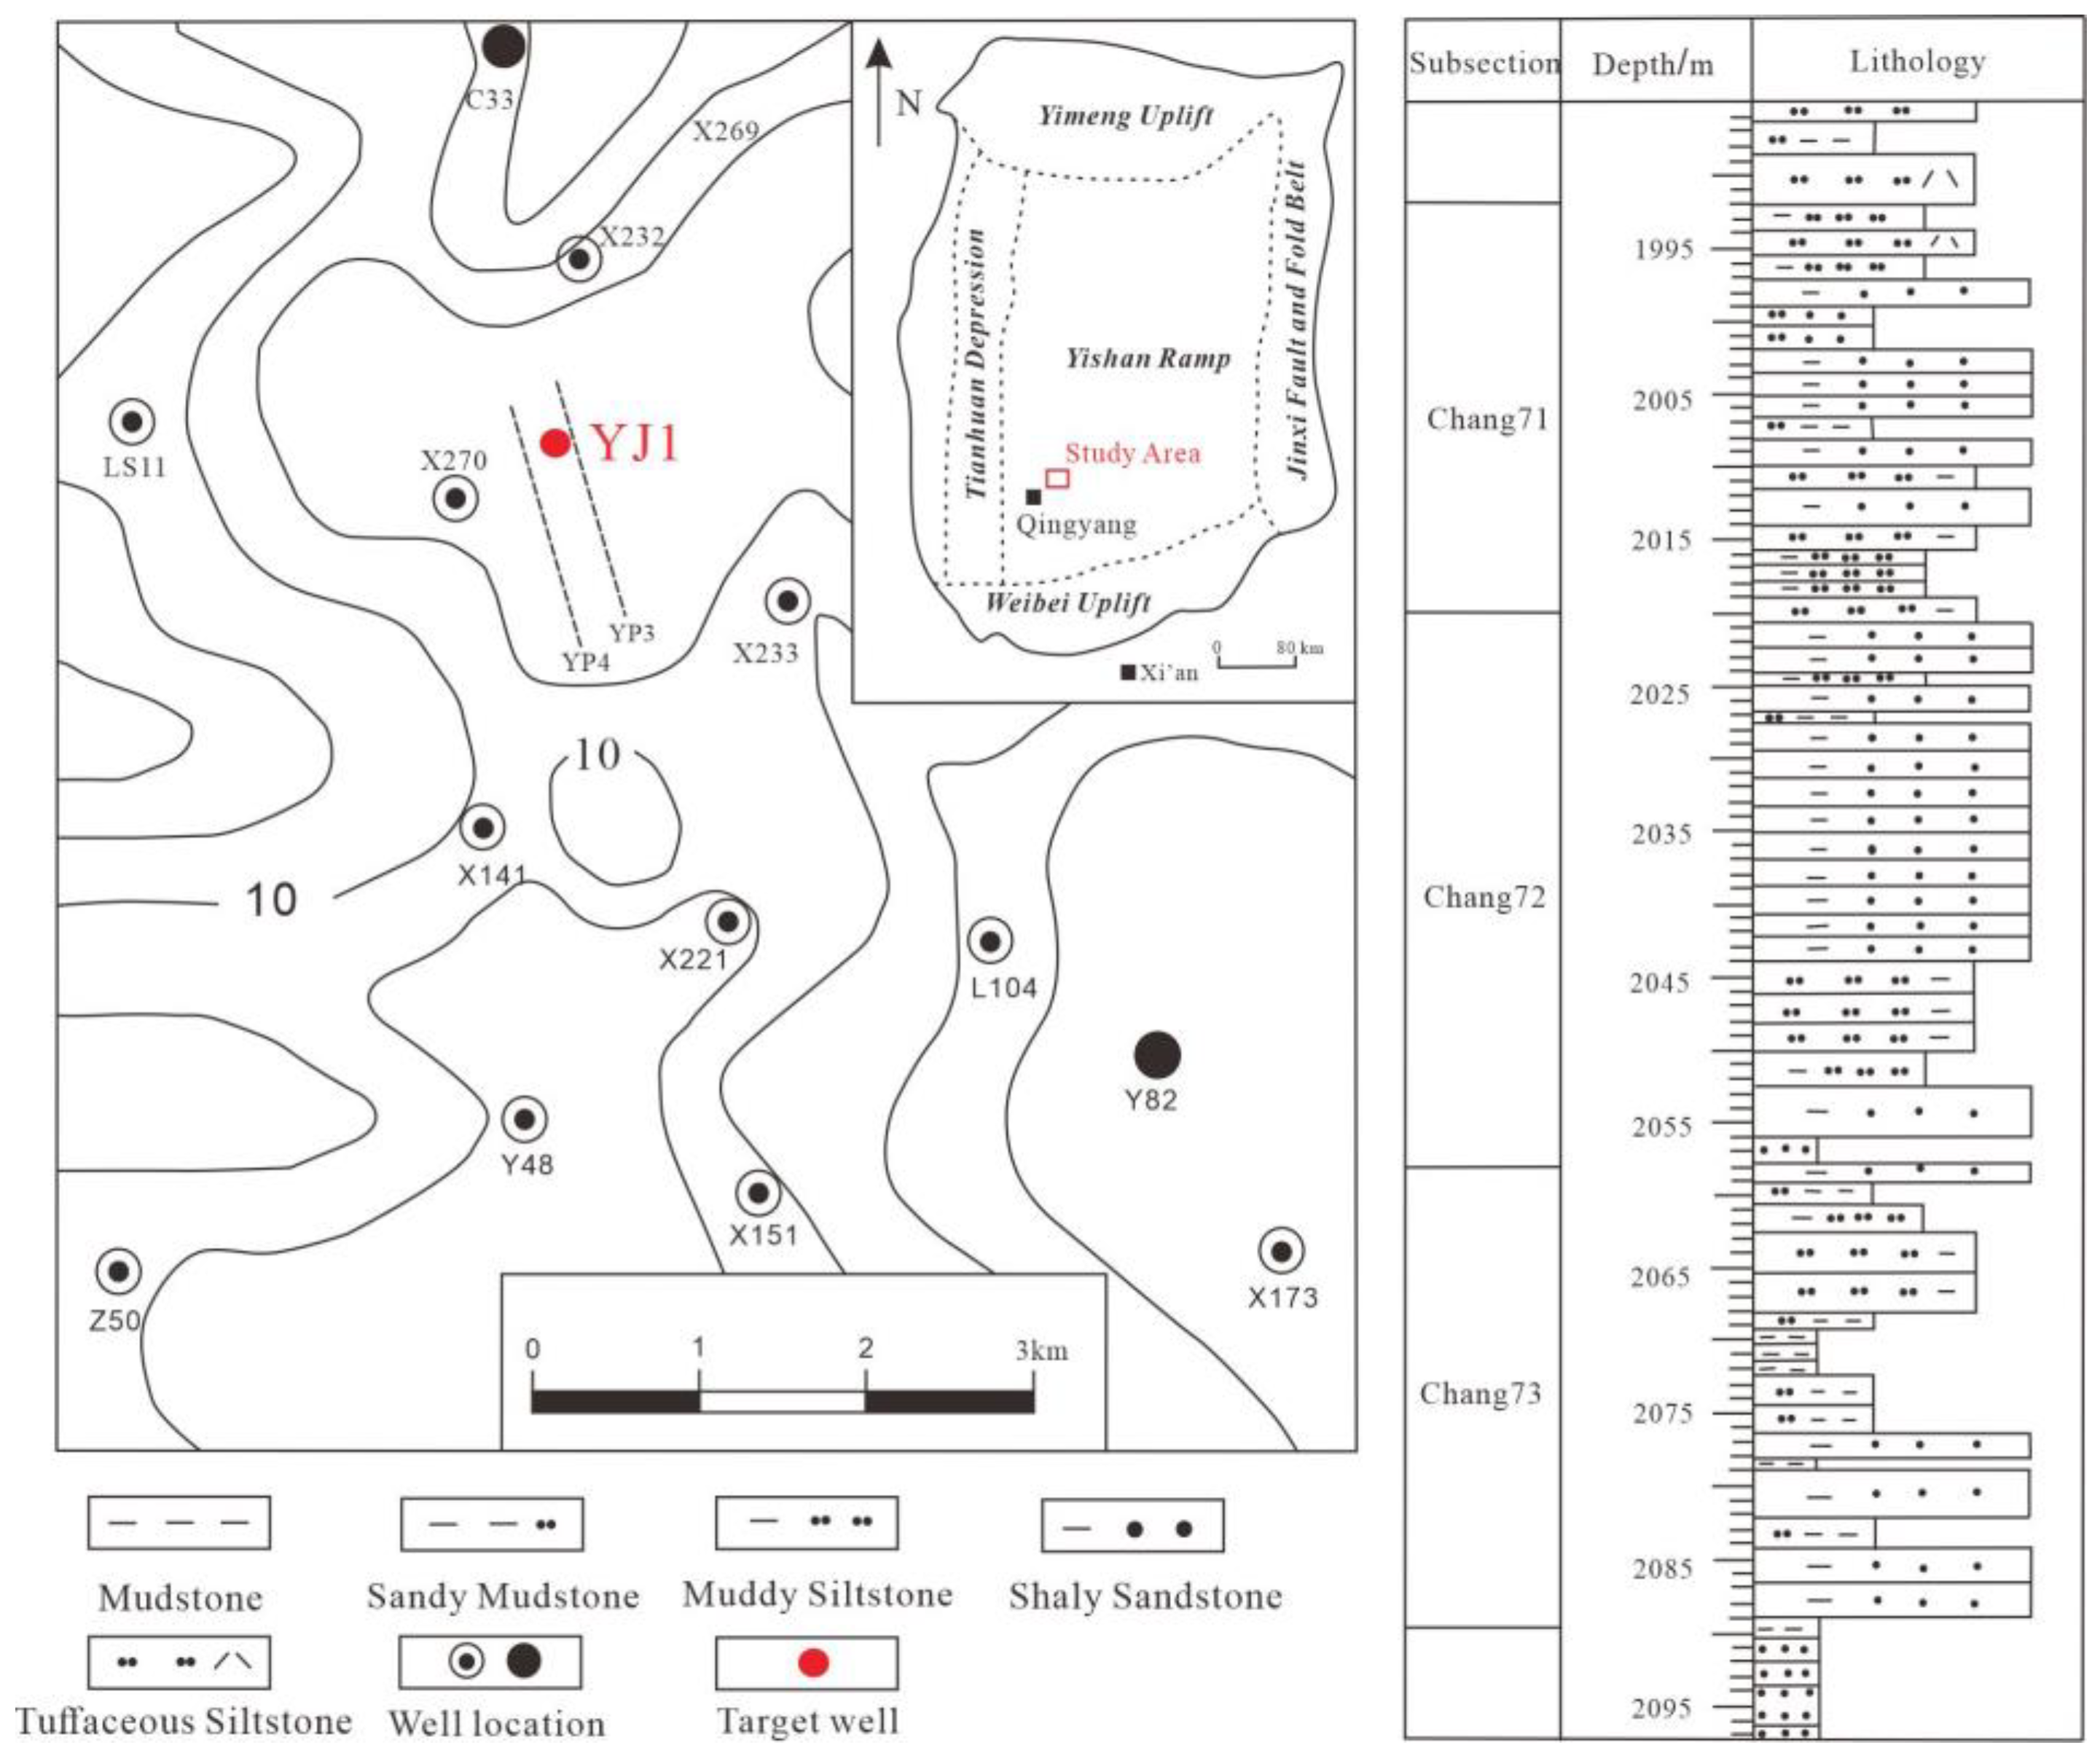
2.1. Geological Background and Samples

The Ordos Basin is in the southwestern part of the North China Plateau and is the second largest sedimentary basin in China [21]. The entire basin has undergone multiple phases of tectonic uplift and depressional migration and is a large-cycle craton basin with simple tectonics [22]. It can be divided into six primary tectonic units (Figure 1), namely, the Yimeng uplift in the north, the Weibei uplift in the south, the western margin retrograde zone, the Tianhuan depression in the west, the Jinxi flexural fold zone in the east, and the northern Shanbei slope in the center [23].
A sedimentary facies of semi-deep and deep lacustrine with high-quality hydrocarbon source rocks was developed in the Triassic Yanchang Formation Chang7 Member, Ordos Basin, formed in a reducing atmosphere with deep water, low salinity, and inconspicuous water stratification [24]. During the Chang73 sedimentary period, the lake’s water expanded sharply to its peak, and with the local development of gravity flow deposits, the sedimentary lithology included mudstone and oil shale which were rich in organic matter. During the Chang72–Chang71 sedimentary period, the lake basin shrank continuously and the delta and gravity flow deposits expanded [25]. The rapid transgression during the Chang73 sedimentary period increased the depth and decreased the oxygen content of the water, laying a good foundation for the formation of organic matter, making the tight reservoir in the Chang7 Member a typical tight oil reservoir. From preliminary estimates, the oil resources in the tight sandstone in the Chang7 Member amounted to 9 × 10⁸ t [26]. Samples in this study were obtained from the Chang7 Member.

2.2. Experimental Method

MIP experiments were conducted using the American Corelab CMS300 and the American AutoPore Ⅳ 9505 mercury pressure instrument. The samples were dried to a constant weight at 105 °C before testing. The maximum experimental pressure was 200 MPa, and the equivalent pore size could be calculated from the capillary pressure using the Washburn formula.
N2-GA experiments were conducted using a fully automated gas adsorption analyzer Autosorb-IQ. The SSA of the samples was calculated using the Brunauer–Emmett–Teller (BET) multimolecular formula. Parameters, such as the pore volume and average pore size, were calculated using the Barret–Joyner–Halenda (BJH) model based on desorption curves; the morphology of the isotherm in the N2-GA was used to qualitatively evaluate the PSD of the samples [27].
MAPs experiments were conducted using FEI’s Helios 650 scanning tests in the MAPs mode by scanning several thousand small and same-size images of ultra-high resolution in a selected area, splicing the small images into one ultra-high-resolution and ultra-large-area 2D image.

3. Results

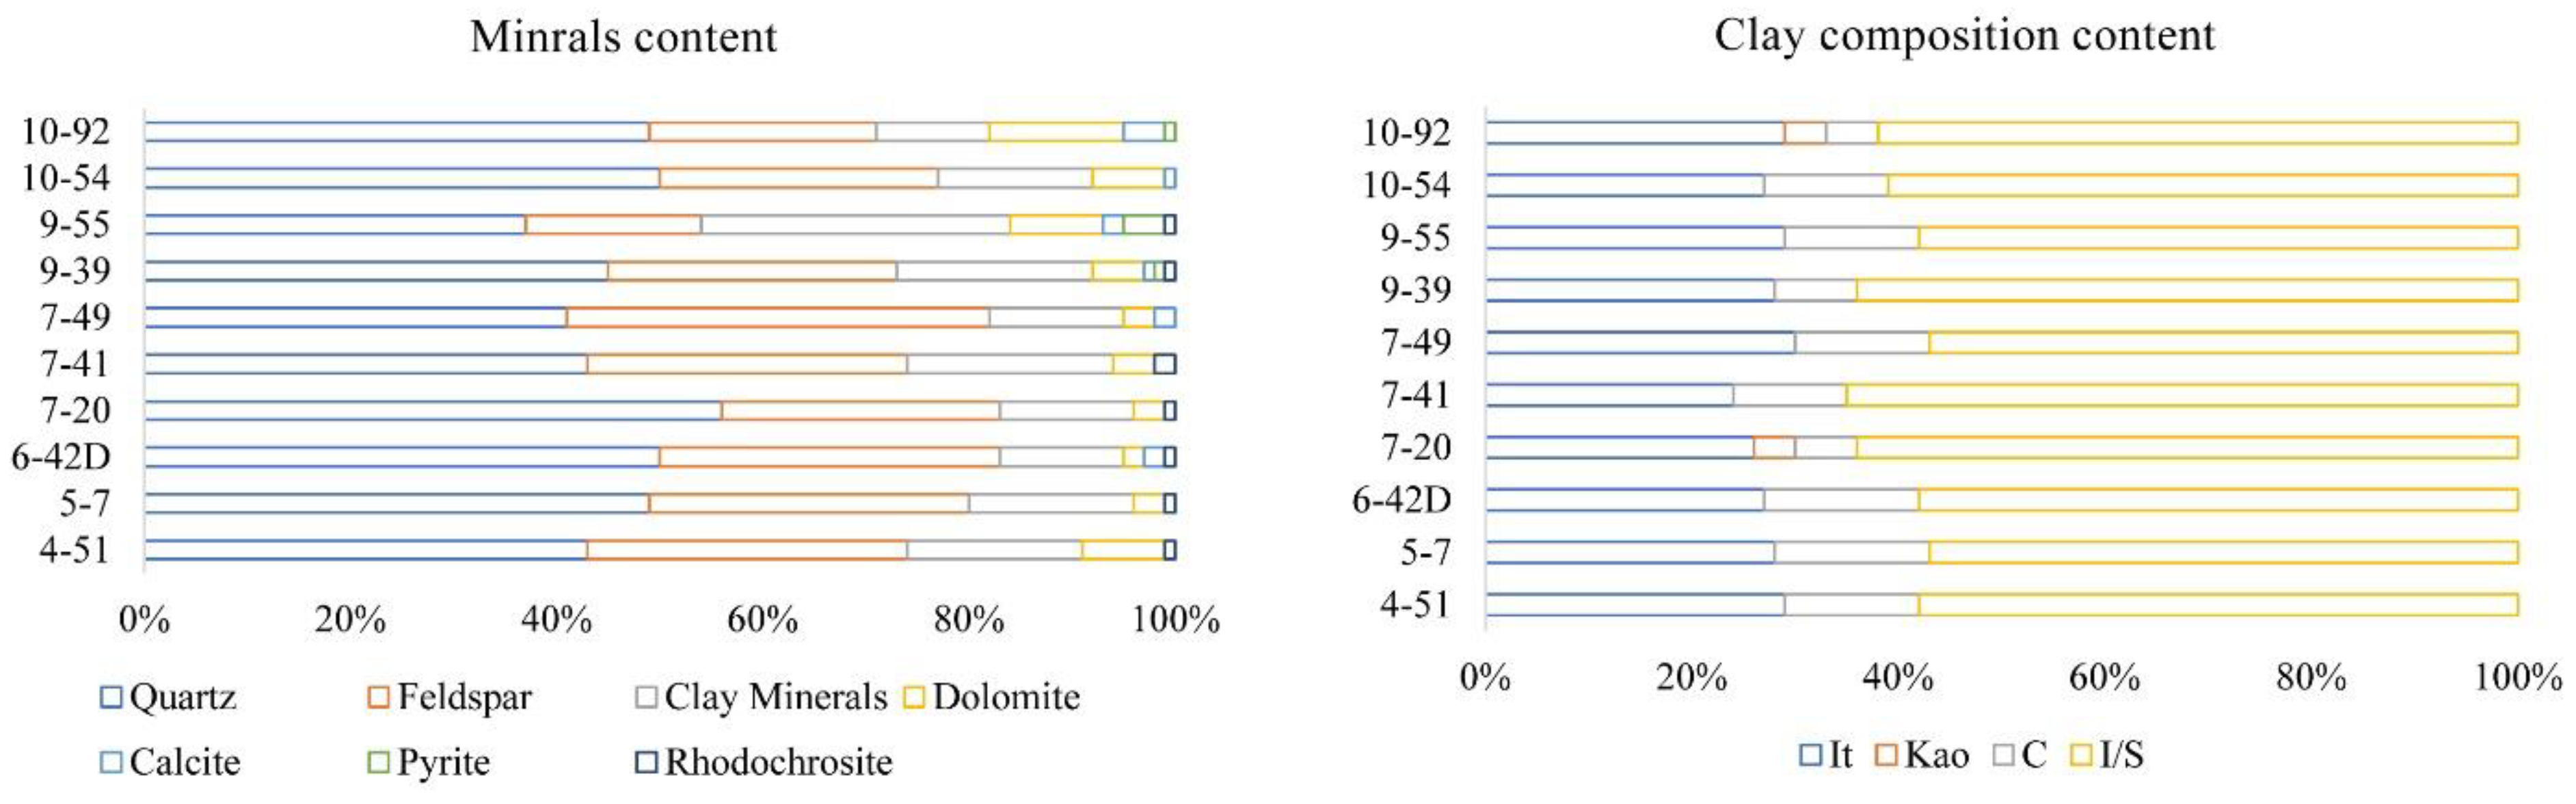
3.1. Lithology and Diagenesis

Figure 2 shows the XRD (X-ray powder diffraction) results of the samples. The mineral compositions include detrital minerals (quartz, feldspar); clay minerals (chlorite and illite); carbonate minerals (dolomite and calcite); and small amounts of pyrite and siderite. The distribution range of the detrital mineral content was 54% to 83%, with an average of 75%; the distribution range of the clay mineral content was 11% to 30%, with an average of 16.5%; and the distribution range of the carbonate mineral content was 3% to 18%, with an average of 6.7%.
The Chang7 Member of the Ordos Basin experienced moderate–strong mechanical compaction. The hydrocarbon source rocks at the bottom of the Chang7 Member produced organic acid before hydrocarbon expulsion, causing the dissolution of the tight sandstone [28]. Consequently, the reservoir’s pore structure has mostly suffered severe damage, making the pore structure complex. The samples of the study area have intergranular pores, intracrystalline pores, and dissolution pores, with occasional microfracture development. Intergranular pores (Figure 3a,d) are mostly irregular polygonal, and the compaction and cementation have produced an obvious reduction effect on the pore space, filled with calcareous and muddy minerals. Dissolution pores (Figure 3b) are more common in these samples and are irregularly polygonal in shape, and these pores can be observed microscopically, contributing to the pore space of tight reservoirs and having an enhancing effect on the pore space. In the clay minerals, many intracrystalline pores are developed (Figure 3c) with a small pore size and poor connectivity. Furthermore, microfractures (Figure 3e) that are mostly larger than 10 µm in width can be observed under the microscope and filled with organic matter.

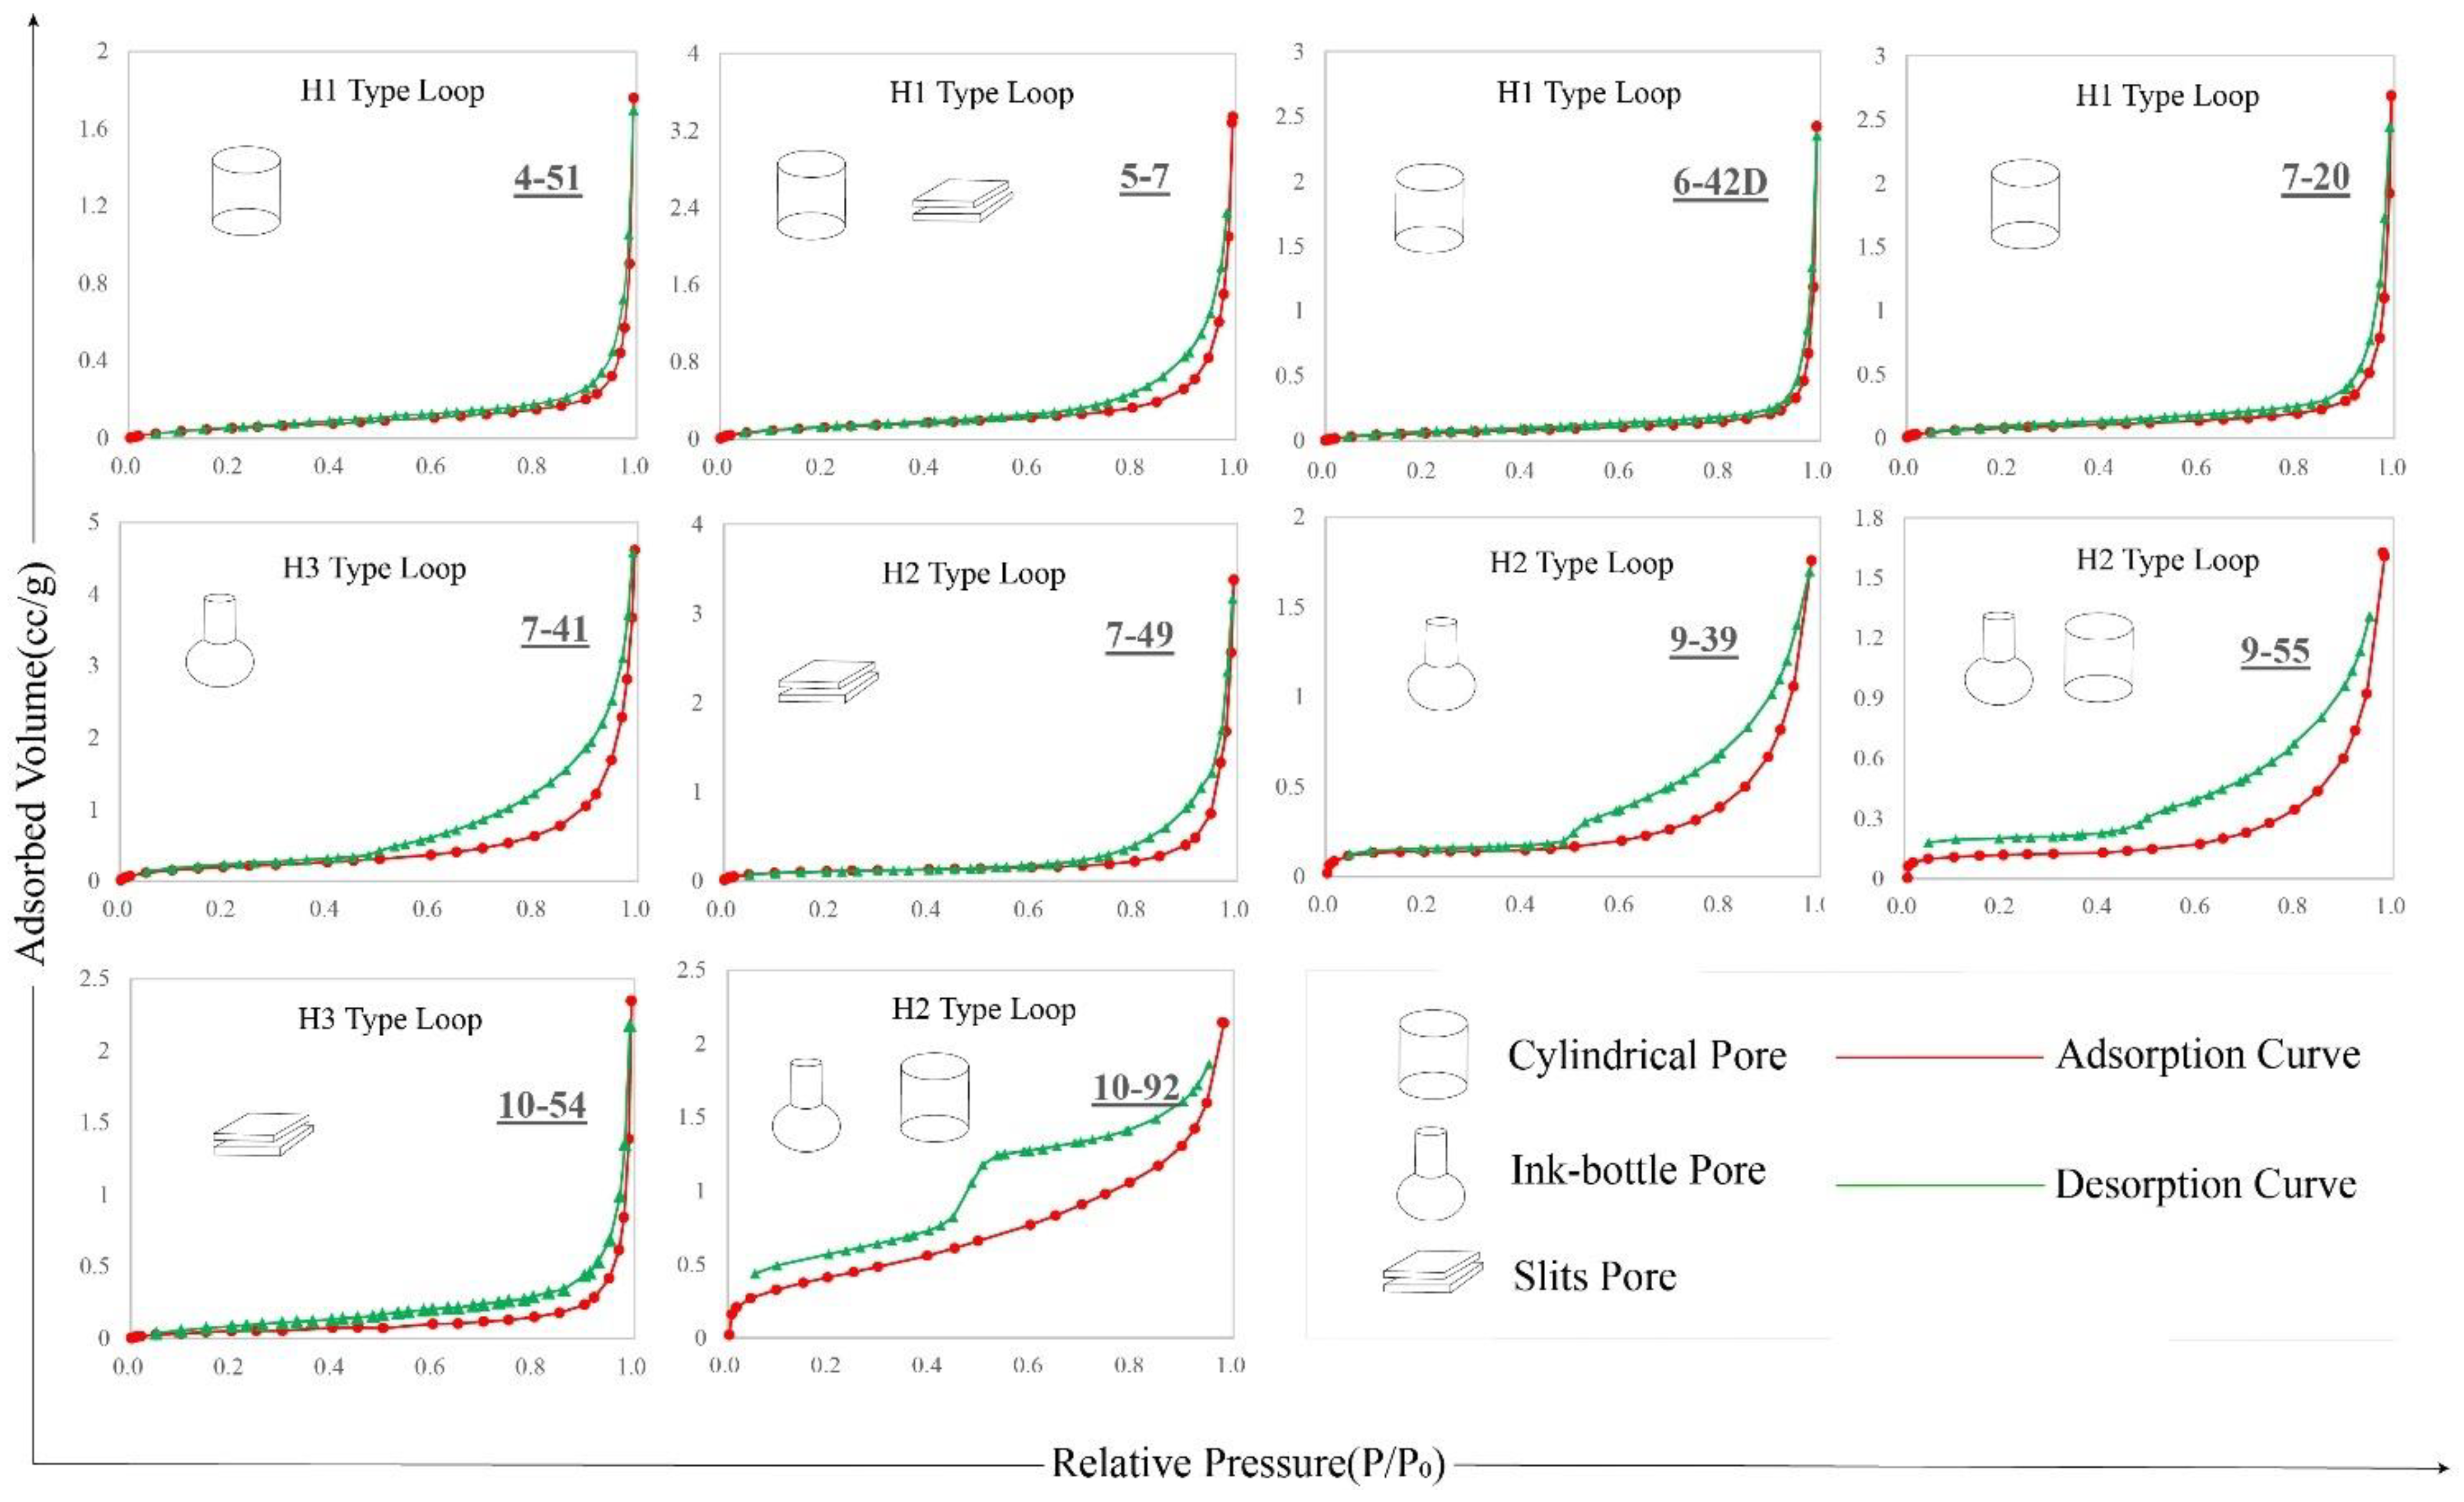
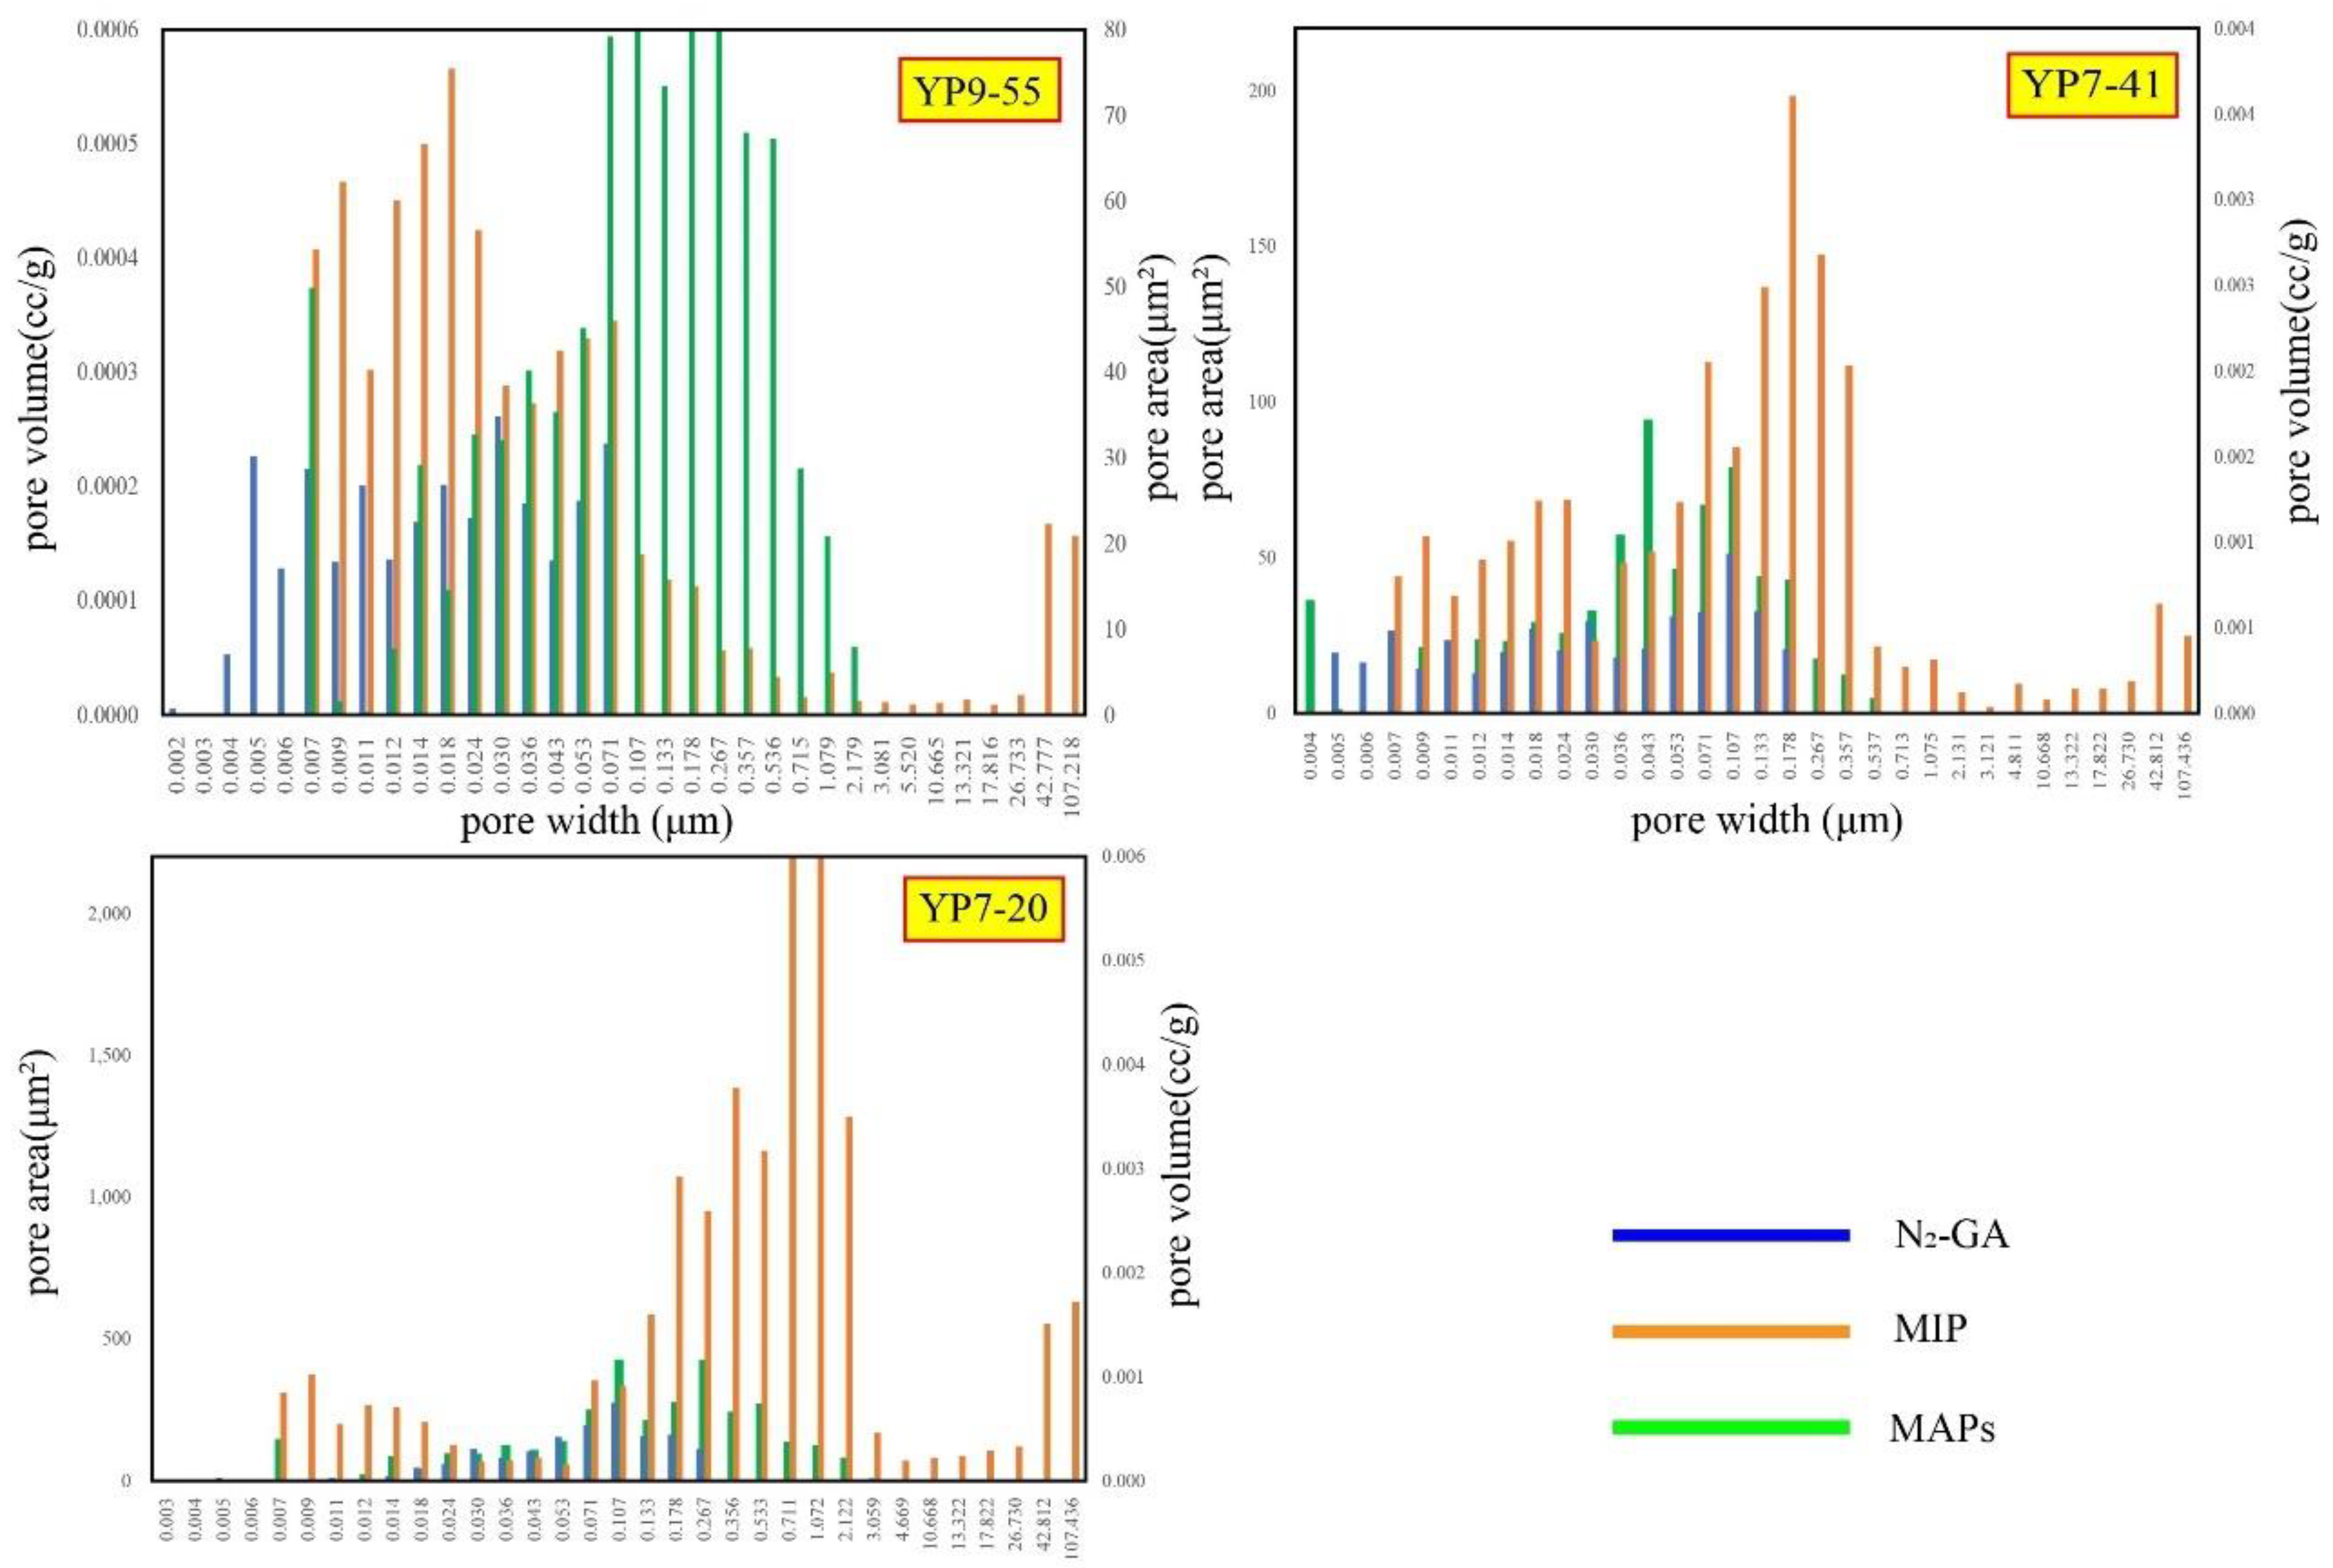
3.2. Results and Analysis of N2-GA Experiments

According to the BET theory, the SSA of the samples was distributed between 0.19 and 1.55 m2/g, with an average of 0.52 m2/g. The pore volume calculated using the BJH model was distributed between 0.003 and 0.008 cc/g, with an average of 0.004 cc/g. The average pore size of all samples was distributed between 1.40 and 11.58 nm, with an average of 4.39 nm. As shown in Figure 4, all of the samples’ isotherms have hysteresis loops, and according to Brunauer et al. [29], are of Type IV. Isotherm types can reflect valuable information, such as pore geometry characteristics. Using the classification criteria of the International Union of Pure and Applied Chemistry (IUPAC) [30], and according to the hysteresis loops’ morphology and inflection points, the Type IV isotherms of these samples can be subdivided into Type H1 (Samples 4-51, 5-7, 6-42D, and 7-20), Type H2 (Samples 7-41, 9-39, 9-55, and 10-92), and Type H3 (Samples 7-49 and 10-54). The curves of the H1 type reflect small adsorption amounts at low relative pressures. These hysteresis loops appear at higher relative pressure and correspond to a narrow pressure range, and their pore type is mainly cylindrical with both ends opening; the curves of the H2 type have an obvious inflection point compared with the adsorption curve, showing characteristics of instantaneous desorption. The distribution range of the hysteresis loop is larger, and its pore type is mainly ink-bottle-shaped; the curves of the H3 type are relatively narrow, and the curve slope increases significantly with the increase in the relative pressure. The desorption curve has no obvious inflection point, and its pore type is mainly of a flat plate shape. The isotherms of all of the samples showed no plateau when the relative pressure P/P0 was close to 1, relating to the capillary condensation phenomenon occurring in large pores [31], indicating that some macropores in the samples could not be measured via N2-GA experiments.

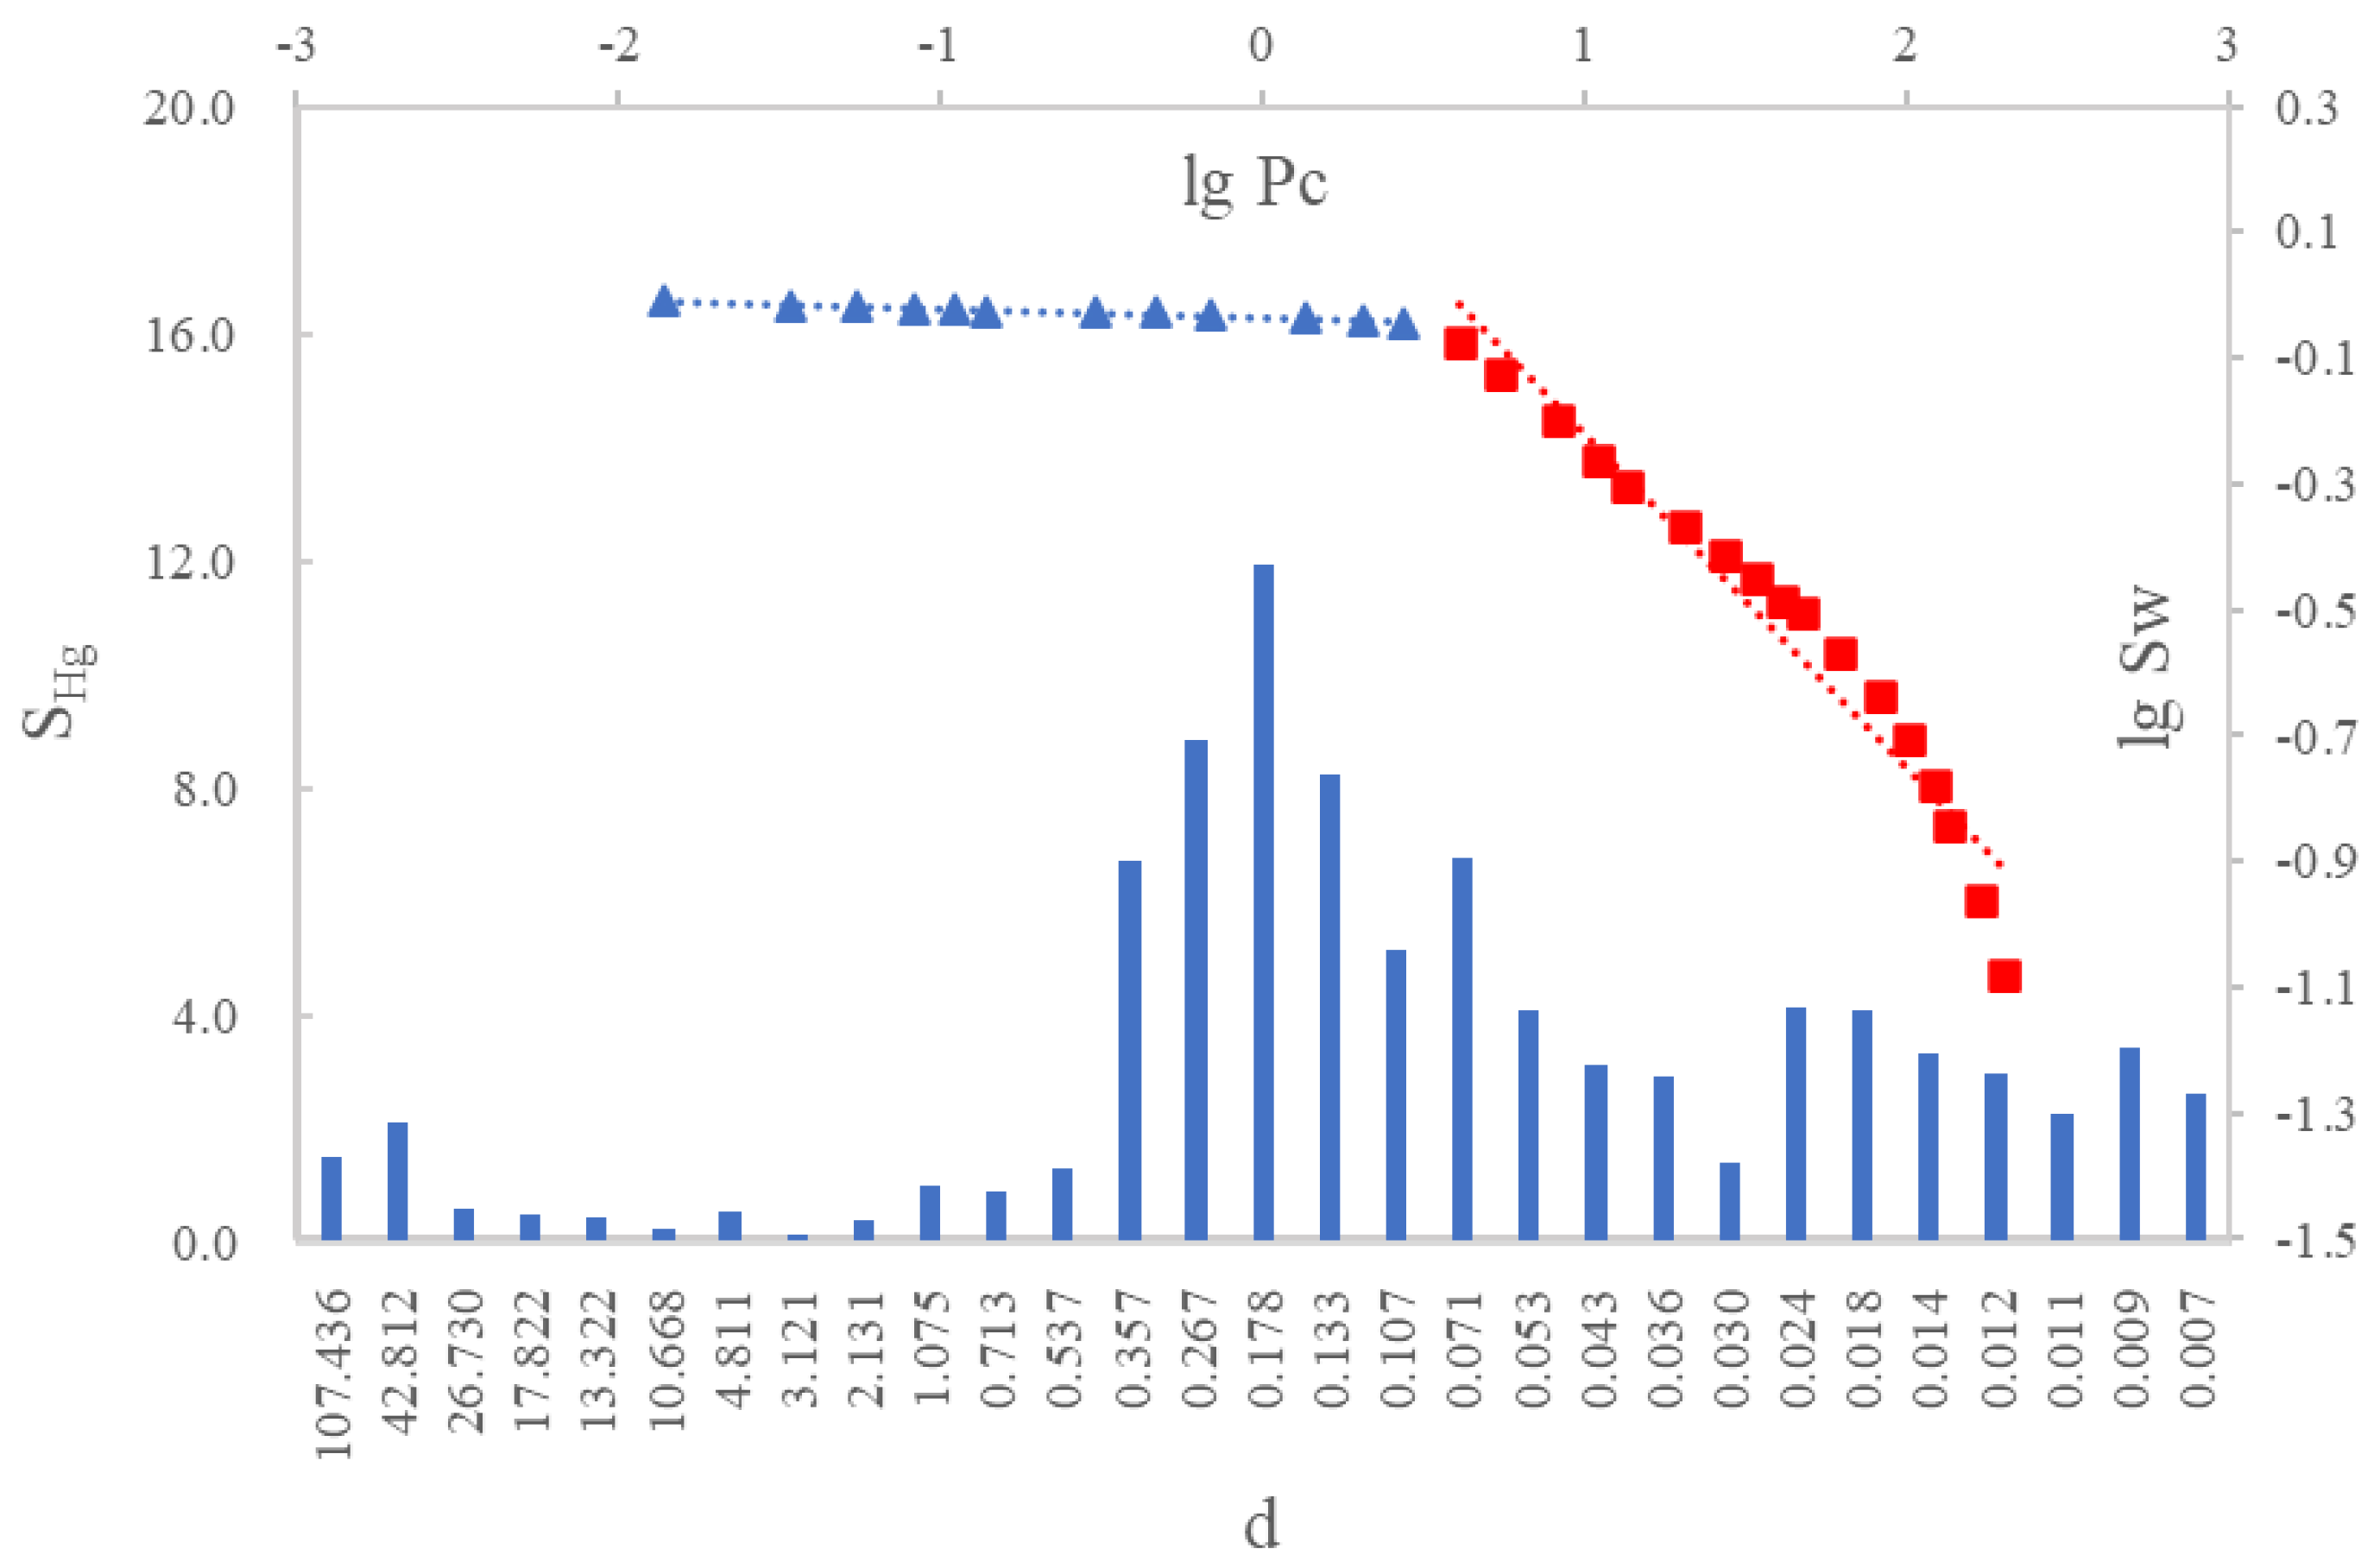
3.3. Results and Analysis of MIP Experiments

The MIP experiment is based on the capillary bundle model, assuming that the pore medium is composed of capillary bundles with different pore widths. When the injection pressure is higher than the capillary pressure corresponding to the pore-throat, the mercury enters the pore space, the injection pressure is equal to the capillary pressure, the corresponding capillary radius is the pore-throat radius, and the volume of mercury entering the pore space is the volume of the pore space connected by the pore-throat. By changing the injection pressure, the pore distribution curve and capillary pressure curve can be obtained as shown in Figure 5, and the calculation formula is as follows:
P c = 2 σ c o s θ r
where  P c  is the capillary pressure,  σ  is the interfacial tension between mecury and air,  θ  is the wetting angle of mercury with rocks, and  r  is the pore radius. As the mercury injection pressure increases, the smaller pore radius can be measured.
The experimental results showed that the porosity distribution range was 2.08% and 17.86%, with an average of 8.16%. It should be noted that the porosity here refers to the flow porosity, the value of which is slightly less than the effective porosity. The discharge pressure distribution range was 0.48 MPa and 13.79 MPa, with an average of 2.93 MPa. The median pore-throat radius distribution range was 0.007 μm and 0.244 μm, with an average of 0.142 μm. The capillary pressure curve had obvious hysteresis occurring between the injection and ejection curves (Figure 5), indicating that a large amount of mercury remained in the pore space.

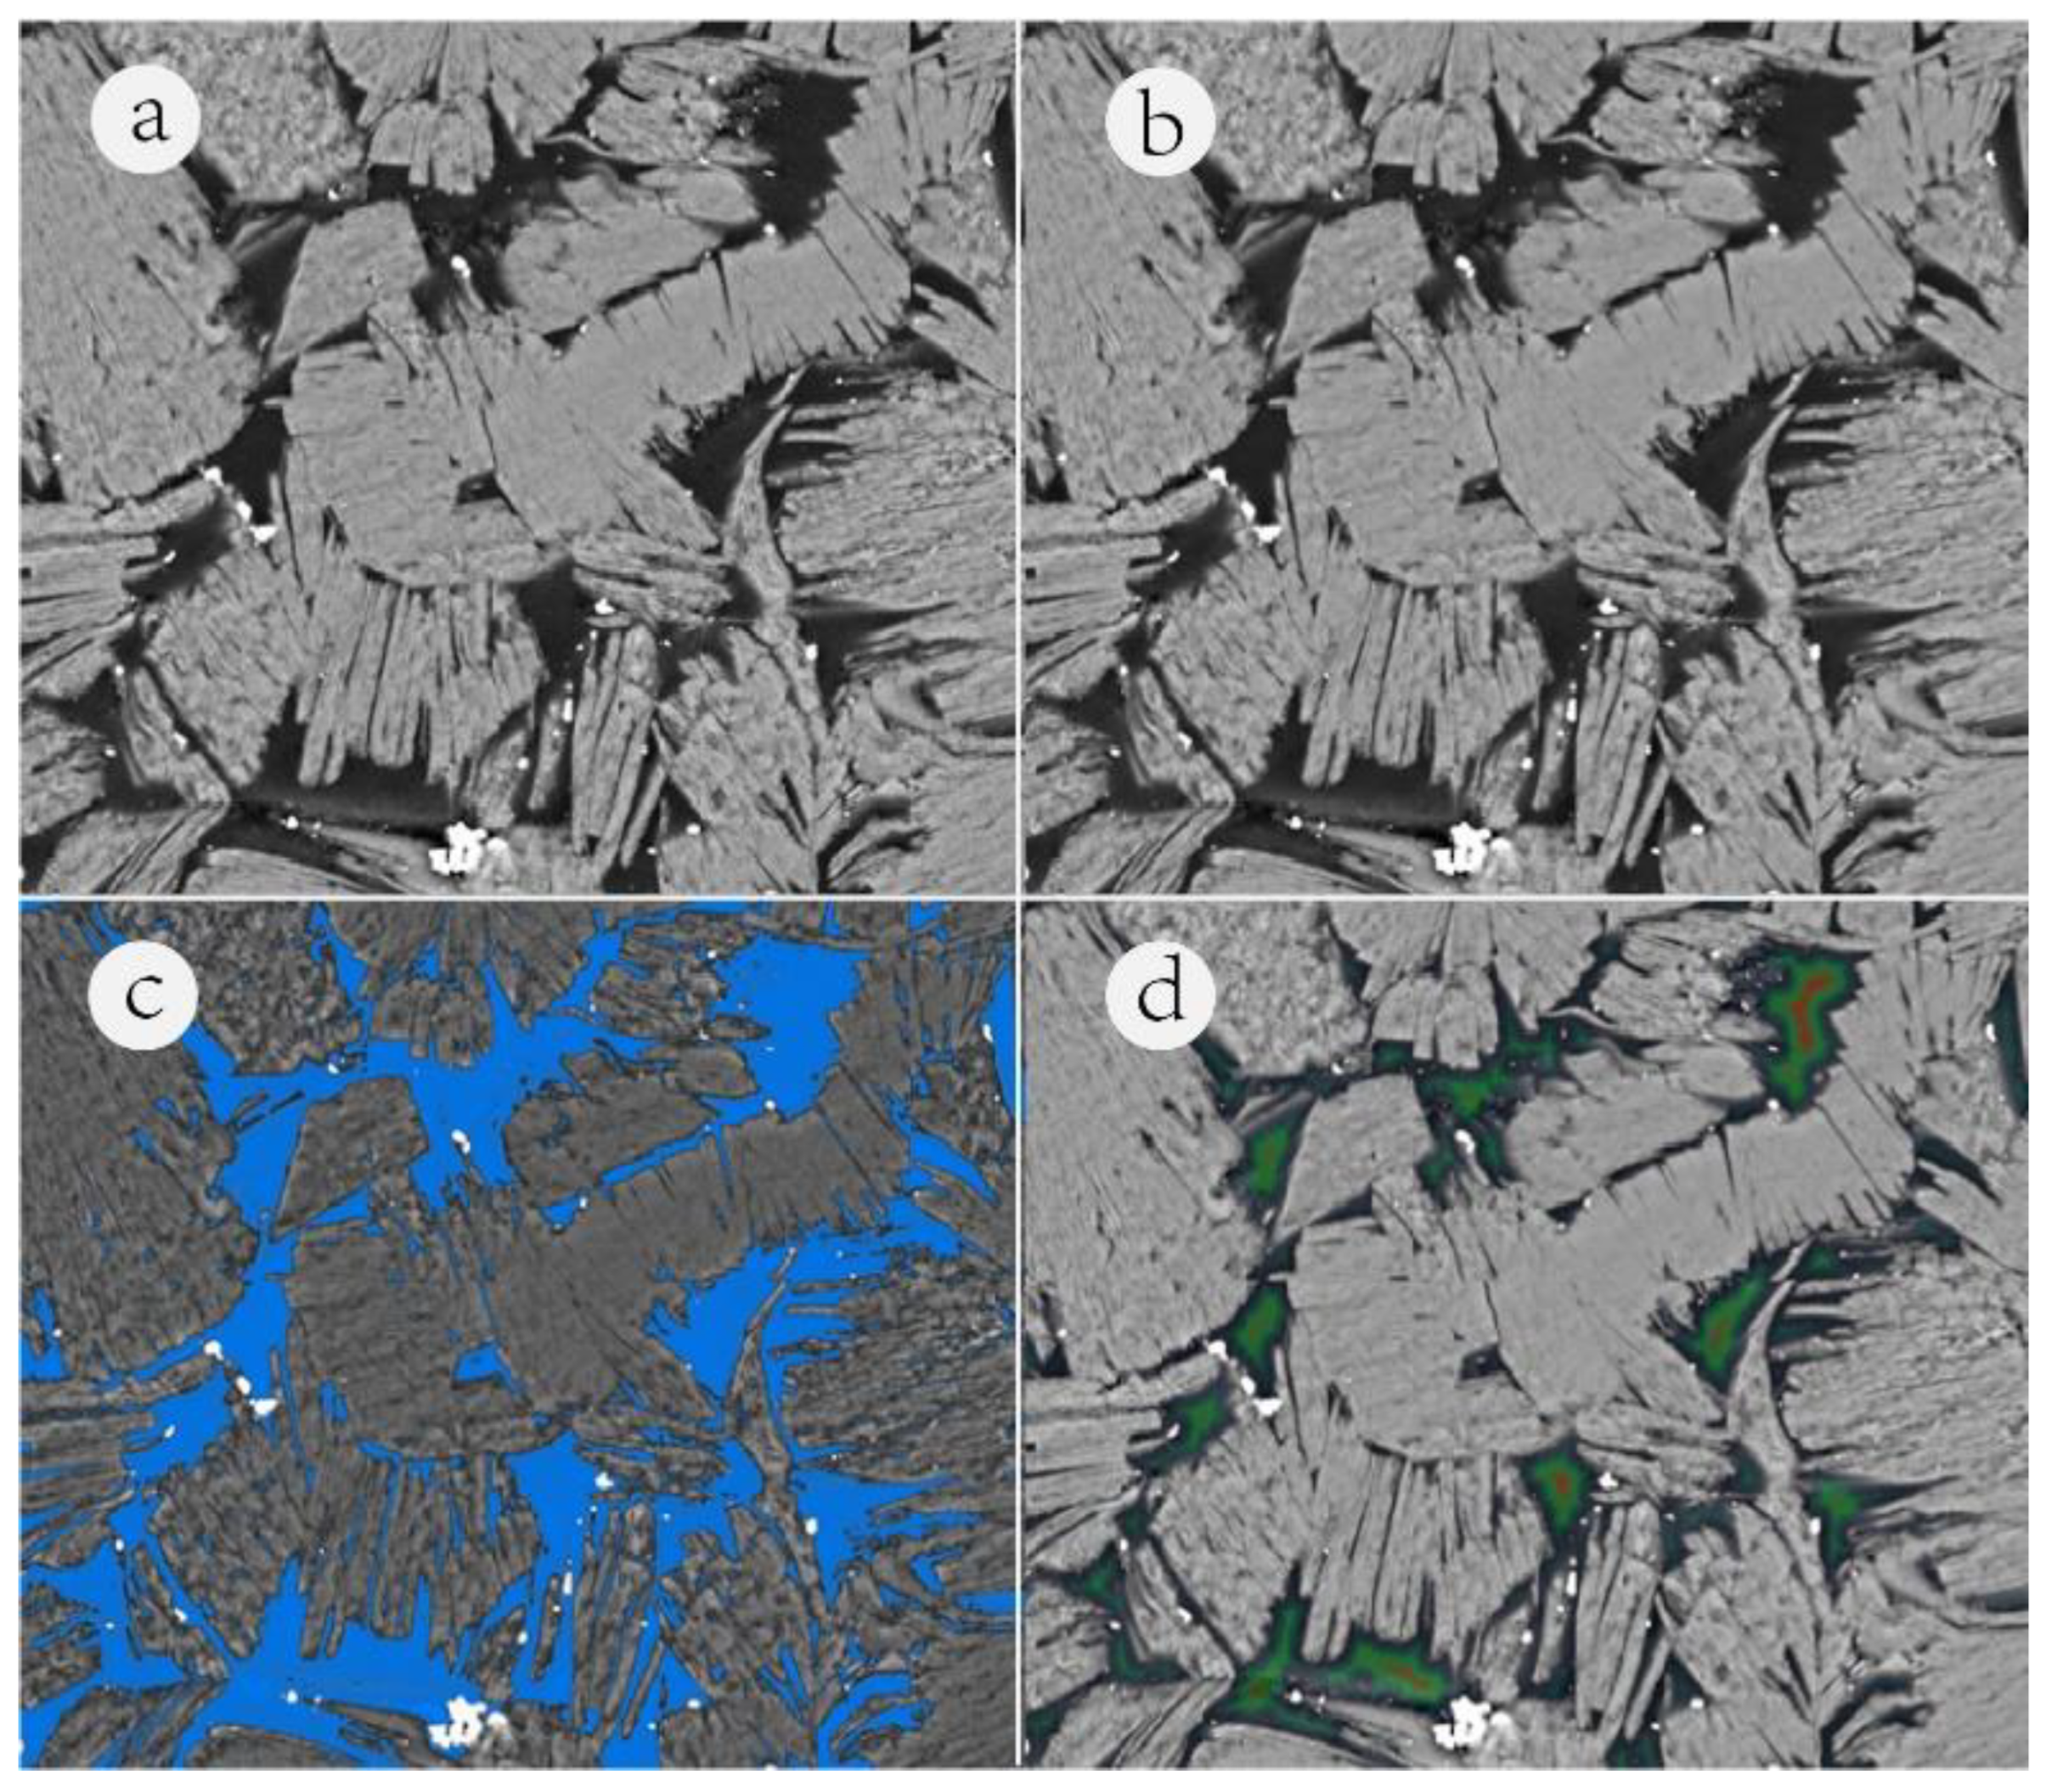
3.4. Experimental Results and Analysis of MAPs

The MAPs experiment obtained a large-area 2D BSE image with an ultra-high resolution (Figure 6a). Using ImageJ software, the image was smoothed (Figure 6b) and denoised, and then we conducted threshold segmentation for the obtained image (Figure 6c); the threshold for pores was set to 0 and that for particles was set to 1 to obtain a binarized image. Based on the binarized image, the pore’s medial axis was extracted (Figure 6d), and the pore size was determined by the distance from the pixels of the medial axis to the edge of the pores. The pore area distribution was then determined. From the MAPs image analysis, 2D pore-throat qualitative analysis and continuous quantitative characterization from the micro-nano range could be achieved [32].

4. Discussion

4.1. Combining Different Experiments to Characterize the Full-Range PSD

4.1.1. The Principle of Combining the Different Experiments

The PSD obtained from the N2-GA experiments in this study is mostly distributed in the range of several nanometers to more than 100 nm, and the PSD obtained from the MIP experiments is mostly distributed in the range of several nanometers to tens of microns. For example, the PSD of sample 7-20 is between 0.14 and 160.1 nm, measured via N2-GA, and the PSD of sample 7-20 is between 2 nm and 53 μm, measured via MIP. By comparing the pore size range of the MIP and N2-GA experiments, it was found that the pore size value of the two experiments was different. If the pore size range is uniform, it will be conducive to the horizontal comparison among the data and lay a good foundation for discussing the combined data. The pore size curve of the MIP experimental data was linearly extended toward the small pore (Figure 7a) so that the pore size range could cover the entire pore size range of the N2-GA experiments (Figure 7b). On this basis, the pore volume data of N2-GA were further interpolated onto this pore size range; to obtain the pore volume data of MIP and N2-GA based on the uniform pore size range (Figure 7c), the specific operation of interpolation was utilized to find the pore volume value of the N2-GA through the pore size range, as seen in Figure 7a, obtained via that which was linearly extended.
According to the abovementioned method in Figure 7, for the uniform pore size range, the MIP and N2-GA experimental pore volume data partly overlapped. For the overlapping pore volume, some scholars choose 50 nm as the splicing pore size [4,7,9], which distinguishes between the pores of mesopores and macropores according to the IUPAC criteria. Cao et al. [5] chose the splicing pore size of 10 nm based on the decimal pore classification criterion. Some scholars selected the splicing pore size when the change rate of the pore volume curves was equal, that is, when (dV/dD) N2GA = (dV/dD) MIP [33]. The abovementioned uniform methods are mostly simple between different experimental data, and the method’s rationality and splicing pore size have not been further discussed. The same numbered MIP and N2-GA experimental samples are not strictly from the same sample, and significant differences exist between the two methods regarding the experimental principles and calculation models.
When comparing the data of the two experimental methods, it is worthwhile to study the similarity trend of the overlapping data. Based on the new PSD, two parameters, “similarity  ” (Equation (1)) and “similarity  ” (Equation (2)), are introduced. The first parameter reflects the similarity trend of the overlapping part, and the second parameter reflects the statistical similarity of the overlapping part. Combining the two parameters can well reflect the comprehensive similarity of the pore volume data in the overlapping part. If the data exhibit high similarity, the overlapping data are comparable and applicable for combination, and vice versa. Table 1 shows the two parameters for the 10 samples in this study.
s i m i l a r i t y = cos θ = A · B A · B
where  A  is a vector comprising the pore volume data of the N2-GA in the overlapping part, and  B  is a vector comprising the pore volume data of the MIP pore in the overlapping part. The range of  cos θ  is [−1, 1]. When the value tends to 1, the two vectors are closer, and when the value tends to −1, the two vectors are more opposite. Therefore, this parameter can be used to characterize the similarity trend of the overlapping part.
s i m i l a r i t y = i = 1 n a i b i i = 1 n ( a i + b i )
where  a i  is the N2-GA pore volume corresponding to the i-th column in the overlapping part, and  b i  is the MIP pore volume corresponding to the i-th column in the overlapping part. Two volume data on each pore size were differenced and their absolute value was summed. The obtained values were compared with the total volume of the two methods in the overlapping part to characterize the statistical similarity of the overlapping data. The two parameters are reported in Table 1.
In order to study the differences with comprehensive similarity, 3 of the 10 samples were selected. These were Sample 7-41 with good comprehensive similarity, Sample 9-55 with moderate comprehensive similarity, and Sample 7-20 with poor comprehensive similarity. The full-range pore size and area distributions were obtained using the MAPs experiment. The extracted pore area was also interpolated by the same pore size range with MIP and N2-GA. Finally, the three methods’ pore data characteristics were compared in the uniform pore size range.

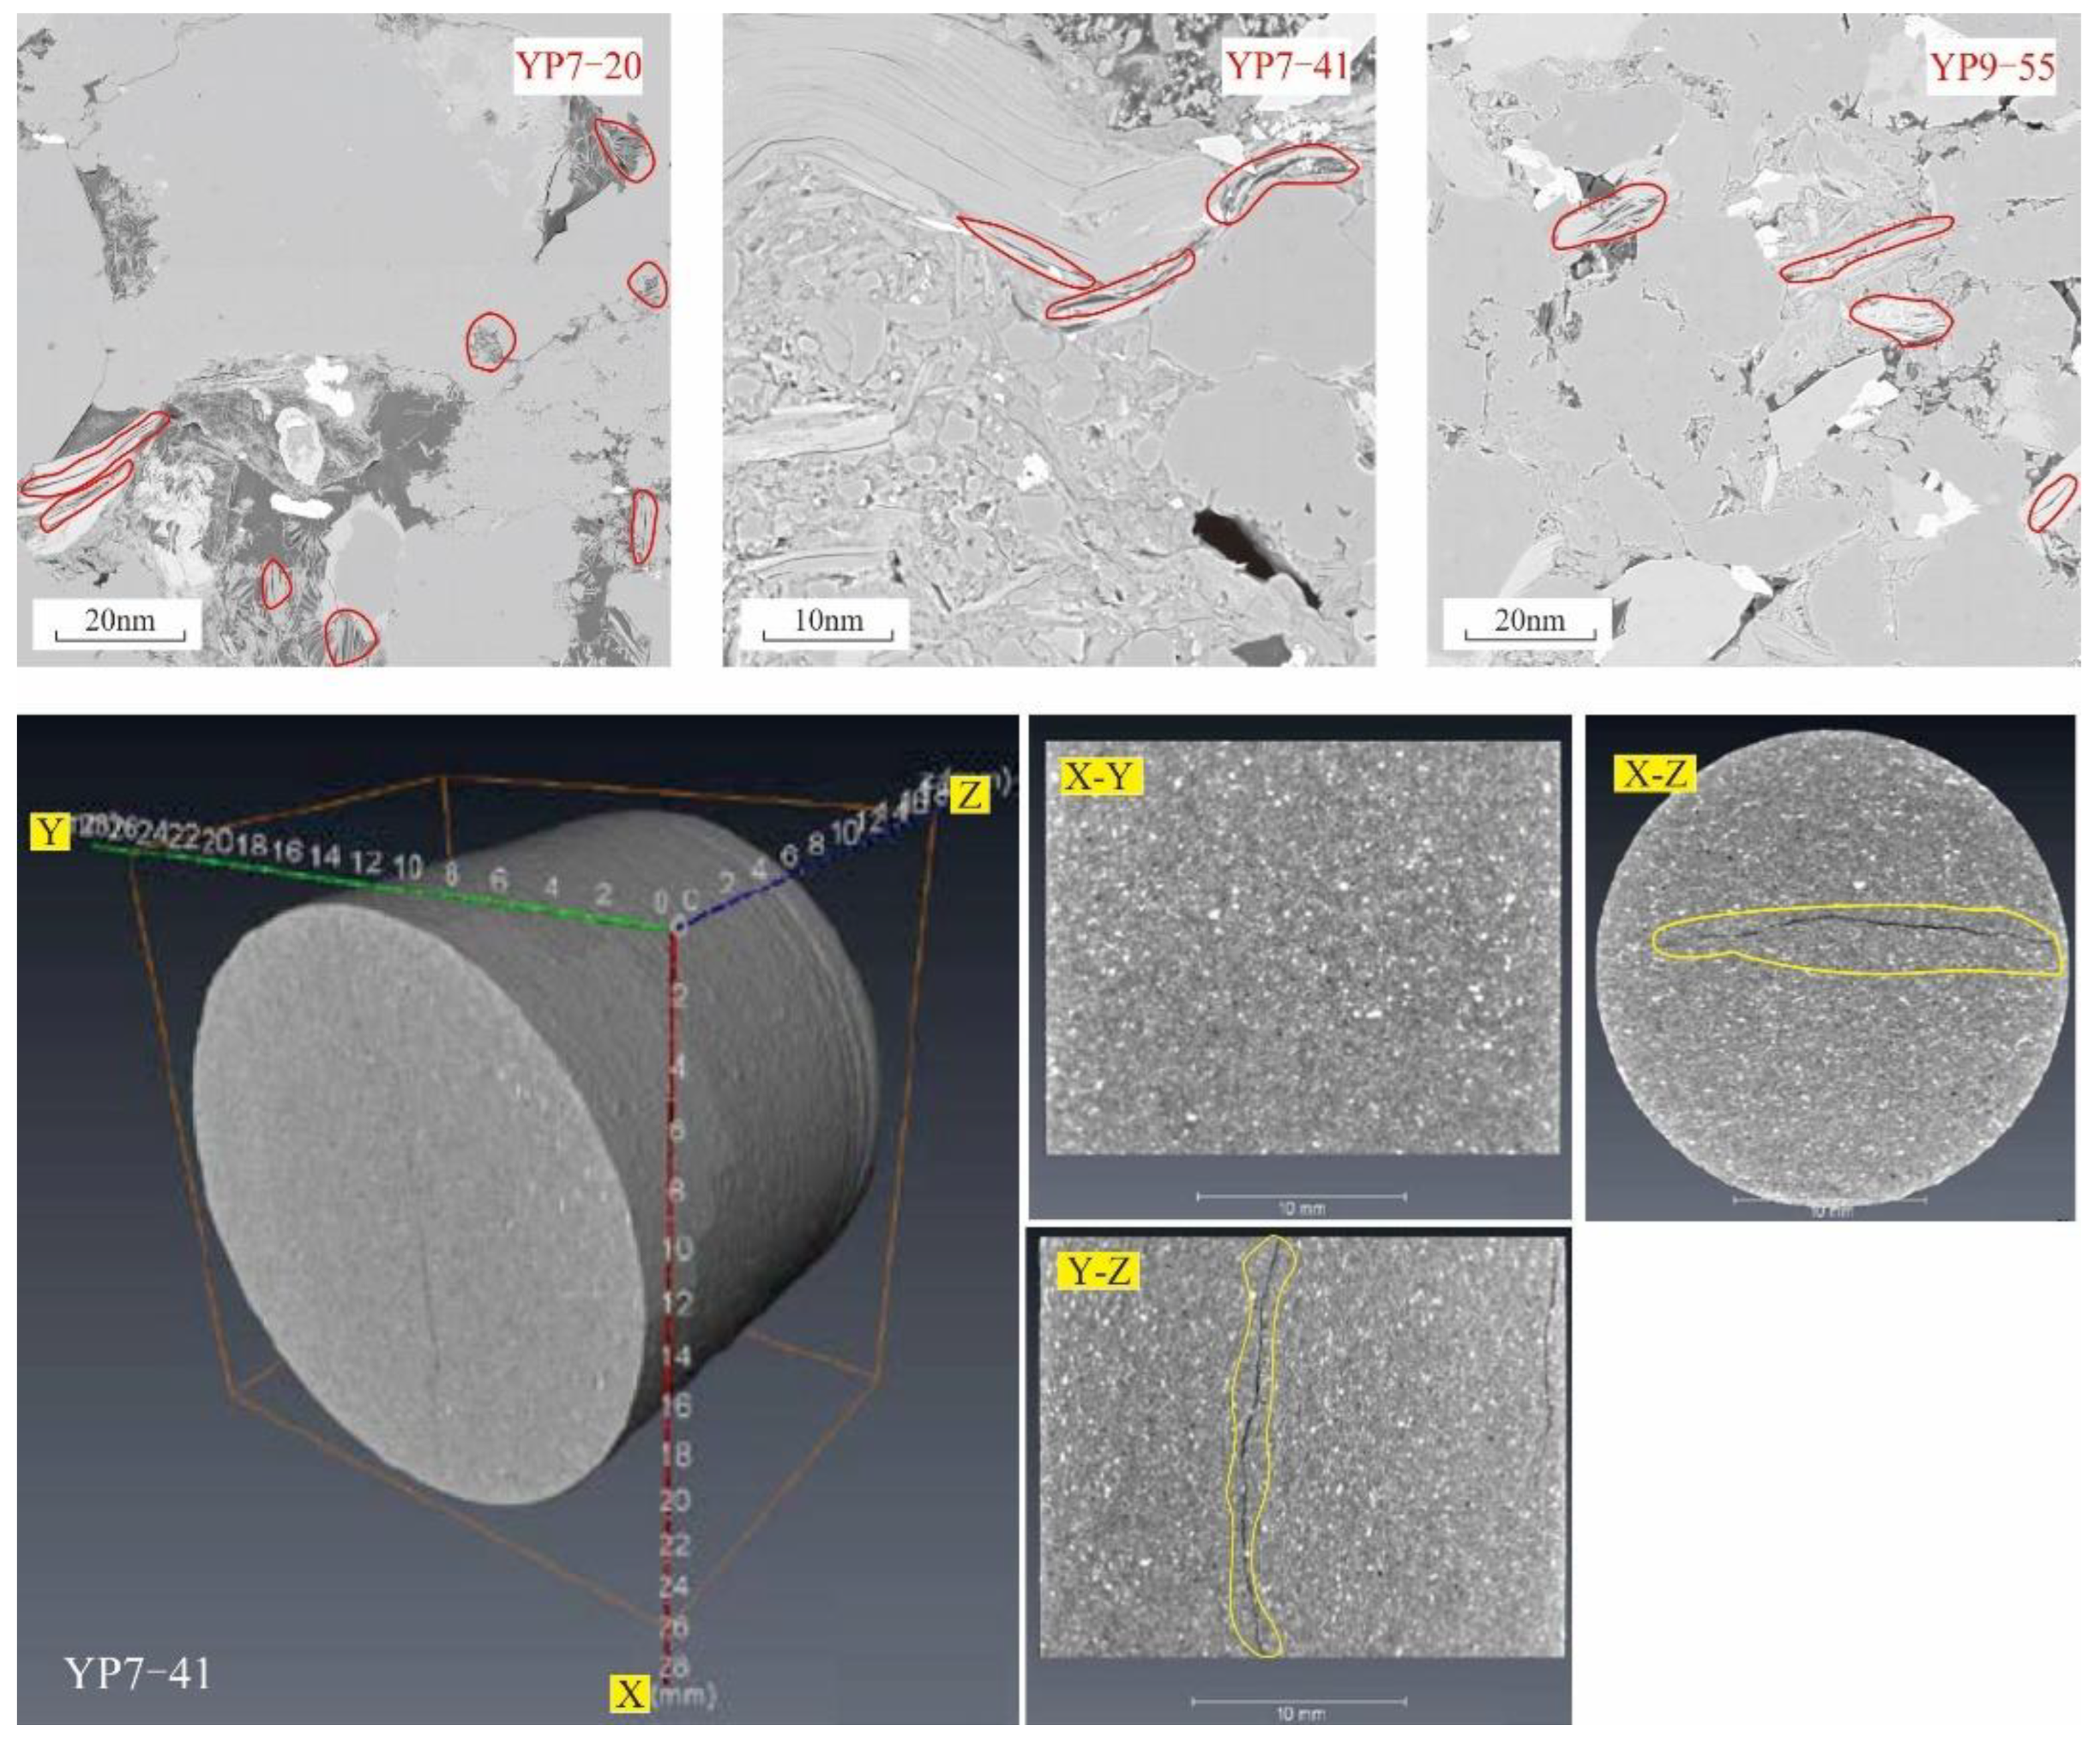
4.1.2. Using MAPs to Verify the Rationality of the Data Splicing

The pore size range of the MAPs includes the nano-micro range, covering the overlapping data of MIP and N2-GA. Therefore, introducing the MAPs is critical for verifying the rationality of splicing the overlapping data between the two experimental methods.
By comparing the data of the three experiments in a uniform pore size range (Figure 8), regardless of the comprehensive similarity of the overlapping part, there is not an applicable splicing point in the pore volume data. Specifically, the data from the three methods are poorly correlated with trends, pore volume values, and similarity. Taking Sample 7-41 with the best comprehensive similarity as an example, the data of the three experimental methods showed some differences in the overlapping pore size range. For the pore size larger than 50 nm, the MAPs and MIP data showed poor similarity, and the N2-GA and MAPs also showed poor similarity when the pore size was smaller than 50 nm. Therefore, it was challenging to find an applicable pore size for data splicing. Instead of simply splicing, in-depth studies are needed to combine MIP and N2-GA data to characterize the full-range PSD. The study of the data splicing should not be on a single pore size but on the similarity trend of overlapping data, and an in-depth study of different experimental methods should be carried out. Zhu et al. [3] highlighted that multiscale data fusion does not simply involve data splicing but requires a comprehensive study of pore structures, mineral compositions, and so on.

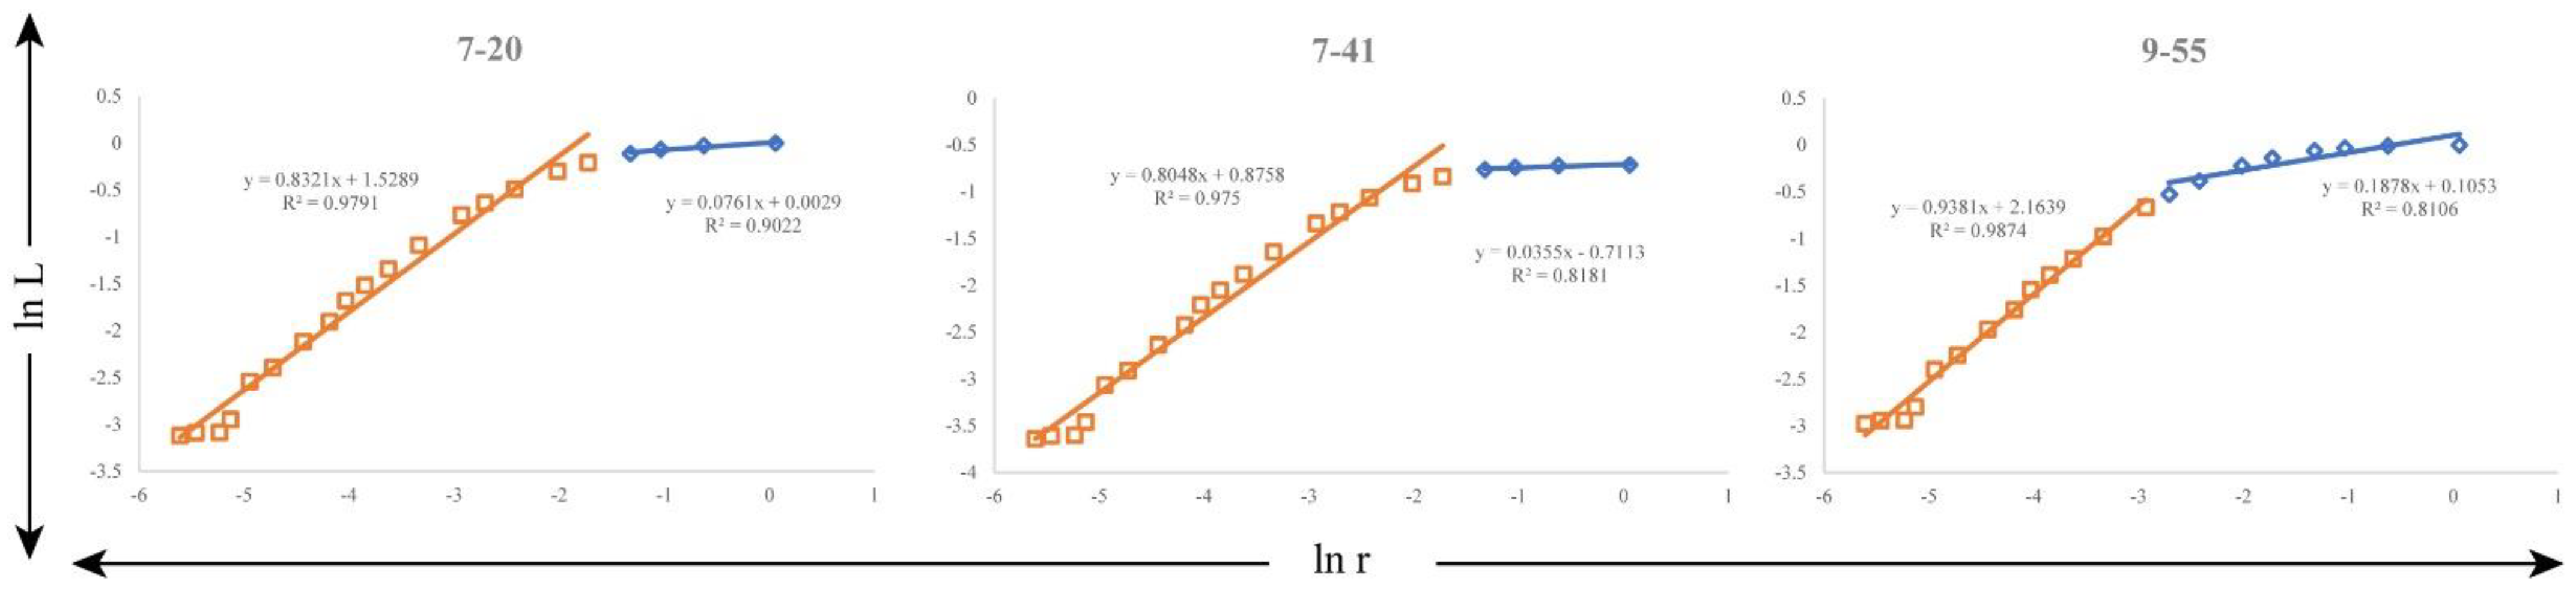
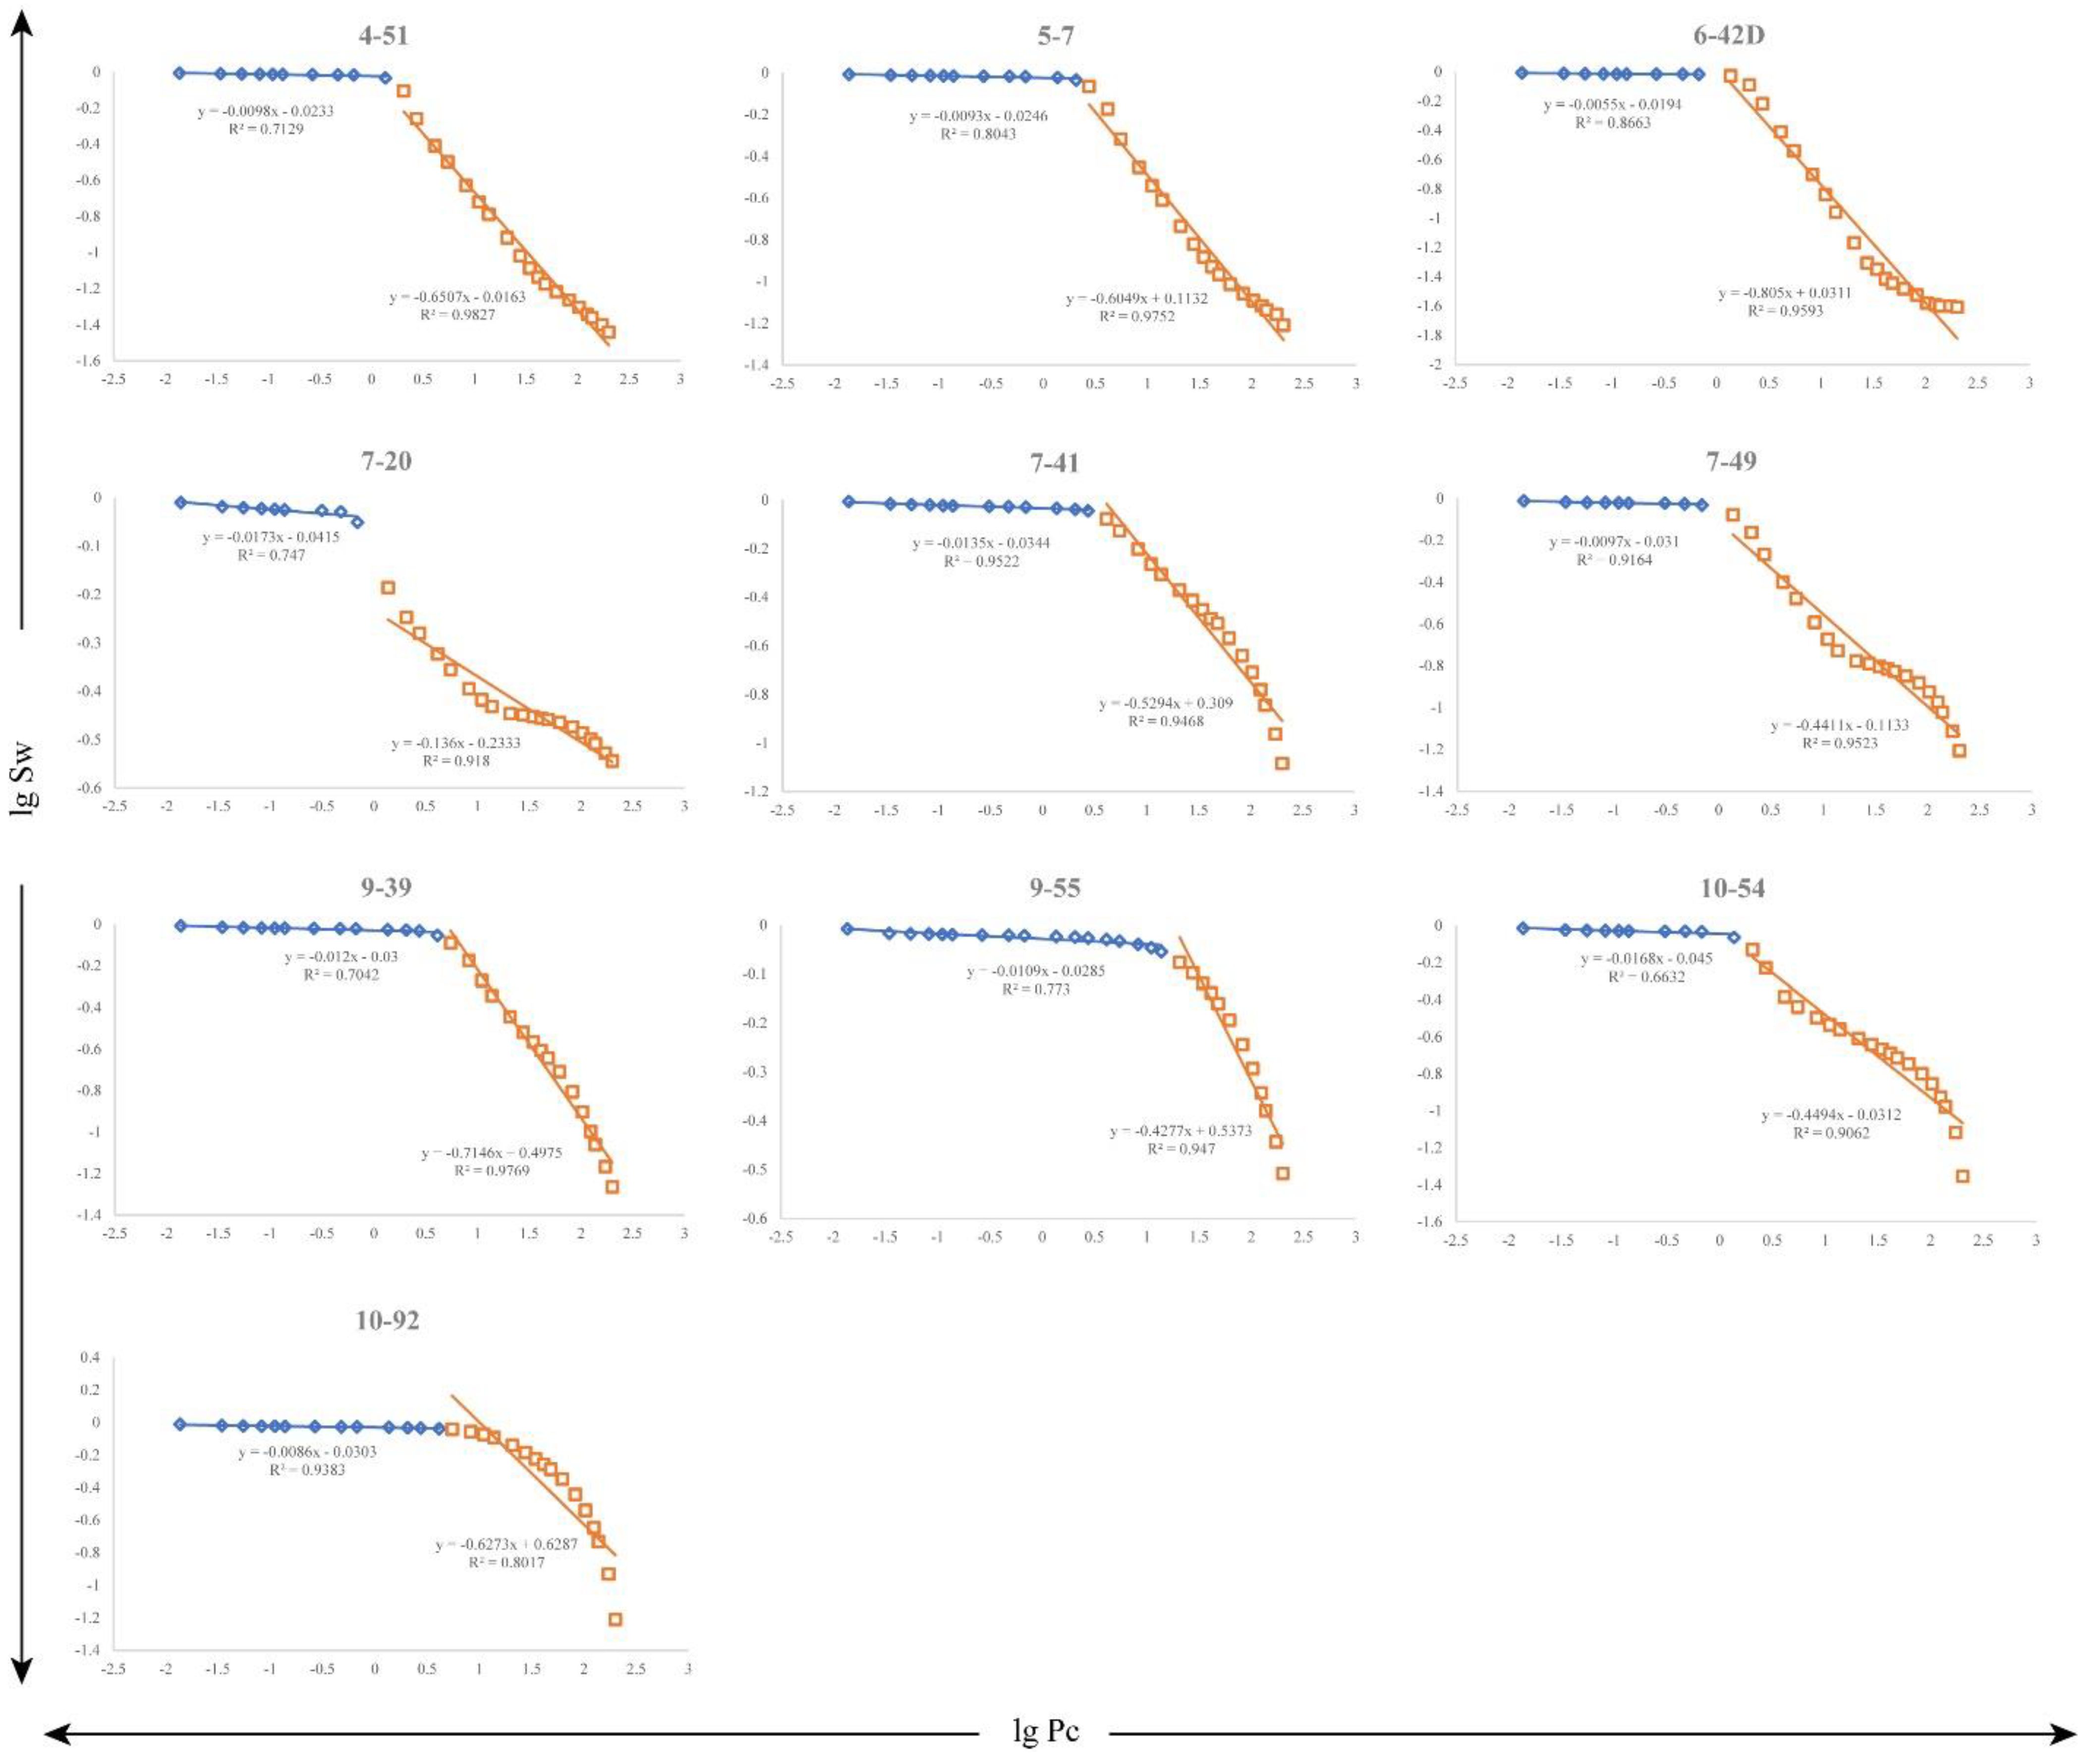
4.2. Full-Range Fractal Study of Reservoir’s Heterogeneity

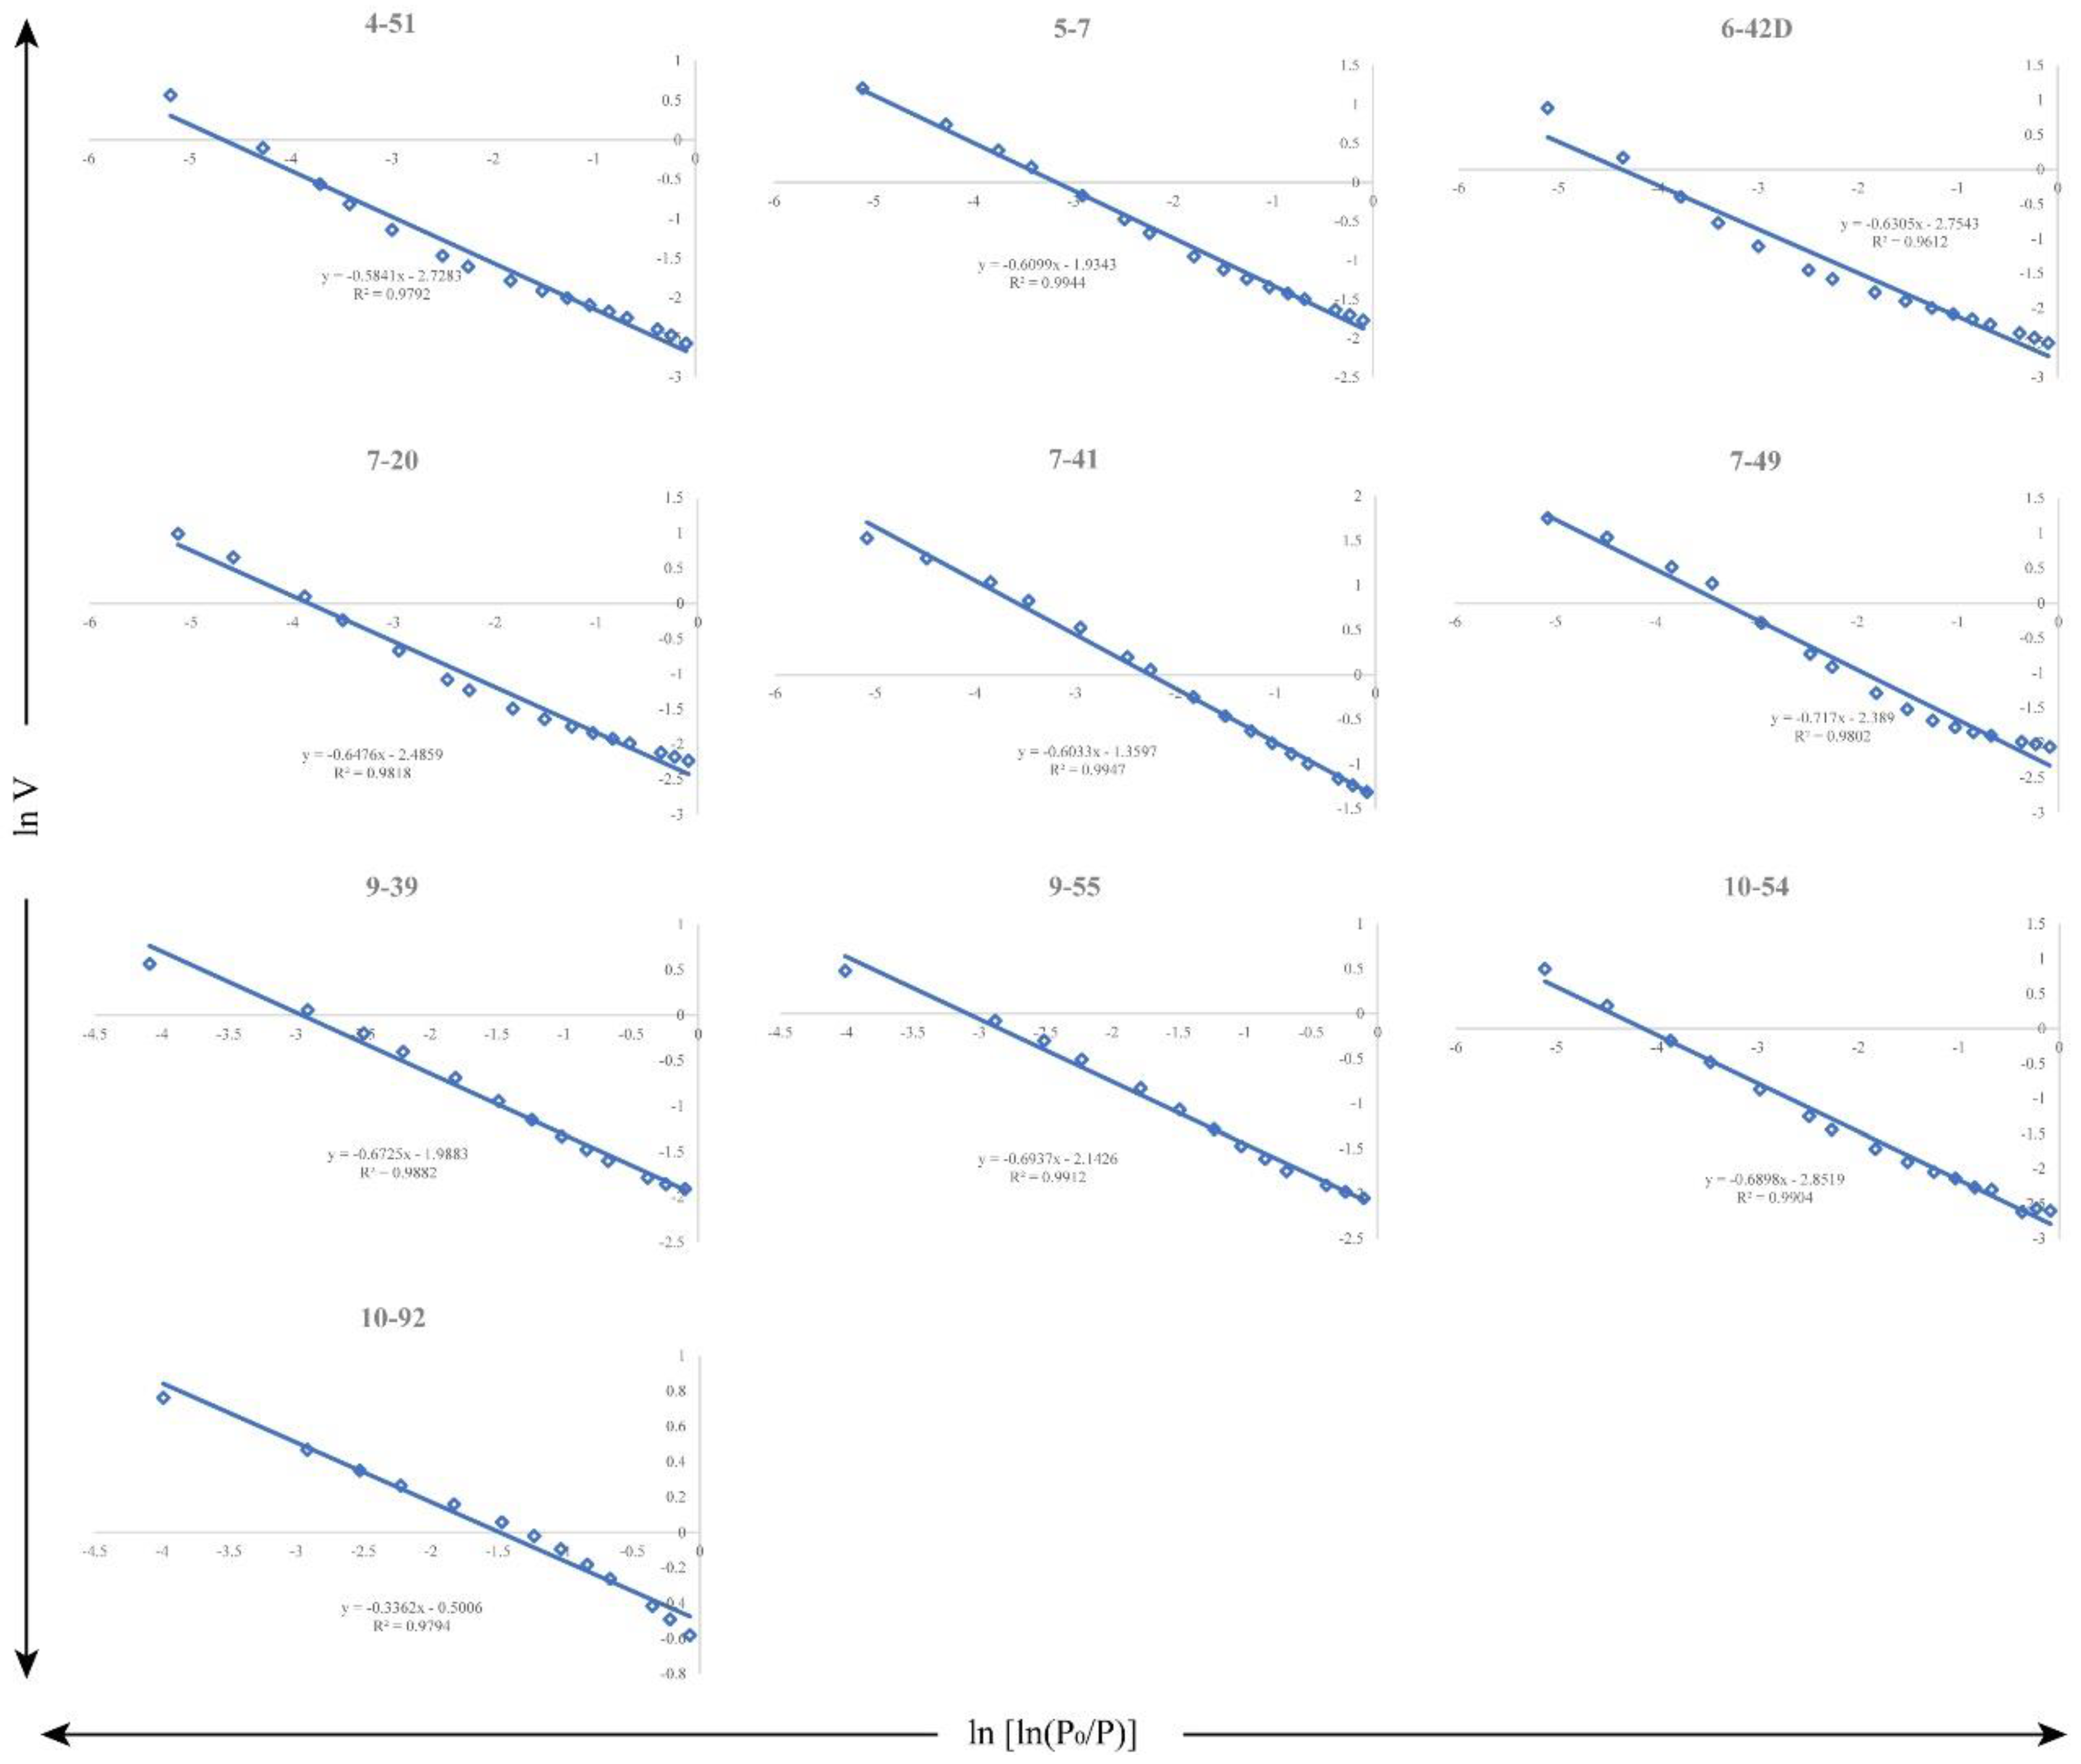
4.2.1. Two-Dimensional Fractal Dimension Calculation Model

From the image of MAPs, the pore size and pore area percentage can be obtained. These data are combined with the fractal theory to derive the calculation method of the 2D fractal dimension. The power law function describing the fractal characteristics of porous media is as follows:
N ( > r ) r D
where  r  is the pore radius,  N ( > r )  is the number of the pore space with a pore radius greater than r N ( > r )  and r have the following power function according to the principle of fractal geometry:
N > r = r r m a x P r d r = a r D
where  r m a x  is the maximum pore radius,  P r  is the density function of the pore radius distribution, and a is a proportional constant.
The P(r) can be obtained by taking a derivative with respect to r in Equation (4):
P r = d N ( > r ) d r = a r D 1
where  a = D a  is a proportional constant.
The expression of the accumulated pore area less than r in the reservoir can be obtained by substituting Equation (5) into the following formula.
S < r = r m i n r P r · α · r 2 · d r = a ( r 2 D r m i n 2 D )
where the constant  a = a a α / ( 3 D ) α  is a constant related to the pore shape, and  r m i n  is the smallest pore radius in the reservoir. Similarly, the  S  which represents the total pore area of the reservoir is as follows:
S = β ( r m a x 2 D r m i n 2 D )
The expression of the accumulated pore area fraction with a pore radius less than  r ;   L  can be obtained by substituting Equations (6) and (7) into the following formula.
L = S ( < r ) S = r 2 D r m i n 2 D r m a x 2 D r m i n 2 D
Since  r m i n r m a x , Equation (8) can be simplified as follows:
L = ( r r m a x ) 2 D
Taking logarithms on both sides of Equation (9), we can then obtain the fractal formula of MAPs.
l n L = 2 D ln r r m a x = 2 D l n r 2 D l n r m a x
where  2 D l n r m a x  is a constant. Equation (10) can be simplified as follows:
l n L = 2 D l n r + C
Therefore, from the pore area percentage ( L ) and the pore size ( r ), the 2D fractal dimension can be calculated by finding the slope  k  of double logarithmic curves in Figure 9 ( D = 2 k ). The fractal dimension of the small pore is distributed between 1.06 and 1.20, with an average of 1.14, and the large pore is distributed between 1.81 and 1.96, with an average of 1.90. The data indicate that the large and small pores have different pore structure characteristics. The fractal dimension of the large pore is larger than that of the small pore, indicating that the pore space and pore-throat configuration of large pores are more complex.

4.2.2. Three-Dimensional Fractal Dimension Calculation Model

Based on the MIP experimental data, the equation for calculating the fractal dimension from the capillary curve is as follows [18]:
lg 1 S H g = D 3 l g · P c D 3 l g · P s
where  S H g  is the saturation of the nonwetting phase,  P c  is the capillary pressure, and  P s  is the mercury inlet pressure.
Based on the N2-GA experimental data, the fractal dimension of the tight sandstone was calculated using the FHH model with the following equation:
l n · V = K ln l n P 0 P + C
where  V  is the gas adsorption volume corresponding to the equilibrium pressure (cm3/g),  P 0  is the saturation vapor pressure (MPa),  P  is the pressure of the system at equilibrium (Mpa),  K  is the slope of the double logarithmic curve, and  C  is a constant.
From Equation (12), a linear relationship exists in the logarithmic curve between the reservoir capillary pressure and wetting phase saturation as shown in Figure 10, and the fractal dimension based on the capillary curve can be obtained via linear regression of the MIP data. The double logarithmic curve has an obvious inflection point, which divides the curve into two segments. The fractal dimension of each segment is between two and three, which is consistent with the definition of a fractal in a porous systems [34,35]. The fractal dimension D1 of the large pore is distributed in the range of 2.98 and 2.99, with an average of 2.99, and the fractal dimension D2 of the small pore is distributed in the range of 2.20 and 2.86, with an average of 2.46. The segmental fractal indicates that the large and small pores have different pore structures. The fractal dimension of the large pore is larger than that of the small pore, indicating that the pore morphology and pore-throat configuration relationship is in a different pore size range. This feature is consistent with the 2D fractal dimension calculated from the MAPs data.
From Equation (13), the fractal dimension of N2-GA can be obtained (Figure 11). Its fractal dimension is distributed between 2.28 and 2.66 with an average of 2.38, indicating that the heterogeneity characterized by the N2-GA experiment is relatively weak.
The difference in diagenesis and later reformation can explain the difference in the fractal dimension between the large and small pores. For small pores, the organic acids produced by hydrocarbon source rocks at the bottom of the Chang7 Member have a more pronounced acid-etching effect on small pores because the organic acids preferentially react in small pores with large SSA [36], making their pore distribution less heterogeneous. The clay mineral filling mainly affects large pores, making the surface more heterogeneous. The high percentage of pore-filling minerals in the Chang7 Member tight reservoir directly leads to the large fractal dimension of the large pores. For the same sample, the pore with a larger fractal dimension has more complex pore structure types and a more complex pore-throat configuration relationship, and its heterogeneity is stronger. Therefore, the strong heterogeneity of the large pores in the study area is the principal reason for the complex pore structure.

4.2.3. Discussion of the Fractal Dimension of the MIP

The fractal dimension of the MIP corresponds to a pore size range of a few nanometers to hundreds of micrometers. Therefore, studying the fractal dimension of MIP is important for characterizing the heterogeneity of pores. All fractal curves have a distinct inflection point, indicating that the fractal has a segmented character. Combining the PSD histogram and the double logarithmic curve of MIP, the segmented fractal features can correspond well with the PSD histogram pattern. The PSD histogram mostly has two segments of normal distribution and uniform distribution, corresponding well with the segmented fractals of the double logarithmic curve (Figure 12). In the preliminary study of the fractal characteristics, the segmental of the fractal can be judged according to the experimental PSD histogram.
The segmented fractal pore size of the samples in the study area was counted, and the pore size ranged from 106 nm to 1 µm, indicating that the segmented fractal size was not a fixed value for samples but varied with the sample characteristics. The segmented fractal pore size of samples was classified into three types according to the value in Figure 13: Type I (segmented pore size < 300 nm), Type II (segmented pore size between 300 and 600 nm), and Type III (segmented pore size > 600 nm). Combining the mineral composition, physical parameters, and pore structure parameters of the samples, the segmented fractal pore size has an obvious classification characteristic. This result shows that the segmented fractal pore size increases gradually with the increase in the main skeleton mineral content, the decrease in the clay mineral content, and the increase in the pore radius and porosity. Therefore, the segmented fractal pore size of the sample is not a fixed value but will change with the sample with a different mineral composition and pore structure.

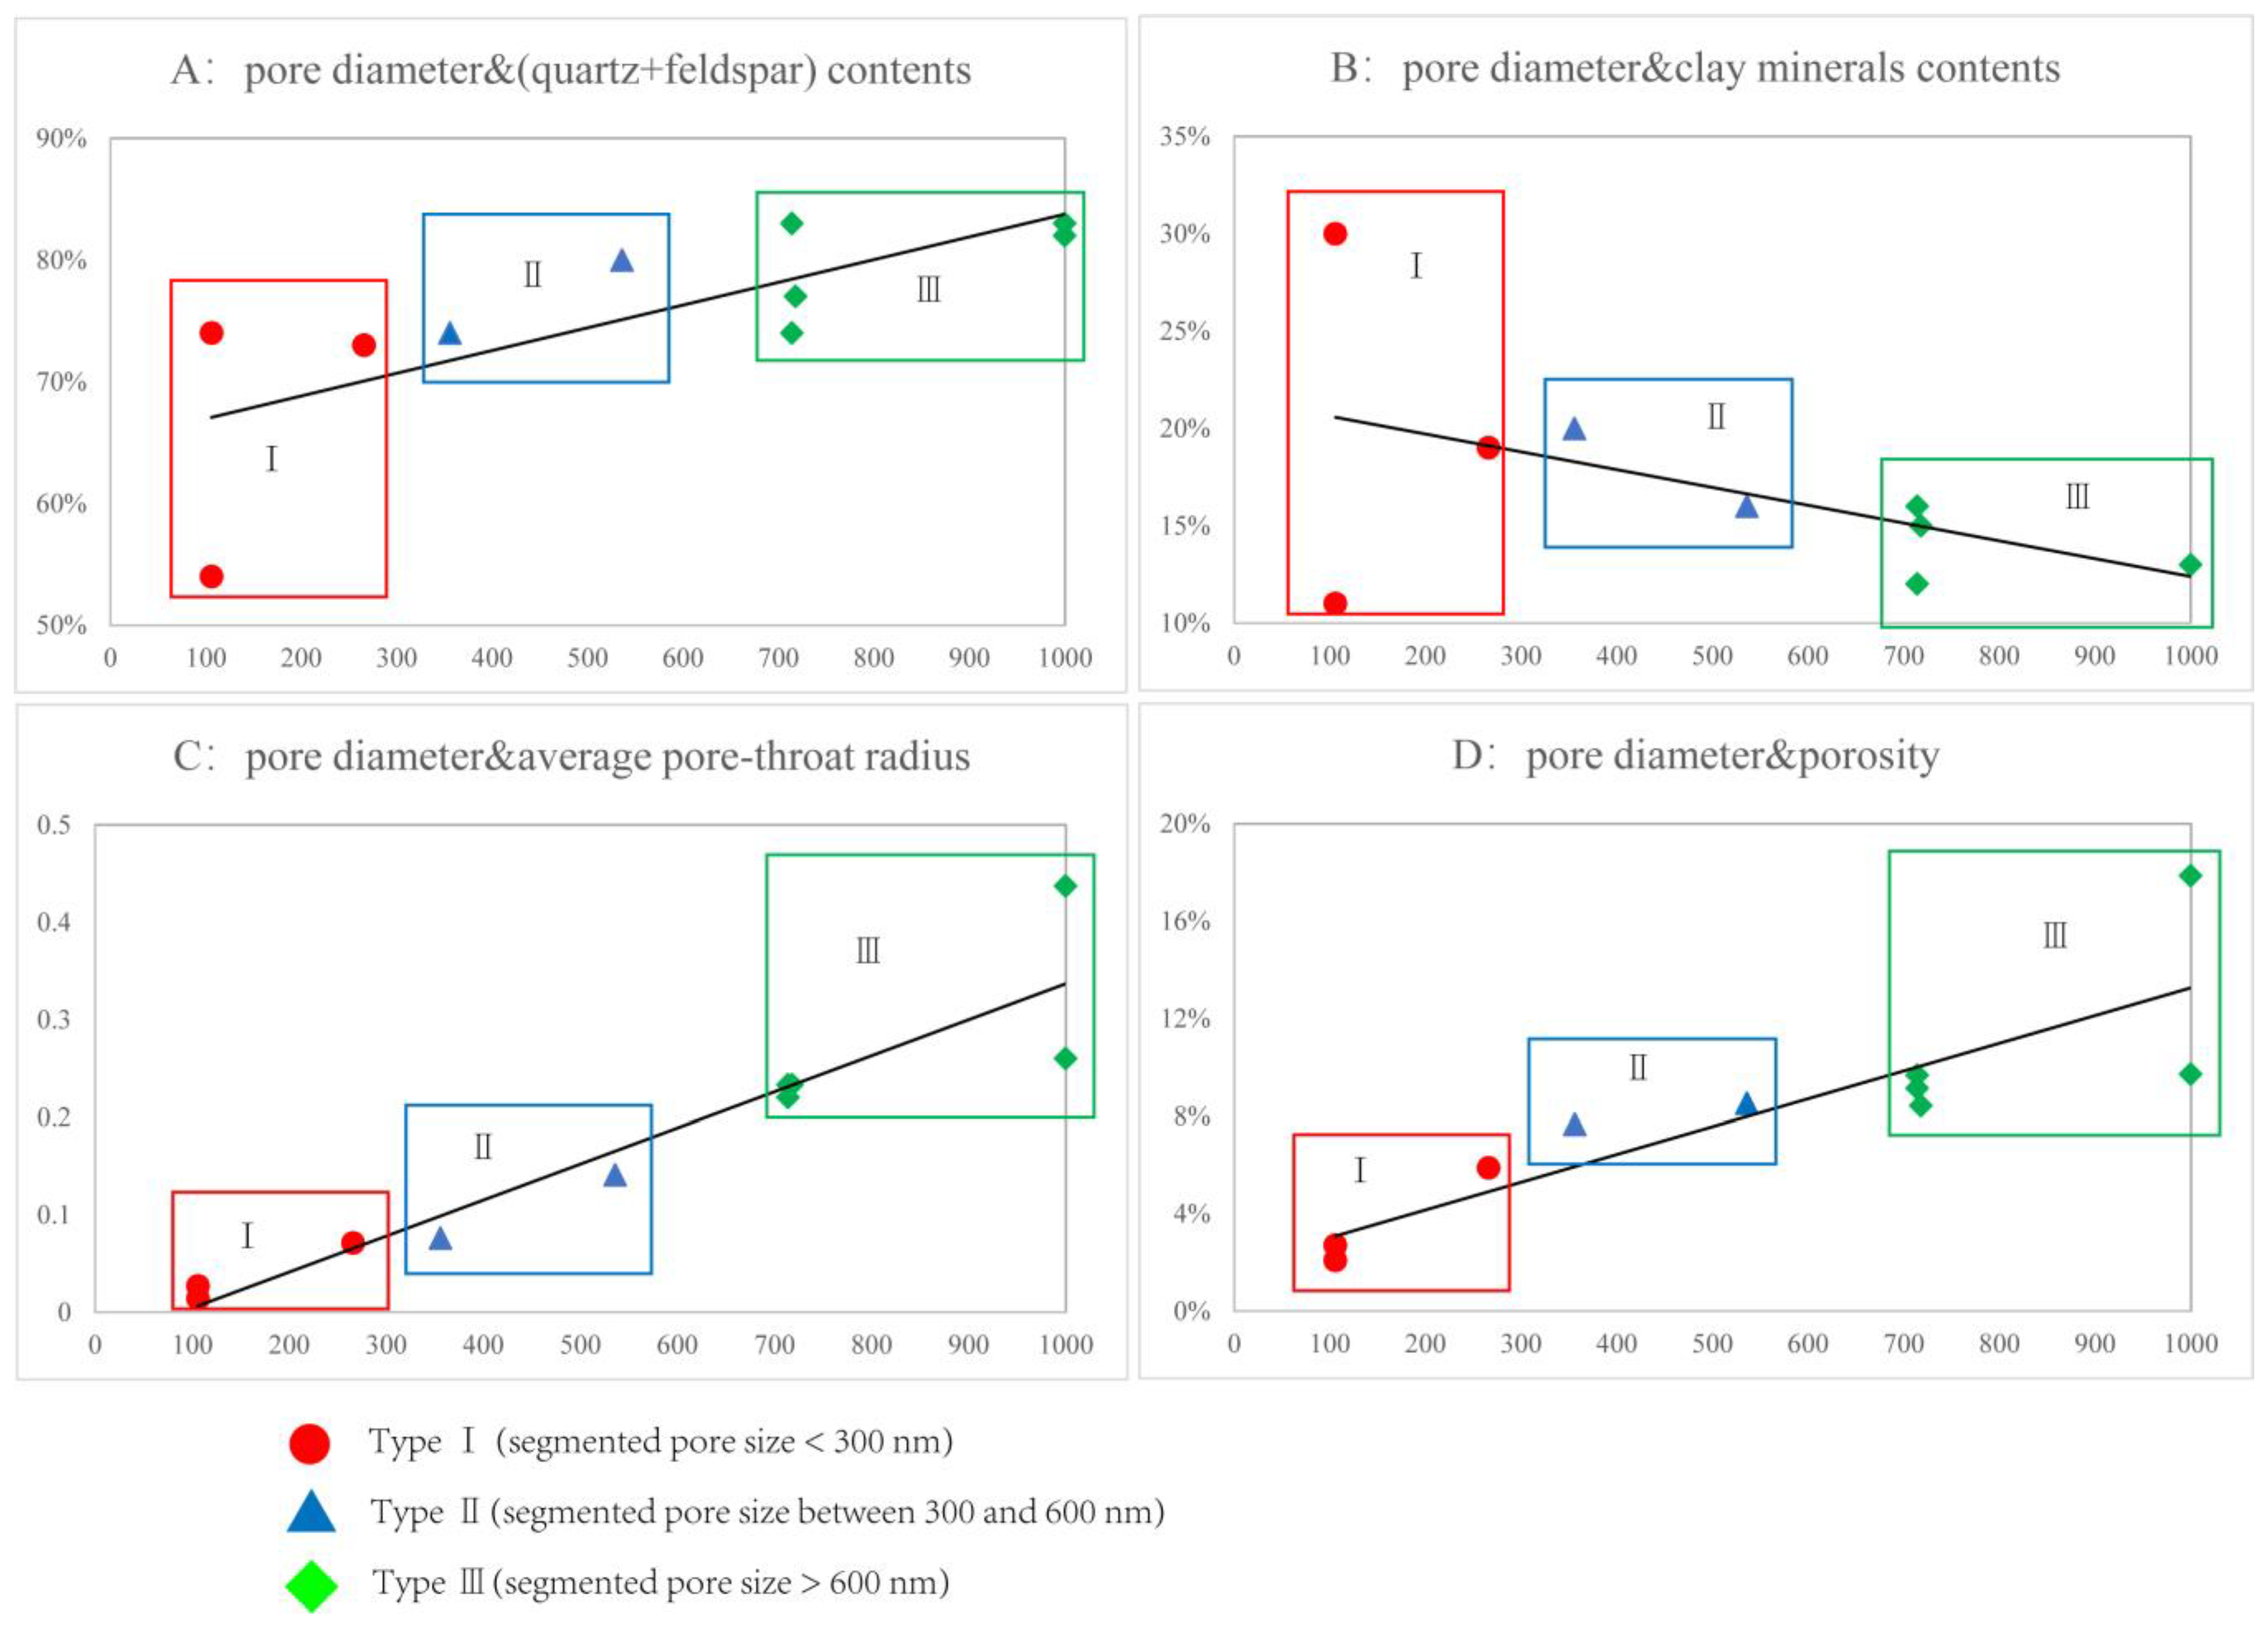
4.2.4. The Values of the Segmented Fractal Pore Size

Is the segmented fractal pore size a fixed value for the same sample? Does it change depending on the calculating model of fractal dimension? Comparing the fractal dimension and pore size obtained from the MIP and MAPs in Table 2, the fractal pore sizes of all of the samples, except for Sample 7-20, correspond well to each other. Regarding Sample 7-20, its physical properties are different from the other samples, but its pore types, sorting, and mineral composition are not significantly different from other samples; so, the reason for the difference in the physical properties of Sample 7-20 is mostly due to the development of microfractures, which in turn leads to inaccurately measured MIP data and affects the calculation of the fractal dimension. We can conclude that the segmental fractal pore size is relatively fixed for the same sample with specific mineral compositions and physical characteristics; it does not change with the calculating model of the fractal dimension.

4.2.5. The Relationship between Fractal Dimensions of Different Dimensions

In the study of the fractal characteristics of rough surfaces, Ge et al. [37] highlighted that the relationship between the fractal dimension of contour curves ( D p ) and the fractal dimension of the rough surface ( D s ) is  D s = D p + 1 . Wang et al. [38] studied the fractal structure of coal samples and highlighted that the 2D fractal dimension ( D 2 ) and 3D fractal dimension ( D 3 ) indicate a relationship of  D 3 = D 2 + 1 . This was obtained by calculating the 3D fractal dimension +1 and comparing it directly to the 2D fractal dimension of MAPs data, and comparing this with the 3D fractal dimension of the MIP and N2-GA data. The 3D fractal dimension +1 compared directly with the 2D fractal dimension was smaller in the small pores. The average value of the 3D fractal dimension +1 compared directly with the 2D fractal dimension of the MAPs data was 2.14, whereas the average value of the 3D fractal dimension calculated by the MIP data was 2.44. In the large pore size range, the 3D fractal dimension with the 2D fractal dimension +1 directly corresponded well with the fractal dimension from the MIP data, where the average of the 3D fractal dimension calculated from the 2D fractal dimension was 2.90, and the average value of the 3D fractal dimension of the large pore obtained from the MIP data was 2.99. Therefore, calculating the 3D fractal dimension +1 compared directly with the 2D fractal dimension was more applicable for the large pores, but it was not applicable for the small pores.
According to the SEM images in Figure 14, the pore types of small pores are mostly residual intergranular and intracrystalline pores of clay minerals. The morphology of residual intergranular and intracrystalline pores is mostly linear. For the linear pores, the 2D observation significantly influences the final pore characterization due to the different cross-section directions, and it is challenging to accurately characterize the true 3D heterogeneity features. Taking the micro-CT results of Sample 7-41 (Figure 14) as an example, the linear pores in the X-Z and Y-Z planes cannot be reflected in the X-Y plane. Therefore, it is challenging to accurately characterize the sample’s pore structure using the 2D fractal of the small pore where the linear pores are mostly developed. It also explains the difference between the 3D fractal dimension of MIP and the 2D fractal dimension +1 of the MAPs.

5. Conclusions

(1) The MIP and N2-GA PSD were combined by a uniform pore size range and were interpolated. According to the comprehensive similarity values, three samples were selected to conduct MAPs experiments, and the data were interpolated using the same method. The results showed that the three experimental methods could not find an applicable pore size for data splicing in data trend, pore volume, or data similarity.
(2) Based on the segmental fractal pore size of the MIP, all of the samples were classified into three types. The segmented fractal pore size of MIP shows that the segmented fractal pore size increases gradually with the increase in the main skeleton mineral content, the decrease in the clay mineral content, and the increase in the pore radius and porosity. However, for the same sample, the fractal pore size is fixed and does not change with a different calculating model.
(3) Comparing the 2D and 3D fractal dimensions, the method for directly calculating the 3D fractal dimension using the 2D fractal dimension +1 is more applicable for the large pores, but is not applicable for the small pores due to the influence of the extensive development in linear pores.

Author Contributions

Data curation, formal analysis, and writing—original draft, C.Z.; methodology, writing—review, editing, and project administration, P.G.; formal analysis, J.Z. and X.D. All authors have read and agreed to the published version of the manuscript.

Funding

This research was funded by the National Key R&D Program of China, grant number 2021YFA0719000, and the National Nature Science Foundation of China, grant number 42141021.

Data Availability Statement

Not applicable.

Conflicts of Interest

The authors declare no conflict of interest.

References

  1. Zou, C.; Zhu, R.; Bai, B.; Yang, Z.; Wu, S.; Su, L.; Dong, D.; Li, X. First discovery of nano-pore throat in oil and gas reservoir in China and its scientific value. Acta Petrol. Sin. 2011, 27, 1857–1864. [Google Scholar]
  2. You, Y.; Niu, X.; Feng, S.; Wang, F.; Wang, C.; Li, W. Study of pore features in Chang7 tight oil reservoir, Yanchang layer, Ordos Basin. J. China Univ. Petrol. 2014, 38, 18–23. [Google Scholar]
  3. Zhu, R.; Wu, S.; Su, L.; Cui, J.; Mao, Z.; Zhang, X. Problems and future works of porous texture characterization of tight reservoirs in China. Acta Petrol. Sin. 2016, 37, 1323–1336. [Google Scholar]
  4. Tian, H.; Zhang, S.; Liu, S.; Zhang, H. Determination of organic-rich shale pore features by mercury injection and gas adsorption methods. Acta Petrol. Sin. 2012, 33, 419–427. [Google Scholar]
  5. Cao, T.; Song, Z.; Liu, G.; Yin, Q.; Luo, H. Characteristics of shale pores, fractal dimension and their controlling factors determined by nitrogen adsorption and mercury injection methods. Petrol. Geol. Recovery Effic. 2016, 23, 1–8. [Google Scholar]
  6. Xiao, D.; Lu, S.; Lu, Z.; Huang, W.; Gu, M. Combining nuclear magnetic resonance and rate-controlled porosimetry to probe the pore-throat structure of tight sandstones. Petrol. Explor. Dev. 2016, 43, 961–970. [Google Scholar] [CrossRef]
  7. Jiang, Z.; Tang, X.; Li, Z.; Huang, H.; Yang, P.; Yang, X.; Li, W.; Hao, J. The whole-aperture pore structure characteristics and its effect on gas content of the Longmaxi Formation shale in the southeastern Sichuan basin. Earth Sci. Front. 2016, 23, 126–134. [Google Scholar]
  8. Zhang, J.; Li, X.; Wei, Q.; Sun, K.; Zhang, G.; Wang, F. Characterization of Full-Sized Pore Structure and Fractal Characteristics of Marine–Continental Transitional Longtan Formation Shale of Sichuan Basin, South China. Energy Fuels 2017, 31, 10490–10504. [Google Scholar] [CrossRef]
  9. Wang, X.; Jiang, Z.; Jiang, S.; Chang, J.; Zhu, L.; Li, X.; Li, J. Full-Scale Pore Structure and Fractal Dimension of the Longmaxi Shale from the Southern Sichuan Basin: Investigations Using FE-SEM, Gas Adsorption and Mercury Intrusion Porosimetry. Minerals 2019, 9, 543. [Google Scholar] [CrossRef]
  10. Jia, F.; Shen, P.; Li, K. Study on the Fractal Characteristics of Sandstone Pore Structure and Its Application. Fault-Block Oil Gas Field 1995, 01, 16–21. [Google Scholar]
  11. Wang, Z.; Jiang, X.; Pan, M.; Shi, Y. Nano-Scale Pore Structure and Its Multi-Fractal Characteristics of Tight Sandstone by N2 Adsorption/Desorption Analyses: A Case Study of Shihezi Formation from the Sulige Gas Filed, Ordos Basin, China. Minerals 2020, 10, 377. [Google Scholar] [CrossRef]
  12. Yao, Y.; Liu, D.; Tang, D.; Tang, S.; Huang, W. Fractal characterization of adsorption-pores of coals from North China: An investigation on CH4 adsorption capacity of coals. Int. J. Coal Geol. 2008, 73, 27–42. [Google Scholar] [CrossRef]
  13. Bu, H.; Ju, Y.; Tan, J.; Wang, G.; Li, X. Fractal characteristics of pores in non-marine shales from the Huainan coalfield, eastern China. J. Nat. Gas Sci. Eng. 2015, 24, 166–177. [Google Scholar] [CrossRef]
  14. Li, Y.; Wang, Z.; Pan, Z.; Niu, X.; Yu, Y.; Meng, S. Pore structure and its fractal dimensions of transitional shale: A cross-section from east margin of the Ordos Basin, China. Fuel 2019, 241, 417–431. [Google Scholar] [CrossRef]
  15. Qiao, P.; Ju, Y.; Cai, J.; Zhao, J.; Zhu, H.; Yu, K.; Qi, Y.; Meng, S.; Li, W.; Sun, Y.; et al. Micro-Nanopore structure and fractal characteristics of tight sandstone gas reservoirs in the eastern Ordos basin, China. J. Nanosci. Nanotechnol. 2021, 21, 234–245. [Google Scholar] [CrossRef]
  16. Lai, J.; Wang, G.; Zheng, Y.; Li, W.; Cai, C. Method for calculating the fractal dimension of the pore structure of low permeability reservoirs: A case study of the Xujiahe formation reservoir in central Sichuan basin. J. Northeast Petrol. Univ. 2013, 17, 1–7. [Google Scholar]
  17. Zhang, Q.; Hou, G.; Pan, W.; Han, J.; Ju, Y.; Li, L.; Ju, W.; Shu, W. Fractal Study on Structure Fracture. J. Basic Sci. Eng. 2011, 19, 853–861. [Google Scholar]
  18. Feng, X.; Zhu, H. Micro-pore Structure and Fractal Characteristics of the Xiashihezi Formation Tight Reservoir in Sulige Area in Ordos Basin. Geol Sci. Technol. Inform. 2019, 38, 147–156. [Google Scholar]
  19. Yan, J.; He, X.; Geng, B.; Li, X.; Guo, H. Models Based on Fractal Theory to Assess Pore Structure of Low Permeability Sand Reservoirs. Well Logging Technol. 2017, 41, 345–352. [Google Scholar]
  20. Peng, J.; Han, H.; Xia, Q.; Li, B. Fractal characterization and genetic mechanism of micro-pore structure in deeply buried tight sandstone reservoir: A case study of Kalpintag Formation in Shuntuoguole area, Tarim Basin. Acta Petrol. Sin. 2018, 39, 775–791. [Google Scholar]
  21. Fu, J.; Liu, X.; Li, S.; Guo, Q.; Zhou, X.; Yang, W. Discovery and resource potential of shale oil of Chang 7 member, Triassic Yancahng Formation, Ordos Basin. China Petrol. Explor. 2021, 26, 1–11. [Google Scholar]
  22. Guo, Y.; Li, W.; Guo, B.; Zhang, Q.; Chen, Q.; Wang, R.; Liu, X.; Ma, Y.; Li, Z.; Zhang, M.; et al. Sedimentary systems and palaeogeography evolution of Ordos Basin. J. Palaeogeograpjy 2019, 21, 293–320. [Google Scholar]
  23. Yang, J. Tectonic Evolution and Oli-Gas Reservoirs Distribution in Ordos Basin; Petroleum Industry Press: Beijing, China, 2002. [Google Scholar]
  24. Yang, H.; Zhang, W. Leading effect of the Seventh Member high-quality source rock of Yanchang Formation in Ordos Basin during the enrichment of low-penetrating oil-gas accumulation: Geology and geochemistry. Geochimica 2005, 34, 147–154. [Google Scholar]
  25. Yuan, X.; Lin, S.; Liu, Q.; Yao, J.; Wang, L.; Guo, H.; Deng, X.; Cheng, D. Lacustrine fine-grained sedimentary features and organic-rich shale distribution pattern: A case study of Chang 7 Member of Triassic Yanchang Formation in Ordos Basin, NW China. Petrol. Exp. Dev. 2015, 42, 34–43. [Google Scholar]
  26. Yang, H.; Liang, X.; Niu, X.; Feng, S.; You, Y. Geological conditions for continental tight oil formation and the main controlling factors for the enrichment: A case of Chang 7 Member, Triassic Yanchang Formation, Ordos Basin, NW China. Petrol. Exp. Dev. 2017, 44, 12–20. [Google Scholar] [CrossRef]
  27. Yang, F.; Ning, Z.; Kong, D.; Liu, H. Pore Structure of Shales form High Pressure Mercury Injection and Nitrogen Adsorption Method. Nat. Gas Geosci. 2013, 24, 450–455. [Google Scholar]
  28. Lu, J.; Wang, X.; He, Y.; Yang, C.; Deng, N. Diagenesis and porosity evolution of Chang7 tight sandstones in Fuxian area, Ordos basin. J. Northeast Petrol. Univ. 2017, 41, 9–20. [Google Scholar]
  29. Brunauer, S.; Deming, L.S.; Deming, W.E.; Teller, E. On a Theory of the van der Waals Adsorption of Gases. J. Am. Chem. Soc. 1940, 62, 1723–1732. [Google Scholar] [CrossRef]
  30. Rouquerol, J.; Avnir, D.; Fairbridge, C.W.; Everett, D.H.; Haynes, J.H.; Pernicone, N.; Ramsay, J.D.F.; Sing, K.S.W.; Unger, K.K. Recommendations for the characterization of porous solids. Pure Appl. Chem. 1994, 66, 1739–1758. [Google Scholar] [CrossRef]
  31. Li, J.; Yin, J.; Zhang, Y.; Lu, S.; Wang, W.; Li, J.; Chen, F.; Meng, Y. A comparison of experimental methods for describing shale pore features—A case study in the Bohai Bay Basin of eastern China. Int. J. Coal Geol. 2015, 152, 39–49. [Google Scholar] [CrossRef]
  32. Li, Y.; Zhang, Y.; Yin, S.; Cong, L.; Yan, M.; Tian, X. Characterization of the pore space in tight sandstone reservoirs from macroscopic and microscopic perspectives: A case study of Gaotaizi reservoir in Qijia area, the Songliao Basin. Oil Gas Geol. 2016, 37, 915–922. [Google Scholar]
  33. Zhang, L.; Lu, S.; Xiao, D.; Li, B. Pore structure characteristics of tight sandstones in the northern Songliao Basin, China. Mar. Petrol. Geol. 2017, 88, 170–180. [Google Scholar] [CrossRef]
  34. Xu, Y.; Lü, C.; Chen, G.; Zhong, J.; Yang, W.; Xue, L. Fractal characteristics of shale pores of Longmaxi Formation in southeast Sichuan Basin. Lithol. Reserv. 2015, 27, 32–39. [Google Scholar]
  35. Zhang, X.; Zhang, T.; Lin, C. Pore structure evaluation of low permeability reservoir based on pore fractal features. Lithol. Reserv. 2013, 25, 40–45. [Google Scholar]
  36. He, C.; Hua, M. Fractal geometry description of reservoir pore structure. Oil Gas Geol. 1998, 19, 17–25. [Google Scholar]
  37. Ge, S. The Fractal Behavior and Fractal Characterization of Rough Surfaces. Tribology 1997, 17, 74–81. [Google Scholar]
  38. Wang, D.; Wei, Q.; Wei, J.; Bai, X.; Yu, C.; Zhang, P. Fractal characteristics of fracture structure and fractal seepage model of coal. J. China Univ. Min. Technol. 2020, 49, 103–109. [Google Scholar]
Figure 1. Geological map and comprehensive histogram of the study area.
Minerals 13 00587 g001
Figure 2. The histogram of the mineral and clay mineral composition.
Minerals 13 00587 g002
Figure 3. Main pore types of reservoirs in the study area: (a) intergranular pore; (b) dissolution pore in feldspar; (c) intracrystalline pore in clay mineral; (d) intergranular pores, partially filled with secondary minerals; and (e) microfracture, filled with organic matter.
Minerals 13 00587 g003
Figure 4. Isotherms of N2-GA experiment.
Minerals 13 00587 g004
Figure 5. Schematic diagram of the MIP experimental curve.
Minerals 13 00587 g005
Figure 6. The processing process of the MAPs image: (a) original grayscale image; (b) after smoothing; (c) threshold segmentation; (d) extracting the medial axis. The above images are provided by the test organization; the samples in the figure are not part of this study and are only used to illustrate the data processing process for MAPs.
Minerals 13 00587 g006
Figure 7. Schematic diagram of combining the different experiments. (a) the pore size curve of MIP experimental data was linearly extended towards small pore; (b) interpolate the pore volume of N2-GA to the new pore size interval; (c) the pore volume data of MIP and N2-GA based on the uniform pore size range.
Minerals 13 00587 g007
Figure 8. PSD of the three methods based on the uniform pore size.
Minerals 13 00587 g008
Figure 9. Plots of ln(L) vs. ln(r) reconstructed from MAPs.
Minerals 13 00587 g009
Figure 10. Plots of lg(Sw) vs. lg(Pc) reconstructed from MIP.
Minerals 13 00587 g010
Figure 11. Plots of ln(V) vs. ln[ln(P0/P)] reconstructed from N2-GA.
Minerals 13 00587 g011
Figure 12. Histogram of MIP and its corresponding segmented fractal graph.
Minerals 13 00587 g012
Figure 13. The correlation between segmented fractal pore size and relevant parameters of MIP.
Minerals 13 00587 g013
Figure 14. Schematic diagram and micro-CT of linear pores.
Minerals 13 00587 g014
Table 1. Similarity values of samples.
Sample
Number
Similarity ①Similarity ②Sample
Number
Similarity ①Similarity ②
4-510.95460.61797-490.77450.3495
5-70.88020.26369-390.85340.5176
6-42D0.92430.41779-550.93920.3414
7-200.00040.569610-540.73540.6532
7-410.93470.420310-920.94000.6653
Table 2. Fractal dimension and segmental fractal pore size of MIP and MAPs.
Sample
Number
MIPMaps
D1Segmented Fractal
Pore Diameter (nm)
D2D1Segmented Fractal
Pore Diameter (nm)
D2
4-512.35 7142.99
5-72.40 5362.99
6-42D2.20 7142.99
7-202.86 10002.98 1.17 3561.92
7-412.47 3562.99 1.20 3561.96
7-492.56 10002.99
9-392.29 2662.99
9-552.57 1062.99 1.06 1061.81
10-542.55 7182.98
10-922.37 1062.99
Average2.46 2.99 1.14 1.90
Disclaimer/Publisher’s Note: The statements, opinions and data contained in all publications are solely those of the individual author(s) and contributor(s) and not of MDPI and/or the editor(s). MDPI and/or the editor(s) disclaim responsibility for any injury to people or property resulting from any ideas, methods, instructions or products referred to in the content.

