Article

Technology Upgrade Assessment for Open-Pit Mines through Mine Plan Optimization and Discrete Event Simulation

1
Department of Systems and Computer Engineering, Universidad Católica del Norte, 0610 Angamos, Antofagasta 127079, Chile
2
Department of Mining and Materials Engineering, Faculty of Engineering, McGill University, 3610 University Street, Montreal, QC H3A 0C5, Canada
3
DRA Americas Inc., 555 René-Lévesque Blvd. West 6th Floor, Montreal, QC H2Z 1B1, Canada
*
Author to whom correspondence should be addressed.
Minerals 2023, 13(5), 642; https://doi.org/10.3390/min13050642
Submission received: 2 April 2023 / Revised: 28 April 2023 / Accepted: 2 May 2023 / Published: 5 May 2023

Abstract

:
Digital technologies are continually gaining traction in the mining and mineral processing industries. Several studies have shown the benefits of their application to help improve various aspects of the mineral value chain. Nevertheless, quantitatively assessing new technologies using a holistic approach is vital to evaluate whether the potential localized benefits ultimately translate to an overall increase in project net present value (NPV). This study develops an integrated system-wide methodology for open-pit mines, supporting the technoeconomic assessment of implementing new technology that impacts strategic and operational timeframes. The first part of the framework relies on a state-of-the-art mine plan optimization algorithm that incorporates geological uncertainty. The resulting outputs are then fed into the discrete event simulation portion of the framework (second part) to maximize plant throughput using alternate modes of operation (blending strategy) and operational stockpiles to deal with unexpected changes in ore feed attributes. Sample calculations loosely based on a gold deposit located in the Maricunga belt, Chile, are presented in the context of evaluating different intelligent ore sorting technology options.

1. Introduction

Over the years, the mining and mineral processing industry has adopted digital technologies through diverse methods and techniques [1]. These technologies have required computational intelligence tools to address rising and challenging demands. For example, the Internet of Things (IoT) has contributed significantly to a range of mining areas, from safety in coal mining operations [2,3] to the monitoring of tailings dams to avoid potential failures [4]. Similarly, machine vision has improved the real-time monitoring and control of flotation processes [5,6,7], as well as ore classification approaches [8,9]. Machine learning (ML) algorithms have been utilized in many applications along the mineral value chain, including resource estimation [10,11,12], lithological classification [13], reduction of back-breaks and flyrock phenomena in blasting operations [14], and in predictive maintenance [15]. This work does not intend to provide a comprehensive list of contributions of these and other technologies. However, Figure 1 summarizes a recent review focused on the implementation of digital technologies across the mineral value chain [1].
The underlying assumption that motivates the relevant described efforts of scholars and practitioners relies on the fact that by improving or optimizing a well-limited problem, the whole value chain will somehow be enhanced [16]. Nevertheless, the general system theory claims that separately optimized subsystems do not guarantee whole-system optimization [17]. This is easily explained by considering a high-level subsystem consisting of only a truck dispatched to and from a mill. Suppose that a company could increase its mills’ grinding rate by applying a particular computational intelligence tool. Suppose further that many efforts were invested in the project, and the outcome was promising; however, after the implementation, the same company noticed that it was not obtaining the expected profit. What was the reason? The mills’ feed. They analyzed the process and realized the dispatched trucks could not adequately feed the mills. In other words, the improvement attained was obscured by another part of the value chain, preventing the true potential from being reached. One might find this example simple or unrealistic, but the authors of this work have often encountered similar situations. A relatively recent study presented a technology map for the modernization of a mine under a holistic view [18]. It covered six mining phases (exploration, project evaluation, mine design and construction, operations, closure, post closure) and incorporated pillars (mineral resources management, production, productivity and asset efficiency, profitability and cost control, supply chain, socio-economic factors, health/environment/safety/legal) that indicated all aspects that impact this industry. This study provided enough perspective into the complexity of the value chain and the many related dimensions to tackle. However, there was a certain lack of quantification owing to its broad scope.
The mineral value chain distinguishes itself from other value-added systems because of the uncertainty inherent to natural geological systems. This is one of the most influential factors in cost overruns and has a significant impact on mine planning [19]. Several recent investigations have utilized discrete event simulation (DES) to analyze system-wide response to unexpected changes in ore characteristics. In [20], the authors combined this method with reinforcement learning to improve truck dispatching policy adherence to the designed operational plan. Other studies have developed digital twin frameworks by integrating predictive modelling, including partial least squares regression [21] and artificial neural networks [22] with a DES framework to improve decision-making processes in the plant. These latter two works interestingly incorporated the concept of multiple operational modes that govern policies for alternating plant configurations and related control strategies to stabilize plant performance against geological uncertainty [23]. However, all of these studies focus only on the medium term.
Another branch of research introduced the concept of the mine complex, defined as a supply chain system that involves many activities (i.e., integrated modular systems and/or subsystems) as the material is transformed [24]. It covers not only the mining sequence (production scheduling) but also how the material flows downstream, such as mineral beneficiation, separation and refinement [25]. Several subsequent studies have energized this approach [26,27,28,29,30,31,32,33]; however, the formulation of the mathematical problem possesses extraneous parameters, along with tuning hyperparameters added due to the solution methods (e.g., metaheuristics). To the best of our knowledge, the impacts of adding the mentioned parameters have not yet been analyzed in detail by any published work.
A quantitatively based holistic approach is fundamental to determining whether promising digital technologies suit medium- and long-term solutions as part of a technoeconomic assessment. The present study aims to provide a methodology that relies on a framework to evaluate the impact of a prospective digital technology in a system comprising both mine planning and metallurgical plant performance under uncertainty. The proposed framework couples a state-of-the-art mine planning algorithm (long term) with a DES model (medium term) and makes use of the alternation of operational modes while avoiding unnecessary parameters. The final outcome is an evaluation of the expected cumulative NPV for the project triggered by the digital technology under consideration.
The remainder of the article begins with an overview of recent advances in mine planning to contextualize the underlying theory used in this research; these include the formulation of stochastic integer programming (SIP), used to determine the necessary constraints for open-pit optimization, and commonly selected metaheuristic algorithms for solving/approximating the defined problem. This work aims to expand on these approaches by coupling a mixed integer linear programming (MILP) formulation with a parallelized implementation of the variable neighborhood descent (VND) metaheuristic. The proposed methodology, here termed mining technology assessment process (MTAP), is then introduced with the necessary parameters and related considerations detailed for each portion of the overall framework. Finally, a case study of a company with a mine site in a gold-rich porphyry deposit located in the Maricunga belt, Chile, is presented, where the proposed methodology is applied to assess the incorporation of intelligent ore-sorting technology into their value chain.

2. Advances in Stochastic Open-Pit Mine Planning

A good understanding of what constitutes a mineral deposit is critical to determine the feasibility of a mining project. However, since exploration campaigns are expensive [34], geostatisticians have developed techniques to deal with the lack of information between two sample points in order to create a model(s) of the orebody. Resource estimation, which has been the most common approach employed in practice (e.g., kriging), seeks to provide the best linear unbiased estimate of in situ contained metal(s). However, the main drawback of this approach is its inability to reproduce the variability of the deposit grades, which produces a smoothing effect and, therefore, unrealistic expectations [19]. In response, geostatisticians have also proposed to work with a set of equiprobable scenarios generated by algorithms such as sequential Gaussian simulation or the turning bands method [35]. The stochastic approach then focuses on not just one potential discrete outcome, but this generated set of equiprobable scenarios, and thus create risk profiles that enable quantification of confidence within the decision-making processes.
Under the stochastic approach, some scholars have classified the methods into robust-and-risk-averse and neutral-risk; however, no detailed studies show the advantages or disadvantages of one over the other [36]. Regardless, the neutral-risk approach has been more extensively developed, initiated by the work proposed by [37] and the presentation of the first mine planning technique [38]. This technique is based on the formulation of stochastic integer programming (SIP) to maximize the cumulative net present value (NPV), whose objective function follows the general form in Equation (1) [33].
z = max 1 n S t = 1 n T s = 1 n S i C a A p a i t v a i t s 1 n S t = 1 n T s = 1 n S i C a A c a i t + u a i t s + c a i t l a i t s t = 1 n T k K p k t w k t
In this equation, nT represents the number of periods, nS the number of scenarios, i C the components of the mining complex (e.g., mines, stockpiles, plants), and a A the properties of the mined mineral (e.g., metal, grade, tonnage). This neutral-risk method aims to obtain a single mining sequence; as such, the first part of the formulation considers the value of property a at component i in period t under scenario s (vaits), and pait is the related time-discounted revenue under the trio property a/component i/period t. Due to the number of scenarios, it is almost certain that the same set of blocks violates upper or lower production requirements (e.g., component i/property a) in some cases. As a result, the second part of the objective function introduces unit costs ( c a i t + , c a i t ) and upward and downward deviations for not reaching (laits) or exceeding (uaits) the described requirements in a period t under scenario s. This formulation seeks to minimize or avoid any violations for the best-case scenario. Lastly, the third part of the function is related to capital expenditure options (k K): in other words, costs associated with investments in the mining project. Equation (1) has been the result of several efforts over the years [26,27,28,29,30,31,32,33]. Further details are left to the reader in [33].
It is challenging to resolve real/realistic problems from a computational efficiency perspective due to the number of blocks involved (e.g., thousands or millions); therefore, rather than using exact methods such as the classic branch-and-cut approaches (for mixed linear integer programs), the mentioned studies have utilized metaheuristics that provide efficient running times but do not guarantee an optimum. Still, metaheuristics are preferable because the optimization uncertainty added to this particular problem is relatively less than the inherent geological uncertainty. They require an initial solution (mining plan) that is subsequently perturbed to choose prospective options based on whether it increases the cumulative NPV represented. When the best option is determined, it replaces the previous solution with the selected one, and a new iteration is performed until no prospective solutions are found. The literature shows a considerable amount of these metaheuristics in the neutral-risk approach, such as tabu search [39], particle swarm optimization [40], and simulated annealing, the latter being the most commonly employed [26,27,28,29,30,31,32,33].
Although the merit of Equation (1) is unquestionable, it presents opportunities for improvement by avoiding the parameters included in the second set of nested sums. The unit costs found in those sums do not offer an obvious link to the actual (real) operation parameters, so they usually need to be adjusted by repeatedly trying different values (low to high) until the desired effect is reached. In addition, they rely on a geological risk discount factor to defer the risk of not meeting production targets to later periods [33], which is also challenging to estimate (it is common practice to start with the same range as the economic discount rate, but they might need posterior adjustments). Furthermore, the use of metaheuristics involves tuning hyperparameters that significantly influence the control of the optimization process. Unfortunately, the effects of adjusting parameters with no natural link to the operation and hyperparameters of the metaheuristics are manifested through additional time to find a solution due to the repetition of the experiments (not discussed in depth by any work). Moreover, this will inevitably add another source of uncertainty when comparing models: one might set unintentionally favorable values for a model and unintentionally unfavorable values for others [41].
Avoiding additional parameters favors introducing further details of each component of the mineral value chain. Indeed, [23,42,43] laid the foundation to link the metallurgical plant within stochastic mine planning through the concept of alternate operational modes. These modes represent processing configurations for the plant by which it receives the determined capacity to react to geological uncertainty while not violating any constraints (purpose of the second sums set of Equation (1)). This approach has led the efforts of several investigations in the medium-term using the DES method [21,22,44,45,46] and more recently, the longer term [41]. This latter study depicts the tactical alternation of modes over periods by embedding a linear programming formulation into a parallelized implementation of the variable neighborhood descent (VND) metaheuristic [47]. VND was selected for this research because, unlike other metaheuristics, it does not possess extraneous parameters and works under stochastic contexts. Another advantage of VND is that it relies on a finite number of comparisons (based on the number of blocks), which offer an opportunity to reduce time by leveraging all the available computational resources and, thus, perform those tasks in parallel (parallelization).

3. Methodology

Figure 2 presents a proposed mining technology assessment process (MTAP) to quantitatively assess the impact of implementing a digital technology or any other technology in the mining industry. This methodology comprises the following six steps.

3.1. Determining Technology

This first step aims to determine what technology will be assessed. As its name suggests, the trigger can be a new technological development or the recent update of a technology already implemented at a mine site. The mineral value chain must be reviewed at a high level to evaluate what stage(s) the technology under question will influence it by improving performance and/or reducing cost.

3.2. Engineering of Operational Modes

After a technology is selected and the affected stages of the value chain are determined, it is critical to understand how this adoption could affect the plant’s operational modes or require the creation of new ones. For example, a new mill would increase the number of tons processed per day; or a new flotation technique would improve the recovery of a particular metal, etc. It is most likely that different laboratory tests would help guide technical decisions at this stage and translate them into parameter sets that define/constrain the model.

3.3. Long-Term Validation (Mine Planning)

Once the operational modes are specified, they are tested by a quantitative framework implemented by a long-term state-of-the-art mine planning algorithm that deals with a range of equiprobable scenarios to manage risk (it will be described in Section 3.7.1). The primary outcomes of this stage include the cumulative NPV for the project, an initial mine plan, and a list of corresponding ore blocks. If the results are not promising (i.e., negative or low NPV), the parameters from the previous stage are reviewed, and a new scenario can be attempted. The process is repeated as many times as wanted/needed.

3.4. Parameter Adjustments

When a promising result is reached, the parameters are translated to be used in the DES portion of the model that simulates plant performance (e.g., ore blocks, processing rates, maximum stockpile capacity, etc.). These parameters must be in accordance with those used in the long-term validation stage.

3.5. Medium-Term Validation (Metallurgical Plant)

The objective of the DES is to maximize the throughput by using operational stockpiles and blending strategies to increase the cumulative NPV (see Section 3.7.2); in this sense, we say “operational stockpile”, meaning that these ore stockpiles contain several days or weeks of plant feed that are continually drawn and replenished, as opposed to strategic stockpiles that may contain materials that are unprocessed for many months or years. Repeated simulations are carried out to assess system-wide plant performance in response to geological uncertainty from the determined mine plan(s) (Monte Carlo simulations). If the simulated results do not meet plant expectations, it implies the need to reconsider the translation of the parameters or even going back to “engineering operational modes.” The cyclic (feedback) nature of system/operational policy design is commonly needed for industrial engineering systems, especially complex mining systems.

3.6. Final Analysis

In this last stage, the outcomes are put together for the final decision at the strategic level. Domain experts review the proposed solution and policies for the last time, which are then sent to the decision-makers, thereby ending the loop.

3.7. Framework

As previously mentioned, the MTAP methodology requires a quantitative framework, which is explained hereunder.

3.7.1. Algorithm

The long-term algorithm aims to determine a mine plan x with the highest expected cumulative NPV considering a range of equiprobable geological scenarios and mining and processing parameters (Figure 3). To reach this objective, the following function f(x) is maximized:
max [ f ( x ) ] = t = 1 n T b B t c b t + 1 n S s = 1 n S t = 1 n T f s t B t
where:
: set of all blocks within the scope of the simulation.
cbt: expected discounted cost of mining block b in period t.
nS: number of scenarios.
nT: number of periods.
fst(t): Short-term processing decision.
Figure 3. The framework and its internal relations between the long-term algorithm and DES.
Minerals 13 00642 g003
This function has associated constraints ensuring that any extracted block must have its predecessors previously excavated (slope constraint) and does not exceed a maximum mine capacity for a specific period (capacity constraint). Equation (2) was implemented through a parallelized VND metaheuristic that allows an empty initial solution.
The second part of the algorithm is the short-term processing decision. It seeks to determine which of the blocks assigned by the mine plan to a specific period are profitable to process. To do it so, this decision receives a particular scenario and selects the best operational mode(s) under which each block will be processed. Equation (3) shows the formulation.
f s t B t = max b B t o O v b s o m b m b s o
where:
𝒪: set of available operational modes.
vbso: discounted recoverable value of block b in scenario s when undergoing processing mode o.
mbso: mass of block b processed in scenario s under operational mode o.
This equation has imposed constraints, such as the mass of a block processed by the different operational modes, which cannot exceed the total mass of the same block. Additionally, there is a maximum processing time available during the year. Finally, the operational modes require a certain proportion of two or more rock types; this last constraint safeguards these proportions. This part of the algorithm presents a difference from the one in [41] because it can receive the efficiency of the ore sorting if implemented. This function was developed using the simplex method through the Dantzig–Wolfe decomposition to reduce the number of calculations and take advantage of the delay column generation to increase efficiency [48]. In addition, once a solution is reached, the subsequent attempts do not re-calculate considering all the blocks but instead re-optimize using the previous solution as a starting point, including only the blocks added into or removed from the period. After a mine plan is generated, a second set of equiprobable scenarios is used to determine a risk profile along with the ore to be sent to the plant for each scenario (Figure 3).
As a reminder, this formulation avoids the extra parameters introduced in Equation (1). However, one of its limitations is that it does not include strategic stockpiling (only short-term operational stockpiles), which is fixed by the other portion of the framework. The algorithm was implemented in C++. More detailed descriptions of the mine planning algorithm are described in [41].

3.7.2. Discrete Event Simulations (DES)

DES frameworks model the interactions of key process variables and their environments with respect to a sequence of discrete events in time (e.g., operational policy threshold crossings). DES is a dynamic form of Monte Carlo simulation, providing a flexible framework within which to simulate system-wide response and develop robust decision-making processes against geological uncertainty. Due to the incorporation of effective alternate operational modes and related control strategies (such as stockpiling), the system can handle the variability in upcoming feeds and deviations from the expected ore attributes. The trade-offs between available operational policies can be evaluated, as well as the thresholds that prompt the timing of their execution [44,49]. The simulation of extended operating periods allows for the identification of potential deficiencies or bottlenecks in coordinating unit processes within the target system. DES models are thus proper risk assessment and decision-making tools in any mining system [45].
The framework designed for the present study receives the ore blocks determined by the long-term planning algorithm (after passing through the ore sorter if implemented) along with the parameters previously defined, such as the operational modes, metallurgical recovery, metal price, maximum processing capacity, and associated cost. Furthermore, additional control parameters such as production campaigns and shutdown periods, stockpile levels, and critical ore levels are considered (Figure 3). It also includes some ways to deal with other uncertainties, such as deviations in expected ore feed tonnage and the activation of contingency modes to avoid potential stockout events. However, perhaps the most significant addition is the capacity to represent operational stockpiles, as they are not part of the long-term algorithm. The DES model aims to maximize the average daily throughput of the ore for processing, which has a relevant impact on the final cumulative project NPV. The ultimate outcome is an updated risk profile of cumulative NPV.
The DES framework was implemented using the software Rockwell Arena®, Version 16.2 Student Edition, complemented by coding using Visual Basic for Applications (VBA®), Version 7.1.

4. Sample Calculations

The following section aims to apply the methodology to a realistic case study by assessing the incorporation of intelligent ore-sorting technology into a gold company’s value chain using a holistic approach.

4.1. Case Study

4.1.1. Gold Deposit

Economic concentrations of gold in the Earth’s crust have been episodically driven by a combination of sedimentary, magmatic and hydrothermal processes acting through geologic time [50]. In terms of overall endowment, just three geological settings account for close to 90% of all known gold deposits: (i) syn-orogenic vein-type; (ii) porphyry-epithermal systems, and; (iii) conglomerate-hosted deposits [50]. This study focuses on gold-rich porphyry deposits, which are formed in volcanic-plutonic arcs in island and continental settings. Descriptions and related genetic models of these types of examples have linked the occurrence of copper-deficient porphyry gold deposits to Phanerozoic volcano plutonic arcs [51,52]. As such, prime examples of these systems are evident in Circum-Pacific and alpine Himalayan regions [53].
Gold-rich porphyry deposits are commonly emplaced at shallow (1–2 km) crustal levels [54] and are thus likely to be closely associated with volcanic rocks. Porphyry deposits with average gold contents of ≥0.4 g/t may be arbitrarily defined as gold-rich [51]. Average gold contents are generally <1 g/t, although richer deposits do occur, e.g., the Grasberg deposit, Indonesia, contains several hundred million tonnes (Mt) averaging >1.5 g/t Au. The size of these deposits can vary widely, ranging from less than 50 Mt to 4500 Mt.
The gold-rich porphyry deposits in Chile are closely comparable to those elsewhere, especially those in the Philippine Island arcs [55]. The Maricunga belt is a region of numerous gold-silver copper prospects and deposits in the high Andes of northern Chile [55]. The principal deposits are mainly of porphyry-epithermal type, with one major pluton-related vein and one distal contact metasomatic deposit [56]. The Maricunga belt is a linear metallogenic unit defined by several trends of gold and/or silver mineralization within the Andean Cordillera of northern Chile [55]. The porphyry deposits, including those at Marte, Lobo, Refugio, La Pepa, and Volcán, typically contain gold as the only economically extractable metal, whereas those at Caspiche and Cerro Casale contain gold plus by-product copper potential [57].
The case study was developed loosely based on the Au-Cu porphyry deposits of the Maricunga region in order to generate a conceptual geological model. The geological units based on this basic Au-rich porphyry model include (1) diorite porphyry that hosts mineralized veinlets, and (2) silicified intrusive breccias. Based on geological characteristics and Bond work indices (BWi), it was determined that dioritic rock equals 16 kWh/t and silicified volcanic breccia equals 21 kWh/t, with a ratio of 1:1 of blocks of each unit following the generated geology. Figure 4 presents a schematic geological section.

4.1.2. Ore Sorting

Ore sorting is not a new technology; however, it has gained interest since the 2000s to be applied to the base and precious metals such as copper and gold [45]. Particle sorting is the most common approach implemented in mine sites, having a range of sensors available in the market to determine what material must be accepted or rejected [58]. Sensing techniques are divided between active and passive, and in turn, they are divided into body and surface. Active means that the sensor excites a sample and then analyzes the response, whereas the passive approach is limited to observing it. Body refers to seeking an internal analysis, and surface only from the outside [58]. Table 1 shows a categorization of various sensing techniques. Ore sorters include advanced process control, automation, real-time data, and simulation (Figure 1), which in practice is evolving to the use of computational intelligence such as principal component analysis and artificial neural networks [59]—intelligent ore sorting.

4.2. Application of MTAP

4.2.1. Determining Technology

A company in Chile wanted to evaluate the potential benefits of implementing intelligent ore-sorting technology immediately following the primary crushers. After analyzing the project value chain, it was determined that increasing the grade of the ore sent to the plant should positively impact the cumulative NPV of the project. To assess the idea, they contacted three providers who offered different sensors with their respective rejection percentages. All of these sensors make decisions by analyzing the material surfaces, but two of them are classified as active (contrast Table 1 and Table 2). It is worth mentioning that digital technologies somehow enhanced all of the prospective sensors. Still, the optical sensor was particularly improved with an artificial neural network that increased the efficiency of this sensor by 5% compared to other solutions found on the market. Experiments were run in a laboratory to determine the solution’s efficiency based on the rock extracted from the mine. The results are summarized in Table 2.
The company leaned toward the OPT option because it achieved by far the highest rejection rate, in addition to requiring less capital investment; the counterargument would be that the higher rejection rate might correspond to lower metal recovery, hence a potential for either the XRF or NIR technologies to be superior choices. In terms of operational modes, due to each option having similar cost, the highest one was considered and summed up in the mining costs.

4.2.2. Engineering of Operational Modes

After identifying the options, the company selected initial values for their operations, such as mining and processing capacities per year, metallurgical recovery, and operational modes, among others. These parameters came from experiments, prototypes, and advice from domain experts. The complete list is provided in Table 3.

4.2.3. Long-Term Validation

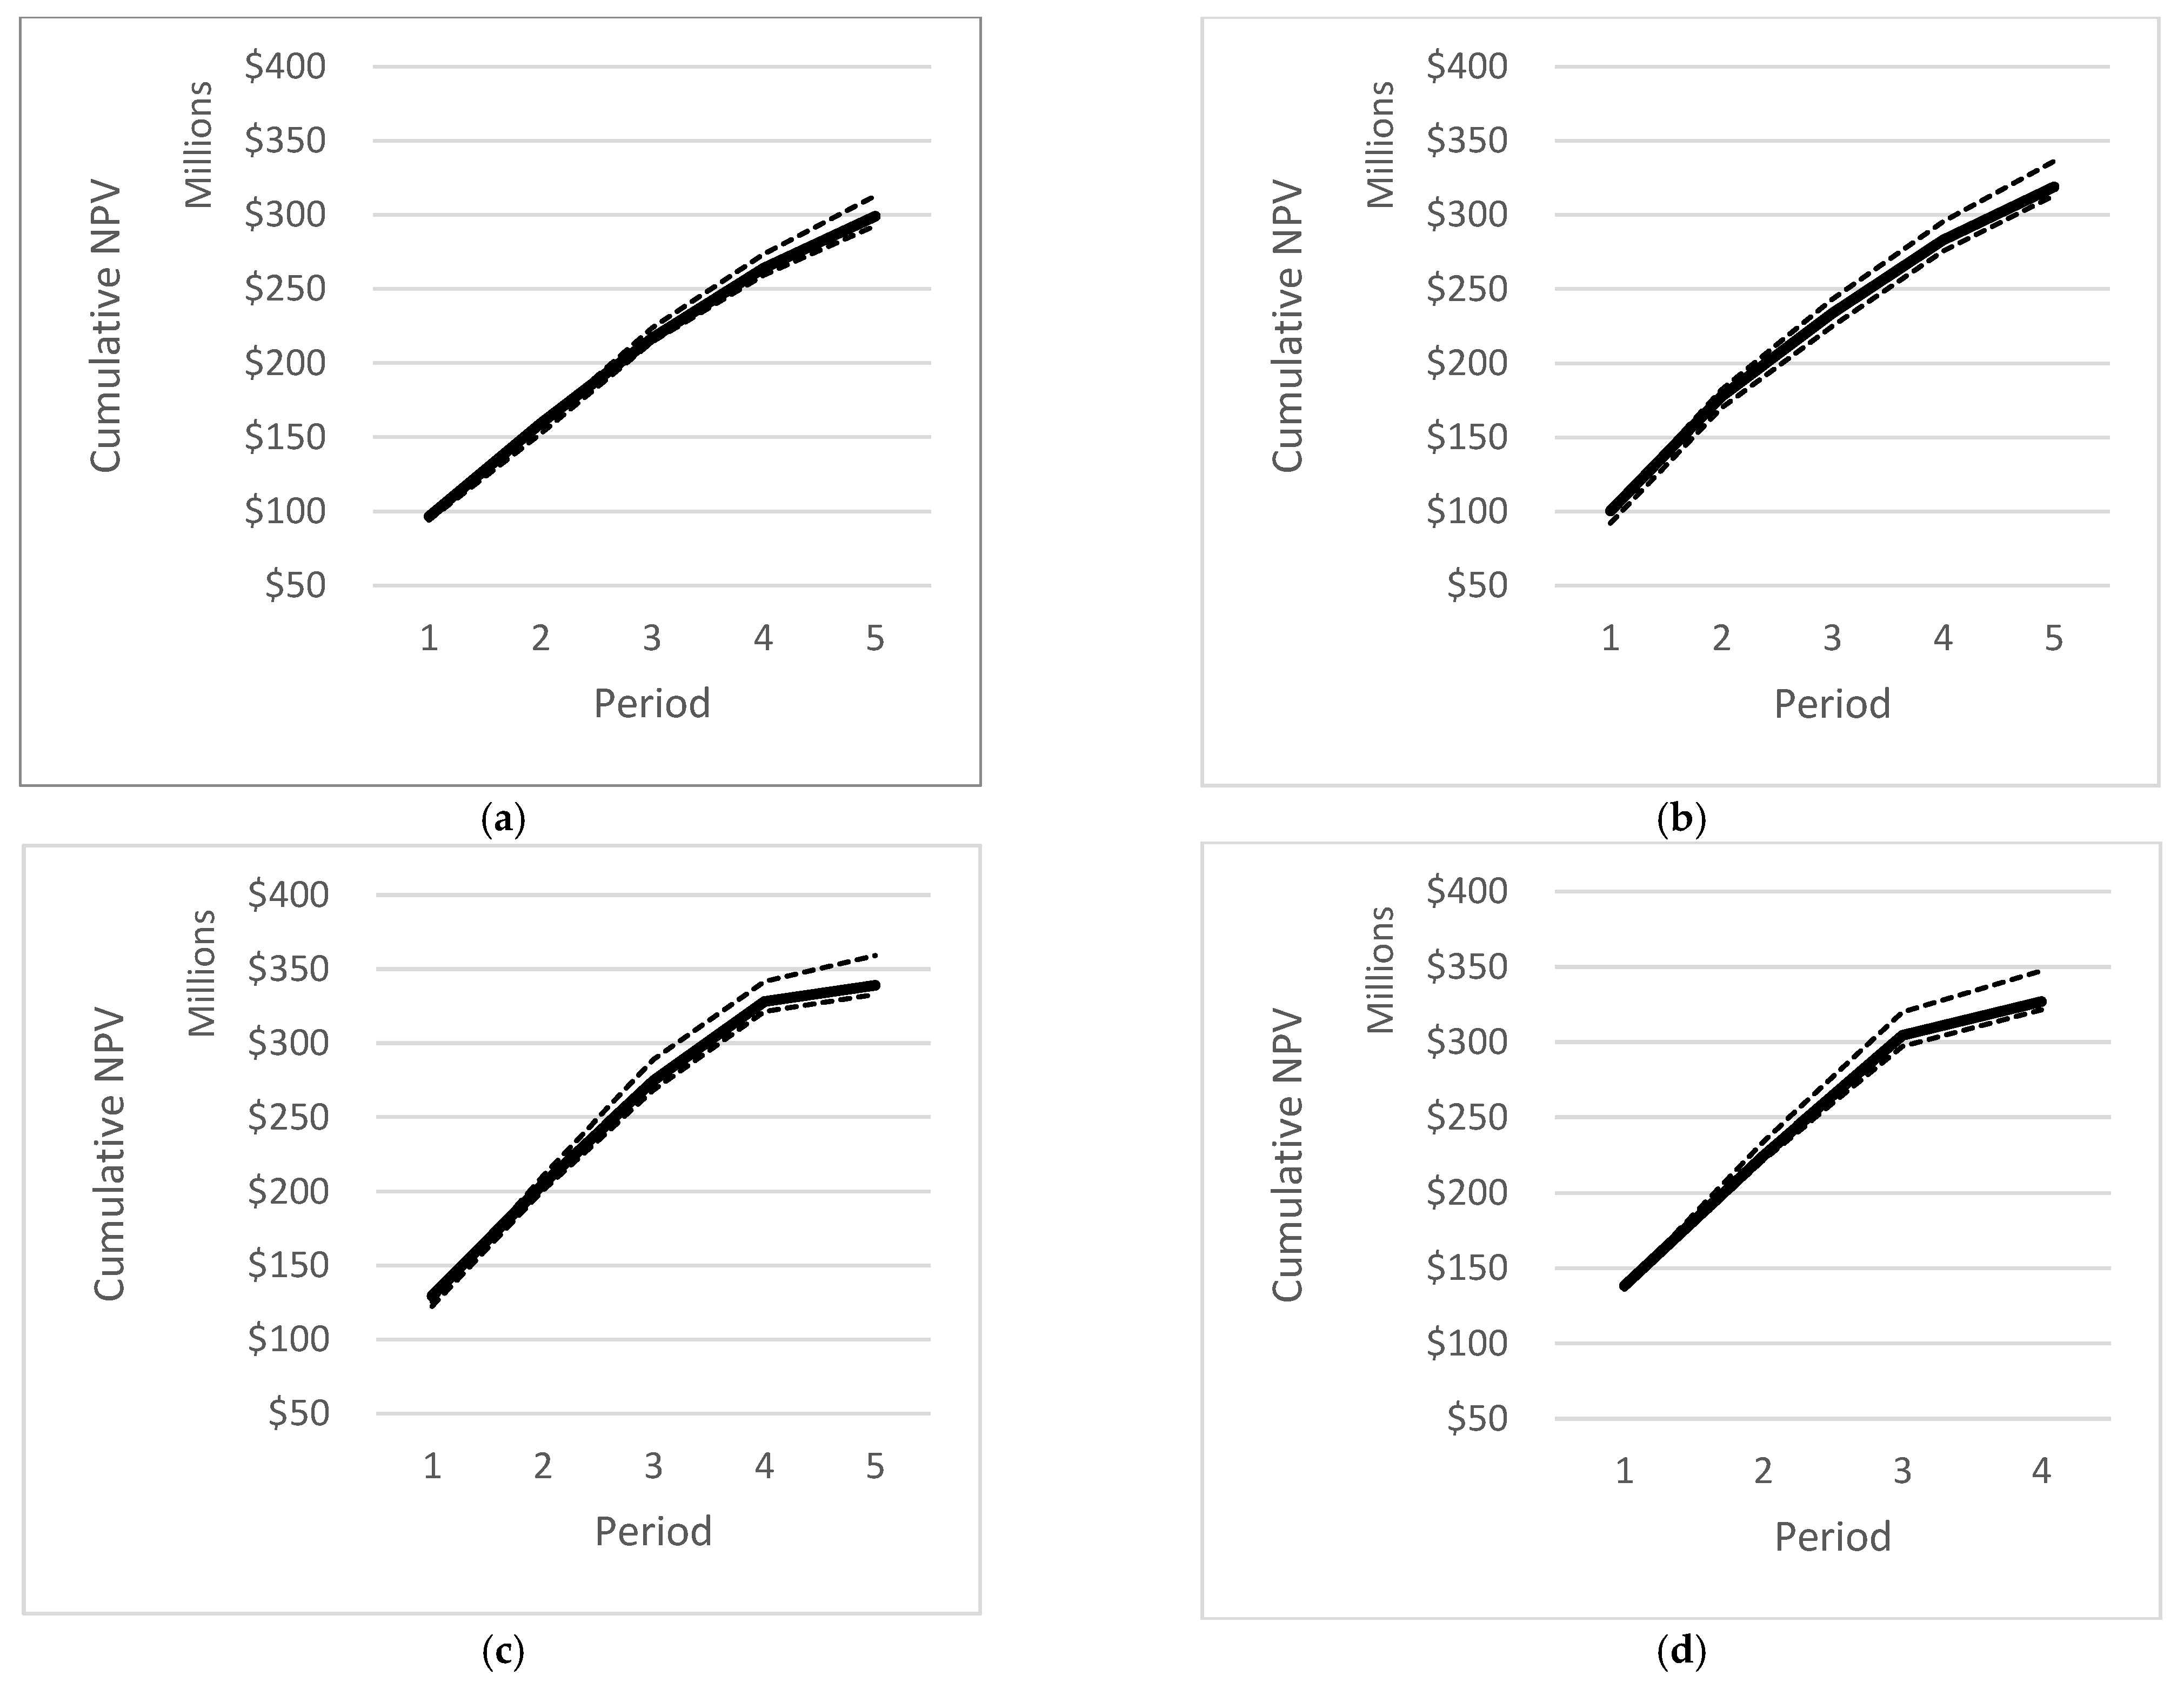
Using the previously indicated parameters across 20 equiprobable geological scenarios, the algorithm ran on a server with an Intel Xeon® CPU E5-2650 processor using parallelization. Ten of the scenarios were used to generate an optimized mine plan, and the other ten for obtaining risk profiles of the cumulative NPV to be sent to the DES portion of the framework. Based on Table 2, the three options were configured and subjected to the algorithm, plus the “as-is” option of not implementing the ore sorting technology in the mine site. Figure 5 presents the cumulative NPV curves associated with each option. Even though the results were not conclusive as to which ore sorting approach is better, it was observed that any of the three options would have a significantly positive impact on the NPV, as indicated by the higher curves in Figure 5b–d (options in Table 1) with respect to 5a (no ore sorting). Among the options evaluated, the NIR option appeared to be the best based on a maximum NPV of USD 338 M (Figure 5c)
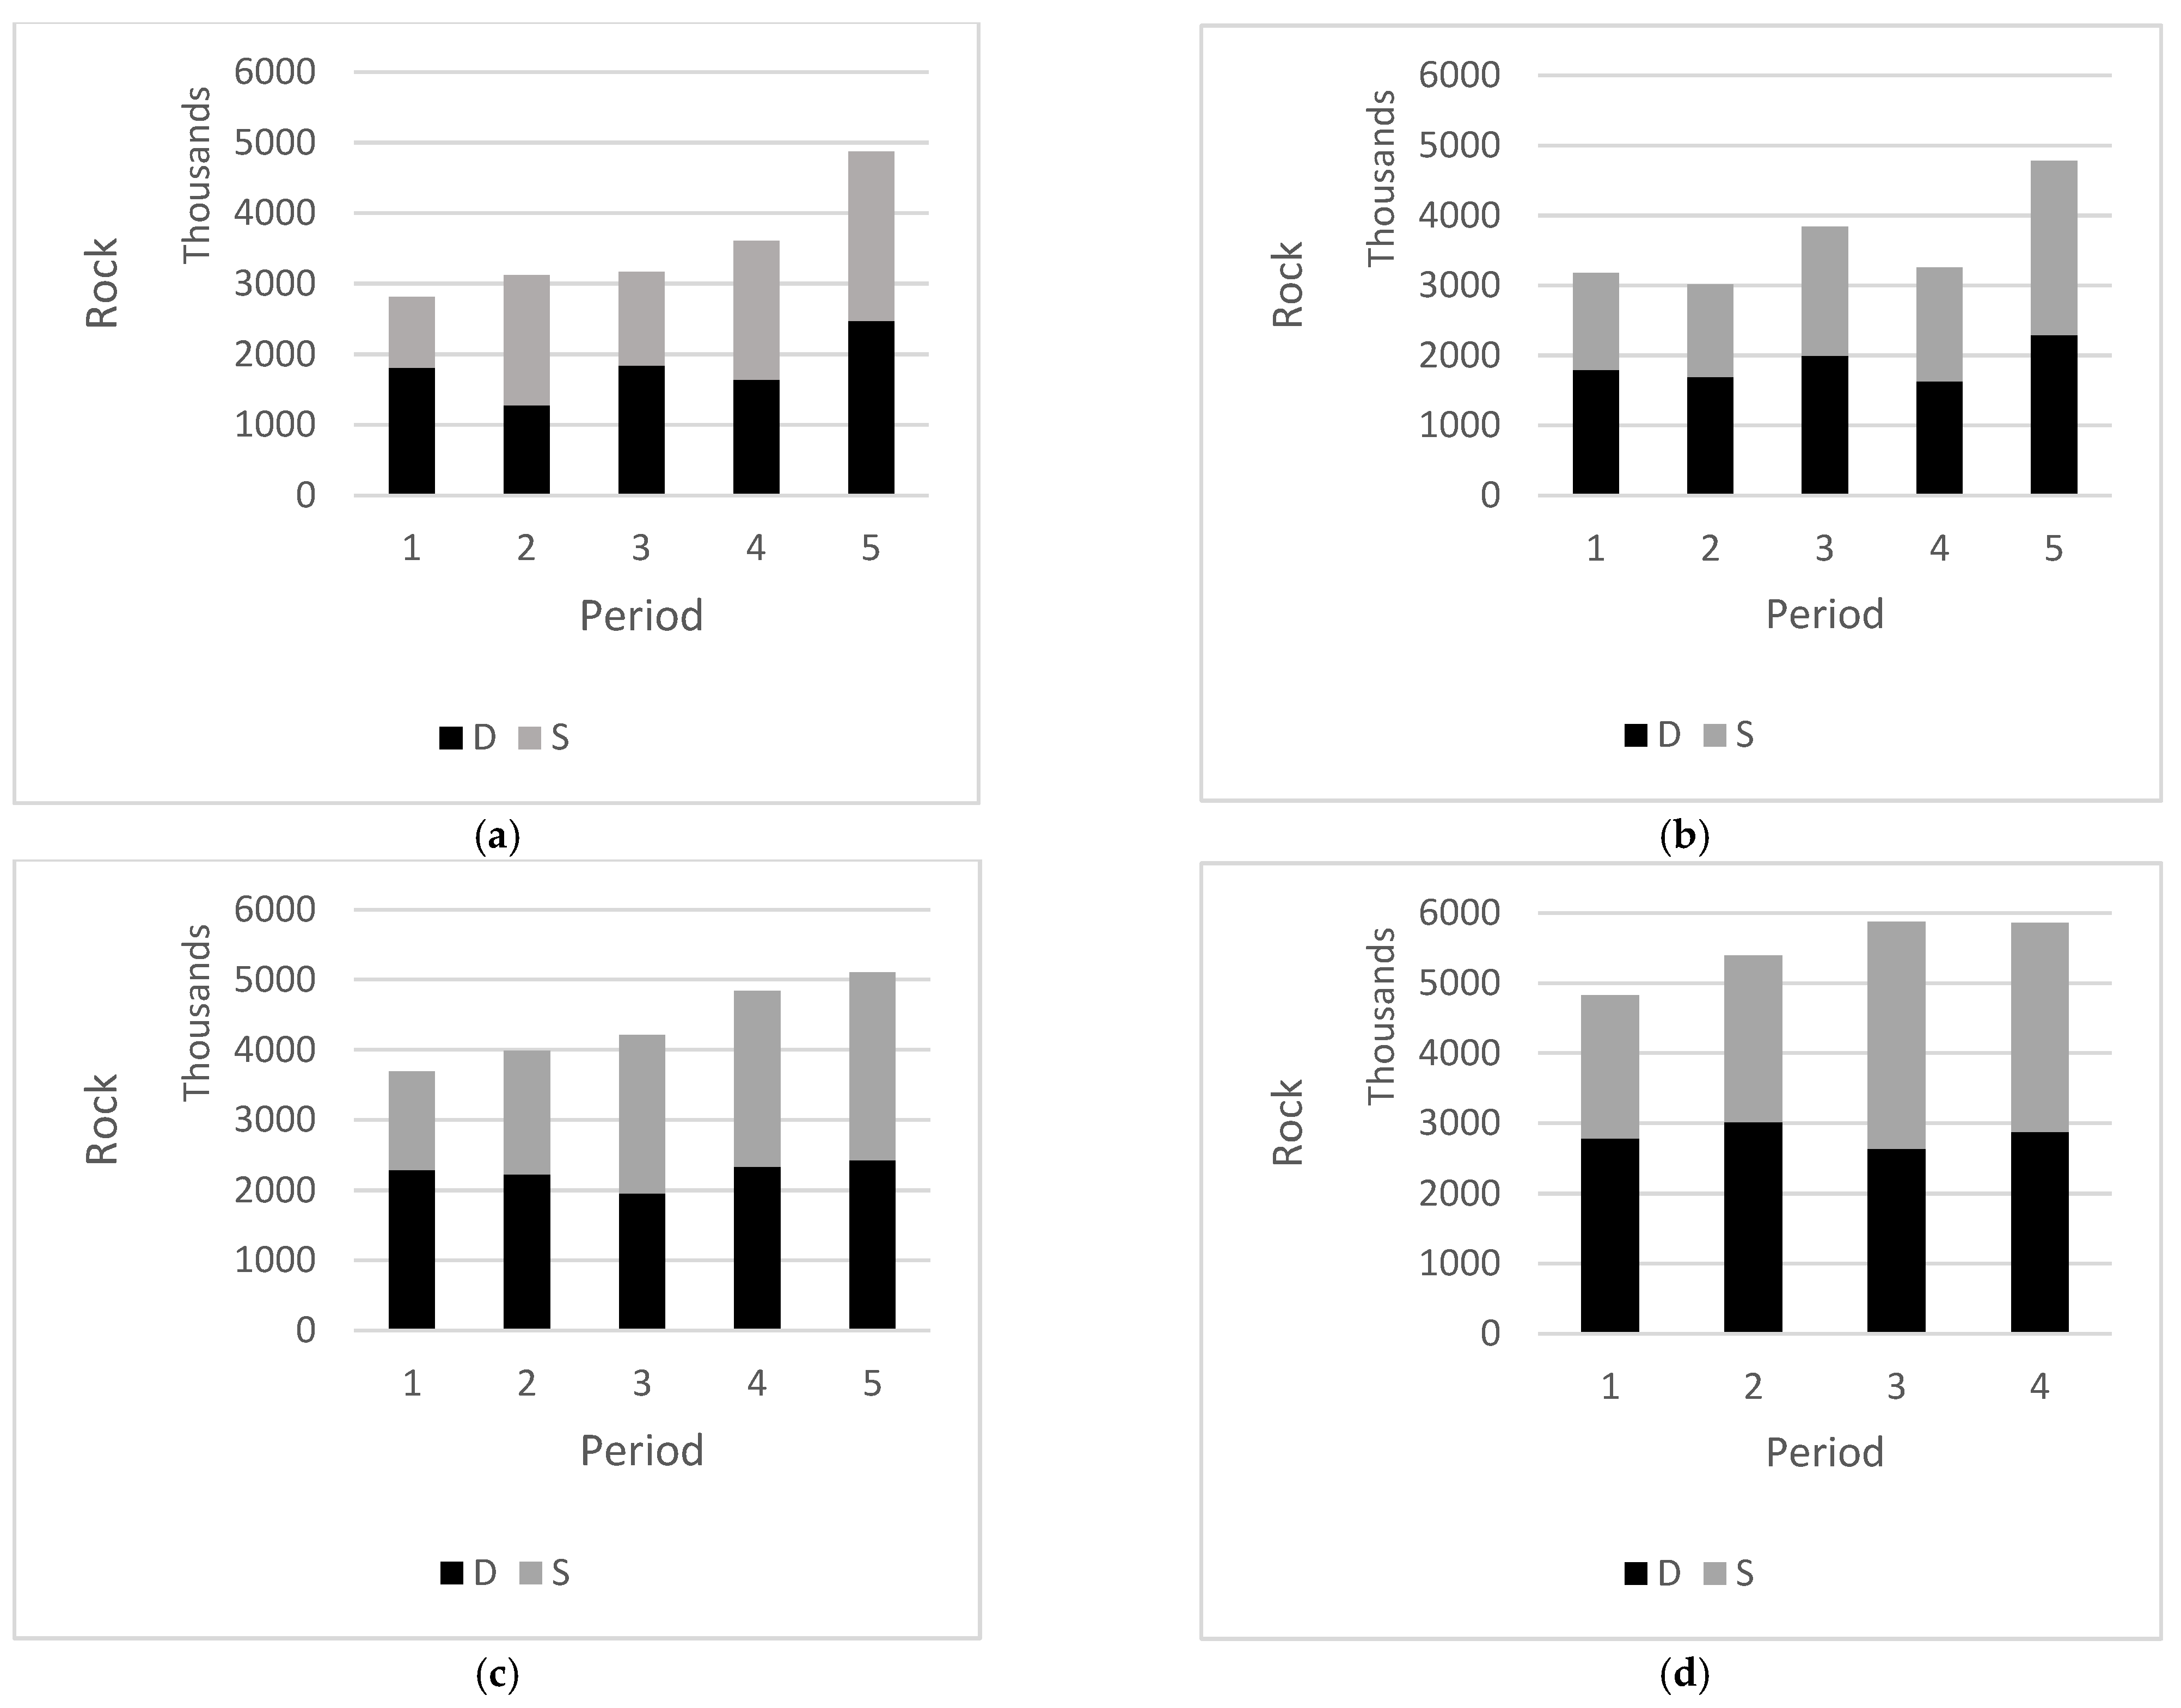
It is apparent in Figure 6d that the OPT option reached almost 6 M tonnes in the last two periods due to it having to provide more feed (50% rejection). This caused the reduction of periods to four because all of the ore was processed earlier. The other options reached only 5 M in the last year, which provided some broader insights about introducing new mining capacity to avoid leaving idle resources; indeed, the single-minded insertion of new technology does not generally reach its full potential if different limiting factors emerge throughout the mine life, and a fair assessment requires considering the life-of-mine impact.

4.2.4. Parameter Adjustments

Once the mine plan is determined, the total ore per scenario is made available to the DES framework. Since it aims to optimize the plant performance, parameters such as the processing capacity and the number of periods to process the ore are left to be decided by the DES. The rest of the parameters are in Table 4. Some of these parameters, previously presented in Table 3, were converted to daily rates, which are more appropriate for the operational timescale. Additionally, it is observed that three maximum stocks were tested based on what the company can deal with: 5, 7, and 10 days of supply. Considering this information, a critical diorite level was set, which triggers when the plant needs to change its operational mode during a shutdown. Two contingency modes were introduced to manage the risk of unplanned shutdowns due to a lack of a type of ore (D or S) during a production campaign. These modes are not ideal in terms of performance but are essential in rebalancing the stockpile levels, so that the regular modes can be resumed.

4.2.5. Medium-Term Validation

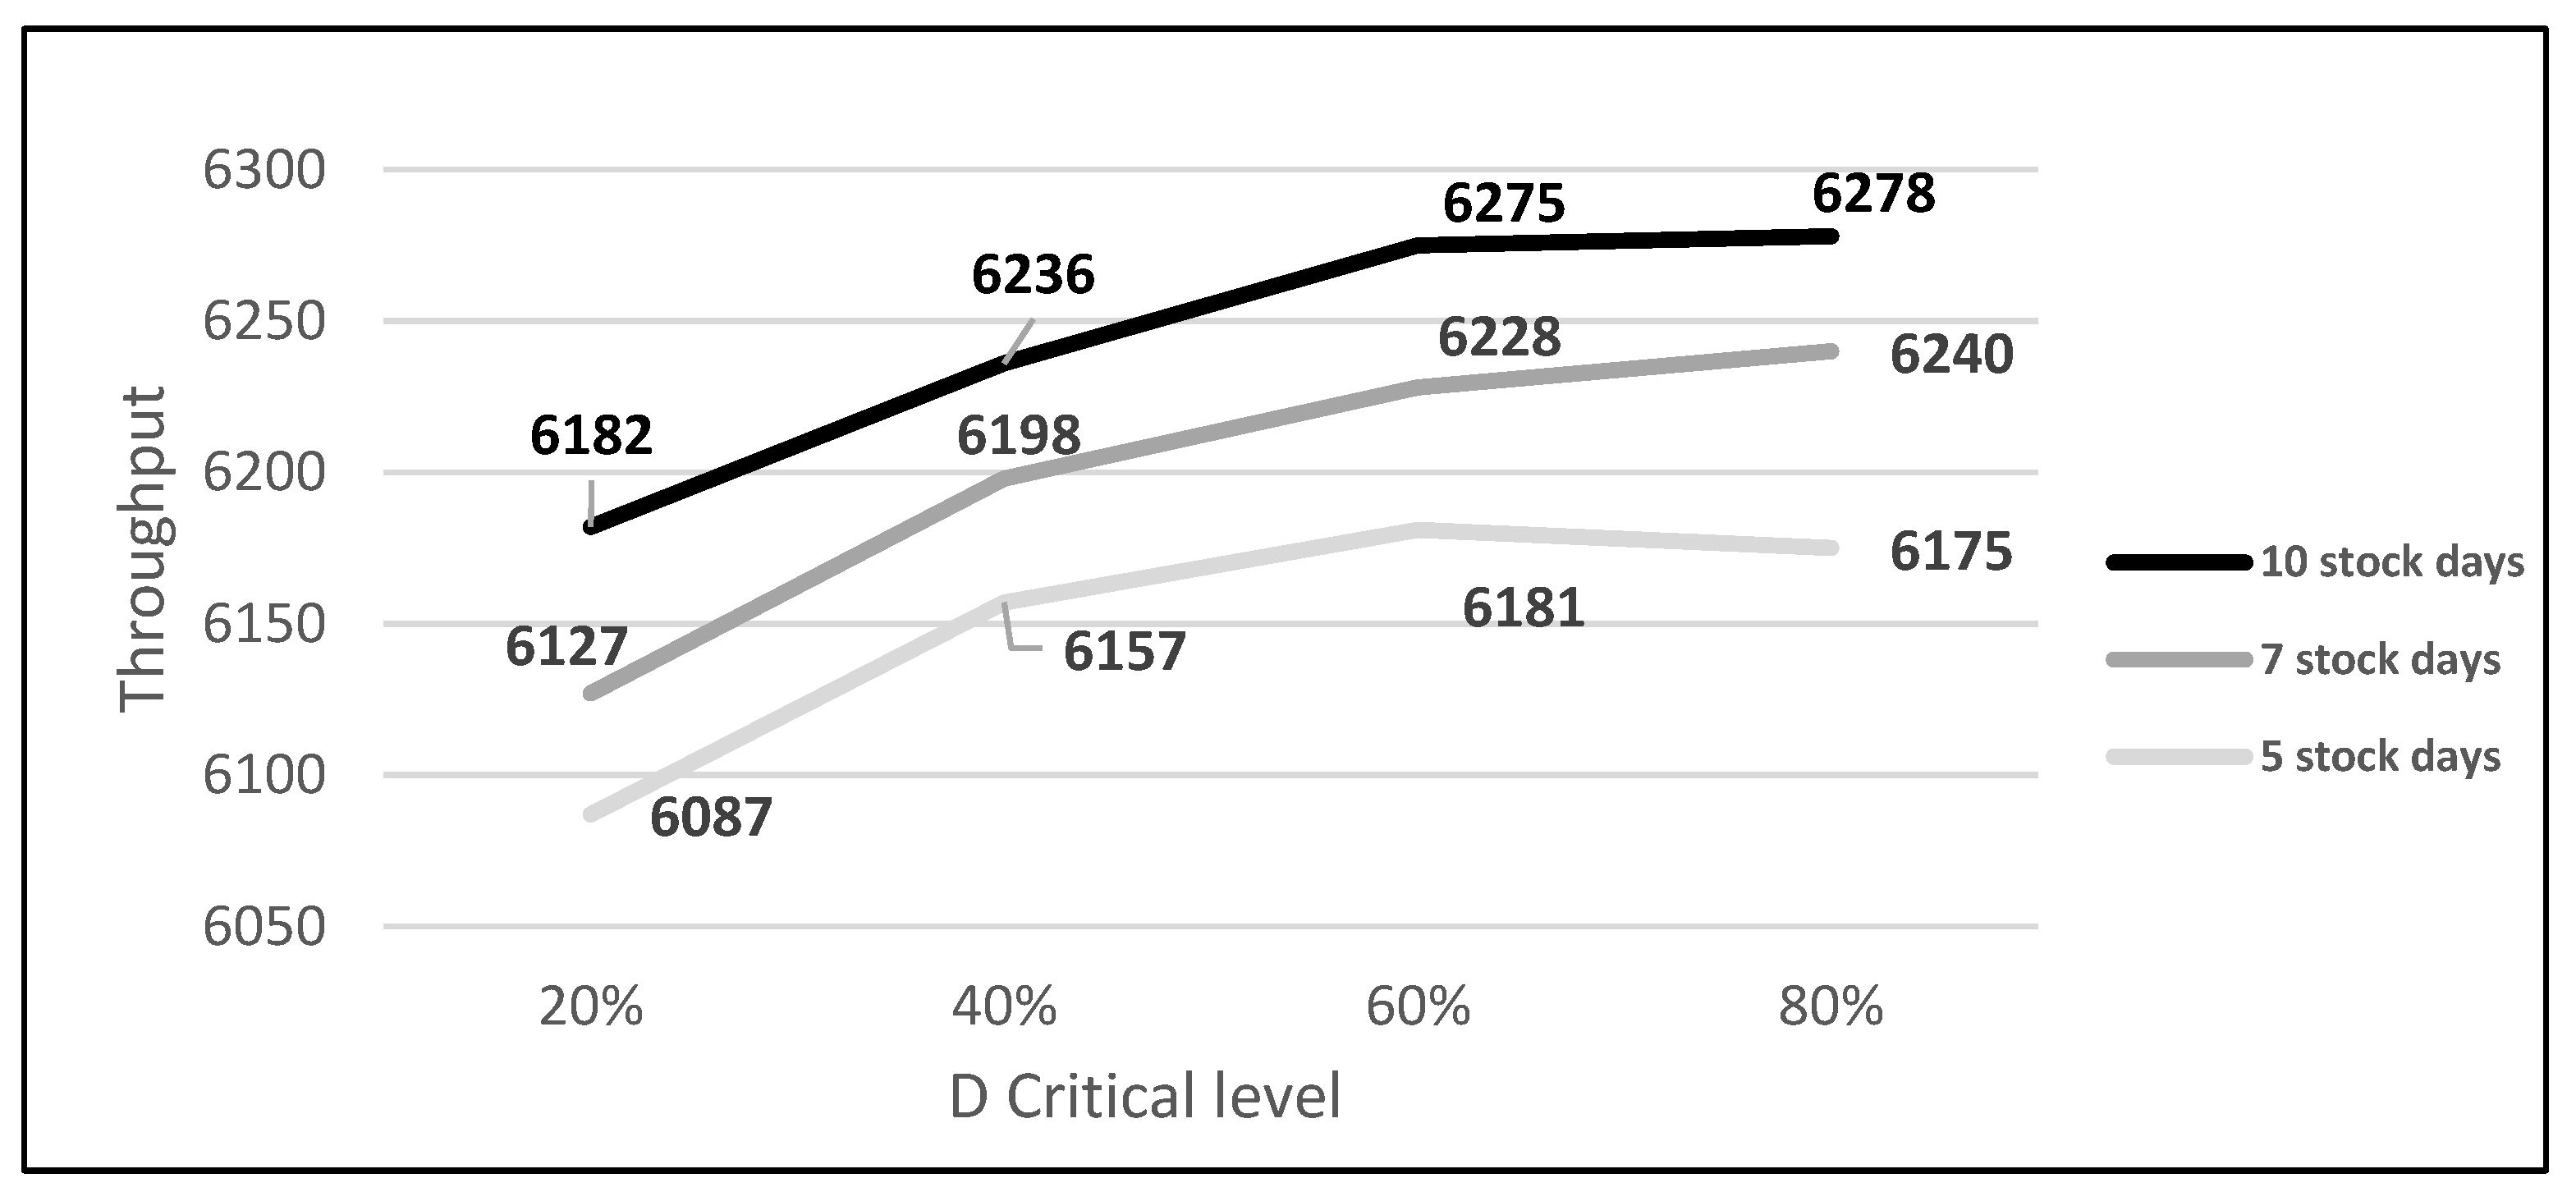
Each option (No Sort, XRF, NIR, and OPT) was adjusted based on the maximum stocks and critical diorite level (Table 4) to find an improved throughput. Figure 7 shows a plot with three throughput curves (one for each maximum stock) and their association with the critical diorite level for the NIR option. It is observed that maximum values were reached when target stock levels were set to 10 days, mainly when 80% of that ore was diorite. Nevertheless, the one that followed it (60%) was only 3 tonnes per day less, which led to selecting the latter option to provide better risk management by not stressing the system to have a high amount of diorite.
To have a high throughput indicates that contingency modes are not being used, or used only during short periods. Figure 8 presents a graph obtained from Arena, where it is noticed that stockpile levels are under the established limits in the NIR option during the first 600 days. In fact, according to the outcomes, the total time of processing ore under the Mode A contingency is, on average, 26.78 days, representing 1.6% of the total (approximately 1694 days). The Mode B contingency is even less frequent, with only 0.23 days (0.01%).
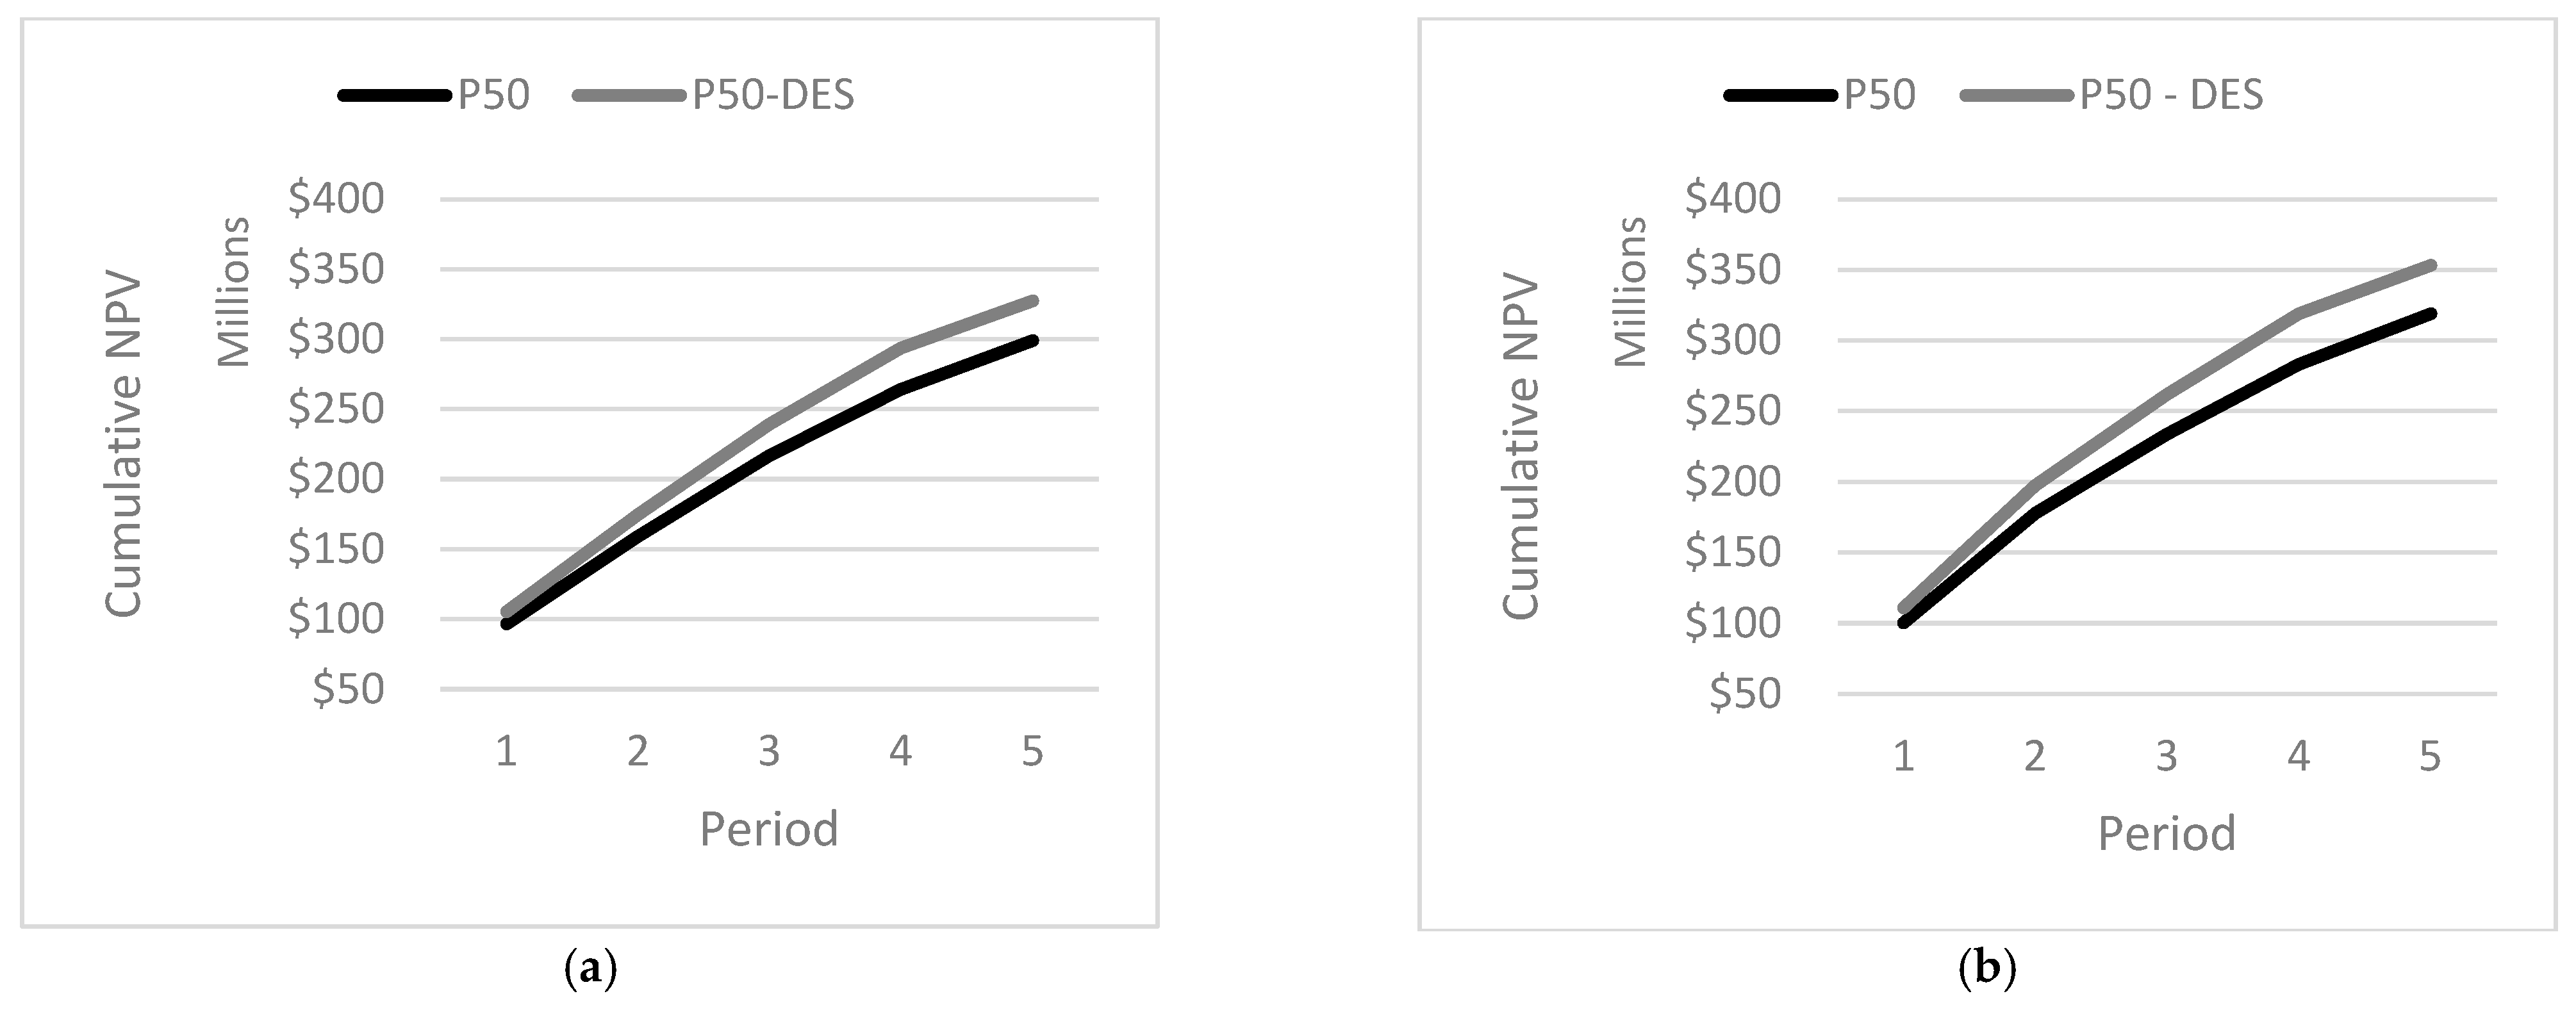
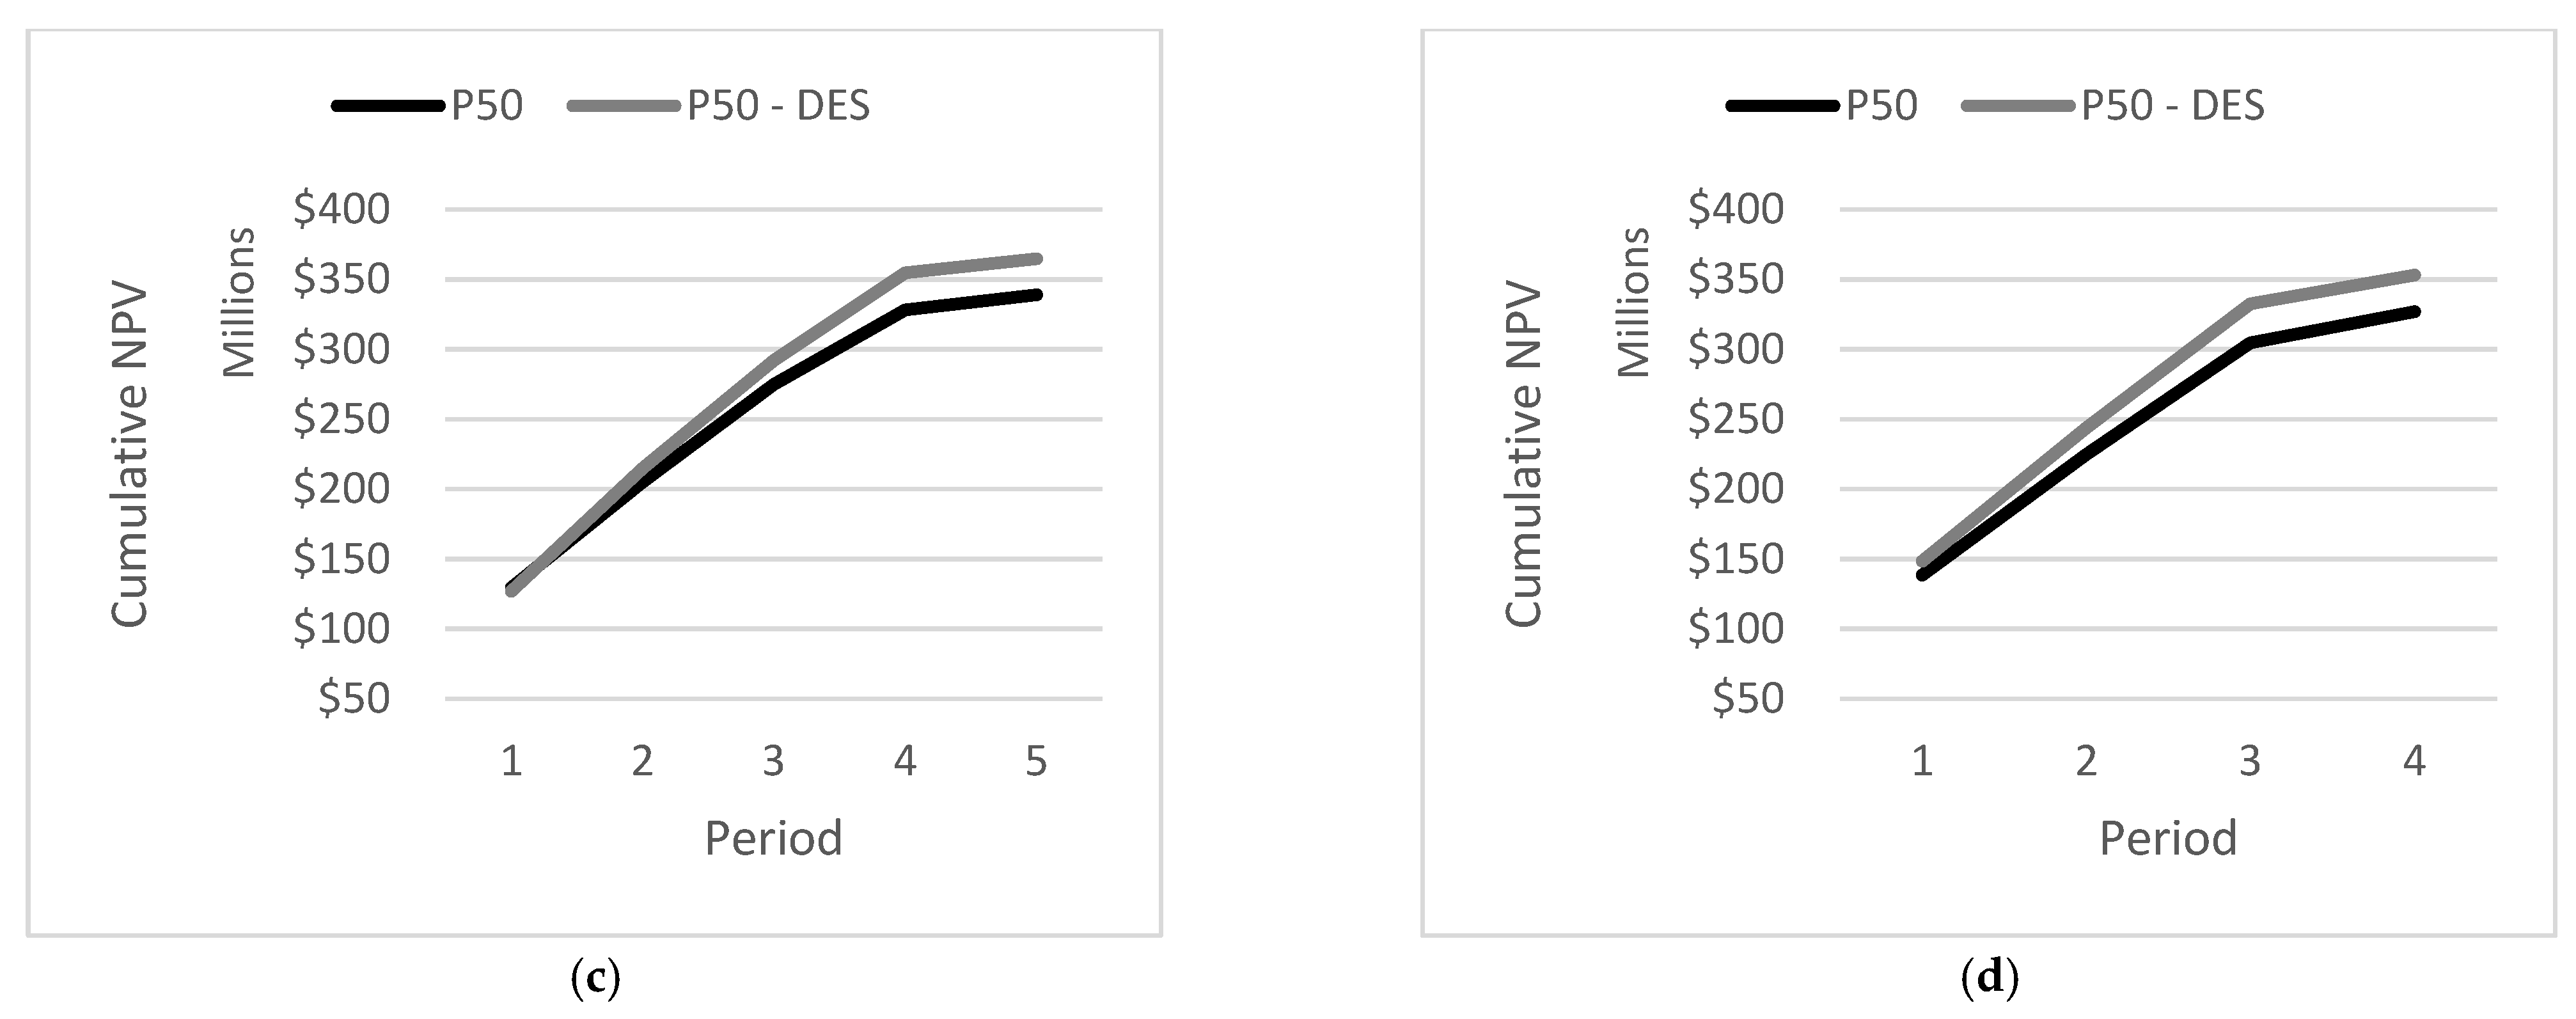
Following the discrete event simulations, the cumulative NPV for each P50 curve was contrasted with those obtained from the long-term modelling. Figure 9 shows the results where it is apparent that the maximization of throughput and the use of operational stockpiles increase the previous results by an average of ~10%. Therefore, the long-term outcomes become a lower bound. In addition, these results confirm that the NIR option is the most favorable, reaching a cumulative NPV of USD 364 M (Figure 9c).

4.2.6. Final Analysis

The outcomes suggest the importance of a balance between the rejection percentage and the efficiency of the ore sorter. Reducing the total ore to be sent to the plant indeed decreases the cost associated with processing but also decreases the efficiency, which causes less metal production overall. This is demonstrated by contrasting the XRF and OPT options with a similar NPV of USD 353 M (see Figure 9b,d). Table 5 shows that OPT processed almost 3 t/d less than XRF (less cost), but the metal recovery was 6% less (i.e., less metal produced). The metal recovery presented in Table 5 was calculated as the metallurgical Au recovery (Table 3) multiplied by the efficiency of the ore sorting option (Table 2).
Interestingly, the OPT option that was enhanced via neural network capabilities (achieving ~5% improved efficiency over the other options) resulted in a decreased cumulative NPV by ~USD 12 M compared to the NIR option. Moreover, despite a lower capital investment, the OPT option clearly did not result in a better system-wide performance.
As a result, the NIR option was proposed as the best option to implement ore sorting technology in the company.

5. Conclusions

The present work introduced the MTAP as a methodology for technoeconomic and operational assessment of new or updated digital technologies (also extensible to other types of technology) within the mining sector. This methodology includes six stages through which a holistic analysis is carried out via a quantitative framework. The current framework consists of a state-of-the-art algorithm to generate a long-term mine plan for open-pit mines and a DES model that simulates plant performance to maximize throughput and using operational (short-term) stockpiles as a control measure (however, a similar procedure can be developed for underground operations if a suitable underground mine planning algorithm is available). A realistic case study loosely based on a gold-rich porphyry copper deposit from the Chilean Maricunga Belt demonstrated the approach, in which a company wanted to assess the inclusion of intelligent ore sorting technology.
The corresponding outcomes indicate the benefits of introducing intelligent ore-sorting technology into the company’s mine site. All of the assessed options that included this technology presented a better cumulative NPV compared to when it was not implemented, with the best option (NIR) corresponding to a USD 37.5 M increase. A relevant trade-off was also found between the amount of material rejected and the metal recovery efficiency of the ore sorter. Reducing more material does not necessarily mean higher profit. In this regard, it is shown that even though digital technology might be seen as very promising when analyzed in isolation, this localized analysis does not necessarily imply the best global improvement (e.g., OPT option).
One of the main drawbacks of the algorithm presented in [41] was not considering strategic stockpiles; however, the combination with a DES model under the same framework proved that the cumulative NPV provided by the algorithm acts as a lower bound, which can subsequently be refined. Moreover, this outcome demonstrates the importance of having a long-term plan that considers other geometallurgy attributes, such as rock type and liberation characteristics, to properly manage the operational modes of the processing plant.
Overall, the methodology provided valuable insight into the relevance of following a quantitative process to assess the suitability of incorporating digital or other technologies into the mineral value chain. More real or realistic case studies will be evaluated in future work to gain additional insight and refine the methodology.

Author Contributions

Conceptualization, A.Q., J.Ó. and A.N.; methodology, A.Q.; software, A.Q. and J.Ó.; validation, R.W. and A.N.; investigation, A.Q.; resources, A.Q.; data curation, A.Q. and J.Ó.; writing—original draft preparation, A.Q. and J.Ó.; writing—review and editing, R.W. and A.N.; supervision, A.N.; funding acquisition, A.Q. All authors have read and agreed to the published version of the manuscript.

Funding

This research was partially funded by a scholarship granted by the Chilean National Agency for Research and Development—ANID, grant number 72200205.

Data Availability Statement

The data presented in this study are available on request from the corresponding author. The data are not publicly available due to privacy concerns of anonymous industrial partners.

Acknowledgments

We are thankful to NLHPC. Powered@NLHPC: This research was partially supported by the supercomputing infrastructure of the NLHPC (ECM-02).

Conflicts of Interest

The authors declare no conflict of interest.

References

  1. Barnewold, L.; Lottermoser, B. Identification of digital technologies and digitalization trends in the mining industry. Int. J. Min. Sci. Technol. 2020, 30, 747–757. [Google Scholar] [CrossRef]
  2. Qiuping, W.; Shunbing, Z.; Chunquan, D. Study on key technologies of Internet of Things perceiving mine. Procedia Eng. 2011, 26, 2326–2333. [Google Scholar] [CrossRef]
  3. Yinghua, Z.; Guanghua, F.; Zhigang, Z.; Zhian, H.; Hongchen, L.; Jixing, Y. Discussion on Application of IOT Technology in Coal Mine Safety Supervision. Procedia Eng. 2012, 43, 233–237. [Google Scholar] [CrossRef]
  4. Sun, E.; Zhang, X.; Zhongxue, L. The internet of things (IOT) and cloud computing (CC) based tailings dam monitoring and pre-alarm system in mines. Saf. Sci. 2012, 50, 811–815. [Google Scholar] [CrossRef]
  5. Mehrabi, A.; Mehrshad, N.; Massinaei, M. Machine vision-based monitoring of an industrial flotation cell in an iron flotation plant. Int. J. Miner. 2014, 133, 60–66. [Google Scholar] [CrossRef]
  6. Jahedsaravani, A.; Marhaban, M.; Massinaei, M. Prediction of the metallurgical performances of a batch flotation system by image analysis and neural networks. Miner. Eng. 2014, 69, 137–145. [Google Scholar] [CrossRef]
  7. Jahedsaravani, A.; Massinaei, M.; Marhaban, M. Development of a machine vision system for real-time monitoring and control of batch flotation process. Int. J. Miner. 2017, 167, 16–26. [Google Scholar] [CrossRef]
  8. Singh, V.; Rao, S. Application of image processing and radial basis neural network techniques for ore sorting and ore classification. Miner. Eng. 2005, 18, 1412–1420. [Google Scholar] [CrossRef]
  9. Cao, B.; Xie, Y.; Gui, W.; Wei, L.; Yang, C. Integrated prediction model of bauxite concentrate grade based on distributed machine vision. Miner. Eng. 2013, 53, 31–38. [Google Scholar] [CrossRef]
  10. Sun, T.; Li, H.; Wu, K.; Chen, F.; Zhu, Z.; Hu, Z. Data-Driven Predictive Modelling of Mineral Prospectivity Using Machine Learning and Deep Learning Methods: A Case Study from Southern Jiangxi Province, China. Minerals 2020, 10, 102. [Google Scholar] [CrossRef]
  11. Zaki, M.; Chen, S.; Zhang, J.; Feng, F.; Khoreshok, A.; Mahdy, M.; Salim, K. A Novel Approach for Resource Estimation of Highly Skewed Gold Using Machine Learning Algorithms. Minerals 2022, 12, 900. [Google Scholar] [CrossRef]
  12. Kaplan, U.; Dagasan, Y.; Topal, E. Mineral grade estimation using gradient boosting regression trees. Int. J. Min. Reclam. Environ. 2021, 35, 728–742. [Google Scholar] [CrossRef]
  13. Beretta, F.; Rodrigues, A.; Peroni, R.; Costa, J. Automated lithological classification using UAV and machine learning on an open cast mine. Appl. Earth Sci. 2019, 128, 79–88. [Google Scholar] [CrossRef]
  14. Khandelwal, M.; Monjezi, M. Prediction of Backbreak in Open-Pit Blasting Operations Using the Machine Learning Method. Rock Mech. Rock Eng. 2013, 46, 389–396. [Google Scholar] [CrossRef]
  15. Willingham, D.; Marchant, R. Predictive Maintenance Using Simulation and Machine Learning. In Proceedings of the 13th AusIMM Mill Operators, Perth, Australia, 10–12 October 2016. [Google Scholar]
  16. Molaei, F.; Rahimi, E.; Siavoshi, H.; Ghaychi, S.; Tenorio, V. A Comprehensive Review on Internet of Things (IoT) and its Implications in the Mining Industry. Am. J. Appl. Sci. 2020, 13, 499–515. [Google Scholar] [CrossRef]
  17. Skyttner, L. General Systems Theory—Ideas & Applications; World Scientific Publishing Co. Pte. Ltd.: Singapore, 2001; pp. 45–101. [Google Scholar]
  18. Jacobs, J.; Webber-Youngman, R.C.W. A technology map to facilitate the process of mine modernization throughout the mining cycle. J. S. Afr. 2017, 117, 637–648. [Google Scholar] [CrossRef]
  19. Dimitrakopoulos, R. Stochastic Optimization for Strategic Mine Planning: A Decade of Developments. J. Min. Sci. 2011, 47, 138–150. [Google Scholar] [CrossRef]
  20. Carvalho, J.; Dimitrakopoulos, R. Integrating Production Planning with Truck-Dispatching Decisions through Reinforcement Learning While Managing Uncertainty. Minerals 2021, 11, 587. [Google Scholar] [CrossRef]
  21. Wilson, R.; Mercier, P.; Patarachao, B.; Navarra, A. Partial Least Squares Regression of Oil Sands Processing Variables within Discrete Event Simulation Digital Twin. Minerals. 2021, 11, 689. [Google Scholar] [CrossRef]
  22. Peña-Graf, F.; Ordenes, J.; Wilson, R.; Navarra, A. Discrete Event Simulation for Machine-Learning Enabled Mine Production Control with Application to Gold Processing. Metals 2022, 12, 225. [Google Scholar] [CrossRef]
  23. Navarra, A.; Waters, K. Concentrator utilization under geological uncertainty. Can. Metall. Q. 2016, 55, 470–478. [Google Scholar] [CrossRef]
  24. Montiel, L.; Dimitrakopoulos, R. Optimizing mining complexes with multiple processing and transportation alternatives: An uncertainty-based approach. Eur. J. Oper. Res. 2015, 247, 166–178. [Google Scholar] [CrossRef]
  25. Lamghari, A.; Dimitrakopoulos, R.; Senécal, R. A metaheuristic approach for optimizing mineral value chains under uncertainty. Optim. Eng. 2022, 23, 1139–1164. [Google Scholar] [CrossRef]
  26. Goodfellow, R.; Dimitrakopoulos, R. Global optimization of open pit mining complexes with uncertainty. Appl. Soft. Comput. 2016, 40, 292–304. [Google Scholar] [CrossRef]
  27. Montiel, L.; Dimitrakopoulos, R.; Kawahata, K. Globally optimising open-pit and underground mining operations under geological uncertainty. Min. Techol. 2016, 125, 2–14. [Google Scholar] [CrossRef]
  28. Goodfellow, R.; Dimitrakopoulos, R. Simultaneous stochastic optimization of mining complexes and mineral value chain. Math. Geosci. 2017, 49, 341–360. [Google Scholar] [CrossRef] [PubMed]
  29. Montiel, L.; Dimitrakopoulos, R. Simultaneous stochastic optimization of production scheduling at Twin Creeks mining complex. Nevada Min. Eng. 2018, 70, 48–56. [Google Scholar] [CrossRef]
  30. Del Castillo, M.; Dimitrakopoulos, R. Dynamically optimizing the strategic plan of mining complexes under supply uncertainty. Resour. Policy 2019, 40, 83–93. [Google Scholar] [CrossRef]
  31. Levinson, Z.; Dimitrakopoulos, R. Simultaneous stochastic optimization of an open-pit gold mining complex with waste management. Int. J. Min. Reclam. Environ. 2020, 34, 415–429. [Google Scholar] [CrossRef]
  32. LaRoche-Boisvert, M.; Dimitrakopoulos, R. An Application of Simultaneous Stochastic Optimization at a Large Open-Pit Gold Mining Complex under Supply Uncertainty. Minerals 2021, 11, 172. [Google Scholar] [CrossRef]
  33. Dimitrakopoulos, R.; Lamghari, A. Simultaneous stochastic optimization of mining complexes—Mineral value chains: An overview of concepts, examples and comparisons. Int. J. Min. Reclam. Environ. 2022, 36, 443–460. [Google Scholar] [CrossRef]
  34. Randolph, M. Current Trends in Mining. In SME Mining Engineering Handbook, 3rd ed.; Darling, P., Ed.; Society for Mining, Metallurgy, and Exploration, Inc.: Englewood, CO, USA, 2011. [Google Scholar]
  35. Paravarzar, S.; Emery, X.; Madani, N. Comparing sequential Gaussian and turning bands algorithms for cosimulating grades in multi-element desposits. C. R. Geosci. 2015, 347, 84–93. [Google Scholar] [CrossRef]
  36. Nelis, G.; Morales, N.; Widzyk-Capehart, E. Comparison of different approaches to strategic open-pit mine planning under geological uncertainty. In Proceedings of the 27th International Symposium on Mine Planning and Equipment Selection—MPES 2018; Widzyk-Capehard, E., Hekmat, A., Singhal, R., Eds.; Springer: Cham, Switzerland, 2019; pp. 95–105. [Google Scholar]
  37. Ramazan, S.; Dimitrakopoulos, R. Traditional and new MIP models for production scheduling with in-situ grade variability. Int. J. Surf. Min. Reclam. Environ. 2004, 18, 85–98. [Google Scholar] [CrossRef]
  38. Dimitrakopoulos, R.; Ramazan, S. Stochastic integer programming for optimizing long term production schedules of open pit mines: Methods, application and value of stochastic solutions. Trans. Inst. Min. Metall. A Min. Technol. 2008, 117, 155–160. [Google Scholar]
  39. Lamghari, A.; Dimitrakopoulos, R. A diversified Tabu Search approach for the open-pit mine production scheduling problem with metal uncertainty. Eur. J. Oper. Res. 2012, 222, 642–652. [Google Scholar] [CrossRef]
  40. Kan, A. Long-term production scheduling of open pit mines using particle swarm and bat algorithms under grade uncertainty. J. South Afr. Inst. Min. Metall. 2018, 118, 361–368. [Google Scholar] [CrossRef]
  41. Quelopana, A.; Ordenes, J.; Araya, R.; Navarra, A. Geometallurgical Detailing of Plant Operation within Open-Pit Strategic Mine Planning. Processes 2023, 11, 381. [Google Scholar] [CrossRef]
  42. Navarra, A.; Rafiei, A.; Waters, K. A system approach to mineral processing based on mathematical programming. Can. Metall. Q. 2017, 56, 35–44. [Google Scholar] [CrossRef]
  43. Navarra, A.; Menzies, A.; Jordens, A.; Waters, K. Strategic evaluation of concentrator operational modes under geological uncertainty. Int. J. Miner. 2017, 164, 45–55. [Google Scholar] [CrossRef]
  44. Wilson, R.; Toro, N.; Naranjo, O.; Emery, X.; Navarra, A. Integration of geostatistical modeling inro discrete event simulation for development of tailings dam retreatment applications. Miner. Eng. 2021, 164, 106814. [Google Scholar] [CrossRef]
  45. Wilson, R.; Mercier, P.; Navarra, A. Integrated Artificial Neural Network and Discrete Event Simulation Framework for Regional Development of Refractory Gold Systems. Mining 2022, 2, 8. [Google Scholar] [CrossRef]
  46. Ordenes, J.; Toro, N.; Quelopana, A.; Navarra, A. Data-Driven Dynamic Simulations of Gold Extraction Which Incorporate Head Grade Distribution Statistics. Metals 2022, 12, 1372. [Google Scholar] [CrossRef]
  47. Lamghari, A.; Dimitrakopoulos, R.; Ferland, J. A variable neighborhood descend algorithm for an open-pit mine production scheduling problem with metal uncertainty. J. Oper. Res. Soc. 2014, 65, 1305–1314. [Google Scholar] [CrossRef]
  48. Dantzig, G.; Wolfe, P. Decomposition Principle for Linear Programs. Oper. Res. 1960, 8, 101–111. [Google Scholar] [CrossRef]
  49. Saldaña, M.; Toro, N.; Castillo, J.; Hernandez, P.; Navarra, A. Optimization of the heap leaching process through changes in modes of operation and discrete event simulation. Minerals 2019, 9, 421. [Google Scholar] [CrossRef]
  50. Hartwig, F. Episodic concentration of gold to ore grade through Earth’s history. Earth Sci. Rev. 2018, 180, 148–158. [Google Scholar]
  51. Sillitoe, R. Some thoughts on gold-rich porphyry copper deposits. Miner. Depos. 1979, 14, 161–174. [Google Scholar] [CrossRef]
  52. Sillitoe, R. Style of low-grade gold mineralization in volcano-plutonic areas: Nevada Bur. Mines Geology 1983, 36, 52–68. [Google Scholar]
  53. Sillitoe, R. Gold-rich porphyry copper deposits: Geological model and exploration implications. Geological Association of Canada Special Paper. Miner. Depos. Model. 1993, 40, 465–478. [Google Scholar]
  54. Cox, D.; Singer, D. Distribution of gold in porphyry copper deposits. In U.S. Geological Survey Open-File Report; US Geological Survey: Reston, VA, USA, 1988; pp. 88–146. [Google Scholar]
  55. Vila, T.; Sillitoe, R. Gold-rich porphyry systems in the Maricunga belt, northern Chile. Econ. Geol. 1991, 86, 1238–1260. [Google Scholar] [CrossRef]
  56. Sillitoe, R. Gold Metallogeny of Chile an Introduction. Econ. Geol. 1991, 86, 1187–1205. [Google Scholar] [CrossRef]
  57. Sillitoe, R.; Tolman, J.; Van Kerkvoort, G. Geology of the Caspiche Porphyry Gold-Copper Deposit, Maricunga Belt, Northern Chile. Econ. Geol. 2013, 108, 585–604. [Google Scholar] [CrossRef]
  58. Bearman, R.; Bowman, D.; Dunne, R. Decision support for ore sorting and preconcentration in gold applications. Miner. Process. Extr. Metall. 2020, 129, 12–23. [Google Scholar] [CrossRef]
  59. Luo, X.; He, K.; Zhang, Y.; He, P.; Zhang, Y. A review of intelligent ore sorting technology and equipment development. Int. J. Miner. Metall. Mater. 2022, 29, 1647–1655. [Google Scholar] [CrossRef]
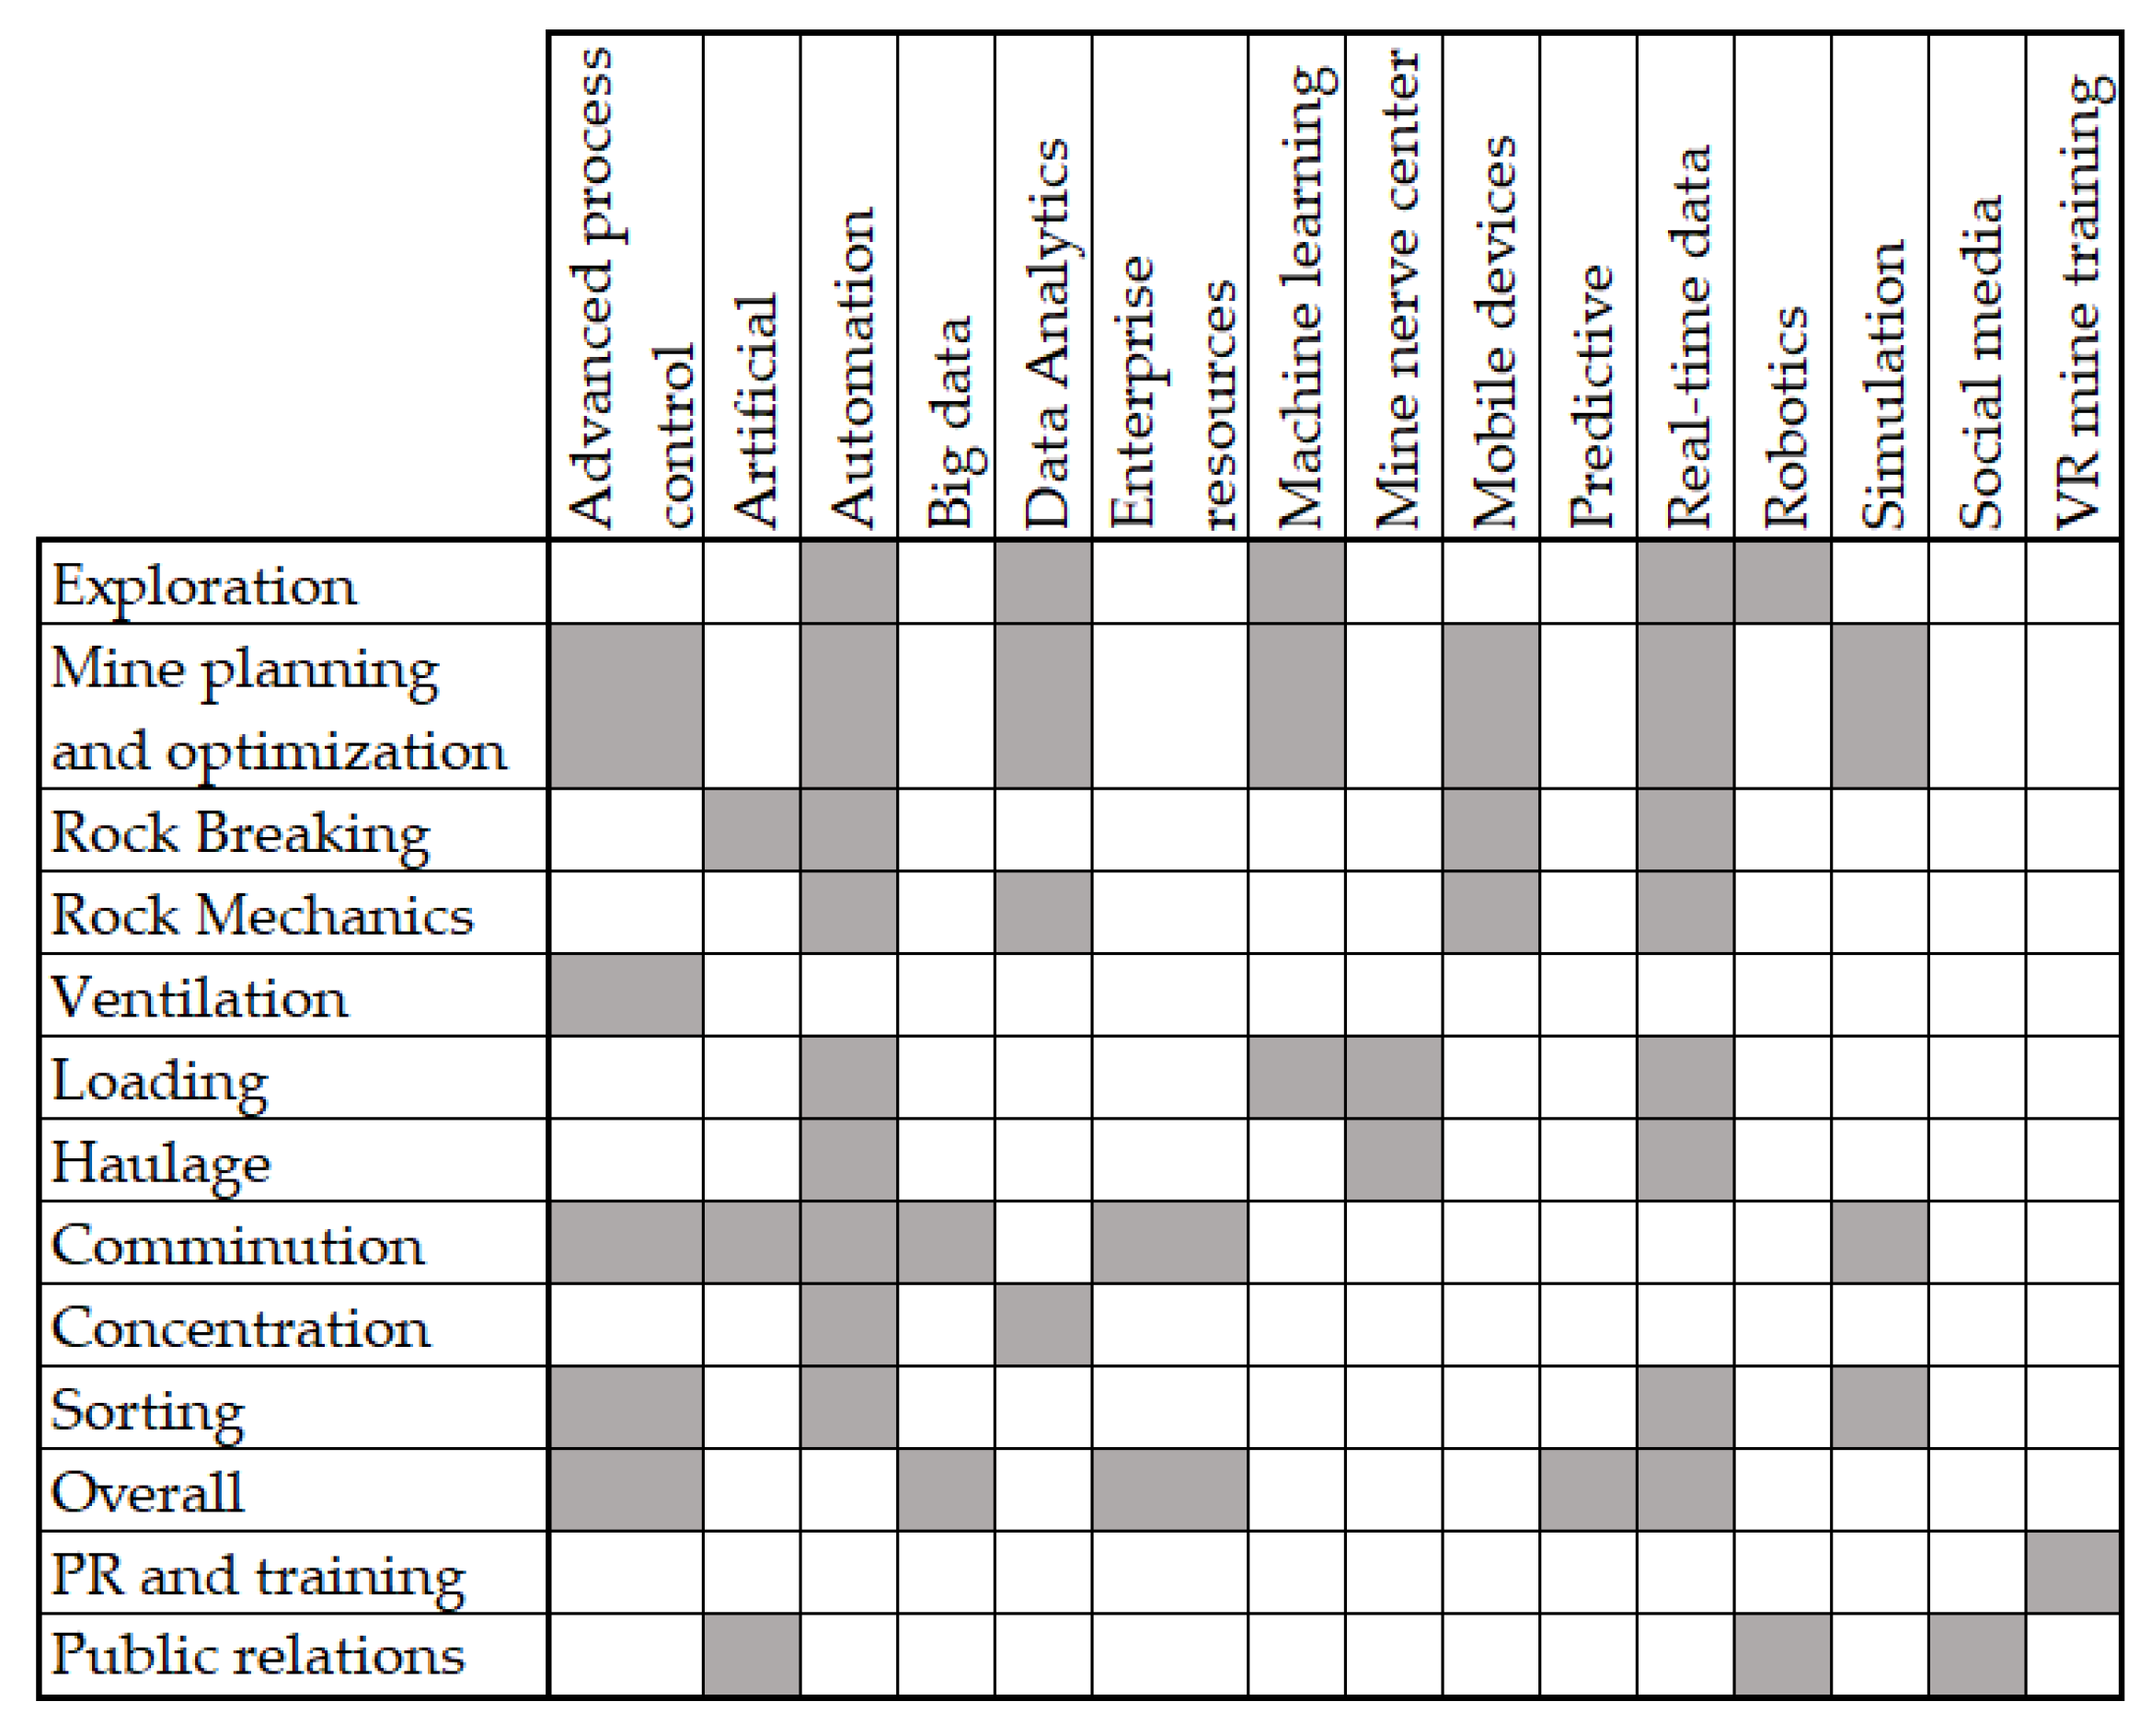
Figure 1. Digital technologies applied across the mineral value chain. Gray cells indicate an important concentration of publications. Adapted from [1].
Minerals 13 00642 g001
Figure 2. Proposed methodology.
Minerals 13 00642 g002
Figure 4. A schematic geological section for the case study.
Minerals 13 00642 g004
Figure 5. P10, P50, and P90 cumulative NPV curves of the mine without ore sorting (a), XRF (b), NIR (c), and OPT (d).
Minerals 13 00642 g005
Figure 6. Amount of rock extracted in each period, differentiating between diorite porphyry (D) and silicified intrusive breccia (S). Without ore sorting (a), XRF (b), NIR (c), and OPT (d).
Minerals 13 00642 g006
Figure 7. Throughput curves for each maximum stock and their association with the critical diorite level for the NIR option.
Minerals 13 00642 g007
Figure 8. Stockpile levels during the first 600 days for one scenario of the NIR option. Ore 1 is S, and Ore 2 is D.
Minerals 13 00642 g008
Figure 9. Comparison of P50 curves before and after adjustments from the DES portion of the framework for the mine without ore sorting (a), XRF (b), NIR (c), and OPT (d).
Minerals 13 00642 g009aMinerals 13 00642 g009b
Table 1. Sensor classification based on passive/active and body/surface detection [58].
Sensor Detection PrinciplePassive (P) or Active (A)Body (B) or Surface (S)
X-ray FluorescenceAS
Raman SpectroscopyAS
Laser Induced FluorescenceAS
Laser Induced Breakdown SpectroscopyAS
Near Infrared SpectroscopyAS
Nuclear Magnetic ResonanceAB
Microwave Heating + Infrared DetectionAB
X-ray DiffractionPS
X-ray TransmissionPB
Optical/Color/UVPS
ElectromagneticPB
RadiometricPB
Table 2. Ore sorting with different sensors, their rejections, and the associated efficiency.
OptionSensor Detection PrincipleRejectionEfficiency
XRFX-ray Fluorescence18%98%
NIRNear Infrared Spectroscopy36%96%
OPTOptical50%90%
Table 3. Parameters of the case study.
ParametersValues
Block weight (tonne)15,375
Number of blocks4536
Block dimension (m)25 × 25 × 10
Block density (tonne/m3)2.46
Number of periods5
Length of periods (year)1
Discount rate (%)8
Metal Price Au (USD/oz)1185
Mining cost (USD/tonne)3.48
Mining capacity (tonne/period) 16,000,000
Processing availability (hperiod)8280
Rock typesDiorite porphyry (D)
Silicified intrusive breccia (S)
Processing cost (USD/tonne)3.85
Recovery Au (%)0.83
Operational Mode A 2
Processing rate (tonne/h)284
Percentage rock D80
Percentage rock S20
Operational Mode B 2
Processing rate (tonne/h)256
Percentage rock D40
Percentage rock S60
1 Includes the operational cost associated with the ore sorter. 2 Parameters associated with the operational modes.
Table 4. DES parameters of the case study.
Parameters5 Days7 Days10 Days
Length of periods (year)1
Production campaigns (day)29
Shutdowns (day)1
Ore typesDiorite porphyry (D)
Silicified intrusive breccia (S)
Target ore stock level (tonne)34,08047,71268,160
Critical diorite level 120%/40%/60%/80%
Operational Mode A 2
Processing rate (tonnes/day)6816
Ore D5452
Ore S1364
Operational Mode A Contingency 2
Processing rate/ore S (tonnes/day)4430
Operational Mode B 2
Processing rate (tonnes/h)6144
Ore D2458
Ore S3686
Operational Mode B Contingency 2
Processing rate/ore D (tonnes/day)3994
1 Percentage with respect to target ore stock level. 2 Parameters associated with the operational modes.
Table 5. Ore processed and metal recovery per assessed option.
OptionOre Processed (Tonnes)Metal Recovery (%)
No Sort11,130,54183
XRF11,081,59681
NIR10,287,05380
OPT8,134,84575
Disclaimer/Publisher’s Note: The statements, opinions and data contained in all publications are solely those of the individual author(s) and contributor(s) and not of MDPI and/or the editor(s). MDPI and/or the editor(s) disclaim responsibility for any injury to people or property resulting from any ideas, methods, instructions or products referred to in the content.