Article

Infrared Spectroscopic Investigations of Calcium Oxalate Monohydrate (Whewellite) Dehydration/Rehydration

Department of Chemistry & Biochemistry, University of Oklahoma, Norman, OK 73069, USA
Minerals 2023, 13(6), 783; https://doi.org/10.3390/min13060783
Submission received: 16 May 2023 / Revised: 5 June 2023 / Accepted: 6 June 2023 / Published: 8 June 2023

Abstract

:
Variable-temperature infrared spectroscopy is employed to monitor molecular vibrations during dehydration of calcium oxalate monohydrate (COM) and hydration of anhydrous calcium oxalate (COA). A unique variable-temperature infrared spectroscopy approach combines precise sample temperature control and rapid (2 °C s−1) heating/cooling with high-sensitivity infrared analysis. Infrared spectra are obtained at specific isothermal sample temperatures, while applying linear temperature versus time heating and cooling ramps, and in coordination with programmed temperature steps. Spectrum vibration bands provide information regarding the symmetry and local environments of solid-state water molecules and oxalate anions. When COM is heated, water molecules liberated from different crystallographic sites are selectively detected. Subtle oxalate anion configuration changes associated with water losses are detected based on infrared vibration band shapes and wavenumber trends. Dehydration and rehydration processes occur at lower temperatures and over narrower temperature ranges than conventional thermal analysis methods because samples consist of thin layers of small particles. Reversible and irreversible sample changes are distinguished by using a step heating/cooling temperature program and spectral subtractions. COA temperature-dependent structure variations that occur while heating and cooling samples in an atmosphere with a low water vapor concentration are characterized.

Graphical Abstract

1. Introduction

Vibrational spectroscopy has long been used for mineral characterizations [1,2,3,4]. Vibration band frequencies and intensities are determined by the molecular structure and intermolecular interactions [5]. Spectra obtained by using infrared and Raman spectroscopy can be used to confirm mineral compositions and identify trace contaminants. Mineral structure information obtained by vibrational analysis can be augmented by sample perturbation techniques. For example, variable-temperature spectroscopic analyses characterize sample changes induced by heating and cooling [6]. Specifically, infrared spectrum changes can be correlated with specific temperature-dependent solid-state structure variations [6,7,8]. The appropriate methodology employed for variable-temperature infrared spectroscopy measurements is dictated by the properties of the material analyzed (i.e., solid, liquid, paste, etc.), the spectroscopic analysis approach (i.e., transmission, emission, reflection, etc.), and the temperature range to be studied.
Due to the excessive absorption of infrared radiation by minerals, sample dilution in a non-absorbing matrix (e.g., KCl or KBr) is often required prior to analyses [9]. Unfortunately, the sample thermal properties are altered after mixing them with a diluent, resulting in variable-temperature infrared spectroscopy trends that differ from the thermal analysis results obtained for the undiluted material. In addition, interactions between the sample and the diluent can affect absorbance band shapes [10], which can result in incorrect vibrational spectrum interpretations. For these reasons, when it is desirable to compare variable-temperature infrared spectroscopy results with those obtained by other thermal analysis techniques, neat samples should be employed. Attenuated total reflectance (ATR) is currently the method of choice for infrared analysis of neat solids [9]. The ATR approach involves pressing powders onto the surface of a high index of refraction crystal [11]. Infrared radiation is passed through the crystal so that it internally reflects from the crystal surface where the sample resides. Interactions between the solid and evanescent waves extending into the sample provide an infrared spectrum. Since these waves penetrate short distances into the sample, path lengths are typically a few microns, allowing high-absorptivity molecular vibration bands to be detected without distortion or truncation. For variable-temperature ATR measurements, the temperature of the sample and ATR crystal must be controlled. This is typically accomplished by placing a heating/cooling plate in contact with the ATR crystal [12,13]. Spectral artifacts often appear in acquired infrared spectra due to the temperature dependence of the ATR crystal optical properties and the temperature gradients at the interface between the crystal and the sample [14].
The recent introduction of the button sample holder provides an alternative to the ATR technique for neat sample variable-temperature infrared measurements [15]. A button consists of a stainless-steel disk backing with a stainless-steel wire mesh welded to its surface [10]. Samples are loaded as thin layers of powder dispersed within the wire mesh voids. Infrared radiation absorption is dependent on the particle size and the sample layer thickness. For most materials, sufficiently short radiation penetration distances can be obtained by this method to provide infrared spectra without truncating highly absorbing vibration bands. As demonstrated here, artifact-free variable-temperature infrared spectra can be obtained with high sensitivity by using a button sample holder and thermoelectric heating/cooling [16].
Calcium oxalate monohydrate (COM), also known as whewellite, is a ubiquitous mineral found in the environment and in biological organisms that forms by reactions of oxalic acid and calcium ions [17,18]. Although the dihydrate (COD) and trihydrate (COT) exist [19], the monohydrate is the most abundant because it has the highest thermodynamic stability at room temperature [18,20]. The COM crystal structure is well-known [21]. When heated, COM undergoes toptotactic water loss to form anhydrous calcium oxalate (COA) [22]. Although the structure of β-COA, which is the most stable anhydrous form, has been determined [23,24], the α-COA structure, which is the initial product of COM dehydration, remains in question [21,22]. By using a button sample holder and thermoelectric heating/cooling, subtle infrared spectrum changes associated with the COM to α-COA transition and the effects of water adsorption on the α-COA structure were identified.

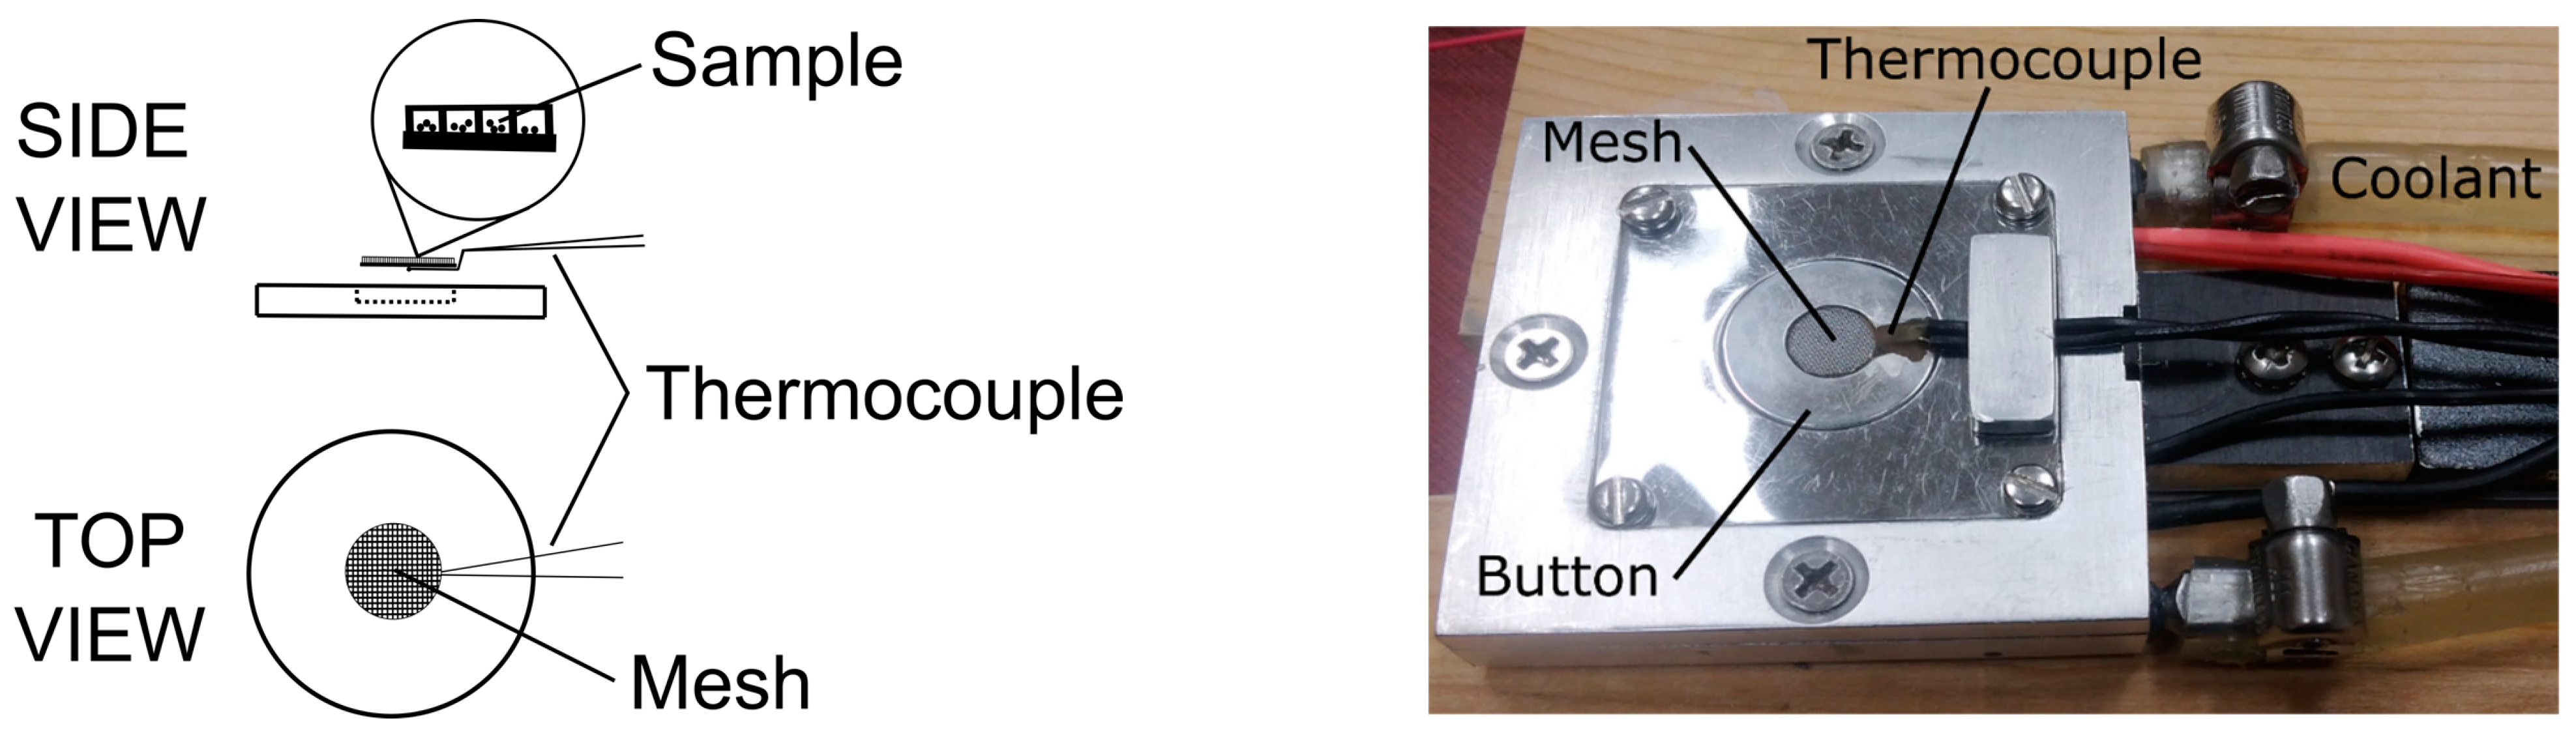
2. Materials and Methods

Calcium oxalate monohydrate (99.9995% purity) was obtained from Johnson Matthey (London, UK) and used without further purification. The variable-temperature infrared spectroscopy apparatus shown in Figure 1 is described in detail elsewhere [16]. The 100-mesh modified button sample holder incorporates a thermocouple that is spot-welded to a 0.30 mm-thick stainless-steel backing. The button rests on top of two stacked thermoelectric chips that provide sample heating/cooling. Excess heat is removed from the apparatus by liquid coolant flowing through a reservoir beneath the stacked chips. A small amount (<1 mg) of COM powder was dispersed throughout the void spaces of the wire grid in the button sample holder. An artist brush was used to remove particles from the top of the mesh and to create a thin layer of powder within the mesh void spaces. The apparatus in Figure 1 was placed on a slide so that it could be easily inserted into and removed from the spectrophotometer through a slot opening in the sample compartment. A Mattson Instruments Inc. (Madison, WI, USA) Nova Cygni 120 Fourier transform infrared spectrophotometer (FTIR) and a Harrick Scientific Inc. (Pleasantville, NY, USA) praying mantis diffuse reflection accessory [25] were used for infrared spectrum measurements. Spectra were obtained over the 4000–700 cm−1 range at an 8 cm−1 resolution by signal-averaging 64 interferograms, requiring about 30 s, for both sample and background single-beam measurements. Background single-beam spectra were obtained with the empty button prior to adding the sample. Although all measurements were performed at an 8 cm−1 resolution, interferogram zero-filling prior to processing yielded a 0.97 cm−1 spectrum digitization interval. This was found to provide reproducible infrared band shapes and yielded a superior signal-to-noise ratio compared to measurements performed at a 4 cm−1 resolution [26]. Reflectance spectrum baseline offsets and slopes were removed by using macro programs to apply the same correction methodologies to all the spectra obtained during analyses [27]. Spectra were converted to a form that was proportional to the analyte concentration by using the Kubelka-Munk transformation [28].

3. Results

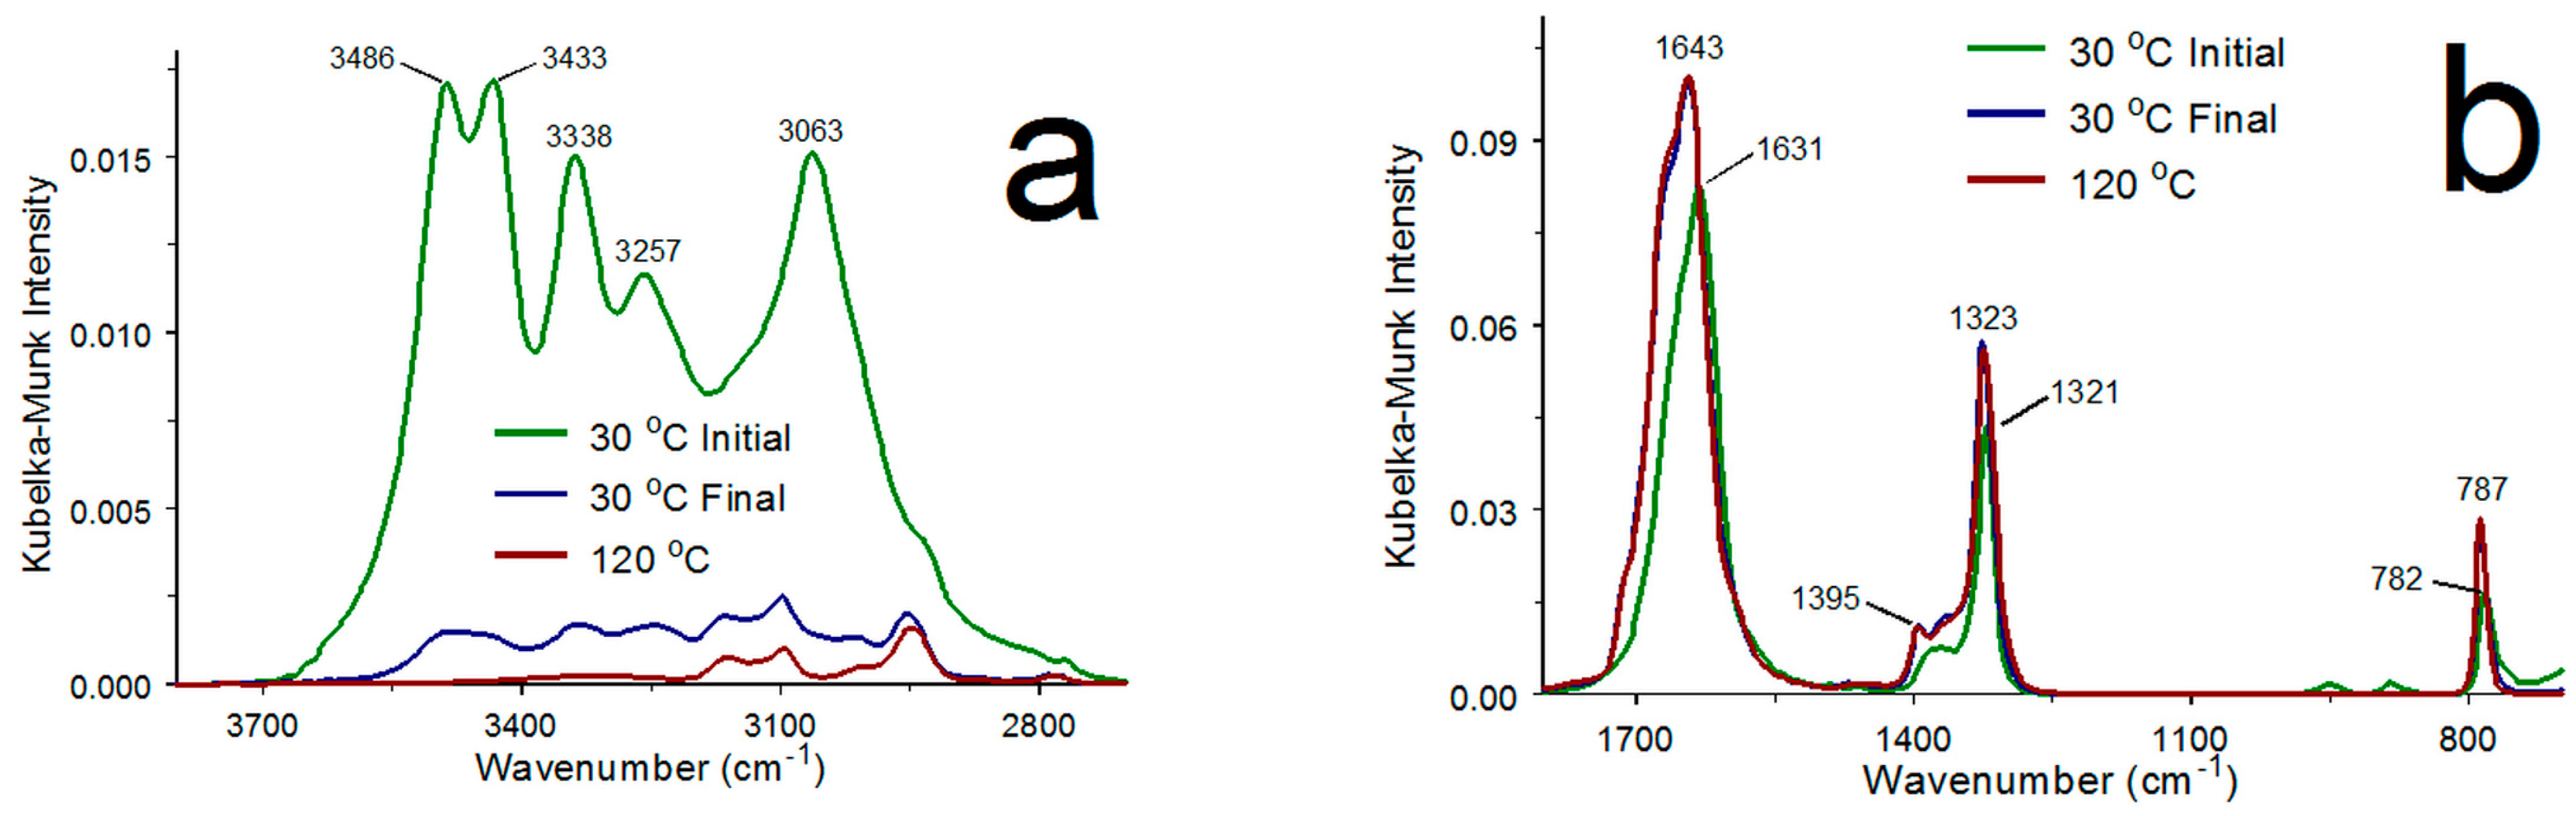
3.1. COM and α-COA Infrared Spectra

The effects of heating on the COM structure were investigated by infrared spectroscopy. A COM powder infrared spectrum was measured at 30 °C by using diffuse reflection. Another spectrum was obtained at 120 °C after a brief (~5 min) equilibration period. A third spectrum was measured after cooling the sample back to 30 °C. The 3700–2800 cm−1 region of the COM infrared spectrum contains overlapping O-H stretching vibration bands that are representative of crystallographic water molecules, whereas bands representing oxalate anion fundamental vibrations are found in the 1800–700 cm−1 range. Figure 2a,b show the water and oxalate anion infrared spectrum regions in the initial neat COM spectrum (green), the 120 °C spectrum (red), and the final 30 °C spectrum (blue). The 120 °C spectrum is representative of α-COA and the blue spectrum represents a mixture of primarily α-COA with some COM. The COM infrared spectrum band locations in Figure 2 are consistent with the previously reported values listed in Table 1. Two sets of O-H stretching vibration bands were assigned to crystallographic water molecules. One water molecule environment (W1) was assigned to vibration bands at 3433 and 3338 cm−1, whereas the other (W2) exhibited O-H stretching vibration bands at 3486 and 3063 cm−1 [29]. The band at 3257 cm−1 was assigned to a water bending vibration overtone [30]. Table 1 COM and α-COA wavenumbers differ depending on the analysis method. For example, the 3065 cm−1 band obtained by using a KBr pellet and transmission spectroscopy [31] was found at 3050 cm−1 when attenuated total reflectance (ATR) was employed [18]. Wavenumbers for the Figure 2a COM band maxima are similar to those in spectra previously obtained by diffuse reflection (i.e., DRIFTS) [32,33]. The overlapping bands between 3200 and 2900 cm−1 in the 120 °C spectrum were most likely linear combinations of oxalate anion vibrations. In fact, Shippey assigned the 2925 cm−1 band to the sum of asymmetric and symmetric oxalate stretching vibrations [30]. The nearly complete loss of O-H stretching vibration band intensity in the 120 °C spectrum confirmed that it is characteristic of α-COA. The hygroscopic α-COA sample gained some water after cooling in the FTIR purge gas, yielding the final 30 °C spectrum in Figure 2a. Although the O-H stretching vibration band profiles for the two spectra measured at 30 °C had similarities above 3200 cm−1, the bands in the final 30 °C spectrum were broader, suggesting more diverse environments for re-adsorbed water molecules compared to the initial COM configurations.
The asymmetric stretching (νa), symmetric stretching (νs), and bending (νδ) COM oxalate anion fundamental vibrations were assigned to the bands at 1631, 1321, and 782 cm−1, respectively [29]. The νa, νs, and νδ α-COA oxalate anion band locations at 1643, 1323, and 787 cm−1 in the 120 °C spectrum (Figure 2b) were closest to those reported by Shippey [30]. The three α-COA oxalate anion bands in Figure 2b were blue-shifted (i.e., at higher wavenumbers) relative to the corresponding COM bands. Similar blue shifting was evident in the Table 1 oxalate band wavenumbers. In addition to band shifts, Figure 2b shows that intensities for the three oxalate fundamental vibration bands increased when water was removed. The significant overlap of the oxalate anion fundamental vibration bands in the 120 °C and final 30 °C spectra in Figure 2b suggests that the sample largely retained the α-COA oxalate anion orientations upon cooling.

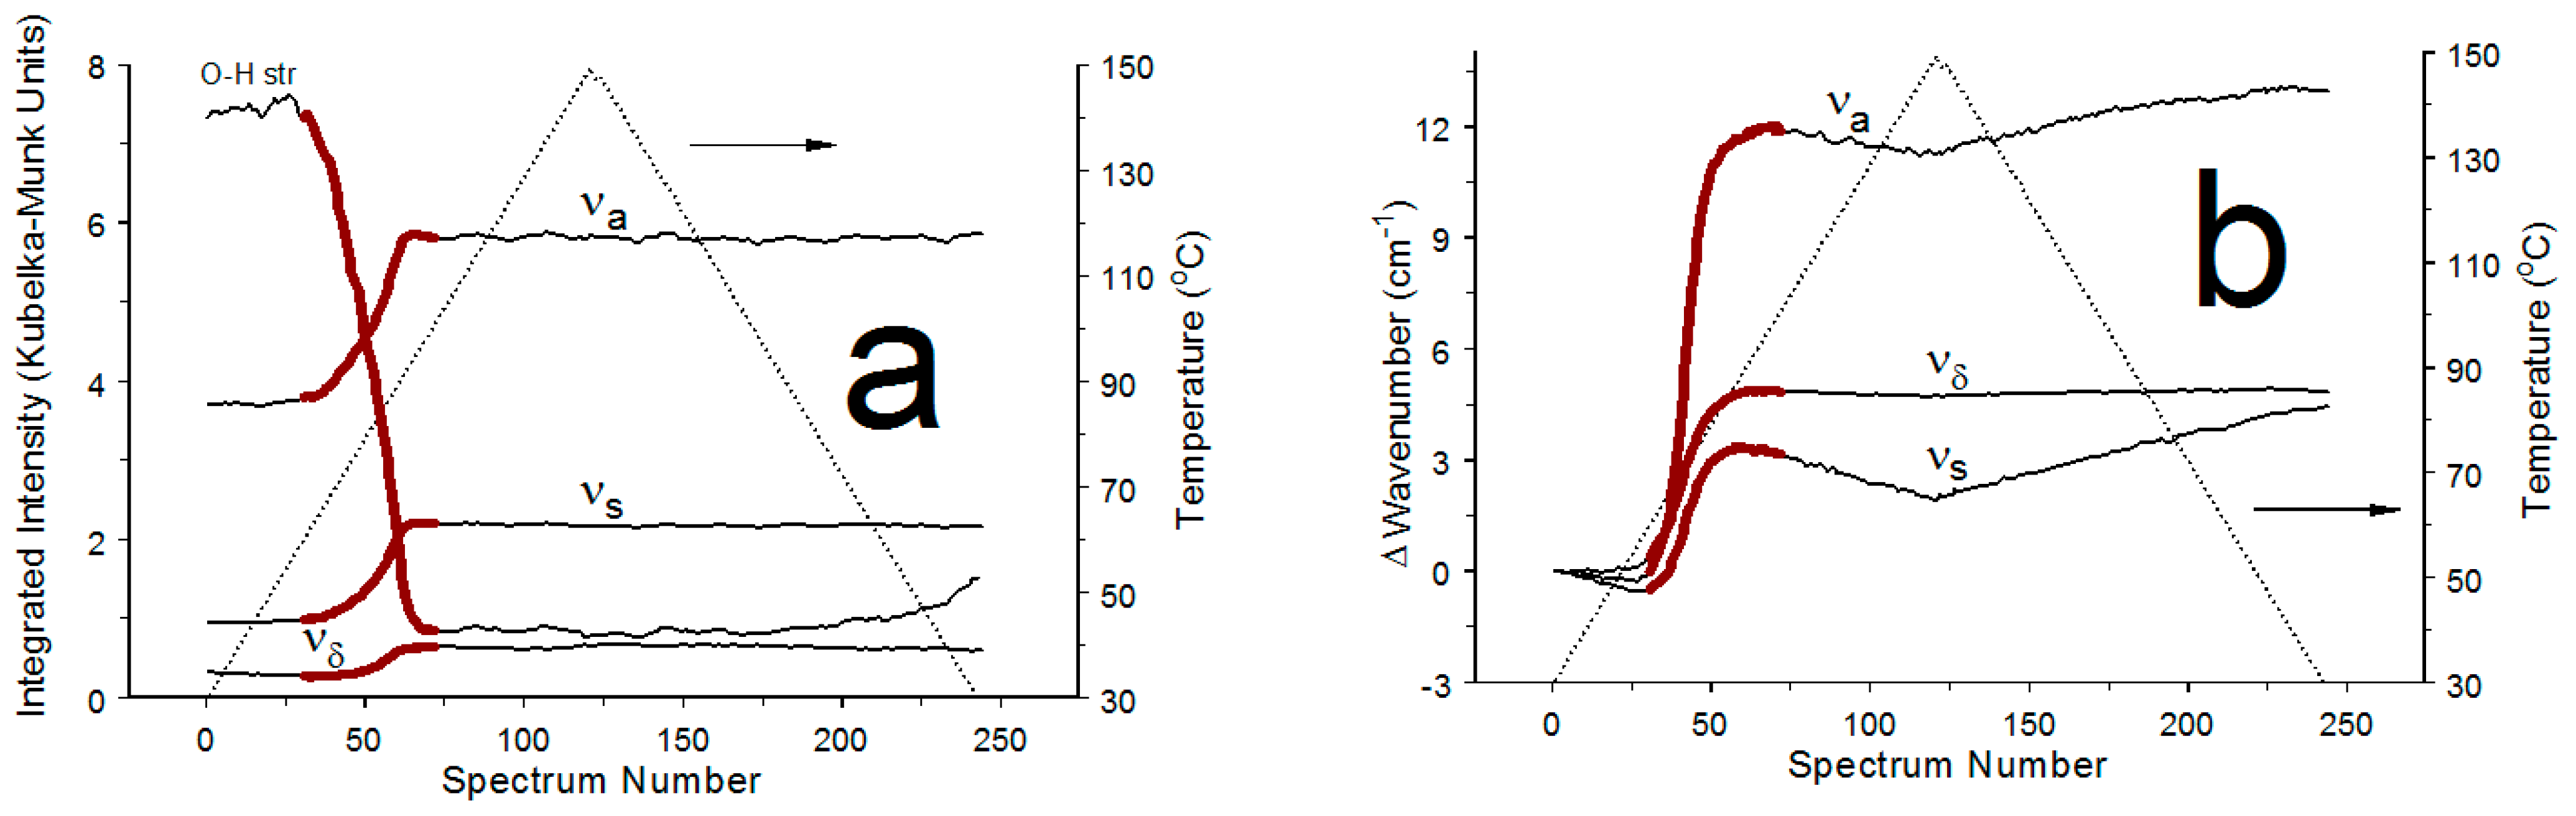
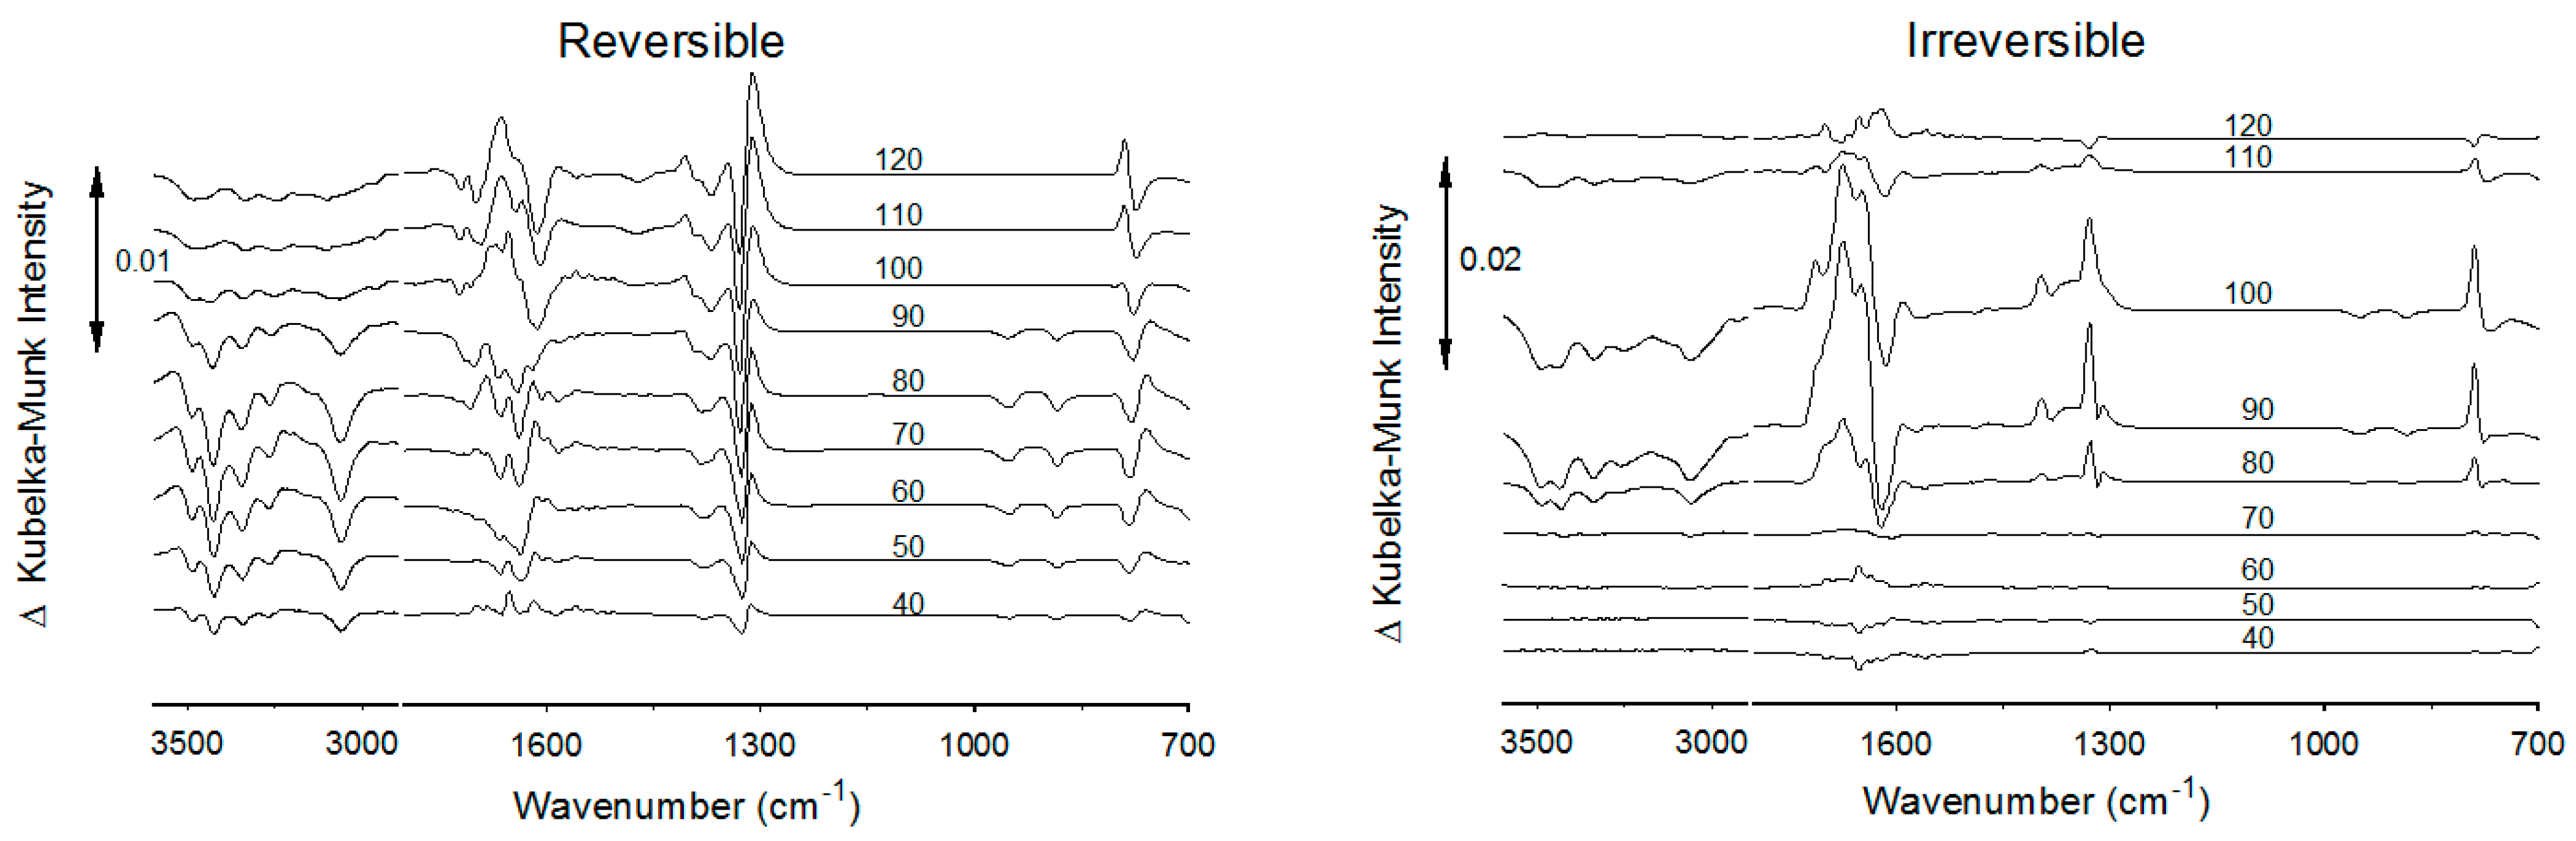
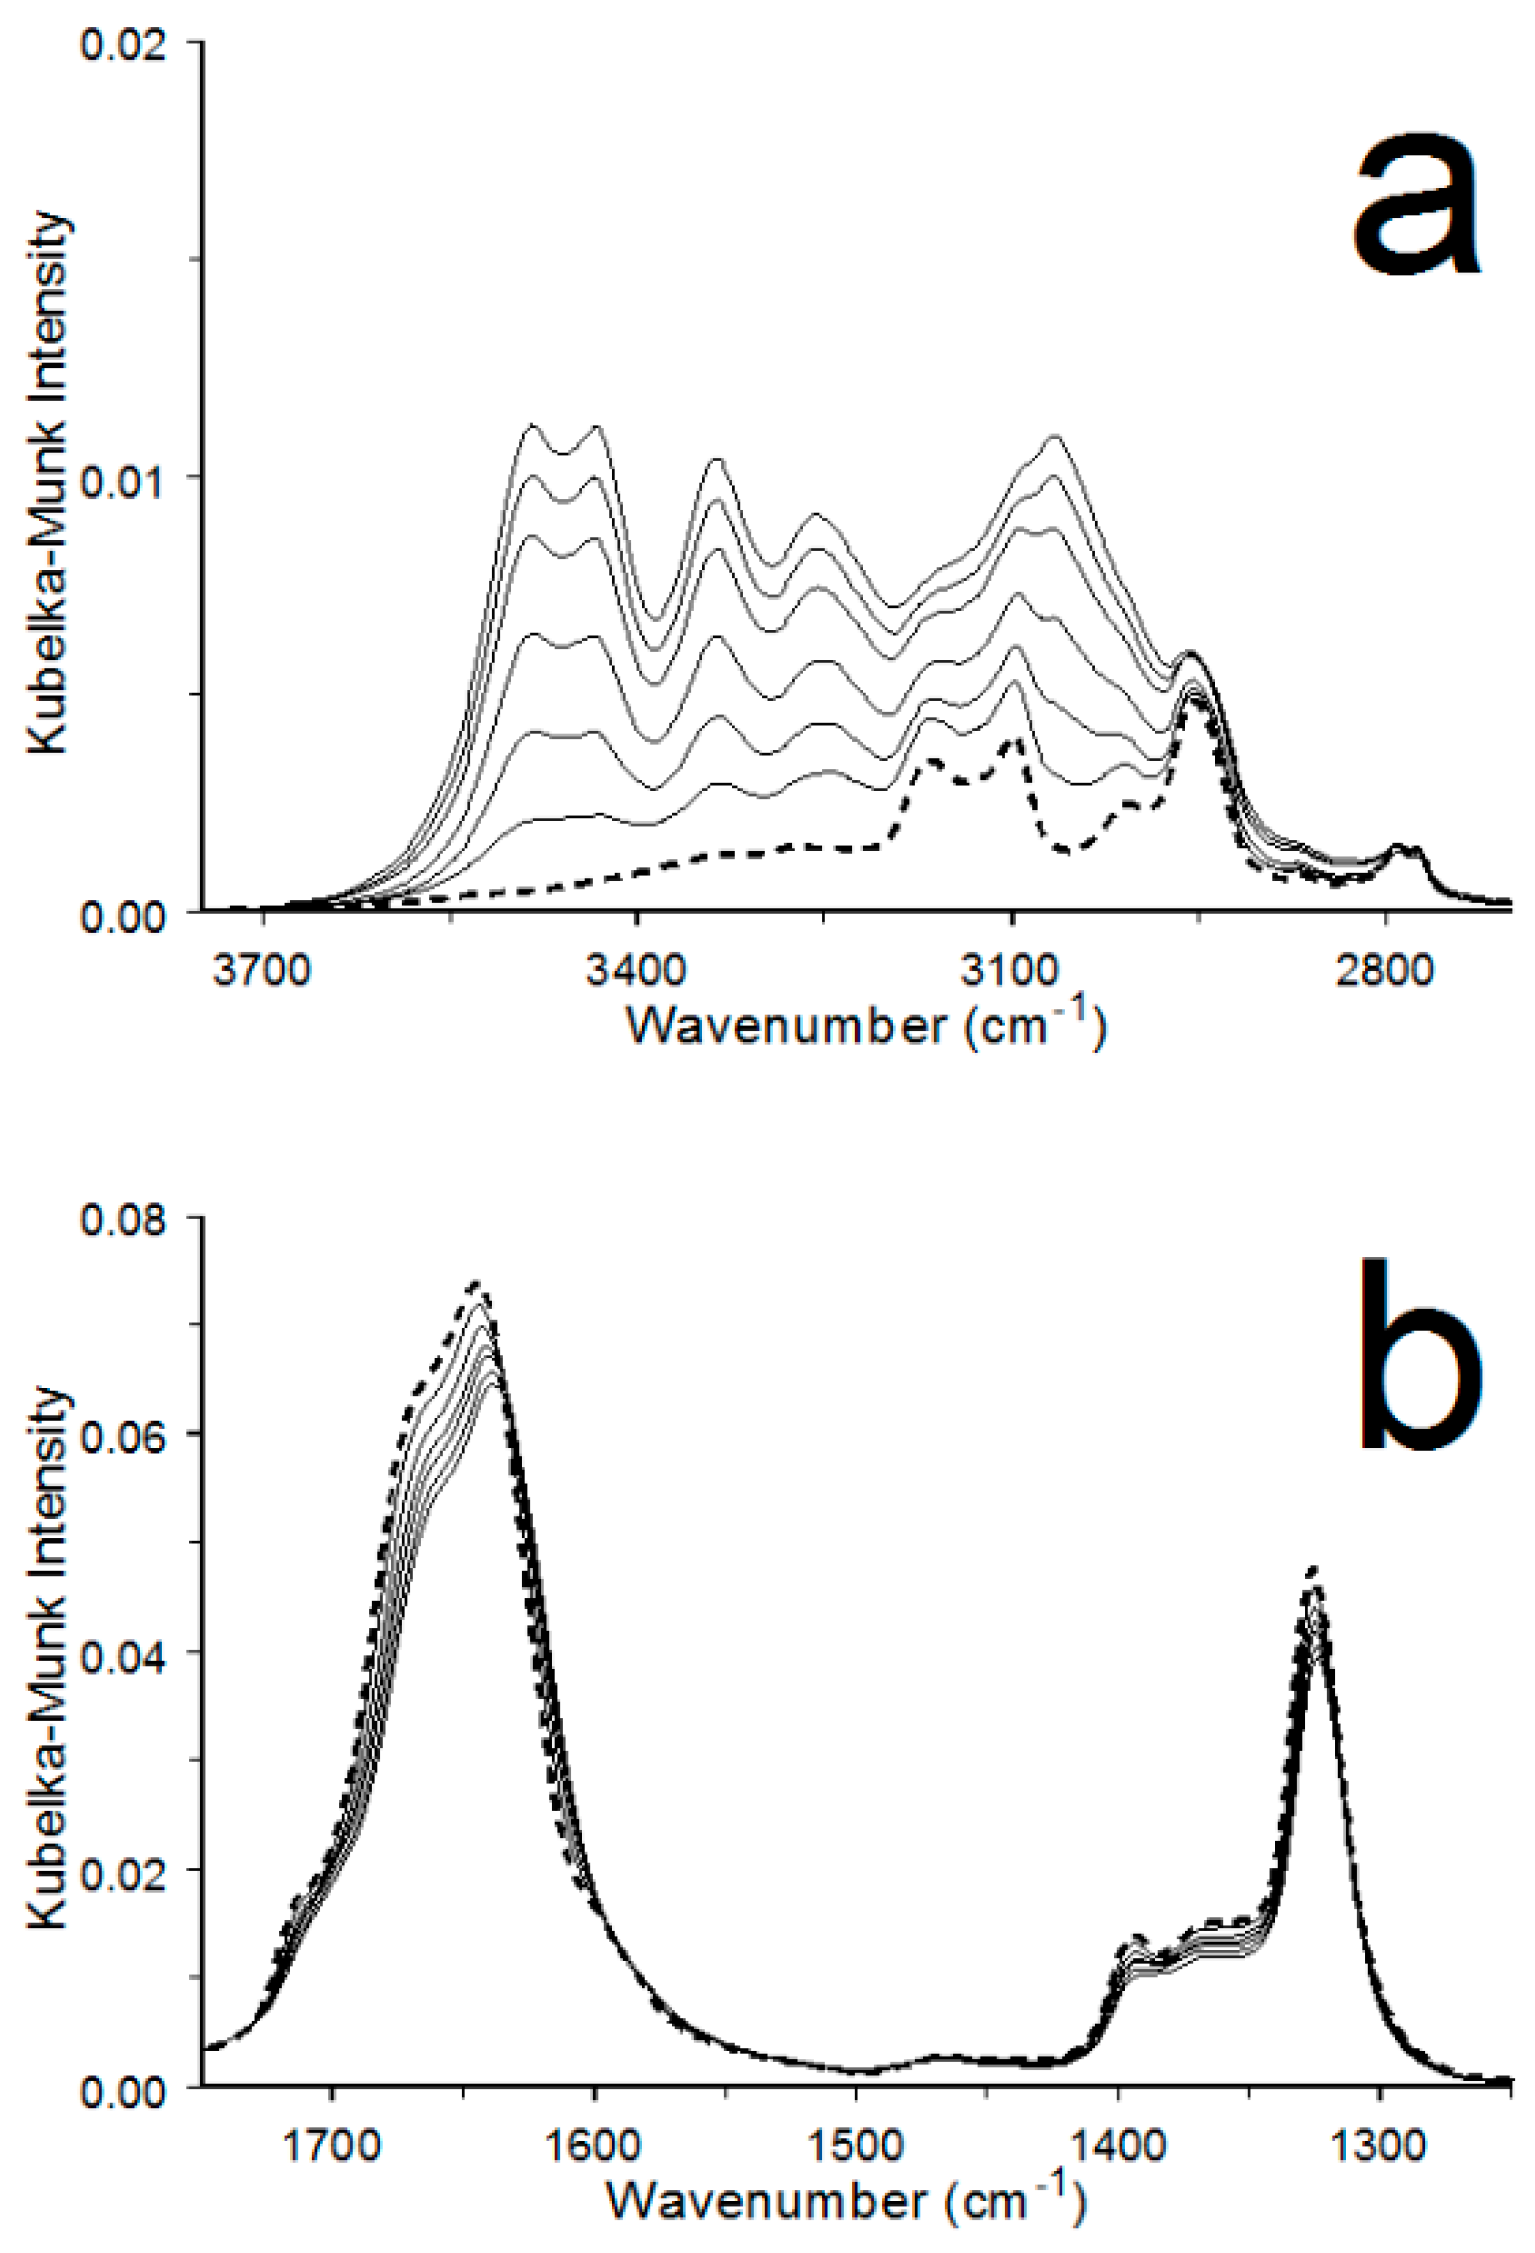
3.2. COM Dehydration

Greater details regarding the COM to α-COA conversion and the stability of the α-COA structure upon cooling were obtained by measuring infrared spectra while heating a COM sample from 30 to 150 °C at 2 °C min−1, immediately followed by cooling back to 30 °C at −2 °C min−1. Because spectra were acquired at 30 s intervals, measurements were performed at ca. 1 °C sample temperature increments. Figure 3a shows plots of the O-H stretching and oxalate anion vibration band areas as a function of the spectrum number. Sample temperatures associated with each spectrum were the average of thermocouple readings performed immediately prior to and after interferogram acquisitions. The dotted line depicts those average temperatures for the 242 infrared spectra. Thick red lines highlight measurements carried out between 60 and 100 °C while heating the sample.
After an initial slight increase, the integrated O-H stretching vibration band area decreased at higher sample temperatures. The sharp drop in the O-H stretching vibration band area was coincident with band area increases for the oxalate anion fundamental vibrations. The smallest integrated O-H stretching vibration band areas, signifying nearly complete dehydration, were obtained between spectrum 72 (100 °Cheating) and spectrum 172 (100 °Ccooling). Residual 3700–2700 cm−1 band areas in these spectra were due to the oxalate combination bands remaining after the O-H stretching vibration bands from water were removed (Figure 2a, red line). Since the O-H stretching vibration band intensities in infrared spectra acquired above 100 °C were near zero, these spectra were representative of α-COA. During sample cooling, the O-H stretching vibration band area noticeably increased after spectrum 175 (97 °Ccooling), but the three oxalate anion band areas did not significantly change (Figure 3a). The water adsorbed by the sample during cooling resulted in an O-H stretching vibration band area increase that was about 9% of the initial COM spectrum band area.
Figure 3b shows trends in the oxalate anion fundamental vibration band wavenumbers throughout the sample temperature program. The νa and νs bands exhibited slight red shifts (i.e., negative offsets) below 60 °C, whereas the νδ wavenumber remained constant. All three bands exhibited abrupt blue shifts at higher temperatures. The νa band exhibited the largest shift (~12 cm−1), the νs band shifted by about 3 cm−1, and the νδ band shifted from 782 to 787 cm−1 (~5 cm−1). The rates at which the oxalate band wavenumbers shifted with temperature were greater than the rates at which the band areas increased. Thus, although significant band area and wavenumber changes were detected between 60 and 100 °C, they exhibited different temperature dependencies, suggesting that the underlying mechanisms responsible for these changes were different. When the sample temperature increased from 100 to 150 °C, the νa and νs bands exhibited small red shifts, whereas the νδ band wavenumber did not change. Upon cooling, Figure 3a shows that the water content continued to be near zero until the temperature dropped below 100 °C, and Figure 3b shows that the νa and νs band wavenumbers gradually increased. The absence of water O-H stretching vibration bands confirmed that the sample was primarily anhydrous above 100 °C. Consequently, the νa and νs band shifts between 100 °Cheating and 100 °Ccooling were likely caused by α-COA crystal lattice expansion and contraction. The fact that these wavenumber trends continued until the sample temperature reached 30 °C suggests that oxalate anions remained primarily in the α-COA configuration during cooling, even though some water returned to the sample. Interestingly, the νδ band wavenumber remained constant throughout sample cooling, suggesting that the α-COA oxalate anion bending vibration frequency was relatively unaffected by temperature or the small amount of adsorbed water.
Figure 4 shows an overlay of the infrared spectra obtained near 100 °Cheating, 150 °C, 100 °Ccooling, and after returning to 30 °C. The significant overlap of the oxalate vibration bands is indicative of consistent anion symmetries at these temperatures. Compared to the other spectra, the 30 °C spectrum contained a higher intensity in the O-H stretching vibration range due to water adsorption. The broad O-H stretching vibration band is representative of water molecules participating in hydrogen bonds of varying strengths. The shoulder above 3400 cm−1 and the 3331 cm−1 maximum are indicative of water molecules in environments similar to W1 and W2 in COM. The 3245 cm−1 peak can be assigned to the H-O-H bending vibration overtone. The weak W1 and W2 bands were superimposed on a broad background, suggesting that most adsorbed water molecules did not adopt conformations comparable to those in COM.
Subtle variations in the Figure 4 spectra are characterized by the Figure 5 difference spectra. Red lines in Figure 5a,b denote variations revealed by subtracting the 100 °C spectrum obtained during heating from the 150 °C spectrum (i.e., 150 °C 100 °Cheating). The broad negative band between 3700 and 3200 cm−1 is consistent with the loss of hydroxyl groups (i.e., water molecules) involved in diverse hydrogen-bonding interactions. Notably, the overlapping O-H stretching vibration band pattern characteristic of COM (Figure 2a) was absent, indicating that water molecules lost by heating the sample from 100 to 150 °C did not originate from COM crystallographic sites. In addition to the water loss, the 150 °C 100 °Cheating difference spectrum in Figure 5b reveals that oxalate anion band shifts and intensity changes occurred over this 50 °C temperature increment. These variations were responsible for the temperature-dependent νa and νs wavenumber shifts above 100 °C in Figure 3b. These band shifts are represented in the Figure 5 difference spectra by intensity losses at wavenumbers where the shifts originated adjacent to intensity gains, where they terminated. When positive and negative difference spectrum areas associated with band shifts were comparable, they effectively canceled each other in integrated area calculations, which is why the Figure 3a band area plots exhibited minimal variations over the 100 °Cheating − 100 °Ccooling temperature range.
The blue lines in Figure 5a,b depict the 100 °Ccooling 150 °C difference spectrum in the O-H stretching (Figure 5a) and oxalate anion vibration (Figure 5b) wavenumber ranges. These plots indicate similar changes as the 150 °C 100 °Cheating plots, but in opposite directions. In fact, the red and blue plots in Figure 5b are nearly mirror images, suggesting that the oxalate vibration band changes that occurred when heating the sample from 100 to 150 °C were reversed by cooling the sample back to 100 °C. As in Figure 5b, the combination band changes in the Figure 5a plots are mirror images. However, above 3200 cm−1, the broad blue line positive offset, attributed to adsorbed water, was smaller than the red line negative offset, indicating that more water molecules were lost by heating from 100 to 150 °C than were gained by cooling from 150 to 100 °C. Since the oxalate anion vibration band changes were not correlated with the loss/gain of O-H stretching vibration band intensities, the Figure 5b difference spectra characterize reversible temperature-dependent α-COA oxalate anion variations.
Figure 5c,d compare the 100 °Ccooling  150 °C (blue) and 30 °Ccooling 100 °Ccooling (green) difference spectra. The broad 3700–2700 cm−1 band in the Figure 5c 30 °Ccooling 100 °Ccooling plot was a consequence of the growth of the water O-H stretching vibration band area near the end of the cooling ramp (Figure 3a). This complex positive intensity profile included contributions from adsorbed water and oxalate combination band shifts. Compared to the Figure 2a O-H stretching vibration bands, the 30 °Ccooling 100 °Ccooling Figure 5c difference spectrum bands were broader, suggesting that initially adsorbed water molecule configurations were more diverse than those in COM. The 30 °Ccooling 100 °Ccooling νa and νs band intensity variations occurred at about the same wavenumbers as the 100 °Ccooling 150 °C changes but were somewhat larger. This suggests that the same νa and νs oxalate vibration band intensity changes detected between 150 and 100 °C continued as the sample cooled to 30 °C. Interestingly, the νa difference spectrum features below 1640 cm−1 (indicated by an asterisk) were more positive in the 30 °Ccooling 100 °Ccooling difference spectrum. This offset was likely due to the intensity contributed by adsorbed water molecule H-O-H bending vibration bands. The intensity loss at 787 cm−1 in Figure 5d (indicated by an arrow) was unexpected because the 100 °Ccooling 150 °C difference spectrum exhibited a slight intensity increase. Although the α-COA oxalate bending vibration band wavenumber was relatively constant throughout sample cooling, the intensity of this band was sensitive to small quantities of adsorbed water.
Infrared spectra acquired by using a step heating program (Figure 6) were used to distinguish between COM and α-COA crystal lattice expansion/contraction and sample dehydration/rehydration. After measuring an infrared spectrum at 30 °C, TLow(1), the sample was quickly heated (2 °C s−1) to 40 °C, THigh(1). After equilibrating at 40 °C for 10 s, another spectrum was measured. The sample was then quickly cooled back to 30 °C, TLow(2), and a third spectrum was obtained. This automated procedure was repeated with THigh temperatures that increased to 120 °C in 10 °C increments. Reversible and irreversible temperature-dependent spectrum changes were elucidated from the spectra acquired at TLow(n), THigh(n), and TLow(n + 1) [16]. Sample variations caused by heating were identified by subtracting the TLow(n) spectrum from the THigh(n) spectrum. Negative features indicated wavenumbers where the THigh(n) spectrum intensity was reduced, whereas positive offsets indicated intensity gains. When multiple processes contributed to overlapping intensity variations, difference spectra represented the net changes. Spectrum variations that were reversed after cooling the sample were absent in TLow(n + 1) − TLow(n) spectrum subtractions, revealing only those changes that were irreversible on the measurement timescale. Conversely, because infrared spectra acquired at THigh(n) and TLow(n + 1) contained the same heat-induced irreversible features, only reversible changes were apparent in the THigh(n) TLow(n + 1) difference spectra. Since COM and α-COA crystal lattice expansions and contractions occurred concurrently with sample heating and cooling, spectrum variations associated with these changes were reversible. In contrast, temperature-dependent sample dehydration was mostly irreversible because the low water vapor concentration in the FTIR sample compartment resulted in slow water adsorption rates.
Figure 7 shows difference spectra representing the reversible (left) and irreversible (right) changes that resulted from heating a COM sample in 10 °C steps between 40 and 120 °C. Whereas reversible changes were detected for each temperature step, significant irreversible changes occurred primarily between 80 and 100 °C. The five overlapping bands between 3500 and 3000 cm−1 associated with crystallographic water molecules exhibited reversible intensity losses at every temperature step. Between 100 and 120 °C, intensity losses were smaller and relative band intensities were comparable to those in the Figure 2a COM spectrum. At lower temperatures, losses at 3433 cm−1 (W1) were consistently greater than those at 3486 cm−1 (W2). The reversible νa oxalate band intensity profiles differed with temperature, whereas νs band variations revealed similar wavenumber shifts, but with varying amplitudes. The reversible νδ band intensity changes indicate wavenumber shifts in different directions, depending on the temperature. The largest irreversible changes were detected between 80 and 100 °C. Water and oxalate vibration band difference spectrum features at these temperatures had similar shapes. Positive oxalate anion band features dominated these difference spectra because intensity gains due to increased α-COA sample content effectively canceled smaller overlapping negative offsets associated with COM loss. The Figure 7 irreversible changes were attributed to the COM to α-COA conversion, whereas the much smaller reversible changes were likely due to COM and α-COA crystal lattice expansions.

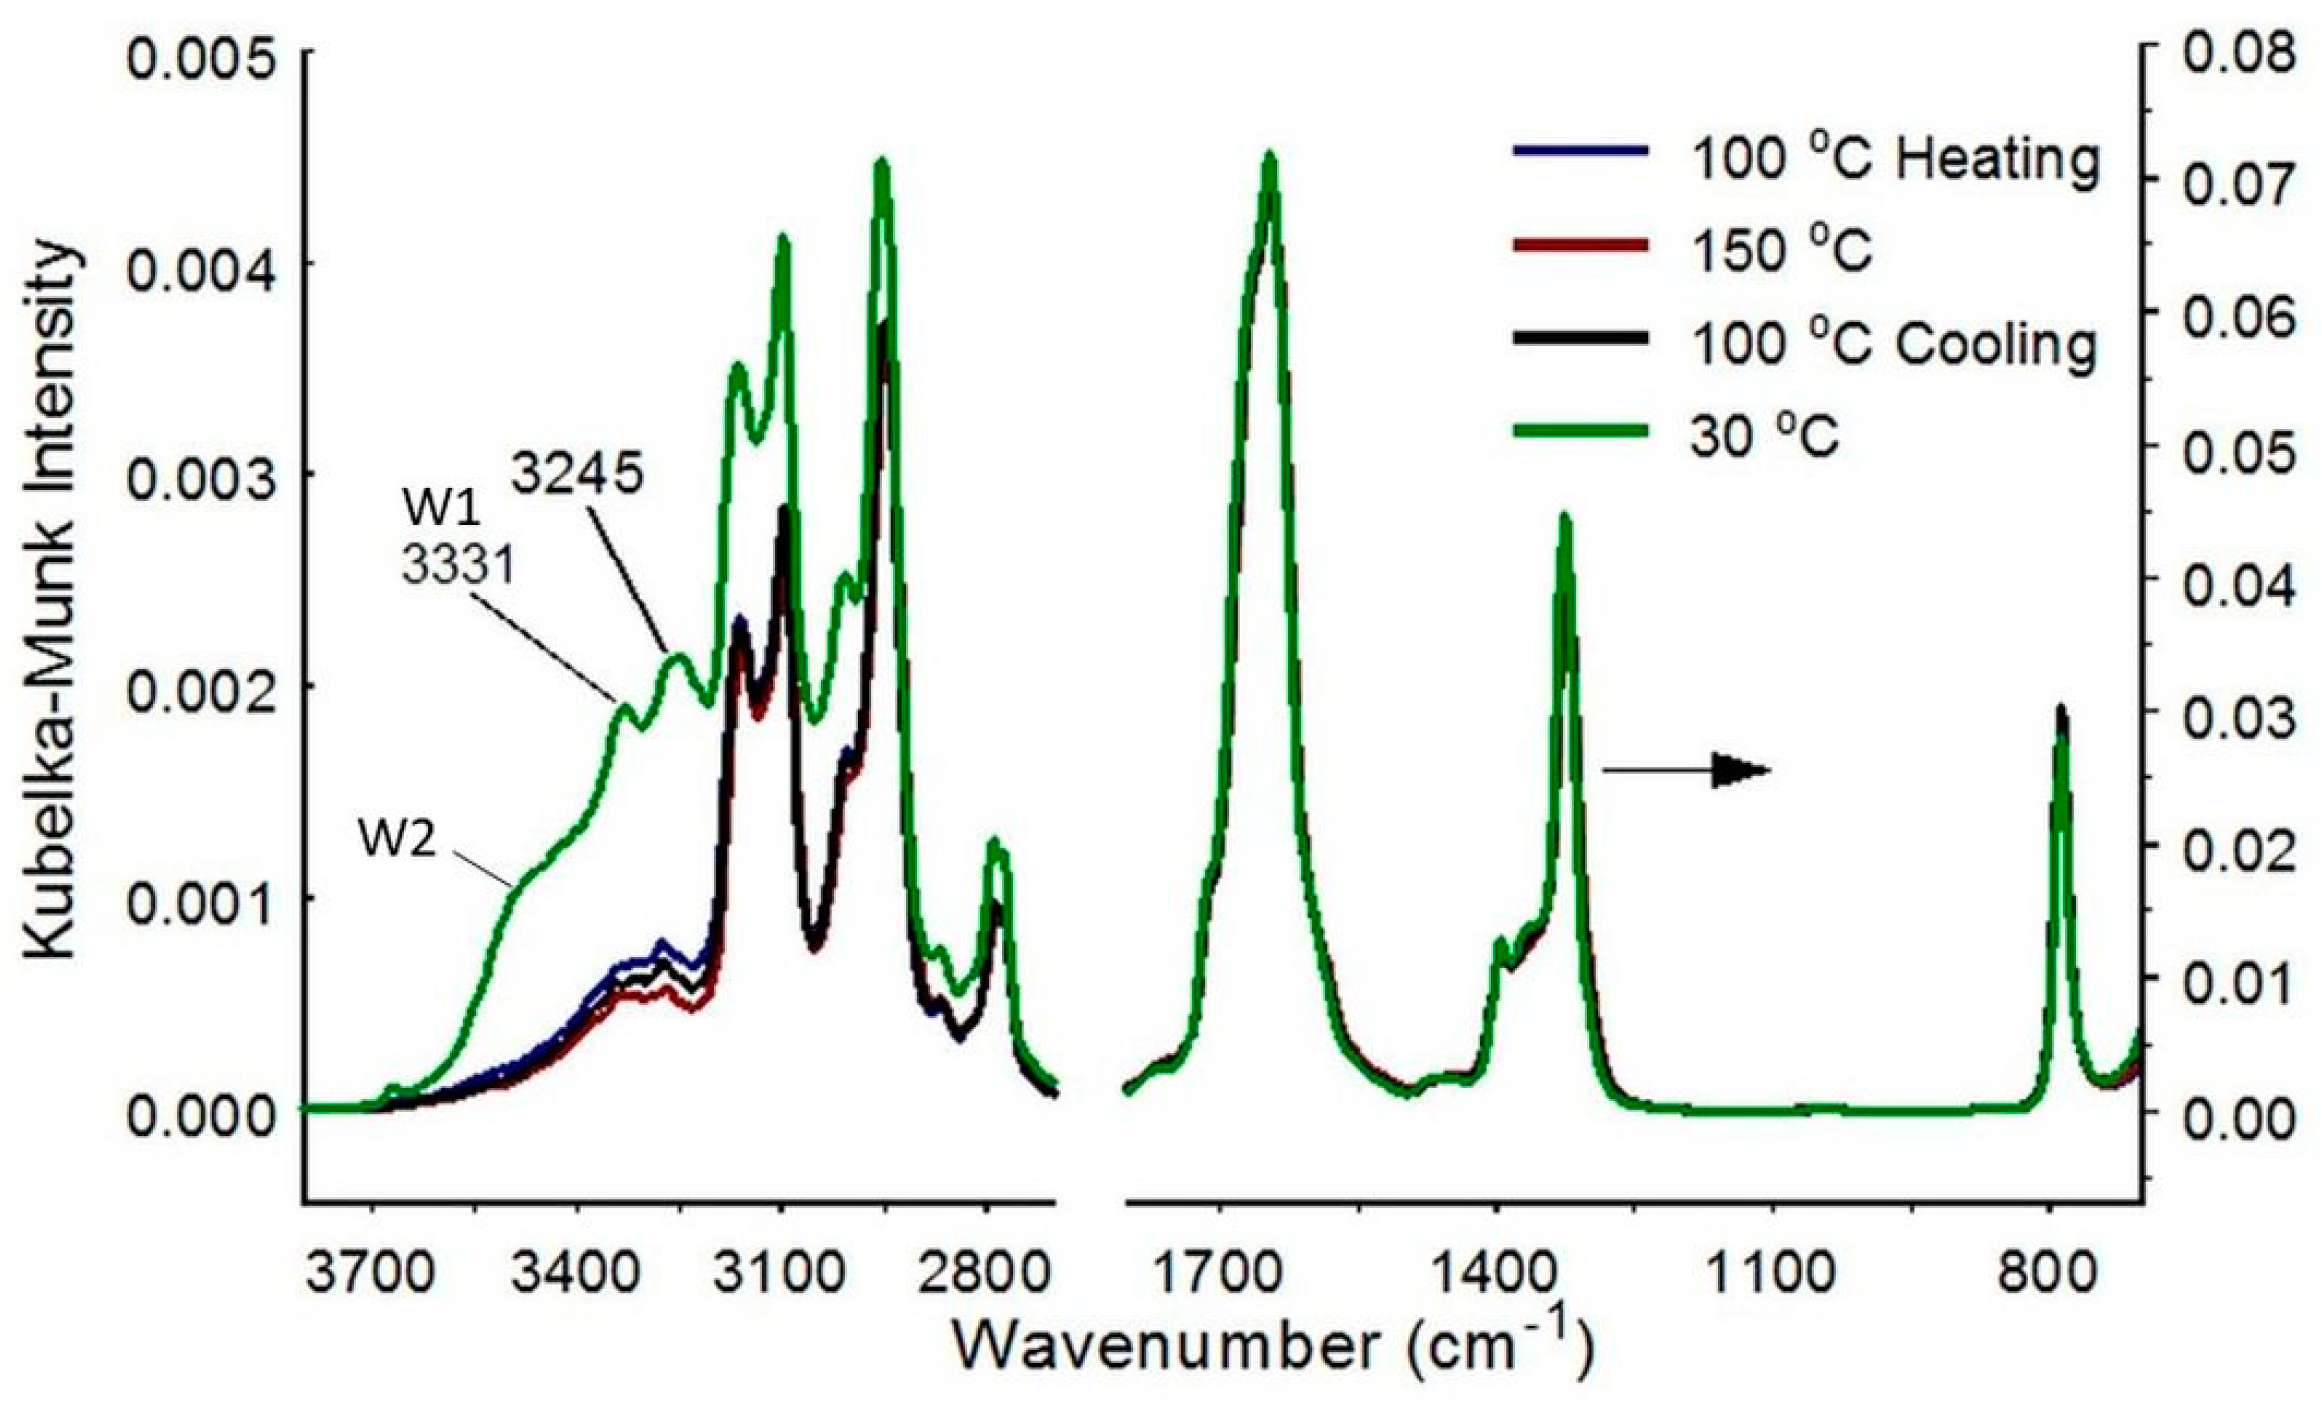
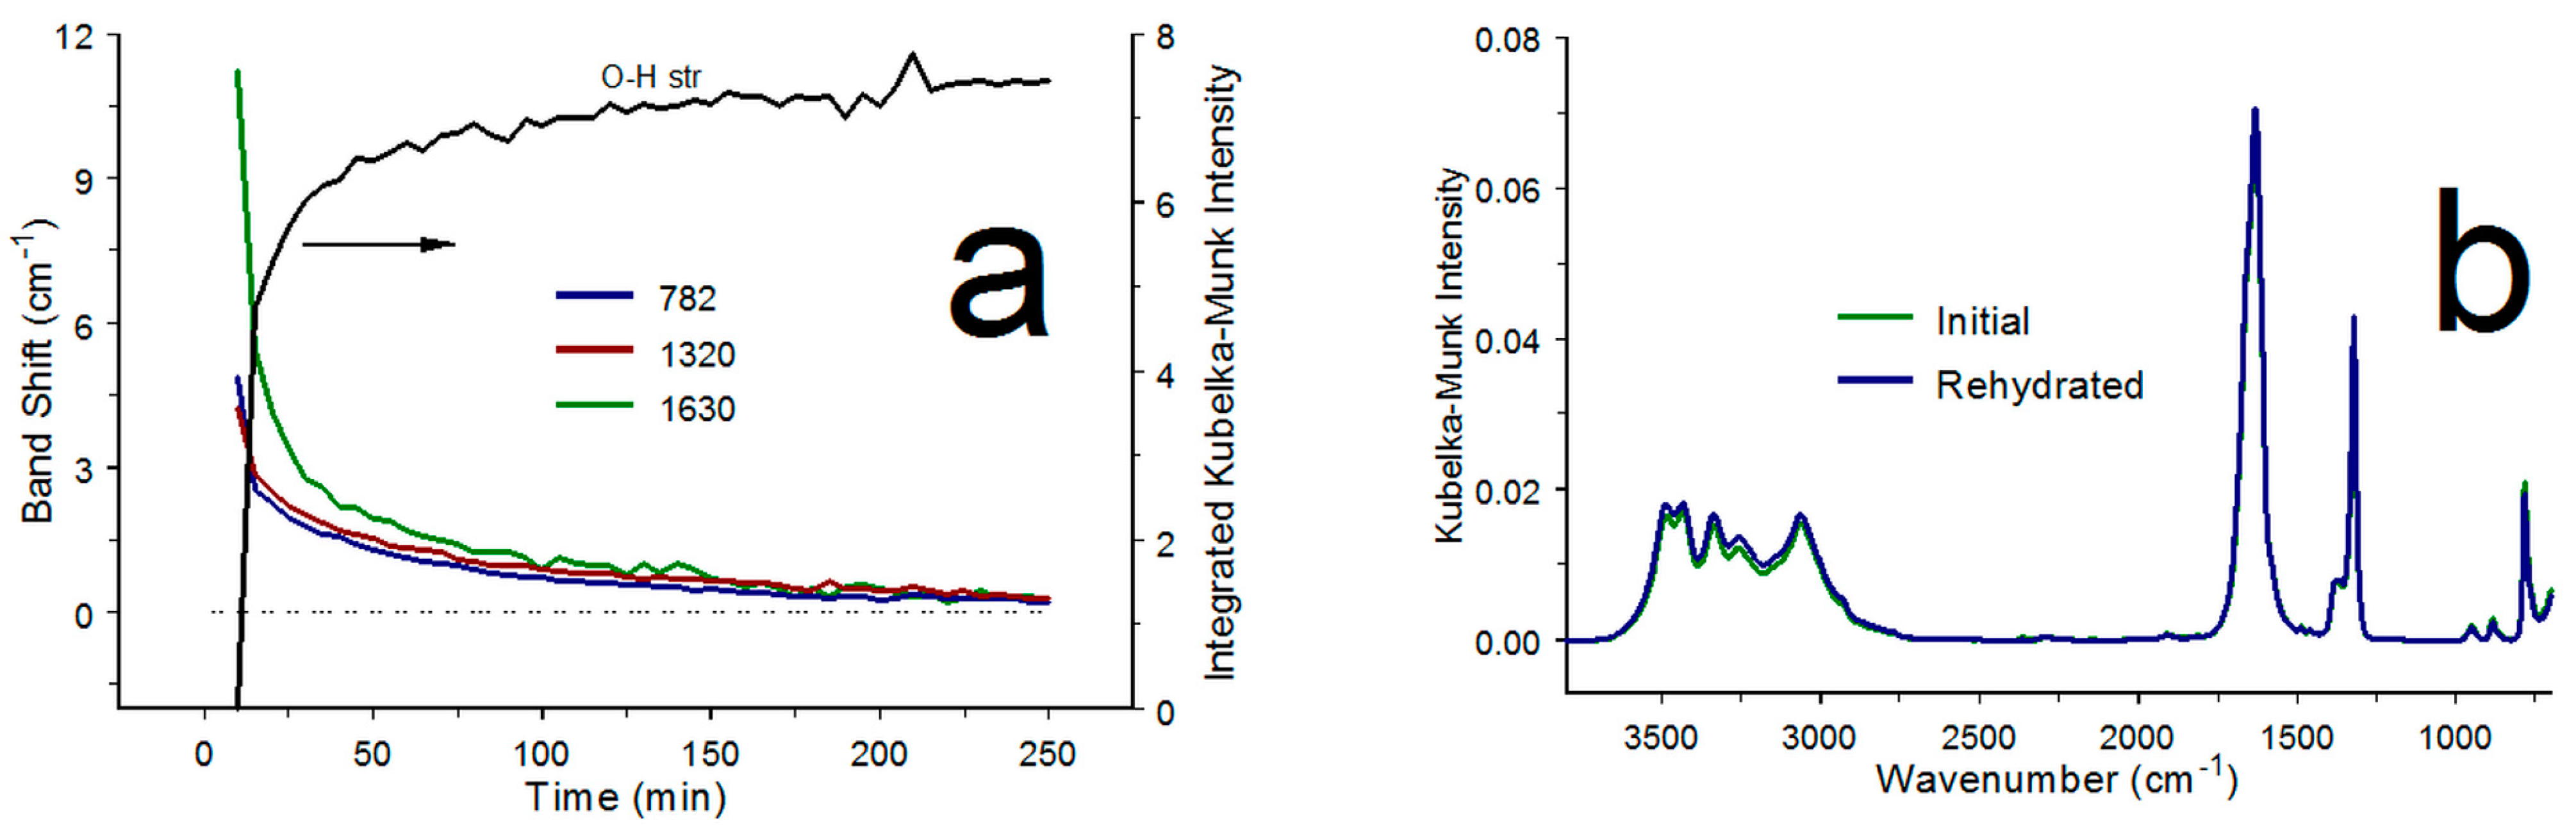
3.3. α-COA Rehydration

The effects of exposing α-COA to the water vapor contained in the FTIR purge gas were investigated by monitoring infrared spectrum changes isothermally as a function of time. After heating a COM sample to 150 °C for 5 min, the resulting α-COA material was cooled at −2 °C s−1 to 10 °C. Infrared spectra were then measured at ca. 30 s intervals for an hour. The 10 °C temperature was selected to promote fast water adsorption rates while avoiding ice formation. Figure 8 shows the 3750–2750, 1750–1250, and 820–750 cm−1 regions of selected infrared spectra acquired over a 1 h period. Dotted lines denote the spectrum obtained immediately after equilibration at 10 °C and solid lines depict six spectra obtained at 10 min intervals. Figure 8a shows that the water O-H stretching vibration bands became more intense and sharper with time. The last acquired spectrum resembled the O-H stretching vibration band region in the 30 °C COM spectrum (Figure 2a). The oxalate vibration band changes are shown in Figure 8b,c. The νa band (1643 cm−1) became sharper, shifted to a lower wavenumber, and decreased in intensity with time. The vs vibration band (1323 cm−1) exhibited similar behaviors, but with smaller changes. When compared to Figure 2b, the νa band wavenumber after 1 h was higher (1638 cm−1) than for pure COM (1631 cm−1), indicating incomplete rehydration. The 787 cm−1 νδ bending vibration band (Figure 8c) also lost intensity and shifted to lower wavenumbers. However, unlike the νa and νs bands, the width of this band increased, primarily by spreading to lower wavenumbers.
Incremental time-dependent spectrum changes are revealed by the Figure 9 plots, obtained by subtracting the successively acquired Figure 8 spectra. For reference, the COM water (Figure 2a) and Figure 5d (30 °Ccooling 100 °Ccooling) α-COA oxalate difference spectrum peak wavenumbers are indicated by vertical dotted lines. The O-H stretching vibration band centers align with the COM wavenumbers, suggesting that the water molecules that adsorbed during the 1 h isothermal period adopted configurations comparable to W1 and W2 in COM. Intensities for these positive residuals diminished with time, which is consistent with a previous report that water adsorption rates decrease with time [36]. The Figure 9b,c negative peak wavenumbers were close to those for the positive difference spectrum peaks detected when cooling α-COA from 100 to 30 °C at 2 °C min−1 (Figure 5d), and those in the Figure 7 100 °C irreversible difference spectrum. The 1682 and 1647 cm−1 negative difference spectrum features became broader and exhibited slight red shifts with increasing time. Figure 9c shows that the 787 cm−1 band intensity losses were coupled with higher intensities at lower wavenumbers (i.e., red shifts) and that the increased intensity was distributed over a broader wavenumber range at longer times.
The rehydration process characterized by Figure 6, Figure 7 and Figure 8 was slow and incomplete due to the low water vapor content of the dry-air FTIR purge gas. To achieve accelerated rehydration, an α-COA sample was exposed to higher water vapor concentrations by periodically moving it into room air. For these measurements, the sample temperature was maintained at 30 °C and infrared spectra were acquired after 5 min room-air exposures. The 15% relative humidity (RH) in the room was much higher than the FTIR water vapor content. Fifty-two infrared spectra were measured, representing a 260 min total exposure period. Figure 10a shows plots of the O-H stretching vibration band integrated area as a function of exposure time, along with oxalate band wavenumber offsets relative to the 30 °C COM spectrum. Based on the O-H stretching vibration band integrated area, the rate of water adsorption exponentially decreased with time. The plots of oxalate vibration band wavenumber offset versus time also exhibited exponentially decreasing trends. These plots gradually approached the horizontal dashed line at zero offset, which represents a return to the 30 °C COM band wavenumbers. As shown by Figure 10a, the α-COA to COM conversion was nearly complete after exposing the sample to room air for 260 min.
Figure 10b shows an overlay of the initial COM spectrum measured at 30 °C (green) and the final spectrum (blue), obtained after heating the sample to 120 °C, cooling to 30 °C, and then exposure to room air for a total of 260 min. These spectra are nearly identical, except that the water O-H stretching vibration band intensities were slightly higher in the final (rehydrated) spectrum. This difference may be attributed to long-term (>4 h) FTIR instrument drift or may indicate that the rehydrated sample contained more water. The latter is possible because, compared to the final 30 °C spectrum measurement, the initially loaded COM sample was exposed to the dry-air FTIR purge environment and infrared source radiation for a longer time, which would be expected to cause some dehydration.

4. Discussion

4.1. COM Dehydration Temperature Range

The most significant irreversible infrared spectrum changes occurred between 80 and 100 °C. When compared to results from previously reported COM thermal analyses, the COM to α-COA transition occurred at a lower temperature and over a smaller temperature range. This was most likely a consequence of the unique sample holder design employed for the studies described here. Thermal analysis sample property versus temperature trends are determined by numerous factors, including: sample holder geometry, sample mass and particle size, the heat transfer characteristics of the sample and its surroundings, and the atmosphere composition [37]. In particular, non-isothermal reactions tend to occur at lower temperatures when smaller sample masses and slower heating rates are employed for thermal analyses [38]. COM dehydration and rehydration rates were dependent on the ambient water vapor concentration. However, even with dry-air purging, local water vapor partial pressures can be high when water molecules liberated within the bulk sample must traverse long diffusion paths before escaping [39]. Based on a computational treatment of COM thermal dehydration, Blazejowski and Zadykowicz predicted that the COM to α-COA transition should proceed at 80 °C under equilibrium conditions [40]. In fact, by using DSC with a 1.25 °C min−1 heating rate and 5 mg sample mass, the start of this transition was detected at 85 °C [36]. In the studies described here, a small sample mass (<1 mg) consisting of particles with typical diameters of a few microns was employed. Samples were spread in a thin layer that was evenly heated. Because desorbed water molecule diffusion paths were short, the dehydration transition temperature range was narrow and COM to α-COA conversion was detected, beginning at about 80 °C.
Although irreversible sample changes were not detected below 80 °C (Figure 7), the plots in Figure 3 indicate that infrared band intensity changes and wavenumber shifts occurred at these temperatures. Trends in the Figure 3 plots below 80 °C while heating COM were indicative of reversible temperature-dependent changes, mostly associated with COM crystal lattice thermal expansions. It is reasonable to expect that these reversible changes continued between 80 and 100 °C. In addition, α-COA crystal lattice thermal expansions increasingly contributed to reversible changes detected over this temperature range. Thus, because the Figure 3 plots represent multiple, simultaneously occurring sample changes, it would be inappropriate to attribute these profiles to a specific process, such as sample dehydration.

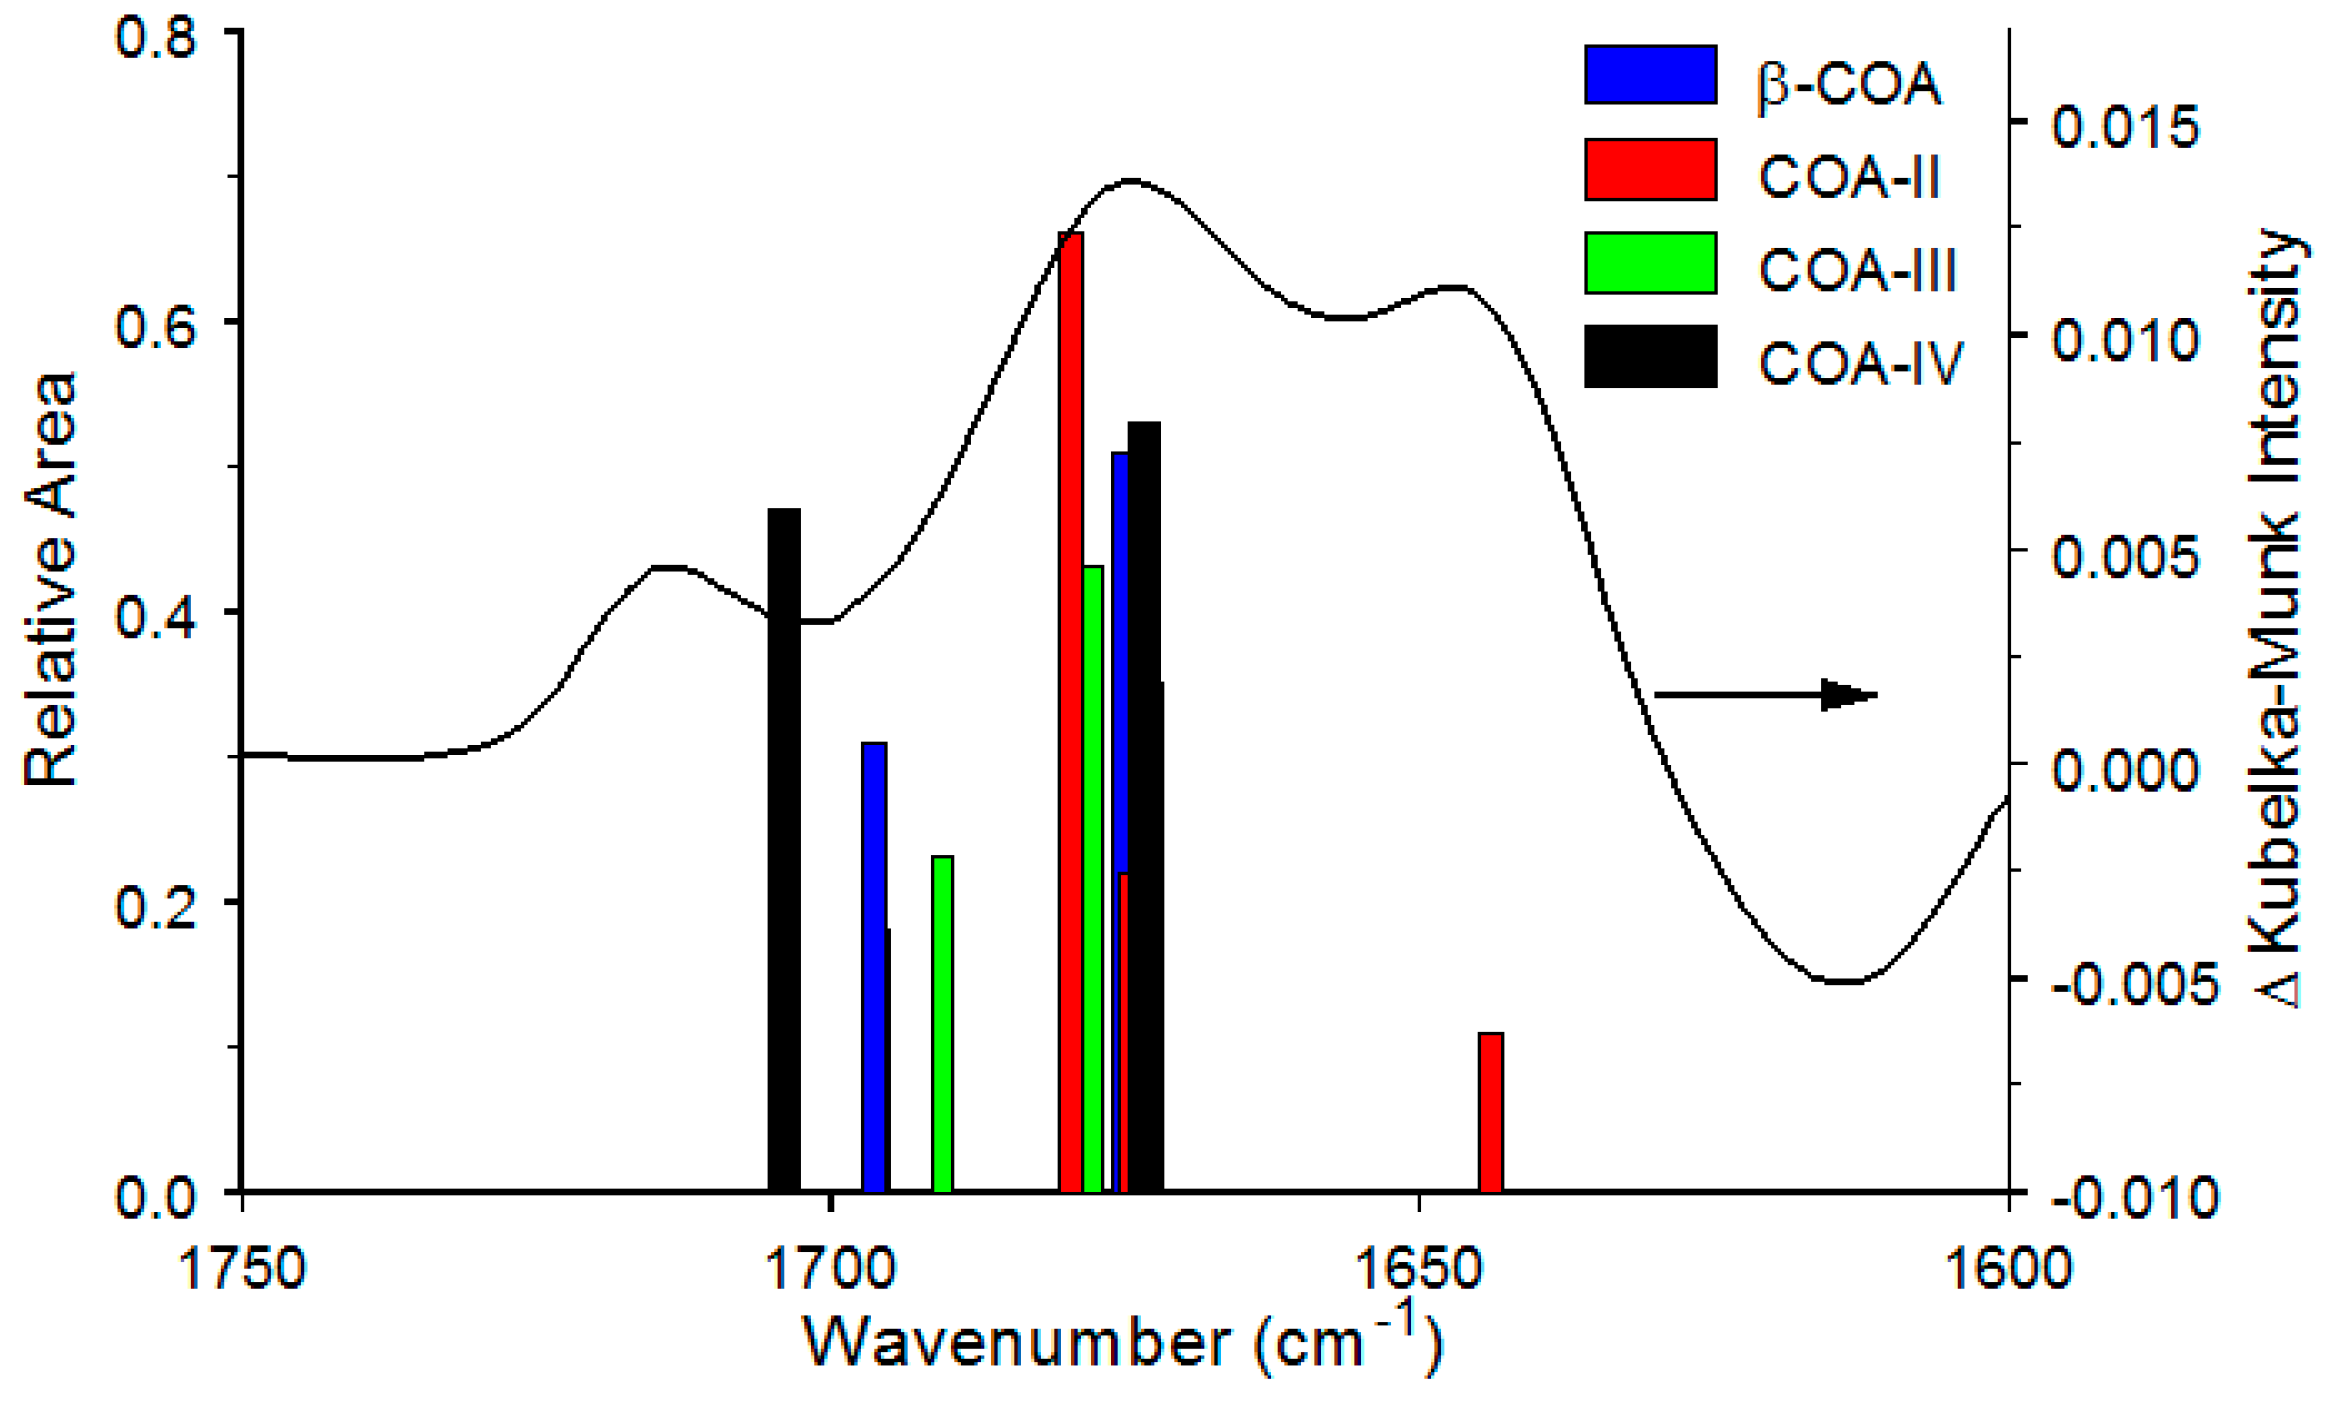
4.2. Distinguishing Dehydration from Crystal Lattice Expansions

The COM crystal is characterized by the P21/c space group [21]. Two distinct oxalate anion configurations lie in the 100 plane [41]. One of these is nearly planar, the other exhibits a slight C-C bond twist. The symmetries of these anions are C2h and D2h, respectively [18]. Water molecules adopt two orientations (W1 and W2). W1 and W2 are hydrogen-bonded to oxalate anions and coordinated to Ca2+ through their oxygen atoms. These non-equivalent water molecules are connected by hydrogen bonding. When heated, water molecules are displaced from the monohydrate, producing anhydrous calcium oxalate (COA). In a dry environment, α-COA eventually transforms to the more stable β-COA configuration [22]. The β-COA crystal space group is P2/m, with two distinct oxalate anion configurations [21]. One oxalate anion is coordinated to four Ca2+ ions, whereas the other is planar and surrounded by six Ca2+ ions [24].
Trends in variable-temperature infrared spectra suggest that sample changes could be attributed to the combined effects of water loss/gain and thermal expansion/contraction of COM and α-COA crystals. Dehydration and temperature-dependent crystal changes can be distinguished by comparing Figure 7 difference spectra. Figure 7 (left) shows that COM water O-H stretching vibration band intensities decreased at sample temperatures between 40 and 70 °C, with the greatest intensity losses associated with the 3433 cm−1 W1 band. This trend is consistent with the findings of Christy et al. [33]. They postulated that W1 and W2 waters were simultaneously lost when COM was heated, but that the initial rate of W1 loss was higher than the W2 loss rate [33]. The results shown in Figure 7 are inconsistent with this hypothesis because no irreversible changes (i.e., permanent water losses) were detected below 80 °C. The 40–70 °C reversible changes were more likely due to COM crystal lattice thermal expansions that preferentially impacted the W1 O-H stretching vibrations.
Irreversible changes between 80 and 100 °C were much greater than the corresponding reversible changes. The irreversible changes were consistent with sample dehydration, whereas the corresponding reversible changes were primarily indicative of thermal expansions of COM and α-COA crystals. Relative intensities for the negative irreversible O-H stretching vibration bands detected over this temperature range were comparable to those in Figure 2a, suggesting that they represented loss of COM water molecules and that the W1 and W2 loss rates were comparable. The impact of irreversible water loss on the oxalate anion vibrations was dramatic. Intensities increased near 1715, 1670, and 1650 cm−1, a sharp band at 1400 cm−1 appeared, and intensity increased near 1320 and 790 cm−1. These changes are indicative of transformations from COM to α-COA (Figure 2).

4.3. α-COA Temperature-Dependent Characteristics

When the sample was heated at 2 °C min−1, very little water was detected in infrared spectra obtained above 100 °C (Figure 3a). The absence of the characteristic COM overlapping water O-H stretching vibration band pattern (Figure 2a) in Figure 5a suggests that the small amount of water remaining at these temperatures was randomly adsorbed to crystal surfaces. The mirror image relationship between the Figure 5b plots indicated that oxalate anion changes above 100 °C were reversible. Thus, the Figure 5a,b difference spectrum features and Figure 3b band wavenumber trends above 100 °C can be attributed to reversible thermal expansion (heating) and contraction (cooling) of the α-COA crystal structure.
The Figure 7 plots indicated that reversible water loss occurred after step heating to 110 and 120 °C. The negative O-H stretching vibration band features can be attributed to loss of a small amount of water that adsorbed when α-COA was cooled to 30 °C prior to the 110 and 120 °C heating steps. Interestingly, the reversible νδ wavenumber shifts exhibited by these spectra differed from the changes detected at lower temperatures. In fact, the oxalate bending vibration band was particularly sensitive to sample structure changes during the COM to α-COA transition. Figure 2b shows that the α-COA band intensity was about twice that for COM. As a result, the 787 cm−1 intensity significantly decreased after water was adsorbed by α-COA (Figure 5d, arrow pointing to green line). Similarly, the ca. 782 cm−1 intensity losses coupled with increases at 787 cm−1 in the 110 and 120 °C Figure 7 reversible difference spectra can be assigned to some COM conversion to α-COA. In contrast, the red shifting of the ca. 787 cm−1 band to 778 cm−1 in the 150 100 °Cheating difference spectrum (Figure 5b, red line) was representative of α-COA crystal lattice thermal expansion. Similar red shifts in the 110 and 120 °C temperature step difference spectra likely occurred but were masked by the larger and opposite COM to α-COA intensity variations.
Zhao et al. employed quantum mechanical modeling and X-ray diffraction measurements to postulate α-COA structure candidates [22]. X-ray diffraction spectra alone were insufficient for determining the α-COA crystal structure because of the unavoidable presence of overlapping features from COM and β-COA phases. They proposed a structure designated as COA-III, derived from β-COA/water model systems, as the most probable α-COA structure. Using temperature-dependent X-ray powder diffraction measurements, Izatulina et al. proposed that the Zhao et al. COA-IV structure, derived by deleting water molecules from the COM structure and re-optimizing, was a closer match to the α-COA structure [21]. The oxalate orientations in the COA-III and COA-IV models differ slightly but are similar to those in COM and β-COA. Zhao et al.’s calculations predicted νs and νδ infrared bands at similar wavenumbers for all models that were consistently higher than the experimentally measured values [22]. Vibrational bands with significant intensities near 1700 and 1680 cm−1 were predicted for the β-COA, COA-III, and COA-IV models. Interestingly, peaks appear near these wavenumbers in the 150 100 °Cheating and 100cooling  150 °C difference spectra (Figure 5b), the irreversible 100 °C step difference spectrum, and the six difference spectra representing α-COA hydration in Figure 9b. In each instance, positive peaks near 1720, 1680, and 1650 cm−1 were detected when the α-COA sample content increased and negative peaks at similar wavenumbers were observed when it decreased. The largest changes were always detected near 1680 cm−1. Figure 11 compares a representative positive difference spectrum profile (Figure 7, irreversible 100 °C step) representing an increase in α-COA sample content, with bar graphs denoting proposed α-COA wavenumbers and relative areas calculated based on models for β-COA and the three α-COA structure candidates considered by Zhao et al. [22]. All the models predicted significant infrared absorbance near 1680 cm−1. The β-COA, COA-III, and COA-IV results predicted vibration bands above 1680 cm−1 but did not account for the band near 1650 cm−1. The COA-II results included a small peak near 1650 cm−1, but nothing near 1700 cm−1. Unfortunately, oxalate anion difference spectrum features representing transitions between the monohydrate and anhydrous calcium oxalate forms could not be used to confirm which postulated structure was correct.

4.4. α-COA Hydration

Figure 12 compares the crystallographic water O-H stretching vibration regions of spectra acquired while heating COM at 2 °C min−1 and successively measured over a 1 h period after rapidly cooling α-COA from 150 to 10 °C. Oxalate combination bands were removed from these spectra by subtracting the α-COA infrared spectrum obtained at 150 °C. Trends in the Figure 12a spectra reflect the combined effects of sample dehydration and thermal expansion of the COM and α-COA crystals. The upper five plots, representing temperatures between 35 and 55 °C, exhibit 3433 cm−1 W1 band blue shifts and intensity losses, whereas the 3486 cm−1 W2 band was largely unaffected by heating. Above 55 °C, the intensities of all the water vibration bands decreased and all bands significantly broadened. Different trends are evident in Figure 12b. The gradual increase in the O-H stretching vibration band intensity with time was due to hydration of α-COA. As the bands became narrower with time, their relative intensities and wavenumbers remained consistent. Because these measurements were performed isothermally, successively acquired spectra did not exhibit temperature-dependent crystal lattice changes. Thus, the band broadening, intensity loss, and peak shifting detected below 80 °C in Figure 12a were most likely associated with the thermal expansion of the COM crystal lattice.
The initial α-COA water adsorption rate depended on the sample temperature and water vapor concentration. Figure 5d differences indicated that the water adsorbed when α-COA was cooled below 100 °C interacted with oxalate anions, causing the 787 cm−1 band intensity to diminish. These interactions were likely via hydrogen bonding between water hydrogens and oxalate oxygens. After some waters attached to the α-COA crystal surface, additional water molecules could adsorb by hydrogen bonding to these “anchor” waters. The resulting hydrogen-bonded water network would exhibit a broad O-H stretching vibration band profile due to the large disparity in hydrogen-bonding interaction strengths. In contrast, the Figure 12b spectra suggested that water molecules adsorbing isothermally at 10 °C quickly adopted W1 and W2 COM conformations.
Comparing Figure 2a and Figure 8a reveals that less than 50% rehydration was achieved after 1 h when the α-COA sample was contained in the FTIR purge environment at 10 °C. When exposed to room air, the plots in Figure 10 indicated that nearly 90% rehydration occurred after 1 h. Since the rate of water adsorption by the sample decreased with time [36], about 4 h was required to attain full rehydration in room air. This behavior is consistent with a previous study of the reversibility of COM dehydration, which found that the process was completely reversible between 25 and 200 °C. Furthermore, when the atmosphere was saturated with water vapor, complete rehydration was achieved after 135 s at 25 °C [42].

5. Conclusions

The thermal analysis approach described here was employed to correlate subtle changes in infrared spectra caused by temperature perturbations of powdered samples to COM and α-COA structure variations. By employing various sample temperature programs, different aspects of the COM to α-COA and α-COA to COM transformations were characterized. Infrared spectroscopic results revealed evidence of two processes. Water desorption was detected by decreased O-H stretching vibration band intensities coupled with oxalate anion band intensity variations and wavenumber shifts. When sample temperatures were below those required for water liberation, O-H stretching and oxalate anion vibration band changes resulted from thermal expansion of the COM crystal lattice. Although both processes could be reversed by cooling, they were distinguishable under low water vapor concentration conditions because rehydration required more time than crystal lattice contraction. Thus, on the timescale of the variable-temperature infrared spectrum measurements, water desorption was effectively irreversible, whereas COM crystal expansion was reversible.
The results described here illustrate the high sensitivity of a variable-temperature infrared spectroscopy apparatus employing a button sample holder and thermoelectric heating/cooling. Since heat was selectively transferred to/from the sample holder, the temperature inside the FTIR sample compartment remained relatively constant during measurements. Sample holder expansion and contraction, which can cause temperature-dependent spectrum artifacts, were minimized because the heated components of the apparatus were thin and comprised of materials with low thermal expansion coefficients (i.e., ceramic and stainless-steel). Consequently, subtle temperature-dependent spectrum variations caused by small sample changes could be reliably characterized. The analysis methodology outlined here should be applicable for investigations of a variety of minerals, particularly those containing water, such as zeolites and clays. Due to the complexity of the overlapping temperature-dependent vibrational spectrum changes revealed by this approach, spectral interpretations should be guided by vibrational frequencies and relative band intensities obtained from molecular modeling calculations.

Funding

This research received no external funding.

Data Availability Statement

Data are available upon request.

Conflicts of Interest

The author declares no conflict of interest.

References

  1. Nascimento-Dias, B.L.D. Overview about Raman spectroscopy of types of olivine group minerals: A brief review. J. Raman Spectrosc. 2022, 53, 1942–1946. [Google Scholar] [CrossRef]
  2. Petit, S.; Righi, D.; Madejova, J. Infrared spectroscopy of NH4+-bearing and saturated clay minerals: A review of the study of layer charge. App. Clay Sci. 2006, 34, 22–30. [Google Scholar] [CrossRef]
  3. Bahfenne, S.; Frost, R.L. A review of the vibrational spectroscopic studies of arsenite, antimonite, and antimonate minerals. Appl. Spectrosc. Rev. 2010, 45, 101–129. [Google Scholar] [CrossRef] [Green Version]
  4. Armenta, S.; Guardia, M.D.L. Vibrational spectroscopy in soil and sediment analysis. Trends Environ. Anal. Chem. 2014, 2, 43–52. [Google Scholar] [CrossRef]
  5. Ditler, E.; Luber, S. Vibrational spectroscopy by means of first-principles molecular dynamics simulations. WIREs Comput. Mol. Sci. 2022, 12, e1605. [Google Scholar] [CrossRef]
  6. Noneman, H.F.; Hollingsworth, M.E.; Singh, J.; White, R.L. A high sensitivity variable temperature infrared spectroscopy investigation of kaolinite structure changes. Spectrochim. Acta A Mol. Biomol. Spectrosc. 2021, 247, 119113. [Google Scholar] [CrossRef]
  7. Singh, J.; White, R.L. A variable temperature infrared spectroscopy study of NaA zeolite dehydration. Vib. Spectrosc. 2018, 94, 37–42. [Google Scholar] [CrossRef]
  8. Singh, J.; White, R.L. A variable temperature infrared spectroscopy study of NaY zeolite dehydration. Spectrochim. Acta A Mol. Biomol. Spectrosc. 2020, 231, 118142. [Google Scholar] [CrossRef]
  9. Tkachenko, Y.; Niedzielski, P. FTIR as a method for qualitative assessment of solid samples in geochemical research: A review. Molecules 2022, 27, 8846. [Google Scholar] [CrossRef]
  10. White, R.L. Diffuse reflection mid-infrared spectroscopy of neat powders by using a wire mesh “button” sample holder. Anal. Chim. Acta 2020, 1098, 110–116. [Google Scholar] [CrossRef]
  11. Blum, M.M.; John, H. Historical perspective and modern applications of attenuated total reflectance-Fourier transform infrared spectroscopy (ATR-FTIR). Drug Test. Anal. 2011, 4, 298–302. [Google Scholar] [CrossRef]
  12. Vilagosh, Z.; Lajevardipour, A.; Appadoo, D.; Juodkazis, S.; Wood, A.W. Using attenuated total reflection (ATR) apparatus to investigate the temperature dependent dielectric properties of water, ice, and tissue-representative fats. Appl. Sci. 2021, 11, 2544. [Google Scholar] [CrossRef]
  13. Schramm, C. High temperature ATR-FTIR characterization of theinteraction of polycarboxylic acids and organotrialkoxysilanes with cellulosic material. Spectrochim. Acta A Mol. Biomol. Spectrosc. 2020, 243, 118815. [Google Scholar] [CrossRef] [PubMed]
  14. Sobieski, B.; Chase, B.; Noda, I.; Rabolt, J. Artifact correction in temperature-dependent attenuated total reflection infrared (ATR-IR) spectra. Appl. Spectrosc. 2017, 71, 1868–1875. [Google Scholar] [CrossRef] [PubMed]
  15. Singh, J.; White, R.L. Variable temperature infrared spectroscopy with a button sample holder and thermoelectric heating/cooling. Anal. Chim. Acta 2022, 1198, 339558. [Google Scholar] [CrossRef]
  16. White, R.L. Thermal analysis by variable temperature infrared spectroscopy with a button sample holder and peltier heating/cooling. Talanta 2023, 258, 124474. [Google Scholar] [CrossRef]
  17. Kohutova, A.; Honcova, P.; Podzemna, V.; Bezdicka, P.; Vecernikova, E.; Louda, M.; Seidel, J. Thermal analysis of kidney stones and their characterization. J. Therm. Anal. Calorim. 2010, 101, 695–699. [Google Scholar] [CrossRef]
  18. Valido, I.H.; Rius-Barta, J.M.; Boada, R.; Resina-Gallego, M.; Valiente, M.; Lopez-Mesas, M. Characterization of calcium oxalate hydrates and the transformation process. ChemPhysChem 2020, 21, 2583–2593. [Google Scholar] [CrossRef]
  19. Conti, C.; Casati, M.; Colombo, C.; Possenti, E.; Realini, M.; Gatta, G.D.; Merlini, M.; Brambilla, L.; Zerbi, G. Synthesis of calcium oxalate trihydrate: New data by vibrational spectroscopy and synchrotron X-ray diffraction. Spectrochim. Acta A Mol. Biomol. Spectrosc. 2015, 150, 721–730. [Google Scholar] [CrossRef]
  20. Fei, T.; Hao, X.; Bao-Lian, S. A simultaneous thermal study in quantitative analysis of calcium oxalate hydrates. Anal. Methods 2013, 5, 6900–6903. [Google Scholar] [CrossRef]
  21. Izatulina, A.R.; Gurzhiy, V.V.; Krzhizhanovskaya, M.G.; Kuzmina, M.A.; Leoni, M.; Frank-Kamenetskaya, O.V. Hydrated calcium oxalates: Crystal structures, thermal stability, and phase evolution. Cryst. Growth Des. 2018, 18, 5465–5478. [Google Scholar] [CrossRef]
  22. Zhao, W.; Sharma, N.; Jones, F.; Raiteri, P.; Gale, J.D.; Demichelis, R. Anhydrous calcium oxalate polymorphism: A combined computational and synchrotron X-ray diffraction study. Cryst. Growth Des. 2016, 16, 5954–5965. [Google Scholar] [CrossRef] [Green Version]
  23. Hochren, O.; Thomas, A.; Kniep, R. Revealing the crystal structure of anhydrous calcium oxalate, Ca[C2O4], by a combination of atomistic simulation and rietveld refinement. Z. Anorg. Allg. Chem. 2008, 634, 1826–1829. [Google Scholar] [CrossRef]
  24. Kolezynski, A.; Malecki, A. Theoretical analysis of electronic and structural properties of anhydrous calcium oxalate. J. Therm. Anal. Calorim. 2010, 99, 947–955. [Google Scholar] [CrossRef]
  25. Milosevic, M.; Berets, S.L. A review of FT-IR diffuse reflection sampling considerations. Appl. Spectrosc. Rev. 2002, 37, 347–364. [Google Scholar] [CrossRef]
  26. Maraoulaite, D.; White, R.L. Optical efficiency effects on infrared diffuse reflection spectroscopy signal-to-noise ratio. Am. Lab. 2018, 50, 14–17. [Google Scholar]
  27. White, R.L. Removal of baseline artifacts from variable-temperature diffuse reflectance infrared spectra. Anal. Chem. 1992, 64, 2010–2013. [Google Scholar] [CrossRef]
  28. Kubelka, P.; Munk, F. Ein Beitrag zur Optik der Farbanstriche. Z. Tech. Phys. 1931, 12, 593–601. [Google Scholar]
  29. Petrov, I.; Soptrajanov, B. Infrared spectrum of whewellite. Spectrochim. Acta 1975, 31, 309–316. [Google Scholar] [CrossRef]
  30. Shippey, T.A. Vibrational studies of calcium oxalate monohydrate (whewellite) and an anhydrous phase of calcium oxalate. J. Mol. Struct. 1980, 63, 157–166. [Google Scholar] [CrossRef]
  31. Guerra-Lopez, J.R.; Guida, J.A.; Vedova, C.O.D. Infrared and Raman studies on renal stones: The use of second derivative infrared spectra. Urol. Res. 2010, 38, 383–390. [Google Scholar] [CrossRef] [PubMed]
  32. White, R.L.; Ai, J. Variable-temperature diffuse reflectance infrared studies of calcium oxalate monohydrate. App. Spectrosc. 1992, 46, 93–99. [Google Scholar] [CrossRef]
  33. Christy, A.A.; Nodland, E.; Burnham, A.K.; Kvalheim, O.M.; Dahl, B. Determination of kinetic paramters for the dehydration of calcium oxalate monohydrate by diffuse reflectance FT-IR spectroscopy. Appl. Spectrosc. 1994, 48, 561–568. [Google Scholar] [CrossRef]
  34. Conti, C.; Casati, M.; Colombo, C.; Realini, M.; Brambilla, L.; Zerbi, G. Phase transformation of calcium oxalate dihydrate-monohydrate: Effects of relative humidity and new spectroscopic data. Spectrochim. Acta A Mol. Biomol. Spectrosc. 2014, 128, 413–419. [Google Scholar] [CrossRef]
  35. Gulley-Stahl, H.J.; Haas, J.A.; Schmidt, K.A.; Evan, A.P.; Sommer, A.J. Attenuated total internal reflection Fourier transform infrared spectroscopy: A quantitative approach for kidney stone analysis. Appl. Spectrosc. 2009, 63, 759–766. [Google Scholar] [CrossRef] [Green Version]
  36. Liavitskaya, T.; Vyazovkin, S. Delving into the kinetics of reversible thermal decomposition of solids measured on heating and cooling. J. Phys. Chem. C 2017, 121, 15392–15401. [Google Scholar] [CrossRef]
  37. Garn, P.D. Thermal analysis: A critique. Anal. Chem. 1961, 33, 1247–1251. [Google Scholar] [CrossRef]
  38. Nair, C.G.R.; Ninan, K.N. Thermal decomposition studies: Part X. Thermal decomposition kinetics of calcium oxalate monohydrate-correlations with heating rate and sample mass. Thermochim. Acta 1978, 23, 161–169. [Google Scholar] [CrossRef]
  39. Ninan, K.N. Thermal decomposition kinetics. Part XIV. Kinetics and mechanism of isothermal decomposition of calcium oxalate monohydrate and correlation with sample mass. Thermochim. Acta 1986, 98, 221–236. [Google Scholar] [CrossRef]
  40. Blazejowski, J.; Zadykowicz, B. Computational prediction of the pattern of thermal gravimetry data for the thermal decomposition of calcium oxalate monohydrate. J. Therm. Anal. Calorim. 2013, 113, 1497–1503. [Google Scholar] [CrossRef] [Green Version]
  41. Tazzoli, V.; Domeneghetti, C. The crystal structures of whewellite and weddellite: Re-examination and comparison. Am. Miner. 1980, 65, 327–334. [Google Scholar]
  42. Knoll, C.; Muller, D.; Artner, W.; Welch, J.M.; Werner, A.; Harasek, M.; Weinberger, P. Probing cycle stability and reversibility in thermochemical energy storage-CaC2O4•H2O as perfect match? Appl. Energy 2017, 187, 1–9. [Google Scholar] [CrossRef]
Figure 1. Left—The variable-temperature button sample holder. Right—Photograph of the assembled apparatus.
Minerals 13 00783 g001
Figure 2. Infrared spectra for COM (green) obtained at 30 °C and α-COA obtained at 120 °C (red), and after cooling back to 30 °C (blue) in (a) the O-H stretching vibration region and (b) the oxalate anion vibration range.
Minerals 13 00783 g002
Figure 3. (a) Integrated band areas for water (3700–2700 cm−1) and the νa (1750–1500 cm−1), νs (1450–1250 cm−1), and νδ (850–750 cm−1) bands plotted as a function of the spectrum number. (b) Oxalate band wavenumber changes during heating/cooling of COM. Red lines highlight the 60–100 °C temperature range while heating the sample.
Minerals 13 00783 g003
Figure 4. Overlay of infrared spectra measured at: 100 °C while heating, 100 °C while cooling, 150 °C, and 30 °C after cooling.
Minerals 13 00783 g004
Figure 5. Overlays of difference spectra resulting from 150 °C 100 °Cheating (red), 100 °Ccooling 150 °C (blue), and 30 °C 100 °Ccooling (green) spectral subtractions in the (a,c) O-H stretching vibration range and the (b,d) oxalate anion vibration range.
Minerals 13 00783 g005
Figure 6. Step heating temperature program. Thick lines denote infrared spectrum measurement periods.
Minerals 13 00783 g006
Figure 7. Difference spectra representing (left) reversible and (right) irreversible changes relative to the 30 °C TLow(n) infrared spectrum. Numbers indicate THigh(n) temperatures.
Minerals 13 00783 g007
Figure 8. α-COA infrared spectra measured at 10 min intervals over a period of 1 h at 10 °C in the (a) water O-H stretching vibration region, (b) for the νa and νs oxalate vibrations, and (c) for the νδ oxalate vibration. Dotted lines denote the first acquired spectrum.
Minerals 13 00783 g008aMinerals 13 00783 g008b
Figure 9. Difference spectra obtained by subtracting the successively acquired spectra in Figure 8 over the (a) 3750–2750, (b) 1750–1250 and (c) 820–750 cm−1 ranges.
Minerals 13 00783 g009
Figure 10. (a) α-COA rehydration after exposure to 15% RH room air. (b) Overlay of initial and final COM spectra.
Minerals 13 00783 g010
Figure 11. Comparison of difference spectrum bands associated with increasing α-COA content (solid line) with calculated band wavenumbers and relative areas reported by Zhao et al. [22].
Minerals 13 00783 g011
Figure 12. Water O-H stretching vibration bands measured (a) while heating COM at 2 °C min−1 and (b) isothermally at 10 °C after cooling α-COA from 150 °C.
Minerals 13 00783 g012
Table 1. Infrared band assignments (cm−1).
Calcium Oxalate Monohydrate
Water VibrationsOxalate VibrationsMethodRef.
ν(OH)2ν(OH)1ν(OH)12δ(OH)ν(OH)2νaνsνδ
3486343333383257306316311321782ButtonFigure 2
3488342833383258305816271320782DRIFTS[33]
3486343433343254306016271319781DRIFTS[32]
34853428333932593059-1328781Microscope[34]
348334293336325830581624–16221320–1316783–781Microscope[19]
3496342933413269306516191318780KBr Pellet[31]
3495344033403250306016201316782KBr Pellet[29]
3488343033383258305716221317781Mull[30]
348134273336325530501620 *1313778ATR[18]
-----16201315780ATR[35]
Anhydrous Calcium Oxalate
16431323787ButtonFigure 2
16361320787Mull[30]
1640–16381330–1327784–782Microscope[19]
16381335780Microscope[34]
* Estimated from the published spectrum, reported value was 1605 cm−1.
Disclaimer/Publisher’s Note: The statements, opinions and data contained in all publications are solely those of the individual author(s) and contributor(s) and not of MDPI and/or the editor(s). MDPI and/or the editor(s) disclaim responsibility for any injury to people or property resulting from any ideas, methods, instructions or products referred to in the content.

