Article

Spatial Heterogeneity of Rare Earth Elements: Implications for the Topsoil of Regional Ion-Adsorption Type Rare Earth Deposit Areas in Southern China

1
College of Petroleum Engineering, Guangdong University of Petrochemical Technology, Maoming 525000, China
2
College of Sciences, Guangdong University of Petrochemical Technology, Maoming 525000, China
3
School of Resource and Environmental Engineering, Jiangxi University of Science and Technology, Ganzhou 341000, China
4
School of Water Resources and Environment, China University of Geosciences, Beijing 100083, China
5
Guangdong Geological Survey Institute, Guangzhou 510110, China
*
Author to whom correspondence should be addressed.
Minerals 2023, 13(6), 784; https://doi.org/10.3390/min13060784
Submission received: 4 May 2023 / Revised: 28 May 2023 / Accepted: 1 June 2023 / Published: 8 June 2023

Abstract

:
The migration and spatial distribution characteristics of topsoil rare earth elements (REEs) are significant for the risk assessment of the external environment. However, the spatial distribution of REEs in the topsoil of ion-adsorption type rare earth element (REE) mining areas is poorly studied. We aimed to determine the differences and control factors of the spatial distribution of REEs in the topsoil of typical rare earth mines in South Jiangxi, South China. Sixty-five topsoil samples and eighteen profile samples were collected and analyzed for their rare earth content to elucidate spatial autocorrelation and heterogeneity using statistical analysis software (IBM SPSS Statistics 26.0.0.0, GS+9.0, and Arcgis10.2.0.3348). Moran index analysis showed that the positive correlation between sampling points was significant within the range of 0–500 m. The best fitting models of the semi-variance variogram were the exponential model, Gaussian model, and spherical model. The sequence of the spatial structure (C0 + C) was Ho > Tb > La > Pr > Nd > Sm > Gd > Tm > Lu > Dy > Er > Yb > Ce > Eu. The spatial fractal distribution pattern was Ho > Tb > Lu > Er > Dy > Yb > Tm > Gd > Ce > La > Eu > Sm > Pr > Nd. This indicated that the light rare earth elements (LREEs) and heavy rare earth elements (HREEs) in the topsoil were significantly different from the other sediments. This study provides new evidence for the environmental quality assessment of the in situ leaching of ionic rare earth ores into the topsoil layer.

1. Introduction

Rare earth elements (REEs) include lanthanide group elements with atomic numbers 57–71. Yttrium (Y) and scandium (Sc) are also used as REEs since their chemical properties are similar to those of lanthanides [1,2]. Rare earth elements are usually divided into two groups: light REEs (LREEs: La, Ce, Pr, Nd, Sm, and Eu) and heavy REEs (HREEs: Gd, Tb, Dy, Ho, Er, Tm, Yb, Lu, Sc, and Y) [2]. The abundance of HREEs is much lower than that of LREEs in the crust [3]. The rare earth deposits associated with both carbonatite and -alkaline granite account for 51.4% and 34%, respectively, and have been explored worldwide [4]. Rare earth elements are an important strategic and essential raw material for emerging renewable energy resources; they have an important position in the construction of national defense and the development of the national economy [5,6,7,8]. However, REEs are relatively small and unevenly distributed globally. China is a major producer of rare earth elements, and accounted for 62.9% of the global exports in 2019 [8]. New statistics [9] indicate that China has discovered 44 million tons (36.6% of the world’s total) of rare earth resources. Ion-adsorption type REE deposits in Southern China have attracted attention since the 1970s, and are an important rare earth resource because of their relatively high HREE contents. They are formed through the adsorption of REES by the clay layer of granite weathering crust. The REEs in this form are easily extracted and have high industrial value [10,11,12]. This has promoted the rapid development of China’s rare earth industry and related industries, which are developing due to technology for different stages of mining ion-type rare earth deposits, including pool leaching, heap leaching, and in situ leaching.
The distribution of ion-type rare earth ores in Southern China is divided into three types: heavy rare earth ores, such as Longnan, which is rich in yttrium [13]; Xunwu, a low-yttrium, cerium-rich light rare earth ore [14]; and a medium-yttrium, europium-rich rare earth ore, such as Xinfeng [10].
The diversiform of REE distribution types and their heterogeneous content in granite weathering crust are important internal factors. The deposits were mineralized with REE ore-forming parent rock by hydrothermal fluid metasomatism in the magmatic period and post-magmatic period [15]. The formation of ion-type rare earth ore is controlled by various factors, including the nature of the ore-forming parent rock, pH value, weathering degree, and topographic features [16,17,18]. After the physical and chemical weathering of granite, rare earth ions from accessory minerals such as sphene, apatite, epidote, monazite, and yttrium phosphate are decomposed into hydroxyl ions or hydroxyl-hydrated ions [10,14], which are adsorbed on the surface of clay minerals in the weathering crust. Long-term weathering and eluviation are concentrated in suitable low-mountain hilly areas, and form weathering and eluviation deposits with industrial significance [12,19,20].
The ore bodies can be regarded as open exchange columns. The fixed phase consists of mainly clay mineral ore, and the mobile phase is characterized by hydrated or hydroxyl-hydrated rare earth ions [10]. The distribution and content of rare earth elements in the weathering crust differ according to the chemical properties of various weathering and leaching rare earth ions.
The content and distribution of REEs in the topsoil layer and in the sediment transported by flowing water are significantly different. The average REE content in the river sediment of the Yangtze River basin is 181.8 mg/kg; this is controlled by the mineral composition of the parent rock and climatic conditions [21]. The arithmetic mean content of total REEs in the topsoil layer of the Jiangjin area in the Sichuan basin is 147 mg/kg [22]. The content distribution and differentiation characteristics are affected by the soil pH value and organic matter content; LREEs become more enriched than HREEs with increasing altitude in the basin. Moreover, the average total rare earth content in the topsoil of Guangzhou and adjacent areas is 2.32 times higher than the background value, and the content of ion exchange REEs in the topsoil is up to 98% of ΣREEs [23]. The average content of ion exchange rare earth elements is 205.83 mg/kg, and this migrates into the surrounding sediment. The total rare earth content and available content in the soil of ionic rare earth mining areas are very high, and may easily enter the food chain through the uptake of polluted soil and water by plants [24]. In addition, this is closely related to the content and sources of REEs, with the sediment formed by artificial mining activities producing tailings which are transported and deposited by flowing water.
The ΣREE content of the topsoil of Baotou rare earth mine tailings is 156–5.65 × 10⁴ mg/kg [2], with the average being 4.67 × 10³ mg/kg. This is significantly higher than the national average of 187.6 mg/kg [25]. The ionic rare earth tailings of Fujian Liancheng include an LREE element content of 257–889 mg/kg and a HREE content of 60.8–270 mg/kg [26]. Overall, this shows that the spatial distribution pattern of REEs in the topsoil layer is controlled by water transportation, artificial mining activities, and other behavioral changes. The REE content in the topsoil layer is often lower than the background value of the sedimentary basin far from the rare earth mining area of the intermediate acid granite parent rock. Was the above reason causing heterogeneity in the distribution of rare earth elements in the topsoil? The difference in heterogeneity is currently reported in ionic rare earth mining areas in the south.
The REEs in the topsoil migrate by physical or chemical weathering. The content and spatial distribution of REEs under weathering as the background reference value of the topsoil in rare earth mining areas is used as reference evidence for the scientific assessment of the rare earth ore leaching activities of environmental impact. Unfortunately, there is little research on the spatial heterogeneity of REEs in the topsoil of ionic rare earth mining areas. This type of research is required to quantitatively assess the environmental risk and to predict the migration and diffusion range of REEs in leaching activities. We aim to provide the differences and control factors of REE and to discuss the spatial autocorrelation and heterogeneity of topsoil of rare earth mines owing to the analysis of the content and vertical migration characteristics of REEs through topsoil and the profile sampling of typical rare earth ores in southern Jiangxi, China, and using statistical analysis software such as IBM SPSS Statistics 26.0.0.0 (IBM Corp., Armonk, NY, USA, 2019) [27], GS+9.0 (Gamma Design Software, LLC., Plainwell, MI, USA, 2008) [28] and Arcgis 10.2.0.3348 (Ersi Inc.2013) [29]. This study provides new insights into in situ leaching extraction and the environmental protection of ionic rare earth ore with the aim of scientifically assessing the environmental effects of REE leaching activities.

2. Materials and Methods

2.1. Study Site

The study site is located in Longnan City, Ganzhou City, Jiangxi Province, China (Figure 1a,b). It is conveniently connected by national roads and county-level roads. The region is situated in the subtropical monsoon climate zone, with an annual average precipitation of 1461.2 mm and an annual average temperature of 19.4 °C. The topography and landforms present as low-mountain and hilly. The main arbor vegetation types are Pinus massoniana Lamb and Schima superba Gardn. et Champ, together with herbs such as Dicranopteris dichotoma under the forest. The main exposed lithology is Yanshanian granite due to continuing weathering under special climatic, topographic, and geomorphic conditions [30]. A very thick crust of granite weathering is formed and the ionic REE ores are deposited by clay mineral adsorption over time.

2.2. Sampling Methods

A total of 65 topsoil samples and 18 profile samples were collected from the rare earth mining area (Figure 1c). The location was mapped with GPS and sampling depth was measured with steel tape. The field sampling depth of topsoil samples was determined according to the completely weathered rock layer. The sampling location is below the humus layer, and three sampling depths are measured from different directions, taking the average value. The depth is generally between 30–50 cm. These samples were collected at elevations of 257–386 m. On the other hand, the main purpose of the profile sampling was to investigate the characteristics of vertical migration and variation of rare earth elements. Three manually excavated slopes were selected as profile samples and the numbers were marked as TRP01, TRP02, and TRP03, respectively. Firstly, the location was mapped with GPS, and the vertical surface layer of 30 cm was removed and the profile was corrected to be straight before sampling, and a steel tape measure is used to measure and sample in layers. In-depth research was conducted on the weathering, leaching and migration of ion type rare earth elements and their relationship with organic matter in the humus layer, with sampling intervals ranging from 20–40 cm from the top of the humus layer (Figure 1d). The TRP01, TRP02 and TRP03 profile samples depth are shown in Table 1, and with a total of 18 samples taken from the profile.

2.3. Analysis of REEs

After the sample was processed, each sample was dried, ground, screened, and mixed for analysis, with a sample particle size less of than 0.075 mm of 50 g being weighed and sent to Guangzhou Aoshi Mineral Laboratory. The total amount of REEs was analyzed using an Agilent-7900 inductively coupled plasma mass spectrometer (ICP-MS, United States). The relative deviation of precision (RD) and the relative error of accuracy (RE) were below 10%. During analysis, two samples were weighed, and one sample was digested with perchloric acid, nitric acid and hydrofluoric acid. The nearly dry sample was dissolved in dilute hydrochloric acid to a constant volume, and then analyzed using ICP-MS. The other sample was added to lithium metaborate/lithium tetraborate flux, mixed evenly, and melted in a furnace above 1025 °C. After cooling, the molten liquid was fixed to volume with nitric acid, hydrochloric acid, and hydrofluoric acid, and then analyzed using the plasma mass spectrometer. GBW07385 (GSS-29) soil reference material was used for quality control. The final test result was synthesized depending on the actual situation of the sample and the digestion effect. The detection limit of the analysis are presented in Table 2.

2.4. Data Processing and Application Software

Original analytical data were analyzed using Excel 2019, and the REE levels were determined using IBM SPSS Statistics 26.0.0.0 (IBM Corp., Armonk, NY, USA, 2019) [27], with GS+9.0 (Gamma Design Software, LLC., Plainwell, MI, USA, 2008) [28] being used to analyse the spatial heterogeneity of REEs and Arcgis10.2.0.3348 (Ersi Inc., Redlands, CA, USA, 2013) [29] being used to generate the plots. The value indicated that the Tukey’s method conversion was carried out for the rare earth content of all the topsoil during the study of the spatial heterogeneity of the rare earth, and that finally, the research data conformed to the normal distribution.

3. Results and Discussion

3.1. Rare Earth Element Concentrations in Topsoil

Sixty-five topsoil samples were analyzed for REE concentrations (arithmetic mean, standard deviation, coefficient of variation, maximum and minimum values, geometric mean, and so on) using IBM SPSS Statistics 26.0.0.0 (IBM Corp., 2019) [27]. Kolmogorov—Smirnov (K-S) analysis indicated that all of the REE concentrations were abnormally distributed (p < 0.05) (Table 3). In particular, the content and spatial distribution characteristics of REE in the topsoil were discussed. The differences in the spatial distribution of REE in the topsoil of the study area and their reasons were revealed through discussions such as standard chondrites, Ce values, Eu/Eu* ratios, and autocorrelation analysis.
Tukey’s method was used for normal transformation (IBM SPSS Statistics 26.0.0. (IBM Corp., 2019) [27]). The square root model was used for Tm, Yb, Lu, and the logarithmic model was used for the transformation of other elements (log10). The results successfully passed the K-S test for normality.
The coefficient of variation (CV) considers the spatial distribution uniformity of REEs [32,33]. Surface soil analysis of the rare earth mining area shows that the minimum CV was 55.5%, and the maximum CV was 143.1% (average CV = 75.7%, standard deviation = 23.2). This indicated that the REEs were unevenly distributed. The HREE CV ranged from 55.5%–74.2% (average = 64.3%, standard deviation = 6.81). This indicated that the HREE was allocated with a high variability. The LREE CV ranged from 68.7%–143.1% (average = 98.9%, standard deviation = 27.7). This indicated that the LREE distribution greatly varied in the topsoil. The CV of LREE La and Eu exceeded 100% of all REEs, and their spatial variability was greater than that of other REEs.
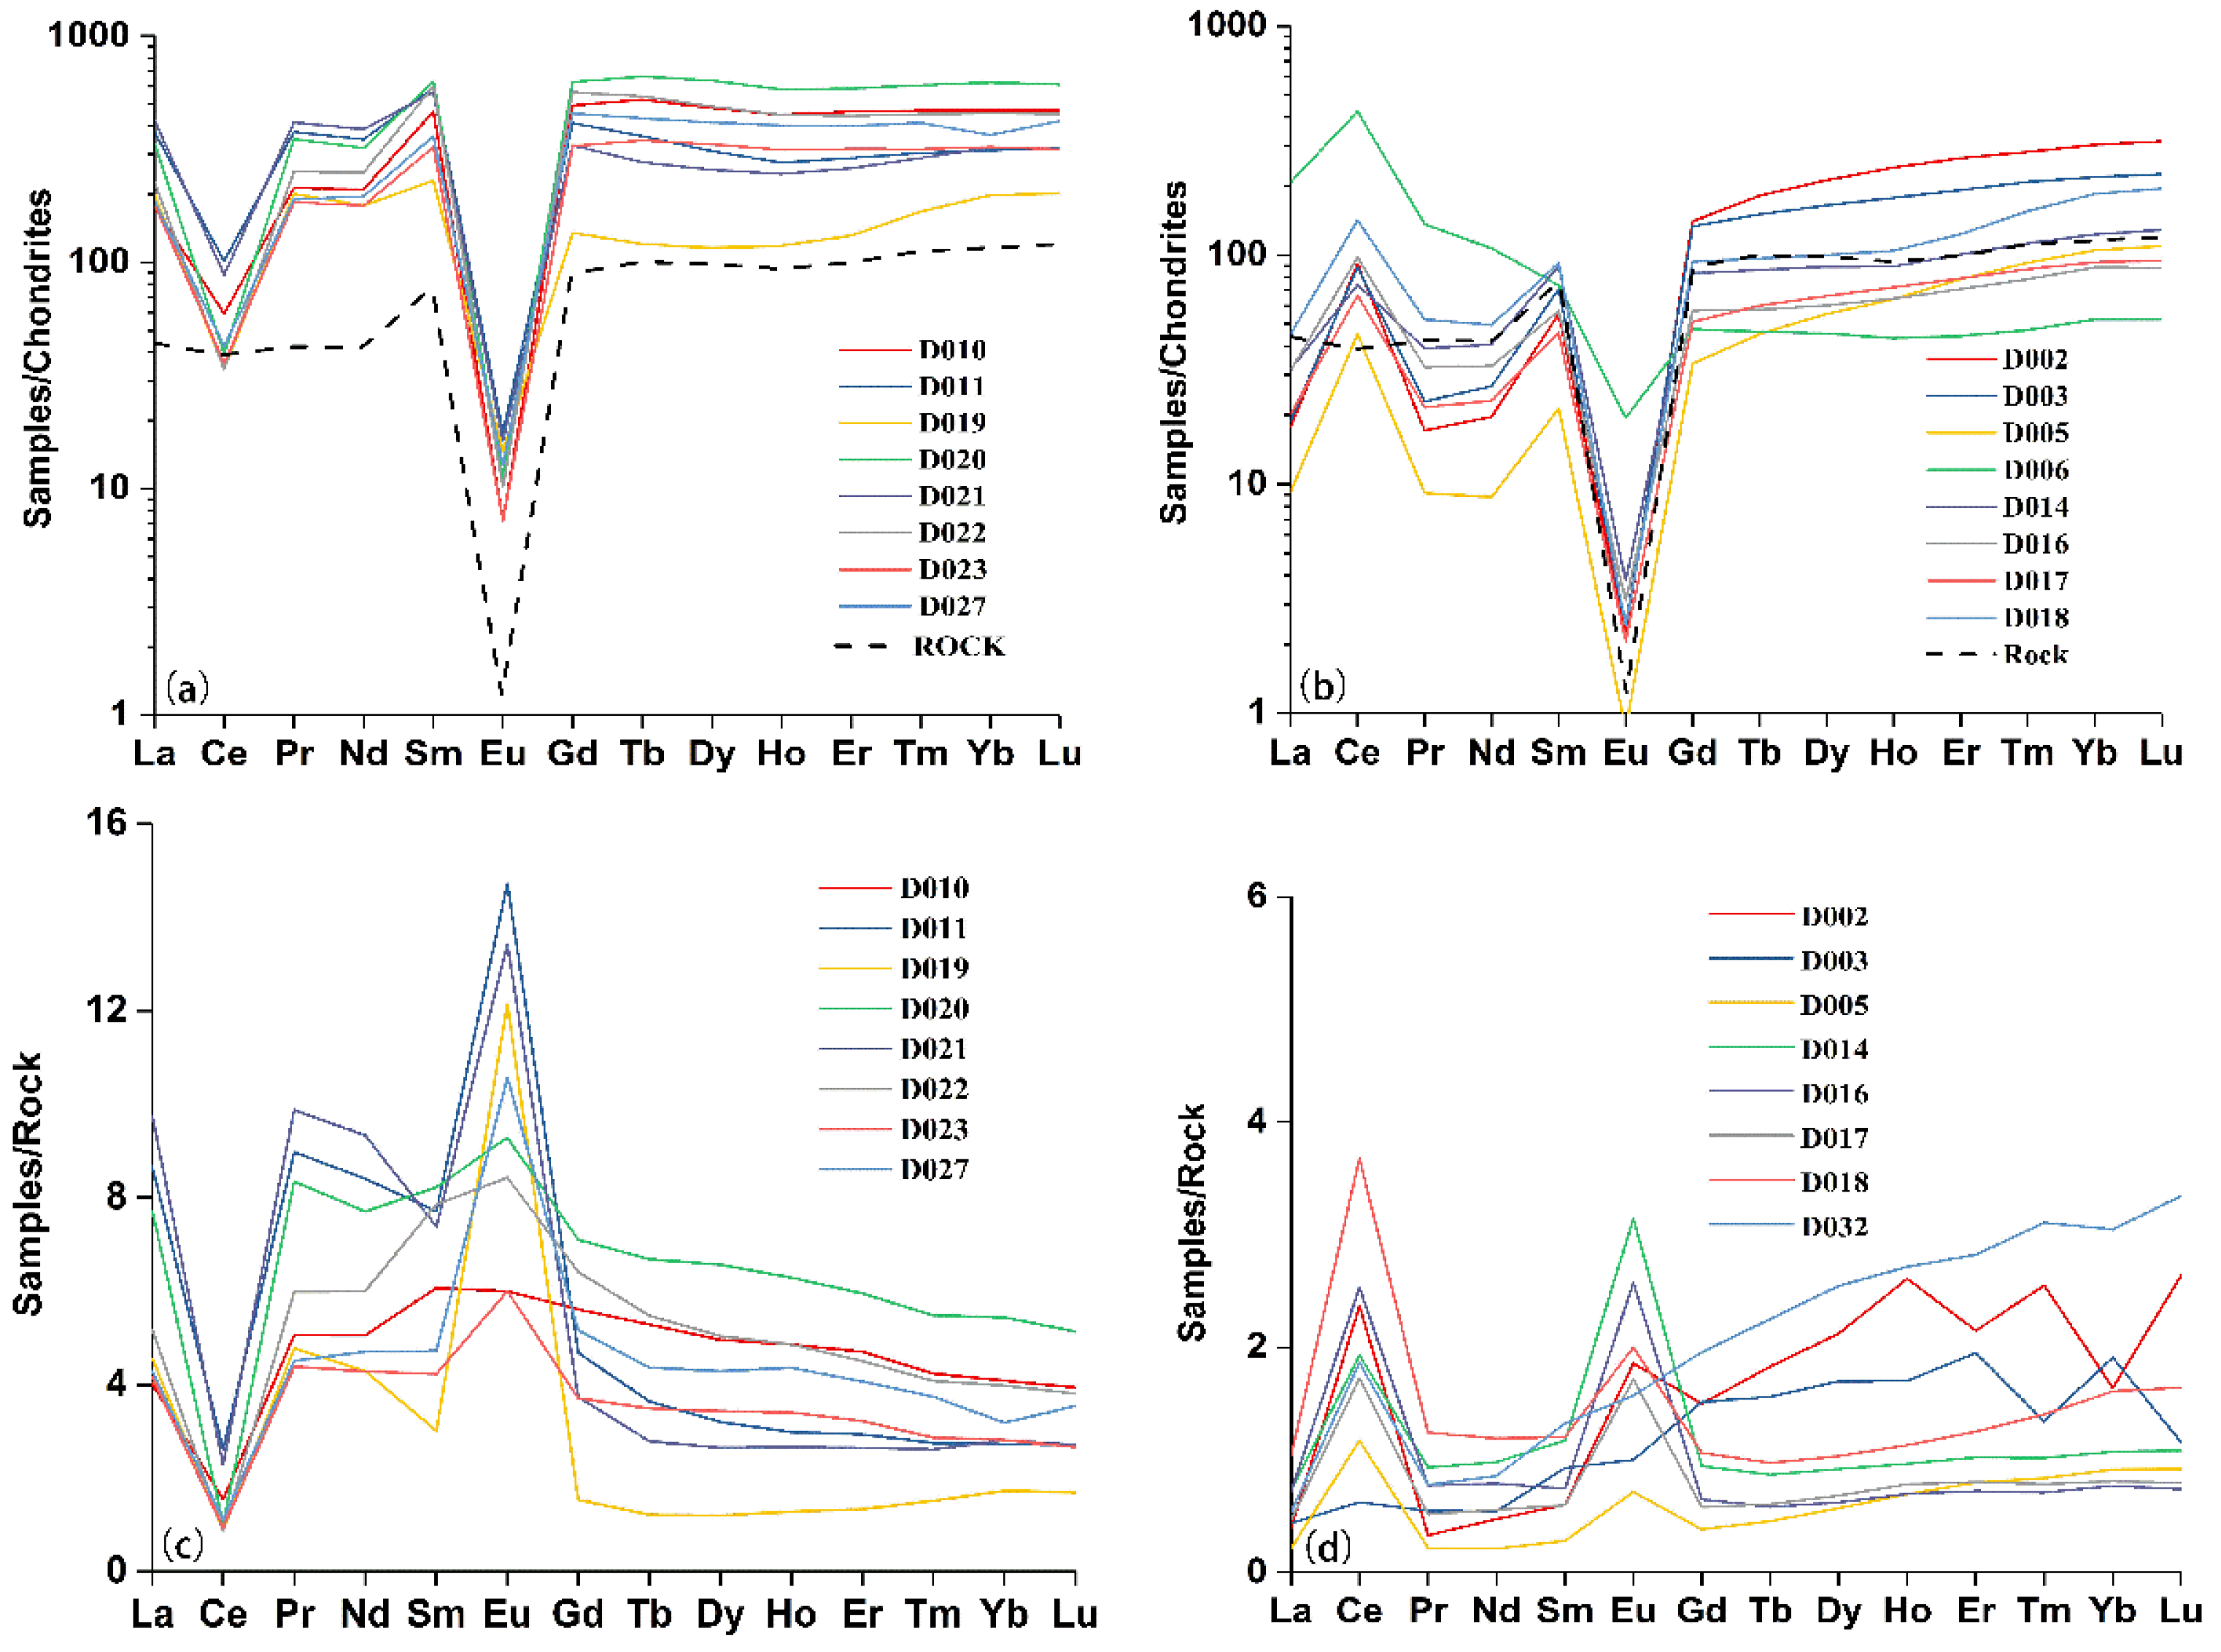
The total content of REEs in the surface soil of the study area varied from 156.3–2397.7 mg/kg (Table 3), with an average of 767.3 mg/kg. The average content of Pr, Nd, and Sm LREEs is obviously higher than the background value and the upper continental crust (UCC) compared with the background value of soil of Jiangxi Province [25] and the REE content in the upper crust [3]. In contrast, the La, Ce, and Eu content was comparatively lower in the study area compared with previous studies. The average value of HREE from Gd to Lu is higher than the background value and UCC content. The rare earth standard chondrite analysis shows that the changes in Ce and La were relatively complex. In order to visually display the trend of Ce changes on the graph, samples with significant abnormal changes in Ce were selected for analysis and explanation (Figure 2). The Ce content presents three changed modes: first, it reveals an obvious negative abnormal variation tendency (compared with the variation of La content) (Figure 2a).
The depth of field sampling points analysis showed that the position is inclined to the lower layer of the completely weathered layer; the Ce content is gradually less in the lower part, and is even lower than the un-weathered parent rock.
Second, the Ce content showed an obvious positive anomaly compared with the La content variation (Figure 2b). The field sampling point shows that it is located at the top of the completely weathered layer at the bottom of the organic matter layer. The organic matter content in the soil is relatively high; this is conducive to Ce enrichment [22,36]. Particle size analysis of soil stratified sampling in the Zudong mining area of Longnan City shows that Ce is below 2 μm and 2–20 μm in clay minerals; this is a characteristic of continuous enrichment [37]. The area at the top of the completely weathered layer is just the beginning of the weathering leaching zone. The peak range of mineral particles appears from 2.1–17.2 μm and the particle size in this area is approximately 70%, which is distributed as fine particles [12,30]. This particle size of clay minerals favors Ce enrichment. Third, the Ce and La content is similar and the fluctuation range between them is small. The rare earth standard chondrite curve is relatively flat. The granite in the Longnan REE mining area has an LREE content (n = 6) of 57 ppm and an HREE content of 279 ppm [35]. The ratio of rare earth content between topsoil samples and Zudong granite shows that the variation tendency of Ce is similar to the above standard composition (Figure 2c,d). This indicated that the upper layer is enriched organic matter that is obviously enriched in Ce. The average Eu content (0.53 mg/kg) showed an obvious loss compared with the UCC content. The chondrite-normalized patterns of Eu present obvious negative anomalies (Figure 2a,b), and it succeeds the characteristics of parent rock. In addition, the LREE/HREE ratio of 0.32 indicated that the HREE are approximately 3-fold enriched compared with the LREE in the topsoil layer. However, Eu is obviously enriched in most samples, and the content of samples at D030 and D035 are over 52 times and 72 times higher than the rare earth contents of rocks. This reflects that the bottom of the completely weathered layer is an excellent Eu enrichment environment (Figure 2c,d).
Additionally, the maximum value, minimum value, average value, and standard deviation of the Eu/Eu* ratio is 1.07, 0.01, 0.07, and 0.15, respectively. The maximum value, minimum value, average value, and standard deviation of the Ce/Ce* ratio is 5.23, 0.12, 1.54, and 0.16, respectively. This indicated that the surface soil level of Eu is low, but Ce is obviously enriched. The average value of La/Yb is 0.59; this confirmed that the rule of enrichment HREEs in the topsoil layer of the study area is linking to a genetic relationship with the ion type rare earth deposits.
Autocorrelation analysis of REEs in topsoil samples demonstrates that it is strongly correlated at the p < 0.05 significance level (Table 4). The correlation coefficient between LREE Ce and La, Pr, Nd, Sm, and Eu is generally low (Eu: r = 0.53, p < 0.05; La: r = 0.46, p < 0.05). This may be related to the geochemical behavior of LREEs. The upper layer of the weathering crust is more conducive to the enrichment of LREE and the middle and lower layers are more enriched in HREE in the process of ionic rare earth ore mineralization [35,38]. The overall topsoil ΣLREE content in the study area is relatively low; this is due to the weathering and leaching of some LREEs. There is an obvious differentiation between the Baotou rare earth mine tailings [2], Sichuan basin topsoil [22], and other REEs. The HREEs—Gd, Tb, Dy, Ho, Er, Tm, Yb, and Lu—show a correlation coefficient of over 0.9; this represents a strong positive correlation. This suggests that the HREE differentiation characteristics are formed by the heavy ion type rare earth ore in the study area.
The above analysis shows that the distribution of rare earth elements in the topsoil of the study area was uneven, and the LREEs distribution was quite different from that of HREEs, with obvious negative Eu anomalies and relatively rich HREEs. This was closely related to the parent rocks of the ionic rare earth ore deposits and the geochemical behavior of rare earth elements.

3.2. Vertical Distribution of REEs in Soil Profiles

A total of 18 samples were collected from the field profile, and the REE analysis was standardized by CI chondrite [34]. In this subsection, the methods of total rare earth content, LREE/HREE, δEu, δCe, and the topography factors with the profile were applied to reveal the vertical differentiation characteristics of rare earth elements.
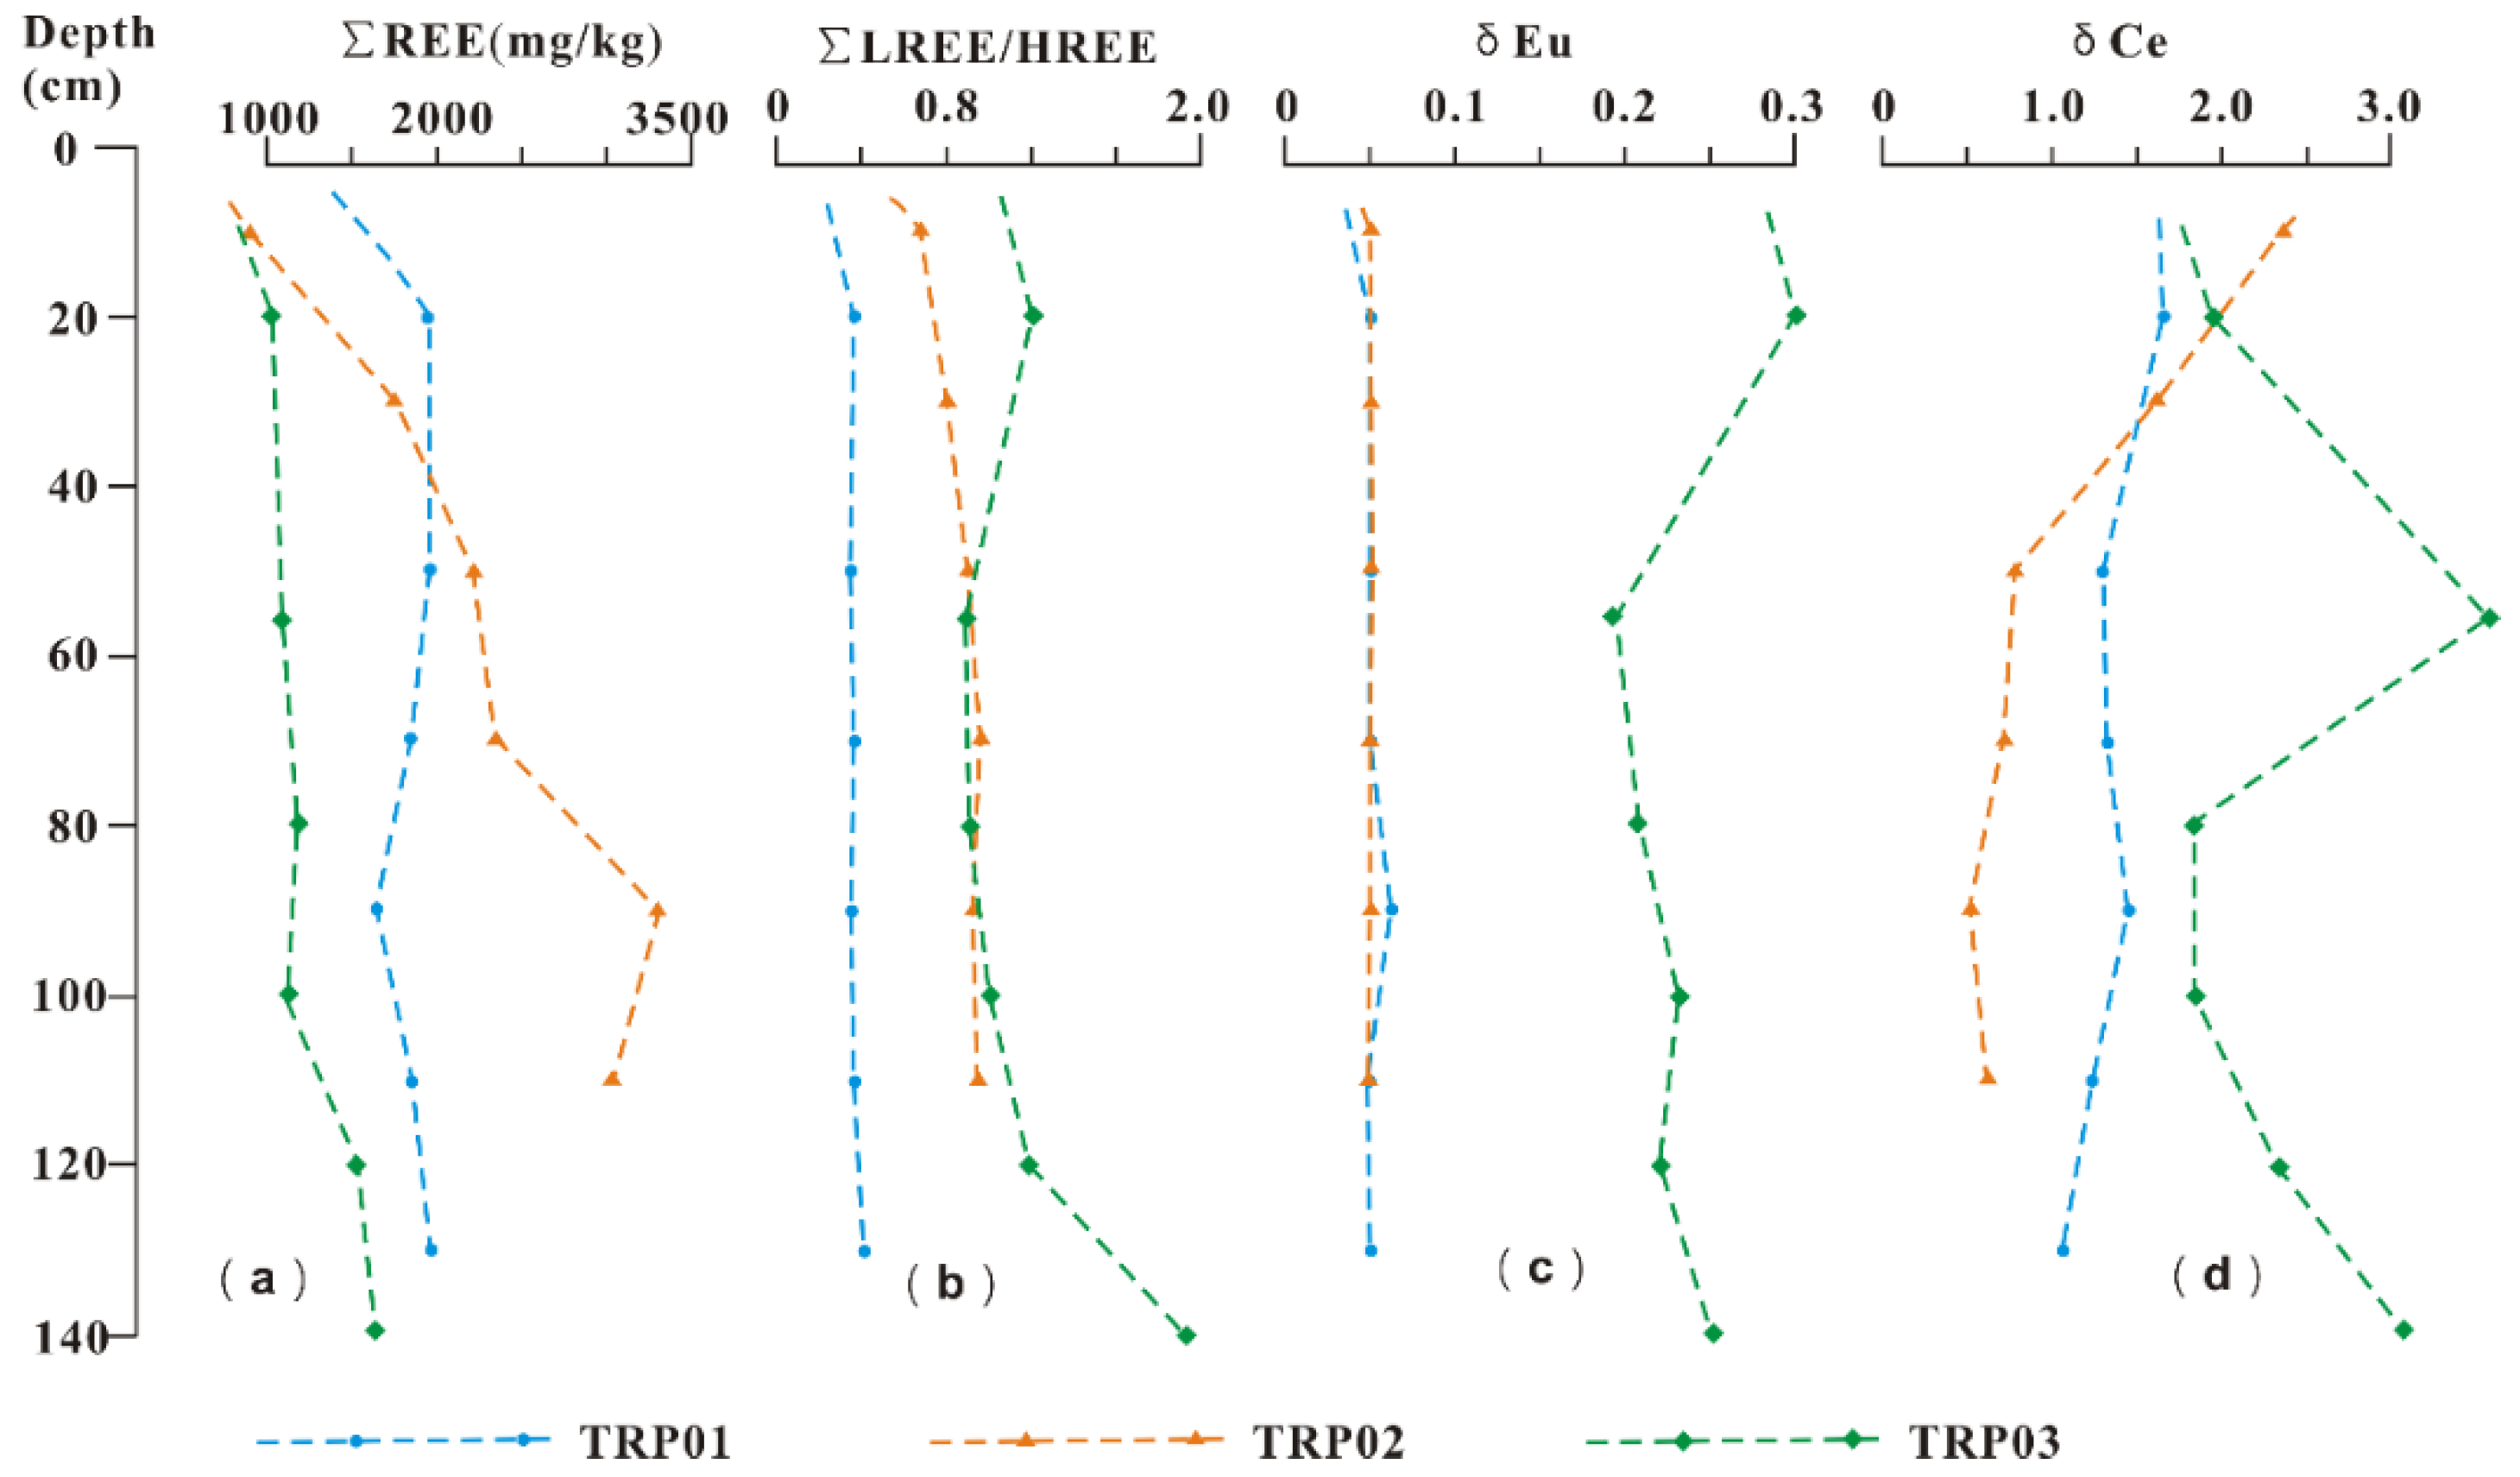
The overall variation of TRP01 and TRP03 profiles is relatively small, and the TRP01 profile curve from the top to the bottom is generally on the right. The ΣREE content in the 20–60 cm range is relatively high and reaches over 300 mg/kg. The ΣREE content decreases between 80–100 cm, and subsequently gradually increased (Figure 3a).
The ΣREE content of the TRP02 profile significantly increased from 10–90 cm, then slightly decreased from 90 cm to bottom. This value is approximately 2-fold much higher than that of the TRP01 and TRP03 profiles. The difference of ΣREE content in the above profiles (at the same or similar sampling locations) is mainly formed by the bedrock lithology and chemical weathering of ion type rare earth ore [18], the chemical process of water and rock [39], and the control of topography [12,15].
The LREE/HREE of the profile shows that the TRP01 ratio is below 1 (Figure 3b). This indicated that the profile is mainly enriched in HREE, while the TRP02 profile is close to 50 cm, and the LREE/HREE ratio gradually approaches 1. This suggested that the LREE and HREE content in the profile is generally equivalent. The LREE content is greater than the HREE content at a depth of 20 cm in the TRP03 profile, while the LREE and HREE content is comparable at 100 cm depth, the LREE and HREE content reveal a similar feature fluctuation (Figure 3b). The LREE content gradually increases below 100 cm. The δEu content is generally lower than that of UCC [3]. TRP01 and TRP02 profiles especially show Eu deficiency from top to bottom (Figure 3c). The δEu value of TRP03 favored the right side; this indicated that Eu showed the same Eu loss characteristics. The Longnan δEu value was 1.21; this suggested that there was an obvious Eu depletion according to the CI standard chondrite value of granite with the Eu (n = 6) content in Zudong mining area [37]. Therefore, the weathering crust formed after granite weathering presented the same characteristics from top to bottom, and the maximum δEu value of 0.3 reveals an obvious negative characteristic of the REE distribution mode of the parent rock.
The δCe content change is relatively complex. The δCe value fluctuates from the highest value of 1.54 to 1.16 from the top to the bottom and is enriched in Ce in the TRP01 profile (Figure 3d). The δCe value is obviously enriched above 40 cm in the TRP02 profile, and there is significantly greater enrichment closer to the surface (Figure 3d). The δCe value rapidly decreased to 0.53 below 40 cm and showed an obvious Ce loss at the bottom. The δCe value shows an anti “S-shaped” fluctuation feature from top to bottom in the TRP03 profile (Figure 3d), with obvious enrichment at 60 cm, followed by increased fluctuations, suggesting an enrichment of Ce.
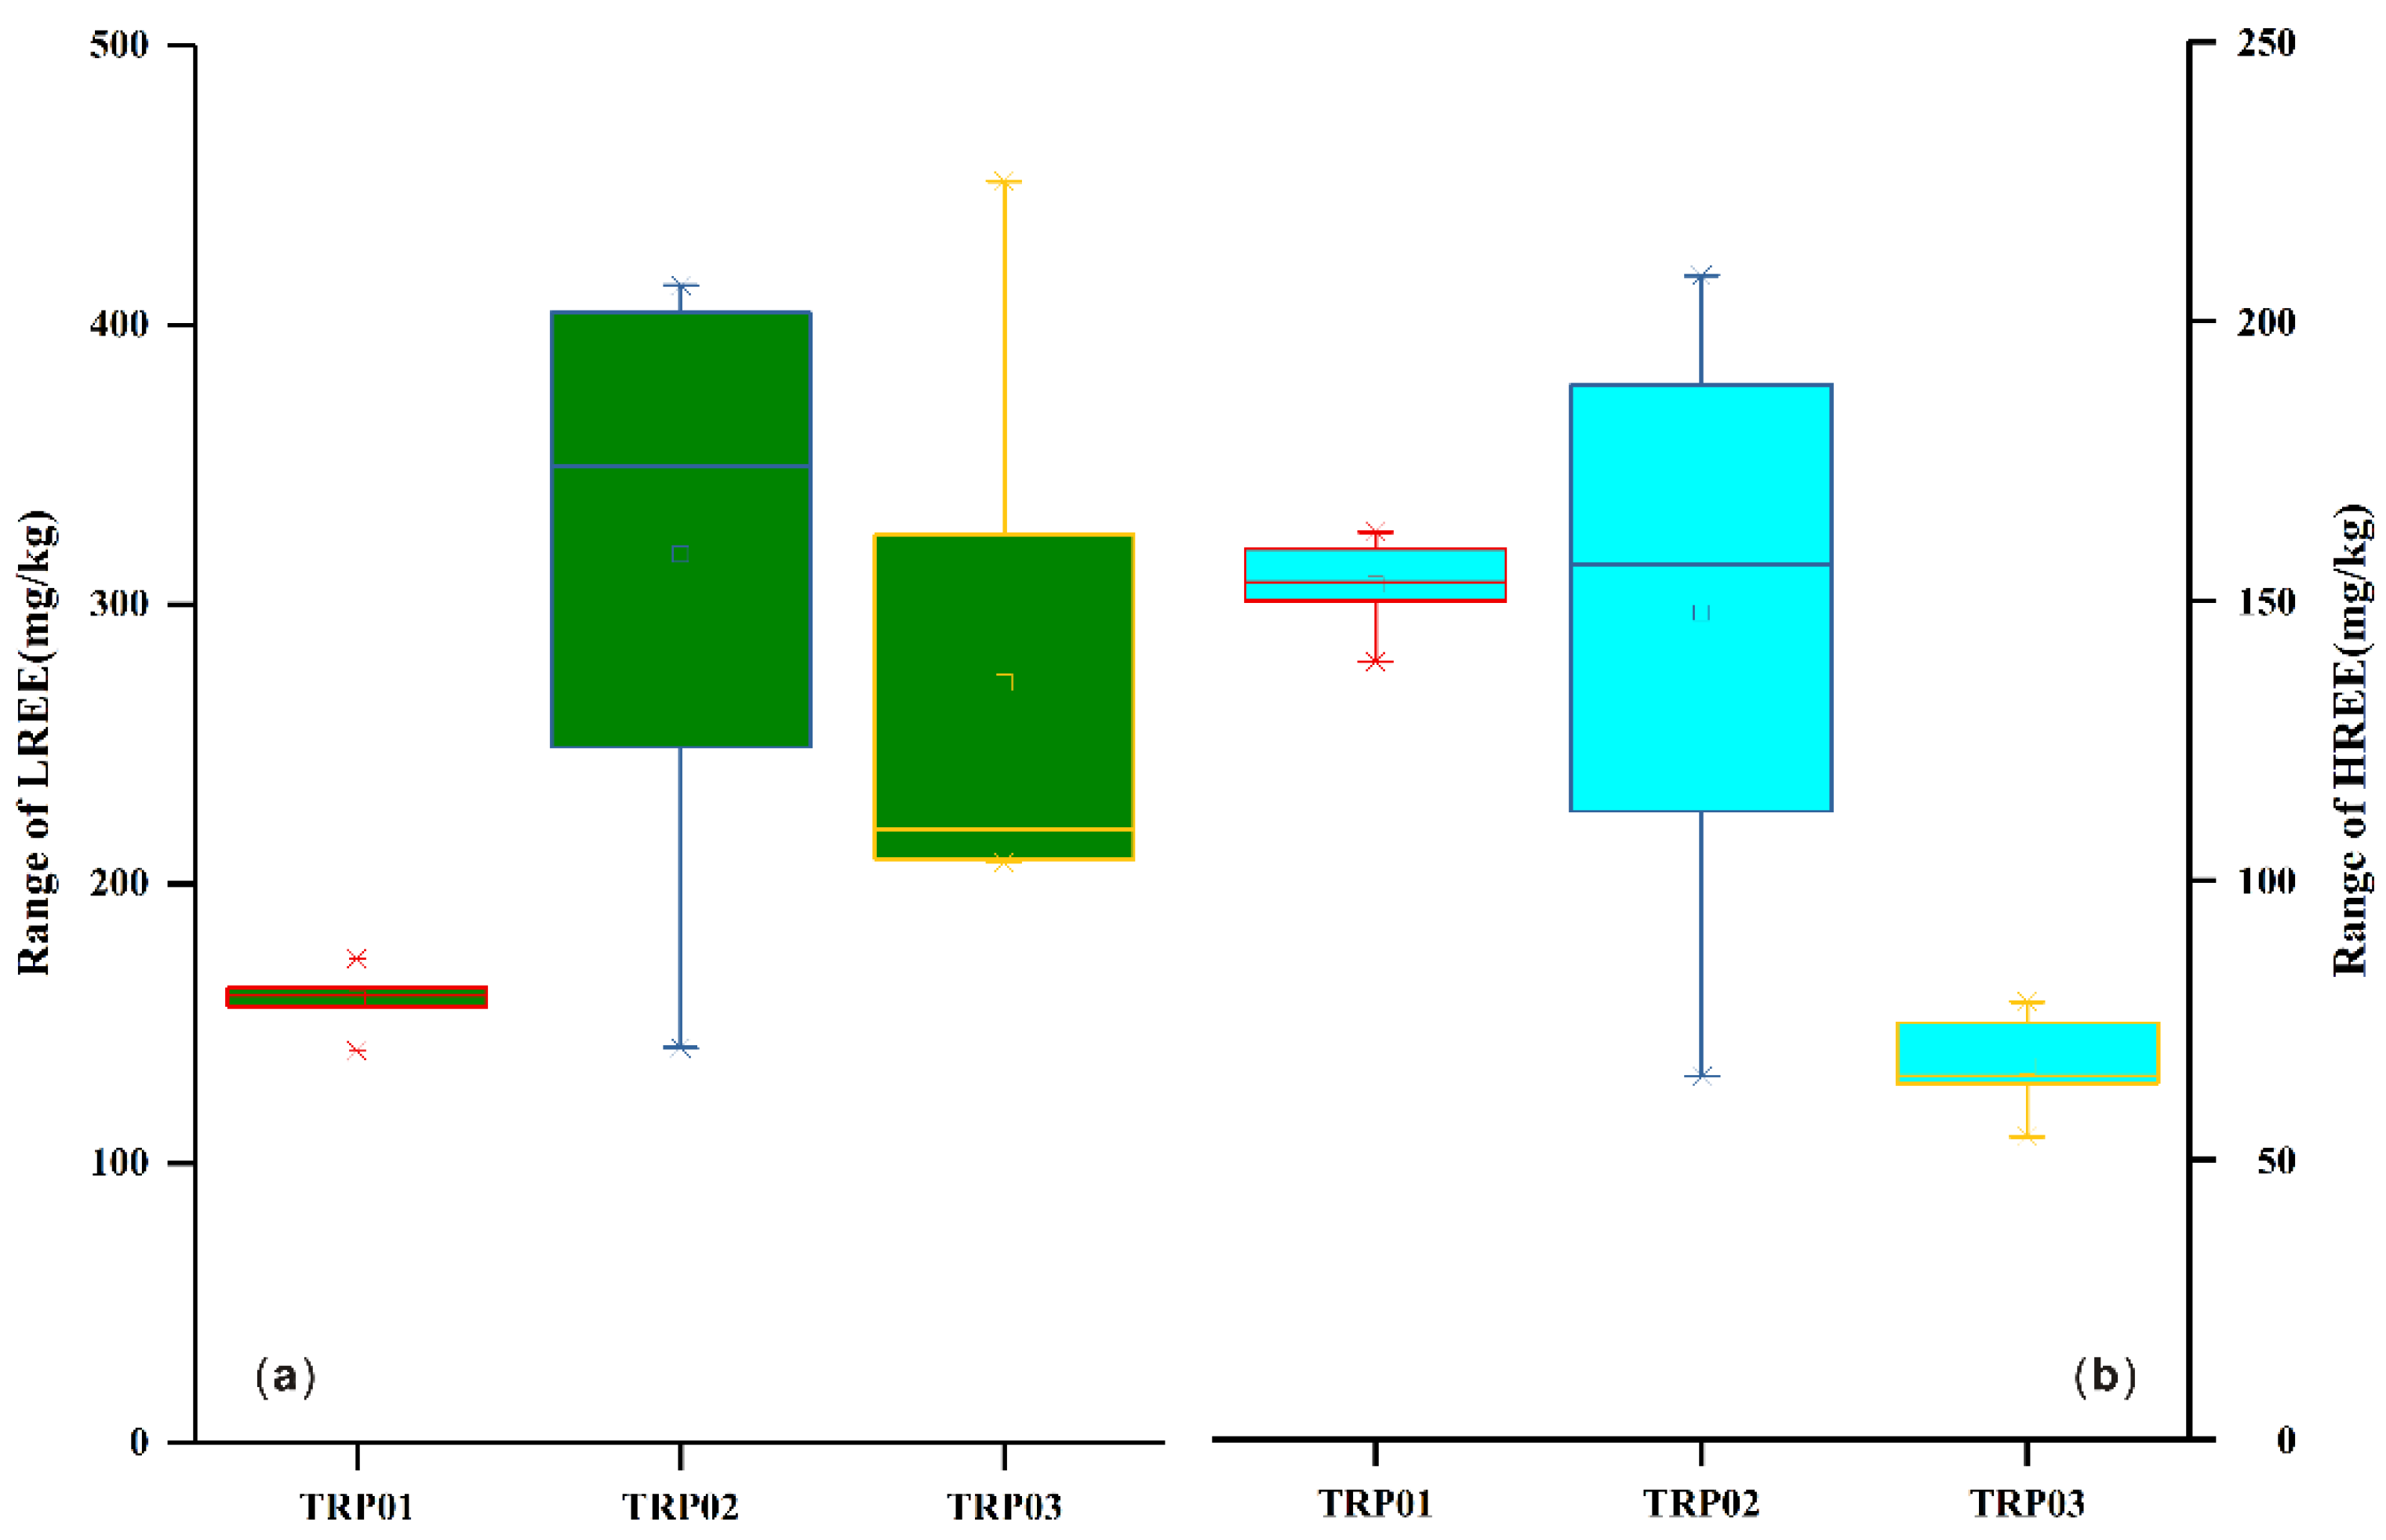
The distribution interval analysis of ΣLREE and ΣHREE contents in the profile indicated that the LREE content in the TRP01 profile changed from 140.20 to 173.35 mg/kg (Figure 4), with an average of 158.79 mg/kg, and a standard deviation of 10.93. This showed that the content of TRP01 increased at the bottom of the profile compared with TRP02 and TRP03.
The rare earth profile content is the narrowest in TRP01 (Figure 4a). This indicated that LREE is evenly distributed in the vertical direction. The distribution range of HREE content in the TRP01 profile is between 139.11–162.31 mg/kg (average = 152.88 mg/kg, standard deviation = 8.16). This is slightly lower than the average LREE content. The distribution range of HREE content in the three profiles is mostly narrow (Figure 4b).
This indicated that the vertical distribution of HREE is more uniform than that in other profiles. The LREE content in the TRP02 profile changes from 141.3 to 414.1 mg/kg (average = 318.0, standard deviation = 105.1). This suggests that LREE has variable distribution characteristics (Figure 4a). This is approximately twice the average content of LREE in TRP01 profile (Figure 3b). The vertical variation changes of HREE content in the three profiles is the largest (Figure 4b). The HREE content in the TRP02 profile changes from 64.9 to 208.2 mg/kg (average = 147.9, standard deviation = 52.3), and is slightly less than the average HREE content in the TRP01 profile. The LREE content in the TRP03 profile changes from 207.7 to 451.4 mg/kg (average = 272 mg/kg, standard deviation = 98.8; Figure 4a). The fluctuation changes of the LREE content in the TRP03 profile is only lower than that of the TRP02 profile. The variation range of HREE content in this profile is relatively narrow (54.1–78.2 mg/kg, with a standard deviation is 8.56). The HREE distribution in the TRP03 profile is relatively uniform vertically; however, the distribution range is smaller than that in the TRP01 profile.
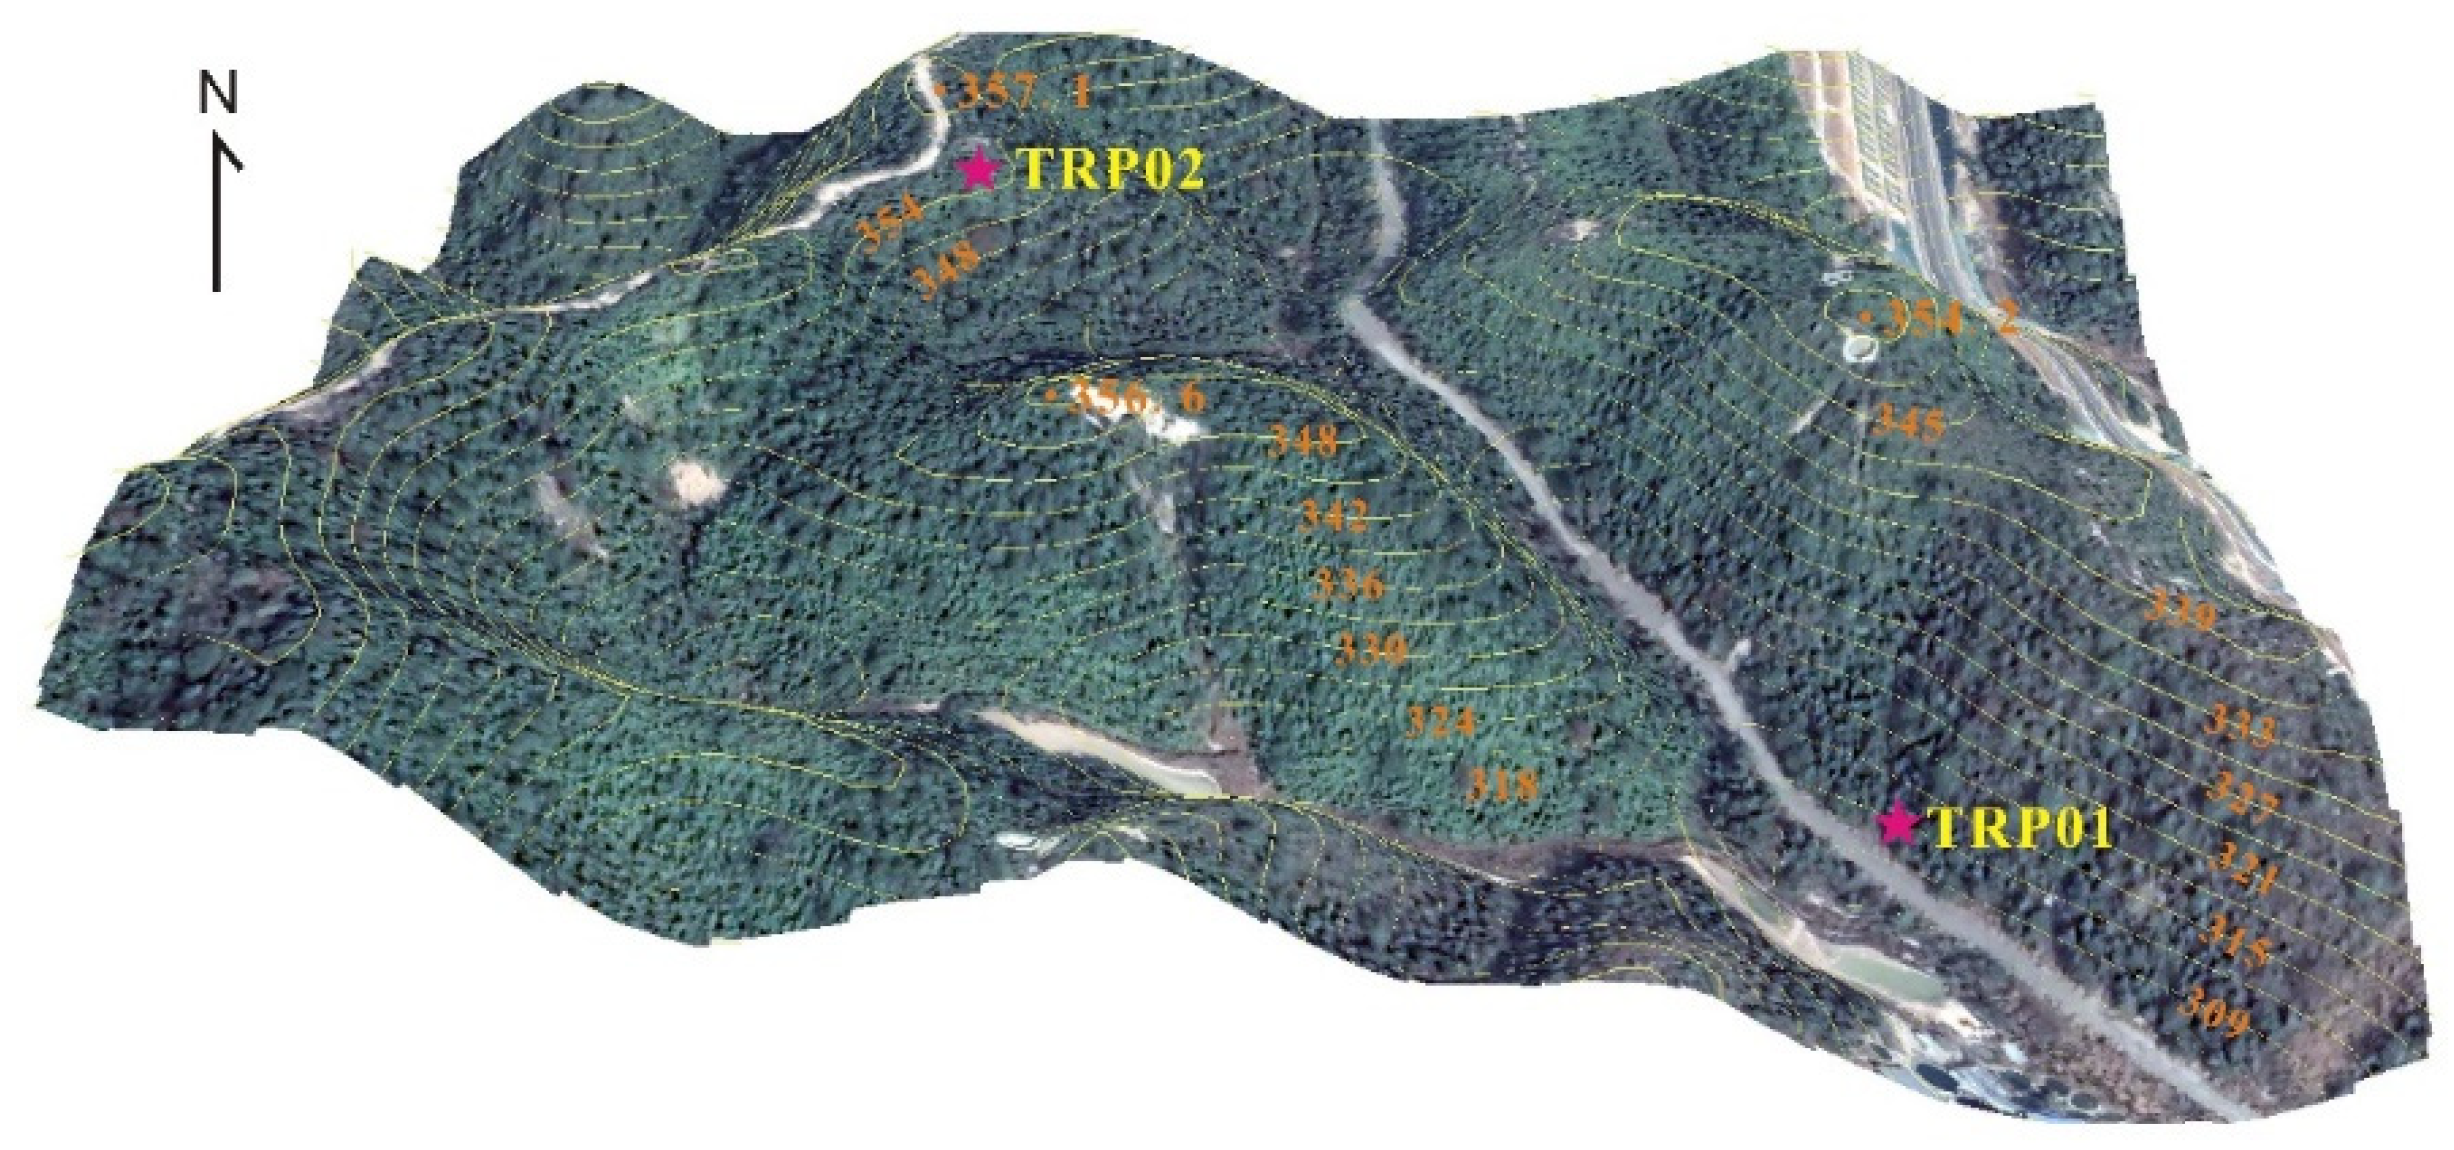
The TRP01 profile mainly contained HREE deposits, TRP02 was enriched in LREE and HREE, while TRP03 contained more LREE than HREE. Moreover, field sampling showed that 356 m of the top elevation of the TRP02 profile had low mountains and hilly landforms (Figure 5). Its upper organic matter layer of weathering crust profile is approximately 15–20 cm, and the lower part is a completely weathered layer, the partly weathered profile is not exposed. Similarly, the TRP01 profile is located in lower-center of the SW slope (Figure 5), and has a relatively thick upper humus layer (>40 cm). The top elevation is 311 m with a completely weathered layer at the top transforming to a partly weathering layer below 120 cm. The TRP03 profile is located in an artificial slope in the SE direction. The highest elevation is 279 m, and the bedrock is granite porphyry; it is presented with a cataclastic rock by weathering.
Some studies considered that the shape and location of the slope surface of the rare earth mining area have a controlling effect on REE enrichment [12,38]. It is deposited by LREE at the upper part of the slope surface of the rare earth mining area, and is concentrated by HREE at the lower centre of the slope surface. The TRP01 profile is located in the lower centre of the SW slope; therefore, the surface runoff and groundwater have a similar migration direction on the slope. Long-term weathering and leaching results in greater extraction of LREE and a higher content of HREE absorbed by clay minerals in the weathering crust. The TRP02 profile is located at the top of the hill and the granite is less weathered by surface runoff and groundwater. This leads to LREE enrichment in the lower centre of the completely weathered layer by long-term weathering and eluviation. The TRP03 profile is located at the foot of the slope; its lithology difference of bedrock results in a main enrichment with LREE after weathering and leaching.
The above analysis indicates that bedrock lithology, LREE and HREE fractionation characteristics, and geomorphological conditions of profiles are mainly responsible for the vertical differentiation of REEs in the study area.

3.3. Spatial Heterogeneity of REEs

The spatial distribution pattern of REEs is formed by multiple processes. This subsection purposed to reveal the spatial heterogeneity characteristics of rare earth elements in the topsoil through spatial autocorrelation, spatial distribution pattern (distance), spatial fractal dimension, etc., in combination with the stratigraphic lithology of the sampling point. Moran’s I index is usually used to calculate the spatial autocorrelation coefficient of each distance class, d in REEs [40]:
I ( d ) = 1 W ( d ) i = 1 , i j n j = 1 , j i n w i j ( d ) ( x i x ) ( x j x ) 1 n i = 1 n ( x i x ) 2
where wij (d) is the distance graded continuity matrix. This indicates that the adjacent sampling positions are within the range of distance d; xi and xj are the measured values of variable x at sampling points i and j; W (d) is the sum of wij, and i, j corresponds to the sampling location of each distance classification. GS+9.0 (Gamma Design Software, LLC., 2008) [28]) software was used to calculate the spatial autocorrelation coefficient.
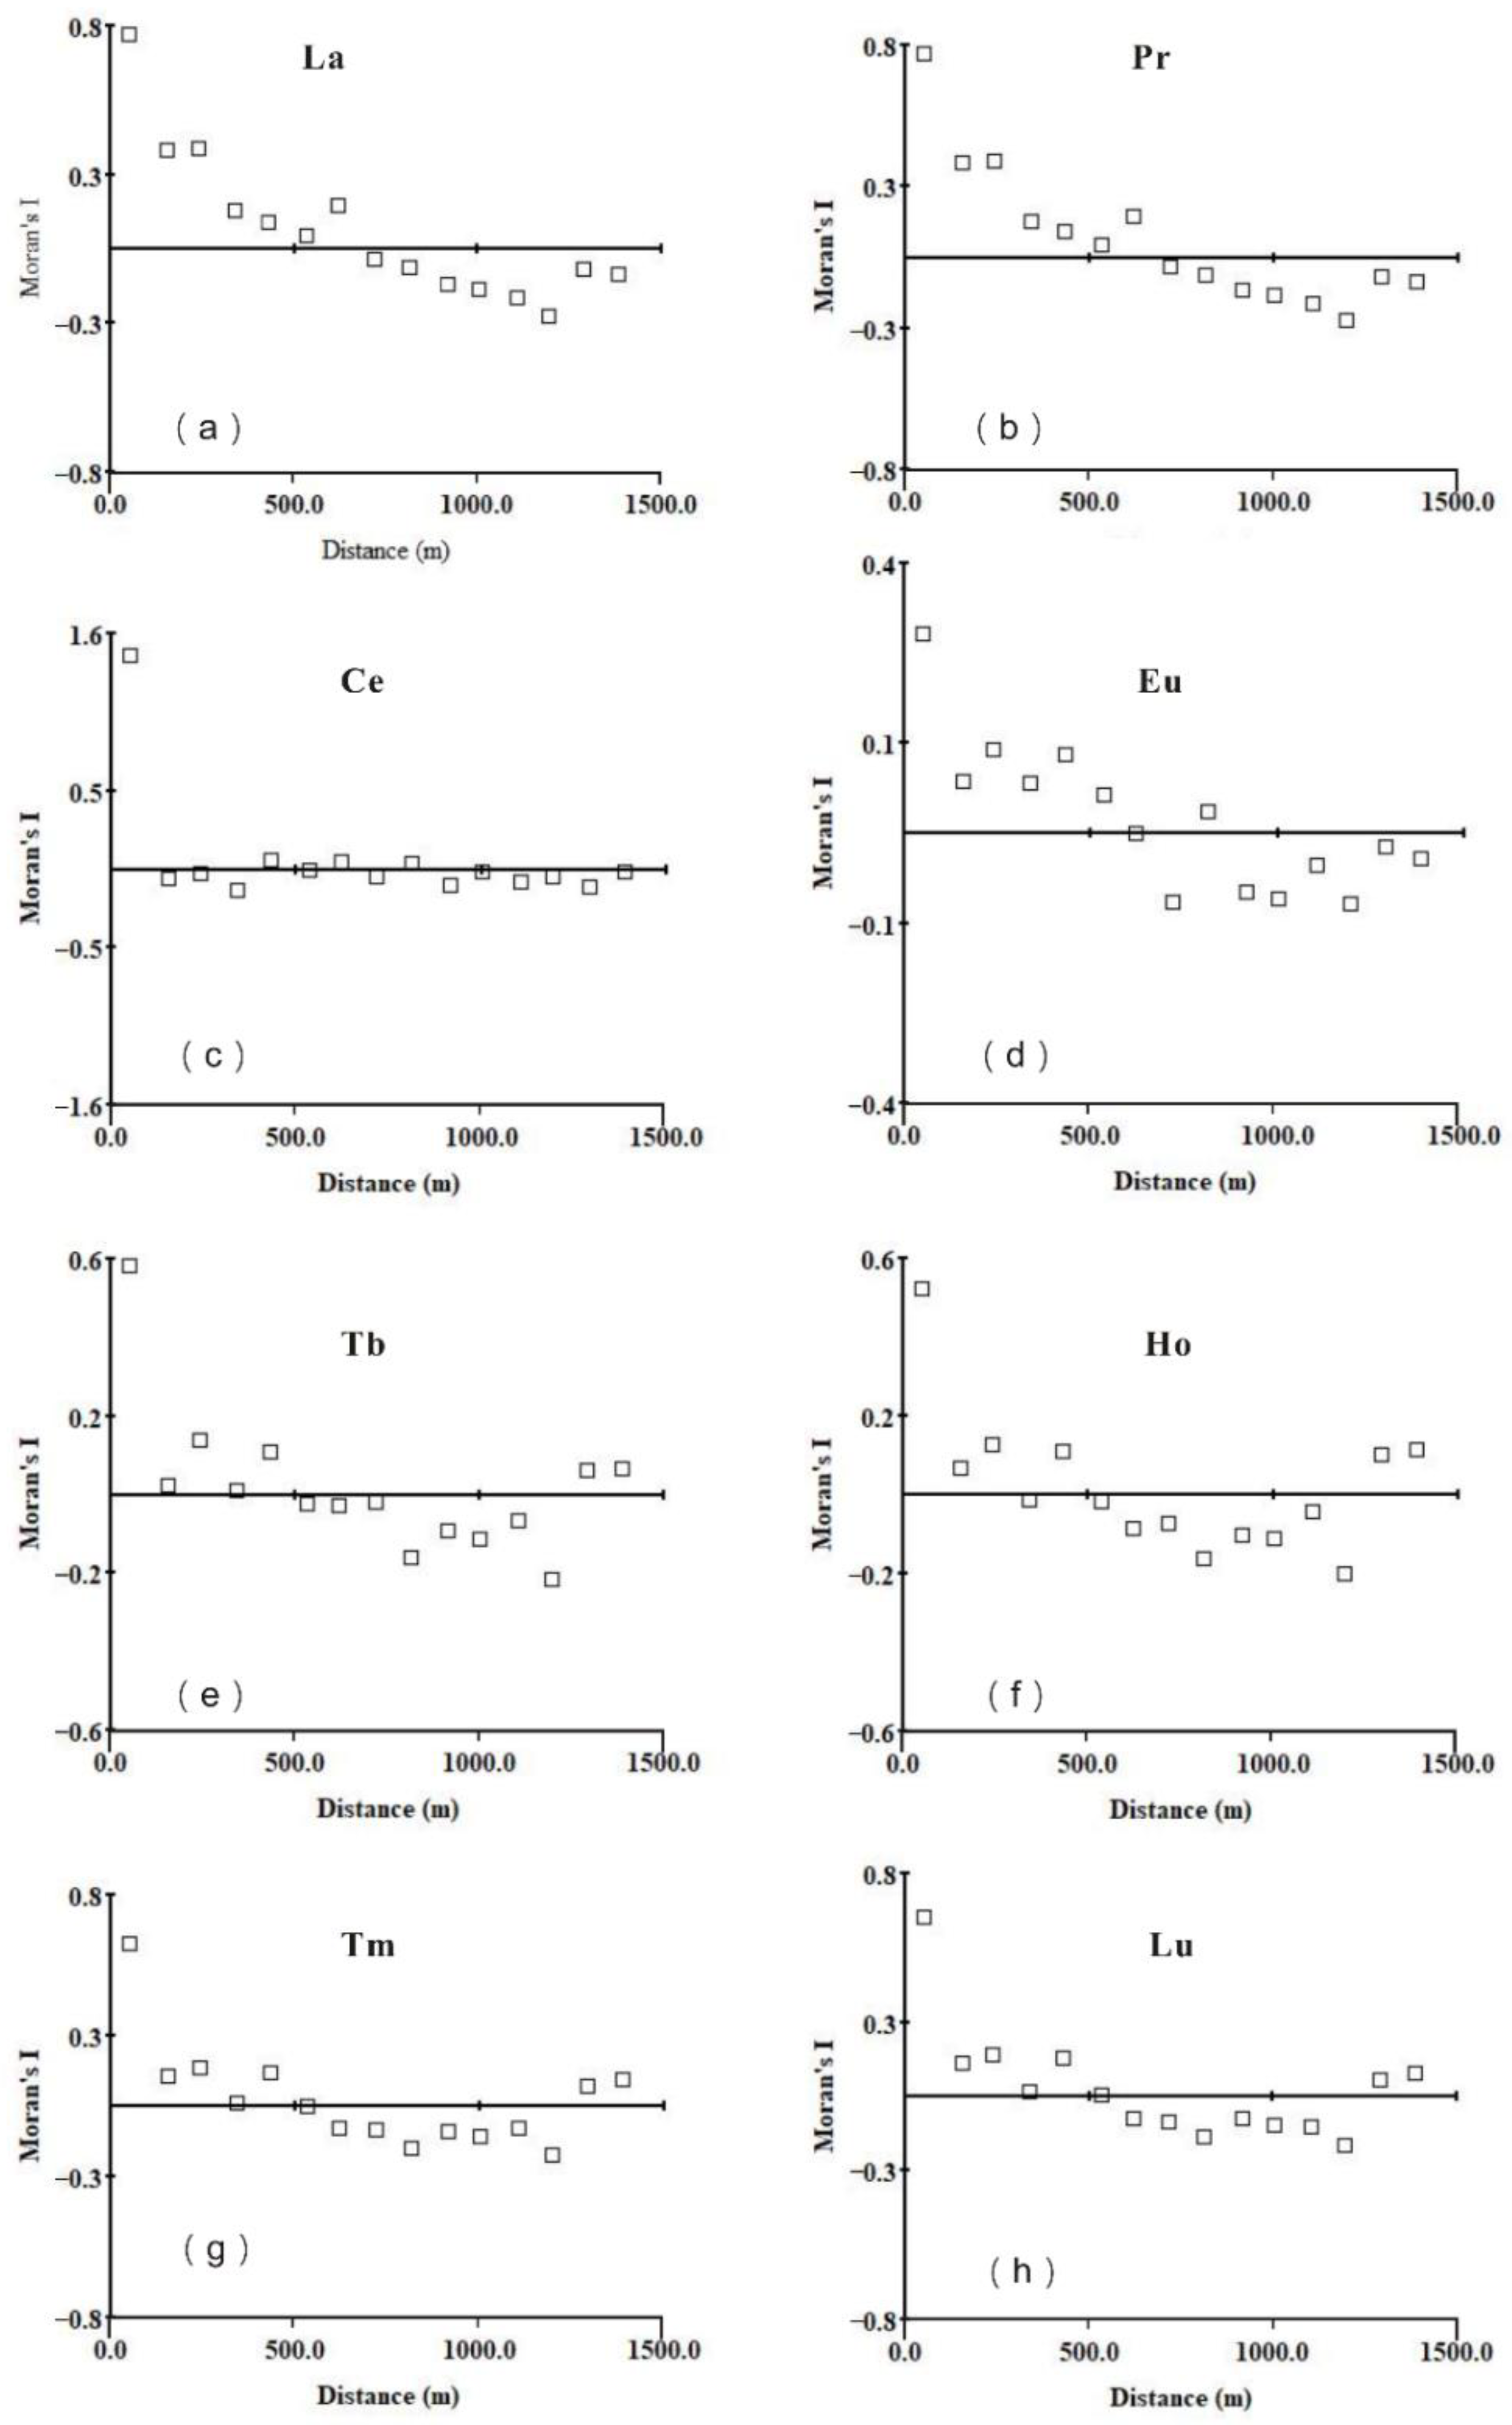
The correlation of La, Pr, and Eu is lower as the distance of sampling points is farther away from each other (Figure 6a,b,d). However, there is an obvious positive correlation within the range of 0–500 m sampling points. The negative correlation increases at greater distances.
The spatial autocorrelation distance of Ce presents an obvious positive correlation within 100 m, while there is an obvious random distribution fluctuation at ~100 m (Figure 6c). The obvious complexity is exposed by the spatial distribution of Ce combined with the analysis of the rare earth ore profile. The spatial autocorrelation of HREE (Tb, Ho, Er, Tm, and so on) has similar characteristics within the range of 0–500 m sampling points; this is an obvious positive correlation of HREE (Figure 6e–h). Moreover, the spatial difference of HREE is significant between 500–1200 m. This indicated an enrichment difference of REE at different sampling locations. Additionally, the positive correlation is distribution at 1300–1400 m. This reflects the characteristics of HREE mineralization in the whole study area.
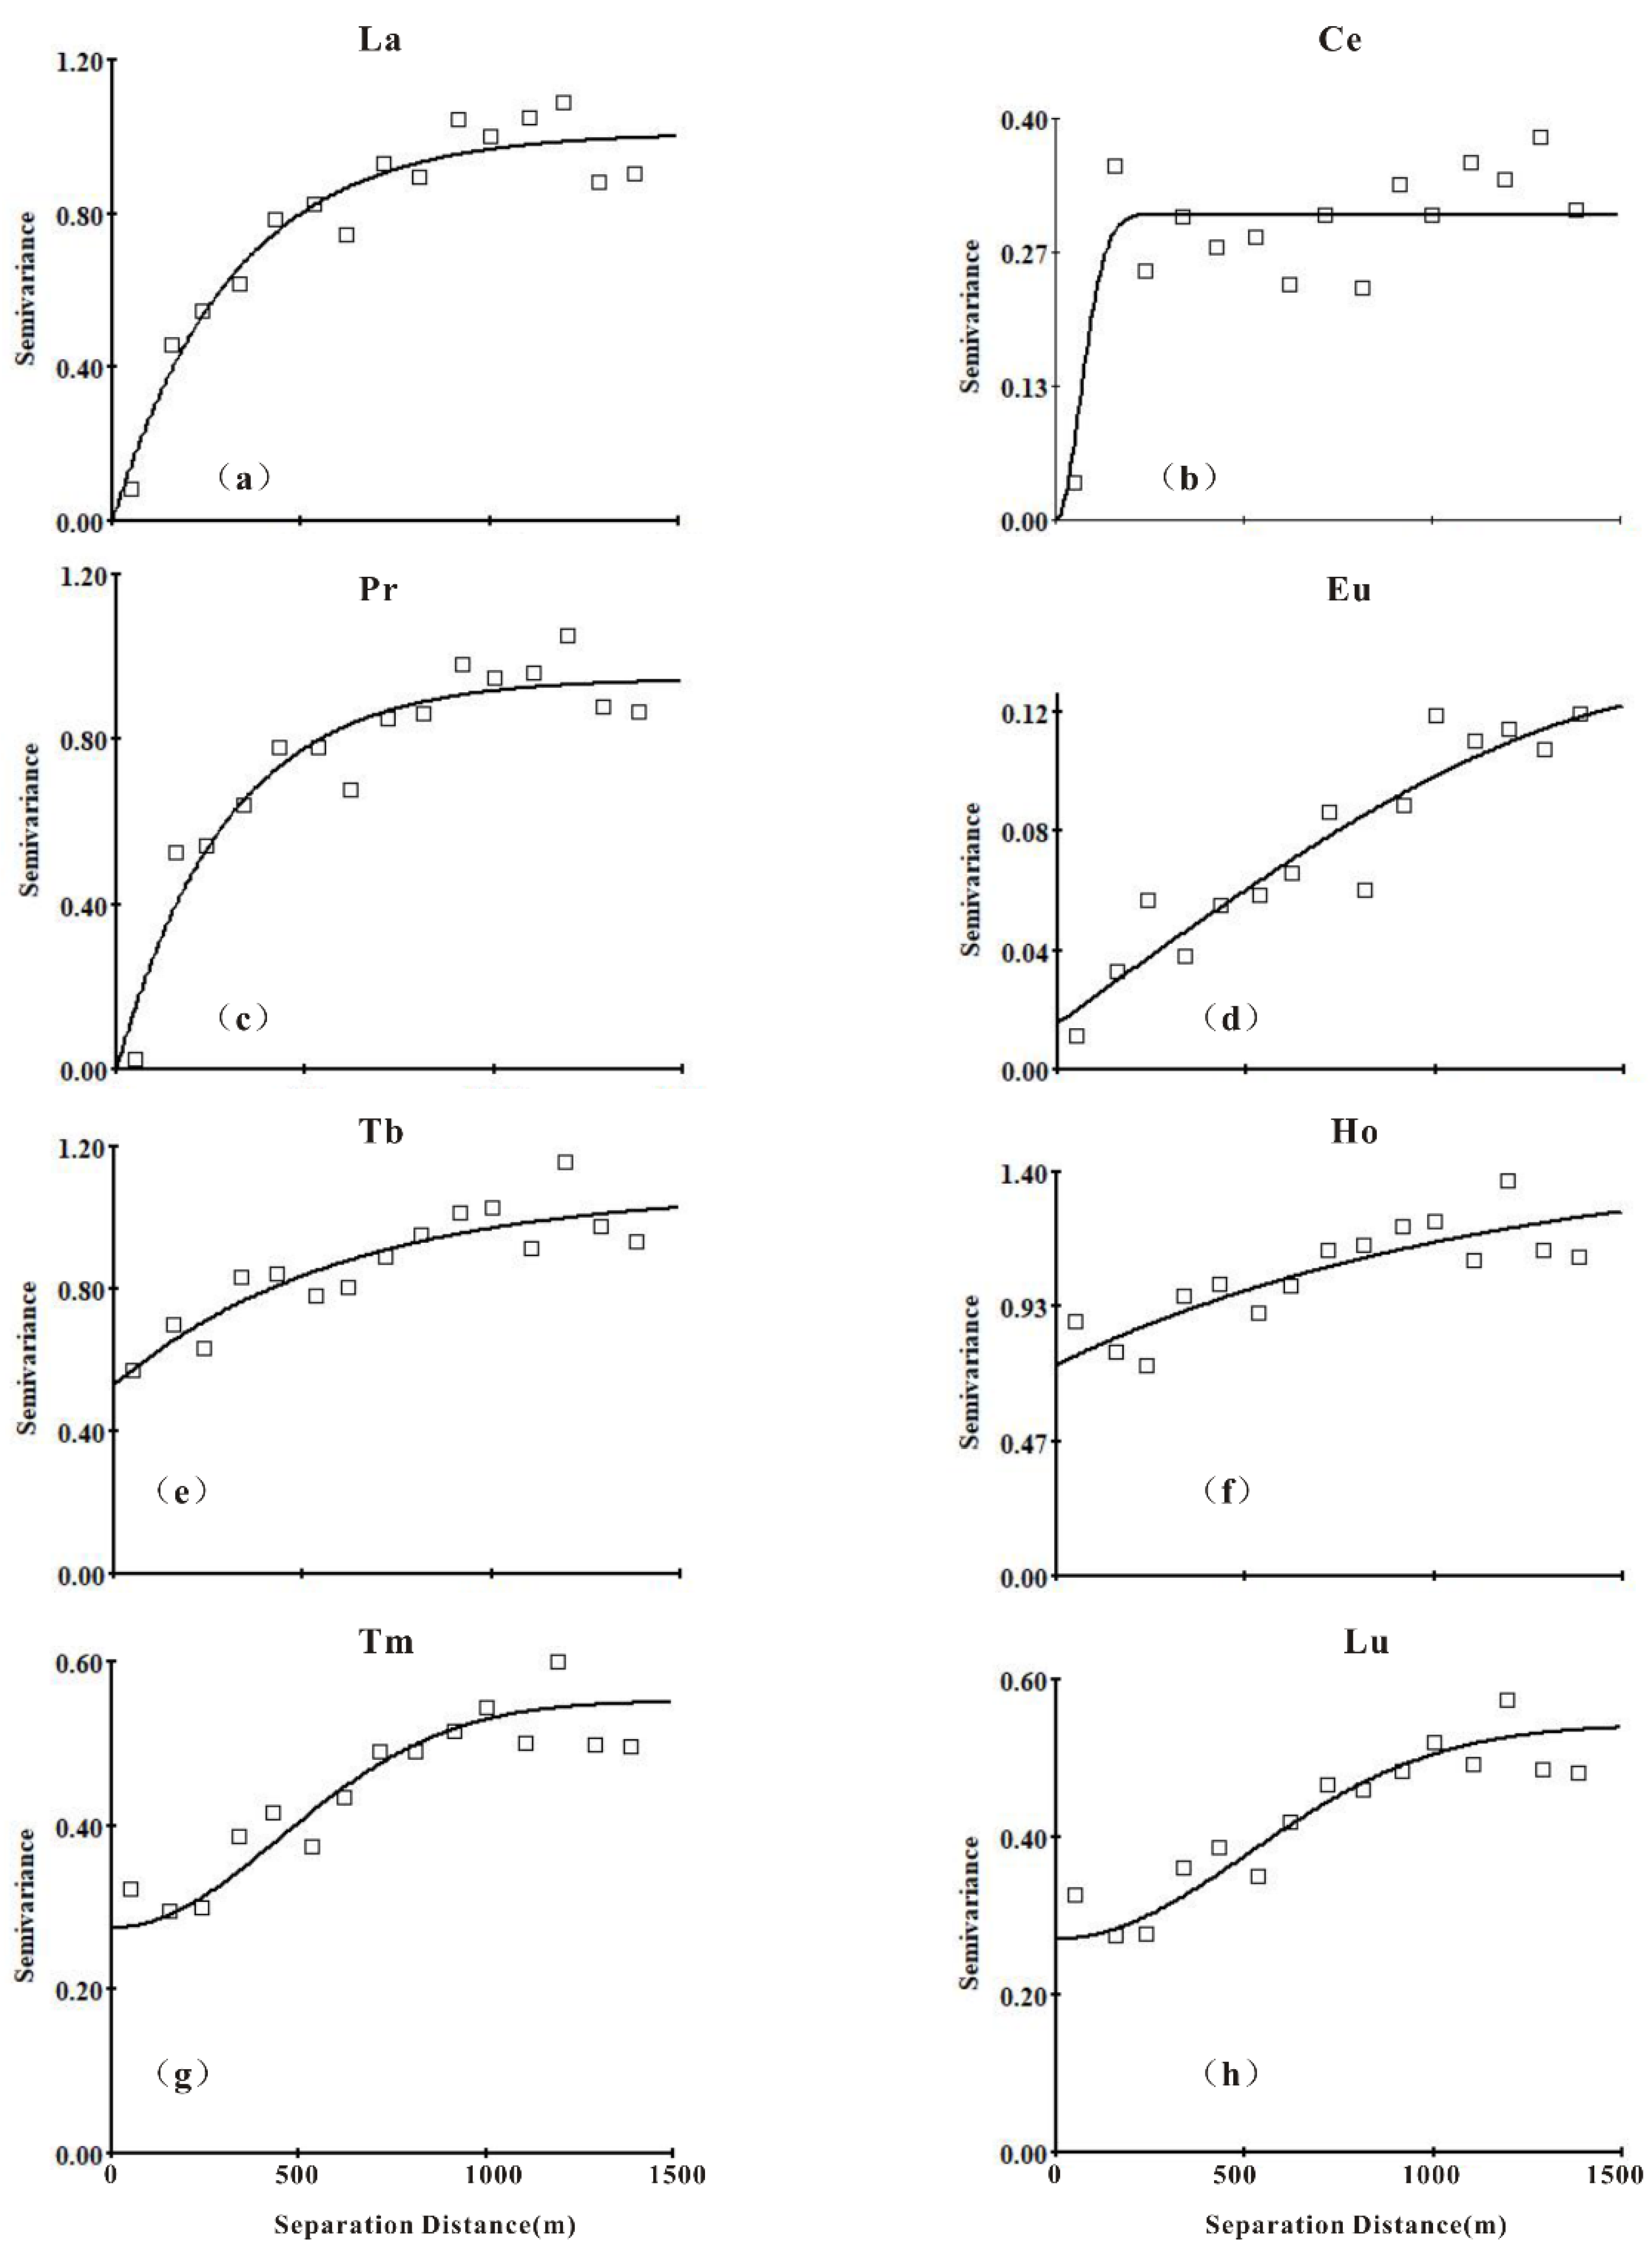
The continuity of spatial distribution can be described by semi-variance function. The characteristic values of the semi-variance function of rare earth elements in the topsoil layer are shown in Table 5. The nugget value (C0), base value (C0 + C), and range (A) are estimated to reflect the variation intensity of variables using the following formula [41]:
r h = 1 2 N ( h ) i = 1 N ( h ) Z x i + h Z ( x i ) 2
where r (h) is a semi variance function; h is the step size. Z (xi + h) and Z (xi) refer to the measured values of the variable Z (x) at the spatial position (xi + h) and xi, respectively, [i = 1, 2, …, N (h)]; N (h) is the number of sample pairs spaced h apart.
The REE content in the topsoil layer that is presented by the mean value of the semi variance function reveal increases with distance, and tends to form a structural variance sill after reaching a certain separation distance. It is worth pointing out that the Ce semi variance graph is the shortest space separation distance to form a structural variance sill (Figure 7b). The maximum fitting coefficient R2 of the REE content is La (93%) and the minimum is Ce (68%). There are three types of fitting models: exponential model, Gaussian model, and spherical model (Table 5). The highest to lowest (C0 + C) values are Ho > Tb > La > Pr > Nd > Sm > Gd > Tm > Lu > Dy > Er > Yb > Ce > Eu; this indicated that Ho is the strongest spatial structure while Eu is the weakest (Table 5).
The maximum C0 is observed with Ho (0.73), followed by Tb (0.53); this suggests that they are relatively affected by random factors. However, the contents of La, Ce, Pr, Nd, and Sm are less affected by random factors. The values of La, Ce, Pr, Nd, and Sm are close to 100%, according to the C/(C0 + C) structure ratio. This indicated that their spatial correlation level is high and is mainly affected by structural factors, but is less affected by random factors. However, the structural ratio of Tb, Dy, Ho, Er, Tm, Yb, and Lu is within the range of 50%–58% (Table 5). This suggested that their spatial correlation was moderated and was affected by structural and random factors.
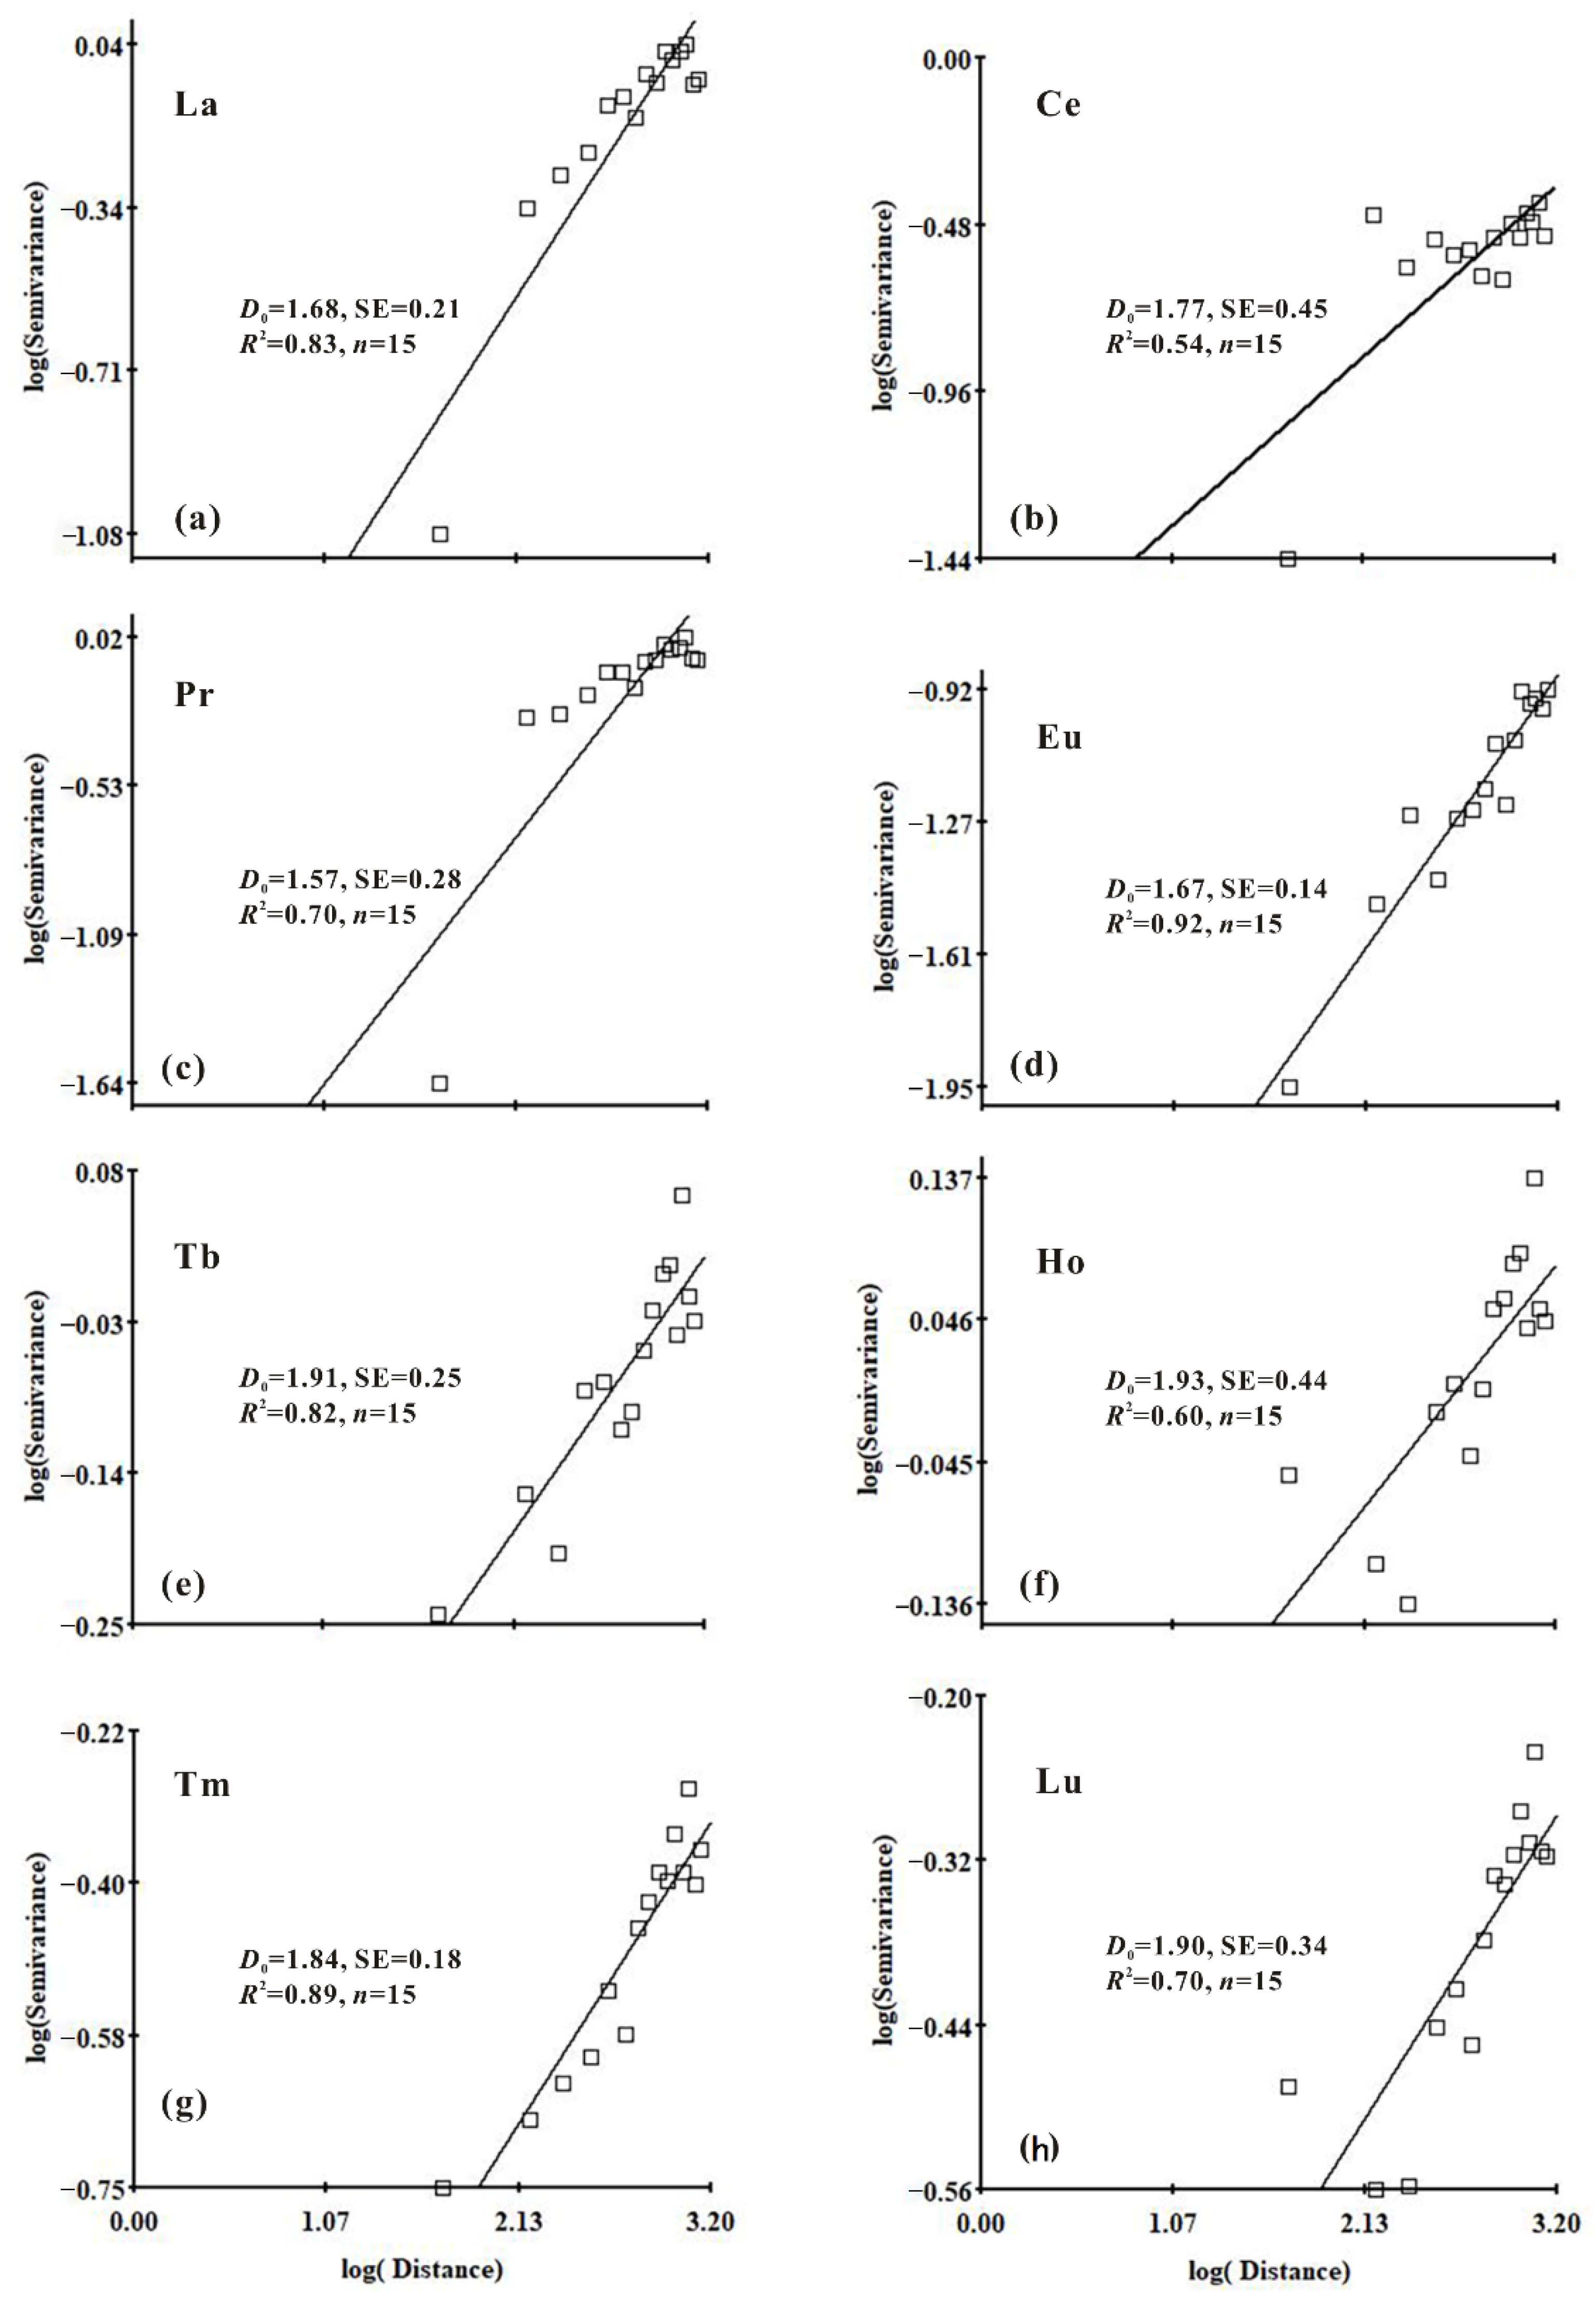
The fractal dimension was Ho > Tb > Lu > Er > Dy > Yb > Tm > Gd > Ce > La > Eu > Sm > Pr > Nd. This revealed that the spatial distribution pattern of Ho is relatively simple and has the strongest spatial dependence, while Nd has the weakest dependence (Table 5, Figure 8).
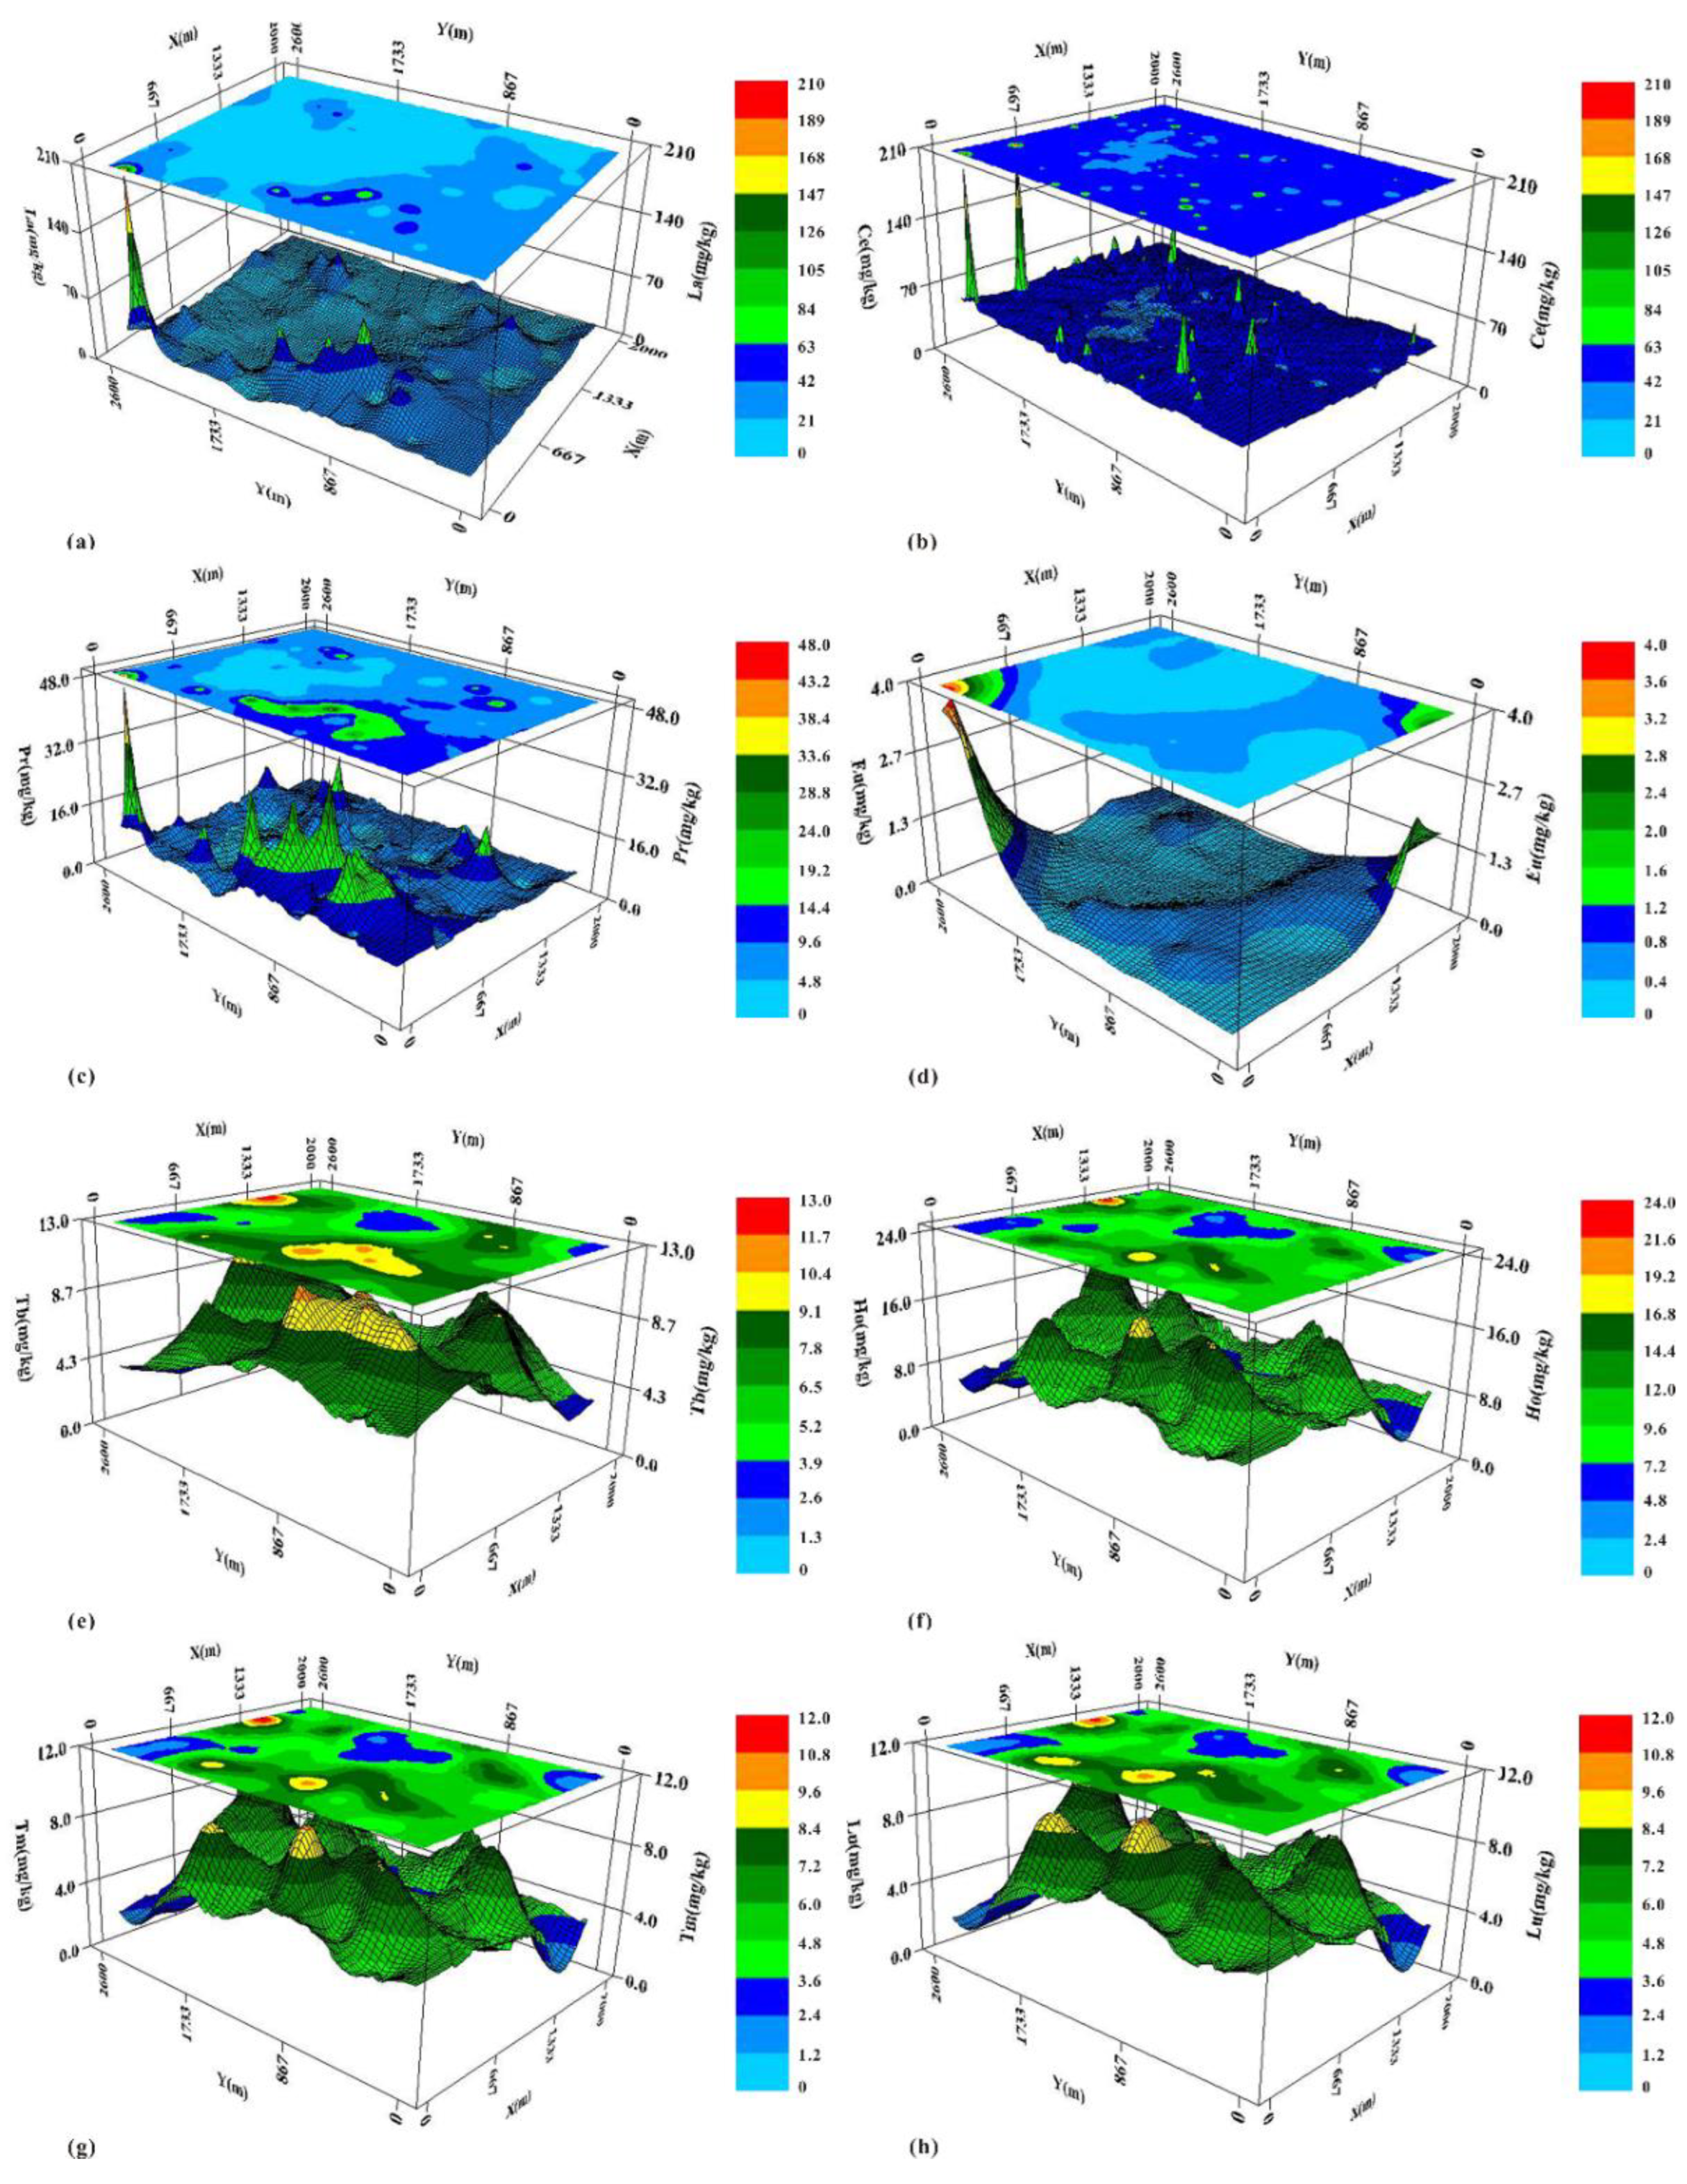
The coordinate origin was cited by the lower left corner and the coordinate system was rebuilt, with the 2D and 3D maps drawn using the Kriging interpolation method (Figure 9). The spatial distribution of various REEs was relatively different.
The high value points of La, Ce, Pr, Eu, and other LREEs are mainly distributed in the northwest corner of the study area, and the content in the west is relatively higher than that in the east (Figure 9a–c). The high HREE values are mainly distributed in the west and north (Figure 9e–h). This shows a good consistency of the horizontal distribution.
The 3D map showed that the spatial fluctuation change of LREEs was less than that of HREEs. There was an occasionally high distribution value; this indicated that their spatial distribution heterogeneity was relatively small. Eu presented a large spatial heterogeneity and a violent fluctuation in the northwest and southeast corners.
The Eu content peaked in sampling point D035 in the northwest region; this section contained manual excavation. The Eu content (5.08 mg/kg) was the highest among all samples in the topsoil layer. This sampling point depth was 40 cm from the surface to the bottom, and the mountain red soil implied that there was a strong weathering and a typical paedogenic environment of the south ionic rare earth mining area. The red soil contained many plant roots, contained some grayish–brown organic matter, and the vegetation above it was dense. The lithology of the bedrock of the soil forming parent material at this point was greyish green basalt, andesitic basalt with basalt andesite, and rhyolitic tuff of Jurassic Changpu Formation (J3c) [42]. REE analysis of the basalt showed that the maximum Eu content was 3.99 mg/km [43]. Therefore, the high value of Eu in the topsoil layer at this point might inherit the characteristics of the soil forming parent material. Meanwhile, the southeast corner (D030) had a similarly high value point with a manual excavation profile at a sampling depth of 320 cm. It contained the same mountain red soil, and the parent rock lithology was siltstone and fine sandstone, suggesting to divide Longtan formation (P2l) in the Permian period. The regional rock geochemical analysis showed that the highest Eu content in Longtan formation was 16.40 mg/kg, and the average value was 3.84 [12]. This indicated that the Eu enrichment at the topsoil reserved the characteristics of the parent rock information. In addition, Longtan formation was a typical coal and shale gas bearing rock, with an average total organic carbon (TOC) content of 5.34% [44]. The high organic matter in the bedrock provided favorable conditions for Eu enrichment after weathering [45,46]. The exponential fitting model was adopted according to the fitting results of the ΣREE semi variance function.
The ΣREE content in the topsoil of the study area was several times higher than the national background value (187.6 mg/kg) compared with the background value of Chinese REE [25]. We previously argued that there was a high risk of rare earth pollution for regional soil in rare earth mining areas in South China even if there was no mining activity or manual excavation in the study area [26].
Therefore, the background value of soil REE in this area should be determined by dividing it into the mining area, transition area, and primary environmental area according to the boundary line of current mining activities and divide the background value by referring to the research results in this paper for the purpose of hierarchical management and to control the soil environmental risk. We should not simply refer to the background value of soil REE in Jiangxi Province or the national standard.
The cancer slope factor (SF) is used to assess the risk of carcinogenesis as follows [47]
Riski = EDIs × SFi
R i s k T o t a l = i = 1 n R s i k i
Among them, Riski is the carcinogenic health risk of the ith rare earth element; EDIs is the estimated daily intake (μg·kg−1·d−1) of bioaccessible REEs via leafy vegetables, root vegetables and drinking water consumption for local people of different gender/age group [23], the mean value of 55.4 kg·μg−1·d−1 is used in this article. RiskTotal is the sum of the Riski values of all REEs. According to the US EPA Integrated Risk Information System (IRIS) [48], the cancer slope factor SF is shown in Table 6:
The carcinogenic risk of Riski or RiskTotal is classified as: no significant risk (<10−6); acceptable/tolerable (10−6~10−4); unacceptable (>10−4) [49].
From Table 6, the risk of rare earth uptake in the topsoil of the study area was not substantial, and Ce and Sm were in acceptable ranges. A comparison of the rare earth ion exchange concentration in the weathered crust around Guangzhou showed that the highest conversion rate of dissolved rare earth ions in the soil was reached 108% [23]. The average content of rare earth elements in the topsoil layer of this area was ranged from 10−4 to 10−6, and their exchange and transformation over time has been a significant environmental risk.
The above analysis showed that the overall correlation of LREEs decreased with increasing sampling distance, while the correlation of HREEs was significant with distance; semi variance function fitting showed that the spatial structure of Ho was the strongest, while Eu was the weakest. The spatial fractal dimension showed that the spatial distribution pattern of Ho was relatively simple and spatially dependent, whereas Nd had a weak spatial dependence. In addition to Eu, the strong spatial heterogeneity of HREEs was responsible for the soil environmental characteristics of high background value of total rare earth content in the topsoil of the region, although the spatial heterogeneity of LREEs was relatively less than that of HREEs. Over time, as the exchange capacity of ionic rare earth ions has increased, so has the risk of rare earth ingestion.

4. Implication

4.1. Rare Earth Element Differentiation Patterns in Topsoil

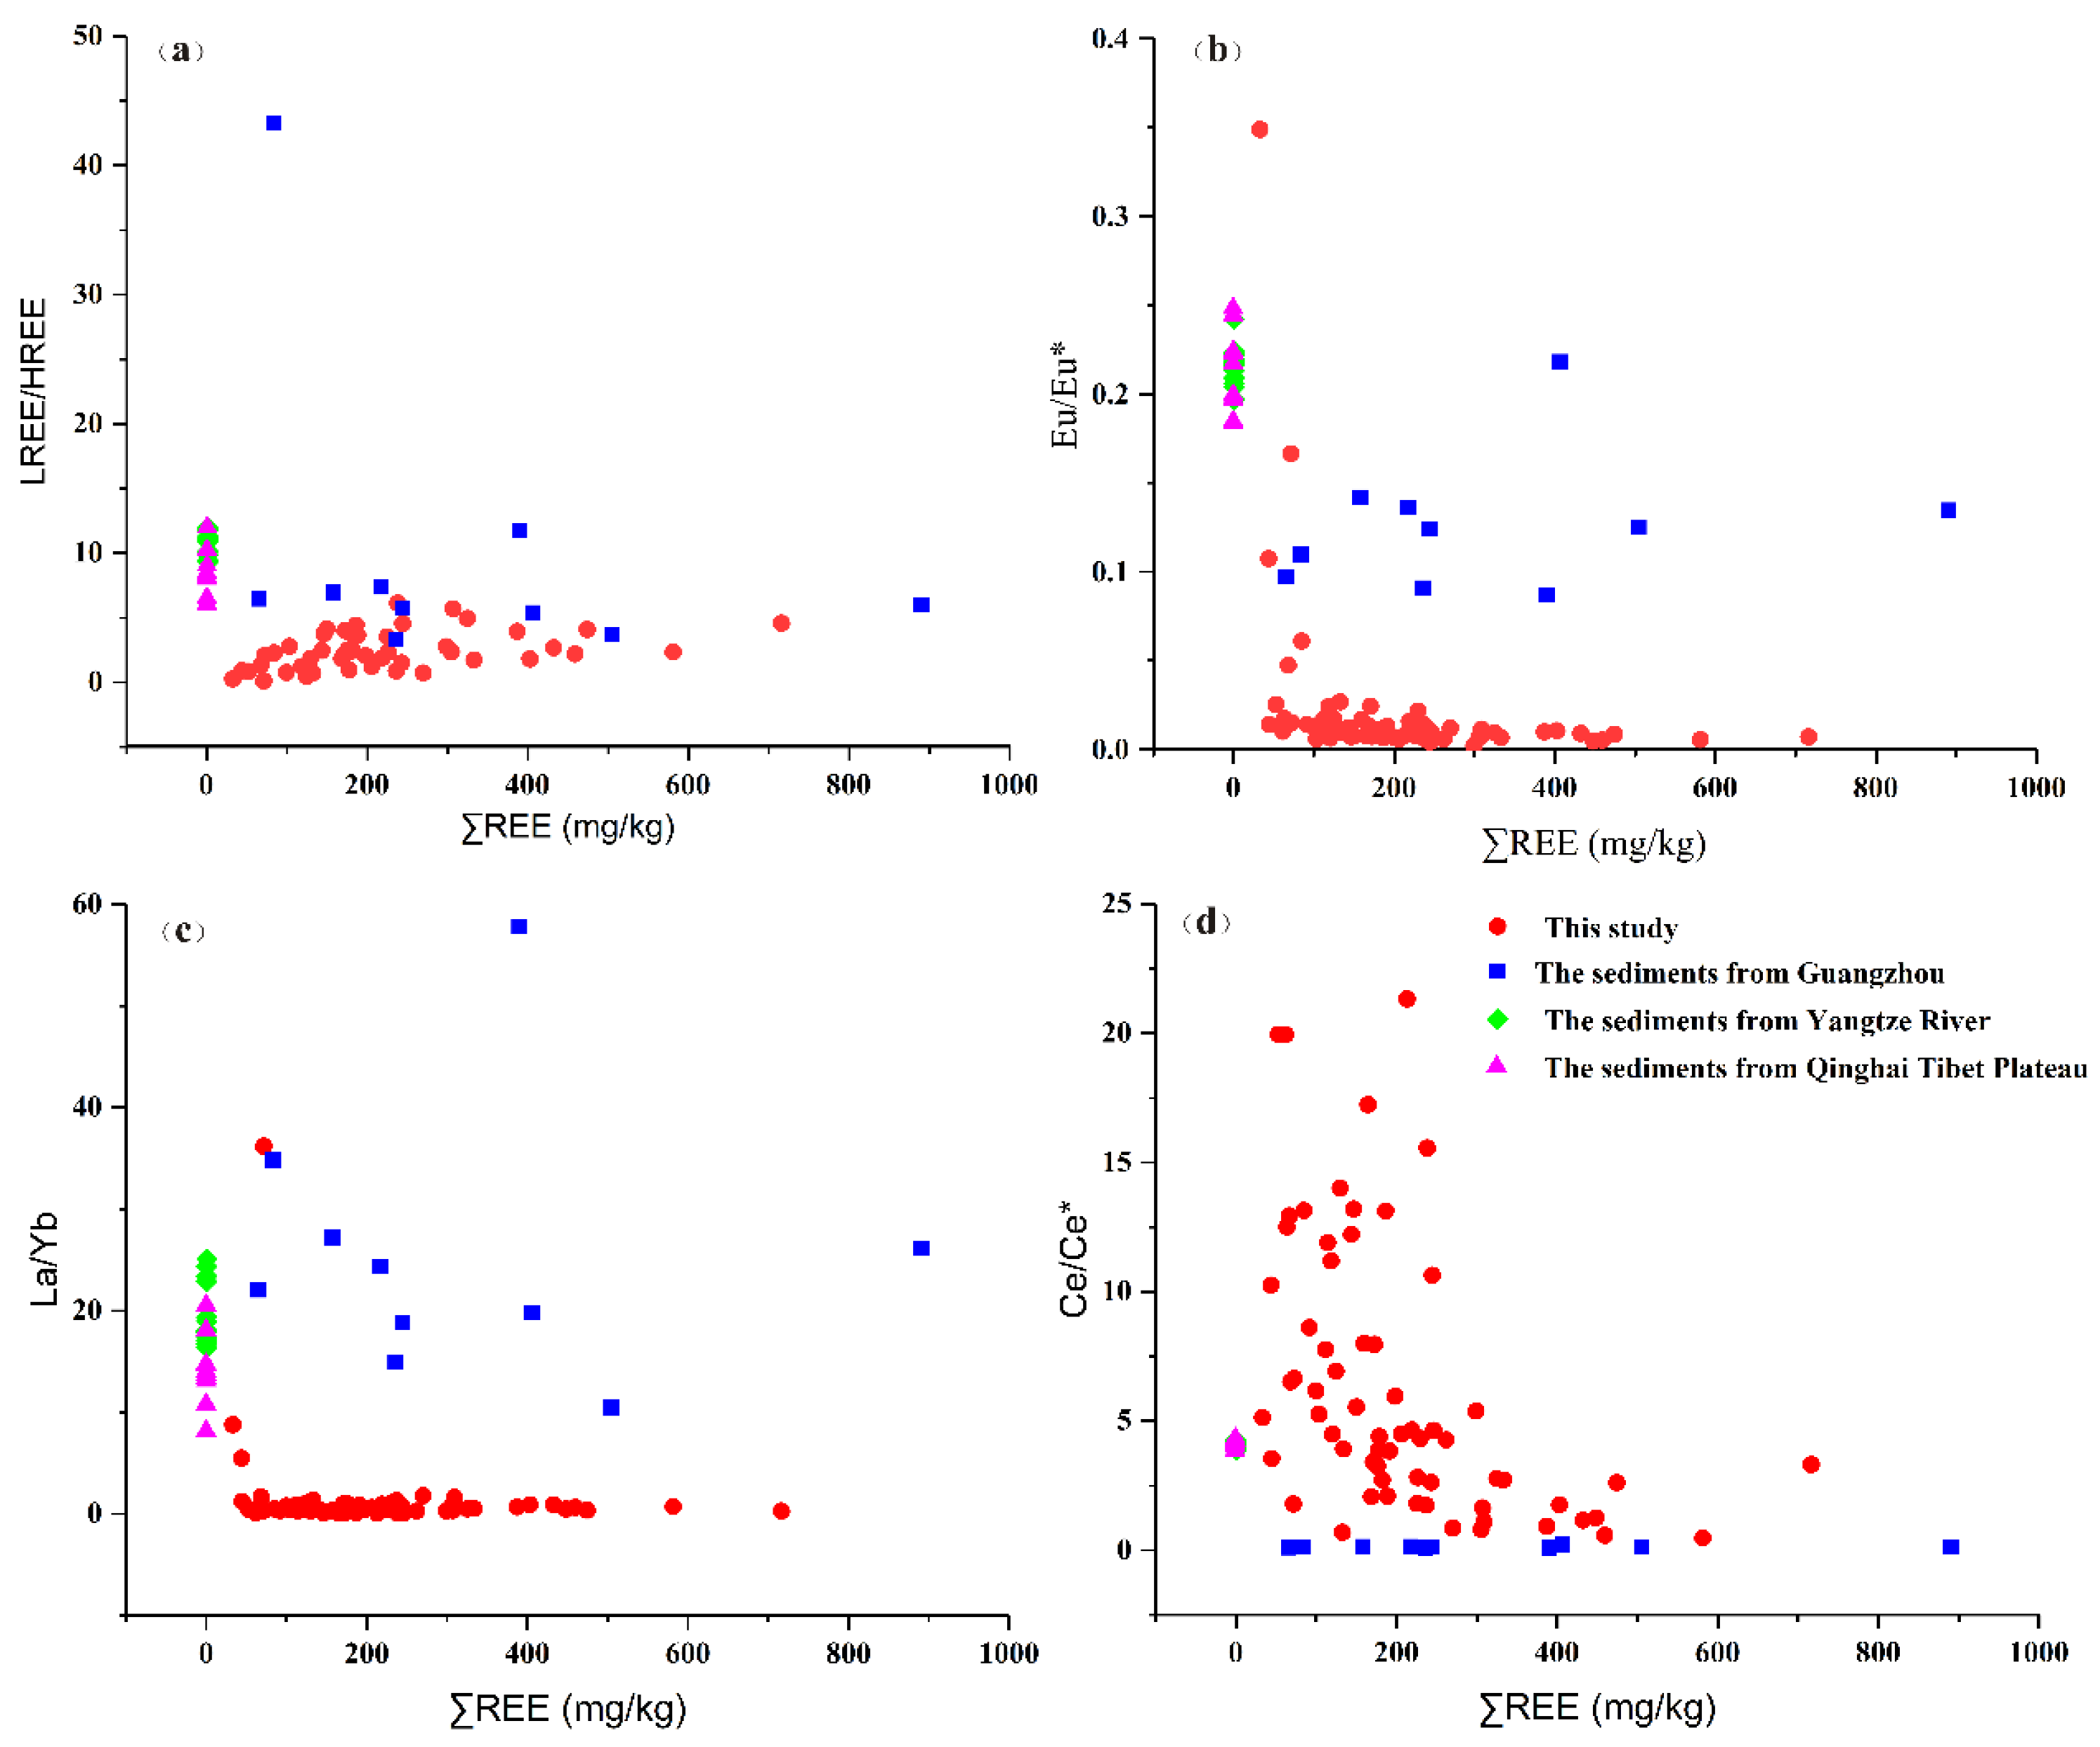
The REE standard chondrite in the topsoil of the study area showed that the Ce content presents obvious positive and negative anomalies and changing fluctuation similar to that of La (Figure 2a,b). The average content of Y was 12.4 times that of the background value. This implied an obvious enrichment in the topsoil. The index differences of LREE/HREE, Eu/Eu*, Ce/Ce*, and La/Yb were significant after analyzing the distribution patterns of rare earths in different regions and sediments, and compared with Guangzhou peripheral soil [23], Yangtze River basin river sediments [21], and Qinghai Tibet Plateau sandy topsoil (Figure 10) [50].
The total content of rare earths is relatively low in river sediments of the Yangtze River basin and sandy topsoil of the Qinghai Tibet Plateau. The ΣREE content in river sediments of the Yangtze River basin fluctuated from 0.15–0.22 mg/kg [21], and ΣREE content in the sandy topsoil of the Qinghai Tibet Plateau ranged between 0.04–0.27 mg/kg [50]. The difference in the distribution pattern of REEs in river sediments of the Yangtze River and the Yellow River basin was presented by a determiner of mineral composition and climate [21]. Rare earth distribution in other large river sediments of the world (such as the Mississippi River and the Amazon River) was similarly significantly different [51]. REEs are mainly concentrated in fine particles in river sediments that were enriched in LREE and depleted in HREE (Figure 10a) [21,51,52]. The REE content in the sandy topsoil of the Qinghai Tibet Plateau was controlled by the lithology of the bedrock and different weathering degrees control the REE content in the topsoil. This suggests that it was enriched in LREE and depleted in HREE [50,53]. The LREE/HREE distribution of rare earths in urban and peripheral soils of Guangzhou showed that the average ratio was 9.99, and the highest value was 43.3 (Figure 10a). This enrichment of LREE in the soil implied a greater risk to the environment [23]. There were two types of LREE/HREE ratios in the study area of this work the ratio of 14 samples was below 1, indicating that the HREE in the topsoil were relatively enriched; however, most ratios were above 1, showing LREE enrichment. The average LREE/HREE ratio of topsoil in the study area is 2.51. This is lower than that in Guangzhou and its surrounding areas. Therefore, the soil environmental risk is relatively low.
The Europium valence does not change in the natural environmental. However, the Eu2+/Eu3+ ratio increases with higher (Al + Si)/O ratios in aluminosilicate melts. Eu3+ and Eu2+ generally prefer a high and low oxygen fugacity environment, respectively [54]; Eu3+ is an incompatible element that occurs in the magmatic oxidation stage and can be preferentially reduced to Eu2+ magma with plagioclase crystallization. This ion exchange condition shows that the magma has a negative Eu anomaly (Eu/Eu* < 1) [5]. Therefore, Eu/Eu* in the topsoil represents the information of rare earth fractionation of the original rock. The Eu/Eu* ratio of river sediments in the Yangtze River basin and topsoil in the Qinghai Tibet Plateau is between 0.15–0.25 (Figure 10b), and the Eu/Eu* ratio of topsoil in regional soil of Guangzhou is mostly between 0.1–0.25. Meanwhile, the Eu/Eu* ratio in the study area is below 0.05 and it is intensively distributed; this shows that the topsoil has an obviously negative Eu anomaly.
Ce enrichment or depletion is formed under normal natural oxidation-reduction conditions [55]. Both oxidation states of soil Ce are present under oxidation-reduction conditions. Ce3+ is more easily oxidized to Ce4+ under high oxygen fugacity conditions; Ce4+ is more easily adsorbed (and shows less migration) by iron hydroxide compared with Ce3+ (Ce/Ce* > 1) [2,56,57]. The positive Ce anomaly in the topsoil of the study area (Figure 10d) is obviously different from Ce fractionation in the regional soil of Guangzhou, Qinghai Tibet Plateau, and river sediments in the Yangtze River basin. The Ce in the LREE topsoil in this study area is differentiated from other REEs because the topsoil is leached [58]. The migration of LREEs results in a higher Ce/Ce* ratio in the topsoil. In addition, the La/Yb ratio showed that the LREEs and HREEs in the topsoil of the study area were not significantly differentiated (Figure 10c), and the HREE content in the topsoil was significantly higher than that in the topsoil of Guangzhou.

4.2. Enrichment Factors of REEs in Topsoil

The enrichment of ionic type rare earth deposits in Southern China is controlled by many factors, including original parent rock, pH values, weathering degree, landform, grain size, clay mineral content, soil organic matter, and so on [12,16,17,22,30,59]. The above ore forming factors of ionic type rare earth deposits can be used for reference in the spatial distribution and distribution pattern of REEs in topsoil. The content and distribution pattern of REE in the topsoil is inherited by a certain genetic relationship with the original parent rock [23,57]. The topsoil layer in this study appears have a significantly different REE content and distribution pattern compared to REEs from similar sampling horizons (depths) of the topsoil layer under the same or similar climate and geomorphic surface conditions; however, this is only a theoretical inference. In fact, the enrichment and spatial distribution of REE in the topsoil layer is also affected by the material composition and particle size, clay mineral content, soil organic matter, and human activities in the weathered layer.
The topsoil samples from Anyuan County, Longnan city, Dingnan County, and other rare earth mining areas are obviously unimodal and bimodal [12]. There is a significant peak estimated in the particle size range of 2.1–17.2 μm; the grain size ratio range is over 70% and is controlled by fine particles. The first peak point of the double peak type appeared at 1.7 μm. The particle size range is 1.4–2.6 μm, and the maximum peak range is 2.6–9.76 μm; this indicates a large difference in the particle size grading of the surface soil in the rare earth mining area.
The cumulative “S” shape grain size curve suggested that the grain size of the topsoil layer was relatively fine, and the grain size increased with depth. This is because the feldspar minerals in the soil were rapidly decomposed, and the SiO2 leached and precipitated; this resulted in an increase in quartz particles. The continuous downward migration was caused by the increased particle size in the lower weathering shell [30]. REEs in sediments are usually enriched in clay and silt, while sand is less enriched due to the dissolution of quartz and carbonate [60]. Clay mineral particles are adsorbed by metal cations such as Fe, Mn, and Al when the particle size of the soil is below 2 μm; they are formed with metal oxide precipitation, and provide conditions for rare earth ion precipitation in the soil [61]. The average grain size of the sediment in the Yangtze River basin is smaller than that in the Yellow River basin, and REEs are enriched in the 1–5 µm particle size [52]. The sediments of the Yangtze River basin contain more REEs than that from the Yellow River basin [51]. The rare earth content in coarse sediment is relatively low [62]. The weathering degree of parent rock and the spatial distribution difference of particle size of the topsoil in the study area had an important impact on the enrichment and spatial distribution mode of REEs in the topsoil.
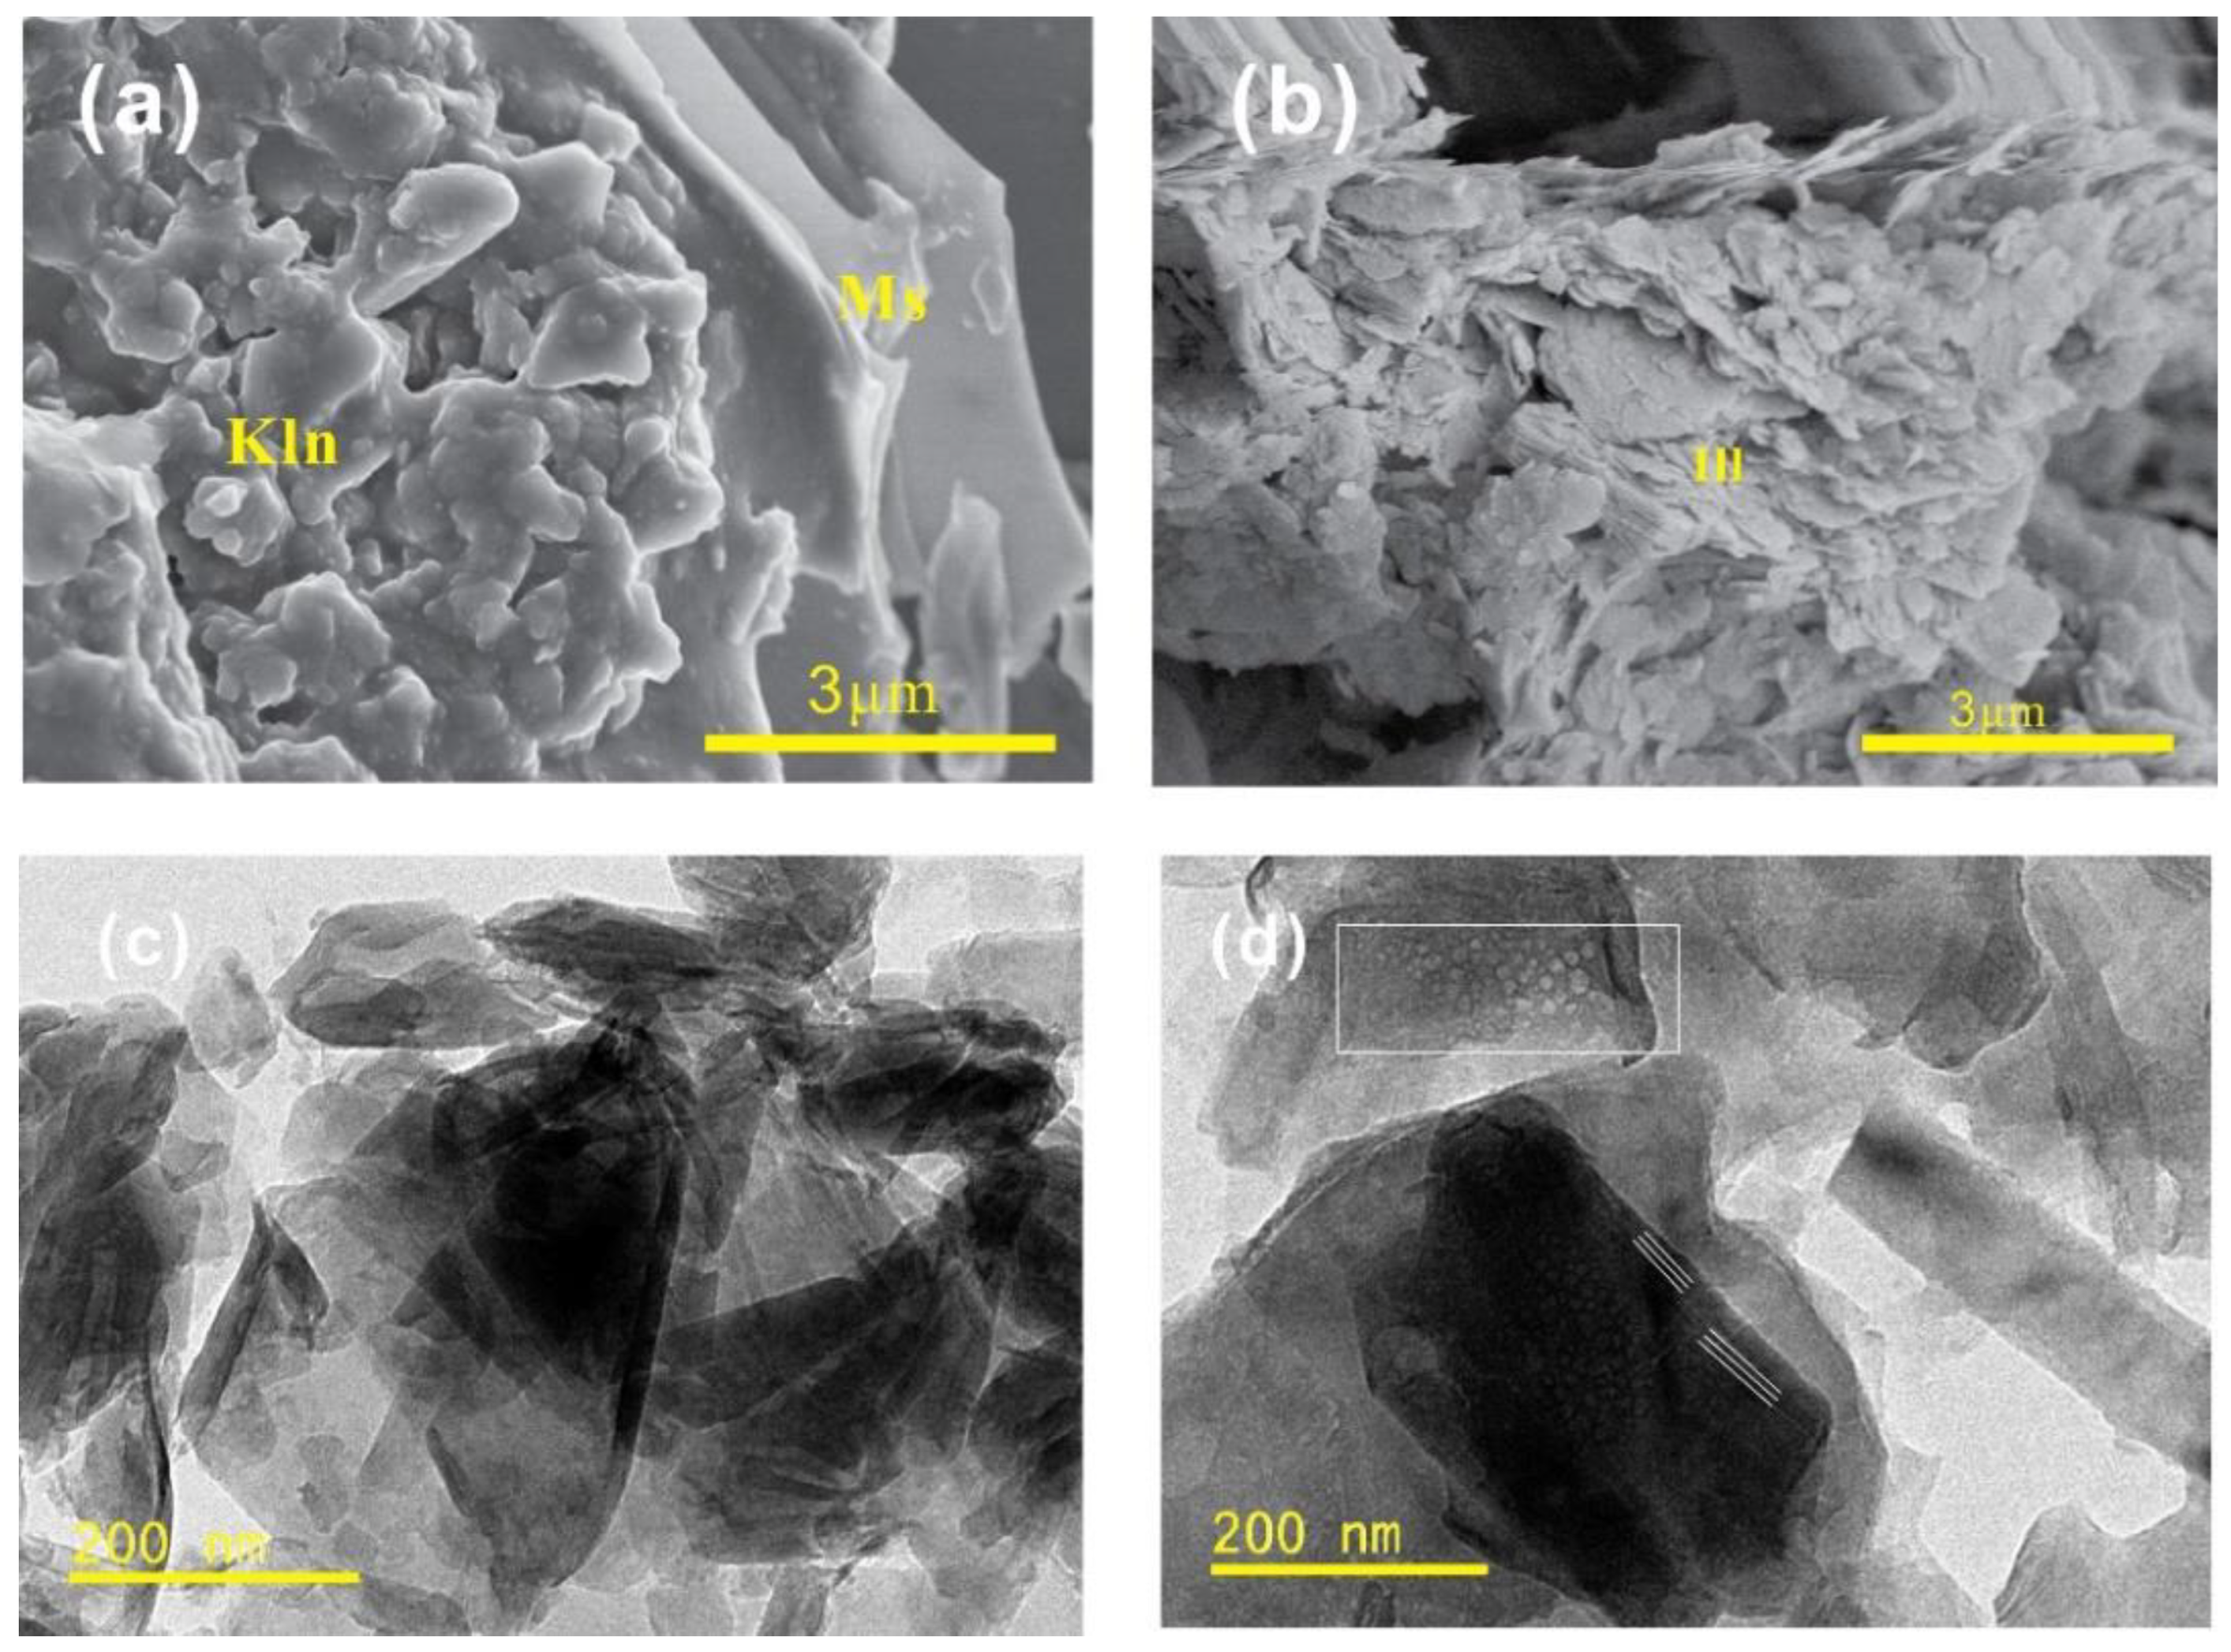
The main clay mineral in the topsoil of rare earth mines is kaolinite, illite, chlorite, vermiculite, and rock forming minerals include quartz, potassium feldspar, and so on in Longnan City, Anyuan County, and Dingnan County in the Southern Jiangxi Province [12]. The maximum and minimum clay mineral content is 62.1% and 8.8%, respectively (average = 31.9%, standard deviation = 11.9). Scanning electron microscopy (SEM) analysis of clay minerals show that they are composed of kaolinite, montmorillonite/illite, and vermiculite at the upper humus layer in the weathering crust profile in Zudong mining area, Longnan City, Southern Jiangxi Province (Figure 11). The top to bottom clay layer was completely weathered and enriched in REEs. There is an obvious increase in halloysite in clay minerals, except for kaolinite [37]. Kaolinite is generally in the form of irregular scale such as microcrystals, and some are interspersed with each other. It gradually increases and is enriched in the topsoil layer; it is occasionally distributed along one side of mica (Figure 11a). Illite is an irregular shape with an undulating surface (Figure 11b), and the particle size is mostly 1–5 μm. It is a mainly distributed on the surface of weathered feldspar as an aggregate.
High resolution transmission scanning electron microscope energy dispersive X-ray spectrometer (HTEM-EDS) image analysis shows that La and Y are mostly enriched in illite, but weakly distributed in kaolinite, and rare earth ions are mostly adsorbed by the inner and outer electrons of clay minerals [63]. Transmission electron microscopy of simulated ore leaching shows that mineral microcracks are presented by granite weathering and clay mineral crystals are piled together in disorder. Clay minerals were corroded by acid electrolyte solution; rare earth ions were brought out by exchange, and irregularly sized dissolution pits were revealed on the surface of clay minerals [59]. The stacking of some lattice stripes was dislocated. This suggests that clay mineral characteristics are transformed during the leaching process. Different types and quantities of clay minerals were formed by different lithology after chemical weathering. The chemical index of alteration (CIA) of metamorphic siltstone and slate in Anyuan County, Southern Jiangxi was larger than that of granite in the Longnan area. X-ray diffraction (XRD) analysis shows that the average content of kaolinite, illite, and potassium feldspar is 40.7%, 8.03%, and 9.72%, respectively, while the average ratio of kaolinite minerals after granite weathering in the Longnan area is 24.7% [30]. This suggests that the differentiation of REE in the topsoil layer is controlled by different clay mineral distributions. There appears to be differences in the original rock lithology in ionic rare earth mining areas, and the type, content, and structure of clay minerals after weathering in the topsoil layer.
The organic matter content in the topsoil layer is an important influence on REE enrichment [64,65]. The rare earth content of the Namco area topsoil in Tibet is higher in the south bank compared with that of the north [53]. This implies that the topsoil organic matter content and water is higher than that of the north. The soil organic matter content and δCe showed a significant correlation in the topsoil of Sichuan Basin [22]. This indicates that Ce is more easily enriched in topsoil with a high organic content.
The organic matter in mangrove soil is mainly formed from the sea, and the composition, redox potential, and organic matter content of sediment are affected by the diagenesis of early organic matter mineralization and Fe Mn oxyhydrogen compounds [66]. The precipitation of REE, metal sulphide, and organic matter in mangrove soil were required more fractionation of rare earth in sediment and mangrove pore water. The addition of La, Ce, or Nd to herbaceous calcareous soil and chernozem reduces the content of other REEs related to organic matter. Meanwhile, the REE content in the form of gold organic complexes in chernozem slightly increases. This indicates that the organic matter content has an obvious role in the adsorption of REEs in chernozem. Therefore, the different types of soil organic matter in different regions were obviously controlled rare earth adsorption. The source of organic matter in the topsoil layer of the ionic type rare earth mining area is mainly provided by the surface vegetation in Southern China. Meanwhile, the original distribution state of organic matter in the topsoil layer is destroyed by artificial activity, and the rare earth distribution is affected.
Migration and enrichment of REEs in soil is formed by human activities [23,52,67,68]. The ΣREE content in weathering crust and sediment was 458.5 mg/kg and 218.6 mg/kg, respectively. These values are significantly higher than the background value of weathering crust and soil, including samples from the weathering crust, surface water, sediment, plant and root soil in regional Guangzhou [23]. The ΣREE content in weathering crust and sediment was 458.5 mg/kg and 218.6 mg/kg, respectively. These values are significantly higher than the background value of weathering crust and soil, including samples from the weathering crust, surface water, sediment, plant and root soil in regional Guangzhou [23].
In addition, mining activities, agricultural farming, and surface excavation cause the migration of REEs into the environment that threaten human health. Heavy metals and rare earths form dust generated by weathering of the soil and quaternary sediments [68]. They enter the aquatic environment and migrate to sediments for enrichment in lake sediments of Murmansk City. This is caused by human activities such as house building and road wear in Arctic urban areas. The total amount of rare earth in urban dust in Zhuzhou, China is 66.1–237.4 mg/kg; this is mainly from local soil with low degrees of human pollution [69].
To sum up, the REE enrichment in topsoil is controlled by large-scale regional geological background conditions (lithology, geological structure, and topography). This has an important impact on the variety, content, and microstructure of clay minerals and soil organic matter content. The enrichment of REEs in the topsoil by human activities is relatively significant in the secondary sedimentary environment. The content and spatial distribution characteristics of REEs in the topsoil in the study area show that REE differentiation is poor compared with other sediments. Currently, chemical weathering leaching is relatively stable in a small area of the mine. However, continuous surface excavation such as in situ leaching artificially intensifies the process and intensity of chemical weathering. The risk of REEs in the exposed topsoil layer migrating to the external environment under acid rain and other leaching superimposition increases; this affects the safety of soil and water [70,71].

5. Conclusions

The external environmental quality of topsoil with the spatial distribution of REEs in rare earth mines was examined since it may pose a human health risk. This paper collected the surface soil and profile samples of the rare earth mining area in Longnan City, Southern Jiangxi Province, China. The REE content was analyzed using IBM SPSS Statistics 26, GS + 9.0, and Arcgis statistical analysis software to evaluate the spatial autocorrelation and heterogeneity of REEs in the topsoil. The following main conclusions were drawn:
(1)
The total REE content, average, and CV value in topsoil in the study area varied from 156.28–2397.74 mg/kg, 767.25 mg/kg, 55.49%–143.05%, respectively. The average ratio of LREE/HREE was 0.32. The Eu/Eu* value, Ce/Ce* value, and La/Yb value indicated that the uneven distribution of REEs in the topsoil; the HREEs were more evenly distributed in space than the LREEs.
(2)
Standard chondrite rare earth analysis showed that a negative Eu anomaly was inherited from the distribution pattern of the parent rock. The ratio of rare earth in the topsoil to parent rock showed that Eu was obviously enriched, and Ce showed abnormally positive and negative expression patterns. This reflected the differences in rare earth element fractionation in the topsoil.
(3)
Moran index analysis showed that the positive correlation between sampling points was significant within the range of 0–500 m, the negative correlation increased with distance. The best fitting models of the semi variance variogram were the exponential model, Gaussian model, and spherical model. Spatial structure (C0 + C) revealed the order of spatial structure from strong to weak: Ho > Tb > La > Pr > Nd > Sm > Gd > Tm > Lu > Dy > Er > Yb > Ce > Eu. The largest fractal dimension of HREEs was Ho (1.93), followed by Tb (1.91) and Lu (1.90). This indicated that their spatial distribution pattern was relatively simple and their spatial dependence was strong.
(4)
Scatter plots of LREE/HREE, Eu/Eu*, Ce/Ce*, La/Yb, and Σ REE showed that the LREE/HREE ratio of topsoil in the study area was the lowest compared to other mining areas. This indicated that the enrichment of rare earth in the topsoil of the study area was controlled by macroscopic factors (parent rock, weathering degree, topography, and so on), and other factors including the particle size of the topsoil, the type and content of clay minerals, the organic matter content, and human activities that controlled the adsorption and spatial distribution of rare earth.

Author Contributions

Conceptualization, H.C. and L.C.; methodology, L.C. and L.Z.; software, H.C. and L.Z.; formal analysis, M.G.; investigation, H.C. and L.C.; data curation, L.Z.; writing—original draft preparation, H.C.; writing—review and editing, H.C. and L.C.; visualization, L.Z. and M.G.; supervision, project administration, L.C.; funding acquisition, L.C. All authors have read and agreed to the published version of the manuscript.

Funding

This research was funded by the National Natural Science Foundation of China (grant numbers 41967038), the Natural Science Foundation of Guangdong Province (grant numbers 2021A1515011487), and the Projects of Talents Recruitment of GDUPT (grant numbers 520130).

Data Availability Statement

Not applicable.

Conflicts of Interest

The authors declare no conflict of interest.

References

  1. Tyler, G. Rare earth elements in soil and plant systems—A review. Plant Soil 2004, 267, 191–206. [Google Scholar] [CrossRef]
  2. Wang, L.Q.; Liang, T. Geochemical fractions of rare earth elements in soil around a mine tailing in Baotou, China. Sci. Rep. 2015, 5, 12483. [Google Scholar] [CrossRef] [PubMed] [Green Version]
  3. Wedepohl, H. The composition of the continental crust. Geochim. Cosmochim. Acta 1995, 59, 1239. [Google Scholar] [CrossRef]
  4. Fan, H.R.; Niu, H.C.; Li, X.C.; Yang, K.F.; Yang, Z.F.; Wang, Q.W. The types, ore genesis and resource perspective of endogenic REE deposits in China. Chin. Sci. Bull. 2020, 65, 3778–3793. [Google Scholar] [CrossRef]
  5. Wang, X.; Lei, Y.; Ge, J.; Wu, S. Production forecast of China’s rare earths based on the Generalized Weng model and policy recommendations. Resour. Policy 2015, 43, 11–18. [Google Scholar] [CrossRef] [Green Version]
  6. Yang, X.; Zhang, J. Recovery of rare earth from ion-adsorption rare earth ores with a compound lixiviant. Sep. Purif. Technol. 2015, 142, 203–208. [Google Scholar] [CrossRef]
  7. Tang, J.; Qiao, J.Y.; Xue, Q.; Liu, F.; Chen, H.H.; Zhang, G.C. Leach of the weathering crust elution-deposited rare earth ore for low environmental pollution with a combination of (NH4)2SO4 and EDTA. Chemosphere 2018, 199, 160–167. [Google Scholar] [CrossRef]
  8. Zhu, X.P.; Zhang, B.; Ma, G.T.; Pan, Z.W.; Hu, Z.G.; Zhang, B.T. Mineralization of ion-adsorption type rare earth deposits in Western Yunnan, China. Ore Geol. Rev. 2022, 148, 104984. [Google Scholar] [CrossRef]
  9. U.S. Geological Survey. Mineral Commodity Summaries; U.S. Geological Survey: Reston, VA, USA, 2020; pp. 1–200. [Google Scholar]
  10. Chi, R.A.; Tian, J. Review of Weathered Crust Rare Earth Ore. J. Rare Earths 2007, 25, 641–650. [Google Scholar]
  11. Kynicky, J.; Smith, M.P.; Xu, C. Diversity of rare earth deposits: The key example of China. Elements 2012, 8, 361–367. [Google Scholar] [CrossRef]
  12. Chen, L.K.; Chen, H.X.; Jin, X.W.; Zhang, L.; Liu, J.H.; Liu, C.Y.; Xu, S.; Wu, K.X.; He, S.; Sun, T.; et al. Research and Prospect of Particle Size, Clay Minerals, Base Ion Migration and Heavy Metal Release of Ionic Rare Earth Ore. J. Rare Earths 2022, 40, 194–215. [Google Scholar]
  13. Wu, C.Y.; Huang, D.H.; Guo, Z.X. REE geochemistry in the weathered crust of granites, Longnan area, Jiangxi Province. Acta Geol. Sin. 1990, 3, 193–209. [Google Scholar]
  14. Chi, R.A.; Zhu, G.C.; Zhang, P.; Xu, Y.H. Chemical behavior of cerium element in rock weathering system. Trans. Nonferrous Met. Soc. China 1999, 9, 158–164. [Google Scholar]
  15. Wang, D.H.; Zhao, Z.; Yu, Y.; Wang, C.H.; Dai, J.J.; Sun, Y.; Zhao, T.; Li, J.K.; Huang, F.; Chen, Z.Y.; et al. A Review of the Achievements in the Survey and Study of Ion-absorption Type REE Deposits in China. Acta Geosci. Sin. 2017, 38, 317–325. [Google Scholar]
  16. Harlavan, Y.; Erel, Y. The release of Pb and REE from granitoids by the dissolution of accessory phases. Geochim. Cosmochim. Acta 2002, 66, 837–848. [Google Scholar] [CrossRef]
  17. Galan, E.; Fernandez-Caliani, J.C.; Miras, A.; Aparicio, P.; Marquez, M.G. Residence and fractionation of rare earth elements during kaolinization of alkaline peraluminous granites in NW Spain. Clay Miner. 2007, 42, 341–352. [Google Scholar] [CrossRef]
  18. Sanematsu, K.; Murakami, H.; Watanabe, Y.; Duangsurigna, S.; Vilayhack, S. Enrichment of rare earth elements (REE) in granitic rocksand their weathered crusts in central and southern Laos. Bull. Geolog. Sur. Jap. 2009, 60, 527–558. [Google Scholar] [CrossRef] [Green Version]
  19. Nesbitt, H.W. Mobility and fractionation of rare earth elements during weathering of a granodiorite. Nature 1979, 279, 206–210. [Google Scholar] [CrossRef]
  20. Gupta, C.K.; Krishnamurthy, N. Extractive metallurgy of rare earths. Int. Mater. Rev. 1992, 37, 197–248. [Google Scholar] [CrossRef]
  21. Jiang, F.Q.; Zhou, X.J.; Li, A.C.; Li, T.G. Quantitatively distinguishing sediments from the Yangtze River and the Yellow River using δEuN-ΣREEs plot. Sci. China 2009, 52, 232–241. [Google Scholar] [CrossRef]
  22. Yuan, Y.Y.; Liu, S.L.; Wu, M.; Zhong, M.Y.; Shahid, M.Z.; Liu, Y.L. Effects of topography and soil properties on the distribution and fractionation of REEs in topsoil: A case study in Sichuan Basin, China. Sci. Total Environ. 2021, 791, 148404. [Google Scholar] [CrossRef]
  23. Wang, Y.Y.; Wang, G.F.; Sun, M.Q.; Liang, X.L.; He, H.P.; Zhu, J.X.; Takahashi, Y. Environmental risk assessment of the potential “Chemical Time Bomb” of ion-adsorption type rare earth elements in urban areas. Sci. Total Environ. 2022, 822, 153305. [Google Scholar] [CrossRef]
  24. Wen, X.J. Study on Characteristics of Soil Environment and Geochemical Behavior of Rare Earth Metals in Rare Earth Mining Area of Southern Jiangxi Province; Yunnan University: Kunming, China, 2012; pp. 1–127. [Google Scholar]
  25. Wei, F.S.; Liu, T.L.; Teng, E.J.; Rui, K.S. Background values of rare earth elements in Chinese soil. Environ. Sci. 1991, 12, 78–82. [Google Scholar]
  26. Ou, X.L.; Chen, Z.B.; Chen, X.L.; Li, X.F.; Wang, J.; Ren, T.J.; Chen, H.B.; Feng, L.J.; Wang, Y.K.; Chen, Z.Q.; et al. Redistribution and chemical speciation of rare earth elements in an ion-adsorption rare earth tailing, Southern China. Sci. Total Environ. 2022, 821, 153369. [Google Scholar] [CrossRef]
  27. IBM Corp. IBM SPSS Statistics for Windows (Version 26.0.0.0) [Computer Software]. IBM Corp. 2019. Available online: https://www.ibm.com/products/spss-statisticsIn-textreferencing (accessed on 1 January 2023).
  28. Gamma Design Software, LLC. GS+Geostatistics for the Environmental Sciences (Version 9.0) [Computer Software]. Gamma Design Software, LLC. 2008. Available online: https://geostatistics.com (accessed on 1 January 2023).
  29. Ersi Inc. Arcgis 10.2 for Desktop (Version 10.2.0.3384) [Computer Software]. Ersi Inc. 2013. Available online: https://www.esri.com (accessed on 1 January 2023).
  30. Chen, L.K.; Jin, X.W.; Chen, H.X.; He, Z.W.; Qiu, L.R.; Duan, H.R. Grain size distribution and clay mineral distinction of rare earth ore through different methods. Minerals 2020, 10, 353. [Google Scholar] [CrossRef]
  31. Rudnick, R.; Gao, S. Composition of the continental crust. Treatise Geochem. 2003, 3, 1–64. [Google Scholar]
  32. Qi, Y.C.; Dong, Y.S.; Jin, Z.; Peng, Q.; Xiao, S.; He, Y.T. Spatial Heterogeneity of Soil Nutrients and Respiration in the Desertified Grasslands of Inner Mongolia, China. Pedosphere 2010, 20, 655–665. [Google Scholar] [CrossRef]
  33. Karanlik, S.; Aqca, N.; Yalcin, M. Spatial distribution of heavy metals content in soils of Amik plain (Hatay, Turkey). Environ. Monit. Assess. 2011, 173, 181–191. [Google Scholar] [CrossRef] [PubMed]
  34. Sun, S.S.; McDonough, W.F. Chemical and Isotopic Systematics of Oceanic Basalts: Implications for Mantle Composition and Processes. Geol. Soc. Spec. Publ. 1989, 42, 313–345. [Google Scholar] [CrossRef]
  35. Li, M.Y.H.; Zhou, M.F.; Williams-Jones, A.E. The Genesis of Regolith-Hosted Heavy Rare Earth Element Deposits: Insights from the World-Class Zudong Deposit in Jiangxi Province, South China. Econ. Geol. 2019, 114, 541–568. [Google Scholar] [CrossRef]
  36. Rogova, O.B.; Fedotov, P.S.; Dzhenloda, R.K.; Karandashev, V.K. Fractionation and fixation of rare earths elements in soils: Effect of spiking with lanthanum, cerium, and neodymium chlorides. J. Rare Earths 2022, 40, 143–152. [Google Scholar] [CrossRef]
  37. Li, M.Y.H.; Zhou, M.F. The role of clay minerals in formation of the regolith-hosted heavy rare earth element deposits. Am. Mineral. 2020, 105, 92–108. [Google Scholar] [CrossRef]
  38. Braun, J.J.; Riotte, J.; Battacharya, S.; Violette, A.; Oliva, P.; Prunier, J.; Maréchal, J.C.; Ruiz, L.; Audry, S.; Subramanian, S. REY-Th-U dynamics in the critical zone: Combined influence of reactive bedrock accessory minerals, authigenic phases, and hydrological sorting (Mule HoleWatershed, South India). Geochem. Geophys. Geosyst. 2018, 19, 1611–1635. [Google Scholar] [CrossRef]
  39. Nakajima, T.; Terakado, Y. Rare earth elements in stream waters from the Rokko granite area, Japan: Effect of weathering degree of watershed rocks. Geochem. J. 2003, 37, 181–198. [Google Scholar] [CrossRef]
  40. Moran, P.A.P. Notes on continuous stochastic phenomena. Biometrika 1950, 37, 17–23. [Google Scholar] [CrossRef] [PubMed]
  41. Lark, R.M. Geostatistics for Environmental Scientists. Eur. J. Soil. Sci. 2001, 52, 521–528. [Google Scholar] [CrossRef]
  42. Jiangxi Provincial Bureau of Geology and Mineral Resources. Drawing Instructions of Digital Geological Map of Jiangxi Province; Geological Publishing House: Beijing, China, 1984; pp. 1–80. [Google Scholar]
  43. Liu, S.; Huang, M.H.; Wu, J.H.; Guan, T.Y. Bimodal volcanic geochemistry characteristics and structural setting of Yutian Group, south Jiangxi. J. Guilin Univ. Technol. 2006, 26, 320–327. [Google Scholar]
  44. Luo, W.; Hou, M.C.; Liu, X.C.; Huang, S.G.; Chao, H.; Zhang, R.; Deng, X. Geological and geochemical characteristics of marine-continental transitional shale from the Upper Permian Longtan formation, Northwestern Guizhou, China. Mar. Petrol. Geol. 2018, 89, 58–67. [Google Scholar] [CrossRef]
  45. Bruggeman, C.; Liu, D.J.; Maes, N. Influence of Boom Clay organic matter on the adsorption of Eu3+ by illite-geochemical modelling using the component additivity approach. Radiochim. Acta 2010, 98, 597–605. [Google Scholar] [CrossRef]
  46. Lidman, F.; Laudon, H.; Taberman, I.; Köhler, S. Eu anomalies in soils and soil water from a boreal hillslope transect-a tracer for Holocene lanthanide transport? Geochim. Cosmochim. Acta 2019, 267, 147–163. [Google Scholar] [CrossRef]
  47. Xie, M.L.; Chang, H.; Zhou, X.H.; Zhu, J.Y.; Chen, Z.; Yang, T.F.; Long, K.; Song, Y.X. Geochemical Characteristics and Factors of Transfer and Accumulation of Rare Earth Elements in Rock-Soil-Tea of the Mengku Tea Region in Yunnan Province, China. Sustainability 2023, 15, 4836. [Google Scholar] [CrossRef]
  48. United States Environmental Protection Agency (EPA). Radionuclide Table: Radionuclide Carcinogenicity Slope Factors; United States Environmental Protection Agency (EPA): Washington, DC, USA, 2001. [Google Scholar]
  49. US EPA Office of Radiation and Indoor Air (ORIA). Radiation Protection Division. Radionuclide Carcinogenicity Slope Factors: Heast; US EPA Office of Radiation and Indoor Air (ORIA): Washington, DC, USA, 2001. [Google Scholar]
  50. Zhang, C.L.; Wu, G.J.; Gao, S.P. A Preliminary Study of the Rare Earth Elements in Surface Soil on the Tibetan Plateau. J. Glac. Geo. 2008, 30, 259–265. [Google Scholar]
  51. Yang, S.Y.; Jung, H.S.; Choi, M.S.; Li, C.X. The rare earth element compositions of the Changjiang (Yangtze) and Huanghe (Yellow) river sediments. Earth Planet. Sci. Lett. 2002, 201, 407–419. [Google Scholar] [CrossRef]
  52. Zhang, C.S.; Wang, L.J.; Zhang, S. Geochemistry of rare earth elements in the mainstream of the Yangtze River, China. Appl. Geochem. 1998, 13, 451–462. [Google Scholar] [CrossRef]
  53. Li, C.L.; Kang, S.C.; Wang, X.P.; Marsan, F.A.; Zhang, Q.G. Heavy metals and rare earth elements (REEs) in soil from the Nam Co Basin, Tibetan Plateau. Environ. Geol. 2008, 53, 1433–1440. [Google Scholar] [CrossRef]
  54. Henderson, P. Rare Earth Element Geochemistry; Elsevier Science Publishing Company Inc.: Amsterdam, The Netherlands, 1984; pp. 1–21. [Google Scholar]
  55. Semhi, K.; Chaudhuri, S.; Clauer, N. Fractionation of rare-earth elements in plants during experimental growth in varied clay substrates. Appl. Geochem. 2009, 24, 447–453. [Google Scholar] [CrossRef]
  56. Marsh, J.S. REE and fractionation and Ce anomalies in weathering Karoo dolerite. Chem. Geol. 1991, 90, 189–194. [Google Scholar] [CrossRef]
  57. Ji, H.B.; Wang, S.J.; Ouyang, Z.Y.; Zhang, S.; Sun, C.X.; Liu, X.M.; Zhou, D.Q. Geochemistry of red residua underlying dolomites in karst terrains of Yunnan-Guizhou Plateau: II. The mobility of rare earth elements during weathering. Chem. Geol. 2004, 203, 29–50. [Google Scholar] [CrossRef]
  58. Sugeng, S.P.; Godang, S.; Priadi, B.; Basuki, N.I.; Himawan, B. Geochemical study of Al–Fe–Ti enrichment in rock weathering: Implications for the recognizing of igneous protolith and the enrichment of REE in soil profile. Appl. Geochem. 2022, 140, 105259. [Google Scholar] [CrossRef]
  59. Jin, X.W.; Chen, L.K.; Chen, H.X.; Zhang, L.; Wang, W.J.; Ji, H.; Deng, S.F.; Jiang, L. XRD and TEM analyses of a simulated leached rare earth ore deposit: Implications for clay mineral contents and structural evolution. Ecotoxicol. Environ. Saf. 2021, 225, 112728. [Google Scholar] [CrossRef]
  60. Vital, H.; Stattegger, K.; Garbe-Schönberg, C.D. Composition and trace-element geochemistry of detrital clay and heavy-mineral suites of the lowermost Amazon River: A provenance study. J. Sediment. Res. 1999, 69, 563–575. [Google Scholar] [CrossRef]
  61. Hu, Z.Y.; Haneklaus, S.; Sparovek, G.; Schnug, E. Rare Earth Elements in Soils. Commun. Soil. Sci. Plan. 2006, 37, 1381–1420. [Google Scholar] [CrossRef]
  62. Taylor, S.R.; McLennan, S.M. The Continental Crust: Its Composition and Evolution. J. Geol. 1985, 94, 57–72. [Google Scholar]
  63. Mukai, H.; Kon, Y.; Sanematsu, K.; Takahashi, Y.; Ito, M. Microscopic analyses of weathered granite in ion-adsorption rare earth deposit of Jiangxi Province, China. Sci. Rep. 2020, 10, 20194. [Google Scholar] [CrossRef]
  64. Sholkovitz, E.R.; Elderfield, H. The cycling of dissolved rare-earth elements in Chesapeake Bay. Glob. Biogeochem. Cycles 1988, 2, 157–176. [Google Scholar] [CrossRef]
  65. Olmez, I.; Sholkovitz, E.R.; Hermann, D.; Eganhouse, R.P. Rare earth elements in sediments off Southern California: A new anthropogenic indicator. Environ. Sci. Technol. 1991, 25, 310–316. [Google Scholar] [CrossRef]
  66. Freitas, T.O.P.D.; Pedreira, R.M.A.; Hatje, V. Distribution and fractionation of rare earth elements in sediments and mangrove soil profiles across an estuarine gradient. Chemosphere 2021, 264, 128431. [Google Scholar] [CrossRef]
  67. Madadi, R.; Saeedi, M.; Karbassi, A. Redox-induced mobilization of rare earth elements in sediments of the northwestern part of the Persian Gulf. Int. J. Environ. Sci. Technol. 2022, 19, 11037–11050. [Google Scholar] [CrossRef]
  68. Slukovskii, Z.I.; Guzeva, A.V.; Dauvalter, V.A. Rare earth elements in surface lake sediments of Russian arctic: Natural and potential anthropogenic impact to their accumulation. Appl. Geochem. 2022, 142, 105325. [Google Scholar] [CrossRef]
  69. Sun, G.; Li, Z.; Liu, T.; Chen, J.; Wu, T.; Feng, X. Rare earth elements in street dust and associated health risk in a municipal industrial base of Central China. Environ. Environ. Environ. Geochem. Health 2017, 39, 1469–1486. [Google Scholar] [CrossRef]
  70. Yang, X.J.; Lin, A.J.; Li, X.L.; Wu, Y.D.; Zhou, W.B.; Chen, Z.H. China’s ion-adsorption rare earth resources, mining consequences and preservation. Environ. Dev. 2013, 8, 131–136. [Google Scholar] [CrossRef]
  71. Xiao, Y.F.; Feng, Z.Y.; Huang, X.W.; Huang, L.; Chen, Y.Y.; Wang, L.S.; Long, Z.Q. Recovery of rare earths from weathered crust elution-deposited rare earth ore without ammonia-nitrogen pollution: I. Leaching with magnesium sulfate. Hydrometallurgy 2015, 153, 58–65. [Google Scholar]
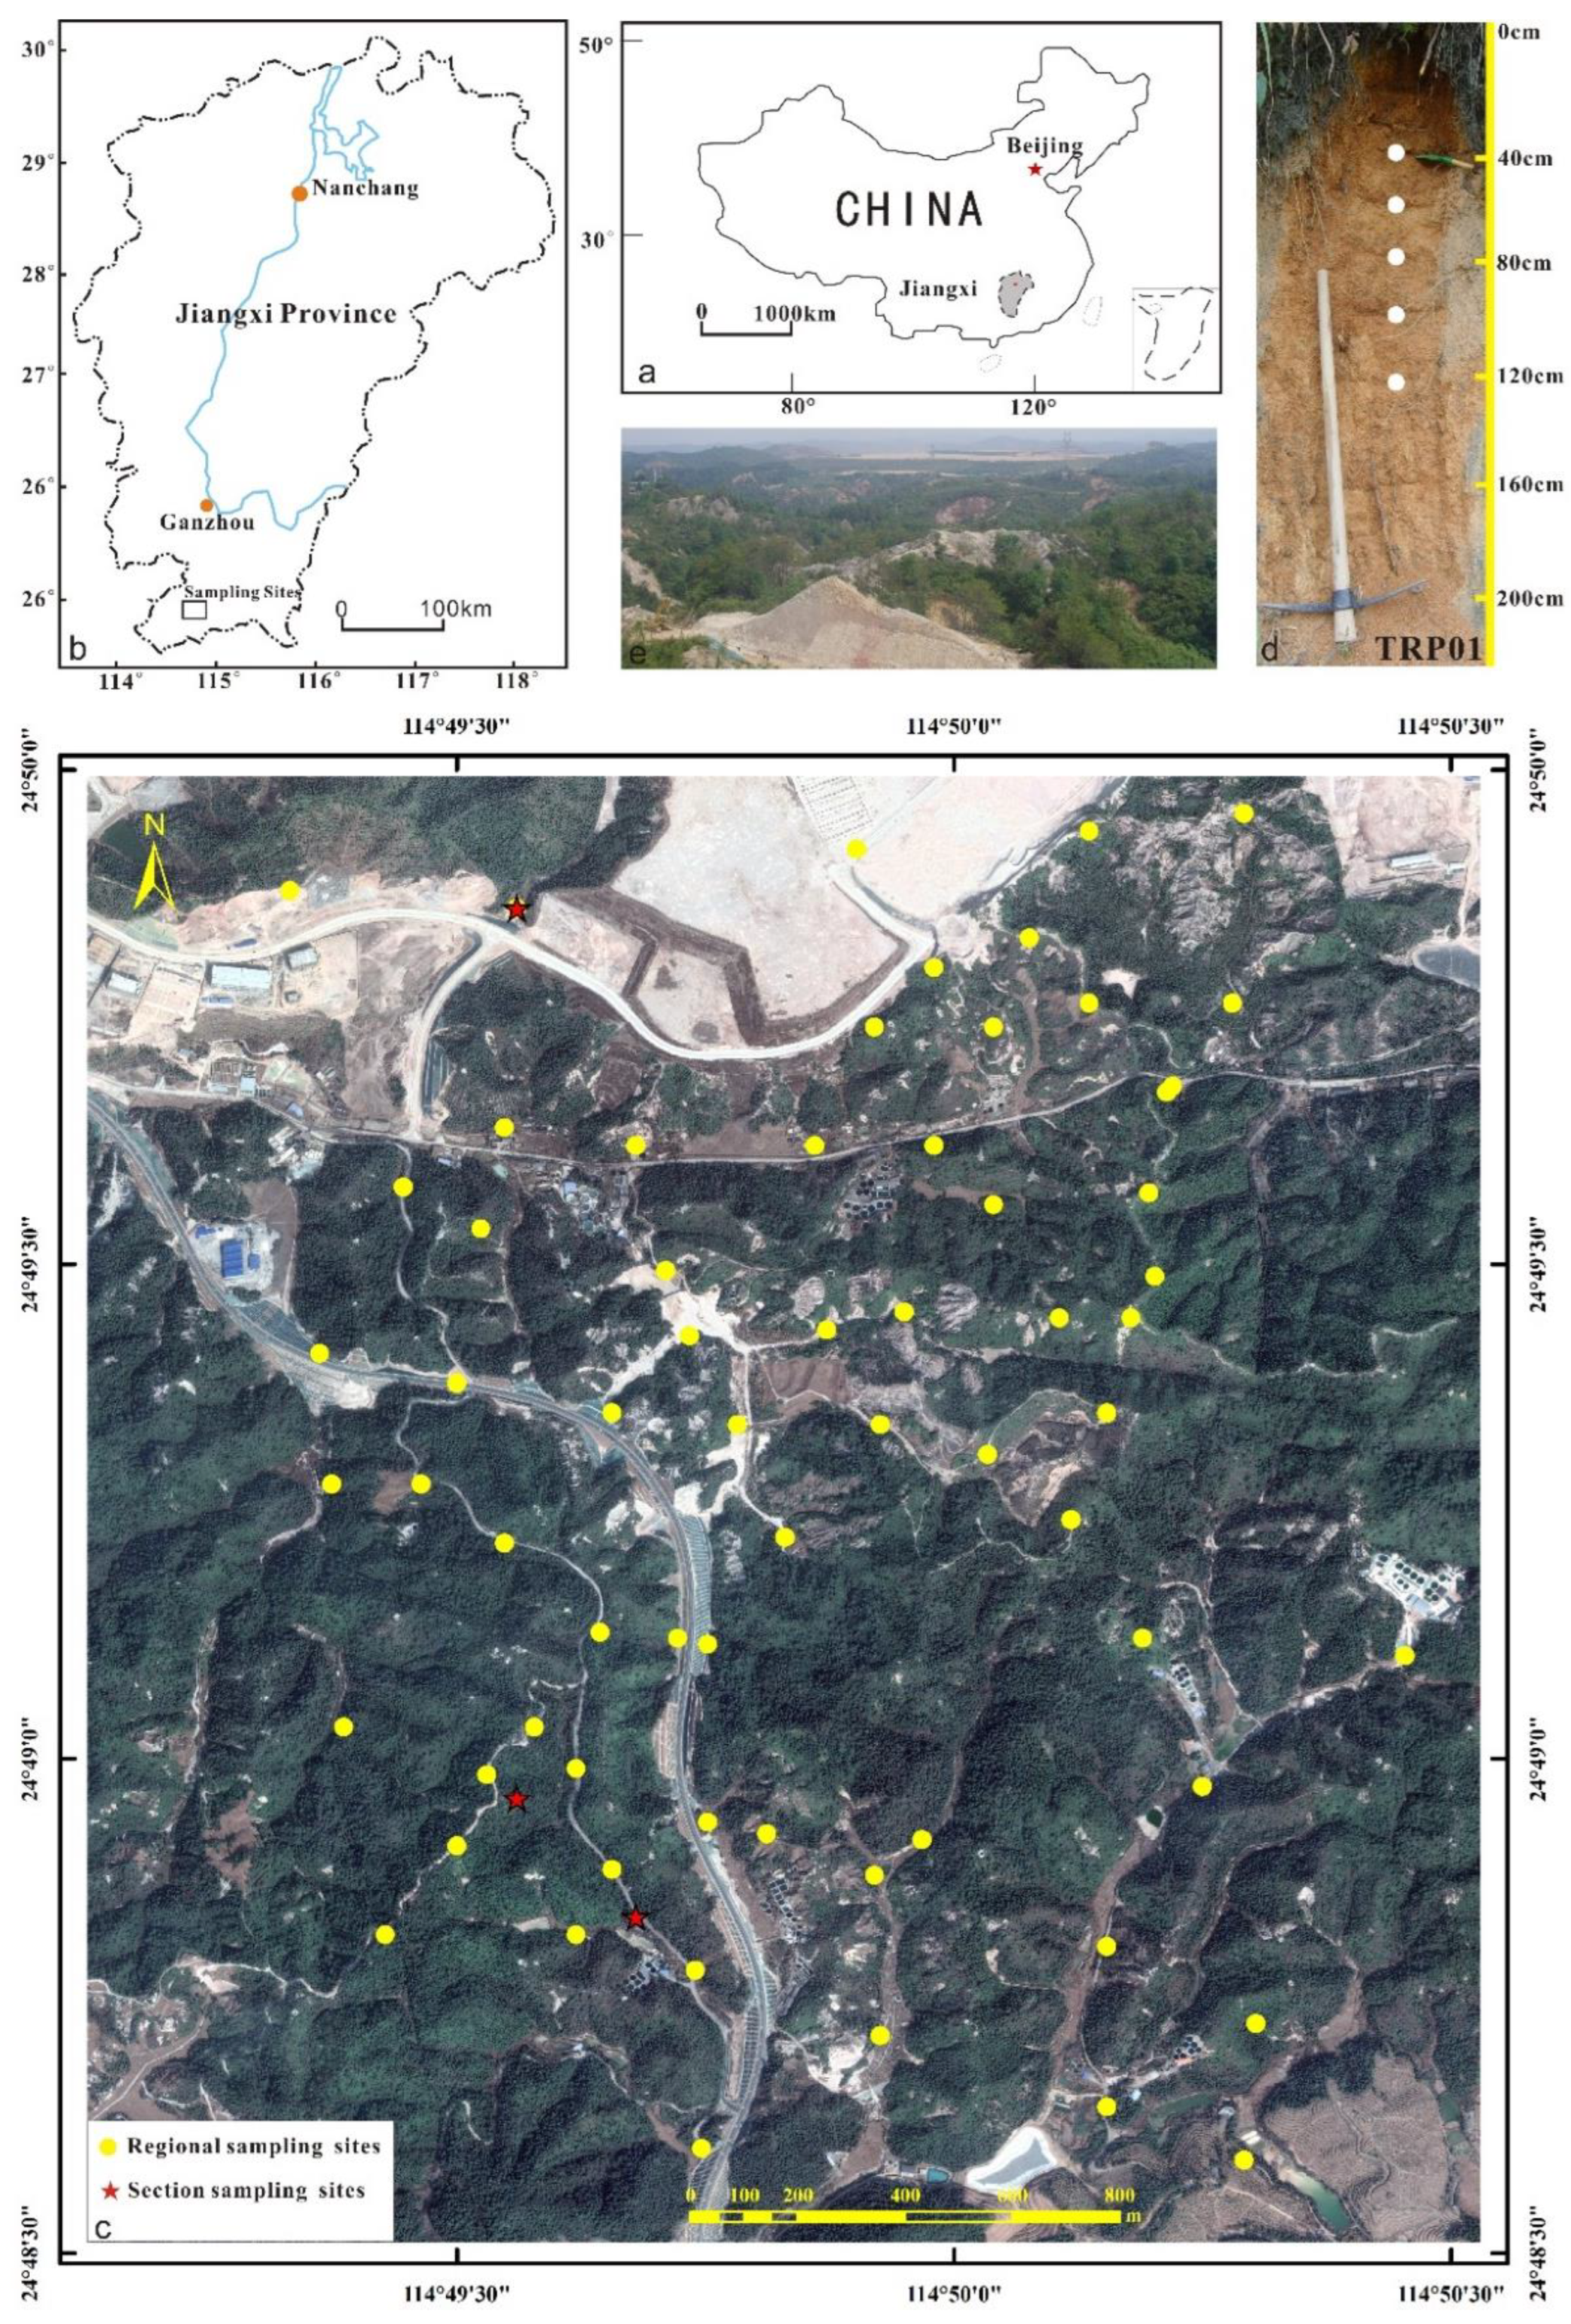
Figure 1. Study location and sampling sites: (a,b) is study area; (c) is sampling sites of topsoil and section of rare earth deposits; (d) is TRP01 Section and (e) is landscape of rare earth mining area. Satellite image is from www.91weitu.com (accessed on 21 January 2022), image taken on 21 January 2022.
Minerals 13 00784 g001
Figure 2. (a,b) Average Carbonaceous Ivuna (CI) chondrite-normalized REE profiles for the samples. (c,d) Average REE concentration profiles for samples normalized to the parent rock composition. The date of Carbonaceous Ivuna (CI) chondrite-normalized is from [34], and REE of parent rock composition is from [35].
Minerals 13 00784 g002
Figure 3. Vertical distributions of REEs in the soil profiles to Carbonaceous Ivuna (CI) chondrite-normalized. (a) is total rare earth content, and (b) is the ratio of light rare earth to heavy rare earth, and (c) is δEu and (d) is δCe. The blue, orange, and green dashed line represent the profile of TRP01, TRP02,and TRP03, respectively.
Minerals 13 00784 g003
Figure 4. Range of HREE and LREE concentrations in three soil profiles. (a) Green indicates the distribution range of light rare earth content, and (b) blue represents the distribution range of heavy rare earth content. The standard deviation of LREE and HREE in TRP01 profile respectively are 10.9 and 8.2; and the standard deviation of LREE and HREE in TRP02 profile respectively are 105.1 and 52.3; and the standard deviation of LREE and HREE in TRP03 profile respectively are 98.8 and 8.6.
Minerals 13 00784 g004
Figure 5. 3D image of TRP01 and TRP02 soil profiles sampling location. Satellite image and DEM is from www.91weitu.com (accessed on 21 January 2022) and the contour interval between adjacent contour lines is 3 m. Image taken on 21 January 2022.
Minerals 13 00784 g005
Figure 6. Moran’s I index of the spatial distribution of REEs contents in topsoil. (ah) represent La, Pr, Ce, Eu, Tb, Ho, Tm, and Lu, respectively, where (a,b,d) show significant spatial aggregation of La, Pr and Eu elements within 500 m; when the size is larger than 500 m, the spatial aggregation gradually changes to random distribution, and the spatial distribution is dispersed as the distance increases. (c) The spatial distribution of Ce element has randomness; (eh) indicates that elements Tb, Ho, Tm, and Lu have significant spatial distribution and aggregation within the range of 0–500 m. When the value is larger than 500 m, the spatial aggregation gradually changes to random distribution, and becomes stronger between 1300 m and 1400 m.
Minerals 13 00784 g006
Figure 7. Semi-variogram of spatial distribution of REEs content in topsoil. (ah) represent La, Ce, Pr, Eu, Tb, Ho, Tm, and Lu of rare earth elements content semi-variance function distribution. Among them, (a,c,e,f) show the semi-variance function distribution of La, Pr, Tb, and Ho elements, respectively. The fitting model is an exponential model; (b) represents the semi-variance function distribution of Ce content, and the fitting model is Gaussian model; (d,g,h) represent semi-variance function distributions of rare earth elements content in Eu, Tm and Lu, respectively, and the fitting model is spherical model.
Minerals 13 00784 g007
Figure 8. Fractal dimension of the spatial distribution of REEs content in topsoil. (ah) represent La, Ce, Pr, Eu, Tb, Ho, Tm, and Lu, respectively. The X-axis represents the step length (distance), and the Y-axis represents the semi-variance function. The double logarithm curve of the X-axis represents the linear regression using the least square method. (f) indicates that Ho space has the highest fractal dimension, indicating that its spatial structure is stable and the difference between each sample point is small. (c) indicates that the fractal dimension of Pr space is the lowest, indicating a large spatial difference.
Minerals 13 00784 g008
Figure 9. 2D and 3D view of spatial distribution of REEs content in topsoil. (ah) represent La, Ce, Pr, Eu, Tb, Ho, Tm, and Lu spatial distribution of rare earth elements in 2D and 3D maps, respectively. Among them, (ad) show the little fluctuation of the light rare earth elements La, Ce, Pr, and Eu in 3D, reflects that the spatial heterogeneity is relatively small. (eh) show the dramatic fluctuation of heavy rare earth elements Tb, Ho, Tm, and Lu in 3D, reflecting that the spatial heterogeneity is large.
Minerals 13 00784 g009
Figure 10. Cross-correlation plots of various geochemical parameters for REEs in topsoil. (a) represents the relationship between LREE/HREE and ∑REE. The average ratio of REE in the topsoil of the study area is low, which is significantly different from the distribution of REE in the topsoil of the Yangtze River Basin and the Qinghai-Tibet Plateau. (b) represents the relationship between Eu/Eu* and ∑REE, and indicates an obvious negative Eu anomaly in the topsoil of the study area. (c) The relationship between La/Yb and ∑REE shows that the difference of light and heavy REE in the surface soil layer is not obvious, and the distribution is approximately linear along the horizontal axis. (d) The graph of the relationship between Ce/Ce*∑REE shows obvious positive anomaly of Ce in the topsoil layer.
Minerals 13 00784 g010
Figure 11. SEM and TEM images of clay minerals in ion-adsorption type rare earth deposits [34,56]. (a) Represents the distribution of kaolinite along the mica side; (b) Illite of irregular form; (c) Disorderly accumulation of clay mineral crystals; (d) The dissolution pit on the surface of clay minerals is a small circular pore caused by the migration and precipitation of rare earth elements.
Minerals 13 00784 g011
Table 1. Profile sampling depth.
Section NameLongitude (°)Latitude (°)Elevation (m)Sample NumberSampling Depth (cm)
TRP01114.82824.814308TRP01-120
TRP01-250
TRP01-370
TRP01-490
TRP01-5110
TRP01-6130
TRP02114.82624.816368TRP02-110
TRP02-230
TRP02-350
TRP02-470
TRP02-590
TRP02-6110
TRP03114.82624.831282TRP03-120
TRP03-255
TRP03-380
TRP03-4100
TRP03-5120
TRP03-6140
Table 2. Detection range of rare earth element analysis test (mg/kg).
No.ElementDetection RangeNo.ElementDetection Range
1La0.5–90008Tb0.01–990
2Ce0.5–90009Dy0.05–990
3Pr0.03–99010Ho0.01–990
4Nd0.1–99011Er0.03–990
5Se1–90012Tm0.01–990
6Eu0.03–99013Yb0.03–990
7Gd0.05–99014Lu0.01–990
Table 3. Descriptive statistics of REEs concentration in surface soil (mg/kg). SD, standard deviation; CV, coefficient of variation; K-S, Kolmogorov–Smirnov (K-S) test; GM, geometric mean; BV, Background value [25]; UCC, the Upper Continental Crust [31].
ElementsMeanSDCVMinMaxK-S GMBVUCC
La29.335.31202.20253<0.00119.142.431.0
Ce60.641.768.720.3259<0.00151.275.063.0
Pr11.110.594.50.8757.1<0.0017.517.897.10
Nd52.144.685.74.10199<0.00136.628.927.0
Sm30.324.581.13.2796.2<0.00122.25.594.70
Eu0.530.75143.10.055.08<0.0010.340.891.00
Gd44.332.974.26.91154<0.00134.25.034.00
Tb8.396.0071.51.5531.4<0.0016.610.740.70
Dy55.637.968.29.622070.00144.75.483.90
Ho12.17.8565.01.8844.00.0079.871.070.83
Er36.622.361.14.701240.01830.33.442.30
Tm6.043.5859.30.5720.20.0205.040.440.30
Yb39.521.955.53.581170.04133.43.052.00
Lu6.283.4855.50.5519.10.0275.290.460.31
LREE18412568.238.1764.70.00511.2160.7133.8
HREE58338566.084.22096.70.00521.049.935.3
LREE/HREE0.320.331.030.450.361.000.533.223.79
Eu/Eu*0.010.031.840.010.04 0.010.170.23
Ce/Ce*12.00.930.644.995.80 4.284.104.25
La/Yb0.741.612.170.612.16 0.5713.915.5
∑REE76743757.01562397.70.00716.4211.6169.1
Table 4. Pearson’s correlations between REE concentrations in the topsoil samples (n = 65, p < 0.05).
LaCePrNdSmEuGdTbDyHoErTmYbLu
La1
Ce0.46 **1
Pr0.96 **0.36 *1
Nd0.87 **0.240.98 **1
Sm0.54 **−0.070.79 **0.88 **1
Eu0.82 **0.53 **0.67 **0.58 **0.221
Gd0.34 **−0.180.56 **0.66 **0.89 **0.081
Tb0.26 *−0.210.47 **0.57 **0.82 **0.020.99 **1
Dy0.21−0.230.42 **0.52 **0.78 **−0.020.97 **0.99 **1
Ho0.18−0.240.38 **0.48 **0.75 **−0.040.95 **0.99 **0.99 **1
Er0.16−0.26 *0.36 **0.46 **0.74 **−0.080.94 **0.98 **0.99 **0.99 **1
Tm0.15−0.25 *0.36 **0.47 **0.74 **−0.090.94 **0.97 **0.99 **0.99 **0.99 **1
Yb0.15−0.27 *0.37 **0.48 **0.75 **−0.120.92 **0.97 **0.97 **0.97 **0.98 **0.99 **1
Lu0.13−0.27 *0.35 **0.46 **0.74 **−0.120.92 **0.95 **0.97 **0.97 **0.98 **0.99 **0.99 **1
* At the 0.05 level (double tailed), the correlation is significant; ** At the 0.01 level (double tailed), the correlation is significant, which is analyzed by IBM SPSS Statistics 26.0.0.0 (IBM Corp., 2019) [27]
Table 5. Variogram analysis of spatial distribution of REEs content in topsoil.
ElementModelC0C0 + CC/(C0 + C)ARSSR2D0SE
LaExponential<0.011.011.00951.0.080.931.680.21
CeGaussian<0.010.301.00159.10.030.681.770.45
PrExponential<0.010.951.00846.0.090.901.570.28
NdExponential<0.010.881.00810.0.090.891.550.30
SmExponential<0.010.731.00753.0.100.821.610.31
EuSpherical0.020.130.881810<0.010.891.670.14
GdExponential0.130.610.789630.050.811.830.22
TbExponential0.531.070.5118090.070.801.910.25
DySpherical0.210.510.5810810.020.851.870.20
HoExponential0.731.470.5034800.130.701.930.44
ErGaussian0.220.450.511053.10.010.881.870.23
TmGaussian0.280.550.501089.50.020.881.840.18
YbGaussian0.180.440.581274.80.010.921.840.21
LuGaussian0.270.540.501228.0.020.881.900.34
C0—Nugget Variance; C0 + C—Structural Variance Sill; C/(C0 + C)—Proportion; A—Range; RSS—Residual SS; R2—fits the variogram; D0—Fractal dimension; SE—Standard error.
Table 6. Risk assessment of rare earth elements in the topsoil.
REESF
(kg·day−1·μg−1) [48]
Mean of CI Chondrite Standardization
(μg·kg−1)
RiskiConcentrations of Ion-Exchangeable REEs (μg·kg−1) [23]
La1.10 × 10−81.24 × 10−46.09 × 10−72.44 × 10⁻⁵
Ce3.52 × 10−89.90 × 10−51.95 × 10−63.58 × 10⁻⁵
Pr7.92 × 10−91.16 × 10−44.39 × 10−76.65 × 10⁻⁶
Nd5.44 × 10−101.11 × 10−43.01 × 10−82.61 × 10⁻⁵
Sm3.74 × 10−81.98 × 10−42.07 × 10−64.69 × 10⁻⁶
Eu1.03 × 10−89.07 × 10−65.71 × 10−76.82 × 10⁻⁷
Gd1.52 × 10−92.15 × 10−48.42 × 10−83.92 × 10⁻⁶
Tb4.88 × 10−92.24 × 10−42.70 × 10−75.65 × 10⁻⁷
Dy4.14 × 10−102.18 × 10−42.29 × 10−82.88 × 10⁻⁶
Ho9.21 × 10−92.13 × 10−45.10 × 10−75.27 × 10⁻⁷
Er2.53 × 10−92.20 × 10−41.40 × 10−71.43 × 10⁻⁶
Tm6.99 × 10−102.37 × 10−43.87 × 10−81.89 × 10⁻⁷
Yb4.00 × 10−92.32 × 10−42.21 × 10−71.07 × 10⁻⁶
Lu3.53 × 10−92.47 × 10−41.96 × 10−71.53 × 10⁻⁷
Disclaimer/Publisher’s Note: The statements, opinions and data contained in all publications are solely those of the individual author(s) and contributor(s) and not of MDPI and/or the editor(s). MDPI and/or the editor(s) disclaim responsibility for any injury to people or property resulting from any ideas, methods, instructions or products referred to in the content.