Article

Fluvial Morphology as a Driver of Lead and Zinc Geochemical Dispersion at a Catchment Scale

1
School of Biological and Environmental Science, Liverpool John Moores University, Liverpool L3 3AF, UK
2
Department of Chemical and Geological Sciences, University of Cagliari, 09042 Monserrato, Italy
3
Environment & Sustainability Institute and Camborne School of Mines, University of Exeter, Penryn TR10 9FE, UK
4
Faculty of Education, Health and Community, Liverpool John Moores University, Liverpool L17 6BD, UK
*
Author to whom correspondence should be addressed.
Minerals 2023, 13(6), 790; https://doi.org/10.3390/min13060790
Submission received: 3 May 2023 / Revised: 5 June 2023 / Accepted: 6 June 2023 / Published: 9 June 2023

Abstract

:
Metal-mining exploitation has caused ecosystem degradation worldwide. Legacy wastes are often concentrated around former mines where monitoring and research works are mostly focused. Geochemical and physical weathering can affect metal-enriched sediment locations and their capacity to release metals at a catchment scale. This study investigated how fluvial geomorphology and soil geochemistry drive zinc and lead dispersion along the Nant Cwmnewyddion (Wales, UK). Sediments from different locations were sampled for geochemical and mineralogical investigations (portable X-ray fluorescence, scanning electron microscope, X-ray diffraction, and electron microprobe analysis). The suspended sediment fluxes in the streamwater were estimated at different streamflows to quantify the metal dispersion. Topographical and slope analysis allowed us to link sediment erosion with the exposure of primary sulphide minerals in the headwater. Zinc and lead entered the streamwater as aqueous phases or as suspended sediments. Secondary sources were localised in depositional stream areas due to topographical obstruction and a decrease in stream gradient. Sediment zinc and lead concentrations were lower in depositional areas and associated with Fe-oxide or phyllosilicates. Streamwater zinc and lead fluxes highlighted their mobility under high-flow conditions. This multi-disciplinary approach stressed the impact of the headwater mining work on the downstream catchment and provided a low-cost strategy to target sediment sampling via geomorphological observations.

1. Introduction

Mining has a long history of exploitation resulting in the accumulation of waste material in river systems [1]. This history provides examples of the soil, water, and biological impacts mining mismanagement and disasters can pose on riverine and coastal systems [2,3]. Over centuries of mining, metal-enriched sediments have been redistributed in catchments via geomorphological processes to achieve morphological equilibrium, eroded and transported along river channels, and deposited in channels or alluvial valleys [4,5,6]. Metal-bearing minerals dispersed in a river system constitute potential sources of contaminants for the ecosystem via sediments, water, or organisms [7,8]. However, understanding metal dispersion at a catchment scale is difficult due to inherent river geomorphology and sediment geochemistry variabilities.
Previous studies have contributed to understanding the links between metal sediment concentrations, geomorphology, and mineral presence [2,9,10,11]. In an English mine site, Kincey, et al. [11] quantified 434 t of Zn- and Pb-contaminated mine waste that eroded from mine heaps in the river headwater of Garrigill Burn, a tributary of the upper South Tyne. Erosional processes such as gullying, bank erosion, and mass movements were observed with laser scanning data acquisition. Large losses of sediments were recorded, particularly during infrequent high-magnitude storms. Foulds, et al. [12] identified the two main processes responsible for mining-affected sediment remobilization and dispersion: (i) the direct erosion of unstable loose sediment mainly characterised by mine waste in headwaters; (ii) bank erosion and the lateral and vertical accretion of floodplain deposits that are common in piedmont areas. Variations in sediment transport velocity, controlled via changes in slope or channel enlargements, have been proposed to create low-energy zones that confine sediments to tributaries, preventing them from reaching main river channels [2]. Therefore, the fluvial geomorphology of mining-impacted catchments enriches the understanding of the erosion, transport, and deposition of metal-enriched sediments.
Mine wastes dispersed into catchments carry ore minerals, such as galena and sphalerite, or secondary metal-bearing minerals, such as sulphates, phosphates, carbonates, and Fe- or Mn-oxyhydroxides [9,10]. These minerals’ stability and metal mobility depend on biogeochemical factors including pH, oxygen concentration, metal sediment and water concentrations, water saturation, and bacterial activity [13]. Therefore, geochemical and mineralogical analysis is necessary to identify the presence and stability of metal-bearing phases. Hudson-Edwards, et al. [9] showed that primary minerals, such as lead (Pb) and zinc (Zn) sulphides, were mostly localised at mine tips associated with their weathered products, such as secondary carbonate, silicate, phosphate, and sulphate (CSPS) minerals. Secondary iron- and Mn-oxyhydroxides were abundant downstream, with Mn-oxyhydroxides progressively decreasing in abundance. This study highlights the importance of investigating sediment geochemistry at a catchment scale.
Sediment mineralogical and geochemical analysis must be undertaken to estimate the storage or release capacities of potential metal sources dispersed in a catchment, and geomorphological information can help explain sediment and water geochemistry spatial variations. River headwaters in mining-impacted catchments can host waste tips, in which fluvial processes associated with high slopes continuously erode the wastes, exposing primary minerals to weathering processes. On the other hand, depositional areas provide permeable riverbeds and banks that can potentially promote geochemical processes that are typical of hyporheic zones or clay embankments with low permeability and reductive conditions [14,15]. Statistical approaches have been used to predict downstream metal decay [5] and have shown that downstream concentration decays are metal-specific depending on their biogeochemistry and associated material, while denser primary minerals remain close to mine waste sources [16,17]. Mixing models can account for dilution processes due to clean sediment, multiple source areas, and the attenuation of suspended sediments due to water acidity variations [17,18]. Modelling limitations arise from the variability of geomorphological processes that are not systematic along a channel [2].
Further research is needed to understand the complex geomorphological and sedimentary geochemical processes controlling metal dispersions in mining-impacted catchments. This paper contributes to this knowledge gap by combining the study of fluvial morphological and geochemical processes and the categorisation of fluvial zones across a river with defined mineralogical paragenesis and metal release capability. In particular, it will focus on the geochemical behaviour of the mining-related metals Zn and Pb, whose (1) toxicities have been investigated extensively [19,20,21,22]; (2) impacts on mining catchments worldwide are well-known [23,24,25,26,27]; and (3) mobility poses management challenges in circum-neutral rivers [14,28,29,30,31]. The specific objectives are to (i) map the spatial fluvial morphological variability along the study catchment; (ii) characterise the geochemistry of the metal-enriched sediment; and (iii) demonstrate the fluvial morphological controls on the Zn- and Pb-bearing mineral distribution along the catchment. The findings can link fluvial systems with sustainable land use management for the reclamation and monitoring of ecological status.

2. Materials and Methods

2.1. Study Site

The study catchment is the Nant Cwmnewyddion in central Wales (Figure 1a). This stream drains the Wemyss and Graig Goch Mines, flows west to the Nant Magwar, and then into Afon Ystwyth. A total of 19 km of river length is impacted by Pb and Zn [32]. This area falls into the Ceredigion Uplands, a special landscape area (SLA) of national importance for its outstanding ecological, cultural, and archaeological value [33]. The Graig Goch, Wemyss, and Frongoch Mines exploited the Frongoch mineral load. Wemyss and Frongoch were joined in the 1840s under the same owner, with Wemyss Adit extended to serve the Frongoch Mine, becoming Frongoch Adit. The mining was in operation from the 2nd half of the 19th century until 1904. The geology of the area is characterised by mudstones and sandstones of the Devil’s Bridge formation of the Upper Llandovery (Telychian-aged) [34]. More recent units are glacial deposits (diamicton) and alluvium (clay, silt, sand, and gravel). These deposits and the mining-exploited areas provide permeable areas surrounded by the low permeability of the Silurian basement. The mining areas are aligned with the southwest-northeast normal fault containing the Frongoch mineral lode enriched in Cu, Pb, Zn, and Ag. The minerals in the ore veins are sulphides, including galena, sphalerite, occasional pyrite, and gangue minerals comprising mainly quartz, feldspar, illite, and chlorite. The lead-bearing secondary minerals include anglesite and plumbojarosite [35]. Monitoring of the annual hydrographic records at the downstream Ystwyth gauge station 63001 (Ystwyth at Pont Llolwyn) indicated a ‘flashy’ stream, with high inter- and intra-annual variability with minimum and maximum streamflow values of 0.8 and 74.7 m3/s in 2016 (NRW station 63001), which are typical of a temperate maritime climate [36].

2.2. Fluvial Geomorphology

The fluvial catchment geomorphology was described using topographical and slope analysis and the grain size distributions of the riverbank sediments, as these have been shown to be the major controls on physical transport and deposition [16,37]. Topographic features, such as the river channel shape and the proximity of valley sides and slope calculations, were extrapolated using ArcGIS v.10 from the LIDAR-Digital Terrain Model (DTM) of the area (Welsh 1 m LIDAR, Natural Resources Wales information ©). The ArcGIS Spatial Analysis tools’ ‘height contour’ and ‘slope’ tools were used to produce the area’s height contour and slope maps. The stream profile was extrapolated using the ‘stack profile’ tool from the functional surface in the 3D analyst tool from the DTM layer. The attribute tables exported the data for calculating the slope degree using Excel functions. The first slope percentage was calculated as the ratio of the elevation change to the length of the relevant stream segment. Then, the slope percentage was converted into a slope degree for consistency with the elaborated ArcGIS map. Finally, landscape survey notes were collected, including nearby vegetation presence, channel and overbank characteristics, and land use.

2.3. Sediment Sampling

Along the Nant Cwmnewyddion and the Nant Magwr, five sediment sampling areas were identified based on the location of mining and variations in fluvial geomorphological features such as slope and topography (Figure 1). The areas were (Figure 1c) (i) upstream of the mine tips, designated as the 0 m point (T0); (ii) the mine tips around the Wemyss Mine (171 m) both at the headwater (CW) and further downstream of the Mill Race Stream (WM); (iii) along the Graig Goch Mine (1110–2620 m) stream segment (GG); (iv) around a middle-reach (3000–4070 m) depositional area (DC); and (v) the floodplain at approximately 5800 m and 6740 m (RB up/s (up-stream) and RB d/s (down-stream), respectively). All the meter indications (e.g., 171 m) refer to the distance from the mine upstream area T0 (0 m, Figure 1a).
In each area, sediment samples were collected along transects perpendicular to the stream corridor on 18, 19, 20, and 26 July of 2016. The transect positions depended on fluvial morphological observations (such as depositional or erosional areas), geological and sedimentological features (sediment texture and rocky outcrop), and vegetation. A total of 68 samples distributed over 17 transects were collected with a stainless-steel trowel and hand augers to a maximum depth of 40 cm. The samples were transported to the laboratory and left to dry at 21 °C for 5 days, and their pH (paper test) values and grain size distributions were determined. The obtained pH values were indicative only and used to describe the relative pH differences among the samples. Grain sizes were separated on a vibration platform (Fritsch) using Endcotts sieves following the Wentworth size classes [38]: very coarse sand (2–1 mm), coarse sand (1–0.5 mm), medium sand (0.5–0.25 mm), fine sand (0.25–0.125 mm), very fine sand (0.125 mm–63 μm), and silt and clay (less than 63 μm).

2.4. Sediment Geochemical Analysis

The geochemical characterisation of the sediment samples was carried out using a portable X-ray Fluorescence (pXRF) Genius 9000XRF model Skyray [39]. The p-XRF analysis was carried out for each size fraction to reduce physical matrix effects. Element peak positions were determined with a standard of silver, and data quality was assessed with the Fresh Water Sediment certified reference material CRM016 (Sigma Aldrich, © 2023 Merck KGaA, Darmstadt, Germany). Samples were run six times to increase data precision and to enable the standard deviation to be calculated. The relative standard deviation (the ratio of the standard deviation and average) for Zn and Pb was below 5%. The limit of detection was calculated as 10 times the standard deviation and equal to 30 mg/kg for Zn and 10 mg/kg for Pb. The arithmetic averages for Pb and Zn concentrations were calculated for each sampling transect to homogenise the values and obtain a representative value of the sampled area [40]. A subset of 10 samples was selected for mineralogical characteristics and metal content quantification. The selection criteria were based on the proximity of the sample to the stream water (e.g., samples on the stream corridor) and the highest metal concentrations obtained with pXRF analysis. The finest granulometric fraction (<63 μm) was selected for X-ray diffraction (XRD) and scanning electron microscope (SEM) analysis due to their observed highest metal concentrations. The mineralogy of the finest was analysed with a Rigaku Miniflex XRD. The resultant data were processed with SIeve for Powder Diffraction File 2 (PDF) software (Release 2012) and the Powder Diffraction File-International Centre for Diffraction Data (PDF-ICDD) database. The XRD results were used for a qualitative description of the sediment mineralogy. SEM observations were performed with an FEI-Quanta 200 SEM and an EDS INCA-X-act-Oxford Instruments. Images were first acquired at large scales (100 to 10 μm) for sample investigations, and then X-ray spectra were acquired for single points or as chemical maps at 20 KeV [41]. Analysis of the whole portion sieved at 2 mm was carried out with a Jeol8100 Superprobe (electron microprobe) with wavelength-dispersive spectroscopy (WDS) and an Oxford Instrument INCA microanalytical system (EDS). Samples were mounted in epoxy-impregnated polished mounts [42]. Metal-bearing phases were detected using backscatter electron images (BSEM) and energy-dispersive detection (EDS). Energy data were collected between 0 and 20 eV using a 15 Kv accelerating voltage and a spot size of 1 µm.

2.5. Zinc and Lead Water Concentrations, Loads, and Suspended Sediments

Stream waters were sampled at six sites along the stream to verify Zn and Pb mobility. The 6 areas, indicated in Figure 1a, were located to capture diffuse and point sources (1) at Wemyss Mine (WM, 171 m); (2) downstream of the tributary Frongoch Adit (d/s FA, 880 m); (3) at Graig Goch Mine (GG, 1645 m); (4) at the middle stream length depositional area (DC, 3210 m); and (5) downstream and upstream of the floodplain (RB up/s, 5930 m and RB d/s, 6780 m). Samples were collected twice in two separate campaigns to measure temporal variability due to streamflow conditions. Streamflows at each site were monitored under low- (28 July 2017) and high- (17 June 2016) flow conditions with gulp injections of NaCl salt [40,43]. The high and low streamflow definitions were determined through analysis of the data from the historical gauge station 63001 located downstream of the Nant Magwar (Ystwyth at Pont Lllowyn; data are available at https://nrfa.ceh.ac.uk/data/station/meanflow, consulted on the 1 August 2019) [40]. pH, conductivity, and temperature were measured directly in the field using a multiprobe Aqua-reader, which was calibrated daily. A portion of each water sample was filtered at 0.45 μm with regenerated cellulose filters (Whatman SPARTAN). Filtered Pb and Zn (0.45 μm, filtered and acidified with 1% v/v of HNO3, FA) were measured with ICP-MS (ICP-Mass Spectrometer Varian 720), and unfiltered Pb and Zn (unfiltered and acidified with 1% v/v of HNO3 1%, RA) were measured with ICP-AES (Inductively Coupled Plasma-Atomic Emission Spectrometer-Varian 810). For precision and accuracy, the water analysis included TMDA 70 (Certified Reference Waters for Trace Elements), EP-H (Matrix Material Environ MAT Drinking Water), the repetition of standards, and sample duplicates. The limits of detection (LODs) verified with field and laboratory blanks were 10 μg/L for Zn and 0.33 μg/L for Pb. Zinc- and Pb-bearing suspended sediment concentrations were calculated via the difference between their unfiltered and filtered water concentrations. The Zn and Pb loads in suspended sediment were estimated by multiplying their concentrations by the streamflow. The method and results from these experiments were presented in full in the study by Onnis, et al. [40]. Low- and high-flow datasets are presented herein to discuss the role of fluvial morphology on sediment geochemistry.

3. Results and Discussion

3.1. Fluvial Geomorphological Zones along the Stream

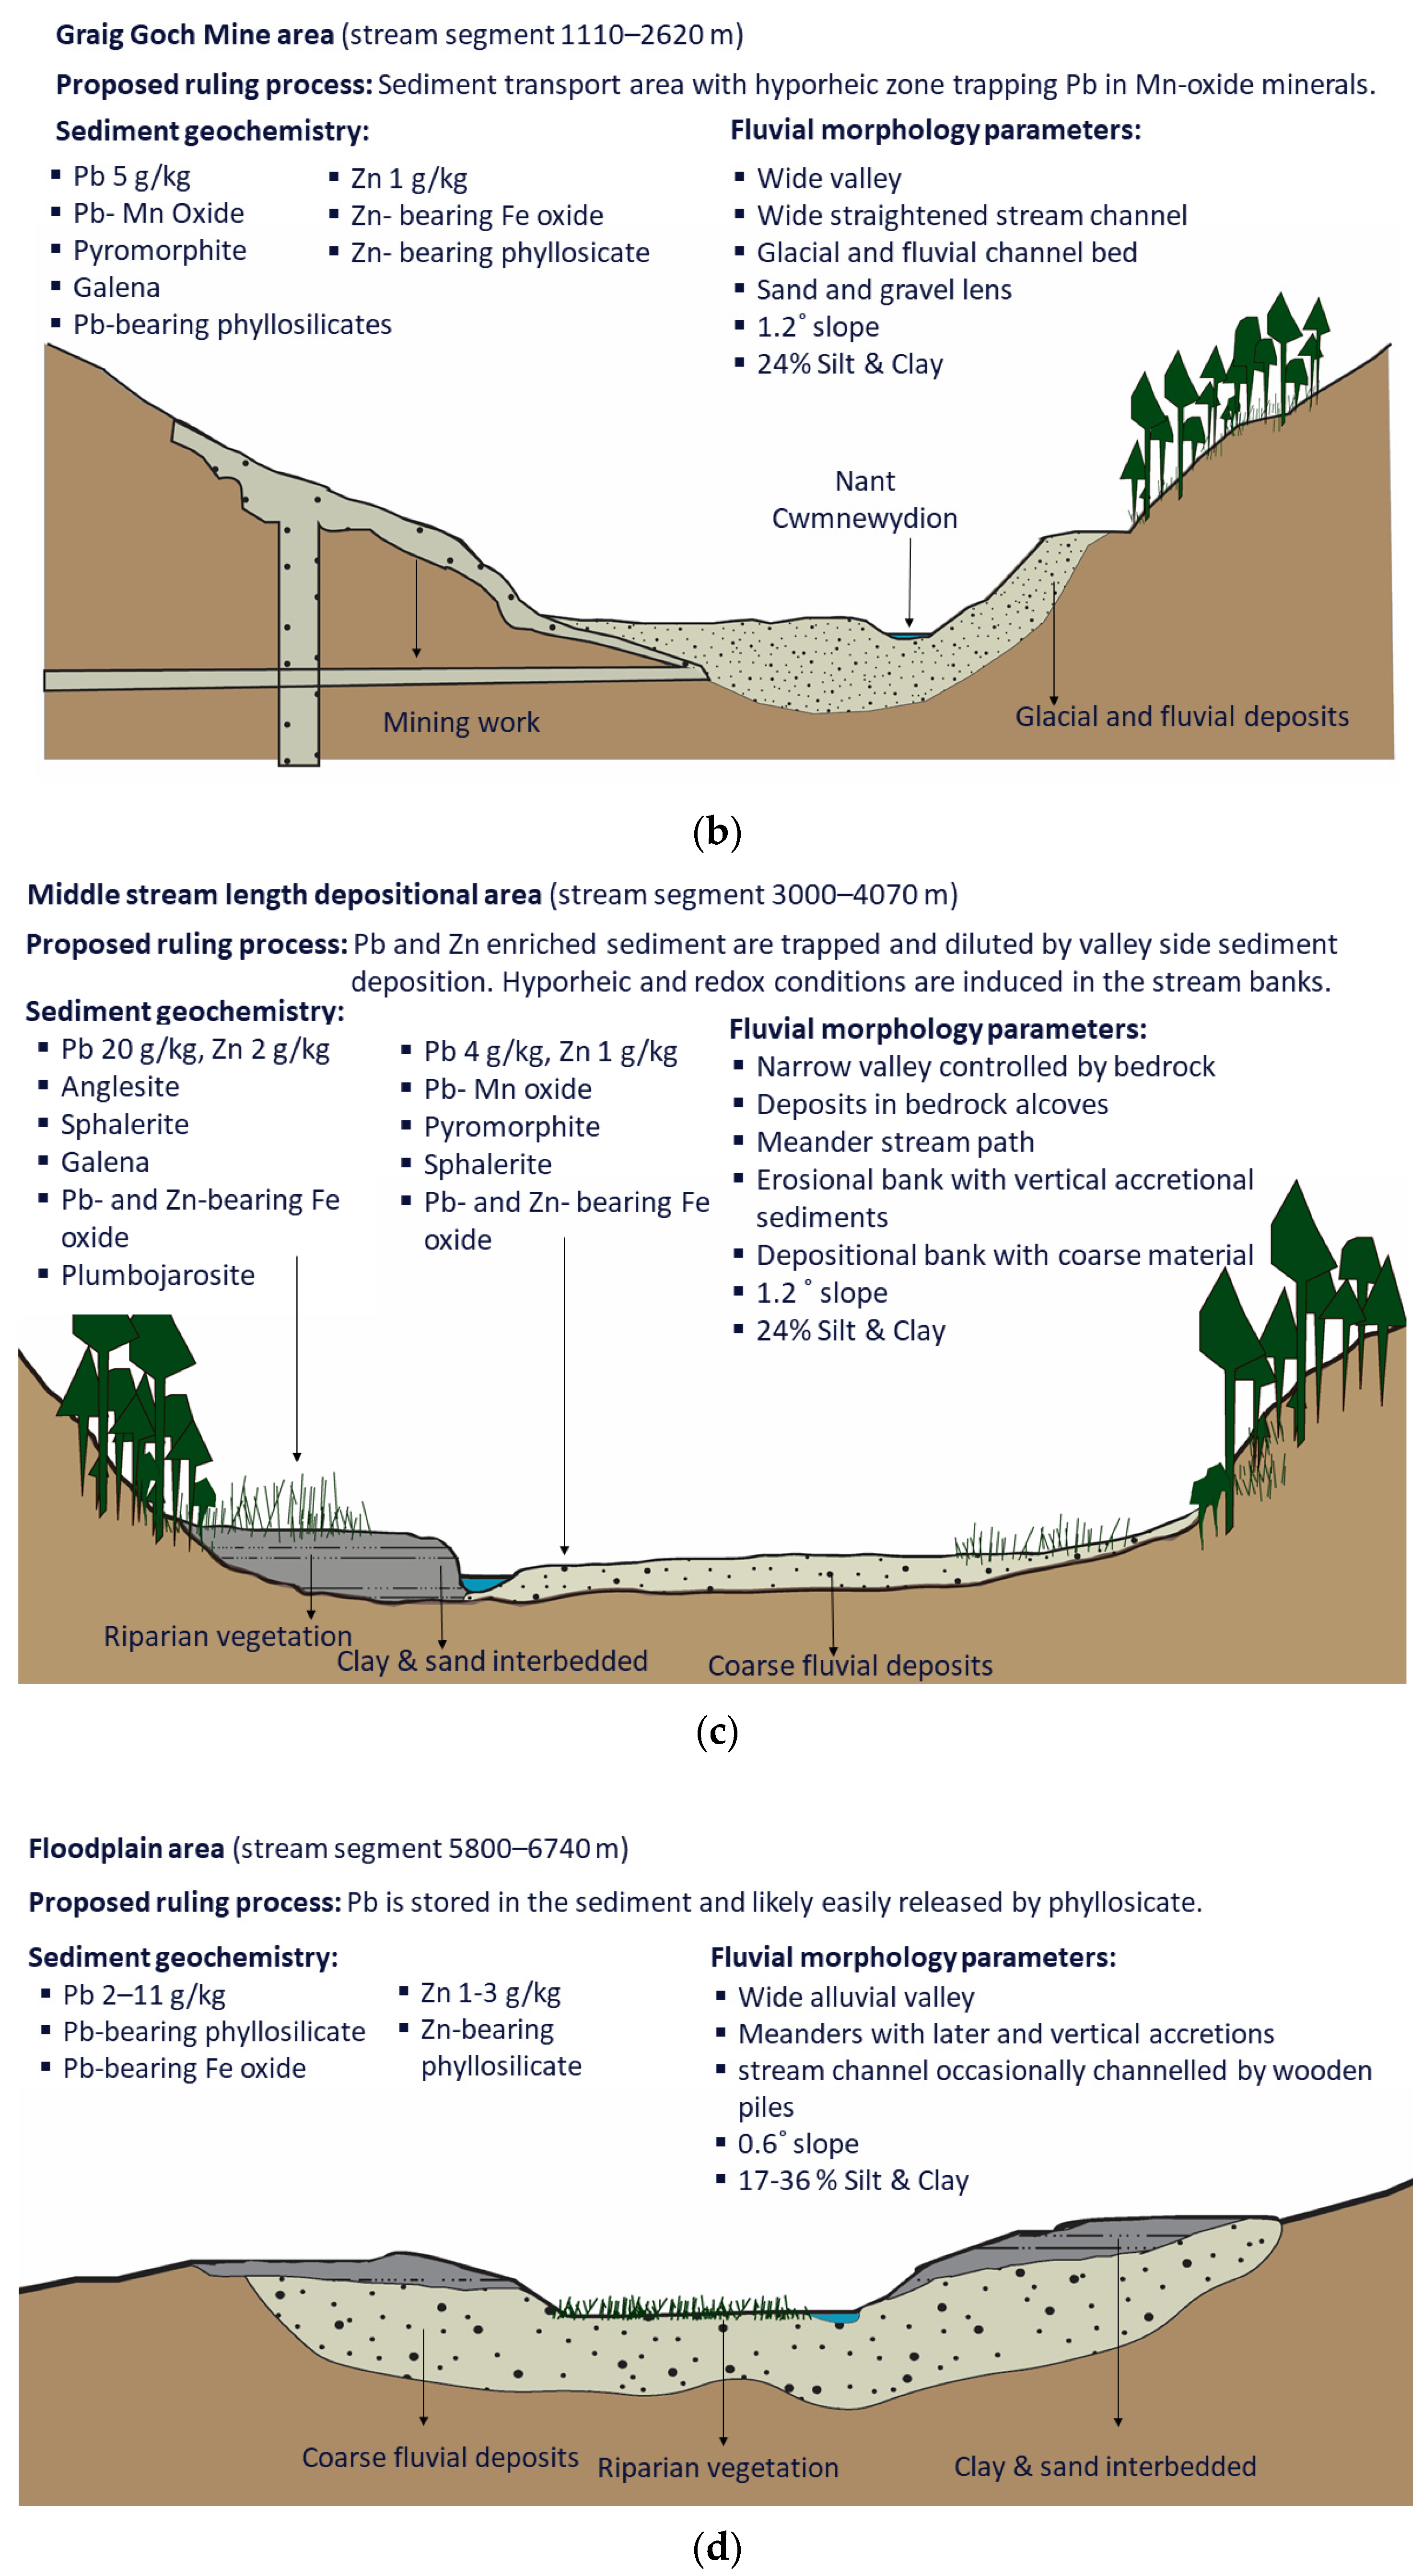
The topography and slope map for the study area is presented in Figure 1a,b. The morphological variabilities of the Nant Cwmnewyddion and the Nant Magwr are typical of mining-impacted rivers, for which active morphological processes restore geomorphological equilibrium disturbed by ore extraction and spoil material [6]. The observed morphological processes include aggradation and degradation events such as the erosion of banks and terraces and sediment deposition. Therefore, areas along the stream were classified as erosional, transport, or depositional (Figure 2).

3.1.1. Erosion from the Mining Heaps (0–180 m Stream Segment)

Over the mine’s history, the stream headwater (0–180 m) was continuously fed with mine waste coming from both Wemyss and the adjacent Frongoch Mine sites. The steep valley sides and the highest slope within the catchment (5.1°) limited the headwater capacity to store mine wastes (Figure 1b). At the mine area (WM), the right stream bank (facing downstream) was 0.5–1 m high and constituted clay and loose sand deposits (Figure 1c.1 and Figure 2a). Occasionally, sand was deposited in pools and alcoves of the bedrock streambed. Numerous surveys at the field site showed lateral accretions in the channel and material loss from the tips and stream banks, which caused changes in the riverbed shape and size. Erosion conveyed sediments from the Wemyss Mine tips into the downstream fluvial system, similar to the erosional processes observed by Kincey, et al. [11]. Due to this continuous degradation, the 0–180 m segment was classified as erosional (Figure 2a).

3.1.2. Sediment Transport (1110–2620 m Stream Segment)

Around the Graig Goch Mine (1110–2620 m, GG), the channel crossed a wide valley and had a slope of 1.2° (Figure 1b,c.2). The river channel was straight at this position, which was likely due to the channelisation imposed by the nearby mine workings, road, and farm. The wide stream channel (1–2 m wide) with glacial sand and gravel lens may have enhanced the circulation of the water [40,44]. The fine-grained waste eroded in the upstream segment (0–180 m) was not deposited in this area (Figure 1c), which was likely due to downstream transport across streamflow conditions [42]. Therefore, the 1100–2620 m stream segment, which was mainly characterised by downstream passive sediment transport, was classified as a transport area (Figure 2b).

3.1.3. Middle Stream Length Depositional Area (3000–4070 m Stream Segment)

At the middle river segment (3000–4070 m, DC), the topography indicated a narrow valley, and the river channel was bedrock-controlled with a slope of 1.2° (Figure 1b,c.3). The channel bed was formed alternatively with bedrock and sand lenses, and the banks were covered with dense wooded and shrub-like vegetation (ferns, nettles, and rushes). Due to seasonal recreational land use, the vegetation and the stream bank stability were occasionally managed. The river channel here meandered, creating 0 to 2 m high riverbanks. Interlayered clays and sands characterised the highest banks, whereas the lowest banks contained coarse sand and gravel fluvial deposits. The fine-grained sediments were similar to those observed at the Wemyss Mine site. This segment potentially acted as a ‘sediment trap’ that was likely filled up during the most active mining years [12]. Depositional structures such as vertical accretions of sand and clay layers and depositional silty–sandy lenses likely control the river bank permeability and interaction with the river water [3,14]. Therefore, the stream segment was classified as a depositional area (Figure 2c).

3.1.4. Floodplain Area (5800–6740 m Stream Segment)

The floodplain stream segment (5810–6740 m, RB) had the lowest slope (0.6°) across the alluvial valley (Figure 1b). The stream channel meandered, except for the segment crossed by the main road, which was channelised using wooden piles. The channel bed comprised largely coarse fluvial deposits (Figure 1c.4). The area was used predominantly as farmland, and channel bed animal crossings occurred in the most downstream segment. The heights of the riverbanks varied from 0 to 2 m and hosted sedimentation structures such as lateral vertical aggradation. Similar features were observed in Welsh rivers (UK) [12] and in a New Zealand mining-impacted catchment [2]. This segment can be considered a depositional area (Figure 2d).

3.2. Sediment Geochemistry and Mineralogy

The sediment pH values varied between 4.5 and 5.0, with the highest readings recorded in the floodplain samples (Table 1). Lead and Zn concentrations ranged from 20 to 24,700 mg/kg and 250 to 4600 mg/kg, respectively. The highest metal values occurred in upstream sediments: 24,700 mg/kg for Pb and 1500 mg/kg for Zn at CW and 23,800 mg/kg for Pb and 4600 mg/kg for Zn at WM. Sediments upstream of the mines (T0) had high Pb and Zn concentrations (7400 mg/kg for Pb and 1300 mg/kg for Zn), which was potentially due to the proximity to the mine waste from the Wemyss and Frongoch Mine. Graig Goch Mine sediments (GG) had lower Pb concentrations than those in the upstream mine heaps. Along the depositional areas (DC and RB), the sediments had some of the lowest concentrations. Sediments from DC had an average of 10,400 mg/kg for Pb and 1000 mg/kg for Zn, and those from RB had average concentrations of 4400 mg/kg for Pb and 1600 mg/kg for Zn (Table 1). Zinc and Pb concentrations throughout the stream were higher than the guideline values reported as the threshold effect level (TEL) and the probable effect level (PEL) from the Canadian soil guidelines adopted by the Environmental Agency [44]. The only values below the TEL (threshold effect level), 123 mg/kg for Zn and 35 mg/kg for Pb [45], were the concentrations measured in a riverbank on the downstream side of the floodplain (Table 1). Therefore, according to the PEL guidelines, the channel and overbank sediments are potentially harmful to the surrounding ecosystem.
Mineralogical analysis showed spatial variability with a widespread presence of bulk minerals such as quartz, feldspar, and phyllosilicate (such as illite and chlorite) associated with zircon, monazite, rutile, and ilmenite. The Zinc and Pb primary minerals were galena and sphalerite, localised predominantly in the upstream part. The secondary mineral geochemistry reflected the presence of phosphate, silicate, sulphate, Pb, and Zn (Table 2). The minerals were anglesite, plumbojarosite, pyromorphite, and Pb- and Zn-bearing phyllosilicates. Iron- and Mn-hydroxides and secondary sulphates were present as secondary weathering products, which were likely both directly precipitated or formed as a replacement for other minerals [9]. The weathering products occurred either at the headwaters with the primary minerals or further downstream, where they were more abundant and varied. The Zn and Pb minerals in the Cwmnewyddion and Magwr river systems are typical of Zn and Pb mining areas with low amounts of pyrite and carbonate [37,46]. The mineralogical suite observed at the Wemyss and Graig Goch Mines corroborates previous findings described by Palumbo-Roe and Dearden [35].
In the upstream part of the catchment, sub-angular aggregates of well-shaped minerals (quartz, rutile, zircon, and phyllosilicate) cemented with Fe-oxide amorphous phases characterised the sediment. The iron-oxides had low concentrations of Pb, S, Cl, and P and showed O–Fe ratios between one to two, indicating a potential goethite or hematite mineralogy. Furthermore, sulphides, including galena and sphalerite, were observed with Fe-oxide minerals occurring on weathered grain edges (Figure 3a). Other secondary minerals were sulphates (anglesite, hydrate Pb-sulphates, and Cu-bearing jarosite). The Graig Goch Mine sample GG L1 was characterised by mudstone detritus and bulk minerals agglomerated in 0.1–0.5 mm clusters or crystals. Occasionally, galena grains and Zn- and Pb-bearing Fe-hydroxides were observed in the clusters (Figure 3b). Other Pb-bearing minerals were Mn-Pb oxides, with a three to one Mn-Pb ratio [40], and pyromorphite spotted on weathered cluster edges. The SEM images showed significant quantities of Zn (of up to 420 mg/kg) and Pb (of up to 1300 mg/kg) associated with phyllosilicate phases (Figure 3b).
Stream erosional banks from the meandered depositional area (3000–4070 m) showed different mineral suites. In the middle length of the river (DC), Pb was observed with sulphides, sulphates, Fe–Mn hydroxides, and phyllosilicate minerals. Samples collected from the depositional side of a meander (DC E) had Pb-bearing Fe or Mn oxide phases and pyromorphite associated with galena (Figure 2c). Samples collected from the 2 m high riverbank (DC F) showed higher Pb and Zn concentrations than sample DC E (Table 1). Lead was observed as a primary and galena (Figure 3c) as a secondary mineral, with chemical compositions that were suggestive of anglesite and plumbojarosite phases. The presence of Zn was noted only with electron microprobe analysis, in accordance with the Zn average of the pXRF results, which indicated lower concentrations of Zn in this area (Table 1). Zinc was found in Fe-oxides and minerals that were chemically similar to sulphates (Figure 3c). In the floodplain, samples showed an abundant Fe-hydroxide presence, bearing a variety of metals such as Pb, Zn, and As (Figure 3d). These minerals were often found in a cementing phase around phyllosilicate layers. Zinc, Pb, S, and P were often associated with the phyllosilicate composition (Mg, Fe, Si, Al, and O).

3.3. Zinc and Lead Water Concentrations, Loads, and Suspended Sediments

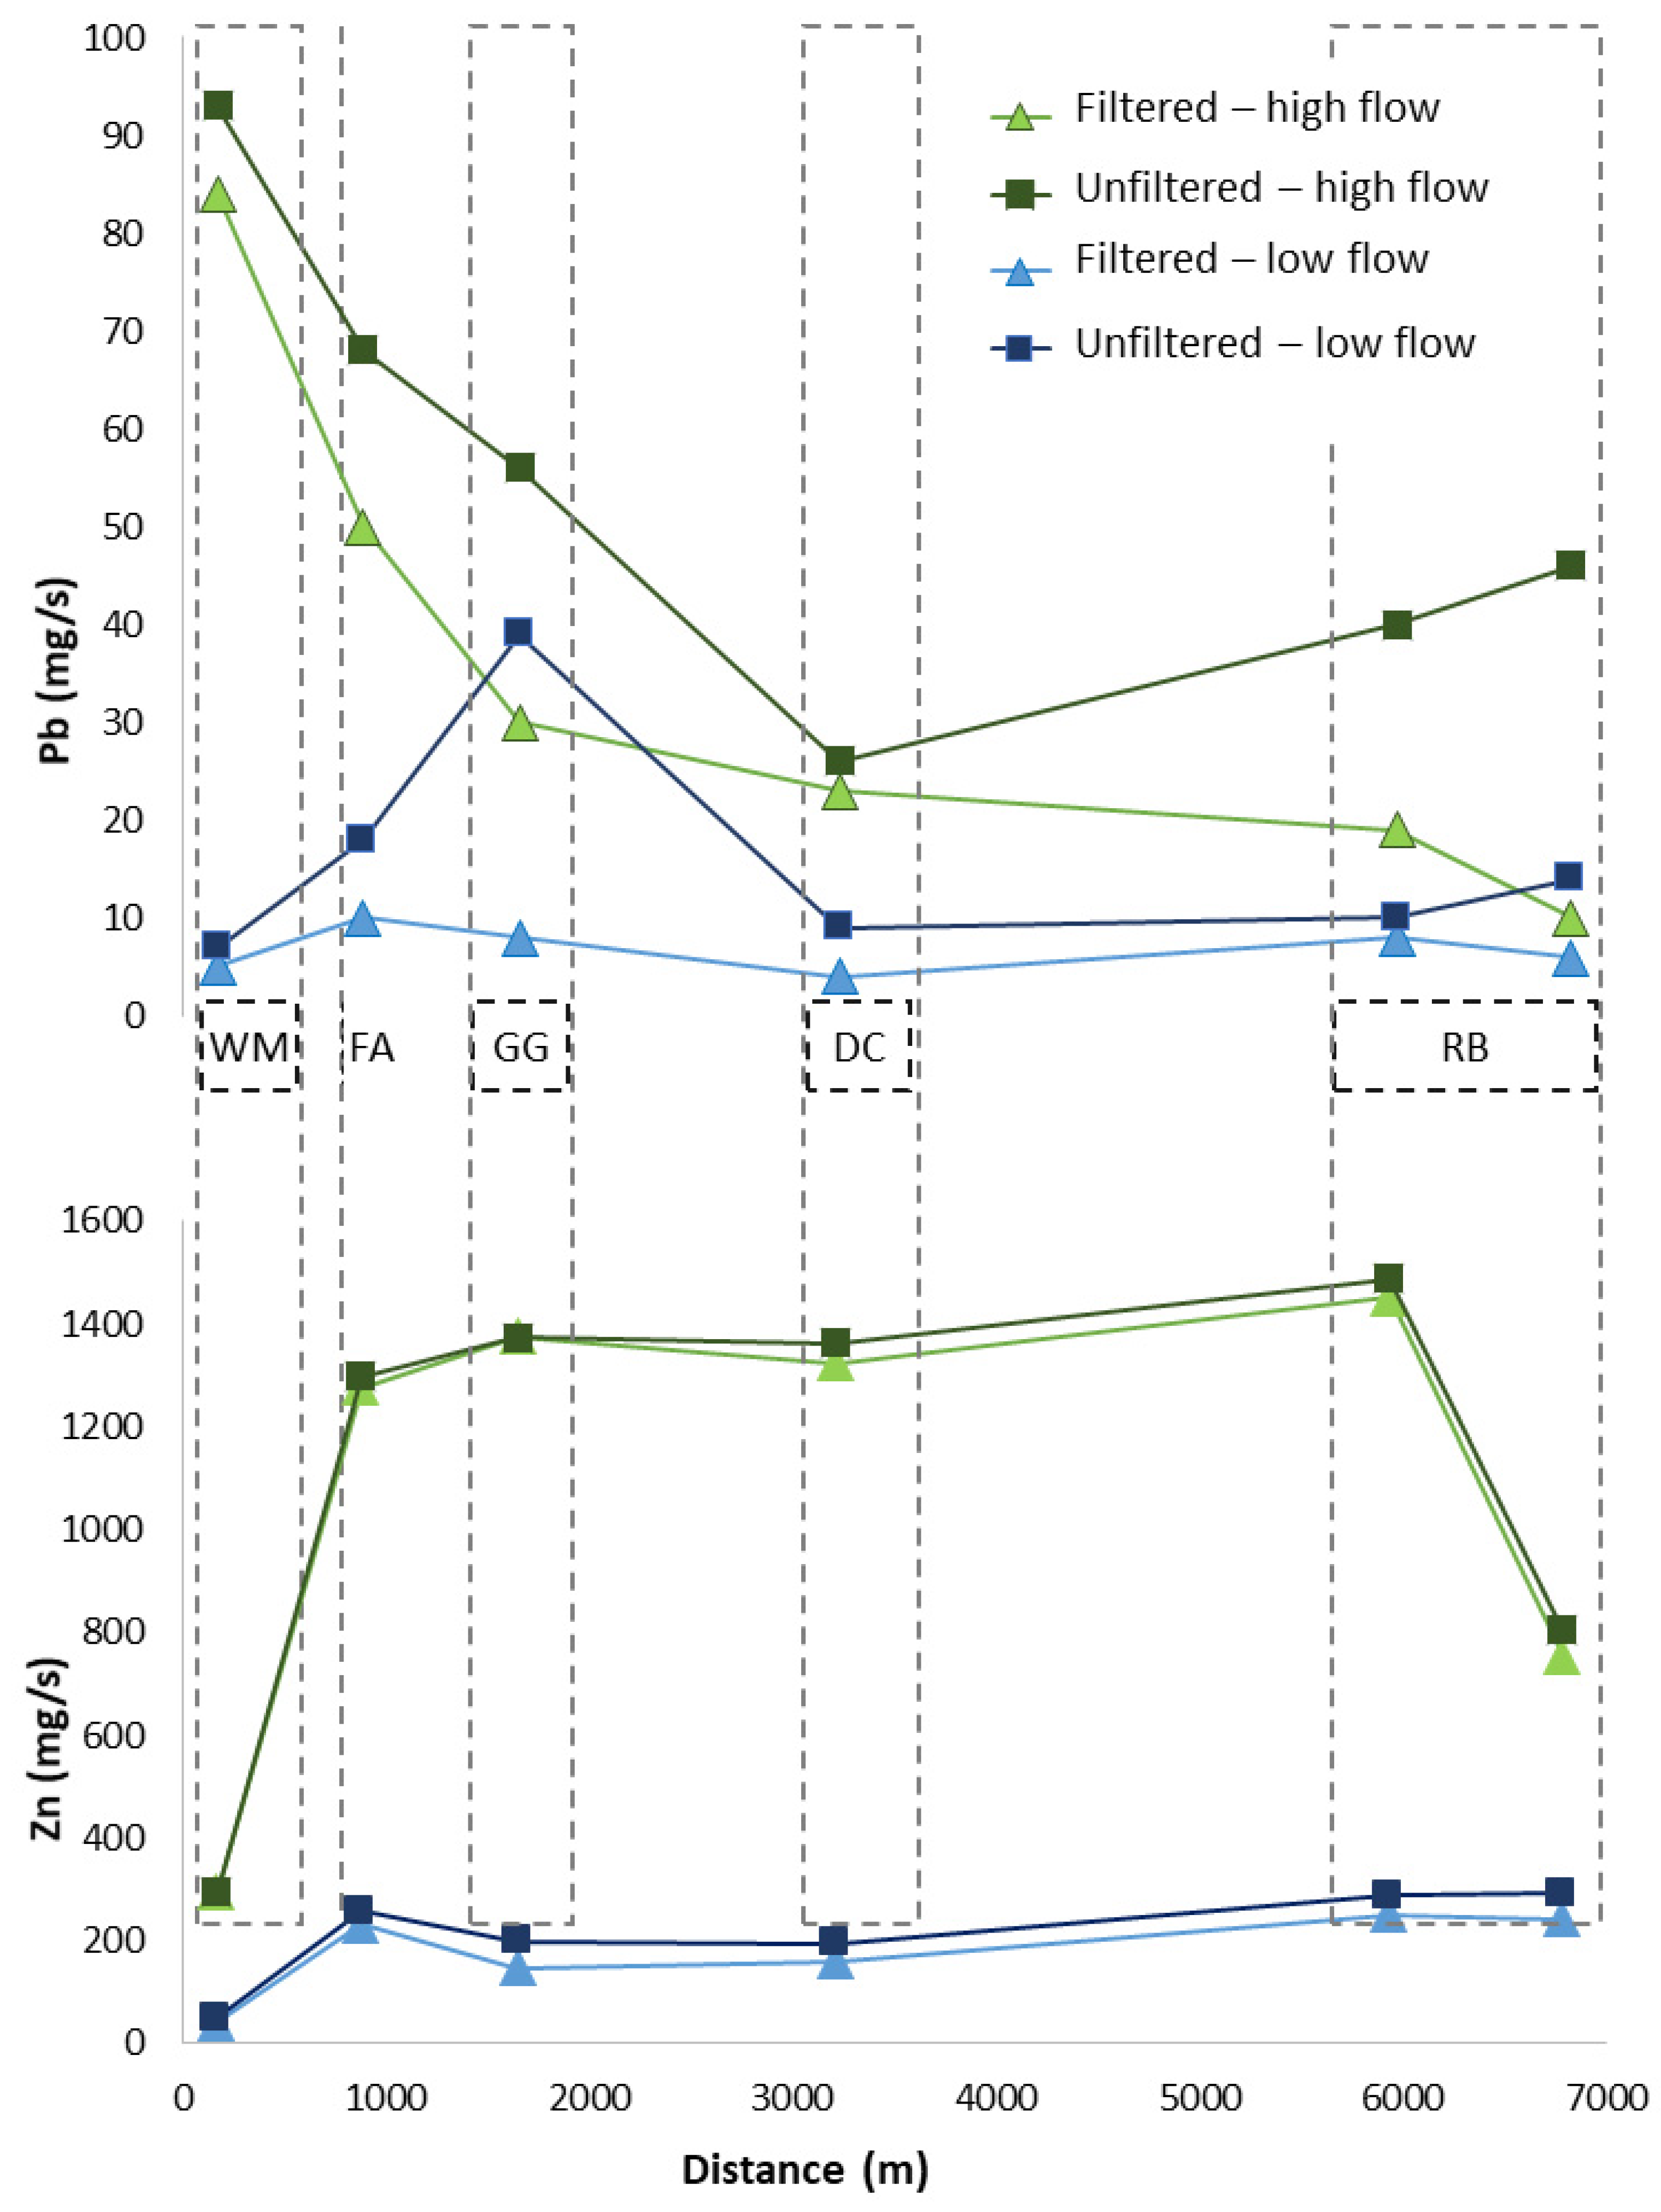
Aqueous Zn and Pb concentrations and suspended sediment loads bearing Pb and Zn varied along the river system (Table 2 and Figure 4) (see [40] for a full dataset). Filtered and unfiltered Zn concentrations showed the same spatial patterns, with slightly higher concentrations in the latter. During low- and high-streamflow conditions, Zn concentrations increased downstream of the Mill Race and the Wemyss Mine tips (171 m downstream). A second increase was noted downstream of Frongoch Adit (880 m), followed by a decrease to the floodplain (6780 m), where the lowest concentrations were observed. Generally, Zn loads increased along WM and FA (Figure 4). Under low-streamflow conditions, filtered and unfiltered Zn loads decreased at GG and gradually increased at DC and the floodplain (RB). An increase in Zn load was observed at GG and, in contrast with low-flow conditions, Zn loads decreased in the lower part of the floodplain (RB d/s). The lowest load values were recorded at 0 m (T0, 6 mg/s) and the highest at 5930 m (RB u/s, 1488 mg/s) during high-flow conditions. Loads under high-streamflow conditions were approximately seven times higher than low-flow loads. Suspended sediment load values were similar across streamflow conditions (Table 2).
Filtered and unfiltered Pb concentrations generally had the same spatial pattern, but unfiltered values showed more variability between low- and high-flow conditions (Table 2). The first Pb concentration increase was recorded at 171 m, which was particularly important under high-flow conditions for unfiltered Pb. Across streamflow conditions, unfiltered Pb ranged from 95 µg/L to 248 µg/L at the Graig Goch Mine, whereas filtered Pb had a constant concentration of approximately 50 µg/L. At 3210 m (DC), Pb concentrations varied among streamflows, especially those of unfiltered Pb (Table 2). Although the filtered Pb concentration decreased in the downstream part of the river, unfiltered Pb exhibited a final increase along the floodplain under low- and high-flow conditions. Lead loads showed spatial variability across streamflow conditions (Figure 3). Under high-flow conditions, filtered and unfiltered Pb loads had the highest values at WM and then decreased up to DC. Under low-flow conditions, the Pb load had the highest spike at FA (880 m) and then decreased along GG and DC. Across streamflow conditions, Pb loads increased in the floodplain area, with unfiltered Pb increasing along the entire floodplain stretch and the filtered Pb load, instead, decreasing in the most downstream part. The variations between filtered and unfiltered Pb loads highlighted the spatial variability of the Pb-bearing sediment load along the stream (Table 2 and Figure 3).

3.4. Fluvial Geomorphological Controls on Zinc and Lead Geochemistry

The geomorphological features (channels, slopes, meanders, etc.) observed along the stream can be associated with different geochemical settings [47]. Together with hydrological conditions (such as streamflow variations), accumulation, erosion, and sediment permeability can significantly control pH–redox reactions and metal residence times [48]. Examples of geochemical processes that are likely to be controlled by fluvial morphological zones are reported in Figure 2.
In the erosional area (0–180 m), Zn and Pb primary minerals or secondary phases, such as anglesite, can be washed downstream via degradation processes (Figure 2a). Anglesite minerals, being stable in circum-neutral streamwater [9], may contribute to the suspended sediment, particularly during high-flow conditions, as reflected in the unfiltered Pb load increase during high-flow conditions (Table 2). Similarly, Kincey, et al. [11] observed the erosion of the waste from a spoil tip with the exposure of fresh waste to weathering conditions and the transport of metal-enriched sediments.
Sediment deposition was low in the transport stream segment (1110–2620 m), and the gravel and sandy streambed likely promoted oxygenated streamwater circulation (Figure 2b). The manganese hydroxides found in this segment (Table 1) may indicate the mixing of oxygenated stream water with anaerobic water from more reducing groundwater environments [49]. Ground- and hyporheic-water-promoting Mn-hydroxide formations may enhance Pb attenuation processes [40,50]. The filtered Pb load decreased around GG across low- and high-flow conditions (Figure 4), and the suspended load was among the highest calculated values (Table 2), indicating processes promoting Pb(aq) uptake and the mobilisation of sediment-borne Pb. Aqueous Pb can be released from Mn-Pb oxides if redox conditions change [31], for example, under prolonged flooding conditions or sediment deposition, decreased water circulation, and the promotion of anaerobic conditions.
Along the depositional area at 3000–4070 m, the narrow valley and the bedrock-controlled river channel were likely trapping metal-bearing sediments mixed with uncontaminated sediments [6,10]. Figure 4 shows a decrease in Pb loads under both high- and low-streamflow conditions, indicating the deposition of Pb-bearing suspended sediments and the attenuation of aqueous Pb. Lead-bearing sulphate and Fe hydroxide were found in the vertical accretion structures, along with sphalerite grains and Zn associated with Fe, P and S, which were interpreted as plumbojarosite minerals (Figure 3c). Herein, prolonged flooding conditions can generate reducing conditions promoting Fe oxyhydroxide dissolution and plumbojarosite stability [51]. The subsequent drying of the sediments can oxidise sulphide phases (galena and sphalerite) and release associated metals [31], easily reaching the streamwater through the sandy layers or forming secondary Zn sulphate minerals and anglesite [14].
Furthermore, in the sandy pockets that are characteristic of the low riverbanks, the presence of Pb-bearing Mn oxides may indicate small areas of water interaction between oxygenated streamwater and sub-surface water (Figure 2c). Secondary Zn sulphate minerals with a high solubility [29] may release Zn in an aqueous form when this sediment is washed out during moderate- to high-streamflow conditions.
In the floodplain (5800–6740 m), the low stream gradient (Figure 1b) likely promotes slow water movement and enhances aqueous Pb and Zn uptake onto mineral surfaces and the deposition of metal-bearing sediments (Figure 4). Lead-bearing phyllosilicates (illite and chlorite) can be easily dispersed along the stream depending on the streamflow conditions, especially under high flow, contributing to the suspended sediment loads (Figure 4); on the contrary, Zn dispersion under high-flow conditions was not observed. Generally, the deposition of metal-bearing sediments as lateral vertical aggradations (Figure 2d) occurring under moderate- to high-streamflow conditions can result in the deposition and prolonged storage of Pb and Zn, which is typical of floodplains [7].

3.5. Implications for Sediment Quality Management

Metal contamination monitoring largely focuses on catchment headwaters wherein mine workings are often located. However, there is ample evidence that centuries of mining activity have produced tonnes of contaminated waste, which high-gradient rivers have remobilised along the rivers [6]. Sediment at the headwater of the Wemyss Mine can release Zn and Pb from sulphide minerals both as aqueous and solid phases (Table 2 and Figure 4). Metals can be physically (deposited) or chemically (precipitated or adsorbed) trapped along the stream, as with the Graig Goch Mine, or sedimented further downstream where both primary and secondary metal-enriched minerals are observed. Lead dispersion along the catchment seems to be influenced by the fluvial morphological parameters recognised along the classified areas. At a circum-neutral pH, Pb forms more stable secondary minerals, such as anglesite and Pb-Mn oxides. This water–soil interaction controls filtered and unfiltered Pb phase mobility, explaining the Pb-bearing suspended sediment load increase under high-flow conditions and the persistent Pb concentration in downstream sediments. A similar Pb behaviour controlled by the topography was observed in the Le’an River floodplain (Jiangxi Province, China) [52]. Zhu, et al. [37] explained that slope geomorphologically and hydrologically controls sediment movement, to which the Pb fate appears to be linked. On the other hand, the downstream decrease in sediment Zn concentrations is potentially due to the instability of Zn sulphate minerals and the high mobility of Zn in circum-neutral river systems [29,30]. In this study, Zn-sulphates, Zn-bearing Fe-oxides, and phyllosilicate were observed in the stream sediments, although the small differences between filtered and unfiltered Zn loads (Figure 4) indicated that Zn was mostly mobilised as aqueous phases and that the Zn-bearing phases had a high solubility.
The primary and secondary minerals observed along the studied stream represent a storage system of trace metals in solid phases. Although sediment metal concentrations tended to decrease downstream from the former mine, the estimated metal load variations demonstrated that secondary sources in the middle stream length and floodplain can still contribute to the metal load, especially under high-flow conditions. The metals contained in downstream sinks are potentially bioavailable. Byrne, et al. [46], using sequential extractions, found increases in readily extractable Zn and Cd downstream from the Dylife Mine, UK. Chemical metal release or up-take from metal-bearing mineral phases may occur due to changes in pH or redox settings [28,53]; this can occur due to streamflow variations [40], the mixing of water, or the soil formation [54]. Therefore, geochemical and mineralogical investigations of metal-bearing phases are fundamental to anticipating their potential metal release and informing remediation strategies.
Procedures for assessing sediment quality may benefit from the evidence provided herein, where both geomorphological and sedimentary geochemical studies highlighted the metal distribution and suggested the possible mechanisms of metal-enriched sediment mobilisation or aqueous metal release. The geomorphological approach can help identify areas of mine waste exposure and deposition. Fluvial geomorphological description can also identify potential secondary metal sources throughout a river, leading to the first steps in mining-impacted river monitoring. This approach can provide guidance on metal contaminant values for restoration and land use purposes [8]. For instance, despite evidence for the presence of Pb- and Zn-contaminated sediments, the areas are used extensively for grazing (1110–2620 m and 5800–6740 m) and recreational purposes (3000–4070 m). This highlighted the need to consider the ecotoxicity Pb and Zn can pose in the environment along the whole stream, where different lands can be dedicated to different uses (farming, recreational, touristic attractions, access to public paths, etc.), increasing the potential exposure of receptors to metal intake. This approach can also be applied to mining incidents such as dam failures to identify areas of sediment deposition and appraise potential metal behaviours across streamflow conditions.

4. Conclusions

The catchment-scale investigation of metal-bearing sediment distribution aids in understanding the long-term environmental impacts of metal mineral extraction on river systems. Previous studies have evaluated the riverine impact of metal mining waste by estimating metal distribution through either geomorphological or geochemical observations. This novel study combined both aspects with metal stream load estimations to elucidate the geochemical and metal release processes operating in different geomorphological settings. The semi-quantitative approach that was used to investigate the fluvial geomorphology (topography, slope, grain size distribution, and landscape observations) allowed the identification of fluvial geomorphological zones (erosional, transport, and depositional areas) where metals were released and trapped across different streamflow conditions. Overall, Pb and Zn sediment concentrations were higher than guideline values, and a variety of metal-bearing minerals were observed along the river: (i) Pb and Zn sulphides, anglesite, and Fe-oxide dominated the erosional mining areas; (ii) hyporheic areas found in sediment transport or depositional areas encouraged Pb-bearing Mn oxide formation; and (iii) Pb- and Zn-bearing phyllosilicate and Fe-oxides characterised downstream depositional areas.
Assessing and monitoring sediments in impacted catchments is often complex, costly, and time-consuming. Fluvial morphological parameters provide low-cost monitoring to plan a sampling strategy whereby alluvial or bedrock-controlled depositional areas are targeted. Fluvial depositional parameters coupled with geochemical and mineralogical investigations can provide information on possible Zn and Pb release patterns.

Author Contributions

P.O., P.B. and K.A.H.-E. designed this study. P.O. wrote the manuscript. P.O., P.B., K.A.H.-E., C.O.H. and T.S. assisted with the fieldwork. All authors contributed to and reviewed the manuscript. All authors have read and agreed to the published version of the manuscript.

Funding

John Moores University funded P.O.’s PhD scholarship (2015–2018).

Data Availability Statement

The data are available upon request. Please contact the corresponding author.

Acknowledgments

The authors gratefully thank Liverpool John Moores University for funding P.O.’s PhD scholarship. We gratefully acknowledge Andy Beard for their assistance with the microprobe analysis, Gary Tarbuck for providing the chemical analysis, Dave Williams and Hazel Clarke for their assistance with the fieldwork equipment, Nicola Dempster and Rob Allen for the XRD analysis, Natasha Donn-Arnold for her help with sampling and the pXRF analysis, Paul Gibbson for their assistance with the SEM analysis, and Timothy P. Lane for their help with the ArcGIS map preparation.

Conflicts of Interest

The authors declare no conflict of interest.

References

  1. Kossoff, D.; Dubbin, W.E.; Alfredsson, M.; Edwards, S.J.; Macklin, M.G.; Hudson-Edwards, K.A. Mine tailings dams: Characteristics, failure, environmental impacts, and remediation. Appl. Geochem. 2014, 51, 229–245. [Google Scholar] [CrossRef] [Green Version]
  2. Clement, A.J.H.; Nováková, T.; Hudson-Edwards, K.A.; Fuller, I.C.; Macklin, M.G.; Fox, E.G.; Zapico, I. The environmental and geomorphological impacts of historical gold mining in the Ohinemuri and Waihou river catchments, Coromandel, New Zealand. Geomorphology 2017, 295, 159–175. [Google Scholar] [CrossRef]
  3. Hudson-Edwards, K.A.; Jamieson, H.E.; Lottermoser, B.G. Mine Wastes: Past, Present, Future. Elements 2011, 7, 375–380. [Google Scholar] [CrossRef]
  4. Elznicová, J.; Matys Grygar, T.; Popelka, J.; Sikora, M.; Novák, P.; Hošek, M. Threat of Pollution Hotspots Reworking in River Systems: Case Study of the Ploučnice River (Czech Republic). ISPRS Int. J. Geo-Inf. 2019, 8, 37. [Google Scholar] [CrossRef] [Green Version]
  5. Lewin, J.; Macklin, M.G. Metal mining and floodplain sedimentation in Britain. In International Geography; Gardiner, V., Ed.; John Wiley & Sons Ltd: Hoboken, NJ, USA, 1987. [Google Scholar]
  6. Miller, J.R. The role of fluvial geomorphic processes in the dispersal of heavy metals from mine sites. J. Geochem. Explor. 1997, 58, 101–118. [Google Scholar] [CrossRef]
  7. Dennis, I.A.; Coulthard, T.J.; Brewer, P.; Macklin, M.G. The role of floodplains in attenuating contaminated sediment fluxes in formerly mined drainage basins. Earth Surf. Process. Landf. 2009, 34, 453–466. [Google Scholar] [CrossRef]
  8. Fornasaro, S.; Morelli, G.; Rimondi, V.; Fagotti, C.; Friani, R.; Lattanzi, P.; Costagliola, P. A GIS-based map of the Hg-impacted area in the Paglia River basin (Monte Amiata Mining District—Italy): An operational instrument for environmental management. J. Geochem. Explor. 2022, 242, 107074. [Google Scholar] [CrossRef]
  9. Hudson-Edwards, K.A.; Macklin, M.G.; Curtis, C.D.; Vaughan, D.J. Processes of Formation and distribution of Pb-, Zn-, Cd-, and Cu-bearing Minerals in the Tyne Basin, Northeast England: Implication for Metal-Contaminated River Systems. Environ. Sci. Technol. 1996, 30, 72–80. [Google Scholar] [CrossRef]
  10. Hudson-Edwards, K.A.; Macklin, M.G.; Miller, J.R.; Lechler, P.J. Sources, distribution and storage of heavy metals in the Rio Pilcomayo, Bolivia. J. Geochem. Explor. 2001, 72, 229–250. [Google Scholar] [CrossRef]
  11. Kincey, M.; Warburton, J.; Brewer, P.A. Contaminated sediment flux from eroding abandoned historical metal mines: Spatial and temporal variability in geomorphological drivers. Geomorphology 2018, 319, 199–215. [Google Scholar] [CrossRef] [Green Version]
  12. Foulds, S.A.; Brewer, P.A.; Macklin, M.G.; Haresign, W.; Betson, R.E.; Rassner, S.M. Flood-related contamination in catchments affected by historical metal mining: An unexpected and emerging hazard of climate change. Sci. Total Environ. 2014, 476, 165–180. [Google Scholar] [CrossRef] [PubMed]
  13. Nordstrom, D.K. Hydrogeochemical processes governing the origin, transport and fate of major and trace elements from mine wastes and mineralized rock to surface waters. Appl. Geochem. 2011, 26, 1777–1791. [Google Scholar] [CrossRef]
  14. Lynch, S.; Batty, L.; Byrne, P. Environmental Risk of Metal Mining Contaminated River Bank Sediment at Redox-Transitional Zones. Minerals 2014, 4, 52–73. [Google Scholar] [CrossRef] [Green Version]
  15. Palumbo-Roe, B.; Wragg, J.; Banks, V.J. Lead mobilisation in the hyporheic zone and river bank sediments of a contaminated stream: Contribution to diffuse pollution. J. Soils Sediments 2012, 12, 1633–1640. [Google Scholar] [CrossRef] [Green Version]
  16. Macklin, M.G.; Brewer, P.A.; Hudson-Edwards, K.A.; Bird, G.; Coulthard, T.J.; Dennis, I.A.; Lechler, P.J.; Miller, J.R.; Turner, J.N. A geomorphological approach to the management of rivers contaminated by metal mining. Geomorphology 2006, 79, 423–447. [Google Scholar] [CrossRef]
  17. Sracek, O.; Kříbek, B.; Mihaljevič, M.; Majer, V.; Veselovský, F.; Vencelides, Z.; Nyambe, I. Mining-related contamination of surface water and sediments of the Kafue River drainage system in the Copperbelt district, Zambia: An example of a high neutralization capacity system. J. Geochem. Explor. 2012, 112, 174–188. [Google Scholar] [CrossRef]
  18. Andrew Marcus, W. Copper dispersion in ephemeral stream sediments. Earth Surf. Process. Landf. 1987, 12, 217–228. [Google Scholar] [CrossRef]
  19. Obiora, S.C.; Chukwu, A.; Chibuike, G.; Nwegbu, A.N. Potentially harmful elements and their health implications in cultivable soils and food crops around lead-zinc mines in Ishiagu, Southeastern Nigeria. J. Geochem. Explor. 2019, 204, 289–296. [Google Scholar] [CrossRef]
  20. Abdel-Tawwab, M. Effect of feed availability on susceptibility of Nile tilapia, Oreochromis niloticus (L.) to environmental zinc toxicity: Growth performance, biochemical response, and zinc bioaccumulation. Aquaculture 2016, 464, 309–315. [Google Scholar] [CrossRef]
  21. Zhang, X.; Yang, L.; Li, Y.; Li, H.; Wang, W.; Ye, B. Impacts of lead/zinc mining and smelting on the environment and human health in China. Environ. Monit. Assess 2012, 184, 2261–2273. [Google Scholar] [CrossRef]
  22. Smith, K.M.; Abrahams, P.W.; Dagleish, M.P.; Steigmajer, J. The intake of lead and associated metals by sheep grazing mining-contaminated floodplain pastures in mid-Wales, UK: I. Soil ingestion, soil-metal partitioning and potential availability to pasture herbage and livestock. Sci. Total Environ. 2009, 407, 3731–3739. [Google Scholar] [CrossRef]
  23. Aghili, S.; Vaezihir, A.; Hosseinzadeh, M. Distribution and modeling of heavy metal pollution in the sediment and water mediums of Pakhir River, at the downstream of Sungun mine tailing dump, Iran. Environ. Earth Sci. 2018, 77, 128. [Google Scholar] [CrossRef]
  24. Cook, N.; Ehrig, K.; Rollog, M.; Ciobanu, C.; Lane, D.; Schmandt, D.; Owen, N.; Hamilton, T.; Grano, S. 210Pb and 210Po in Geological and Related Anthropogenic Materials: Implications for Their Mineralogical Distribution in Base Metal Ores. Minerals 2018, 8, 211. [Google Scholar] [CrossRef] [Green Version]
  25. De Giudici, G.; Medas, D.; Cidu, R.; Lattanzi, P.; Podda, F.; Frau, F.; Rigonat, N.; Pusceddu, C.; Da Pelo, S.; Onnis, P.; et al. Application of hydrologic-tracer techniques to the Casargiu adit and Rio Irvi (SW-Sardinia, Italy): Using enhanced natural attenuation to reduce extreme metal loads. Appl. Geochem. 2018, 96, 42–54. [Google Scholar] [CrossRef]
  26. Elmayel, I.; Esbri, J.M.; Efren, G.O.; Garcia-Noguero, E.M.; Elouear, Z.; Jalel, B.; Farieri, A.; Roqueni, N.; Cienfuegos, P.; Higueras, P. Evolution of the Speciation and Mobility of Pb, Zn and Cd in Relation to Transport Processes in a Mining Environment. Int. J. Environ. Res. Public Health 2020, 17, 4912. [Google Scholar] [CrossRef]
  27. Pavlowsky, R.T.; Lecce, S.A.; Owen, M.R.; Martin, D.J. Legacy sediment, lead, and zinc storage in channel and floodplain deposits of the Big River, Old Lead Belt Mining District, Missouri, USA. Geomorphology 2017, 299, 54–75. [Google Scholar] [CrossRef]
  28. Jarvis, A.P.; Davis, J.E.; Orme, P.H.A.; Potter, H.A.B.; Gandy, C.J. Predicting the Benefits of Mine Water Treatment under Varying Hydrological Conditions using a Synoptic Mass Balance Approach. Environ. Sci Technol 2019, 53, 702–709. [Google Scholar] [CrossRef] [PubMed]
  29. Lee, G.; Bigham, J.M.; Faurea, G. Removal of trace metals by coprecipitation with Fe, Al and Mn from natural waters contaminated with acid mine drainage in the Ducktown Mining District. Appl. Geochem. 2002, 17, 569–581. [Google Scholar] [CrossRef]
  30. Smith, K.S.; DeGraff, J.V. Strategies to predict metal mobility in surficial mining environments. In Understanding and Responding to Hazardous Substances at Mine Sites in the Western United States; Geological Society of America: Boulder, CL, USA, 2007; Volume 17. [Google Scholar]
  31. Lynch, S.F.L.; Batty, L.C.; Byrne, P. Environmental risk of severely Pb-contaminated riverbank sediment as a consequence of hydrometeorological perturbation. Sci. Total Environ. 2018, 636, 1428–1441. [Google Scholar] [CrossRef]
  32. Natural Resource of Wales. Abandoned Mine Case Study, Wemyss Lead and Zinc Mine. 2016. Available online: https://naturalresources.wales/media/679806/wemyss-mine-case-study_2016_06.pdf (accessed on 27 January 2023).
  33. Dyfed, A.T. Metal Mines Remediation Project Part 3: Wemyss Archaeological Assessment; Report No 2016/05–Part 3; DAT Archaeological Services: Llandeilo, UK, 2016; pp. 1–51. [Google Scholar]
  34. Sheppard, T.H. The Geology of the Area around Lampeter, Llangybi and Llanfair Clydogau; Integrated Geoscience Surveys South Programme, Internal Report IR/04/064; British Geological Survey: Nottingham, UK, 2004; Available online: http://nora.nerc.ac.uk/id/eprint/509306/1/IR04064.pdf (accessed on 27 January 2023).
  35. Palumbo-Roe, B.; Dearden, R. The hyporheic zone composition of a mining-impacted stream: Evidence by multilevel sampling and DGT measurements. Appl. Geochem. 2013, 33, 330–345. [Google Scholar] [CrossRef] [Green Version]
  36. Watts, G.; Battarbee, R.W.; Bloomfield, J.P.; Crossman, J.; Daccache, A.; Durance, I.; Elliott, J.A.; Garner, G.; Hannaford, J.; Hannah, D.M.; et al. Climate change and water in the UK—Past changes and future prospects. Prog. Phys. Geogr. Earth Environ. 2015, 39, 6–28. [Google Scholar] [CrossRef]
  37. Zhu, Y.-M.; Lu, X.X.; Zhou, Y. Suspended sediment flux modeling with artificial neural network: An example of the Longchuanjiang River in the Upper Yangtze Catchment, China. Geomorphology 2007, 84, 111–125. [Google Scholar] [CrossRef]
  38. Wentworth, C.K. A Scale of Grade and Class Terms for Clastic Sediments. J. Geol. 1922, 30, 377–392. [Google Scholar] [CrossRef]
  39. Radu, T.; Diamond, D. Comparison of soil pollution concentrations determined using AAS and portable XRF techniques. J. Hazard. Mater. 2009, 171, 1168–1171. [Google Scholar] [CrossRef] [PubMed]
  40. Onnis, P.; Byrne, P.; Hudson-Edwards, K.A.; Frau, I.; Stott, T.; Williams, T.; Edwards, P.; Hunt, C.O. Source apportionment of mine contamination across streamflows. Appl. Geochem. 2023, 151, 105623. [Google Scholar] [CrossRef]
  41. INCA Energy Applications Training Notes; Oxford Instrument: Abingdon-on-Thames, UK, 2008.
  42. Davis, A.; Drexler, J.W.; Ruby, M.V.; Nicholson, A. Micromineralogy of mine wastes in relation to lead bioavailability, Butte, Montana. Environ. Sci. Technol. 1993, 27, 1415–1425. [Google Scholar] [CrossRef]
  43. Richardson, M.; Moore, R.D.; Zimmermann, A. Variability of tracer breakthrough curves in mountain streams: Implications for streamflow measurement by slug injection. Can. Water Resour. J. Rev. Can. Des. Ressour. Hydr. 2017, 42, 21–37. [Google Scholar] [CrossRef]
  44. Mayes, W.M.; Gozzard, E.; Potter, H.A.; Jarvis, A.P. Quantifying the importance of diffuse minewater pollution in a historically heavily coal mined catchment. Environ. Pollut. 2008, 151, 165–175. [Google Scholar] [CrossRef]
  45. Environment Agency. Assessment of Metal Mining-Contaminated River Sediments in England and Wales; Environment Agency: Bristol, UK, 2008.
  46. Byrne, P.; Reid, I.; Wood, P.J. Sediment geochemistry of streams draining abandoned lead/zinc mines in central Wales: The Afon Twymyn. J. Soils Sediments 2010, 10, 683–697. [Google Scholar] [CrossRef] [Green Version]
  47. Ciszewski, D.; Grygar, T.M. A Review of Flood-Related Storage and Remobilization of Heavy Metal Pollutants in River Systems. Water Air Soil Pollut. 2016, 227, 239. [Google Scholar] [CrossRef] [Green Version]
  48. Hudson-Edwards, K.A. Sources, mineralogy, chemistry and fate of heavy metal-bearing particles in mining-affected river systems. Mineral. Mag. 2003, 67, 205–217. [Google Scholar] [CrossRef]
  49. Hudson-Edwards, K.A.; Macklin, M.G.; Curtis, C.D.; Vaughan, D.J. Chemical remobilization of contaminant metals within floodplain sediments in an incising river system: Implications for dating and chemostratigraphy. Earth Surf. Process. Landf. 1998, 23, 671–684. [Google Scholar] [CrossRef]
  50. Harvey, J.W.; Fuller, C.C. Effect of enhanced manganese oxidation in the hyporheic zone on basin-scale geochemical mass balance. Water Resour. Res. 1998, 34, 623–636. [Google Scholar] [CrossRef] [Green Version]
  51. Fuller, C.C.; Harvey, J.W. Reactive Uptake of Trace Metals in the Hyporheic Zone of a Mining-Contaminated Stream, Pinal Creek, Arizona. Environ. Sci. Technol. 2000, 34, 1150–1155. [Google Scholar] [CrossRef]
  52. Forray, F.L.; Smith, A.M.L.; Drouet, C.; Navrotsky, A.; Wright, K.; Hudson-Edwards, K.A.; Dubbin, W.E. Synthesis, characterization and thermochemistry of a Pb-jarosite. Geochim. Cosmochim. Acta 2010, 74, 215–224. [Google Scholar] [CrossRef] [Green Version]
  53. Chen, Y.; Liu, Y.; Liu, Y.; Lin, A.; Kong, X.; Liu, D.; Li, X.; Zhang, Y.; Gao, Y.; Wang, D. Mapping of Cu and Pb contaminations in soil using combined geochemistry, topography, and remote sensing: A case study in the Le’an River floodplain, China. Int. J. Environ. Res. Public Health 2012, 9, 1874–1886. [Google Scholar] [CrossRef]
  54. Wilkin, R.T. Contaminant Attenuation Processes at Mine Sites. Mine Water Environ. 2008, 27, 251–258. [Google Scholar] [CrossRef]
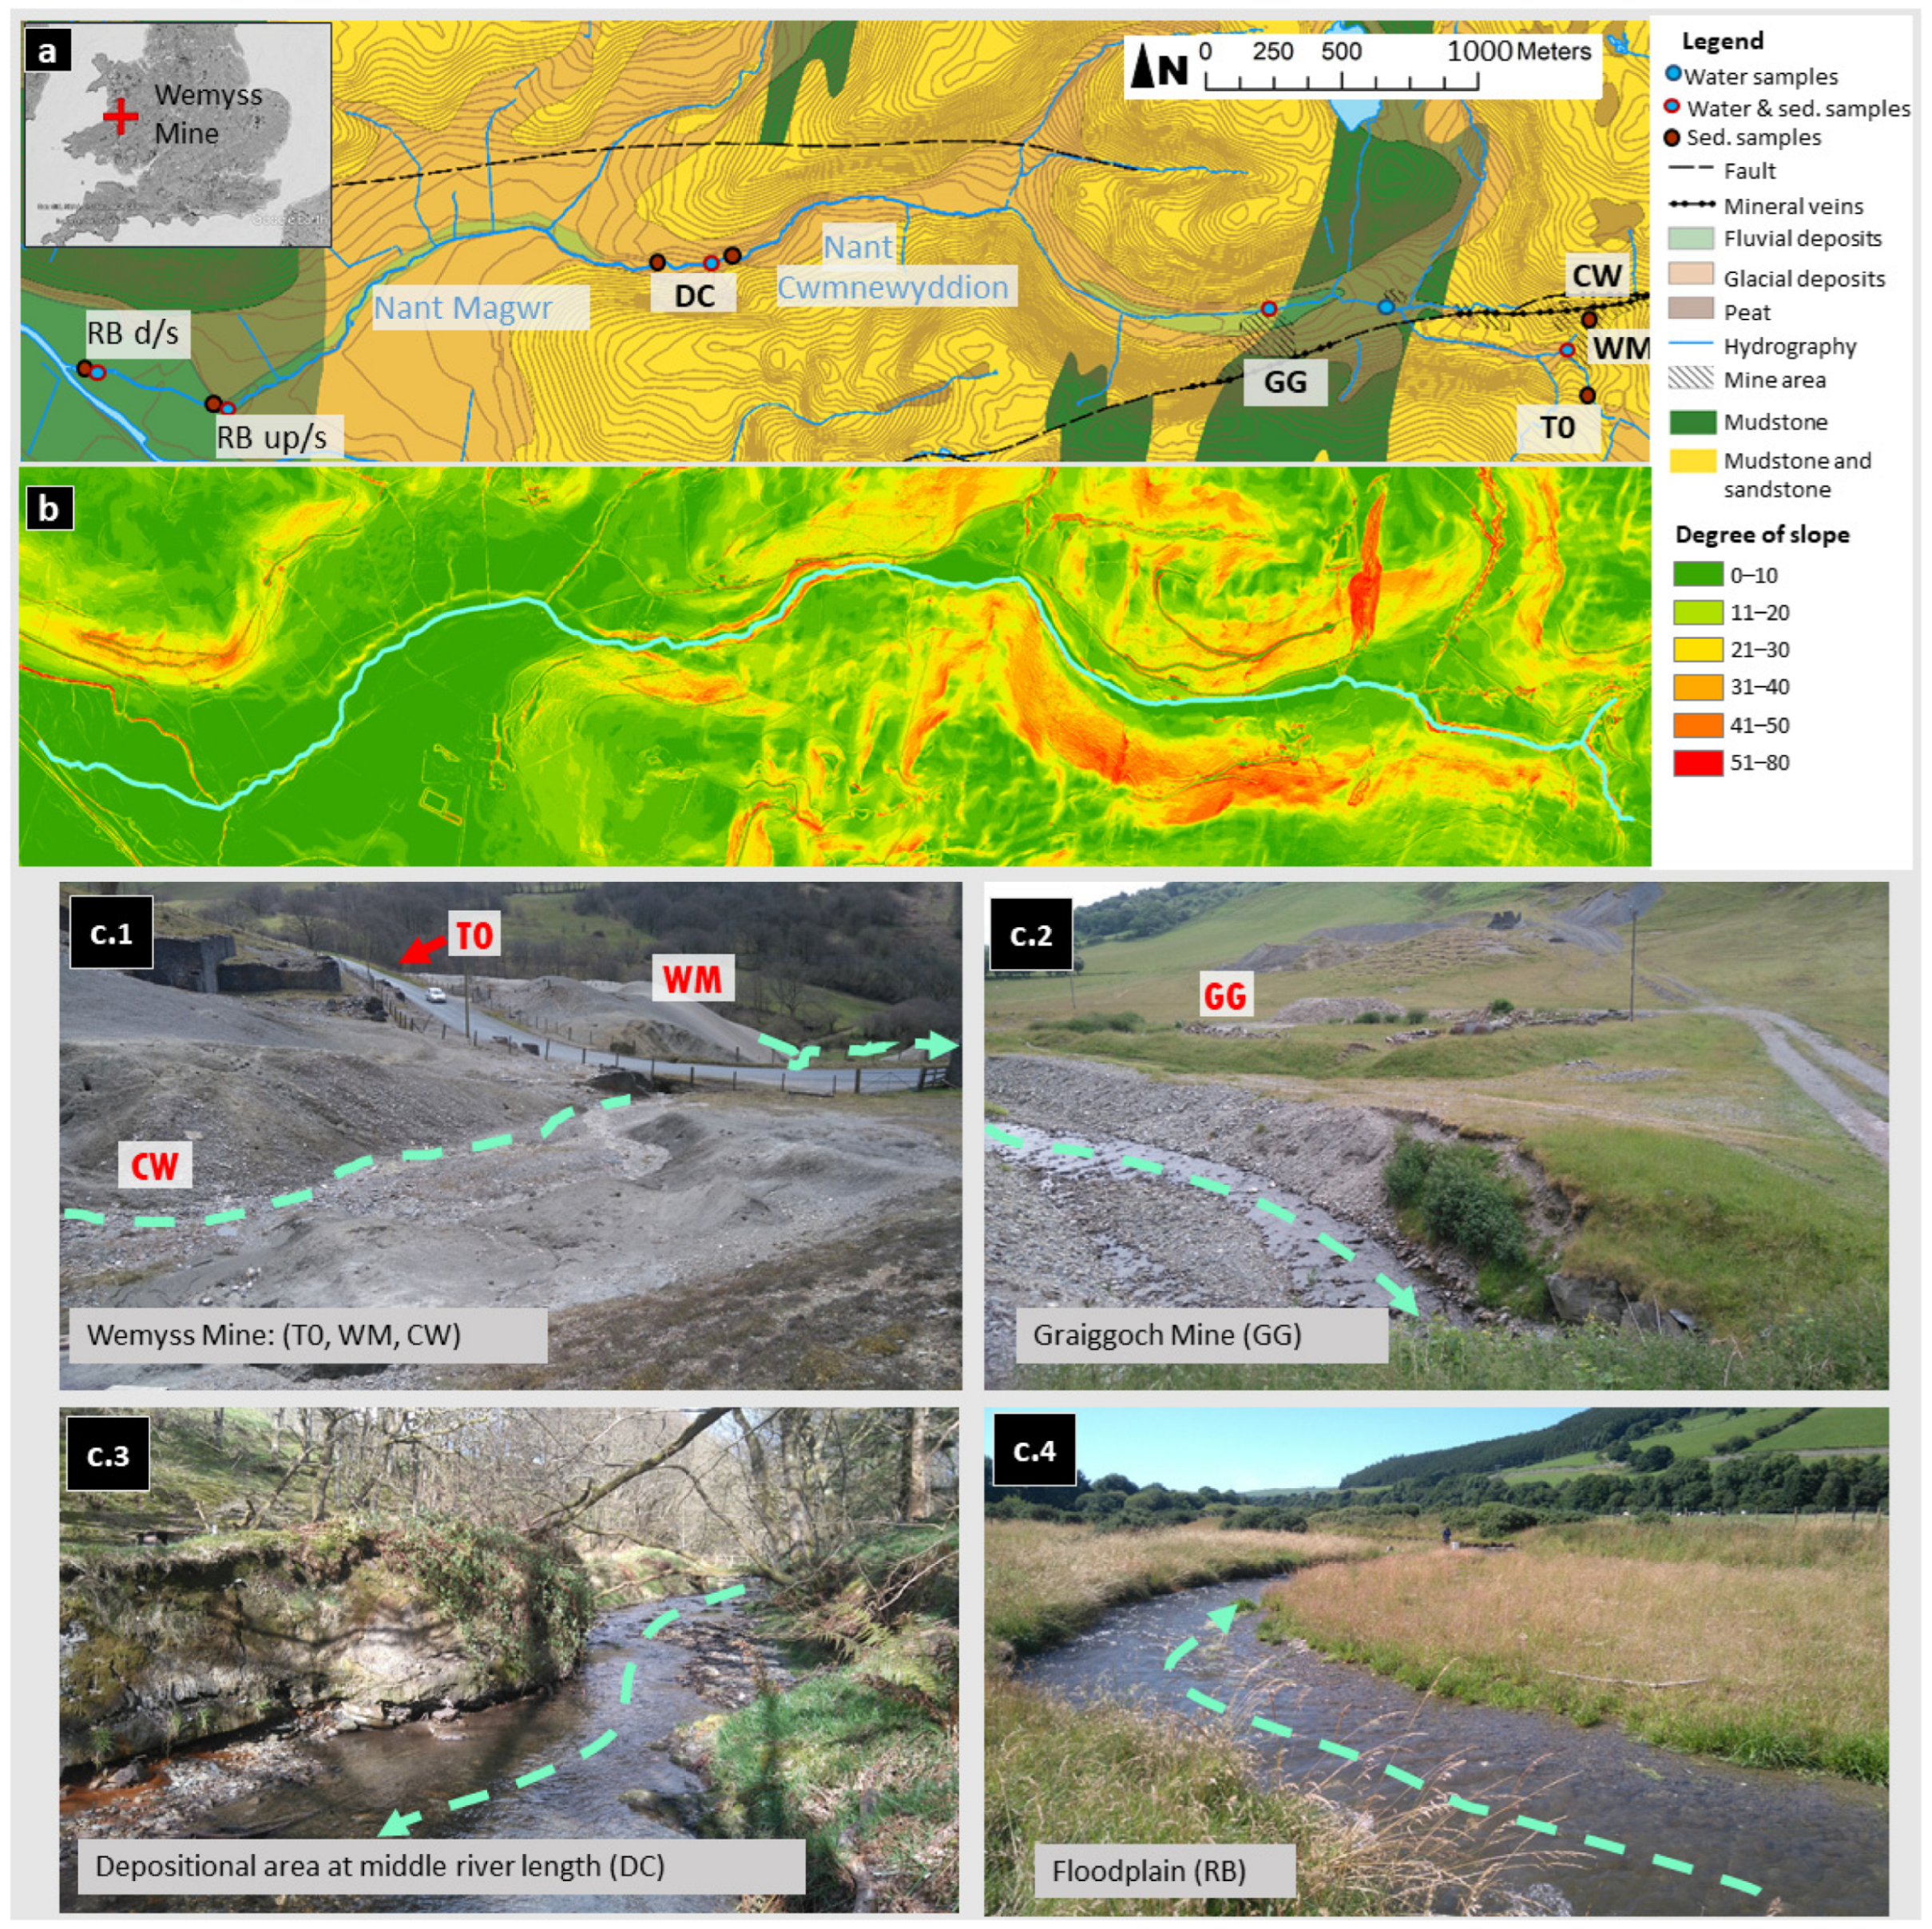
Figure 1. (a) Map of the water and sediment (sed.) sampling areas along the Nant Cwmnewyddion and the Nant Magwr. WM: Wemyss Mine; CW: tributary at Wemyss mine; T0: upstream mine areas; GG: Graig Goch Mine; DC: depositional area at middle river length; RB: floodplain upstream (up/s) and downstream (d/s) area. (b) Topography and slope map of the research site elaborated with ArcGIS from 1 m resolution LIDAR images (Natural Resources Wales information ©). (c) Sampling area views and river paths indicated with the blue dashed line. (c.1) Wemyss Mine area and waste heaps with tributary (dashed lines) and sampling areas (T0, WM, and CW). (c.2) Graig Goch Mine with GG-labelled samples. (c.3) Depositional area at middle river length (DC) with 1 to 2 m riverbank and percolating red water visible on the bottom left. (c.4) Floodplain (RB) view of a meander corner.
Minerals 13 00790 g001
Figure 2. Summary of sediment geochemical and fluvial morphological parameters that are related to Pb and Zn dispersion. The river sessions are an interpretation of the undergoing processes and scale of sediments and basement are approximate. In solid brown is reported the mudstone geological basement. (a) Wemyss Mine (WM, CW); (b) Graig Goch Mine; (c) Middle river length (DC); (d) floodplain (RB).
Minerals 13 00790 g002aMinerals 13 00790 g002b
Figure 3. Electronic microprobe images, chemical maps of selected Pb- and Zn-bearing minerals, chemical spectra (position indicated by the asterisk), and backscattered electron images (CP): (a) Sample from the headwater mine heaps (WM) showing a galena grain with cubical fractures and weathered edges coated with Fe-oxide. (b) Sample from Graig Goch mine area (GG) showing a Fe-hydroxide (spectra 1 and 2) and bearing Pb and Zn illite or muscovite (spectra 3). (c) Sample from the middle river length (DC) showing Pb-, Zn-, and S-bearing grains, Pb-bearing Fe-hydroxide, and silicate minerals (likely quartz and illite-like minerals). (d) Sample from the upper part of the floodplain (RB), a Pb-bearing Fe-hydroxide.
Minerals 13 00790 g003
Figure 4. Lead and Zn loads (mg/s) along the stream, with distance (m) from upstream of the mining areas. Loads are reported under high- (green) and low- (blue) streamflow conditions. WM: Wemyss Mine; FA: Frongoch Adit; GG: Graig Goch Mine; DC: depositional area at middle river length; RB: floodplain upstream (up/s) and downstream (d/s) areas.
Minerals 13 00790 g004
Table 1. Sediment geochemistry results presented for each sampled transect. Lead and Zn concentrations (g/kg) were measured with pXRF. The distances are reported in meters from the first sample upstream of the mining area. The potential mineral suite and trace metal associations are presented as a sum of the XRD, SEM, and Jeol8100 Superprobe (WDS) results. Finally, minimums (min), maximums (max), and the averages for the whole area and suggested metal concentration limits are reported as TEL (threshold effect level) and PEL (predicted effect level) derived from the Environment Agency [45]. WM: Wemyss Mine; CW: tributary at Wemyss Mine; T0: upstream of the mine areas; GG: Graig Goch Mine; DC: depositional area at middle river length; RB: floodplain upstream (up/s) and downstream (d/s) areas.
River AreaTransect DistanceTransectPbZnpHMetal-Bearing Mineral Suite
m g/kgg/kg
Up/s Mines
T00T0 M7.41.34.7Fe-hydroxide; pyromorphite; anglesite; rutile
Mining Areas
CW160CW J24.71.54.4Monazite; galena; Fe-oxide
WM171WM K23.84.64.6Anglesite; galena; Fe-oxide; pyromorphite
GG1650GG L4.51.04.7Pb, Mn-oxide; Fe, Mn-oxide; pyromorphite; anglesite
Middle length
DC3000DC D5.30.94.8Anglesite; sphalerite; galena; Pb- and Zn-Fe-oxide; plumbojarosite; pyromorphite; Pb, Mn-oxide
3400DC E3.80.84.7
3600DC F20.31.54.5
3800DC G11.31.14.6
4070DC H11.10.94.8
Floodplain
RB up/s5800RB B2.61.35Pb- and Zn-bearing phyllosilicate (illite and chlorite); Pb-Fe oxide
5900RB C11.02.75
RB DEP C2.22.05
6000RB D7.41.45
RB d/s6600RB I8.31.54.7
RB DEP B1.71.65
6700RB DEP A2.21.65
RB A00.34.9
Tot. min. 00.34.4
Tot. max. 24.74.65.0
Tot. average 8.71.54.8
TEL 0.0350.123
PEL 0.0910.315
Table 2. River water concentrations and sediment loads for Zn and Pb (F, filtered; UF, unfiltered samples) and streamflows (Q) at sampling sites. WM: Wemyss Mine; CW: tributary at Wemyss Mine; T0: upstream of the mine areas; d/s FA: downstream Frongoch Adit; GG: Graig Goch Mine; DC: depositional area at middle river length; RB: floodplain upstream (up/s) and downstream (d/s) areas.
SampleDateDistanceQZnZnPbPbZnPb
Area mL/smg/Lmg/Lμg/Lμg/Lmg/smg/s
FUFFUFSuspended Sediment
High streamflow
WM15 June 20161712101.41.439043008
d/s FA16 June 20168804303.03.01201602019
GG16 June 201616456002.32.35090027
DC17 June 201632109501.41.42030393
RB up/s17 June 2016593015001.01.010303621
RB d/s15 June 201667808800.90.910505036
Low streamflow
WM29 July 2017171401.11.313018072
d/s FA29 July 20178801301.82.080140268
GG28 July 201716451600.91.3502505232
DC28 July 201732101301.31.63070365
RB up/s30 July 201759303200.80.92030362
RB d/s30 July 201767803100.81.02030508
Disclaimer/Publisher’s Note: The statements, opinions and data contained in all publications are solely those of the individual author(s) and contributor(s) and not of MDPI and/or the editor(s). MDPI and/or the editor(s) disclaim responsibility for any injury to people or property resulting from any ideas, methods, instructions or products referred to in the content.