
Deciphering the Color Origin of Pink Conch Pearl Using Nondestructive Spectroscopies and DFT Calculations


Abstract
:1. Introduction
2. Materials and Methods
2.1. Materials
2.2. Methods
3. Results and Discussion
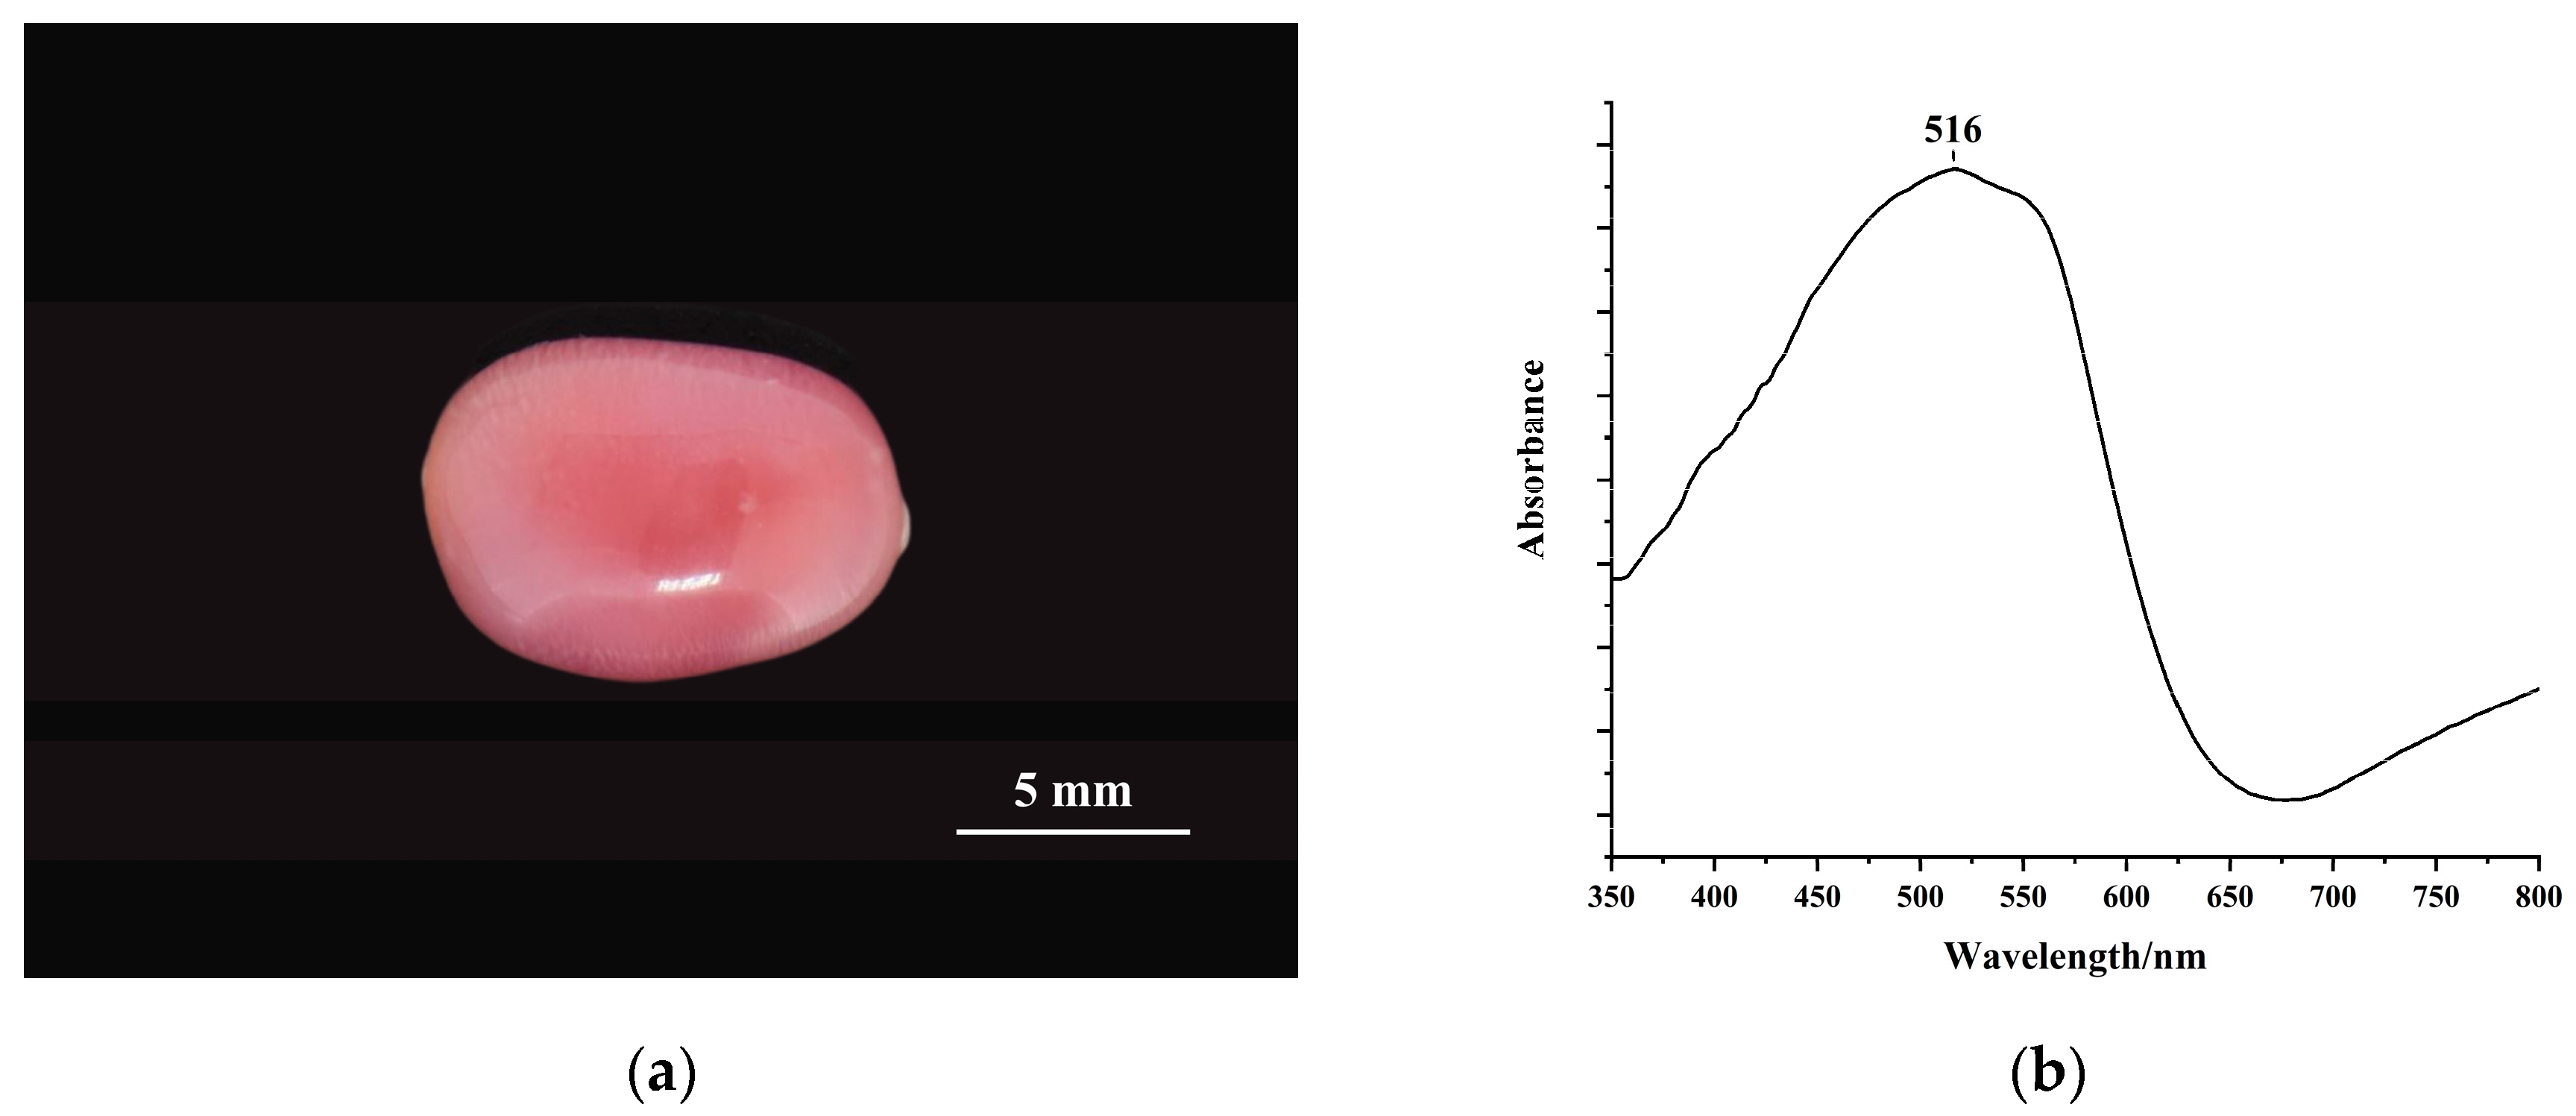
3.1. Color Characterization of Conch Pearl
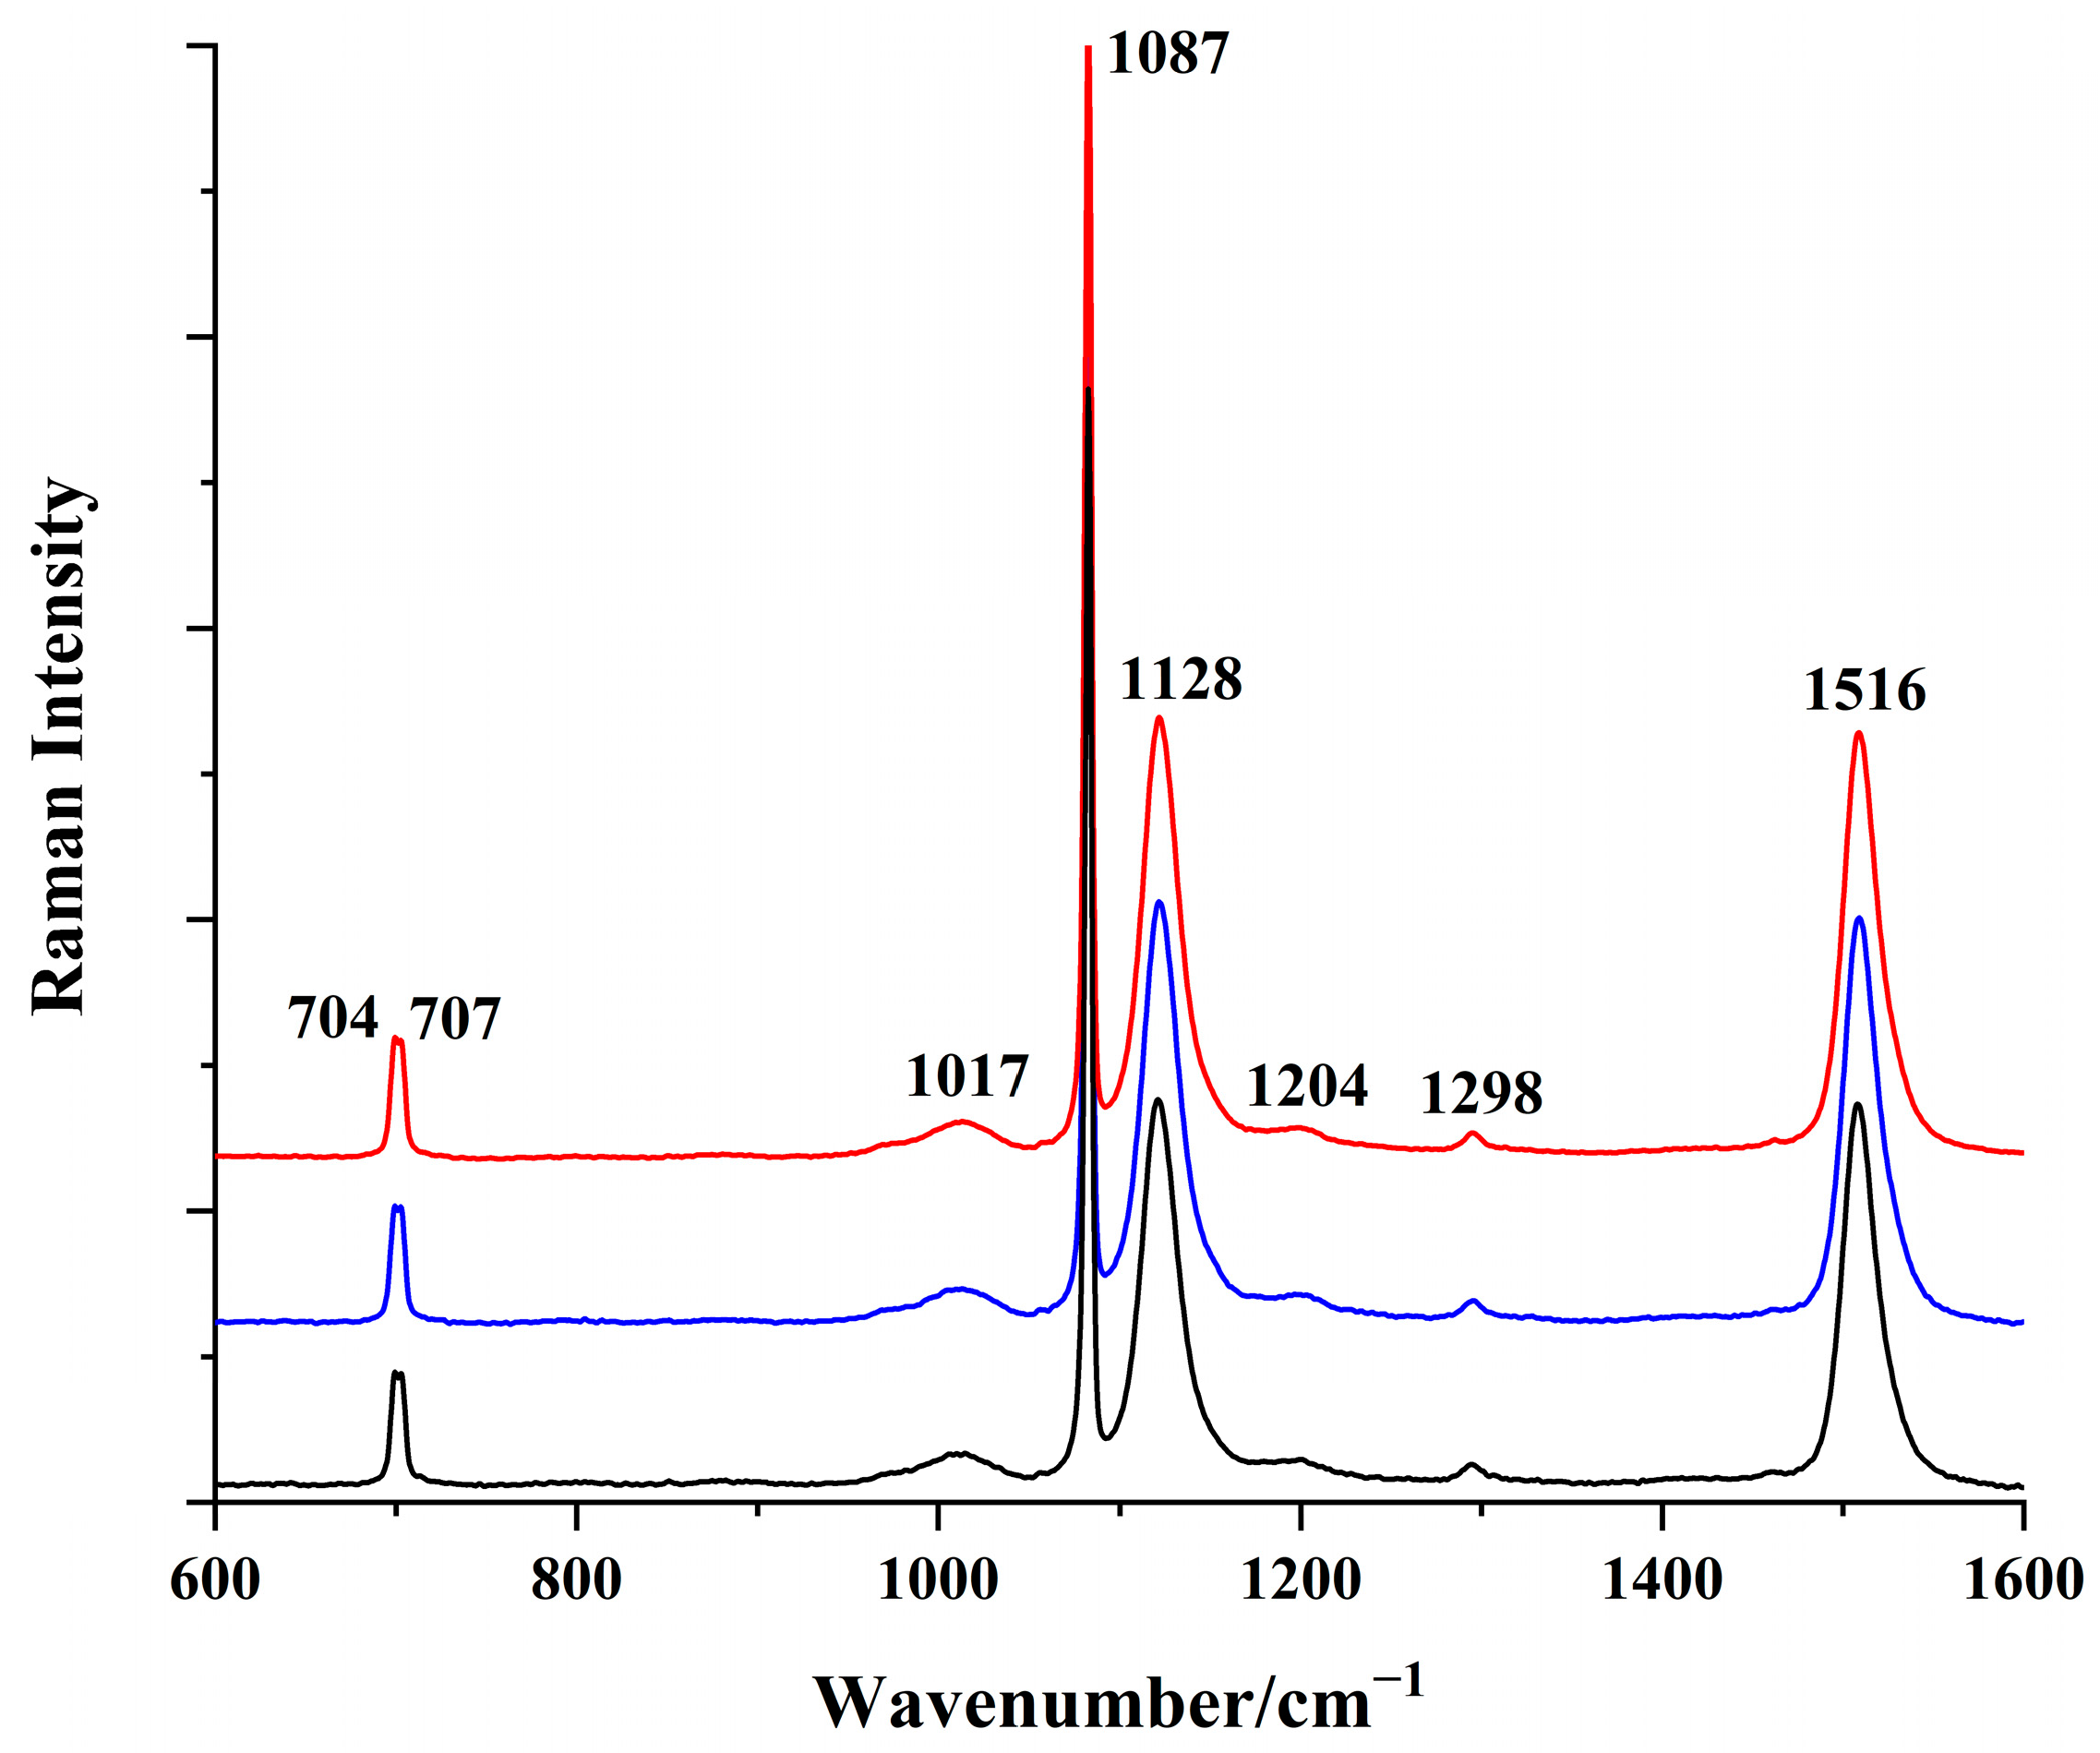
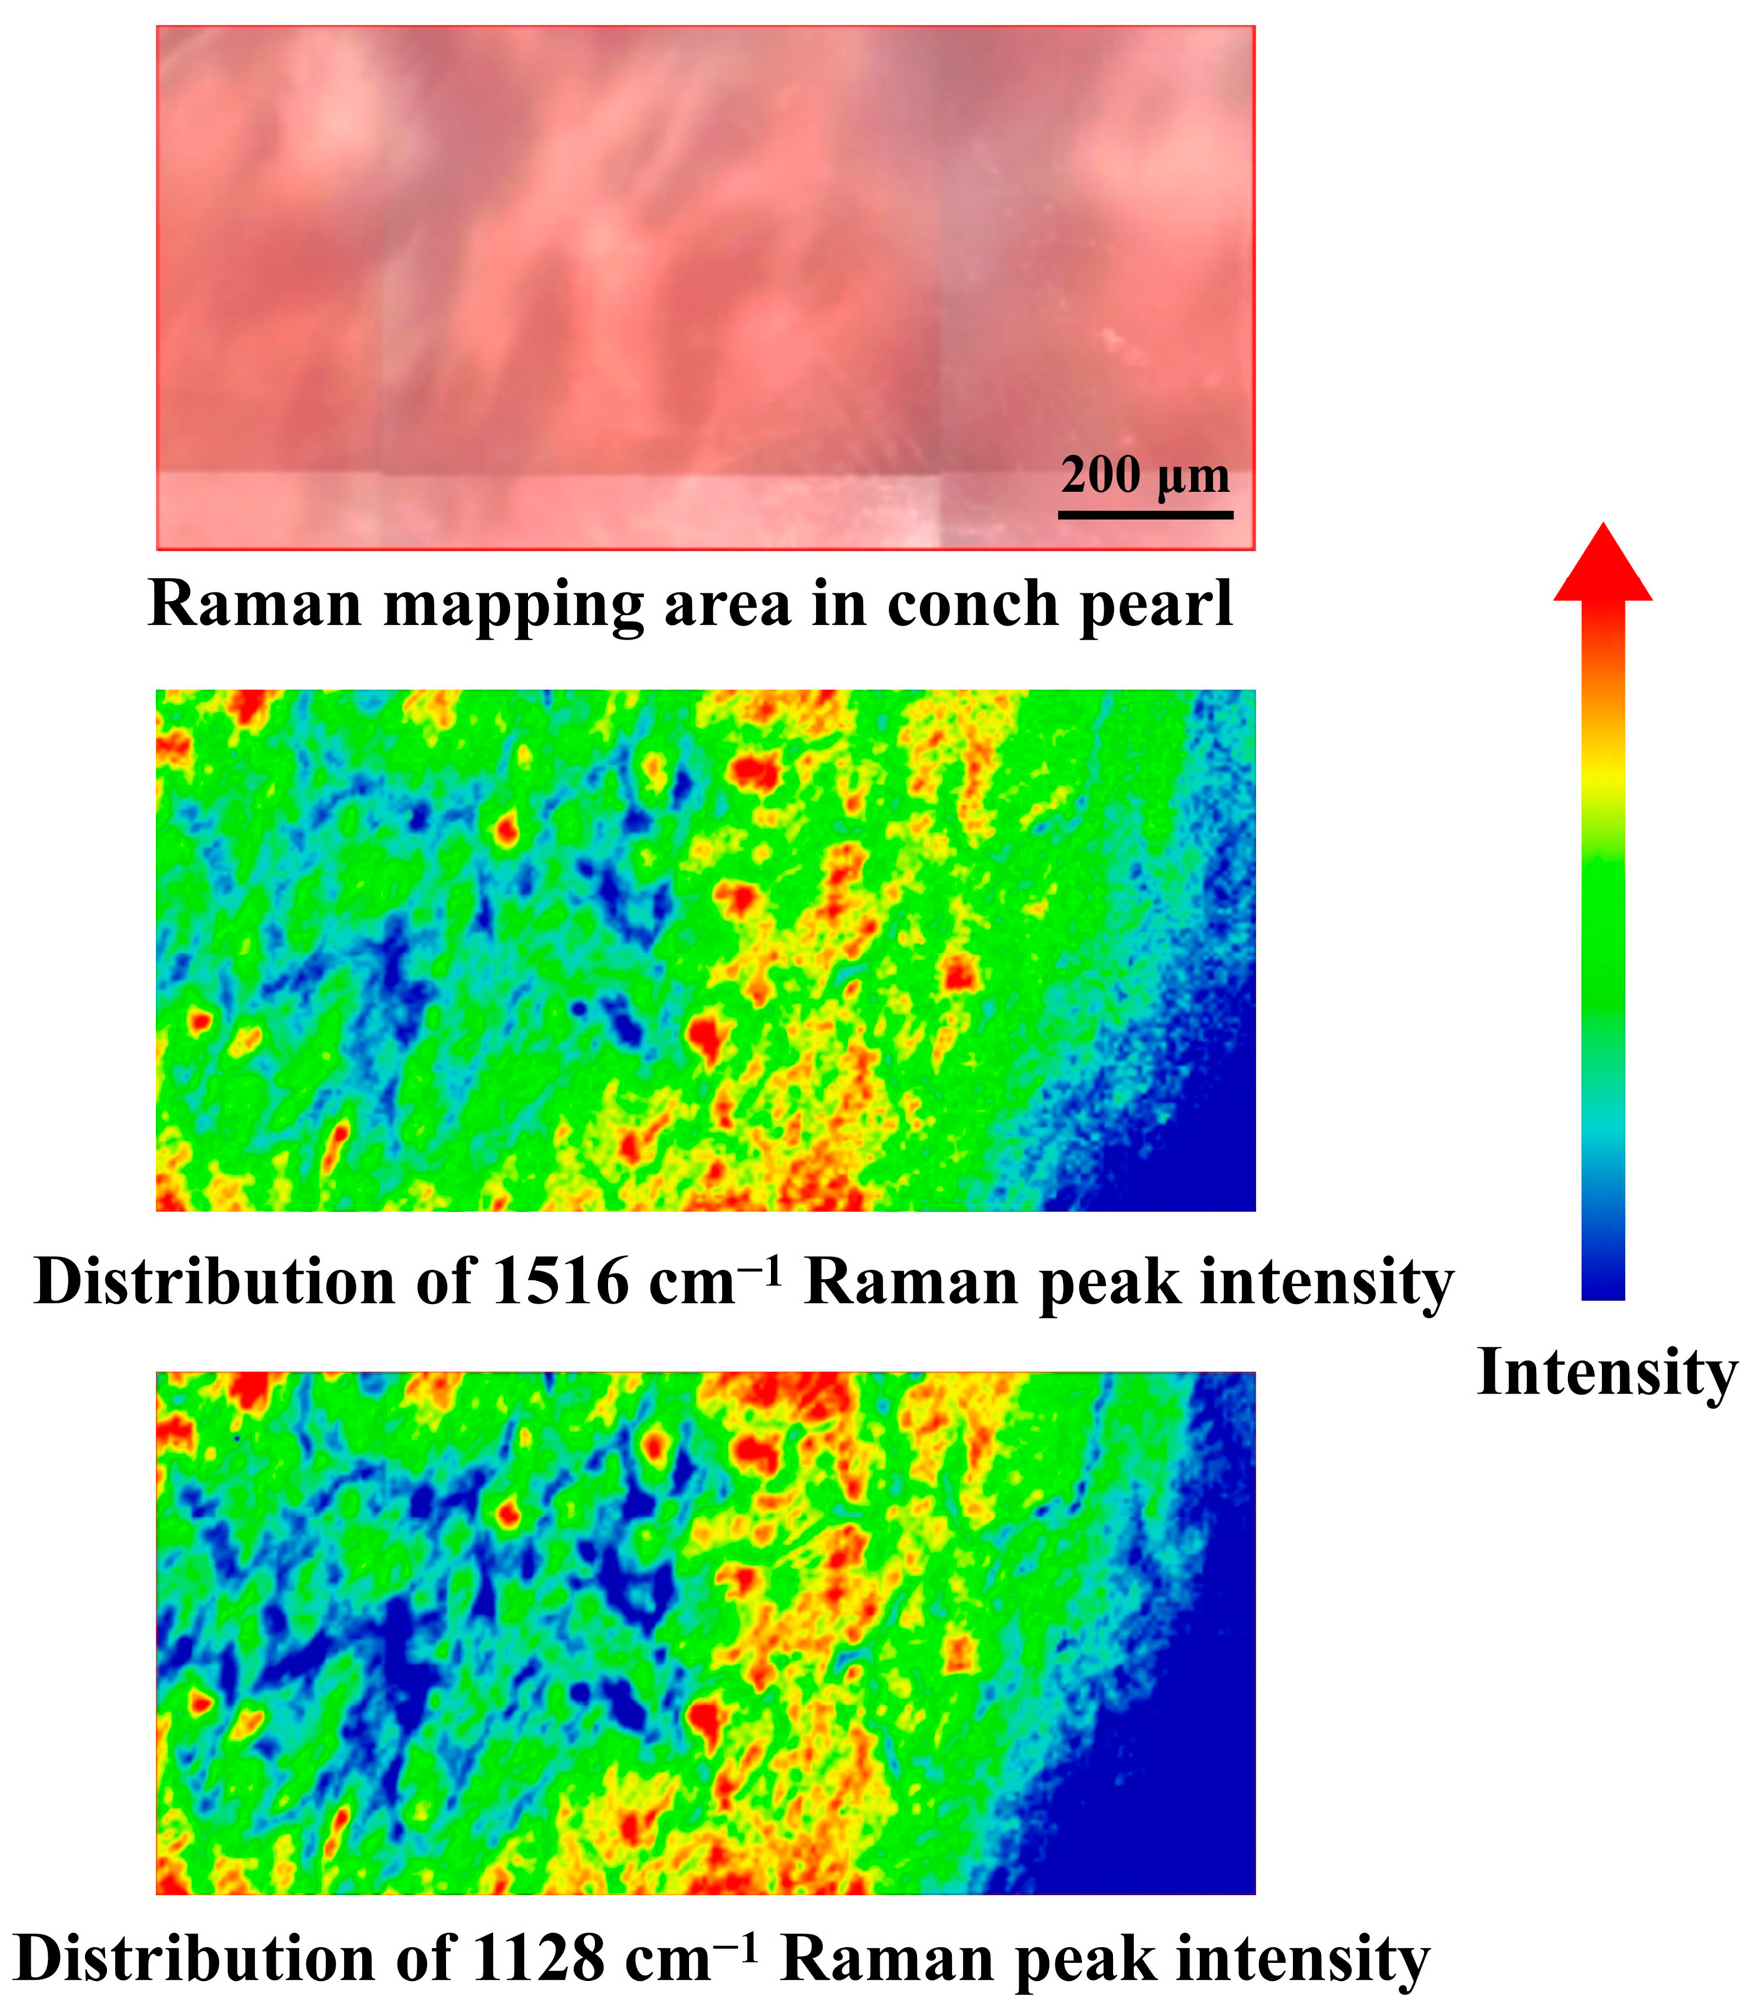
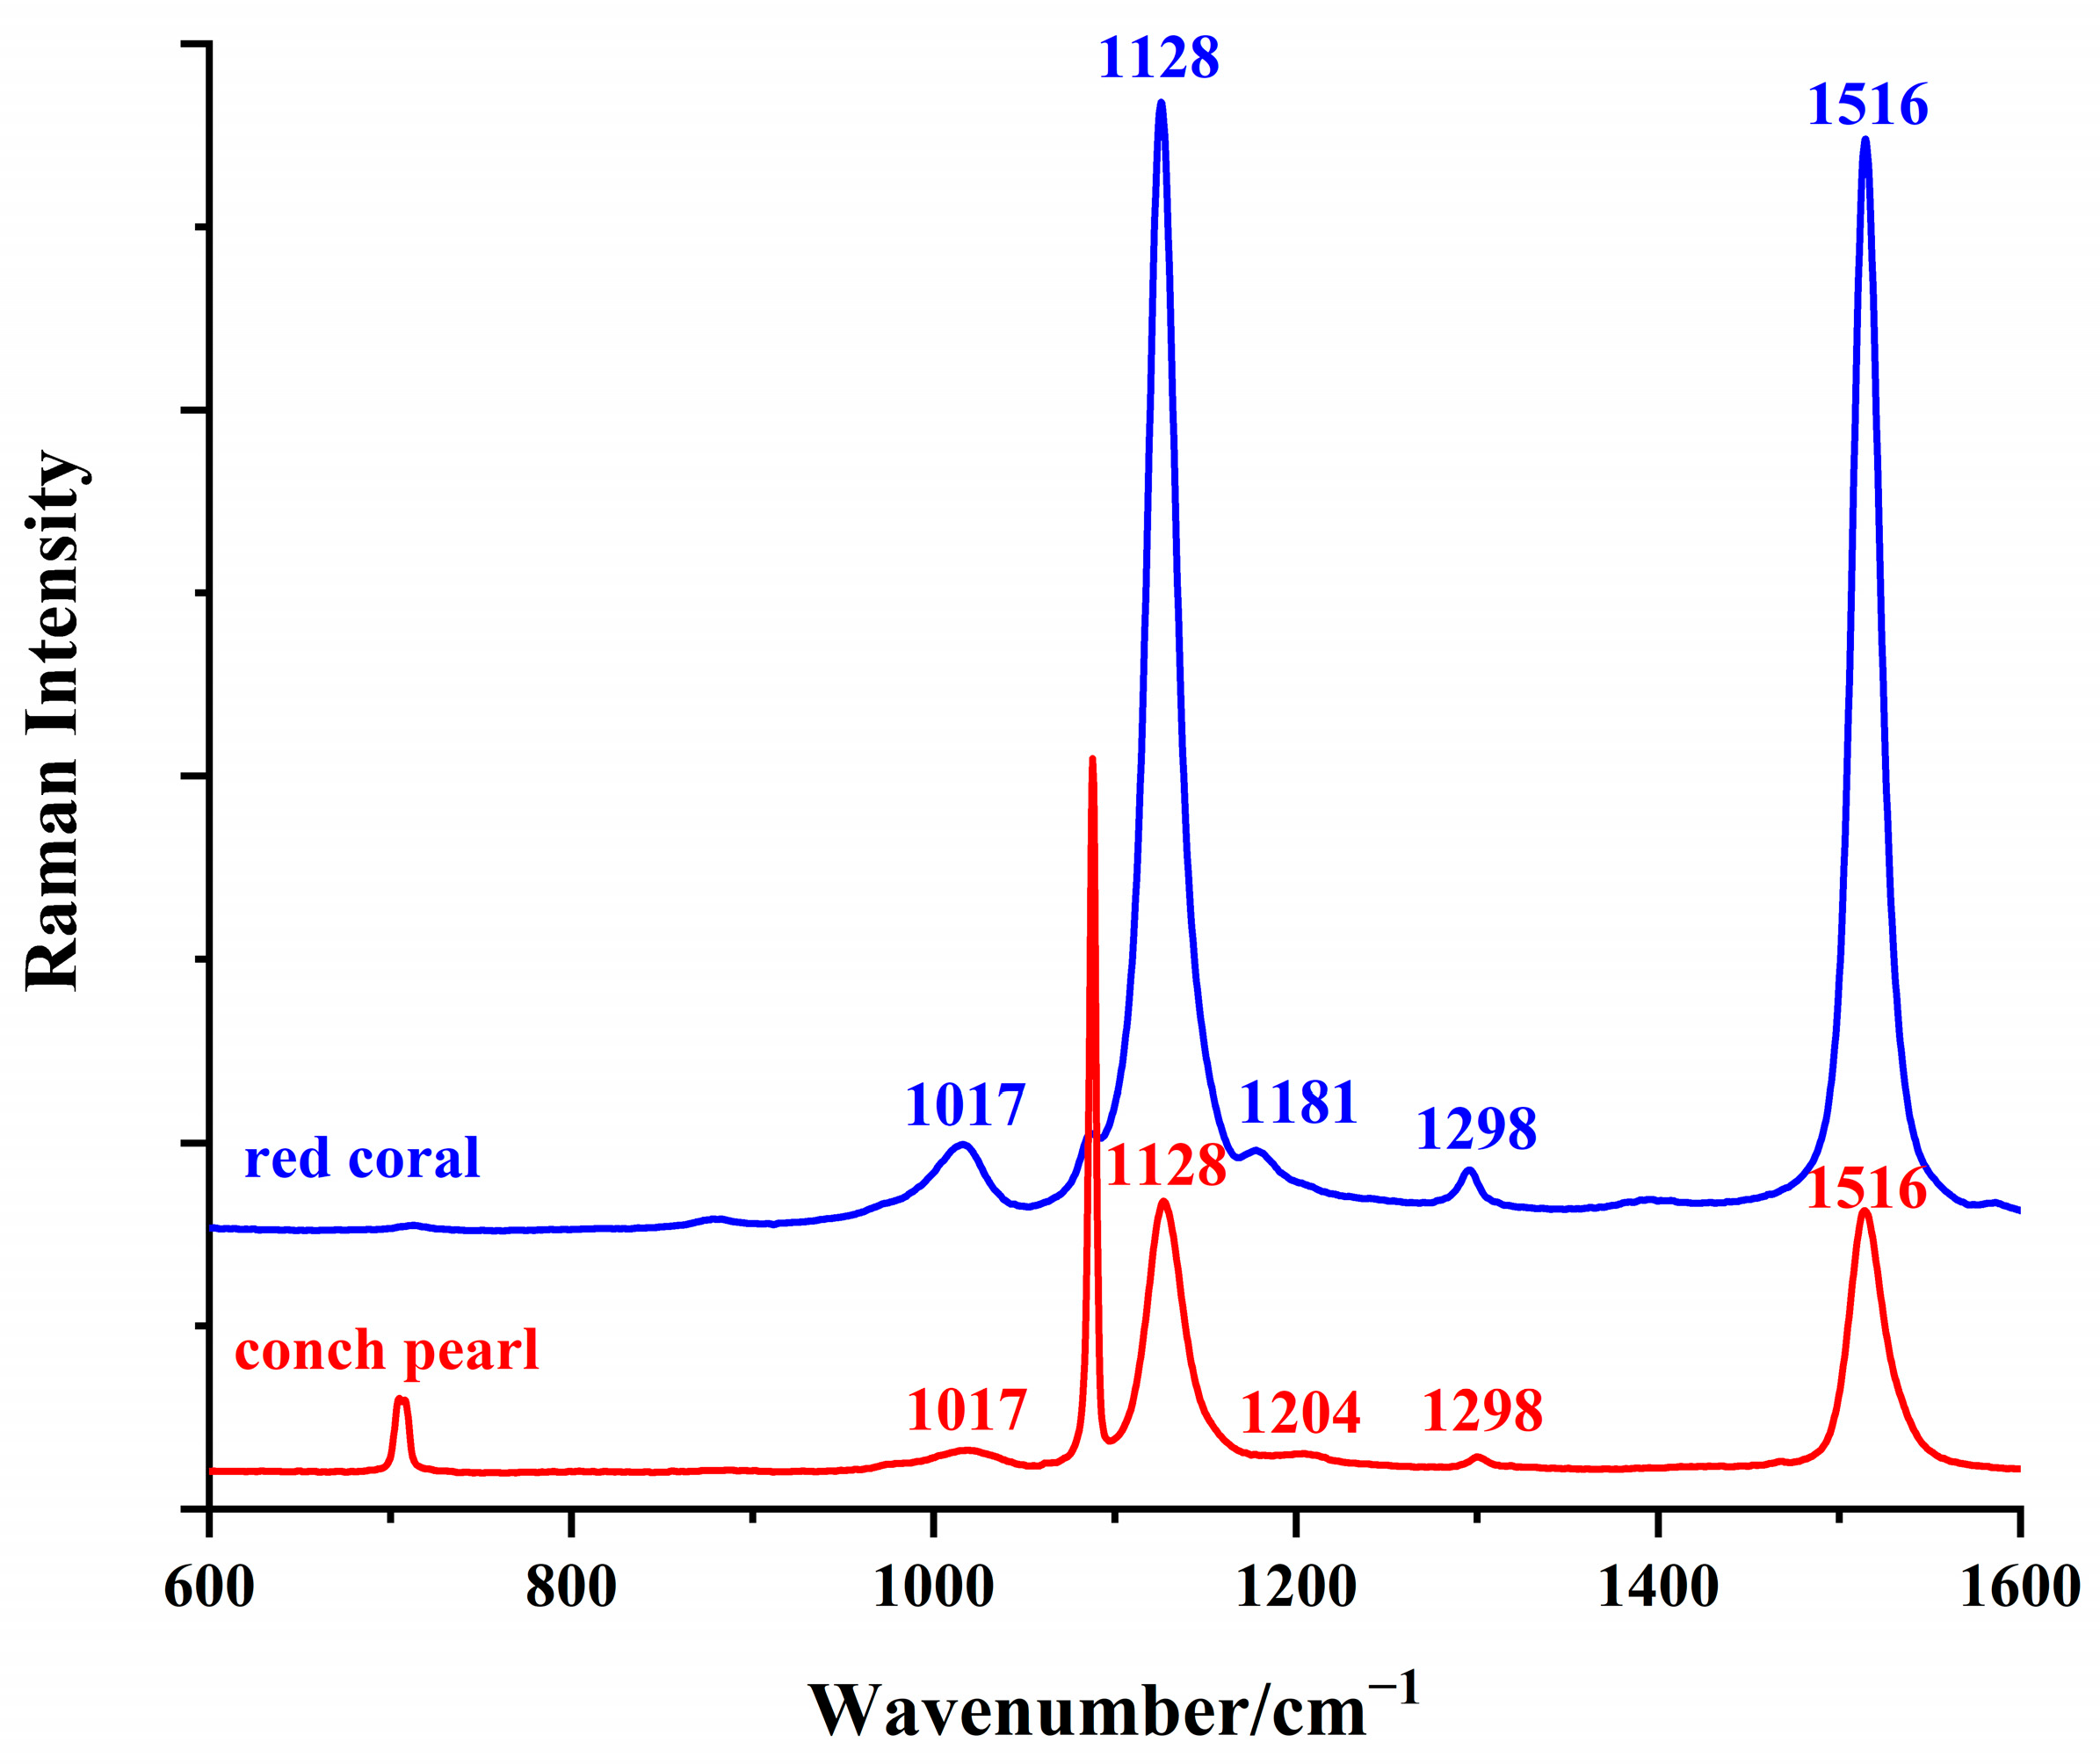
3.2. Raman Spectroscopic Characterization of Conch Pearl
3.3. Pigments in Conch Pearl: Comparative Analysis with Red Coral
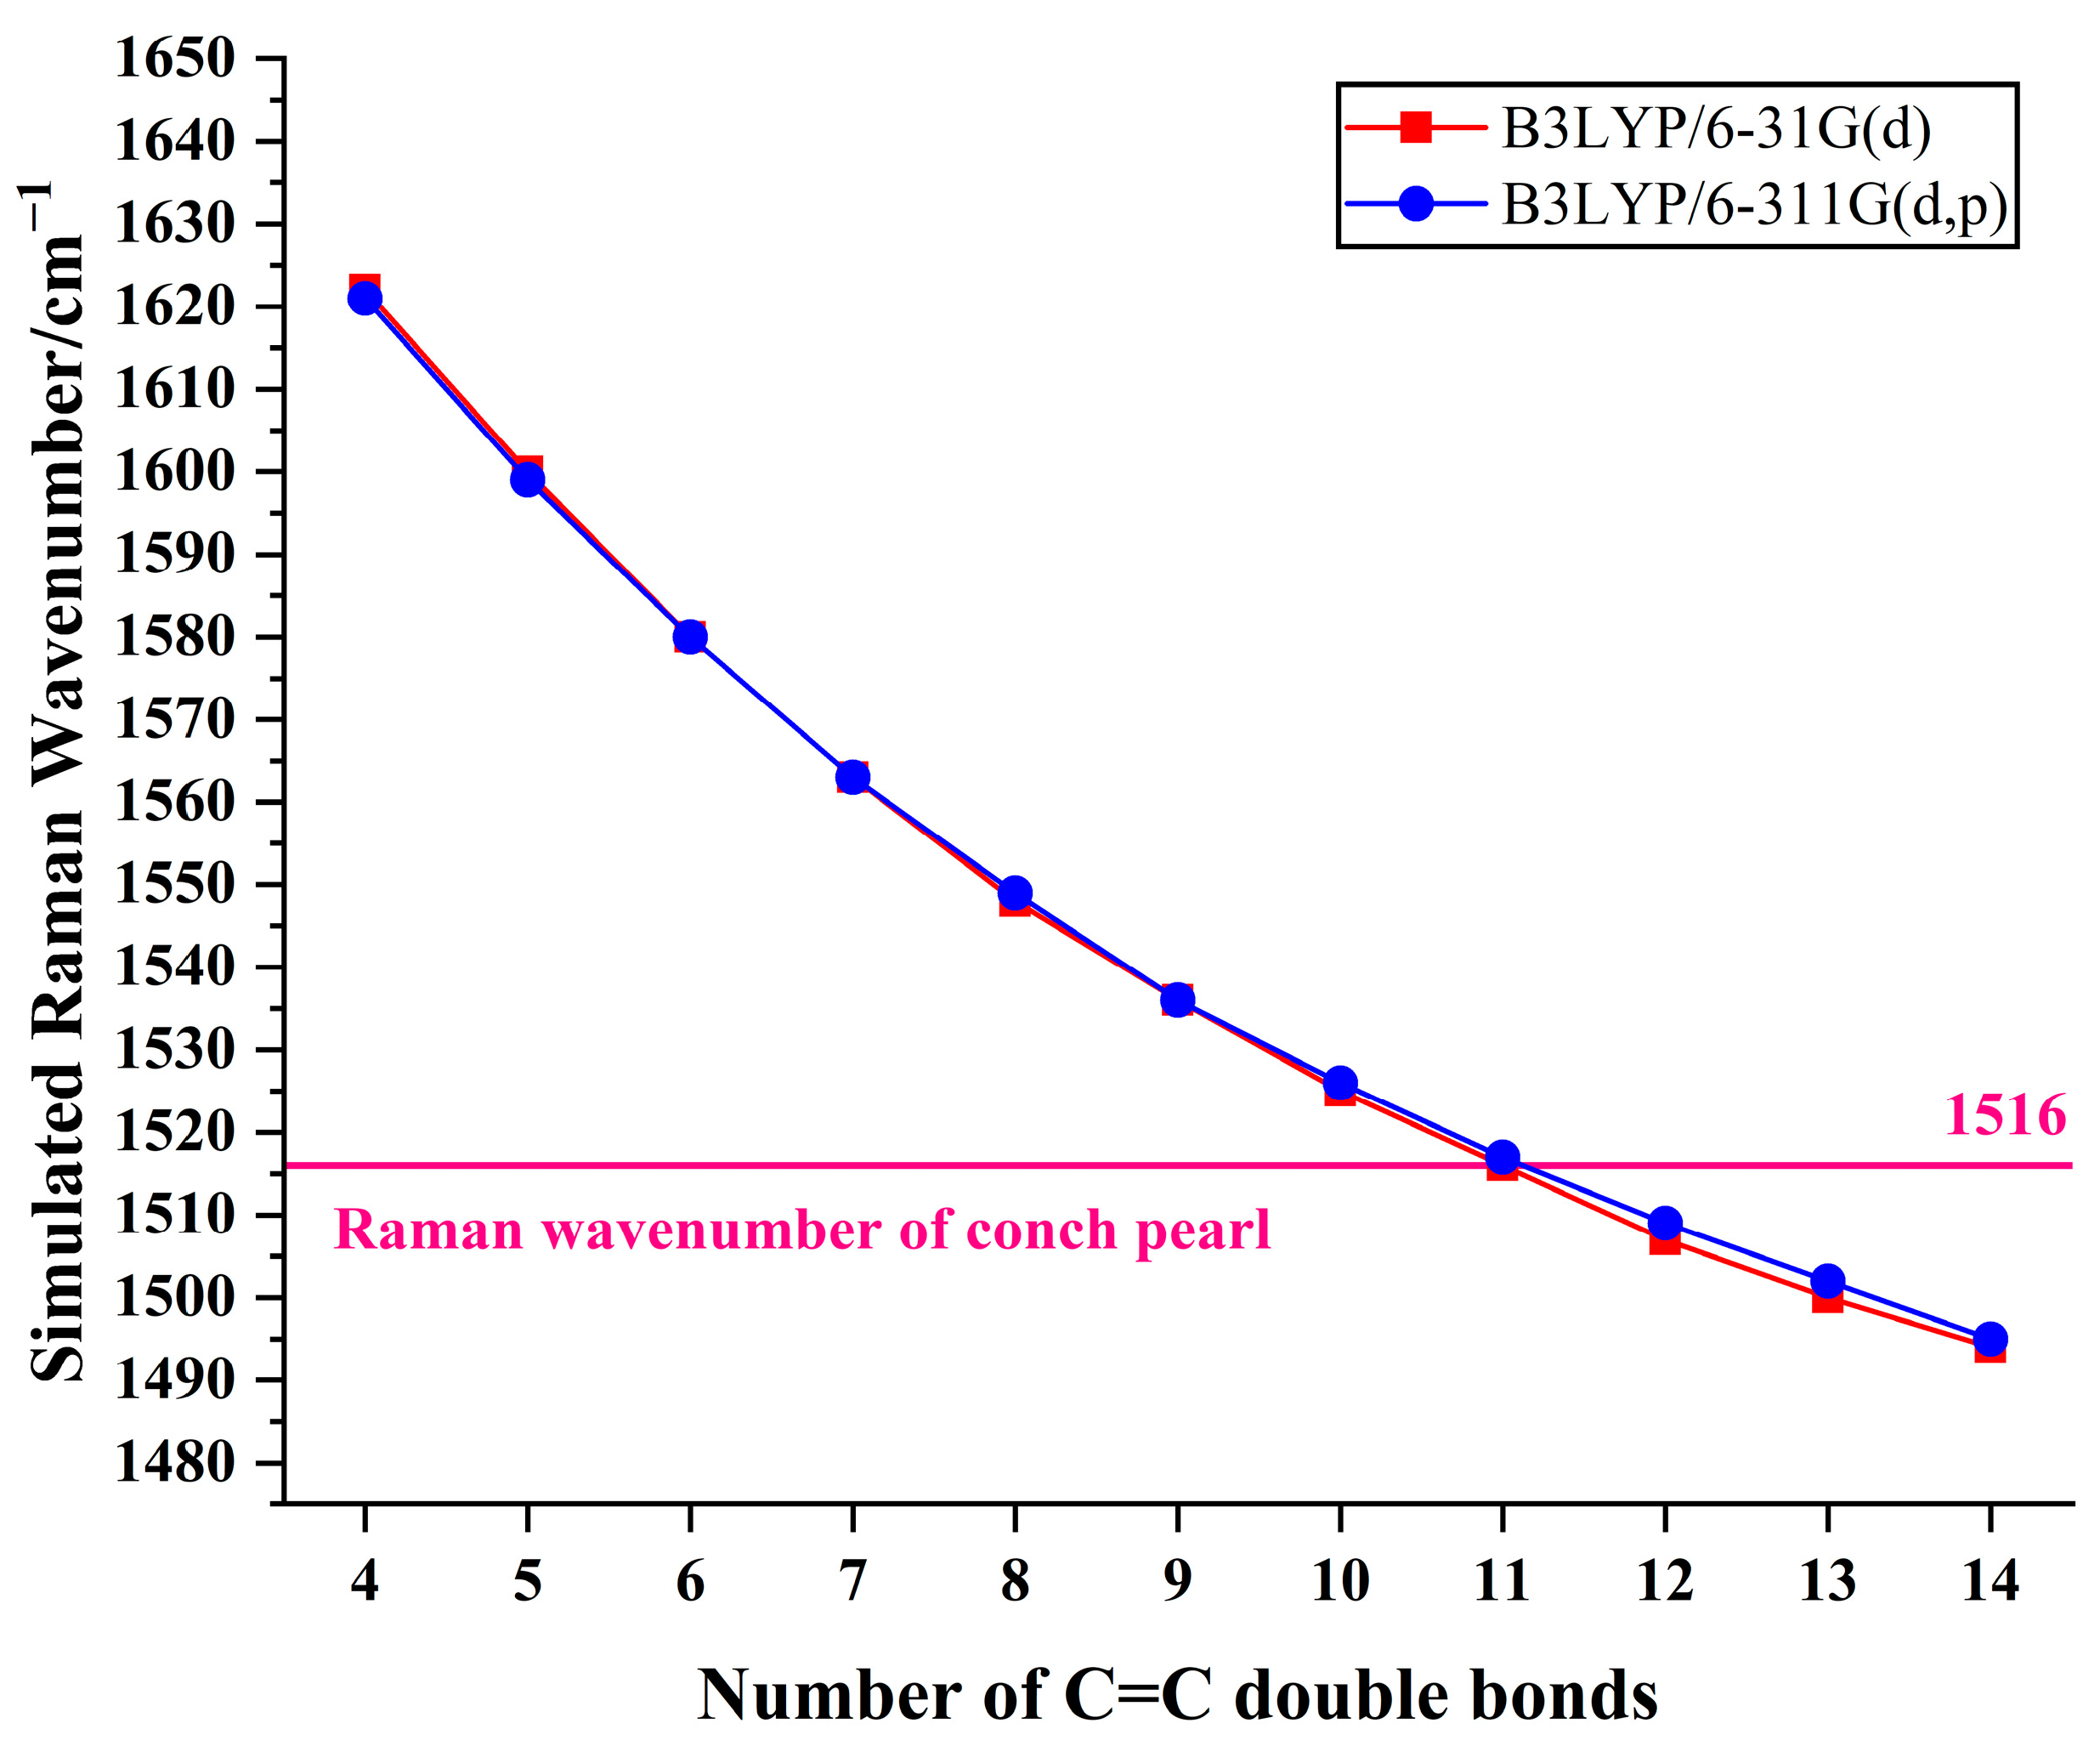
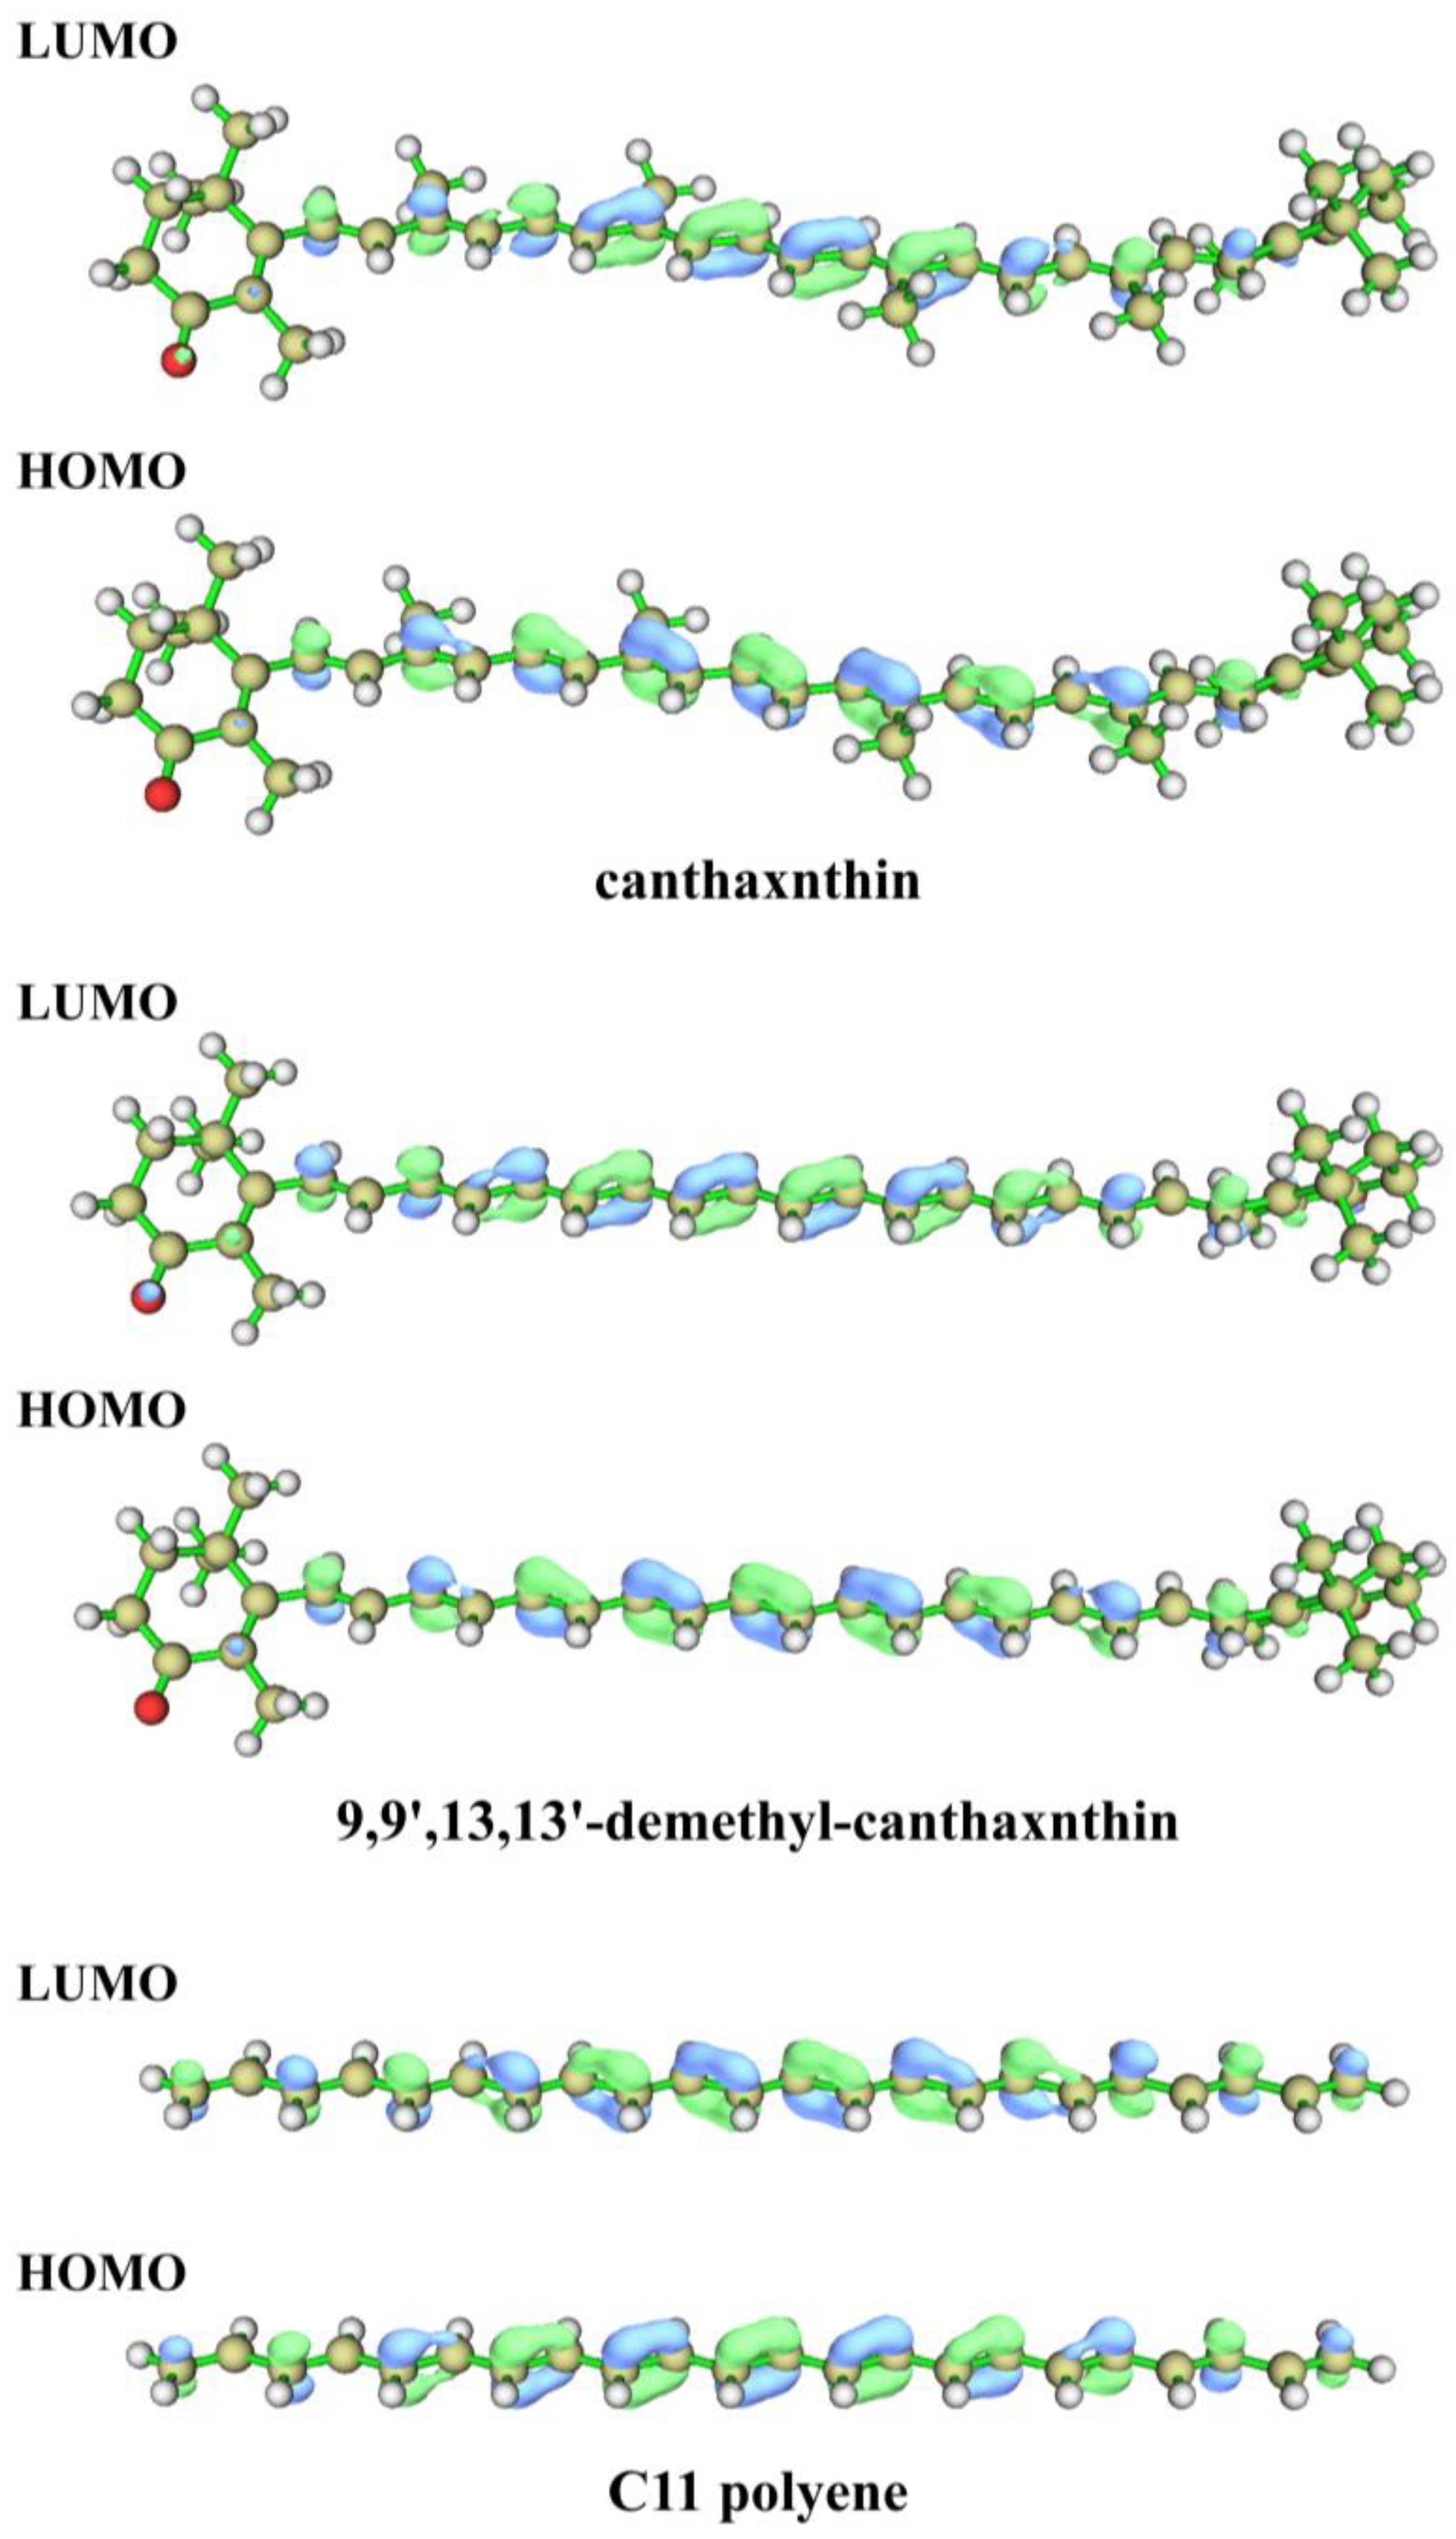
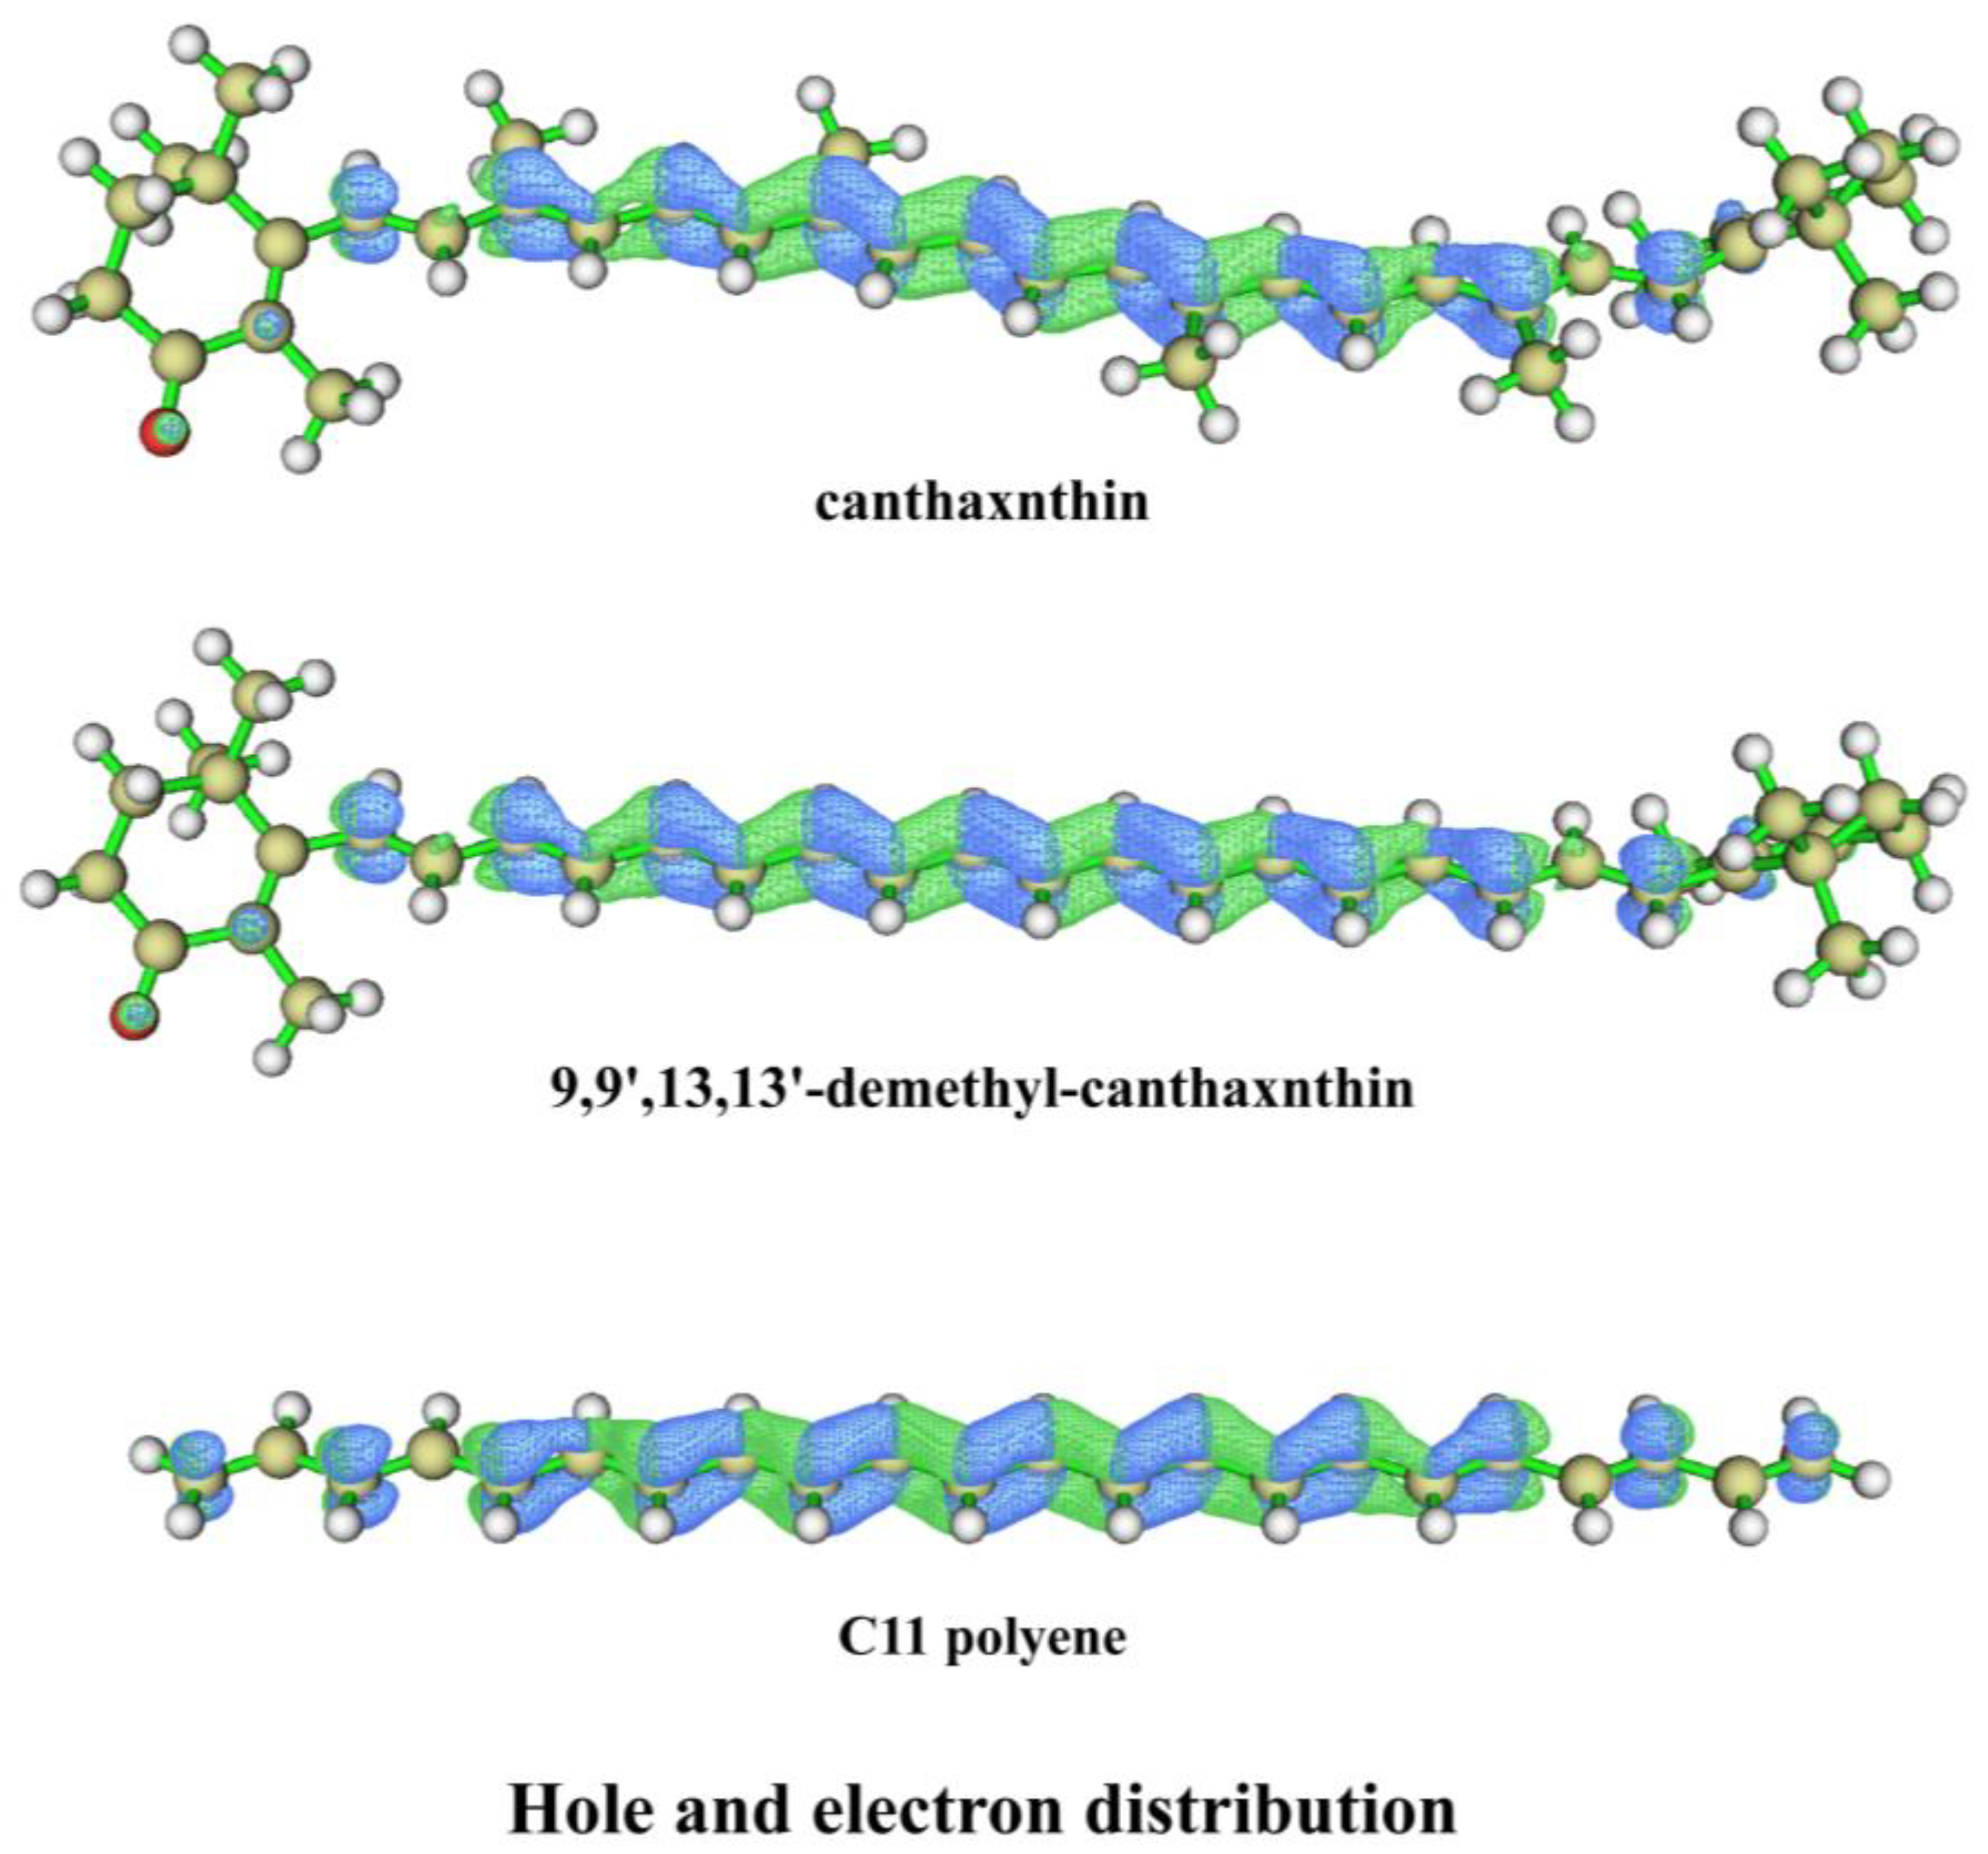
3.4. Color Origin of Conch Pearl
4. Conclusions
Author Contributions
Funding
Data Availability Statement
Acknowledgments
Conflicts of Interest
References
- Fritsch, E.; Misiorowski, E.B. The History and Gemology of Queen Conch “Pearls”. Gems Gemol. 1987, 23, 208–221. [Google Scholar] [CrossRef] [Green Version]
- Polívka, T.; Sundström, V. Dark Excited States of Carotenoids: Consensus and Controversy. Chem. Phys. Lett. 2009, 477, 1–11. [Google Scholar] [CrossRef]
- Rimai, L.; Heyde, M.E.; Gill, D. Vibrational Spectra of Some Carotenoids and Related Linear Polyenes. A Raman Spectroscopic Study. J. Am. Chem. Soc. 1973, 95, 4493–4501. [Google Scholar] [CrossRef] [PubMed]
- Goedheer, J.C. Energy Transfer from Carotenoids to Chlorophyll in Blue-Green, Red and Green Algae and Greening Bean Leaves. Biochim. Et Biophys. Acta (BBA)-Bioenerg. 1969, 172, 252–265. [Google Scholar] [CrossRef] [Green Version]
- Rodríguez-Bernaldo de Quirós, A.; Costa, H.S. Analysis of Carotenoids in Vegetable and Plasma Samples: A Review. J. Food Compos. Anal. 2006, 19, 97–111. [Google Scholar] [CrossRef]
- Matsuno, T.; Katagiri, K.; Maoka, T.; Komori, T. Novel Reductive Metabolic Pathways of 4-Oxo-β-End Group in Carotenoids of the Spindle Shell Fusinus Perplexus. Comp. Biochem. Physiol.-Part B Biochem. 1985, 81, 905–908. [Google Scholar] [CrossRef]
- Karampelas, S.; Fritsch, E.; Makhlooq, F.; Mohamed, F.; Al-Alawi, A. Raman Spectroscopy of Natural and Cultured Pearls and Pearl Producing Mollusc Shells. J. Raman Spectrosc. 2020, 51, 1813–1821. [Google Scholar] [CrossRef]
- Cvejic, J.; Tambutté, S.; Lotto, S.; Mikov, M.; Slacanin, I.; Allemand, D. Determination of Canthaxanthin in the Red Coral (Corallium Rubrum) from Marseille by HPLC Combined with UV and MS Detection. Mar. Biol. 2007, 152, 855–862. [Google Scholar] [CrossRef]
- Merlin, J.C. Resonance Raman Spectroscopy of Carotenoids and Carotenoid-Containing Systems. Pure Appl. Chem. 1985, 57, 785–792. [Google Scholar] [CrossRef]
- Maiani, G.; Castón, M.J.P.; Catasta, G.; Toti, E.; Cambrodón, I.G.; Bysted, A.; Granado-Lorencio, F.; Olmedilla-Alonso, B.; Knuthsen, P.; Valoti, M.; et al. Carotenoids: Actual Knowledge on Food Sources, Intakes, Stability and Bioavailability and Their Protective Role in Humans. Mol. Nutr. Food Res. 2009, 53, 194–218. [Google Scholar] [CrossRef]
- Merlin, J.C.; Delé-Dubois, M.L. Resonance Raman Characterization of Polyacetylenic Pigments in the Calcareous Skeleton. Comp. Biochem. Physiol.-Part B Biochem. 1986, 84, 97–103. [Google Scholar] [CrossRef]
- Kupka, T.; Lin, H.M.; Stobiński, L.; Chen, C.H.; Liou, W.J.; Wrzalik, R.; Flisak, Z. Experimental and Theoretical Studies on Corals. I. Toward Understanding the Origin of Color in Precious Red Corals from Raman and IR Spectroscopies and DFT Calculations. J. Raman Spectrosc. 2010, 41, 651–658. [Google Scholar] [CrossRef]
- Kupka, T.; Buczek, A.; Szostak, R.; Lin, H.; Fan, L.; Stobi, L. Modeling Red Coral (Corallium rubrum) and African Snail (Helixia aspersa) Shell Pigments: Raman Spectroscopy versus DFT Studies. J. Raman Spectrosc. 2016, 47, 908–916. [Google Scholar] [CrossRef]
- Karampelas, S.; Fritsch, E.; Mevellec, J.Y.; Gauthier, J.P.; Sklavounos, S.; Soldatos, T. Determination by Raman Scattering of the Nature of Pigments in Cultured Freshwater Pearls from the Mollusk Hyriopsis cumingi. J. Raman Spectrosc. 2007, 38, 217–230. [Google Scholar] [CrossRef]
- Frisch, M.; Trucks, G.; Schlegel, H.; Scuseria, G.; Robb, M.; Cheeseman, J.; Scalmani, G.; Barone, V.; Petersson, G.; Nakatsuji, H. Gaussian 16, Revision C. 01; Gaussian. Inc.: Wallingford, CT, USA, 2016. [Google Scholar]
- Lu, T.; Chen, F. Multiwfn: A Multifunctional Wavefunction Analyzer. J. Comput. Chem. 2012, 33, 580–592. [Google Scholar] [CrossRef]
- Stephens, P.J.; Devlin, F.J.; Chabalowski, C.F.; Frisch, M.J. Ab Initio Calculation of Vibrational Absorption and Circular Dichroism Spectra Using Density Functional Force Fields. J. Phys. Chem. 1994, 98, 11623–11627. [Google Scholar] [CrossRef]
- Scott, A.P.; Radom, L. Harmonic Vibrational Frequencies: An Evaluation of Hartree-Fock, Møller-Plesset, Quadratic Configuration Interaction, Density Functional Theory, and Semiempirical Scale Factors. J. Phys. Chem. 1996, 100, 16502–16513. [Google Scholar] [CrossRef]
- Becke, A.D. A New Mixing of Hartree-Fock and Local Density-Functional Theories. J. Chem. Phys. 1993, 98, 1372–1377. [Google Scholar] [CrossRef]
- Yanai, T.; Tew, D.P.; Handy, N.C. A New Hybrid Exchange-Correlation Functional Using the Coulomb-Attenuating Method (CAM-B3LYP). Chem. Phys. Lett. 2004, 393, 51–57. [Google Scholar] [CrossRef] [Green Version]
- Zhao, Y.; Truhlar, D.G. The M06 Suite of Density Functionals for Main Group Thermochemistry, Thermochemical Kinetics, Noncovalent Interactions, Excited States, and Transition Elements: Two New Functionals and Systematic Testing of Four M06-Class Functionals and 12 Other Function. Theor. Chem. Acc. 2008, 120, 215–241. [Google Scholar] [CrossRef] [Green Version]
- Yu, H.S.; He, X.; Li, S.L.; Truhlar, D.G. MN15: A Kohn-Sham Global-Hybrid Exchange-Correlation Density Functional with Broad Accuracy for Multi-Reference and Single-Reference Systems and Noncovalent Interactions. Chem. Sci. 2016, 7, 5032–5051. [Google Scholar] [CrossRef] [PubMed] [Green Version]
- Adamo, C.; Barone, V. Toward Reliable Density Functional Methods without Adjustable Parameters: The PBE0 Model. J. Chem. Phys. 1999, 110, 6158–6170. [Google Scholar] [CrossRef]
- Staroverov, V.N.; Scuseria, G.E.; Tao, J.; Perdew, J.P. Comparative Assessment of a New Nonempirical Density Functional: Molecules and Hydrogen-Bonded Complexes. J. Chem. Phys. 2003, 119, 12129–12137. [Google Scholar] [CrossRef]
- Da Chai, J.; Head-Gordon, M. Long-Range Corrected Hybrid Density Functionals with Damped Atom-Atom Dispersion Corrections. Phys. Chem. Chem. Phys. 2008, 10, 6615–6620. [Google Scholar] [CrossRef] [PubMed] [Green Version]
- Finkelshtein, E.I.; Shamsiev, R.S. Spectral and Structural Properties of Carotenoids—DFT and Thermochemical Calculations. J. Mol. Struct. 2019, 1197, 583–593. [Google Scholar] [CrossRef]
- Liu, W.; Wang, Z.; Zheng, Z.; Jiang, L.; Yang, Y.; Zhao, L.; Su, W. Density Functional Theoretical Analysis of the Molecular Structural Effects on Raman Spectra of β-Carotene and Lycopene. Chin. J. Chem. 2012, 30, 2573–2580. [Google Scholar] [CrossRef]
- Kashinski, D.O.; Chase, G.M.; Nelson, R.G.; Di Nallo, O.E.; Scales, A.N.; Vanderley, D.L.; Byrd, E.F.C. Harmonic Vibrational Frequencies: Approximate Global Scaling Factors for TPSS, M06, and M11 Functional Families Using Several Common Basis Sets. J. Phys. Chem. A 2017, 121, 2265–2273. [Google Scholar] [CrossRef]
- Chen, C.; Huang, W.; Gao, Q.; Fan, L.; Shen, A.H. Assignments on Raman Peaks of Red Coral Based on Experimental Raman Spectroscopy and Density Functional Theory Calculation. Spectrosc. Spect. Anal. 2021, 41, 127–130. [Google Scholar] [CrossRef]
- Maia, L.F.; Fleury, B.G.; Lages, B.G.; Barbosa, J.P.; Pinto, À.C.; Castro, H.V.; De Oliveira, V.E.; Edwards, H.G.M.; De Oliveira, L.F.C. Identification of Reddish Pigments in Octocorals by Raman Spectroscopy. J. Raman Spectrosc. 2011, 42, 653–658. [Google Scholar] [CrossRef]
- Brambilla, L.; Tommasini, M.; Zerbi, G.; Stradi, R. Raman Spectroscopy of Polyconjugated Molecules with Electronic and Mechanical Confinement: The Spectrum of Corallium Rubrum. J. Raman Spectrosc. 2012, 43, 1449–1458. [Google Scholar] [CrossRef]
- Bergamonti, L.; Bersani, D.; Csermely, D.; Lottici, P.P. The Nature of the Pigments in Corals and Pearls: A Contribution from Raman Spectroscopy. Spectrosc. Lett. 2011, 44, 453–458. [Google Scholar] [CrossRef]
- Esatbeyoglu, T.; Rimbach, G. Canthaxanthin: From Molecule to Function. Mol. Nutr. Food Res. 2017, 61, 1600469. [Google Scholar] [CrossRef]
- Zheng, Y.; Wang, J.; Zhou, S.; Zhang, Y.; Liu, J.; Xue, C.X.; Williams, B.T.; Zhao, X.; Zhao, L.; Zhu, X.Y.; et al. Bacteria Are Important Dimethylsulfoniopropionate Producers in Marine Aphotic and High-Pressure Environments. Nat. Commun. 2020, 11, 4658. [Google Scholar] [CrossRef]
- Liu, Z.; Lu, T.; Chen, Q. An Sp-Hybridized All-Carboatomic Ring, Cyclo[18]Carbon: Electronic Structure, Electronic Spectrum, and Optical Nonlinearity. Carbon N. Y. 2020, 165, 461–467. [Google Scholar] [CrossRef]


| Raman Peaks of Conch Pearl/cm−1 | Raman Peaks of Red Coral/cm−1 | Assignments |
|---|---|---|
| 1516 | 1516 | ν1 (C=C stretching) |
| 1298 | 1298 | C–H bending |
| 1204 | 1181 | C–H bending |
| 1128 | 1128 | ν2 (C–C stretching) |
| 1017 | 1017 | CH3 rocking |
| Name | Molecular Structure | ν1/cm−1 | ν2/cm−1 |
|---|---|---|---|
| Canthaxanthin |  | 1513 | 1159 |
| 9-demethyl-canthaxnthin | 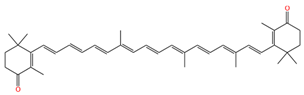 | 1513 | 1152 |
| 13-demethyl-canthaxnthin |  | 1513 | 1145 |
| 9,13-demethyl-canthaxnthin | 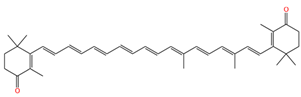 | 1513 | 1142 |
| 9,13′-demethyl-canthaxnthin | 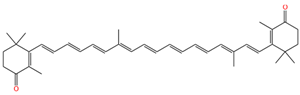 | 1513 | 1142 |
| 9,9′-demethyl-canthaxnthin | 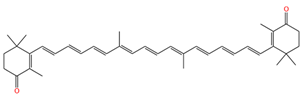 | 1512 | 1146, 1138 |
| 13,13′-demethyl-canthaxnthin | 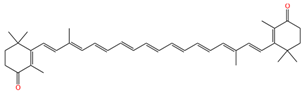 | 1513 | 1139 |
| 9,13,9′-demethyl-canthaxnthin |  | 1513 | 1141, 1132 |
| 9,13,13′-demethyl-canthaxnthin | 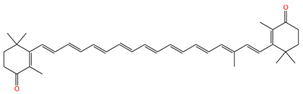 | 1513 | 1136 |
| 9,9′,13,13′-demethyl-canthaxnthin | 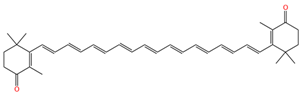 | 1513 | 1132 |
| Functional | HF Exchange | Canthaxanthin | 9,9′,13,13′-Demethyl-Canthaxnthin | Polyene C11 |
|---|---|---|---|---|
| TPSSh | 10% | 612 | 613 | 574 |
| B3LYP | 20% | 585 | 586 | 555 |
| PBE0 | 25% | 565 | 566 | 539 |
| MN15 | 25% | 524 | 524 | 504 |
| BHandHLYP | 50% | 496 | 496 | 481 |
| M06-2X | 54% | 496 | 495 | 480 |
| CAM-B3LYP | 19%–65% | 493 | 491 | 477 |
| ωB97XD | 22.2%–100% | 482 | 479 | 467 |
Disclaimer/Publisher’s Note: The statements, opinions and data contained in all publications are solely those of the individual author(s) and contributor(s) and not of MDPI and/or the editor(s). MDPI and/or the editor(s) disclaim responsibility for any injury to people or property resulting from any ideas, methods, instructions or products referred to in the content. |
© 2023 by the authors. Licensee MDPI, Basel, Switzerland. This article is an open access article distributed under the terms and conditions of the Creative Commons Attribution (CC BY) license (https://creativecommons.org/licenses/by/4.0/).
Share and Cite
Chen, C.; Yu, J.; Ye, X.; Shen, A.H. Deciphering the Color Origin of Pink Conch Pearl Using Nondestructive Spectroscopies and DFT Calculations. Minerals 2023, 13, 811. https://doi.org/10.3390/min13060811
Chen C, Yu J, Ye X, Shen AH. Deciphering the Color Origin of Pink Conch Pearl Using Nondestructive Spectroscopies and DFT Calculations. Minerals. 2023; 13(6):811. https://doi.org/10.3390/min13060811
Chicago/Turabian StyleChen, Chaoyang, Jing Yu, Xu Ye, and Andy H. Shen. 2023. "Deciphering the Color Origin of Pink Conch Pearl Using Nondestructive Spectroscopies and DFT Calculations" Minerals 13, no. 6: 811. https://doi.org/10.3390/min13060811
APA StyleChen, C., Yu, J., Ye, X., & Shen, A. H. (2023). Deciphering the Color Origin of Pink Conch Pearl Using Nondestructive Spectroscopies and DFT Calculations. Minerals, 13(6), 811. https://doi.org/10.3390/min13060811