
Research on New Solid Waste Heat Insulation Material for Deep Mining

Abstract
:1. Introduction
2. Materials and Methods
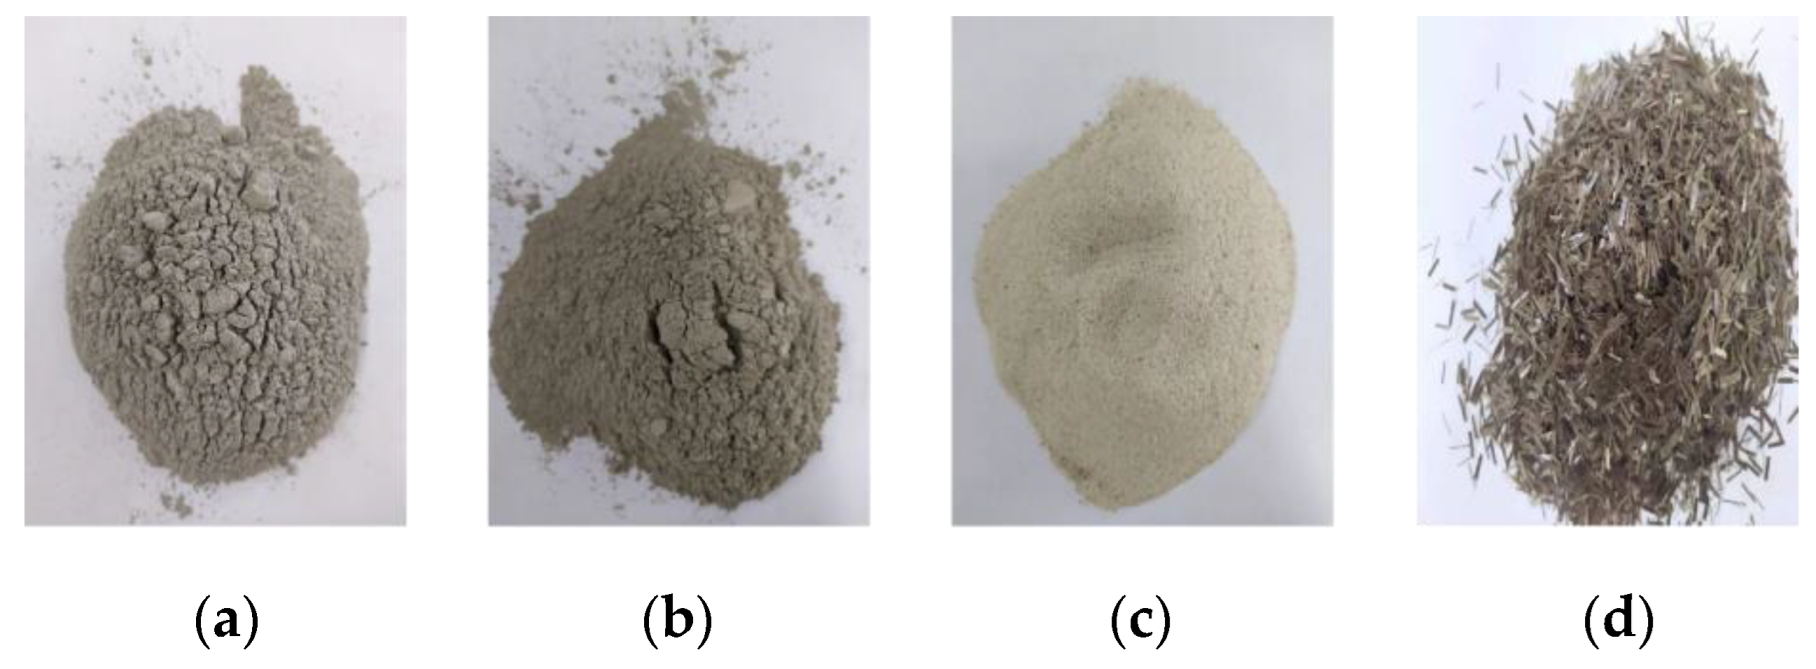
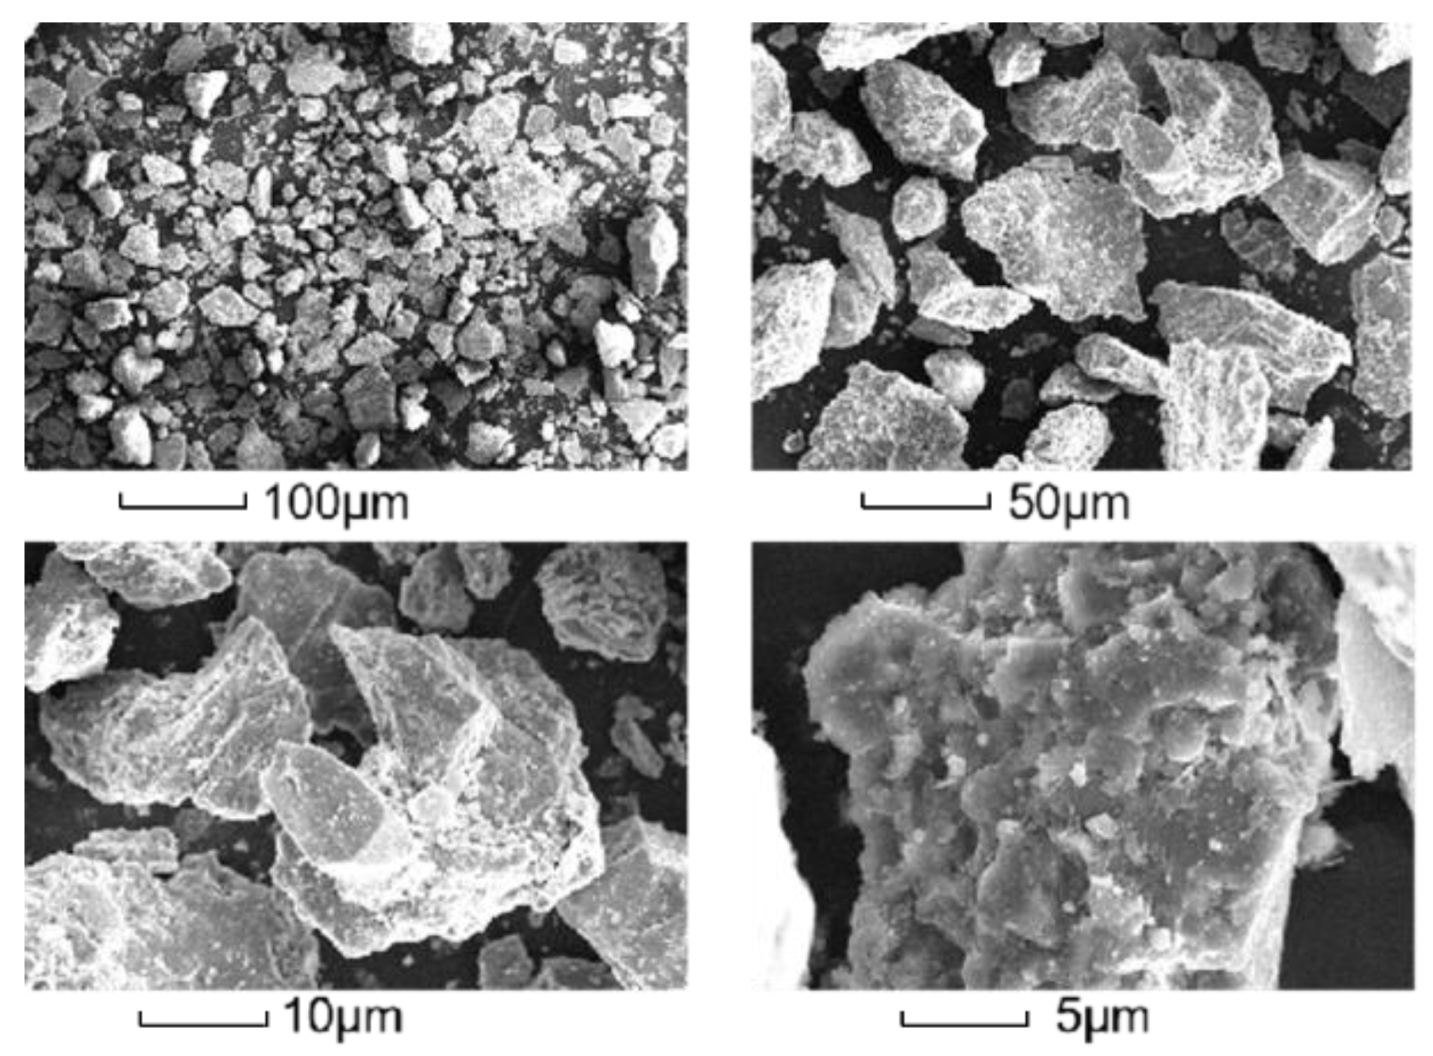
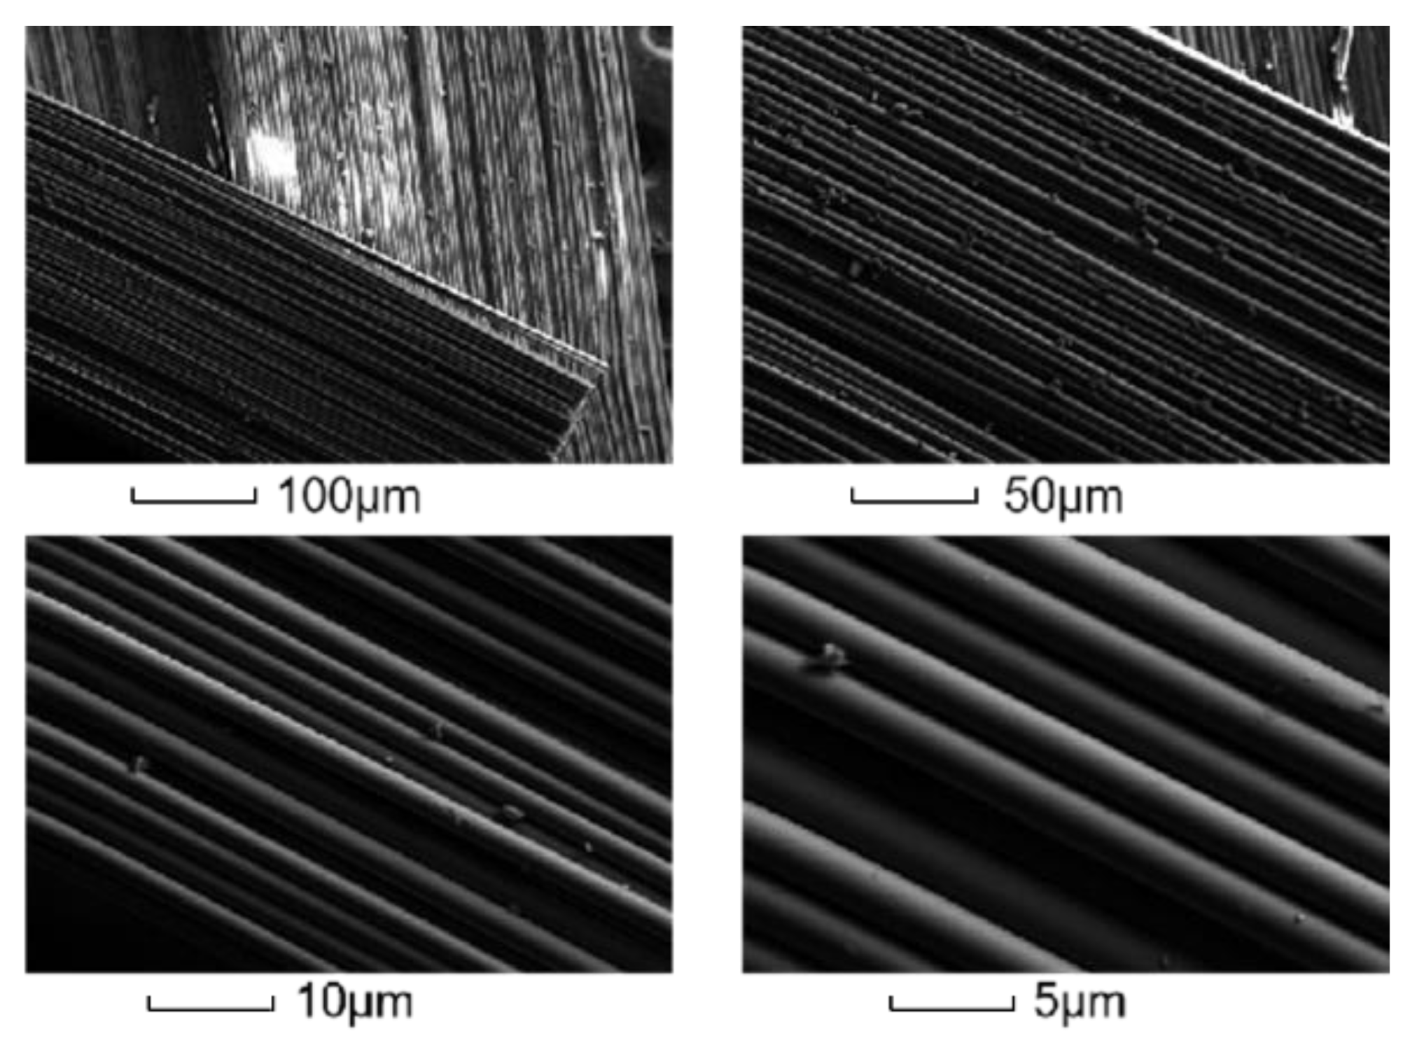
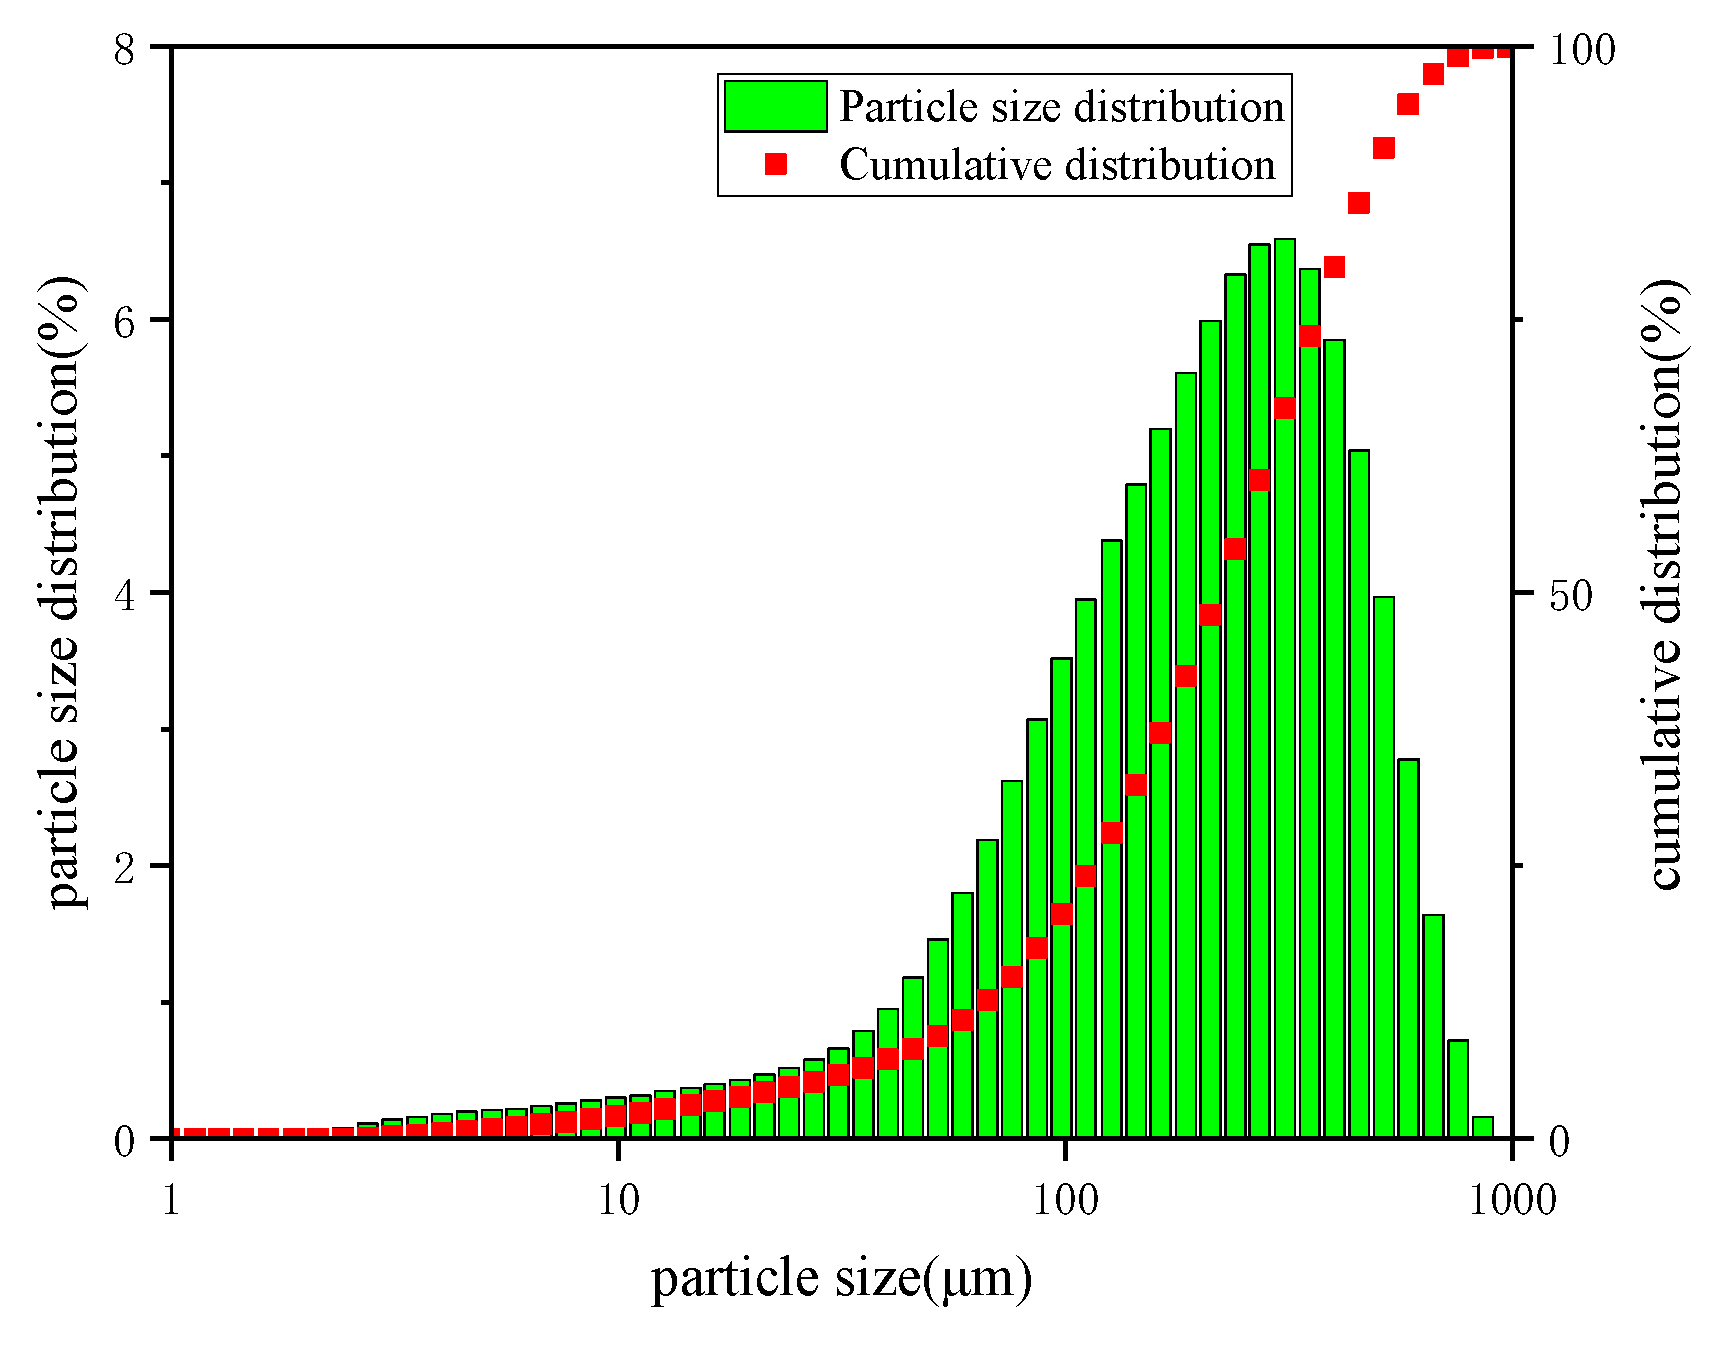
2.1. Raw Material Selection
2.1.1. Material Source
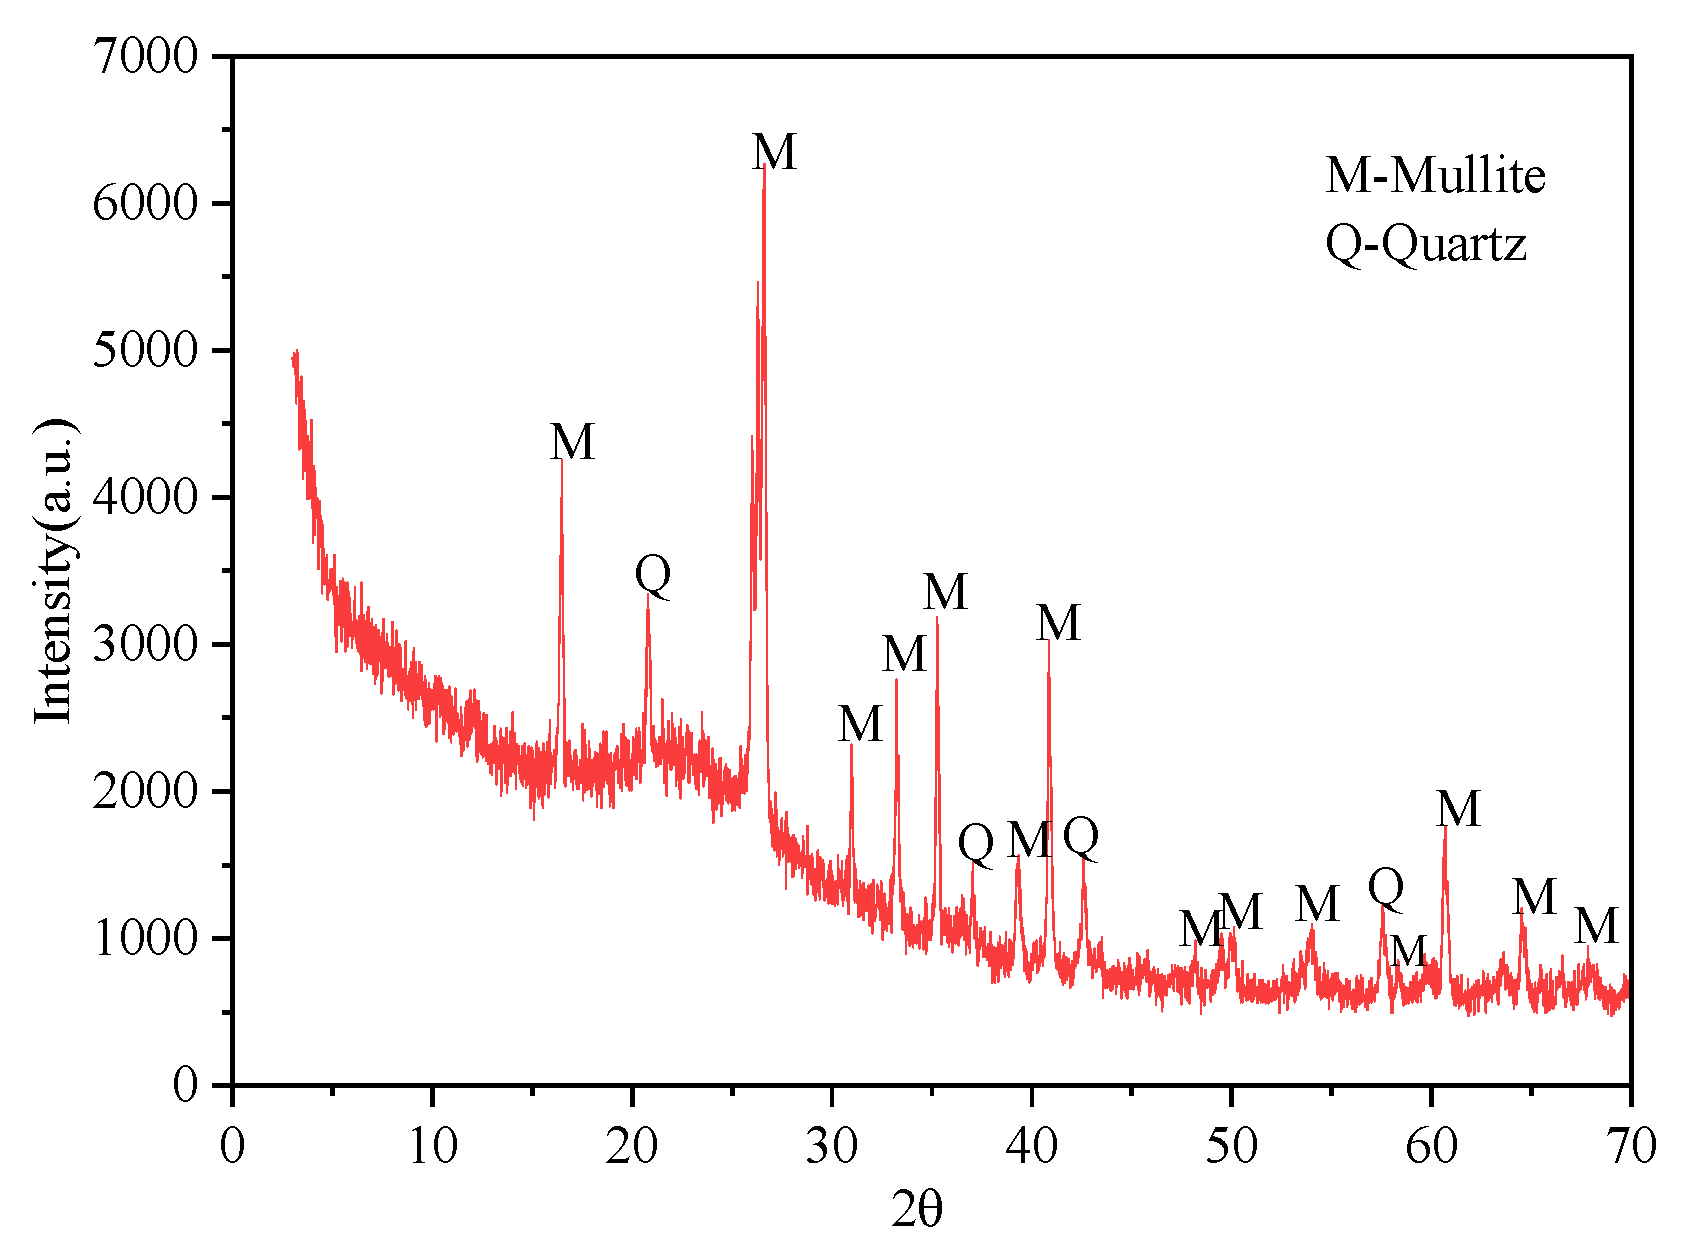
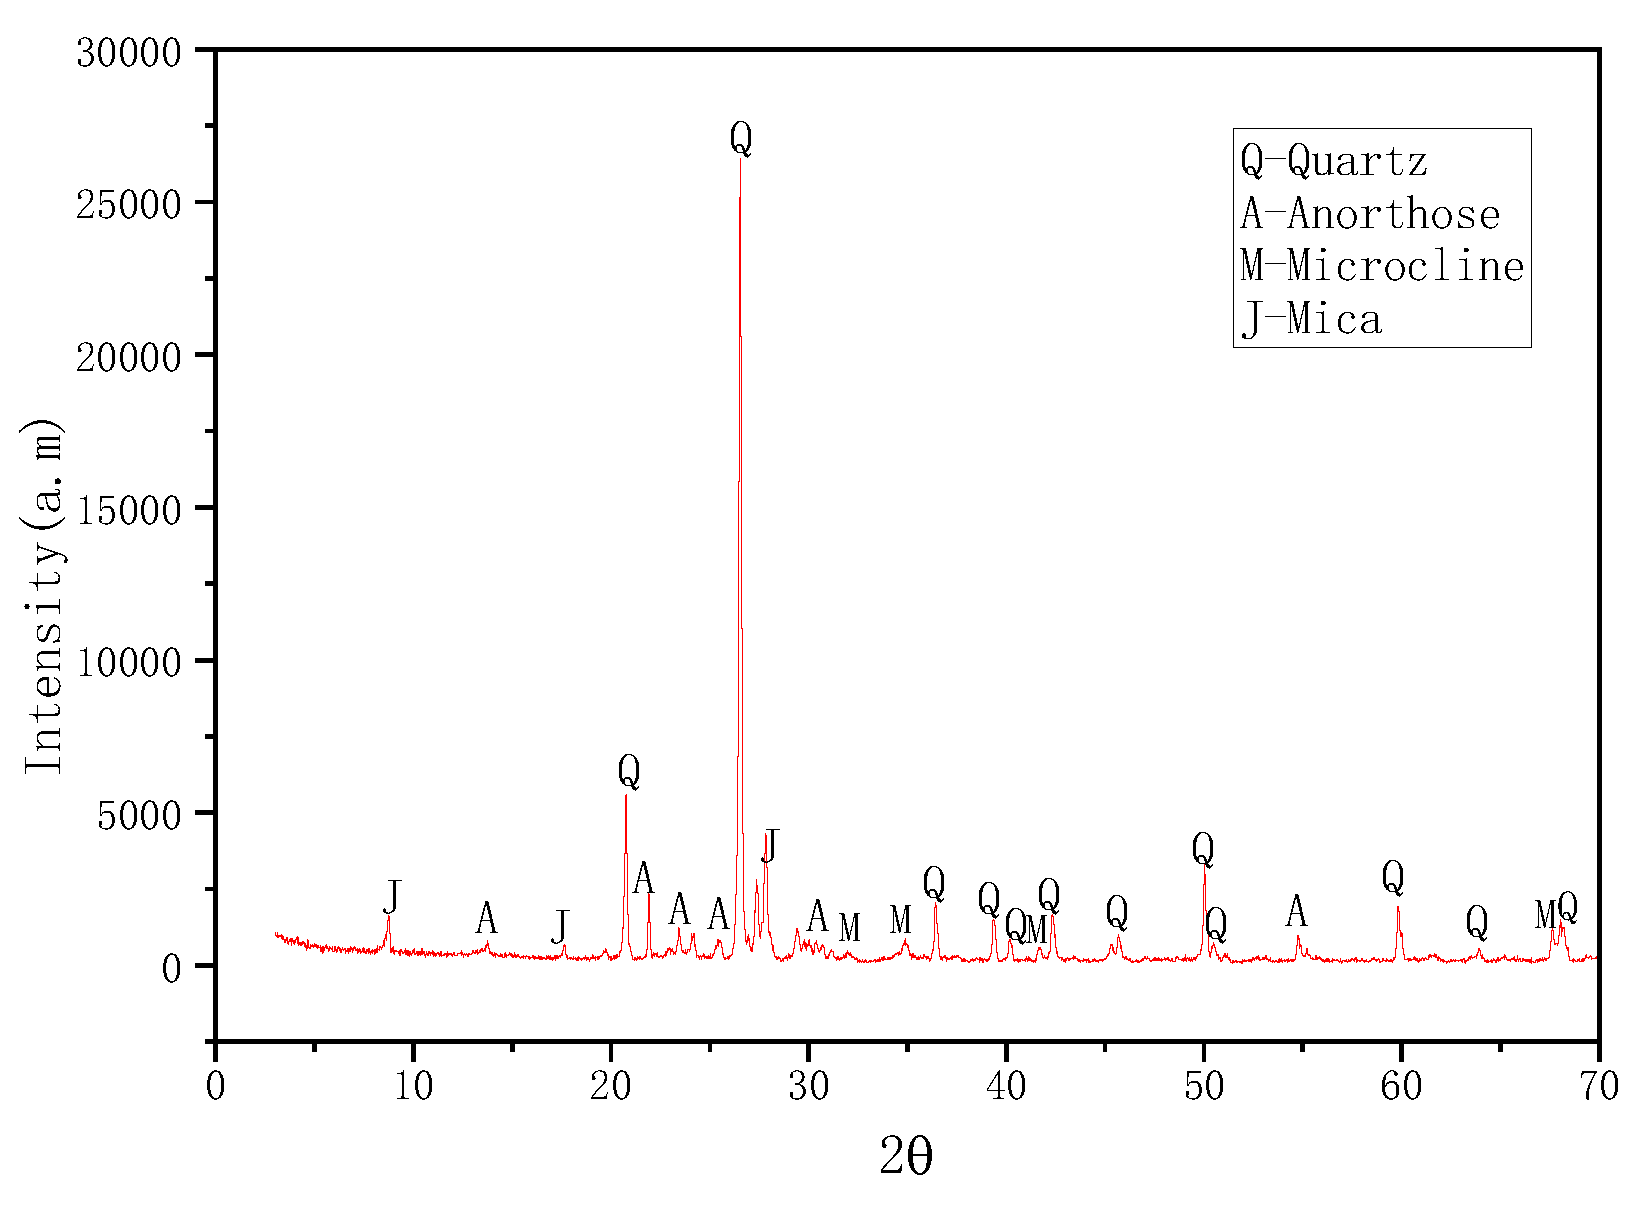
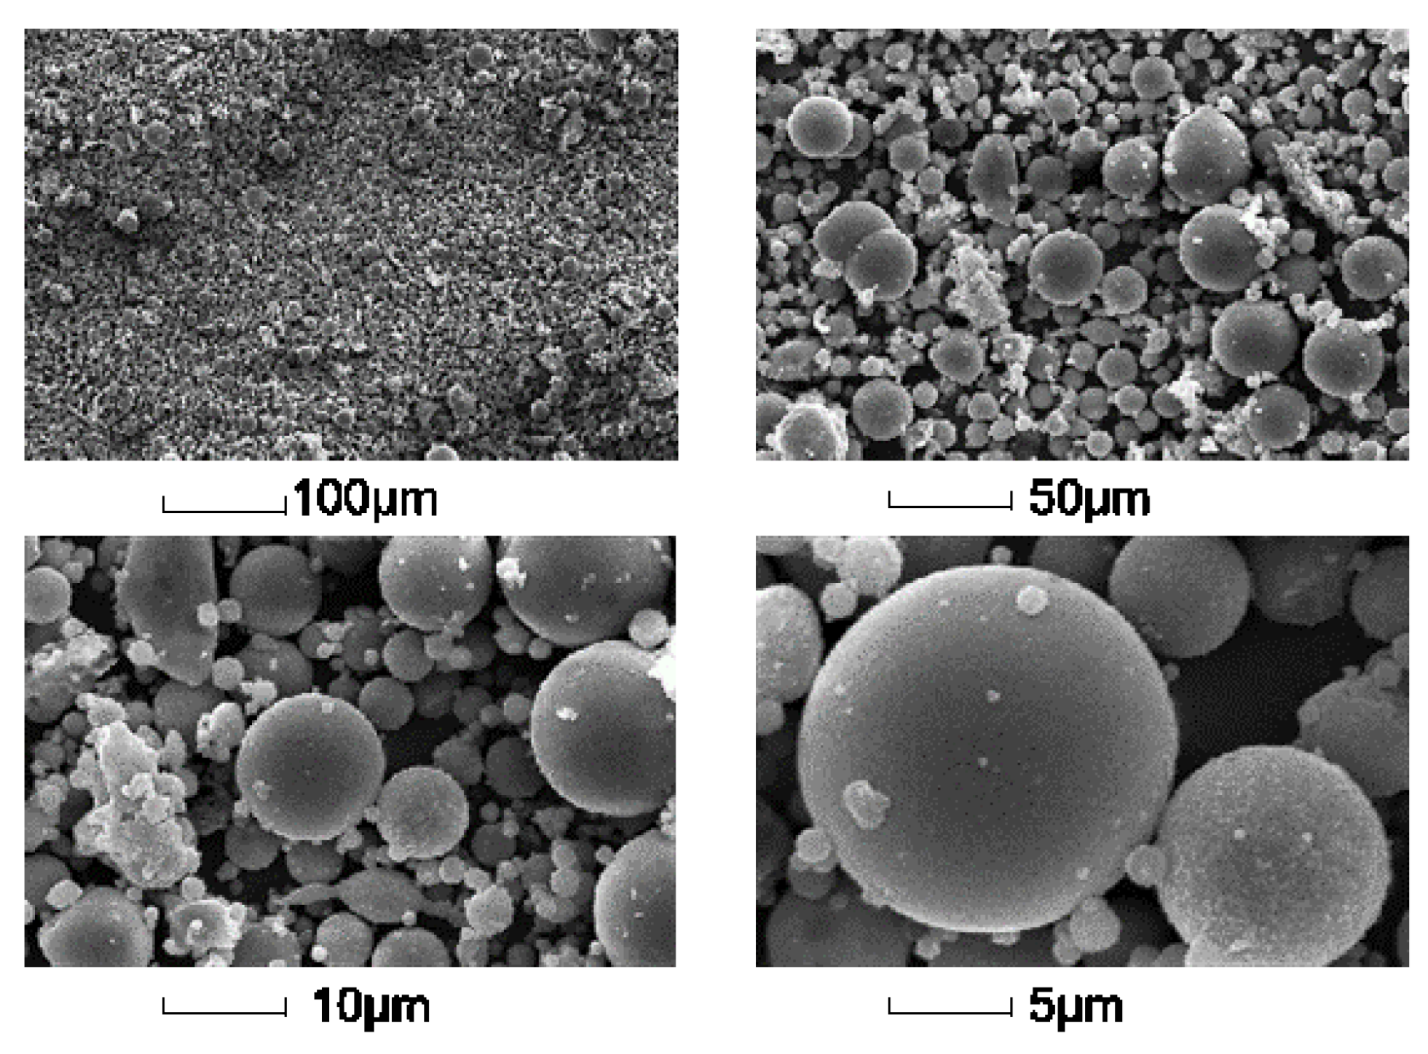
2.1.2. Raw Material Abstract
2.2. Experimental Method
2.2.1. Laboratory Equipment
- (1)
- WDW-200D microcomputer-controlled electronic universal material testing machine
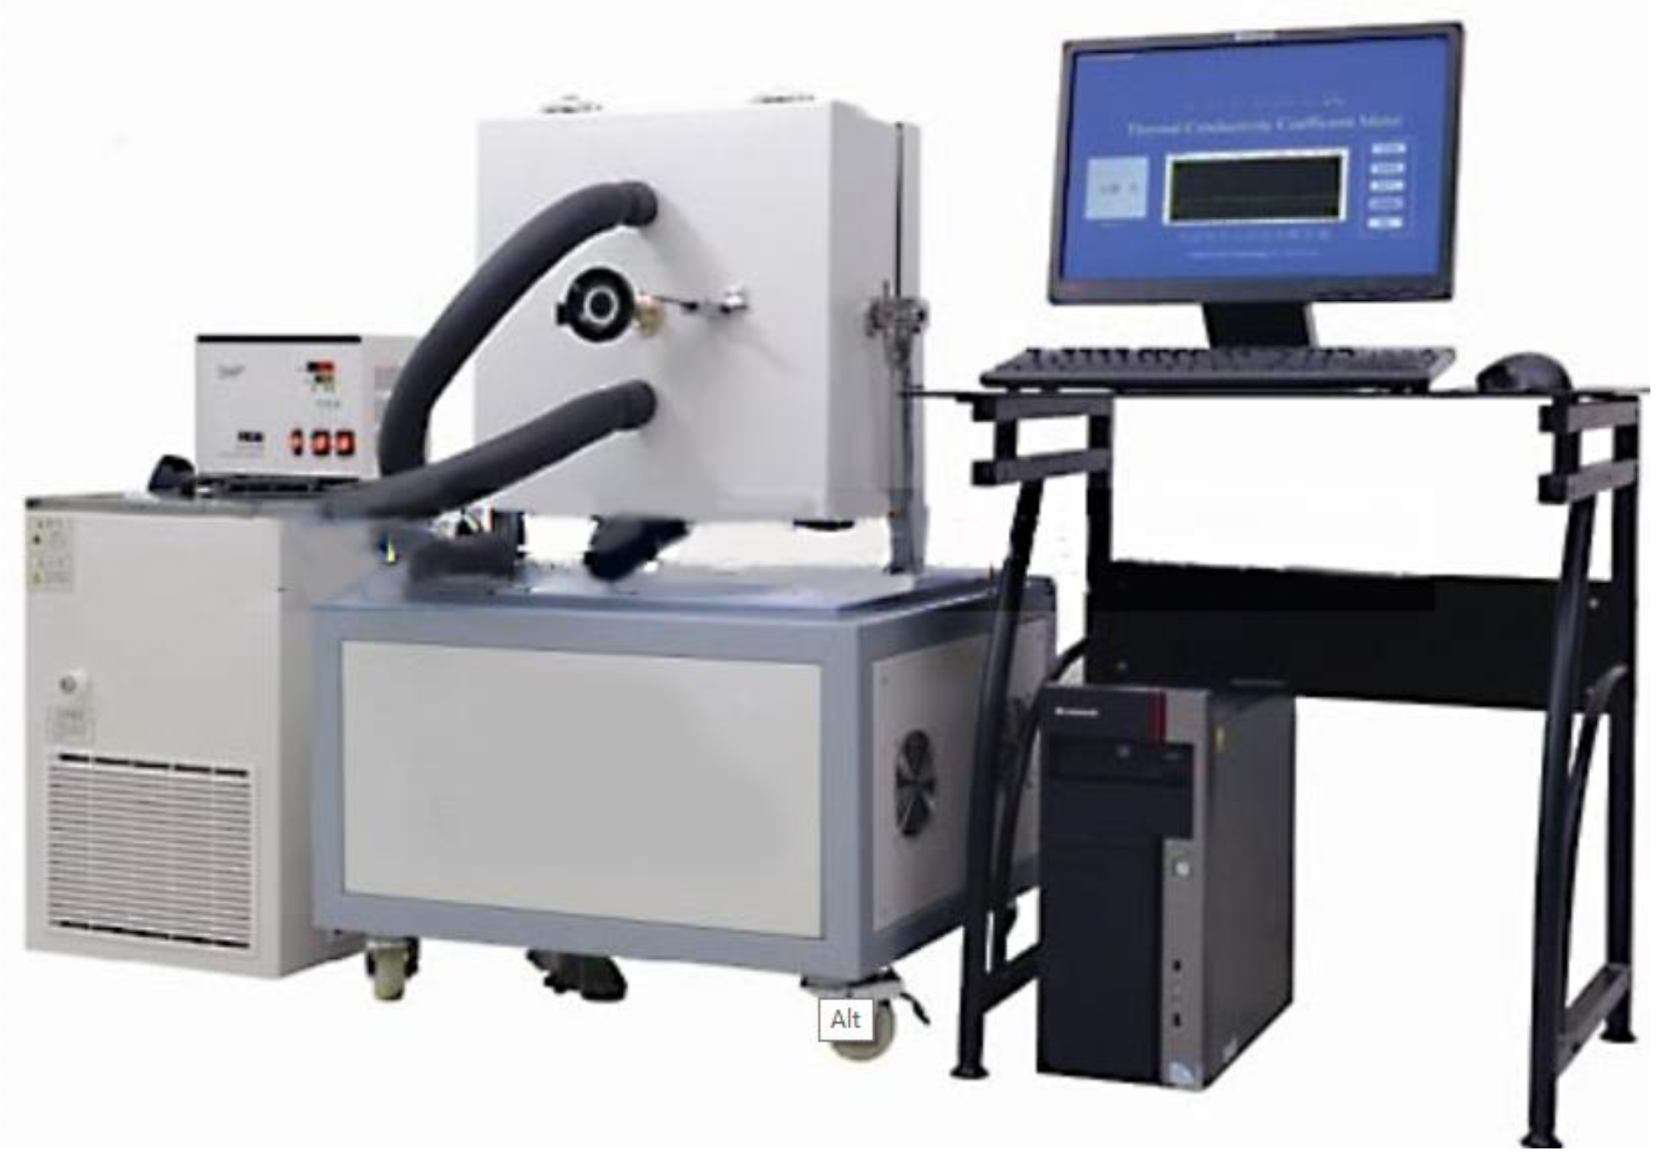
- (2)
- IMRL-01 thermal conductivity meter
2.2.2. Specimen Preparation
- (1)
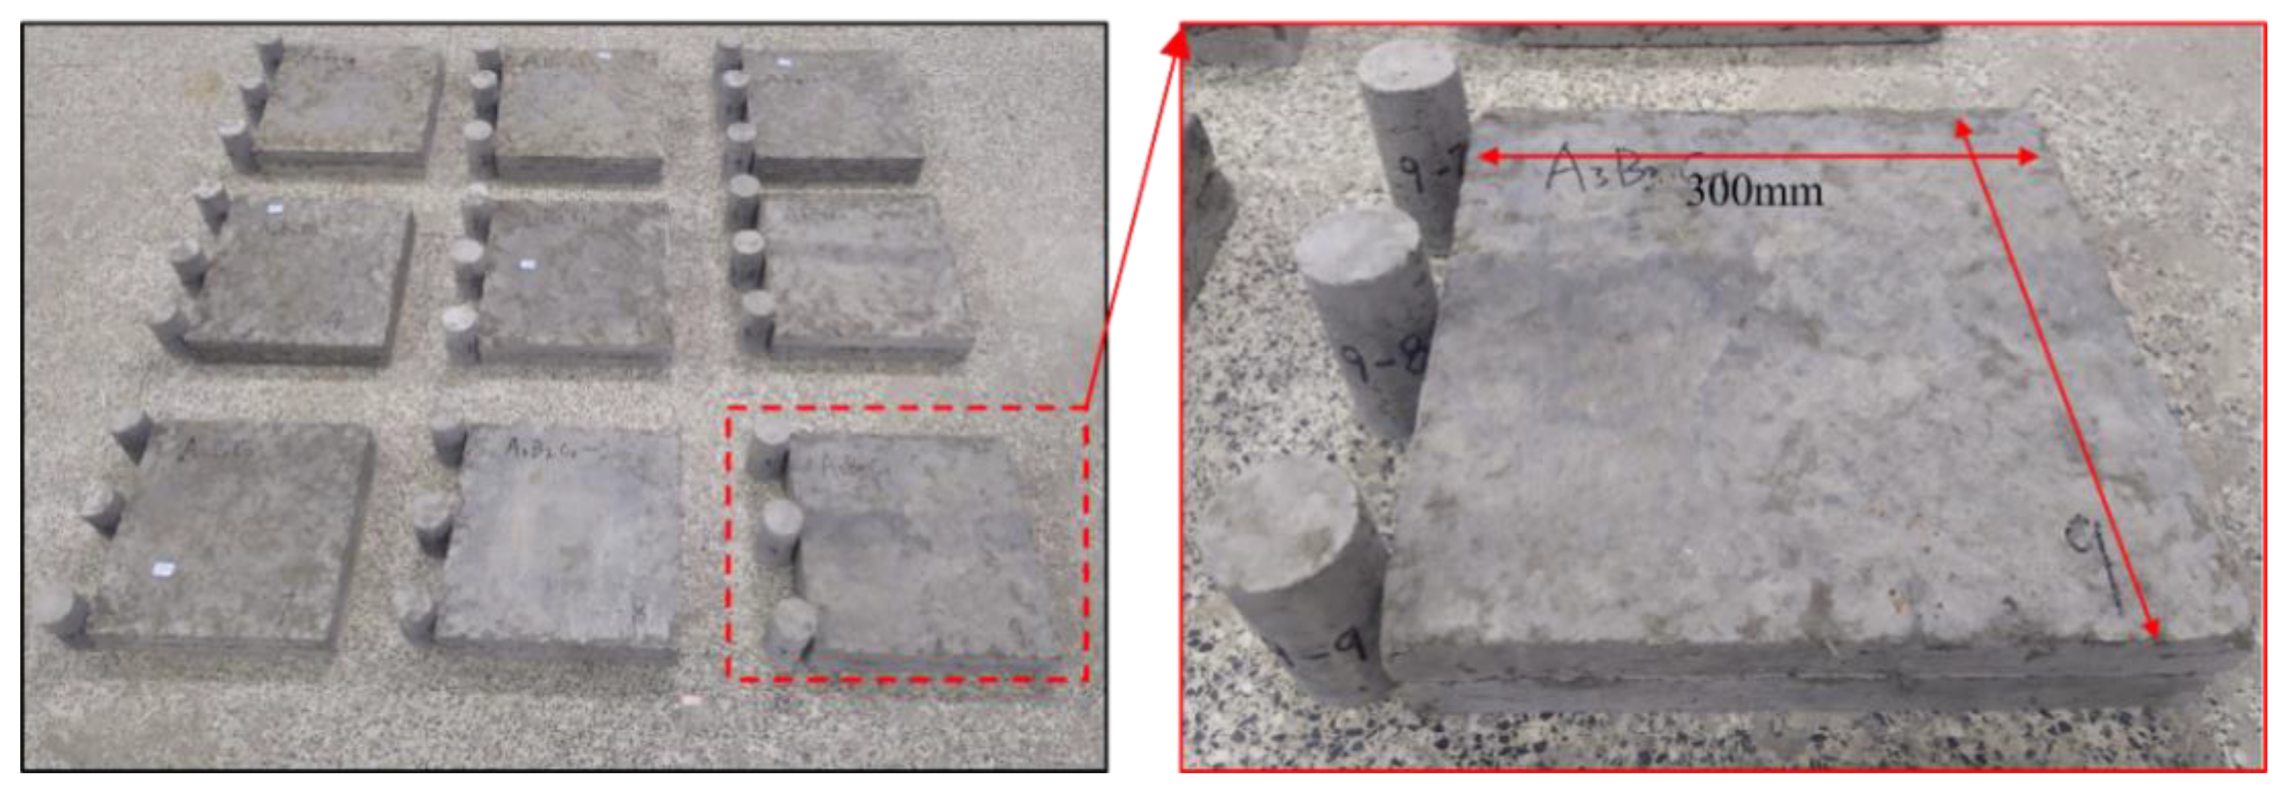
- According to the designed 9 groups of orthogonal experiments, 9 cylindrical test blocks (50 × 100 mm) (a total of 81) were prepared in each group, and 2 cuboid test blocks (a total of 18) were used to test the thermal conductivity.
- (2)
- During the preparation of the sample, the material was stirred evenly with a certain amount of water according to the set ratio, then injected into the triple test mold for vibration tamping.
- (3)
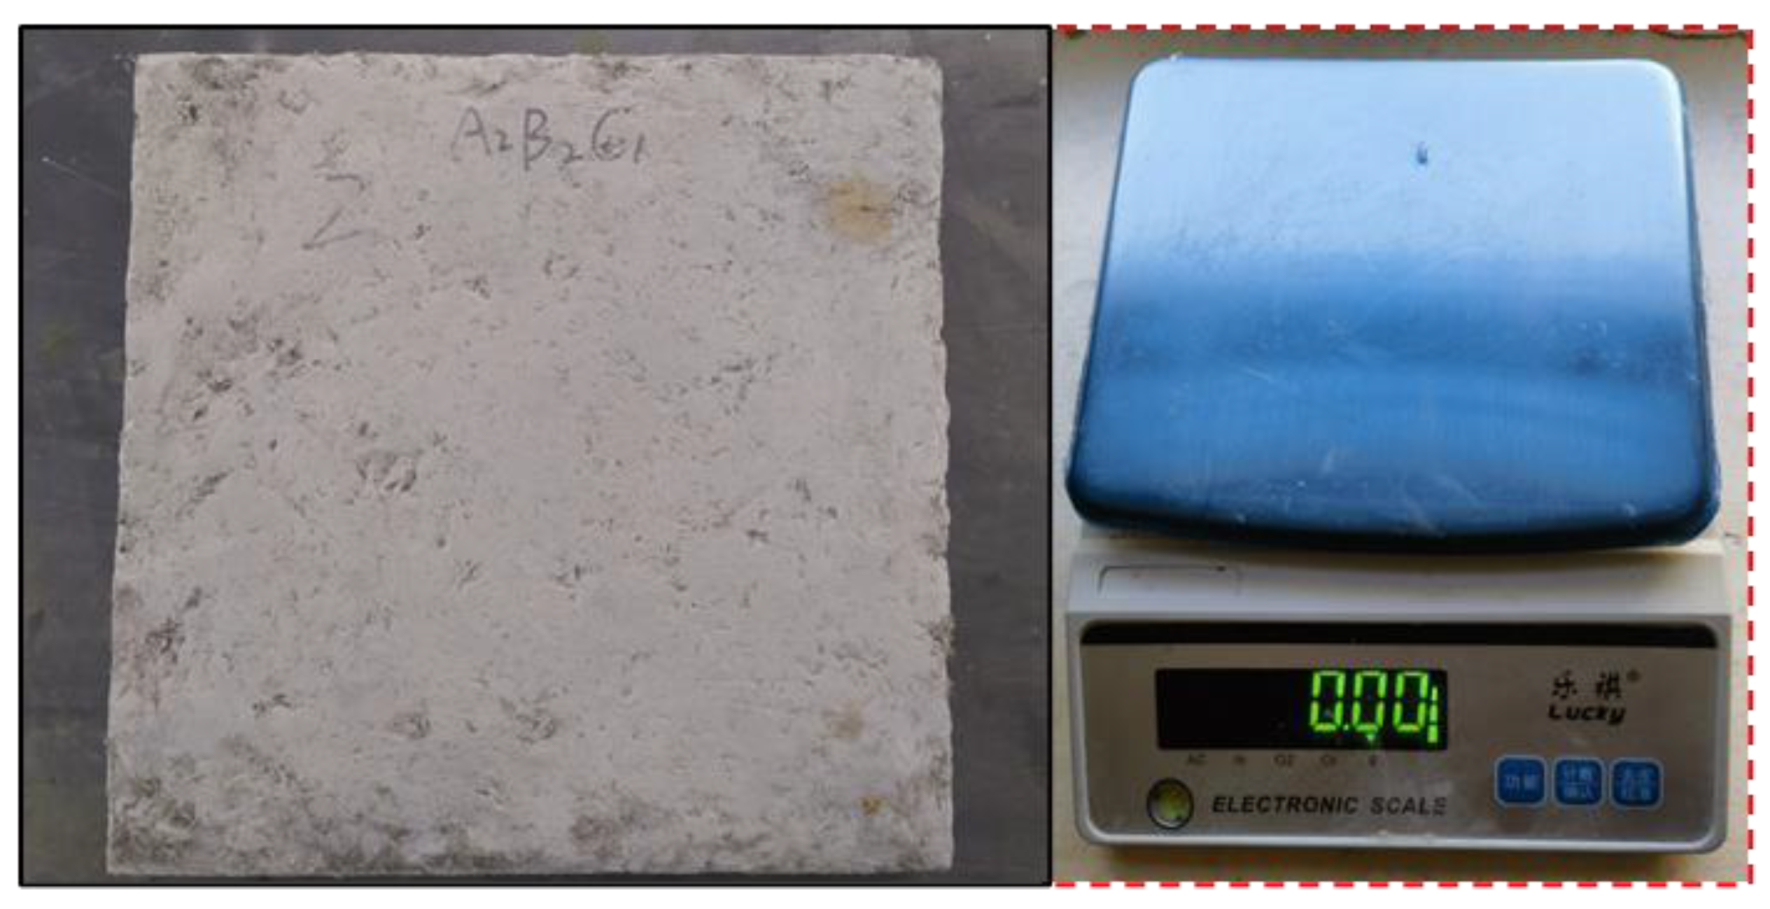
- After 24 h of molding, the demolded test block was placed in the standard curing room (temperature: 20 ± 2°, humidity: more than 95%) for 3 days, 7 days, and 28 days. Some samples are shown in Figure 11. The uniaxial compressive strength, elastic modulus, apparent density, and thermal conductivity at 3 days, 7 days, and 28 days were tested, respectively.
2.2.3. Experimentation
- (1)
- Mechanical parameter test
- (2)
- Thermal conductivity test
- (3)
- Test of apparent density
3. Analysis of Effect
3.1. Analysis of Mechanical Results
3.1.1. Single-Axis Compressive Strength
3.1.2. Elastic Modulus
3.2. Analysis of Thermal Results
3.2.1. Apparent Density
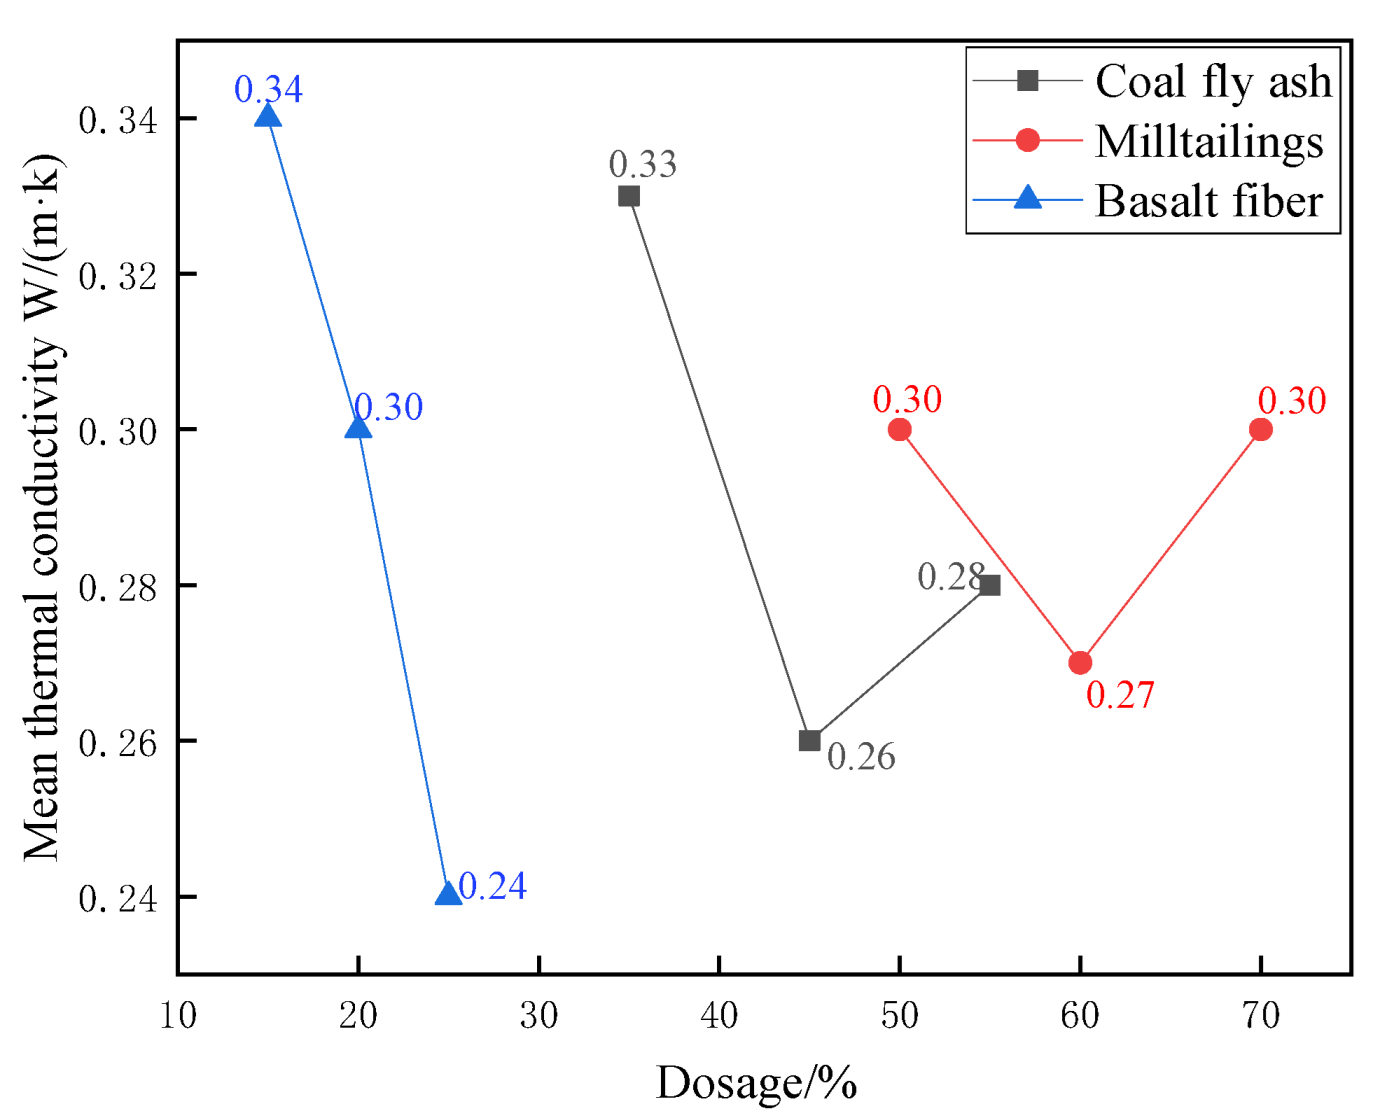
3.2.2. Thermal Conductivity
3.3. Ratio Optimization Based on Test Results
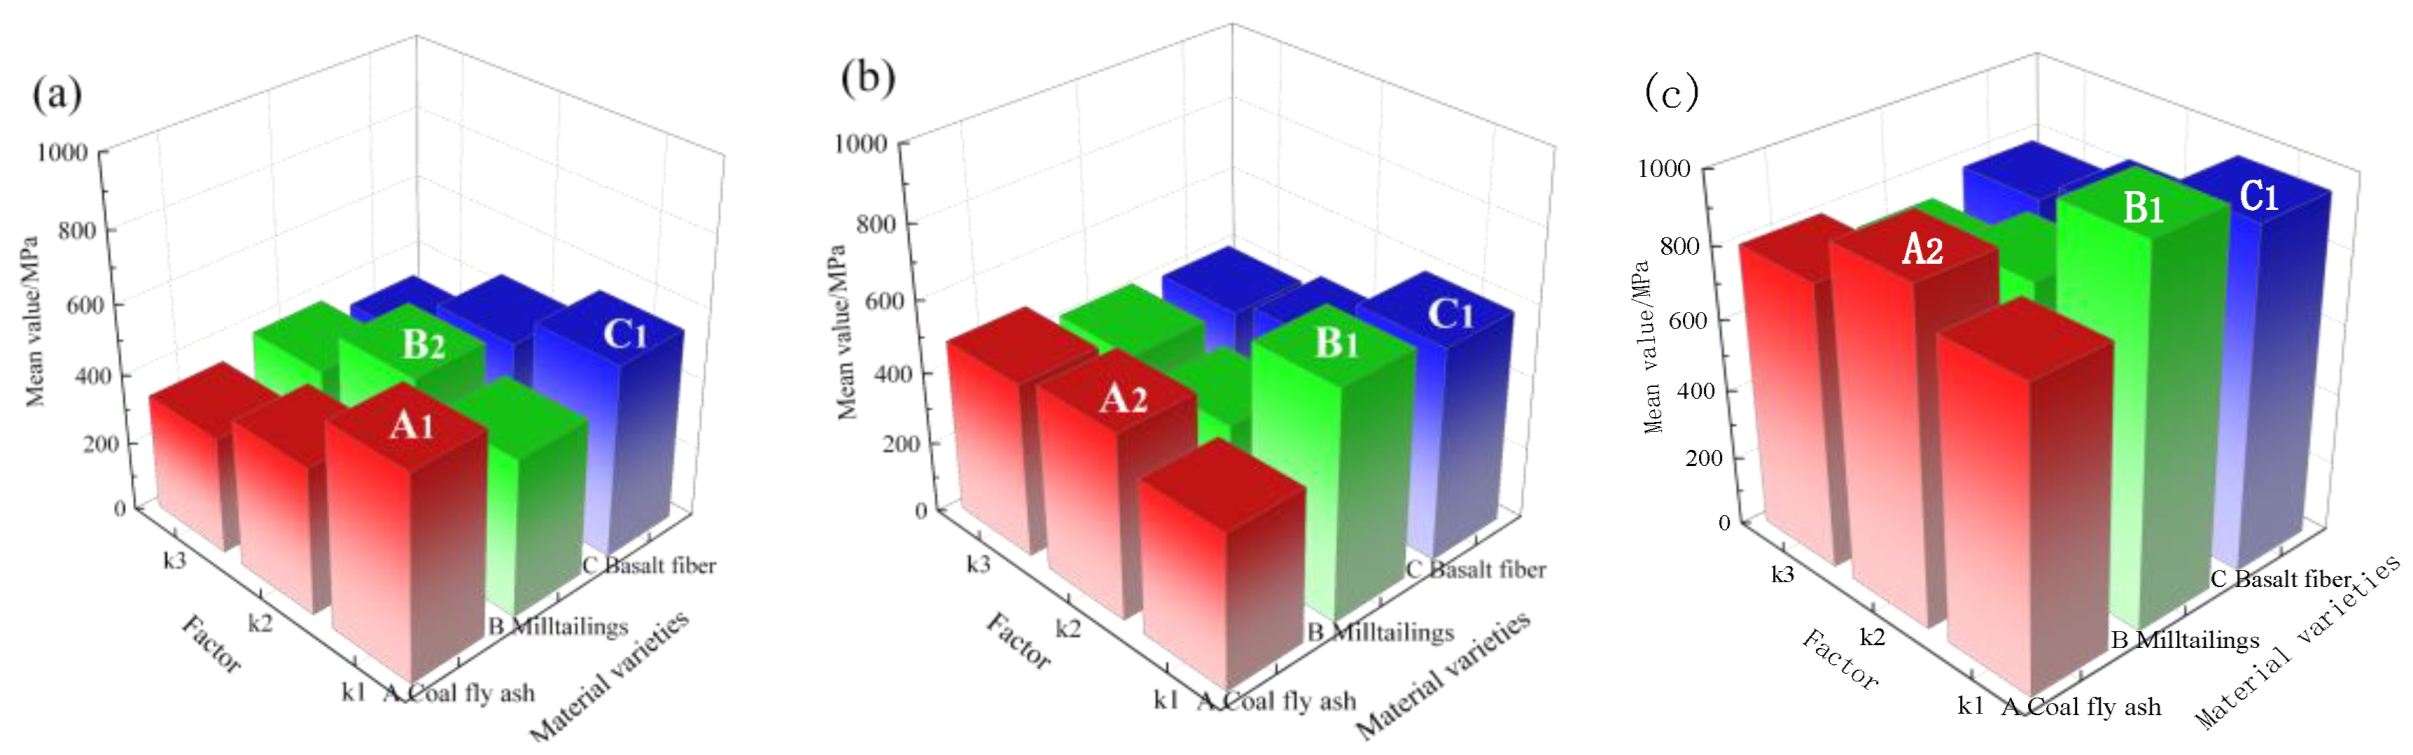
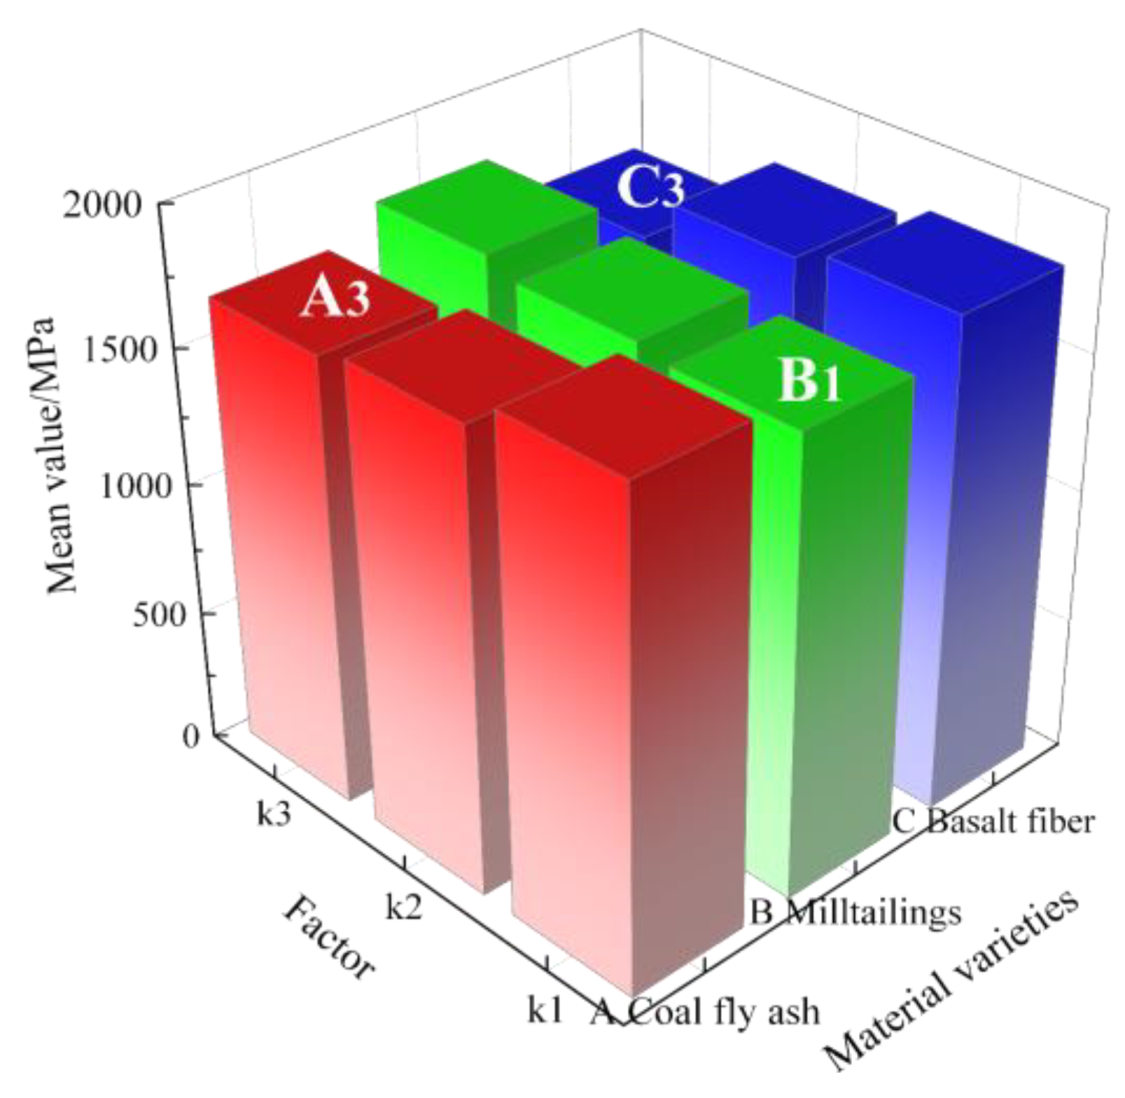
3.3.1. Range Analysis Method
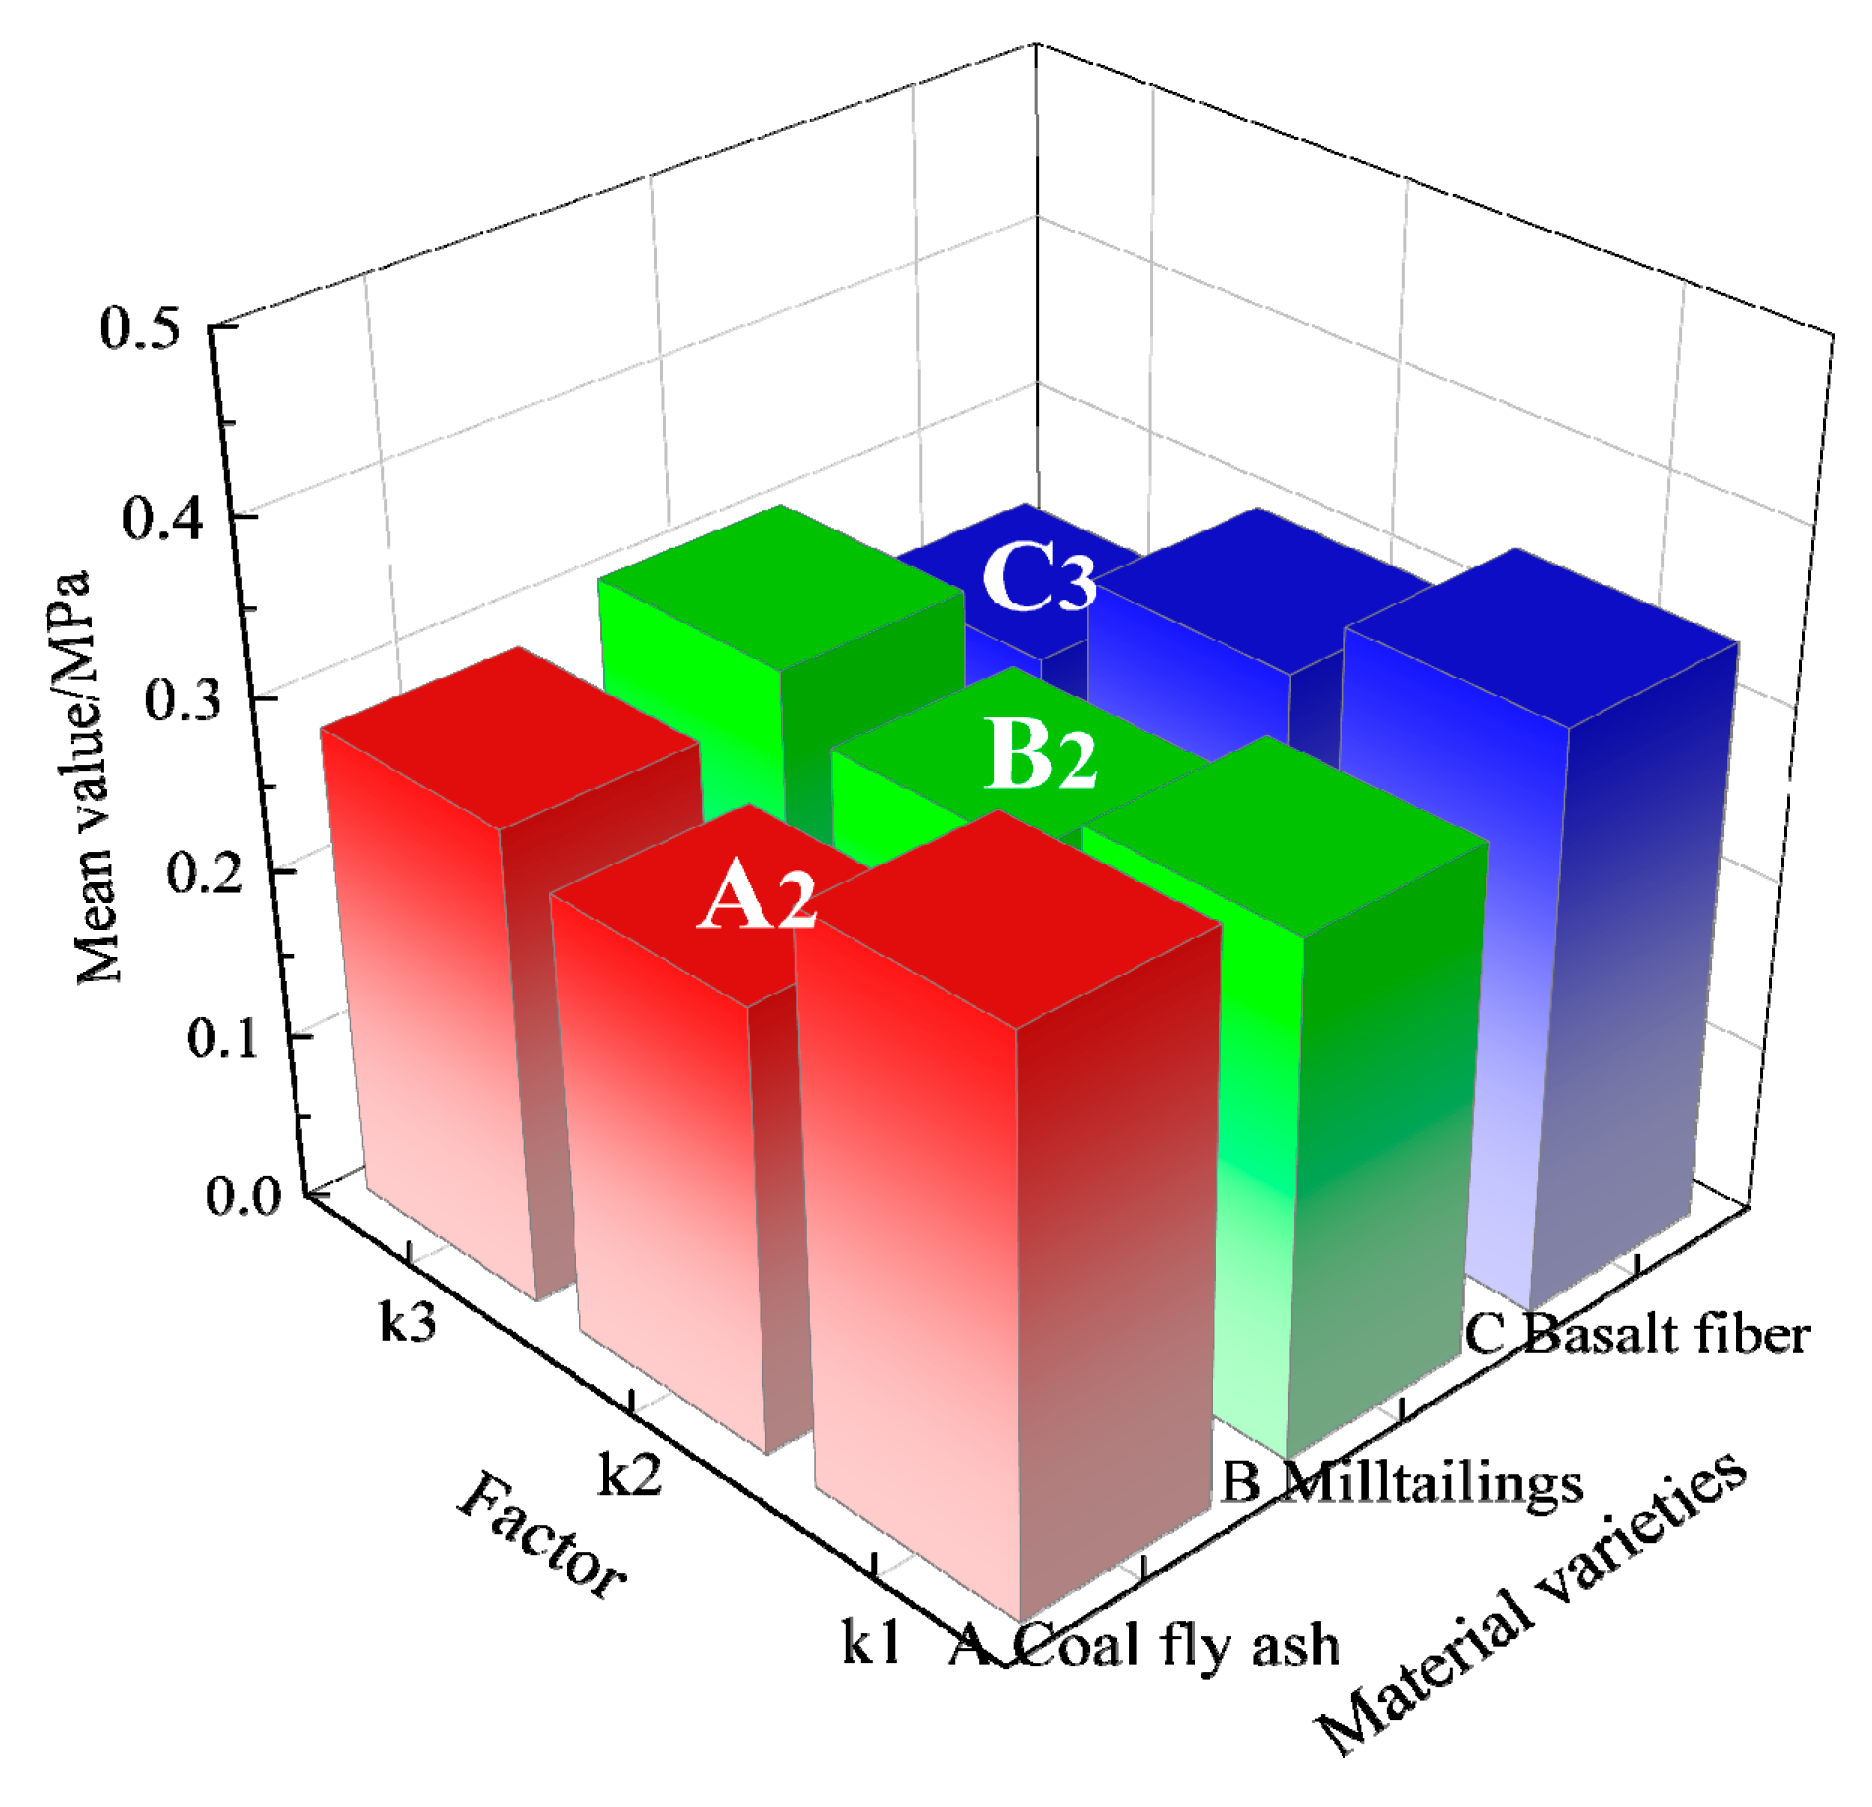
3.3.2. Efficacy Analysis
4. Regression Analysis
4.1. Forecast Model of the Regression Analysis
4.1.1. Establishment of Uniaxial Compressive Strength Regression Model
4.1.2. Establishment of Thermal Conductivity Regression Model
4.2. Comparison of Prediction Model Theory and Experimental Values
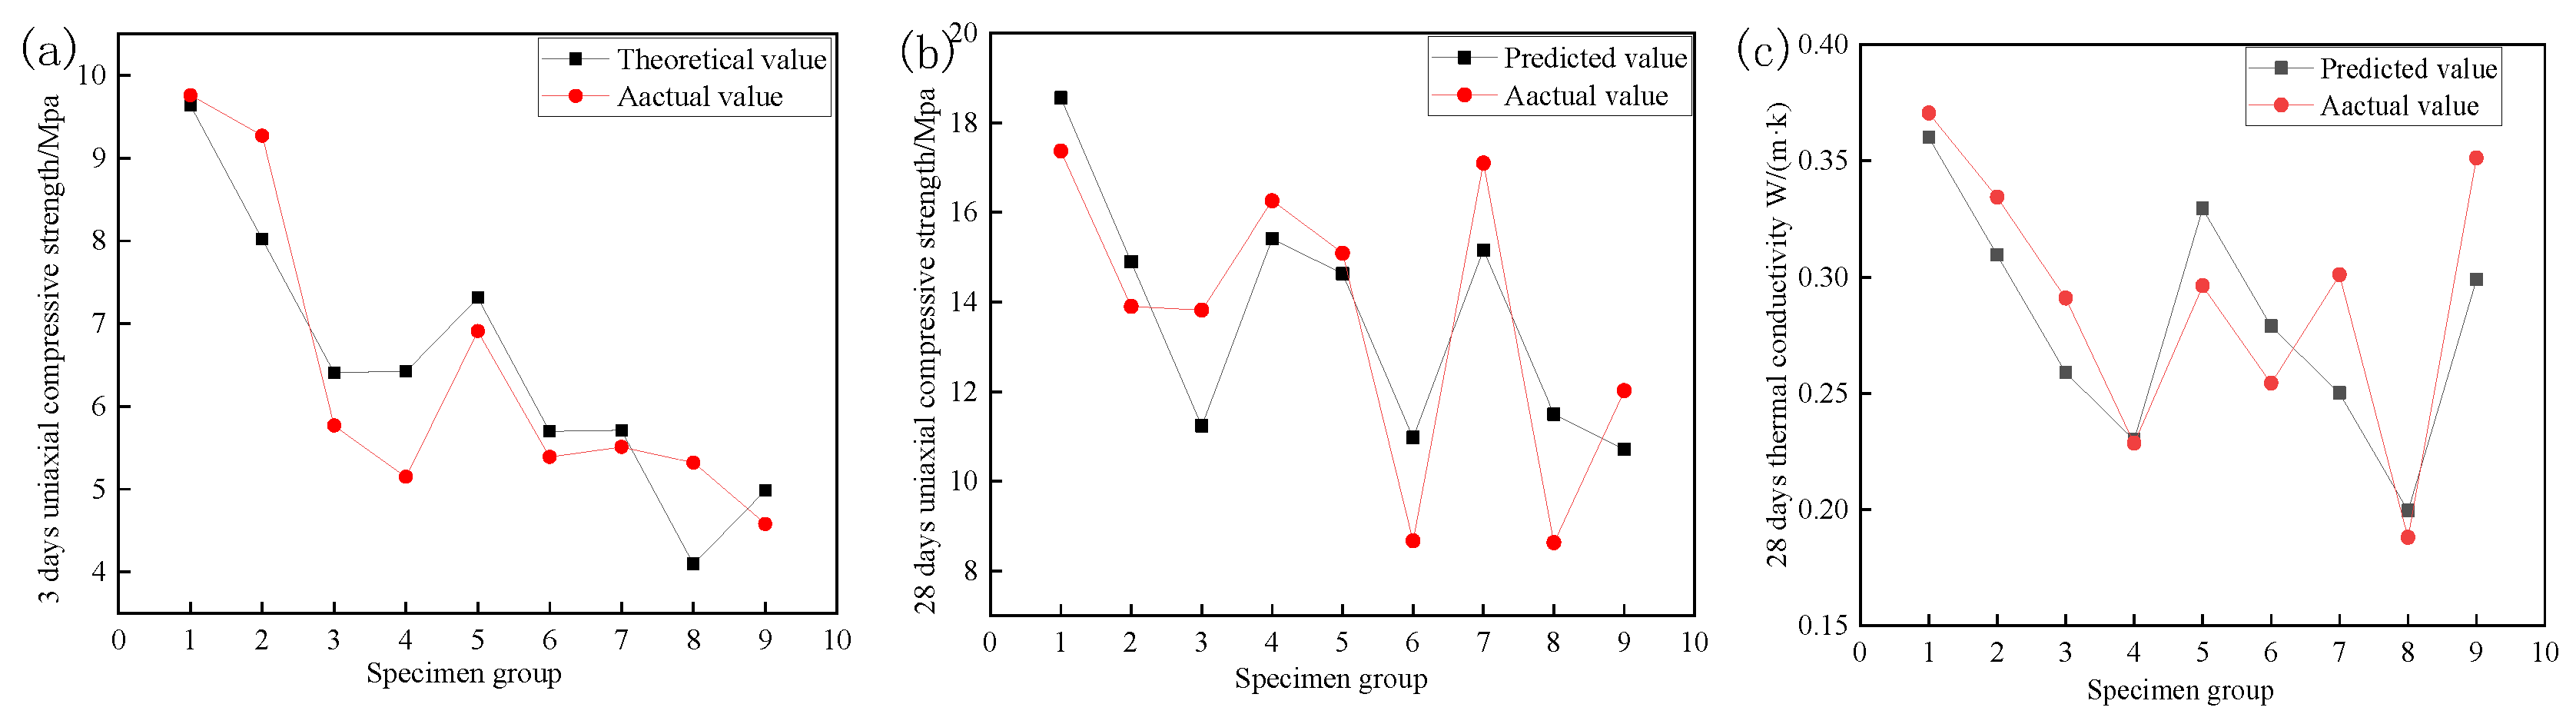
4.2.1. Comparative Analysis of Linear Model Prediction
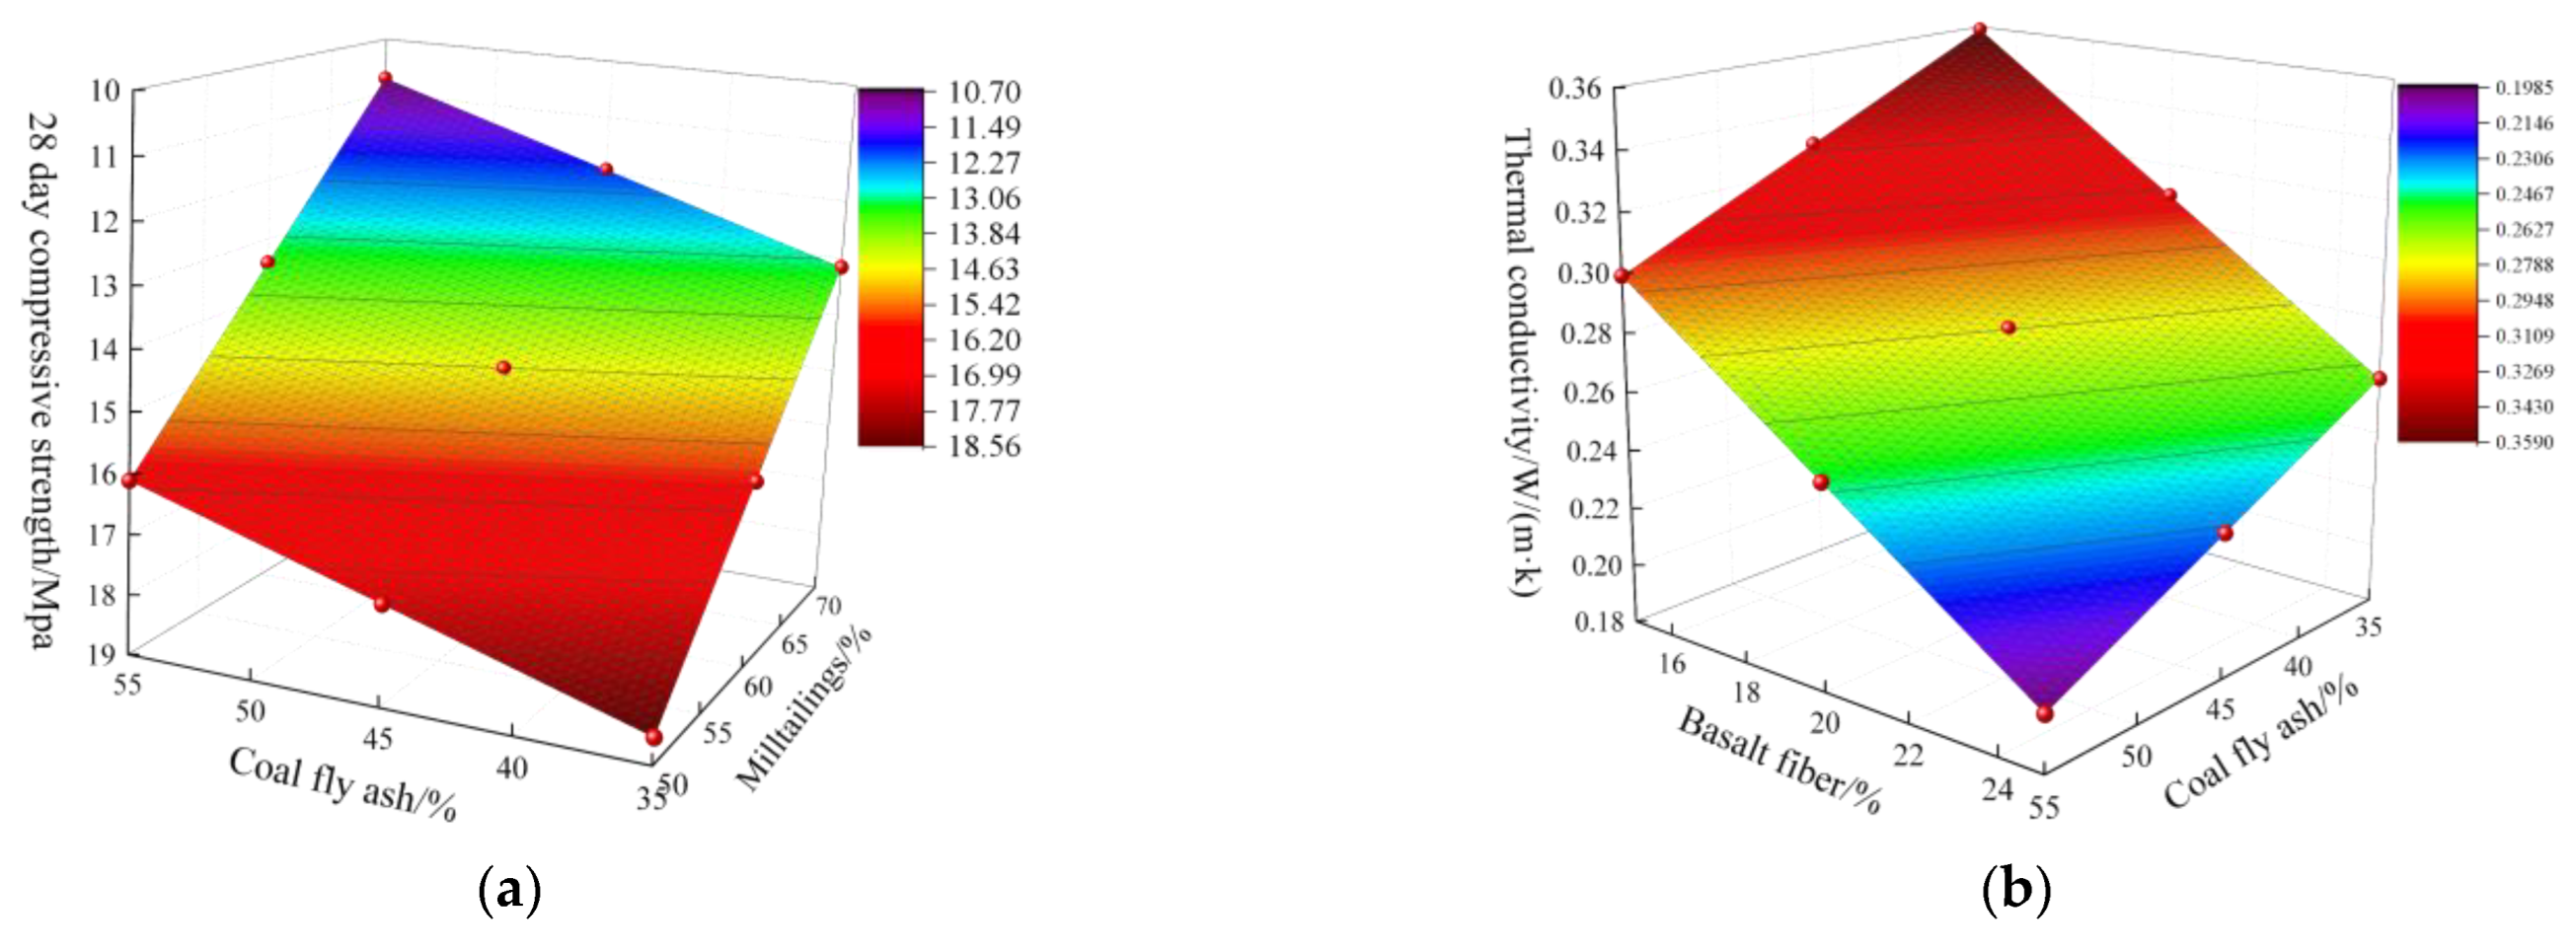
4.2.2. Comparative Analysis of Surface Model Prediction
4.3. Ratio Optimization Based on Regression Analysis
5. Engineering Application
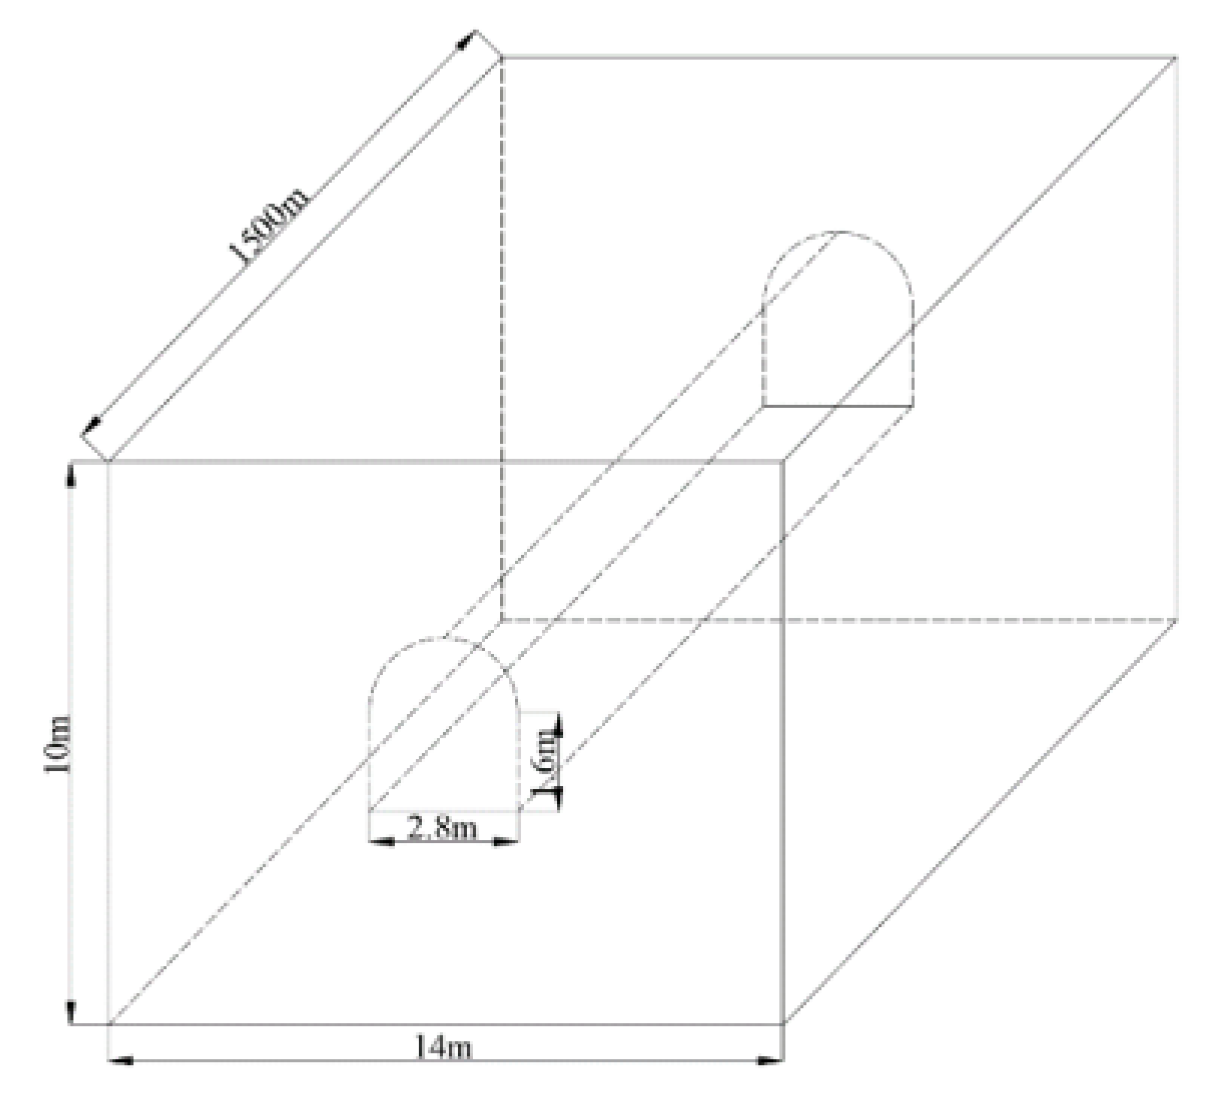
5.1. Overview of Mining Project
5.2. Optimum Thickness Analysis of Roadway
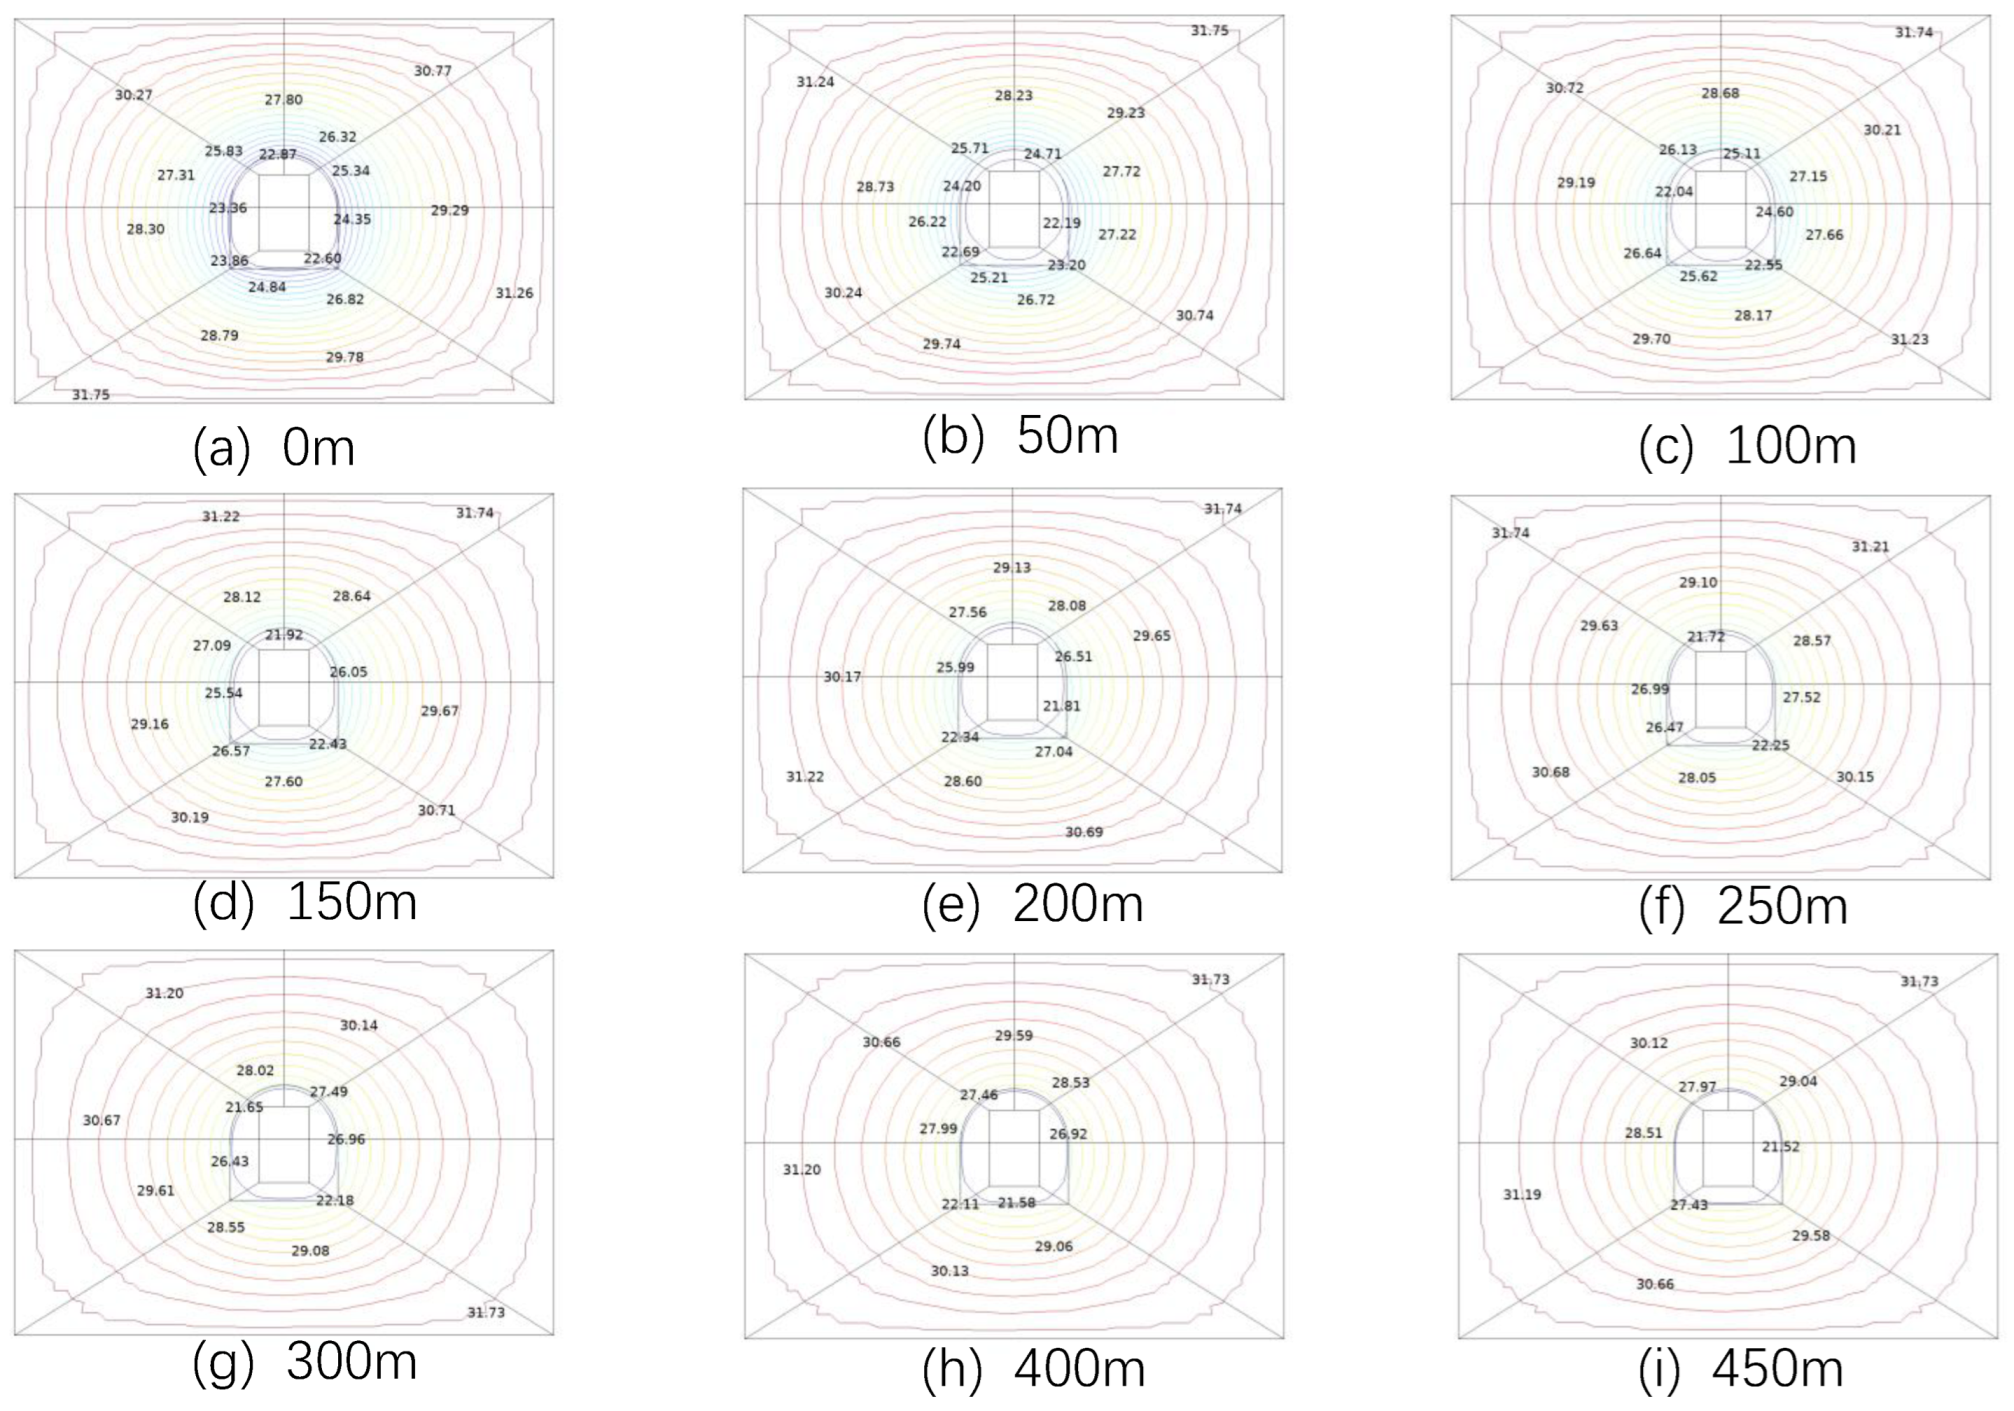
- (1)
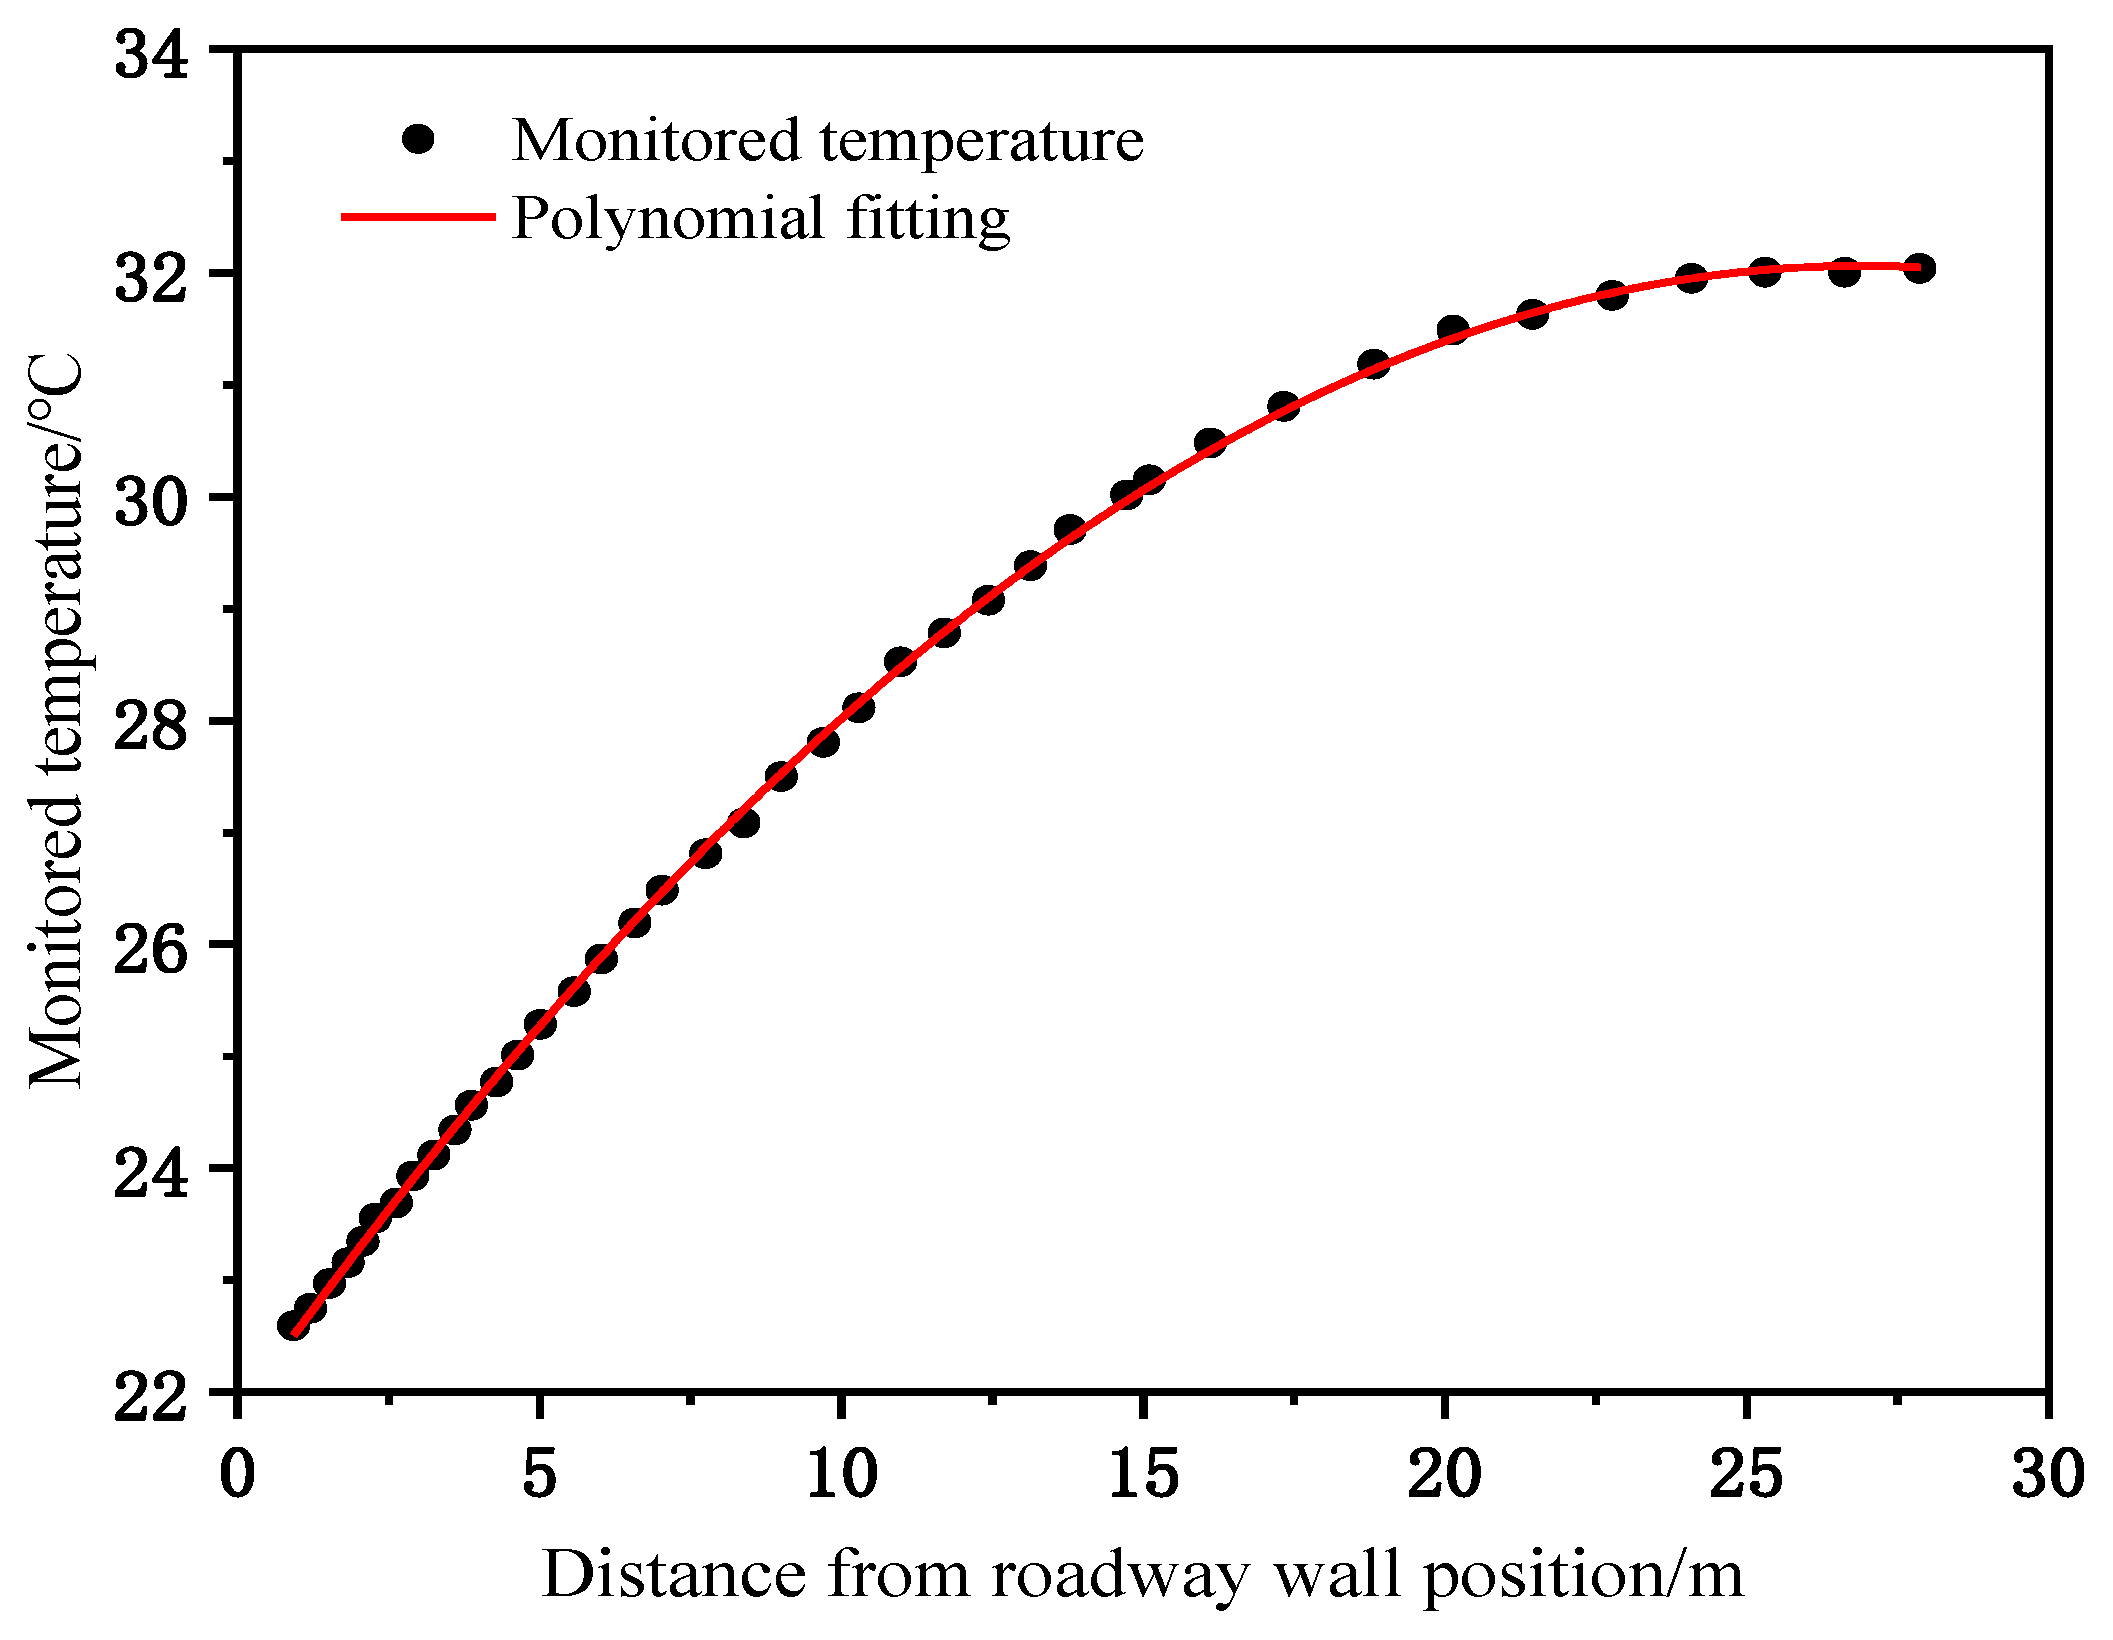
- From Figure 22a–i, it can be seen that the temperature of the surrounding rock of the roadway gradually increases from the wall of the roadway to the depth of the surrounding rock until it approaches and reaches the temperature of the original rock.
- (2)
- With the increase in the thickness of the insulation layer, the temperature difference between the inside and outside of the roadway gradually increases, indicating that the increase in the thickness has an obvious cooling effect.
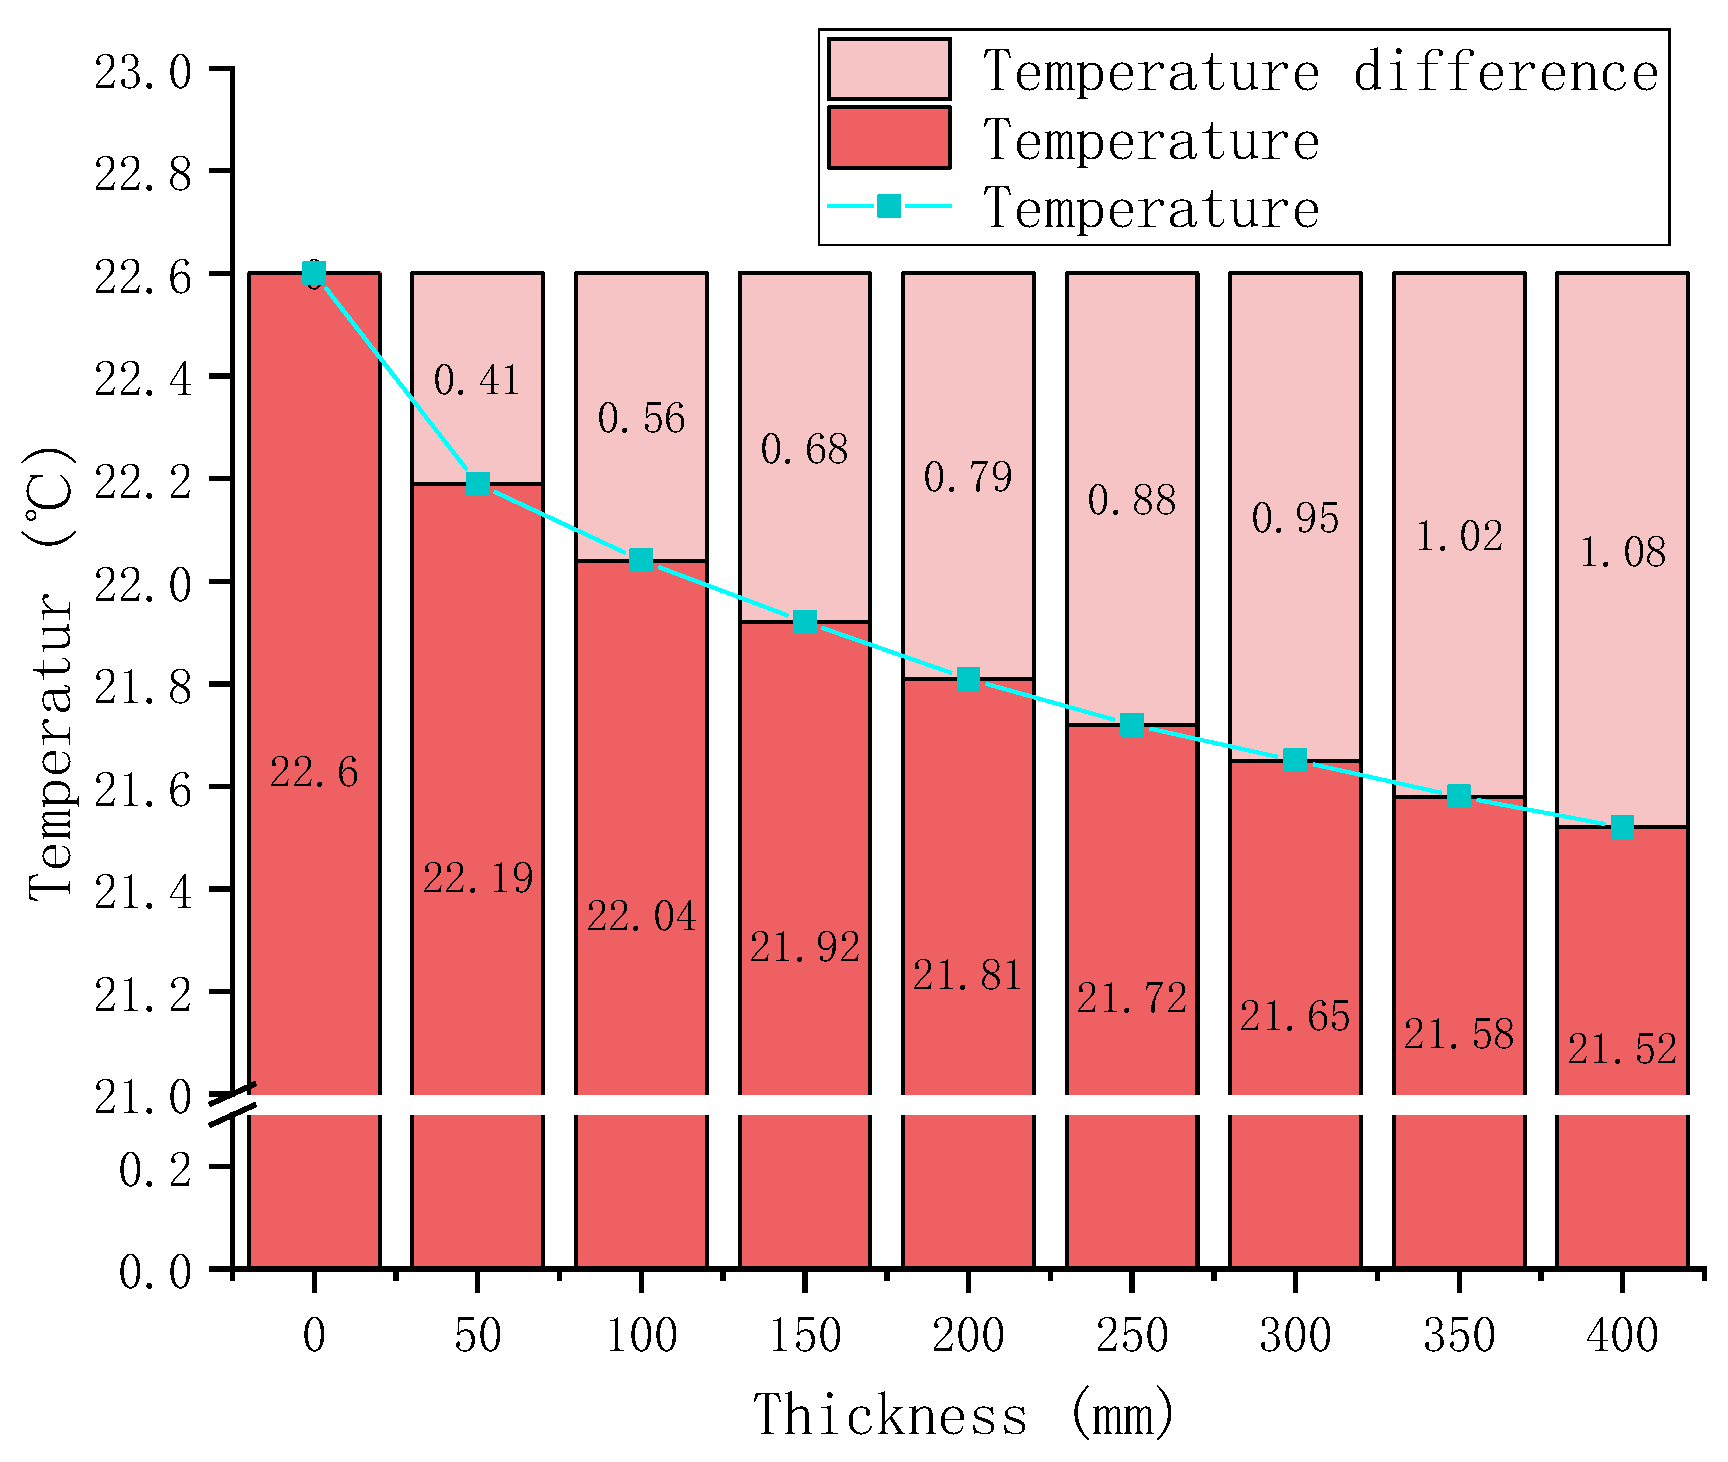
- (3)
- With the continuous increase in the thickness of the heat insulation layer in the roadway for every 50 mm increase, the temperature in the roadway decreases from 0.41 °C to 0.06 °C, and the decrease becomes smaller and smaller. Figure 23 shows the change of the center temperature of the roadway with the thickness of the shotcrete material. Considering the economic cost, the optimum thickness of the thermal insulation layer is 150 mm for the A2B1C3 material.
5.3. Actual Simulation Analysis of Mine
5.3.1. Model Establishment and Simulation Scheme
5.3.2. Analysis of Mining Engineering Simulation Results
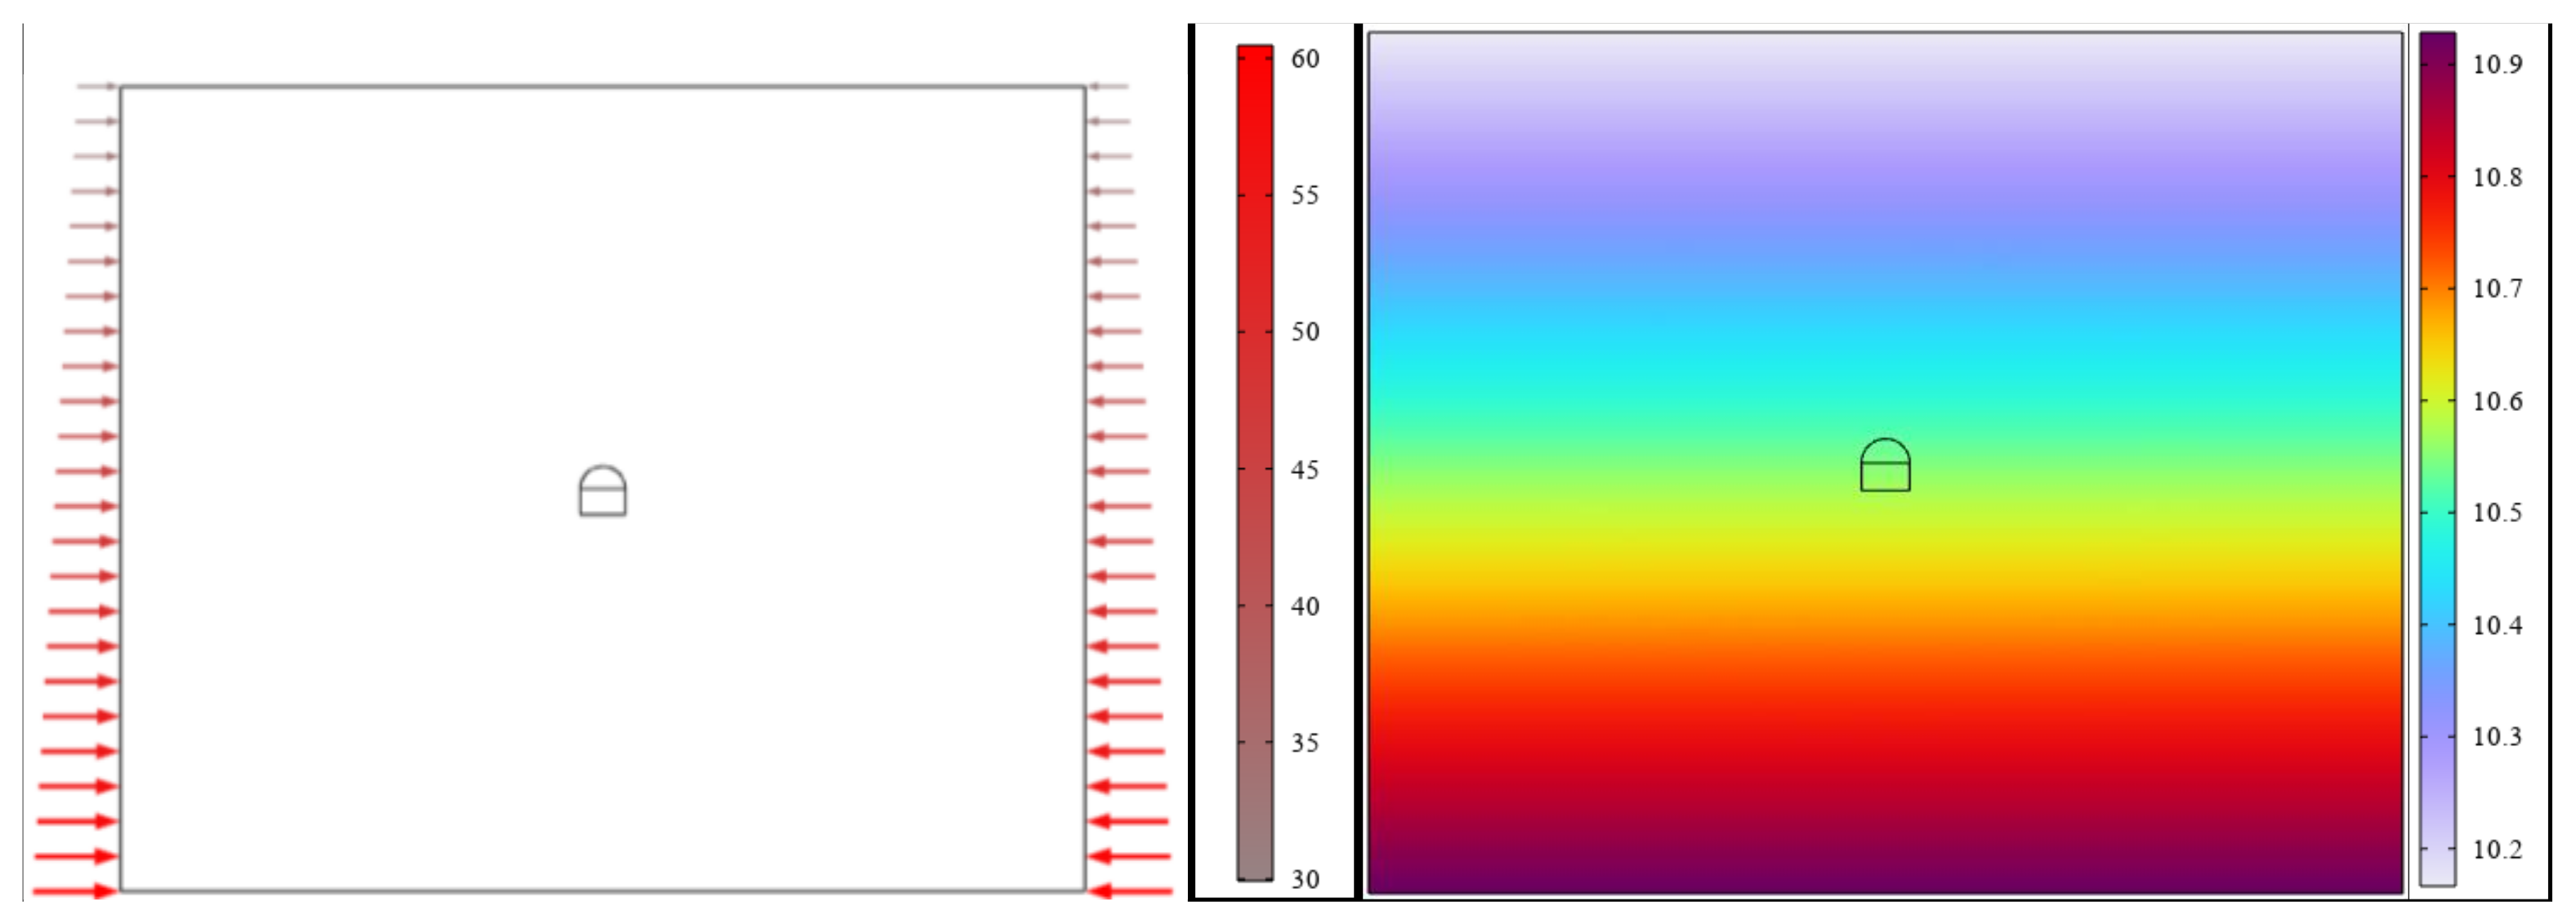
- (1)
- The initial equilibrium of the model
- (2)
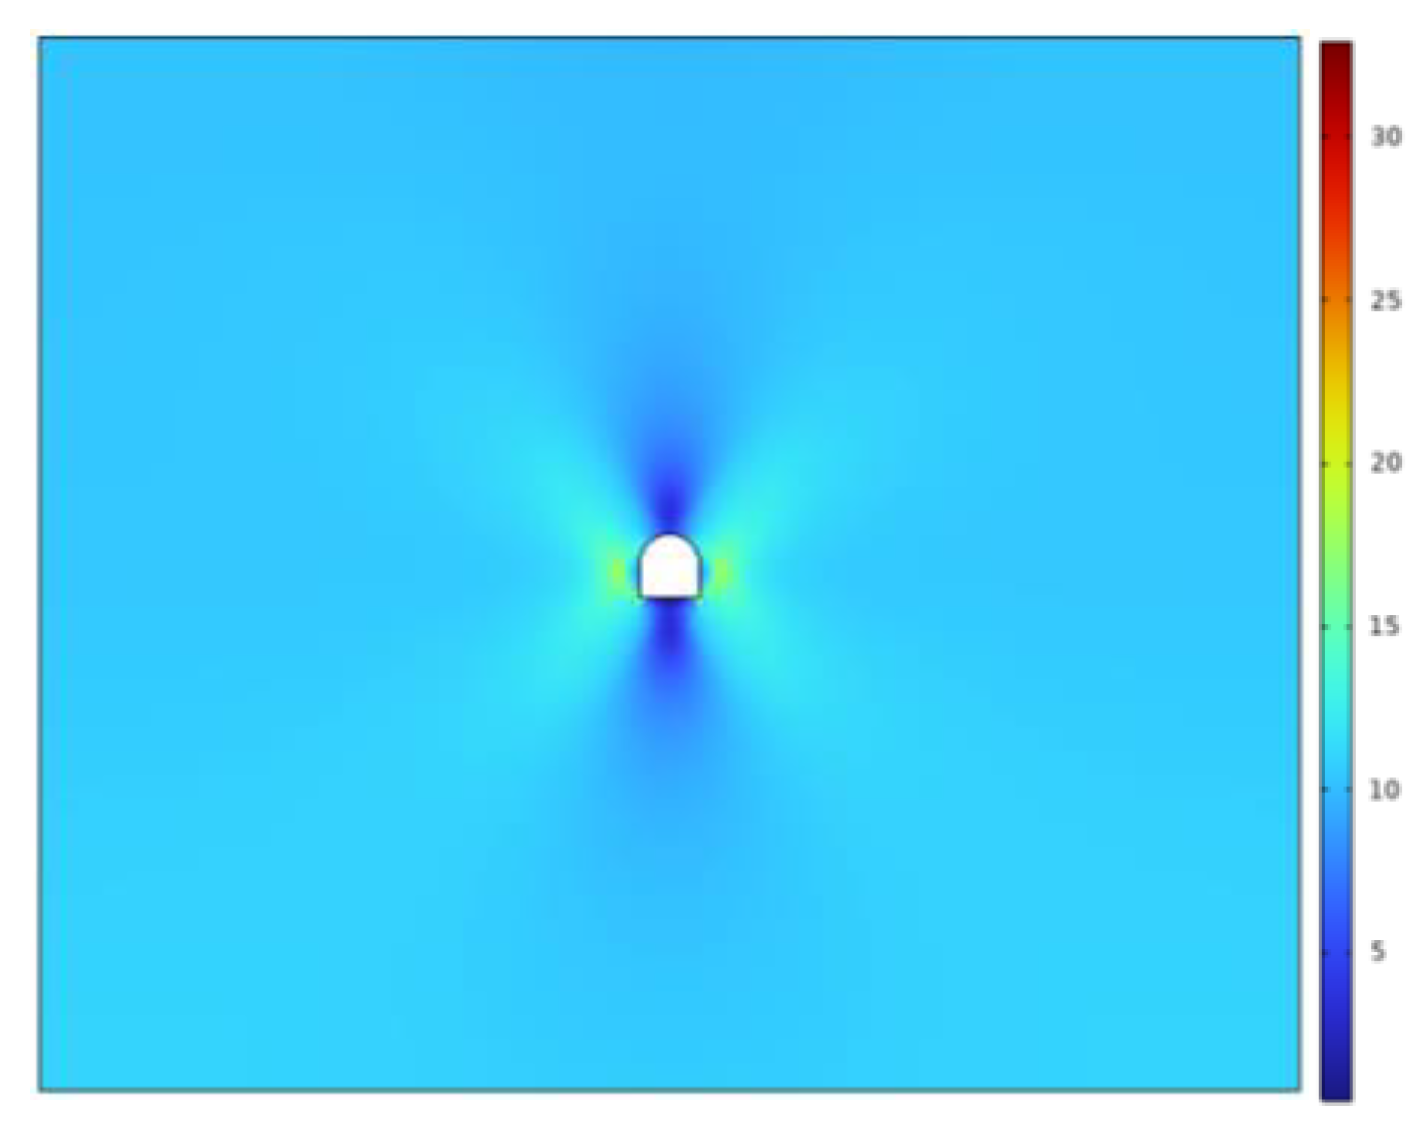
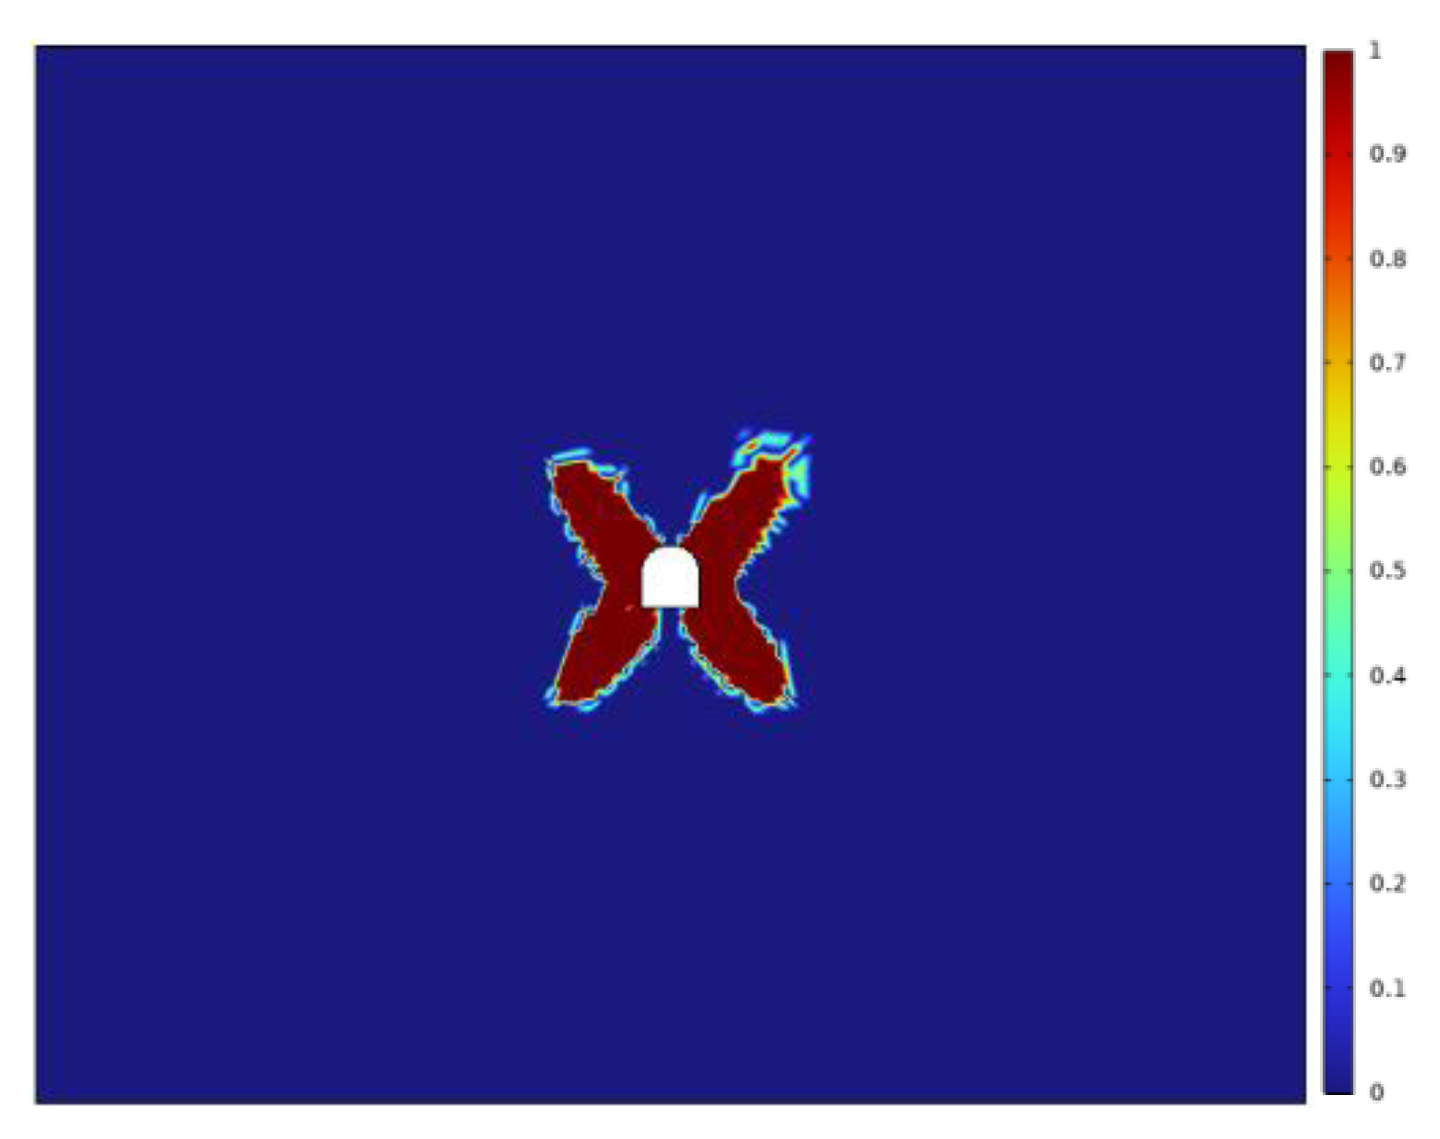
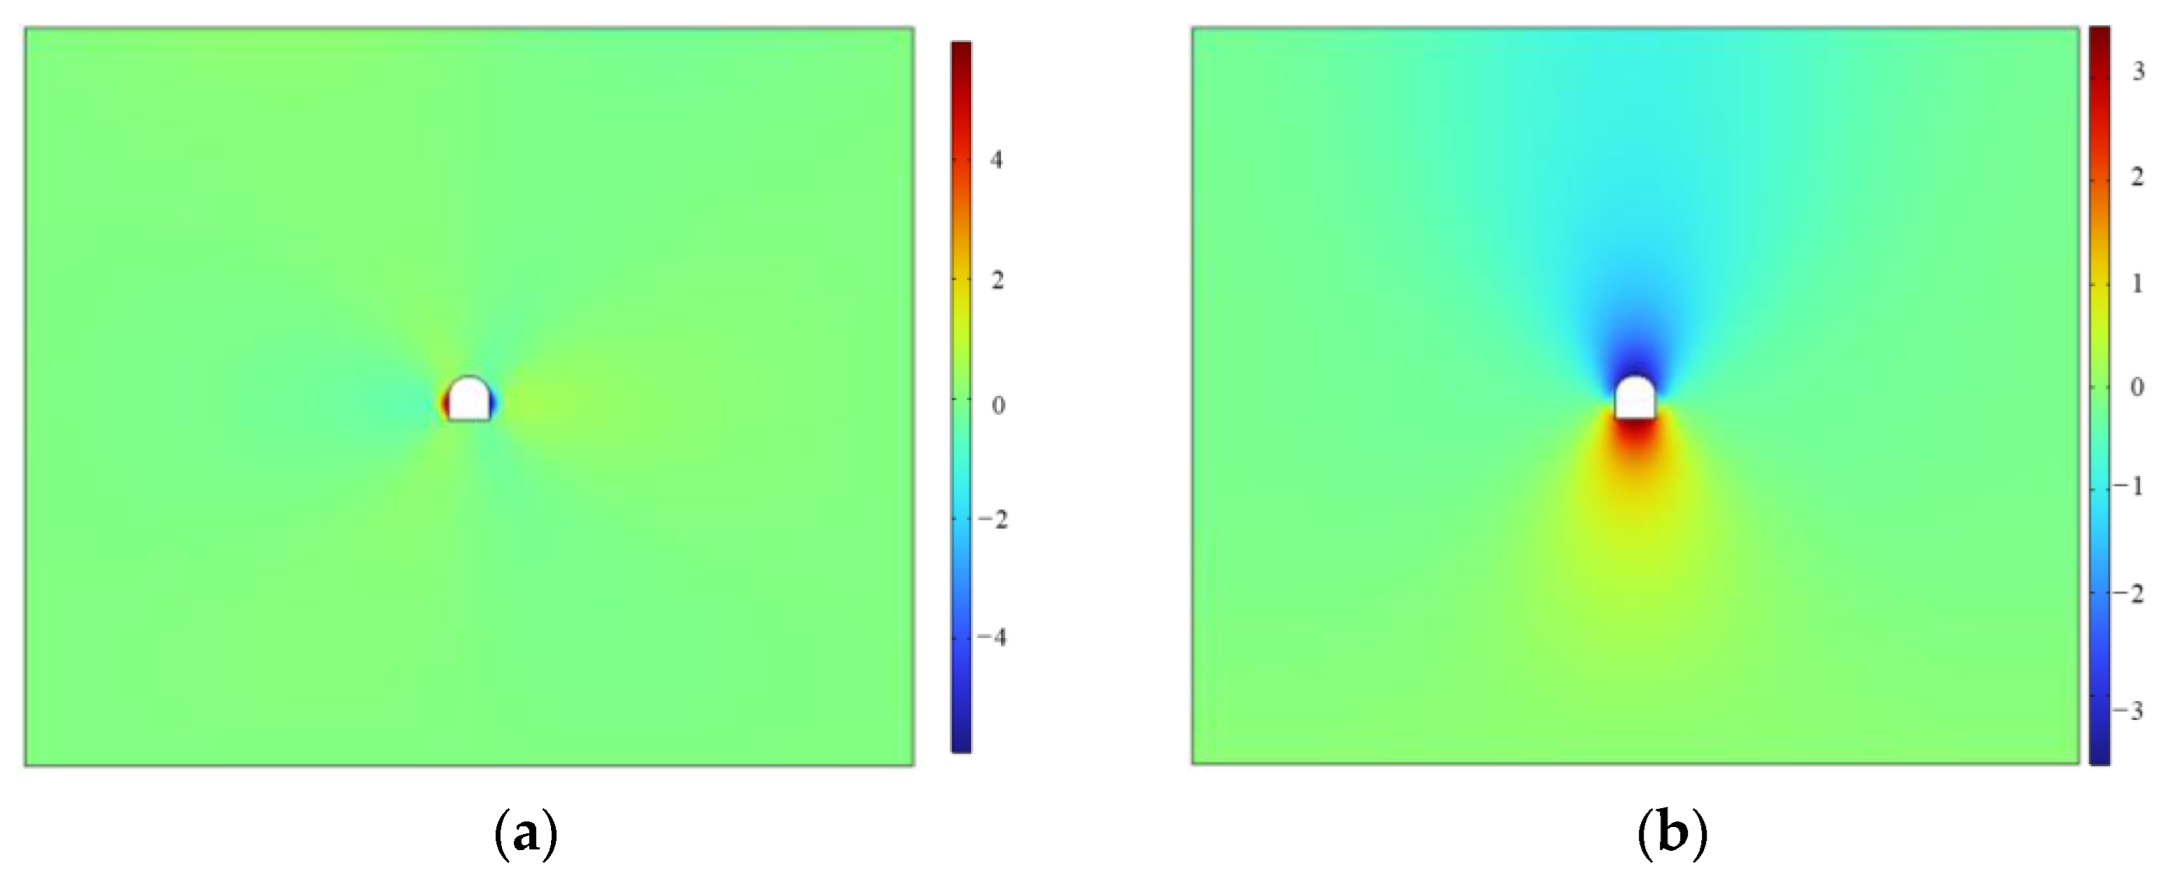
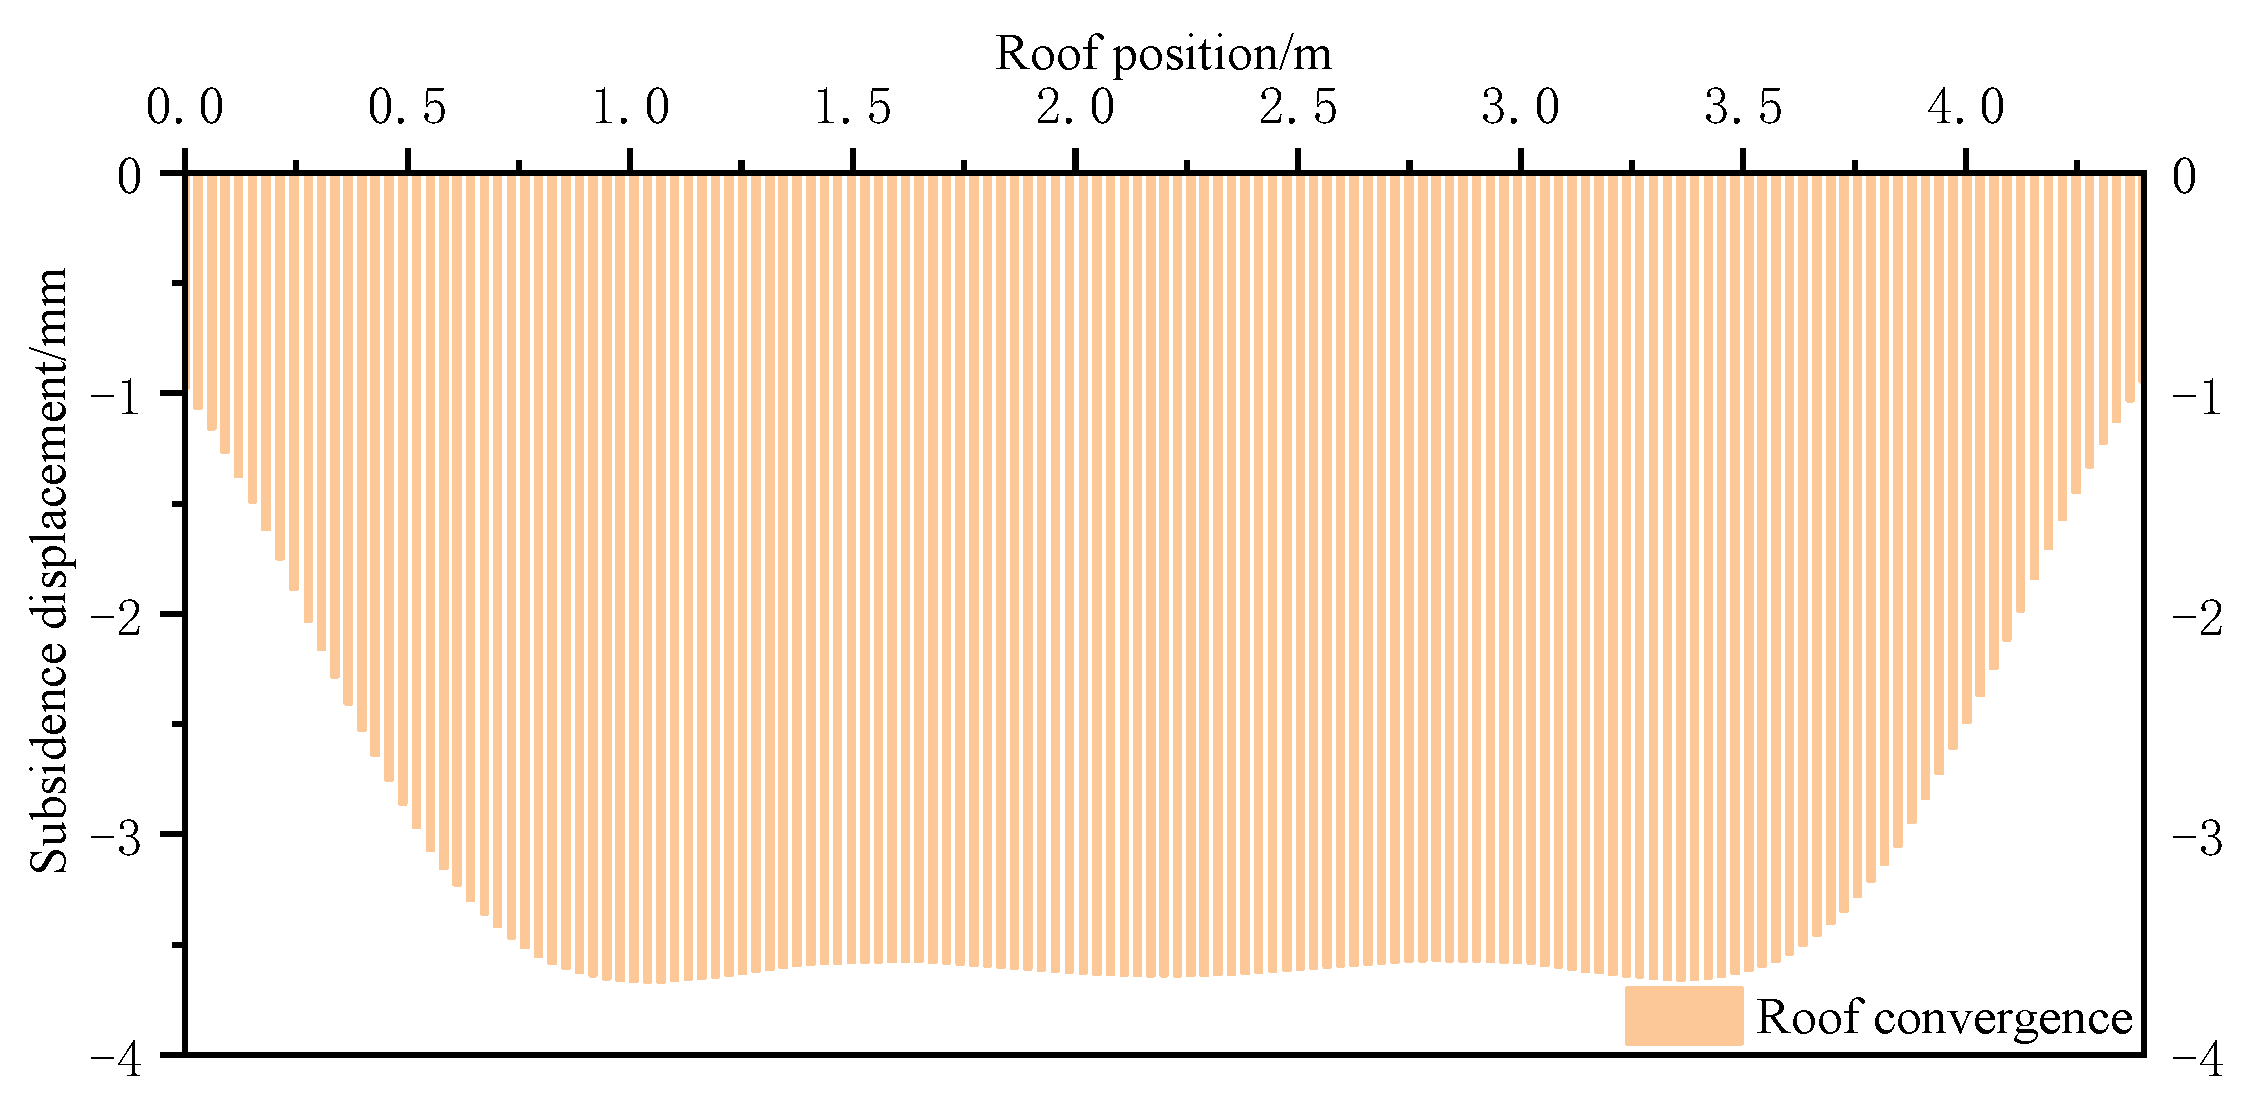
- Roadway stability analysis
- (3)
- Analysis of temperature field around roadway
5.4. Applications in the Field
5.4.1. Spraying Process
- (1)
- The shotcrete workers first check the viscosity of the slurry transported from the well to determine the application of the shotcrete material.
- (2)
- With the material conveying pipeline, the nozzle is connected to the wall of the sprayed roadway, and a small area of test spraying is carried out. According to the test results and the relevant operating procedures, the pressure of the shotcrete machine and the distance between the working face are judged. After the slurry material pipeline is laid, the pipeline ventilation test is first carried out to ensure that the pipeline is not blocked when the spraying starts.
- (3)
- The spraying workers manually add the spraying material to the hopper of the dry spraying machine and adjust the hopper position. In order to ensure the continuity of the spraying operation, several workers are required to continuously feed the material.
- (4)
- The shotcreting operation is carried out by a sprayer holding a nozzle on the wall surface of the shotcrete roadway. During the shotcrete process, the water content of the shotcrete material is controlled by the worker at the nozzle position.
- (5)
- According to the actual operation experience of the mine and the performance of the thermal insulation mortar, the first 50 mm thick layer of the roadway is sprayed. After the initial spray mortar layer is finalized, the surface of the spray layer is cleaned to ensure its smoothness. According to the ratio of the preparation of the mortar spray for the double spray, the double spray thickness is 100 mm.
- (6)
- After the final setting of the compound spray slurry, the spray slurry is moisturized by spraying to ensure that the spray slurry can be cured under better conditions. The degree of humidification of the specific roadway wall is adjusted according to the actual situation of the mine.
5.4.2. Effect Analysis
6. Generalization
6.1. Conclusions
- (1)
- According to the analysis results of the orthogonal test, the influence degree of each component on the 28-day uniaxial compressive strength was: tailings content > coal fly ash content > basalt fiber content; the influence degree of each component on the 28-day elastic modulus was: tailings content > basalt fiber content > coal fly ash content; the influence degree of each component on the 28-day apparent density was: basalt fiber content > coal fly ash content > tailings content; the influence degree of each component on the 28-day thermal conductivity was: basalt fiber content > coal fly ash content > tailings content.
- (2)
- The regression analysis showed that the most suitable regression models for 3-day uniaxial compressive strength, 28-day uniaxial compressive strength, and 28-day thermal conductivity were P3 = 21.456 − 0.1546x − 0.078y − 0.167z; P28 = 39.207 − 0.122x − 0.27y − 0.192z; and T28 = 0.614 − 0.003x − 0.01z. The theoretical value of the prediction model was close to the actual value, which proves that the prediction model has good accuracy.
- (3)
- Considering the uniaxial compressive strength, apparent density, and thermal conductivity of mine thermal insulation mortar, the optimal thermal insulation material in nine kinds of thermal insulation mortar was A2B1C3, that is, 45% fly ash, 50% tailings, and 25% basalt fiber (the percentage of the total mass of fly ash and cement). The compressive strength of the material was 16.26 MPa. The thermal conductivity was 0.228561 W/(m·k), and the apparent density was 1544.00 kg/m3.
- (4)
- With the continuous increase in the thickness of the heat insulation layer in the roadway for every 50 mm increase, the temperature reduction range at the center of the roadway (750 m at the roadway with a length of 1500 m) was 0.41 °C to 0.06 °C, and the temperature reduction at the center of the roadway decreased with the increase in the thickness of the shotcrete. The optimum thickness of the heat insulation layer of A2B1C3 was 150 mm.
- (5)
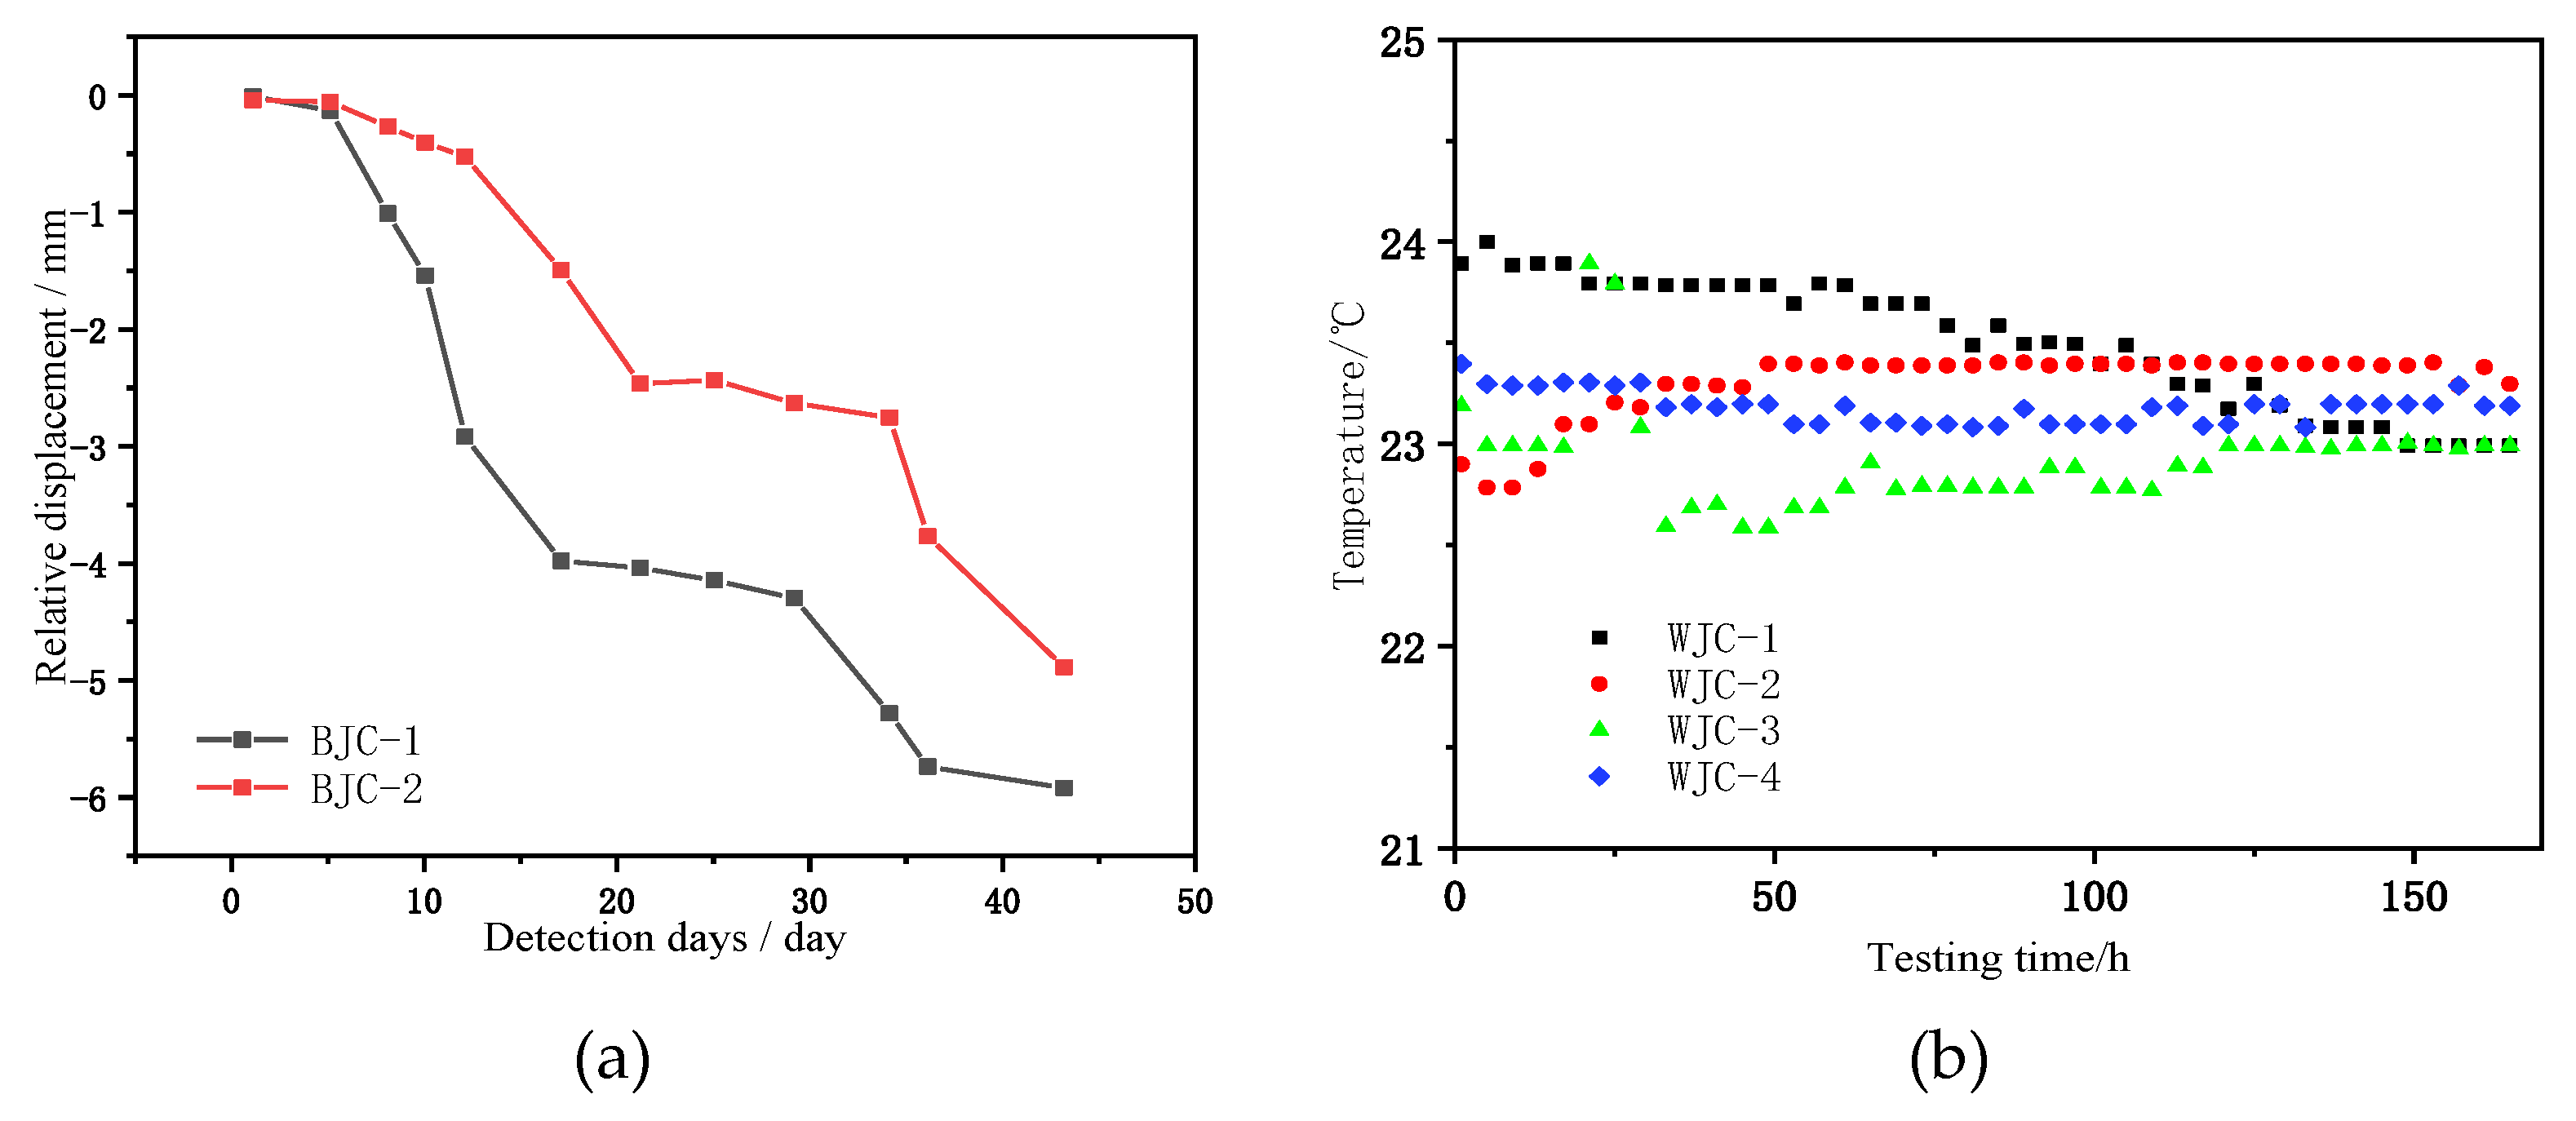
- In the mine field test, it was concluded that when the comprehensive optimal thermal insulation material A2B1C3 was sprayed with a 150 mm thickness, the simulation results showed that the deformation value of the roadway after shotcrete support was stable at the millimeter level deformation, and the overall displacement of the roadway did not change greatly. Therefore, it can be concluded that the overall state after the shotcrete was relatively stable. The temperature in the roadway was stable at the airflow temperature, and the thermal insulation material maintained the temperature stability inside the roadway and achieved the expected thermal insulation effect. That is to say, the mine solid waste insulation material meets the support requirements and has a good thermal insulation effect.
6.2. Prospects
- (1)
- The spray insulation material is not only convenient to transport; the actual rebound of the material should also be considered. At a later stage, further research on the rebound performance and the economy of the material should be carried out.
- (2)
- This experiment only explores the relatively optimal ratio; the more detailed optimal ratio in this range can be further explored.
- (3)
- In this experiment, the mechanical and thermal parameters of the material were only tested for 28 days, and the field test also had certain limitations. Further accurate experimental parameter tests were needed to determine its applicability.
- (4)
- It is necessary to carry out experiments in different mine environments to further verify the universality of the thermal insulation material in practical engineering and meet the thermal insulation needs of more mines.
Author Contributions
Funding
Acknowledgments
Conflicts of Interest
References
- Zhao, Y.; Yang, T.; Liu, H.; Wang, S.; Zhang, P.; Jia, P.; Wang, X. A Path for Evaluating the Mechanical Response of Rock Masses Based on Deep Mining-Induced Microseismic Data: A Case Study. Tunn. Undergr. Space Technol. 2021, 115, 104025. [Google Scholar] [CrossRef]
- de Brito, J.; Kurda, R. The Past and Future of Sustainable Concrete: A Critical Review and New Strategies on Cement-Based Materials. J. Clean. Prod. 2021, 281, 123558. [Google Scholar] [CrossRef]
- Adiguzel, D.; Tuylu, S.; Eker, H. Utilization of Tailings in Concrete Products: A Review. Constr. Build. Mater. 2022, 360, 129574. [Google Scholar] [CrossRef]
- Cai, M.; Duo, J.; Chen, X.; Mao, J.; Tang, C.; Liu, Z.; Ji, H.; Ren, F.; Guo, Q.; Li, P. Research on the co-exploitation strategy of deep mineral and geothermal resources. China Eng. Sci. 2021, 23, 43–51. [Google Scholar] [CrossRef]
- Galan, I.; Baldermann, A.; Kusterle, W.; Dietzel, M.; Mittermayr, F. Durability of Shotcrete for Underground Support—Review and Update. Constr. Build. Mater. 2019, 202, 465–493. [Google Scholar] [CrossRef]
- Ikumi, T.; Salvador, R.P.; Aguado, A. Mix Proportioning of Sprayed Concrete: A Systematic Literature Review. Tunn. Undergr. Space Technol. 2022, 124, 104456. [Google Scholar] [CrossRef]
- Jones, H.; Boger, D.V. Sustainability and Waste Management in the Resource Industries. Ind. Eng. Chem. Res. 2012, 51, 10057–10065. [Google Scholar] [CrossRef]
- Jing, M.; Ao, H. Hazards of mine solid waste and its environmental protection treatment technology. Resour. Conserv. Environ. Prot. 2018, 146. [Google Scholar] [CrossRef]
- Garcia-Troncoso, N.; Baykara, H.; Cornejo, M.H.; Riofrio, A.; Tinoco-Hidalgo, M.; Flores-Rada, J. Comparative Mechanical Properties of Conventional Concrete Mixture and Concrete Incorporating Mining Tailings Sands. Case Stud. Constr. Mater. 2022, 16, e01031. [Google Scholar] [CrossRef]
- Zhao, S.; Fan, J.; Sun, W. Utilization of Iron Ore Tailings as Fine Aggregate in Ultra-High Performance Concrete. Constr. Build. Mater. 2014, 50, 540–548. [Google Scholar] [CrossRef]
- Chen, S.-C.; Gao, M.-Y.; Lin, W.-T.; Liang, J.-F.; Li, D.-W. Effects of Incorporating Large Quantities of Copper Tailings with Various Particle Sizes on the Strength and Pore Structure of Cement-Based Materials. Constr. Build. Mater. 2022, 329, 127150. [Google Scholar] [CrossRef]
- Nayak, D.K.; Abhilash, P.P.; Singh, R.; Kumar, R.; Kumar, V. Fly Ash for Sustainable Construction: A Review of Fly Ash Concrete and Its Beneficial Use Case Studies. Clean. Mater. 2022, 6, 100143. [Google Scholar] [CrossRef]
- Reddy, P.V.R.K.; Ravi Prasad, D. A Study on Workability, Strength and Microstructure Characteristics of Graphene Oxide and Fly Ash Based Concrete. Mater. Today Proc. 2022, 62, 2919–2925. [Google Scholar] [CrossRef]
- Wang, Z. Influence of Fly Ash on the Mechanical Properties of Frame Concrete. Sustain. Cities Soc. 2011, 1, 164–169. [Google Scholar] [CrossRef]
- Golewski, G.L. Effect of Curing Time on the Fracture Toughness of Fly Ash Concrete Composites. Compos. Struct. 2018, 185, 105–112. [Google Scholar] [CrossRef]
- Topçu, İ.B.; Canbaz, M. Effect of Different Fibers on the Mechanical Properties of Concrete Containing Fly Ash. Constr. Build. Mater. 2007, 21, 1486–1491. [Google Scholar] [CrossRef]
- Akid, A.S.M.; Hossain, S.; Munshi, M.I.U.; Elahi, M.M.A.; Sobuz, M.H.R.; Tam, V.W.Y.; Islam, M.S. Assessing the Influence of Fly Ash and Polypropylene Fiber on Fresh, Mechanical and Durability Properties of Concrete. J. King Saud. Univ.—Eng. Sci. 2021, S101836392100088X. [Google Scholar] [CrossRef]
- Zhang, Y.; Wan, Z. Study on Unsteady Temperature Field and Heat Insulation Cooling Mechanism of Surrounding Rock in High Ground Temperature Roadway. Ph.D. Thesis, China University of Mining and Technology, Xuzhou, China, 2013. [Google Scholar]
- Wu, D.; Wan, Z. Experimental Study on the Mechanism of Shotcrete Thermal Insulation in High Geothermal Roadway. Master’s Thesis, China University of Mining and Technology, Xuzhou, China, 2019. [Google Scholar]
- Li, Z.; Xu, Y.; Jia, M.; Liu, H.; Pan, W.; Deng, Y. Numerical simulation of heat damage control by synergistic mining of geothermal energy in deep mine strata. J. Cent. South Univ. (Nat. Sci. Ed.) 2021, 52, 671–680. [Google Scholar]
- Feng, J.; Zhang, C.; Feng, J. Carbon Fiber Reinforced Carbon Aerogel Composites for Thermal Insulation Prepared by Soft Reinforcement. Mater. Lett. 2012, 67, 266–268. [Google Scholar] [CrossRef]
- Rojas, C.; Cea, M.; Iriarte, A.; Valdés, G.; Navia, R.; Cárdenas-R, J.P. Thermal Insulation Materials Based on Agricultural Residual Wheat Straw and Corn Husk Biomass, for Application in Sustainable Buildings. Sustain. Mater. Technol. 2019, 20, e00102. [Google Scholar] [CrossRef]
- Chen, L.; Meng, X.; Liu, G.; Zhao, J.; Liu, Z. Investigation of a New Type of Thermal Insulation Shotcrete with Silicone Rubber Tubes (SSRT). Constr. Build. Mater. 2022, 338, 127631. [Google Scholar] [CrossRef]
- Yao, R.; Zhang, Y. Development of thermal insulation material for roadway in deep coal mine. Mater. Sci. Eng. 2002, 20, 572–575. [Google Scholar] [CrossRef]
- Song, Q.; Li, G.; Ma, Y.; Li, J.; Xing, H.; Li, H. Experimental study on the thermal insulation performance of fly ash foam glass. Archit. Sci. 2014, 30, 63–66, 90. [Google Scholar]
- Pang, J.; Yao, W. Experimental study on new thermal insulation materials for high temperature roadway in deep coal mine. Min. Res. Dev. 2016, 36, 76–80. [Google Scholar]
- Gong, C.; Ni, X. Research and Application of Straw Fly Ash Lightweight Board. Master’s Thesis, Anhui University of Science and Technology, Huainan, China, 2016. [Google Scholar]
- Zhang, D.; Gao, J. Performance Optimization and Application Research of Expanded Vitrified Microsphere Insulation Board. Master’s Thesis, North China University of Technology, Beijing, China, 2017. [Google Scholar]
- Deng, H.; Tian, X.; Xu, Y. Experimental study on the performance of thermal insulation materials for surrounding rock in deep mining. Non-Ferr. Met. Eng. 2018, 8, 103–107, 116. [Google Scholar]
- Jiang, Y.; Xin, S.; Zhang, L.; Zhang, Z.; Guo, J.; Hou, C.; Li, H. Comparative experimental study on the properties of three kinds of mining thermal insulation materials. Min. Res. Dev. 2020, 40, 85–88. [Google Scholar]
- Shi, X.; Zhang, R.; Ho, S.; Li, Z.; Cao, W.; Cheng, X. Preparation and thermal insulation properties of glass fiber reinforced SiO2 aerogel composites. Silic. J. 2016, 44, 129–135. [Google Scholar]
- Ralph, C.; Lemoine, P.; Boyd, A.; Archer, E.; McIlhagger, A. The Effect of Fibre Sizing on the Modification of Basalt Fibre Surface in Preparation for Bonding to Polypropylene. Appl. Surf. Sci. 2019, 475, 435–445. [Google Scholar] [CrossRef]
- Zheng, Y.; Zhang, Y.; Zhuo, J.; Zhang, Y.; Wan, C. A Review of the Mechanical Properties and Durability of Basalt Fiber-Reinforced Concrete. Constr. Build. Mater. 2022, 359, 129360. [Google Scholar] [CrossRef]
- Pehlivanlı, Z.O.; Uzun, İ.; Demir, İ. Mechanical and Microstructural Features of Autoclaved Aerated Concrete Reinforced with Autoclaved Polypropylene, Carbon, Basalt and Glass Fiber. Constr. Build. Mater. 2015, 96, 428–433. [Google Scholar] [CrossRef]
- Hou, C.; Xin, S.; Zhang, L.; Liu, S.; Zhang, X. Foundation Research on Physicochemical Properties of Mine Insulation Materials. Coatings 2020, 10, 355. [Google Scholar] [CrossRef] [Green Version]
- Li, X.; Yu, T.; Park, S.-J.; Kim, Y.-H. Reinforcing Effects of Gypsum Composite with Basalt Fiber and Diatomite for Improvement of High-Temperature Endurance. Constr. Build. Mater. 2022, 325, 126762. [Google Scholar] [CrossRef]
- Li, Y.; Zhang, J.; He, Y.; Huang, G.; Li, J.; Niu, Z.; Gao, B. A Review on Durability of Basalt Fiber Reinforced Concrete. Compos. Sci. Technol. 2022, 225, 109519. [Google Scholar] [CrossRef]
- Meyyappan, P.L.; Jemimah Carmichael, M. Studies on Strength Properties of Basalt Fibre Reinforced Concrete. Mater. Today Proc. 2021, 43, 2105–2108. [Google Scholar] [CrossRef]
- GB/T 50107-2010; Standard for inspection and evaluation of concrete strength. Ministry of Housing and Urban-Rural Development: Beijing, China, 2010.
- BS EN 206-1:2000; Concrete, Specification, Performance, Production and Conformity. British Standards Institution: London, UK, 2000.
- Egorova, A.A.; Rybak, J.; Stefaniuk, D.; Zajączkowski, P. Basic Aspects of Deep Soil Mixing Technology Control. IOP Conf. Ser. Mater. Sci. Eng. 2017, 245, 022019. [Google Scholar] [CrossRef]
- Cheng, L.; Chen, K.; Qiu, S.; Chen, Y. Numerical simulation and distribution law of thermal environment in tunneling roadway based on Fluent. Ind. Saf. Environ. Prot. 2022, 48, 1–5. [Google Scholar]


| Scholar | Material | Thermal Conductivity (W/(m·K)) | Compressive Strength (MPa) |
|---|---|---|---|
| Feng [21] | Polyacrylonitrile fiber, aerogel | 0.073 | - |
| Carlos Rojas [22] | Wheat straw, corn fiber | 0.04 | - |
| Chen Liajun [23] | Perlite, clay | 0.185 | - |
| Yao Rong [24] | Coal fly ash, wollastonite, cement, perlite | 0.17 | 1.63 |
| Song Qiang [25] | Coal fly ash, foaming agent, glass | 0.07 | - |
| Pang Jianyong [26] | Ceramsite, vitrified beads, cement, coal fly ash | 0.2082 | 18 |
| Gong Chao [27] | Cement, coal fly ash, straw | 0.15 | - |
| Zhang Du [28] | Cement, vitrified beads, fiber stone pile | 0.0589 | 0.44 |
| Deng Hongwei [29] | Tailings, cement, foaming agent, vitrified beads | 0.273 | - |
| Wu Dong [19] | Cement, coal fly ash, vitrified beads, and sand | 0.119 | 11.7 |
| Jiang Yewei [30] | Basalt fiber, glass fiber, vitrified beads, cement, and sand | 0.1323 | 10.98 |
| Component | CaO | SiO2 | Al2O3 | MgO | Fe2O3 | K2O | Na2O | Miscellaneous |
|---|---|---|---|---|---|---|---|---|
| Cement | 49.1 | 20.5 | 10.1 | 3.62 | 2.97 | 0.973 | - | 12.737 |
| Coal fly ash | 3.01 | 44.60 | - | 0.62 | 3.97 | 1.55 | - | 15.38 |
| Mill tailings | 2.93 | 66.50 | 14.60 | 0.50 | 1.63 | - | 2.26 | 11.58 |
| Item | Concrete Parameters |
|---|---|
| Maximum test force | 200 KN |
| Test force accuracy | Better than ±1% |
| Force value test range | 0.4%–100% of the maximum test force % |
| Displacement resolution | 0.01 mm |
| Test speed adjustment range | 0.005–500 mm/min |
| Instrument Project | Concrete Parameters |
|---|---|
| Measurement method | Heat flow meter method |
| Test specification | (0.001~2.000) W/(m·K); |
| Standard size of specimen | 300 mm × 300 mm × H (5~35) mm |
| Thermal conductivity measurement accuracy | ±3% |
| Temperature resolution | 0.01°C |
| Temperature control accuracy | 0.05 °C |
| Heat coefficient | 23.26 W/m2·mv |
| Factor | Coal Fly Ash A (%) | Mill Tailings B (%) | Basalt Fiber C (%) |
|---|---|---|---|
| 1 | 35 | 50 | 15 |
| 2 | 45 | 60 | 20 |
| 3 | 55 | 70 | 25 |
| Test Number | Horizontal Combination | Cement Powder | Coal Fly Ash | Mill Tailings | Basalt Fiber | Water Reducing Admixture | Water |
|---|---|---|---|---|---|---|---|
| 1 | A1B1C1 | 780 g | 420 g | 600 g | 180 g | 6 g | 495 g |
| 2 | A1B2C2 | 780g | 420 g | 720 g | 240 g | 6 g | 540 g |
| 3 | A1B3C3 | 780 g | 420 g | 840 g | 300 g | 6 g | 585 g |
| 4 | A2B1C3 | 660 g | 540 g | 600 g | 300 g | 6 g | 525 g |
| 5 | A2B2C1 | 660 g | 540 g | 720 g | 180 g | 6 g | 525 g |
| 6 | A2B3C2 | 660 g | 540 g | 840 g | 240 g | 6 g | 570 g |
| 7 | A3B1C2 | 540 g | 660 g | 600 g | 240 g | 6 g | 510 g |
| 8 | A3B2C3 | 540 g | 660 g | 720 g | 300 g | 6 g | 555 g |
| 9 | A3B3C1 | 540 g | 660 g | 840 g | 180 g | 6 g | 555 g |
| Test Number | Horizontal Combination | 3-Day Uniaxial Compressive Strength (MPa) | 7-Day Uniaxial Compressive Strength (MPa) | 28-Day Uniaxial Compressive Strength (MPa) | ||||||
|---|---|---|---|---|---|---|---|---|---|---|
| 1 | A1B1C1 | 10.22 | 11.19 | 7.86 | 11.07 | 9.53 | 9.74 | 17.54 | 17.42 | 17.13 |
| 2 | A1B2C2 | 9.78 | 11.21 | 6.80 | 8.63 | 8.71 | 8.74 | 13.68 | 14.70 | 13.30 |
| 3 | A1B3C3 | 6.52 | 6.13 | 4.64 | 7.17 | 6.13 | 8.12 | 14.76 | 12.39 | 14.29 |
| 4 | A2B1C3 | 6.79 | 5.27 | 3.36 | 9.57 | 7.06 | 8.25 | 15.90 | 15.48 | 17.38 |
| 5 | A2B2C1 | 6.96 | 7.03 | 6.72 | 8.70 | 8.15 | 6.67 | 18.03 | 14.21 | 13.00 |
| 6 | A2B3C2 | 4.85 | 5.74 | 5.57 | 7.45 | 7.73 | 6.79 | 8.50 | 9.48 | 8.03 |
| 7 | A3B1C2 | 5.93 | 4.89 | 5.69 | 7.40 | 7.17 | 7.12 | 16.60 | 18.05 | 16.64 |
| 8 | A3B2C3 | 5.69 | 5.28 | 4.96 | 6.44 | 5.36 | 5.77 | 10.91 | 8.282 | 6.705 |
| 9 | A3B3C1 | 4.60 | 4.47 | 4.66 | 6.05 | 6.98 | 7.19 | 12.21 | 11.28 | 12.55 |
| Test Number | Horizontal Combination | 3-Day Uniaxial Compressive Strength (MPa) | 7-Day Uniaxial Compressive Strength (MPa) | 28-Day Uniaxial Compressive Strength (MPa) | ||||||
|---|---|---|---|---|---|---|---|---|---|---|
| 1 | A1B1C1 | 600 | 622 | 774 | 749 | 945 | 597 | 877 | 1069 | 816 |
| 2 | A1B2C2 | 741 | 760 | 479 | 204 | 336 | 251 | 542 | 1197 | 672 |
| 3 | A1B3C3 | 451 | 362 | 430 | 259 | 240 | 283 | 719 | 618 | 1048 |
| 4 | A2B1C3 | 290 | 239 | 378 | 664 | 570 | 457 | 704 | 1094 | 1422 |
| 5 | A2B2C1 | 983 | 442 | 413 | 683 | 347 | 467 | 832 | 1023 | 1599 |
| 6 | A2B3C2 | 286 | 311 | 441 | 480 | 518 | 440 | 439 | 741 | 545 |
| 7 | A3B1C2 | 420 | 349 | 359 | 520 | 546 | 665 | 1151 | 1060 | 1176 |
| 8 | A3B2C3 | 272 | 187 | 307 | 292 | 300 | 511 | 525 | 441 | 435 |
| 9 | A3B3C1 | 367 | 306 | 440 | 447 | 415 | 657 | 813 | 725 | 871 |
| Specimen Number | Thermal Conductivity (W/(m·k)) | Specimen Number | Thermal Conductivity (W/(m·k)) |
|---|---|---|---|
| A1B1C1 | 0.370588 | A2B3C2 | 0.254447 |
| A1B2C2 | 0.334392 | A3B1C2 | 0.300998 |
| A1B3C3 | 0.29098 | A3B2C3 | 0.188051 |
| A2B1C3 | 0.228561 | A3B3C1 | 0.351291 |
| A2B2C1 | 0.296303 |
| Specimen Number | 28-Day Apparent Density (kg/m3) | Specimen Number | 28-Day Apparent Density (kg/m3) |
|---|---|---|---|
| A1B1C1 | 1849.00 | A2B3C2 | 1773.00 |
| A1B2C2 | 1845.00 | A3B1C2 | 1691.00 |
| A1B3C3 | 1752.00 | A3B2C3 | 1520.00 |
| A2B1C3 | 1544.00 | A3B3C1 | 1800.00 |
| A2B2C1 | 1813.00 |
| R3d (MPa) | R7d(MPa) | R28d(MPa) | |||||||
|---|---|---|---|---|---|---|---|---|---|
| A | B | C | A | B | C | A | B | C | |
| k1 | 8.264 | 6.804 | 7.082 | 8.649 | 8.546 | 8.231 | 16.91 | 14.82 | 15.03 |
| k2 | 5.816 | 7.163 | 6.722 | 7.819 | 7.463 | 7.749 | 12.54 | 13.22 | 13.34 |
| k3 | 5.134 | 5.247 | 5.41 | 6.609 | 7.068 | 7.097 | 11.5 | 12.9 | 12.58 |
| R | 3.13 | 1.916 | 1.672 | 2.04 | 1.478 | 1.134 | 5.41 | 1.92 | 2.44 |
| R3d (MPa) | R7d (MPa) | R28d (MPa) | |||||||
|---|---|---|---|---|---|---|---|---|---|
| A | B | C | A | B | C | A | B | C | |
| k1 | 579.8 | 447.86 | 549.63 | 429.25 | 634.71 | 589.63 | 839.79 | 1040.95 | 958.24 |
| k2 | 420.32 | 509.37 | 460.68 | 513.97 | 376.8 | 440.05 | 933.31 | 807.41 | 835.99 |
| k3 | 334.18 | 377.06 | 323.99 | 483.79 | 415.49 | 397.33 | 799.63 | 724.37 | 778.49 |
| R | 245.62 | 132.31 | 225.64 | 84.72 | 257.91 | 192.3 | 133.69 | 316.57 | 179.75 |
| Coal Fly Ash (A) (kg/m3) | Mill Tailings (B) (kg/m3) | Basalt Fiber (C) (kg/m3) | |
|---|---|---|---|
| k1 | 1815.33 | 1694.67 | 1820.67 |
| k2 | 1710 | 1726 | 1769.67 |
| k3 | 1670.33 | 1775 | 1605.33 |
| R | 145 | 80.33 | 215.33 |
| Influencing Factor | Coal Fly Ash (A) (MPa) | Mill Tailings (B) (MPa) | Basalt Fiber (C) (MPa) |
|---|---|---|---|
| k1 | 0.33 | 0.3 | 0.34 |
| k2 | 0.26 | 0.27 | 0.3 |
| k3 | 0.28 | 0.3 | 0.24 |
| R | 0.07 | 0.03 | 0.1 |
| Assay Parameters | Compressive Strength (MPa) | Thermal Conductivity (MPa) | Apparent Density (kg/m3) | ||||||
|---|---|---|---|---|---|---|---|---|---|
| A | B | C | A | B | C | A | B | C | |
| k1 | 16.91 | 14.82 | 15.03 | 0.33 | 0.3 | 0.34 | 1815.3 | 1694.7 | 1820.7 |
| k2 | 12.54 | 13.22 | 13.34 | 0.26 | 0.27 | 0.3 | 1710 | 1726 | 1769.7 |
| k3 | 11.5 | 12.9 | 12.58 | 0.28 | 0.3 | 0.24 | 1670.3 | 1775 | 1605.3 |
| Range R | 5.41 | 1.92 | 2.44 | 0.07 | 0.03 | 0.1 | 145 | 80.33 | 215.3 |
| Primary and secondary order | A > C > B | C > A > B | C > A > B | ||||||
| The optimum level | A1 | B1 | C1 | A2 | B2 | C3 | A3 | B2 | C3 |
| Optimal composition | A1B1C1 | A2B2C3 | A3B1C3 | ||||||
| Specimen Number | Efficiency Coefficient | Overall Efficacy Coefficient | ||
|---|---|---|---|---|
| (MPa) | (W/(m·k)) | (kg/m3) | ||
| A1B1C1 | 17.36 | 0.370588 | 1849.00 | 0.74 |
| A1B2C2 | 13.89 | 0.334392 | 1845.00 | 0.71 |
| A1B3C3 | 13.81 | 0.29098 | 1752.00 | 0.76 |
| A2B1C3 | 16.26 | 0.228561 | 1544.00 | 0.91 |
| A2B2C1 | 15.08 | 0.296303 | 1813.00 | 0.77 |
| A2B3C2 | 8.67 | 0.254447 | 1773.00 | 0.68 |
| A3B1C2 | 17.1 | 0.300998 | 1691.00 | 0.82 |
| A3B2C3 | 8.63 | 0.188051 | 1520.00 | 0.79 |
| A3B3C1 | 12.01 | 0.351291 | 1800.00 | 0.67 |
| Fitting Formula | Material | Non-Standardized Coefficient B | Stderr | Standardized Coefficient Beta | t | Significance p | |
|---|---|---|---|---|---|---|---|
| 1 | P3 = 21.456 − 0.1546x − 0.078y − 0.167z | (Constant) | 21.465 | 2.713 | \ | 7.912 | 0 |
| Coal fly ash x | −0.156 | 0.032 | −0.635 | −4.926 | 0 | ||
| Mill tailings y | −0.078 | 0.032 | −0.316 | −2.452 | 0.022 | ||
| Basalt fiber z | −0.167 | 0.064 | −0.339 | −2.632 | 0.015 | ||
| 2 | P3 = 16.792 − 0.156x − 0.167y | (Constant) | 16.792 | 2.122 | \ | 7.912 | 0 |
| Coal fly ash x | −0.156 | 0.035 | −0.635 | −4.48 | 0 | ||
| Basalt fiber z | −0.167 | 0.07 | −0.339 | −2.394 | 0.025 | ||
| 3 | P3 = 13.447 − 0.156x | (constant) | 13.447 | 1.742 | \ | 7.719 | 0 |
| Coal fly ash x | −0.156 | 0.038 | −0.635 | −4.108 | 0 |
| Model | Fitting Formula | Material | Non-Standardized Coefficient B | Stderr | Standardized Coefficient Beta | t | Significance p |
|---|---|---|---|---|---|---|---|
| 4 | P28 = 39.207 − 0.122x − 0.27y − 0.192z | (constant) | 39.207 | 4.586 | \ | 8.548 | 0 |
| Coal fly ash x | −0.122 | 0.054 | −0.302 | −2.274 | 0.033 | ||
| Mill tailings y | −0.27 | 0.054 | −0.668 | −5.033 | 0 | ||
| basalt fiber z | −0.192 | 0.107 | −0.237 | −1.787 | 0.087 | ||
| 5 | P28 = 35.368 − 0.122x − 0.27y | (constant) | 35.368 | 4.233 | \ | 8.355 | 0 |
| Coal fly ash x | −0.122 | 0.056 | −0.302 | −2.177 | 0.04 | ||
| Mill tailings y | −0.27 | 0.056 | −0.668 | −4.818 | 0 | ||
| 6 | P28 = 29.871 − 0.27y | (constant) | 29.871 | 3.643 | \ | 8.199 | 0 |
| Mill tailings y | −0.27 | 0.06 | −0.668 | −4.493 | 0 |
| Model | Fitting Formula | Material | Non-Standardized Coefficient B | Stderr | Standardized Coefficient Beta | t | Significance p |
|---|---|---|---|---|---|---|---|
| 7 | T28 = 0.618 − 0.003x−5.72E−05y − 0.01z | (constant) | 0.618 | 0.137 | \ | 4.517 | 0.006 |
| Coal fly ash x | −0.003 | 0.002 | −0.381 | −1.619 | 0.166 | ||
| Mill tailings y | −5.72E−05 | 0.002 | −0.008 | −0.036 | 0.973 | ||
| Basalt fiber z | −0.01 | 0.003 | −0.76 | −3.232 | 0.023 | ||
| 8 | T28 = 0.614 − 0.003x − 0.01z | (constant) | 0.614 | 0.089 | \ | 6.915 | 0 |
| Coal fly ash x | −0.003 | 0.001 | −0.381 | −1.774 | 0.126 | ||
| Basalt fiber z | −0.01 | 0.003 | −0.76 | −3.54 | 0.012 | ||
| 9 | T28 = 0.498 − 0.01z | (constant) | 0.498 | 0.068 | \ | 7.293 | 0 |
| Basalt fiber z | −0.01 | 0.003 | −0.76 | −3.097 | 0.017 |
| Thermal Conductivity (W/(m·k)) | Density (kg/m3) | Heat Capacity at Constant Pressure (kJ/kg) | Initial Ground Temperature (°C) | Airflow Temperature (°C) | Wind Velocity (m/s) | |
|---|---|---|---|---|---|---|
| Wall rock | 1.43 | 2330 | 800 | 32 | - | - |
| Air | 0.023 | 1.29 | 1004 | - | 20.3 | 2.4 |
| Gunite material | 0.228561 | 1544.00 | 800 | - | - | - |
| Lithologic Characteristics | Volumetric Weight (kg/m3) | Elastic Modulus (GPa) | Poisson ratio | Angle of Internal Friction (°) | Force of Cohesion (MPa) | Tensile Strength (MPa) |
|---|---|---|---|---|---|---|
| Wall rock | 2650 | 18.8 | 0.25 | 50 | 2.73 | 2.3 |
| Heat-proof material | 1544 | 0.46 | 0.27 | 30 | 0.3 | 0.1 |
Disclaimer/Publisher’s Note: The statements, opinions and data contained in all publications are solely those of the individual author(s) and contributor(s) and not of MDPI and/or the editor(s). MDPI and/or the editor(s) disclaim responsibility for any injury to people or property resulting from any ideas, methods, instructions or products referred to in the content. |
© 2023 by the authors. Licensee MDPI, Basel, Switzerland. This article is an open access article distributed under the terms and conditions of the Creative Commons Attribution (CC BY) license (https://creativecommons.org/licenses/by/4.0/).
Share and Cite
Wen, X.; Fu, J.; Zheng, W. Research on New Solid Waste Heat Insulation Material for Deep Mining. Minerals 2023, 13, 838. https://doi.org/10.3390/min13070838
Wen X, Fu J, Zheng W. Research on New Solid Waste Heat Insulation Material for Deep Mining. Minerals. 2023; 13(7):838. https://doi.org/10.3390/min13070838
Chicago/Turabian StyleWen, Xinyi, Jianxin Fu, and Weifei Zheng. 2023. "Research on New Solid Waste Heat Insulation Material for Deep Mining" Minerals 13, no. 7: 838. https://doi.org/10.3390/min13070838