Article

Analysis and Evaluation of Concentrations of Potentially Toxic Elements in Landfills in the Araucanía Region, Chile

1
Facultad de Ingeniería, Universidad Católica de la Santísima Concepción, Concepción 4090541, Chile
2
Centro de Investigación en Biodiversidad y Ambientes Sustentables (CIBAS), Universidad Católica de la Santísima Concepción, Concepción 4090541, Chile
3
Centro Regional de Investigación y Desarrollo Sustentable de Atacama (CRIDESAT), Universidad de Atacama, Copiapó 1532297, Chile
4
Department Biologia Evolutiva, Ecologia i Ciències ambientals, Facultat de Biologia, Universitat de Barcelona, Av. Diagonal 643, 08023 Barcelona, Spain
*
Author to whom correspondence should be addressed.
Minerals 2023, 13(8), 1033; https://doi.org/10.3390/min13081033
Submission received: 31 May 2023 / Revised: 24 July 2023 / Accepted: 25 July 2023 / Published: 1 August 2023
(This article belongs to the Special Issue Concentration and Distribution of Heavy Metals in Soils, Volume II)

Abstract

:
This preliminary study focuses on three abandoned sites, located in the communes of Temuco, Villarrica, and Lonquimay, in the Araucanía Region, Chile. Two of the sites were classified as illegal landfills and one was a former landfill. Seventy-three surface samples were taken, of which 32 were from site S1, 20 were from site S2, and 21 were from site S3. The objectives of this study were (1) to establish the background values of trace metals present in soils through different statistical methods, (2) to determine the level of contamination and possible ecological risks in soils, and (3) to assess the health risk posed to children and adults from potentially hazardous elements (As, Ba, Cd, Co, Cr, Cu, Hg, Ni, Pb, V, and Zn). The data analyzed belong to a report presented by Chile’s National Environmental Centre (CENMA). An evaluation was carried out through a multivariate statistical analysis to determine the type of origin and association of the trace elements, and spatial distribution maps were generated to establish the behavior of the contents of heavy metals present in the sites studied. The background values for sites S1, S2, and S3 were obtained by the median + 2MADdian absolute deviation) method. These values varied in the range of 14,702–41,785 mg kg−1 for Al, 0.83–8.9 mg kg−1 for As, 29.2–77.2 mg kg−1 for B, 59.2–143 mg kg−1 for Ba, 10.1–22.8 mg kg−1 for Cd, 18.4–51.2 mg kg−1 for Co, 12.3–38.0 mg kg−1 for Cr, 47.8–76.6 mg kg−1 for Cu, 36,230–64,274 mg kg−1 for Fe, 0.02–0.05 mg kg−1 for Hg, 482–4396 mg kg−1 for Mn, 16.7–19.3 mg kg−1 for Ni, 1.0–17.6 mg kg−1 for Pb, 1.4–28.2 mg kg−1 for Se, 108–258 mg kg−1 for V, and 68.1–145 mg kg−1 for Zn. In terms of ecological risk, the geoaccumulation index (Igeo), enrichment factor (EF), and contamination factor (Cf) values for As and Se at site S1, As at S2, and Pb with As at S3 were the main elements indicating the highest contamination levels, as well as a higher number of samples with contaminated content. The Potential Ecological Risk Index (PERI) revealed that on average, there was a moderate ecological risk for S1 and S2 and a considerable ecological risk for S3; the main contributions were generated by As and Hg in S1 and S2, while, in S3, they were produced by Pb and As. In terms of the risk to human health, the risk was higher in children than in adults, with the ingestion route as the main source of risk. For adults, it was found that there was no likelihood that they would develop any adverse non-carcinogenic or carcinogenic health effects. In contrast, children were found to be more likely to sustain adverse health effects. Regarding the non-carcinogenic risk to children, the Co and As samples at S1, S2, and S3, and the Pb at site S3 showed values exceeding the non-carcinogenic-risk limit. Regarding the carcinogenic risk, all three sites studied had Cd samples that indicated a likelihood of children developing cancer from this heavy metal.

1. Introduction

Trace elements are categorized as hazardous compounds [1], and contamination with these metals significantly affects the quality of the environment and the ecosystem [2]. They can originate in geogenic sources, which are naturally present in the soil, and/or in anthropogenic sources, which are generated by human activity [3,4,5]. Trace elements, especially those of anthropogenic origin and from diffuse sources, can remain for long periods in soil [4,6] because they do not biodegrade [7] and cannot be metabolized by living organisms [8]. Contamination with these trace elements affects people’s quality of life and can lead to diseases that can reduce life expectancy [9], entering the human body through ingestion, dermal contact, inhalation, and/or the food chain [10].
The growth of urban populations and industries has led to an increase in domestic, industrial, chemical, and other types of waste [10]. Solid waste from landfills is a significant source of metals released into the environment [11], leading to increased groundwater and soil contamination [12]. In developing countries, waste and landfills near residential and industrial areas and roads are increasingly common, mainly due to poor regulations on waste handling and management [7]. In addition, in many locations, abandoned, closed, or old landfills are put to new uses, such as recreational centers, agriculture, and housing developments, among others [8,13], and may pose a risk.
Studies on urban soils have been of great relevance due to the problems of heavy-metal contamination and the environmental deterioration they generate [14]. In Chile, studies on the behavior and contamination of soils in different cities have been reported [5,15,16,17,18,19,20,21,22,23,24,25,26,27], mainly focusing on urban soils. To date, no studies have been published on landfill-soil contamination, so this work aims to provide information on the degree of contamination and potential risks of three landfills in the Araucanía Region, using different statistical approaches and spatial-distribution maps. Therefore, the objectives of this preliminary study are (1) to establish background values for the heavy metals present in soils through different statistical methods, (2) to determine the level of contamination and possible ecological risks in soils, and (3) to assess the health risks for children and adults from potentially hazardous elements.

2. Materials and Methods

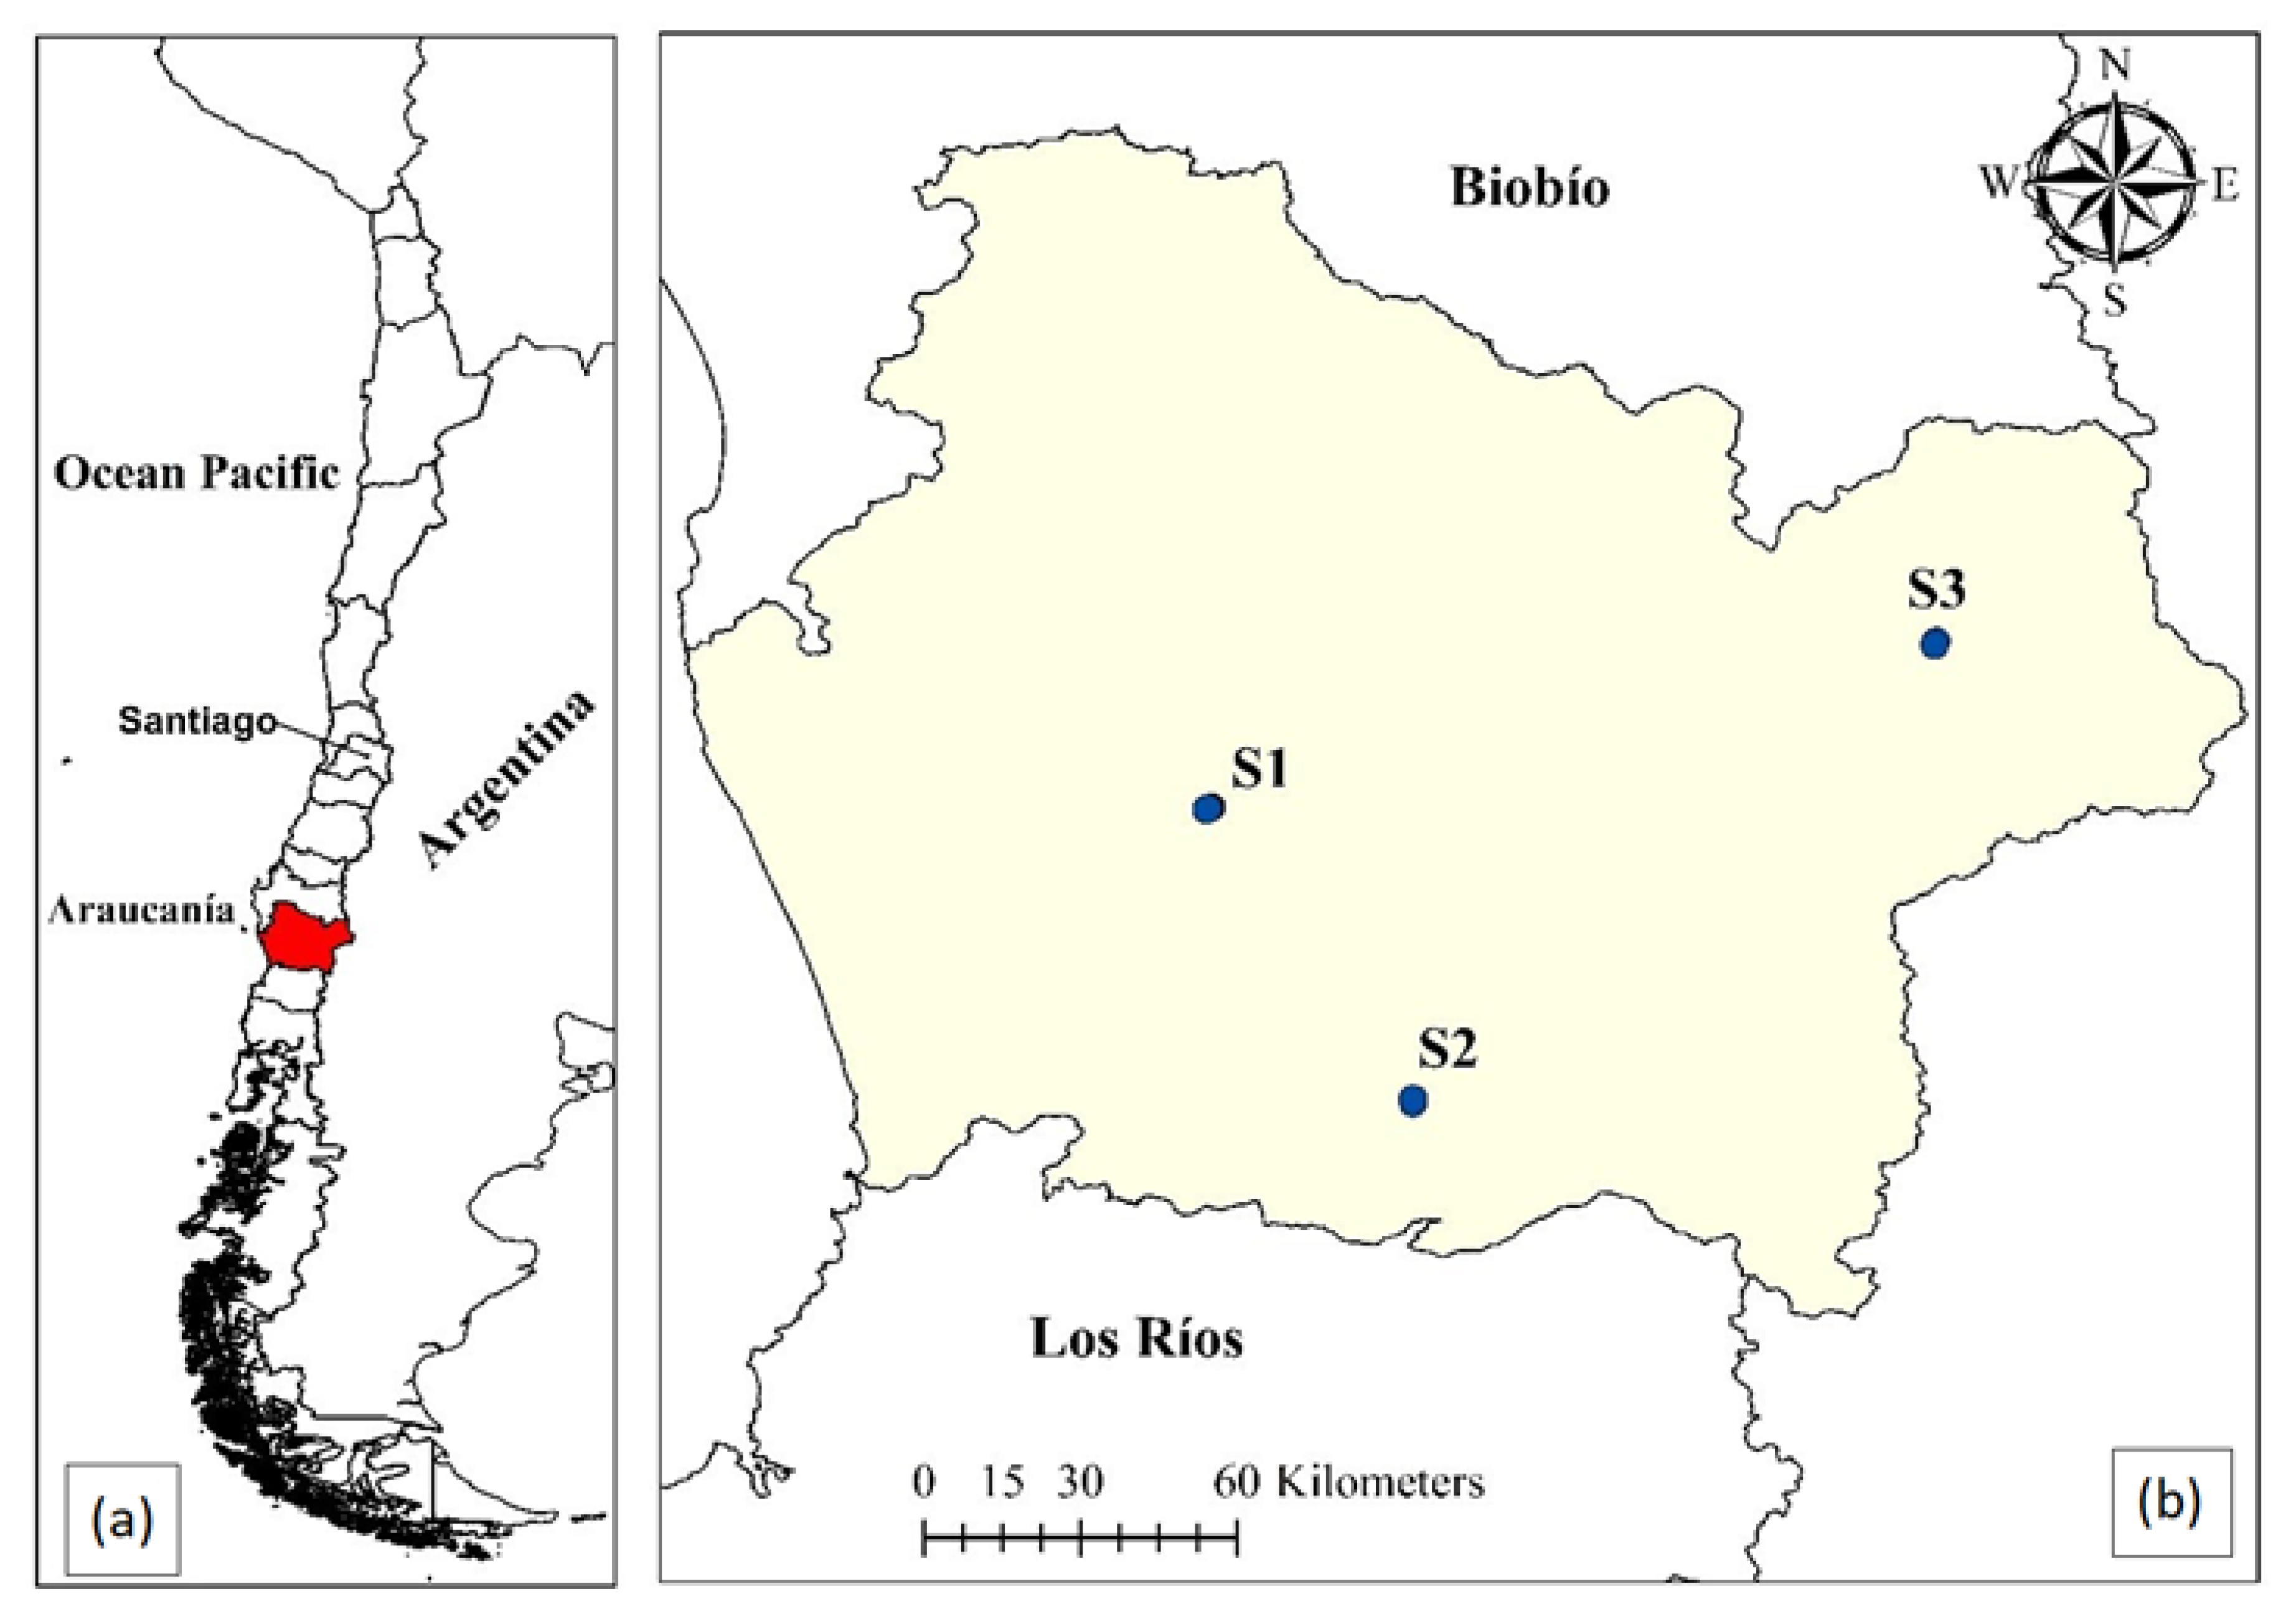
2.1. Description of the Studied Areas

The Araucanía Region is located in the southern part of Chile (at a latitude between 37°35′ and 39°37′ South and 70°50′ to the Pacific Ocean), approximately 721 km south of Santiago. It has a total area of 31,842.30 km2 and 957,224 inhabitants. It is bordered to the north by the Biobío Region, to the south by the Los Ríos Region, to the east by Argentina, and to the west by the Pacific Ocean (Figure 1a). The physical characteristics of Araucanía are given by the continuity of the main relief units of the country; the Andes Mountains, the Intermediate Depression, the Coastal Mountain Range, and the Coastal Plains [28]. The Araucanía Region has a predominantly rainy temperate oceanic climate, with average annual temperatures of 8 °C and rainfall of up to 1250 mm, mainly falling between June and September.
In this preliminary study, three communes belonging to the Araucanía Region were of interest. The first was the commune of Temuco (38°43′60″ S, 72°40′0″ W), which is the capital of the Araucanía Region. It has an area of 464 km² and a population of 282,415 inhabitants. Its main economic activities are forestry, agriculture, and livestock production. The climate is temperate–rainy, with the highest temperatures occurring between October and February, with maximum temperatures averaging between 22 and 25 °C, while the lowest temperatures occur between June and September, reaching a minimum, on average, of 4–5 °C. Rainfall occurs throughout the year, exceeding 1000 mm annually, with the heaviest rainfall between May and August and the driest between January and February. Here, there is a greater frequency of south–south-westerly winds, which change direction to the north–northeast in winter. The second is the commune of Villarrica (39°16′0″ S, 72°13′0″ W), which has an area of 1291.1 km² and a population of 55,438 inhabitants. Economic activities include forestry production, agriculture, livestock, and fish farming. The climate is temperate and very rainy, with minimum temperatures ranging, on average, between 3 °C and 5 °C. Rainfall varies between 2000 mm and 4000 mm annually, with the wettest months between April and November. The prevailing winds come from the north between April and September, while the winds come from the west between October and March. The third is the commune of Lonquimay (38°25′60″ S, 71°13′60″ W), with an area of 3914.2 km² and a population of 10,251 inhabitants. Its main economic activities focus on livestock production and timber activity. Lonquimay has a predominantly temperate–cold–rainy climate with a Mediterranean influence, and towards the Andes Mountains, there is a cold, high-altitude climate. In summer, temperatures can exceed 30 °C, and in winter, they can reach −20° C. Precipitation is mainly in the form of snow, with an annual average of 2000 mm, and the wind direction is mainly from the west.

2.1.1. Landfills in the Araucanía Region

A report carried out by the Chilean National Environmental Centre (CENMA, 2017) identified, prioritized, and ranked abandoned soils with the potential presence of contaminants in the Araucanía Region. Eighty-three of these sites were identified, of which fifteen were classified as high-priority and prioritized. For this preliminary study, three of these soils, those with more than twenty samples, were analyzed to better estimate the statistical calculations. These three sites were classified as landfills, whose soils contain different types of waste, such as household, organic, and non-hazardous industrial waste, among others. These landfills, called sites S1, S2, and S3, are relatively close to urban areas (Figure 1b), so they may pose a risk to the surrounding populations.

Site 1

Site S1 (WGS 84: 38°44′33.7″ S; 72°36′53.8″ W) comprises 27.5 ha, is identified as “Vertedero Ilegal de Residuos Las Quilas”. It is an illegal-waste dump located in the urban sector of the commune of Temuco, Araucanía Region, Chile (Figure 2a). Temuco is located on the central plain of the region. The soils derived from volcanic ashes are Andisols and, in transition to Ultisols, they occur over a gently rolling topography. Site S1 is a freely accessible site, close to residential areas, so it features different receptors, such as families, workers, kindergartens, schools, and hospitals. It is located 200 m from the urban area of Temuco and 170 m from the village of Las Quilas. The site belongs to the Housing and Urbanization Service (SERVIU), and it is classified as abandoned land due to its lack of maintenance. Furthermore, materials were extracted from the river, generating the formation of ballast pits, so it was used as a clandestine dump for the deposition of debris and wastes of different types. Therefore, it is probably a source of contamination in the form of domestic waste, organic waste, percolated waste, presence of vectors, diffuse contamination by population centers and livestock, discharge of liquid industrial waste, incorporation of sediments by aggregate-extraction plants, and extraction of water for irrigation.

Site 2

Site S2 (WGS 84: 39°14′39.9″ S; 72°15′53.4″ W) is an abandoned site corresponding to a former landfill of 15 ha, identified as “Ex Vertedero Villarrica” (Figure 2b), which belongs to the Municipality of Villarrica. It is located approximately 2.5 km northwest of the commune of Villarrica, La Araucanía Region, Chile. Villarica is located in the Andean foothills, in a transition strip in the form of an inclined plane or piedmont that connects the mountain range with the central plain. The soils derived from volcanic ash (basaltic-andesites) are Andisols. Site S2 is a piece of land with a perimeter fence, and its surface is sealed with earth. It was in operation from 2000 to 2014, but it is not known how this landfill was operated or why it was closed. This site was intended to receive construction waste, but it also features other waste types (organic and household, among others). Therefore, there may be contamination with metals and metalloids, which can affect the different receptors in the commune of Villarrica, due to sources of contamination such as non-hazardous industrial waste and household solid waste (MSW).

Site 3

Site S3 (WGS 84: 38°27′38.6″ S; 71°21′50.4″ W) is an illegal landfill of 15.4 ha, belonging to a private property and identified as “Vertedero Ilegal de Residuos Sólidos” (Illegal Solid Waste Landfill). This site is located in the commune of Lonquimay, La Araucanía Region, Chile (Figure 2c). Lonquimay is located in the massif of the Andes Mountains. The soil of incipient development is of volcanic origin and is made up of different deposits of lava, slag, pumice, and pumice; it is highly stratified, without the development of structures. The site is freely accessible, and the nearest receptors are located 1.7 km from the dump. Due to its long history, there is no information available regarding past activities on the site; it is only known that it was generated by clandestine dumping by people close to the sector. Therefore, contamination caused by the possible presence of non-hazardous industrial waste and solid household waste is probable.

2.2. Sampling Procedures

Sampling and Analysis of Soils from Sites S1, S2, and S3

Samples were taken from soils at sites S1, S2, and S3 at locations with the highest probability of contamination. A total of 73 samples were taken, of which 32 were from site S1 (Figure 2a), 20 were from site S2 (Figure 2b), and 21 were from site S3 (Figure 2c). In addition, for each site studied, 8 samples were taken in places where it was observed that the soil did not present an intervention related to anthropogenic sources, to estimate the reference contents of each element, in order to determine whether the contents of heavy metals present at sites S1, S2, and S3 may present a risk of contamination.
Samples were collected at surface level (0–20 cm) with the help of a plastic shovel and then placed in zip-lock bags and duly identified on the label, together with the soil temperature. The information from the different sampling points was recorded in the FLQAM-060302 “Registro de Cadena de Custodia” form, which must be completed at the time of the field visit and then sent, together with the samples, to the Environmental Chemistry Laboratory of CENMA in Santiago, Chile (accreditation certificate LE-174 for the area of physical chemistry for soils and solid waste, granted by the National Institute of Normalization of Chile (INN)). The chemical analysis of the samples was carried out to obtain the contents of different heavy metals. For the elements Al, As, B, Ba, Cd, Co, Cr, Cu, Fe, Mn, Ni, Pb, Se, V, and Zn, methods 3050 A–B of the US EPA (1996) and the ICP-emission-spectroscopy method, which consists of acid digestion of soil samples for analysis by atomic absorption spectroscopy in a flame or oven, were used. In the case of Hg, EPA method 7473 was used, in which Hg is obtained through controlled heating in an oxygen-decomposition oven. The values of the detection limits obtained for each element are presented in Table S1, under ISO 17025 and ISO 9001 protocols. Soil pH was measured in a 1:2.5 soil-to-water ratio [29].

2.3. Data Analysis

Statistical analysis was carried out on the contents of heavy metals present in the preliminary study sites, consisting of a univariate analysis, which included aspects such as descriptive statistics (mean, median, deviation, standard, minimum, maximum, etc.) and graphs (histograms, boxplots, and cumulative frequency). A multivariate analysis was also carried out to identify and determine the associations between and possible sources of contamination in the elements studied. For this purpose, we carried out a Spearman’s correlation coefficient analysis, which indicates the interdependence between two variables, and a principal component analysis (PCA), to which varimax rotation was applied to identify possible sources of origin of the elements studied [19]. The univariate analysis was performed using the open-source software RStudio [30], while the multivariate analysis was performed using the statistical software IBM SPSS Statistics v26. It is worth mentioning that there were some elements whose samples presented contents below the detection limit (Supplementary Table S1), so, for the data analysis in this preliminary study, these values were replaced by half the value of the detection limit for each respective element.
Similarly, a compositional analysis (CoDa) of the data was performed. Its main characteristic is that it is part of a whole, in which the true information on the compositional data is carried over by the proportions between its components [31]. Compositional data are “closed” data and positive values that add up to a constant, such as 1, 100, or 10⁶ [32,33]. The raw data were transformed to a centered log-ratio (clr), in which D new variables were generated that were related through logarithms of individual elements concerning the geometric mean of all components [31], i.e., to construct each log ratio, each variable was divided by the geometric mean of all measured elements, followed by a logarithmic transformation [34]. The data were transformed using the Compositions package in the open-source software RStudio. An exploratory data analysis was performed using edaplots, which consist of graphs comprising a histogram, boxplot, and scatterplot. This was performed through the open-source software RStudio.

2.4. Geochemical Background Values

In [35], the background value, or geochemical threshold, is defined as a relative measure that helps to differentiate geogenic contents from those that are influenced by anthropogenic activities. Currently, Chile does not have regulations that specify threshold values for the contents of different metals present in soils that can generate contamination and produce potential ecological and human health risks [36]. Therefore, for this preliminary study, different methods, tested by [37], were followed to obtain and compare background values. The first was the median ±2MAD (absolute deviation from median), which is, through the use of the median instead of the mean, a more robust method with which to identify the presence of outliers [23,26,31,37]. The second was the upper-Whisker method, which is calculated as Q3 + 1.5 IQR, where Q3 corresponds to the third quartile (75th percentile) and IQR represents the interquartile range, i.e., Q3–Q1 (75th percentile—25th percentile) of the Tukey box [38]. The third method used was the 95th percentile, which indicates that 95% of all data are below a given value [39,40]. The geochemical background values were calculated using Microsoft Excel software, and the graphs were calculated using the open-source software RStudio.

2.5. Assessment of Heavy-Metal and Metalloid Contamination

To determine the level of contamination present in the soils of sites S1, S2, and S3, different ecological indices were used, including (i) geoaccumulation index ( I geo ), which is the level of contamination of sediment or soil determined through the comparison between the current metal content and its geochemical background value. It is calculated as [41].
I geo = log 2 C i 1.5   C b
where C i is the measured content of the particular element in the soil and C b is the soil background value. The authors of [41] established several classes according to the value of the resulting geoaccumulation index: practically uncontaminated ( I geo ≤ 0), slightly-to-moderately contaminated (0 < I geo ≤ 1), moderately contaminated (0 < I geo ≤ 2), moderately-to-heavily contaminated (0 < I geo ≤ 3), heavily contaminated (0 < I geo ≤ 4), heavily-to-extremely contaminated (0 < I geo ≤ 5), or extremely contaminated ( I geo > 5).
The second index used (ii) was the enrichment factor (EF). This index is used to assess the potential impact of anthropogenic activities on heavy-metal contents in soils [42]. The most commonly used major elements are Al, Ca, Fe, Mn, Sc, and Ti, which are also characterized by their low variability of occurrence [43,44]. In this preliminary study, a choice was made between Al and Fe, which are abundant elements in the Earth’s crust, depending on the site. To determine which of the two to use, the most symmetrical option, i.e., that whose asymmetry coefficient was closer to zero, was chosen. Therefore, Al was used as the reference element for S1 and S2 and Fe was used for S3. The EF was calculated using the following equation:
EF = C n C ref Sample B n B ref Background
where C n is the content of a specific element, C ref is the content of the selected majority element, B n is the background content of the specific element, and B ref is the background content of the majority element. The enrichment factor was classified as follows: poor enrichment (EF < 2), moderate enrichment (2 ≤ EF < 5), significant enrichment (5 ≤ EF < 20), very high enrichment (20 ≤ EF < 40), and extremely high enrichment (EF ≥ 40).
The third index was (iii) the contamination factor (Cf), which is used to account for the degree of contamination of a given element in the environment [45], and is calculated as follows:
Cf = C i C b
where C i is the content of a given element and C b is the content of the background values obtained for each site (S1, S2, and S3). [46] established different classes to describe Cf: low contamination (Cf < 1), moderate contamination (1 ≤ Cf < 3), considerable contamination (3 ≤ Cf < 6), and very high contamination (Cf ≥ 6). Microsoft Excel software was used to calculate the geoaccumulation index, enrichment factor, and contamination factor.

2.6. Potential-Ecological-Risk Index (PERI)

In [46], the ecological-risk factor ( Er i ) and the potential-ecological-risk index (PERI), which quantitatively expresses the ecological risk posed by potentially toxic elements at a given site, was established. The ( Er i ) is calculated for each element individually and is obtained from Equation (4), [46]:
Er i   = Tr i   ×   Cf i
where   Tr i is the toxic-response factor for element i and Cf i is the contamination factor for element i. The toxic-response-factor values used in this study were 10 for As, 30 for Cd, 5 for Co, Cu, and Pb, 2 for Cr, and 1 for Zn [19,46,47]. The PERI is the sum of the different environmental risk factors, and it is calculated through the following equation [46]:
PERI = Er i = Tr i ×   Cf i
Both the potential-ecological-risk index and the risk factor have classes indicating the level of risk, which can be seen in Supplementary Table S2. In addition, the calculations were performed using Microsoft Excel, and the graphs were created using the open-source software RStudio.

2.7. Assessment of Potential Risks to Human Health

Human-health-risk assessment is used to estimate potential health risks and the likelihood of harmful effects caused by chemicals in contaminated environments [48]. The main routes of exposure to heavy metals from soil to humans are ingestion of soil particles, dermal ingestion, and inhalation [49]. The non-carcinogenic and carcinogenic risks to adults and children were obtained using Microsoft Excel software, while the open-source software Rstudio was used to produce the various graphs of the potentially hazardous elements at each study site.

2.7.1. Non-Carcinogenic Risk (HQ)

Regarding the non-carcinogenic risk, the daily intake was calculated for ingestion, dermal contact, and inhalation routes for the elements As, Ba, Cd, Co, Cr (VI), Cu, Hg, Ni, Pb, V, and Zn, following Equations (6)–(8) [50]:
D Ing =   C S   ×   IngR × EF × ED BW × AT × 10 6
D Derm =   C S SA × SAF × ABS × EF × ED BW × AT × 10 6
D Inh = C S × InhR × EF × ED PEF × BW × AT
where C S is the total element content in soil (mg kg−1), IngR is the ingestion rate (mg d−1), EF is the exposure frequency (d year−1); ED is the exposure duration (years), BW is the body weight (kg), AT is the average time (d); SA is surface area (cm2), SAF is skin-adhesion factor (mg cm−2), ABS is dermal-absorption factor (unitless), InhR is the inhalation rate (m3 d−1), and PEF is the particulate-emission factor (m3 kg−1). The values used for each of these parameters were obtained from [51] and are available in Supplementary Table S3. Next, the non-carcinogenic risk was quantified following the methodology applied by [50], through the hazard quotient (HQ) for the routes of ingestion ( HQ Ing ), dermal contact ( HQ Derm ), and inhalation ( HQ Inh ):
HQ Ing = D Ing / RfD o
HQ Derm = D Derm / RfD Derm
HQ Inh = D Inh / RfD Inh
where RfD o is the oral (ingestion) reference dose, RfD Derm is the dermal-absorption reference dose, and RfD Inh is the airborne-soil-particulate-inhalation reference dose [51]. The values of RfD o (mg kg−1 d−1) varied between each element, as shown in Supplementary Table S4, while the RfD Derm and RfD Inh values were calculated using Equations (12) and (13) [50]:
RfD Derm = RfD o   ×   ABS GI
RfD Inh = RfC   [ mg   m 3 ]   20 [ m 3 d 1 ] / 70   kg   BW
where ABS GI is the unit gastrointestinal absorption and RfC (mg d−1) is the inhalation reference content for each potentially toxic metal. The values for each are presented in Supplementary Table S4.
Equation (14) was used to obtain the non-carcinogenic hazard index (HI) for each element:
HI = ( HQ Ing + HQ Derm + HQ Inh )
in which USEPA (2001) states that, when the hazard quotient HQ > 1, there is a strong possibility that adverse effects related to non-carcinogenic risk from potentially toxic elements may occur [52]. The same is true for a hazard index (HI) greater than 1.

2.7.2. Carcinogenic Risk (CR)

Carcinogenic risk is estimated as the increase in the likelihood that an individual will develop cancer during his or her lifetime [53]. This is why the International Agency for Research on Cancer (IARC) generated a list of metals that may pose a risk for the development of carcinogenic diseases in humans (IARC, n.d.). In this preliminary study, possible carcinogenic risks were calculated for As, Cd, Cr (VI), Ni, and Pb. This was performed through Equations (15)–(17), [50]:
CR Ing = D Ing   ×   OSF
CR Derm = D Derm ×   DSF
CR Inh = D Inh ×   ISF
where CR Ing , CR Derm , and CR Inh   are the carcinogenic risks associated with the ingestion, dermal contact, and inhalation routes, respectively. On the other hand, OSF, DSF, and ISF are the carcinogenicity-slope factors (mg kg−1 d−1) for inhalation and dermal contact. The DSF and ISF values were obtained by Equations (18) and (19) [50]:
DSF = OSF / ABS GI
ISF = ( IUR   [ μ g   m 3 ] × 70   kg   BW × 10 3 [ mg   μ g 1 ] ) / 20   [ mg   μ g 1 ]
where ABS GI is the unit gastrointestinal absorption and IUR is the unit inhalation risk ( μ g   TE m 3   aire ). Their values are shown in Supplementary Table S4. Finally, the total carcinogenic risk (TCR) for each element present in a soil was calculated by the following equation:
TCR = ( CR Ing + CR Derm +   CR Inh )
where CR Ing ,   CR Derm ,   and   CR Inh are the carcinogenic risks through ingestion, dermal contact, and inhalation, respectively. The EPA states that when the value CR > 10−4, the risk is considered unacceptable and there is an increased risk of carcinogenic diseases associated with potentially hazardous elements, while risk values within the interval of [10−6, 10−4] are considered tolerable [52].

2.8. Geochemical Distribution Maps of Heavy Metals

The spatial distribution was based on proportional symbol maps, whose ranges of values were classified through percentiles, which were divided as follows: (a) < P50, (b) P50–P75, (c) P75–P95, and (d) > P95, represented on the maps by green, yellow, orange, and red colors, respectively. This was performed using ArcGIS v10.3 software.

3. Results and Discussion

3.1. Soil Properties

The descriptive statistical parameters of the soil properties, in this case, the pH, of the three sites studied are shown in Table 1.
The pH present in soil influences the mobility and bioavailability of trace metals [54], while the mobility of many metals present in soils tends to be lower in neutral-to-alkaline soils [55]. Regarding the pH at site S1, 6.3% of the samples were moderately acidic (5.6–6.1), 18.8% were slightly acidic (6.1–6.6), 50.0% were neutral (6.6–7.4), 21.9% were slightly alkaline (7.4–7.9), and 3.1% were moderately alkaline (7.9–8.5). In total 5% of the samples at site S2 were strongly acidic, 5.0% were moderately acidic, 10.0% were slightly acidic, 65.0% were neutral, 10.0% were slightly alkaline, and 5.0% were moderately alkaline. The coefficient of variation (CV) showed low variability in the distribution. At site S3, the pH indicated a variation, in which 38.1% of the samples were slightly acidic, 57.1% were neutral, and 4.8% were slightly alkaline. The coefficient of variation (CV) showed low variability at the three sites. Therefore, a large percentage of the samples were characterized by neutral-to-alkaline pH, so in the three sites studied, the mobility of some of the elements was be lower.

3.2. Contents and Distribution of Heavy Metals in the Studied Sites

Figure 3 shows the contents of As, Cd, and Pb for sites S1, S2, and S3, represented by boxplot diagrams, together with the geochemical reference values obtained for each study site.
The corresponding plots for Al, B, Ba, Co, Cr, Cu, Fe, Hg, Mn, Ni, Se, V, and Zn are presented in Supplementary Figure S1, in the supplementary material. At site S1, the mean contents were as follows, in descending order: Fe > Al > Mn > V > Ba > Zn > Cu > B > Co > Cr > Se > Ni > Cd > Pb > As > Hg. The results for the coefficient of variation showed that, in general, the CV values of As, Ba, Cr, Cu, Hg, Ni, Pb, Zn, Mn, and Se exceeded 33.0%, indicating the presence of inhomogeneous distributions in their contents [9]. In the case of site S2, the mean values were as follows, in descending order: Fe > Al > Mn > V > Zn > Ba > Cu > B > Se > Ni > Cr > Co > Cd > Pb > As > Hg. Furthermore, the CV values of As, B, Ba, Cu, Hg, Mn, Ni, Pb, Se, and Zn were higher than 33.0%, which indicates the presence of inhomogeneous distributions [9]. Finally, the mean contents of the S3 site elements were as follows, in descending order: Fe > Al > Mn > V > Zn > Ba > Cu > Pb > B > Se > Co > Cd > Ni > Cr > As > Hg. Furthermore, the coefficient-of-variation values of Pb and As indicated rather high variations, of 353% and 150%, respectively, greatly exceeding a CV of 33%, which clearly indicates that these two elements presented heterogeneous distributions [9]. In addition, the Hg, Ni, and Se also exceeded this value, but not to a large extent, so they also tended to have inhomogeneous distributions. The rest of the elements presented low CV values, so their distributions behaved more homogeneously. The mean contents of Al, As, Ba, Cu, Hg, Ni, Pb, Se, and Zn at site S1 were higher than their respective geochemical background values. In the case of site S2, the mean values of As, Ba, Cu, Hg, Ni, and Se exceeded the geochemical background values, while at site S3, this was the case for the mean contents of Al, B, Ba, Cd, Co, Cu, Fe, Mn, Pb, V, and Zn. Therefore, there are a large number of elements that may lead to contamination in the soils of sites S1, S2, and S3.
The spatial-distribution maps for the As, Cd, and Pb contents at sites S1, S2, and S3 are presented in Figure 3, while the spatial distributions of Al, B, Ba, Co, Cr, Cu, Fe, Hg, Mn, Ni, Se, V, and Zn are shown in Figure S1. At site S1, it was observed that the As had a different spatial distribution from the other elements, with contents > P95 close to the center and northwest of the dump, while values between P75 and P95 occurred at different locations on the map (center, southwest, east, and northeast). Similarly, the Ni tended to present a different distribution to the rest of the elements, with contents between P75 and P95, and one above the 95th percentile. These were mostly located in the center of the site, while one sample > 26.3 (mg kg−1) was located at the eastern end of the dump. The spatial distributions of the Al, B, Ba, Cd, Co, Cr, Cu, Fe, Mn, and V were relatively similar, and there was a trend of contents > P75 to the southwest of the site, in the samples closest to the Toltén river and on the east side of the site. Some similarities were observed between the spatial distributions of the Hg, Pb, and Zn contents, with the samples above P75 mostly concentrated along the upper area of the dump, closer to the dwellings. Finally, the distribution of Se was somewhat different from those of the other elements, except for Pb, which provided some moderate-to-high samples at the same site. At site S2, there was a varied distribution of moderate-to-high contents throughout the site. For example, in the samples located to the south of the site, it was possible to observe contents above P75 for all the elements (orange and red circles). To the northwest, Al, As, Ba, Cu, Hg, Se, Zn with contents between P75 and P95 and some Pb, Mn, Fe, Cd, Co, and Cr were present, in addition to samples of As, Cu, Hg, and Zn above P95. To the north, some samples with > P75 of B, Fe, V, and a few samples of Cd, Co, Cr, Cu, Mn, Ni, and Pb were present.
The majority of the samples towards the northeast presented the lowest contents of the elements, which tended to be below the 50th percentile, except for a few samples of Al, Ni, and V. It is worth mentioning that there were spatial distributions that had some similarities, such as those of Al, Ba, Cu, Hg, Pb, and Zn, which were characterized by low contents (<P50) towards the northeast of the map and moderate-to-high values (>P75), which were mostly present towards the west, northwest, and south, as mentioned above. On the other hand, the Cd, Co, and Mn showed very similar distributions, so they might have had a common source, while the distributions of Cr and Ni resembled, to a lesser extent, those of Cd, Co, and Mn. of the distributions of the V and Fe were different from those of the other metals; the samples with contents > P75 were mainly located to the north of the site, closer to the road. The element As had a somewhat different distribution was presented from those of the other elements, with moderate-to-high samples (>P75) found mainly towards the northwest of the site, but with samples in which the other elements tended to present low contents. At site S3, the distributions tended to show greater differences between the elements present. Some similarities in the distribution of contents were observed for Al, Ba, Cu, Hg, Mn, and Zn, which, although they were not very similar to each other, the contents higher than P75 occurred more towards the south of the site, with some occurring towards the north. It is worth mentioning that most of the contents in the Hg range of P75–P95 were located towards the south, while to the north, there was a greater presence of lower contents (<P50), but also the presence of a sample with a content higher than P95, which may have been due to point source contamination by the Hg. The maps of Cd, Co, Fe, and V were characterized by higher contents (>P75) towards the center of the sector and, slightly to the north, for Fe and V, so these areas could have a higher risk of contamination. The spatial distributions of Cr and Ni were observed to be similar, both with samples above P95, located at the same site. Furthermore, their contents between P75 and P95 were distributed in different sectors throughout the landfill, unlike the other elements, which tended to cluster in more specific sectors of the map. The spatial distributions of Pb and Se also differed, to some extent, from those of the other elements, albeit with few similarities between them, such as the occurrence of samples with contents higher than P75 towards the south and southeast of the site. However, it should be noted that these elements did not tend to present similar behaviors to each other, so it cannot be guaranteed that they arose from similar sources. Finally, it was observed that B showed some similarities with Fe, with contents > P75 from the center to the north of the map. This also indicated some similarities in terms of the distribution of As, with the highest contents (>P75) in the samples located to the north and the same sample to the south within this range.

3.3. Relationship between Trace Elements

A multivariate data analysis, consisting of a Spearman correlation analysis and a principal component analysis (PCA), was performed to identify and determine the possible sources of and associations between the studied elements and pH at sites S1, S2, and S3.

3.3.1. Relationship between Trace Elements and pH of the Studied Sites

The results of the Spearman correlation analysis of the heavy metals and soil pH at sites S1, S2, and S3 are presented in Supplementary Tables S5–S7, respectively. Regarding site S1, it is possible to observe that the pH presented low correlations with the Zn, Ni, and Pb, indicating little influence on these elements. There were also significant negative associations between the pH and the Fe, V, Al, Co, Cr, Cd, B, Mn, and, to a lesser extent, the Ba and Cu. Regarding significant positive correlations, the pH was only moderately associated with Se and a medium–low-significance correlation with Hg and As, which may mean that there was an influence of the pH on the behavior and uptake of these three elements compared to the rest. At site S2, the pH demonstrated highly significant positive correlations with the Ba and Zn, moderate-to-high correlations with the Pb, Cu, and Hg, and moderate-to-low correlations with the Co, As, and Cr. With the rest of the elements, the pH showed weak associations. This indicates that the availability of these trace elements was associated with the soil pH and that changes or variations in the pH value influenced the accumulation and mobility of the associated elements at this site [31]. Finally, for site S3, it was found that the soil pH did not present significant positive correlations with any of the elements studied, but that it did present a moderately significant negative association with the Zn, which could mean that pH inversely influences zinc mobility, i.e., at a neutral-to-alkaline pH, Zn mobility may increase. Therefore, except for Zn, the adsorption of heavy metals in soil is not dominated by pH.

3.3.2. Relationship between Heavy Metals of the Studied Sites

Site S1

As shown in Supplementary Table S5, the Spearman correlation matrix showed strong associations between certain metals, which could indicate that they have a common provenance or origin. The Ba showed a very strong positive association with the Al, Cd, and V, a strong association with Co, Fe, Cr, B, Cu, and Mn, a moderately negative correlation with Pb, and weak associations with the rest of the elements. The Cd showed a very strong association with Co, Al, Fe, Ba, and V, a strong association with Mn, Cr, and B, and a moderate association with Cu, while it demonstrated weak negative correlations with Hg, Pb, and Zn. On the other hand, the Cu had a strong positive correlation with B, Ba, and V, a moderate correlation with Al, Cd, Cr, Co, and Fe, and low correlations (both positive and negative) with the rest of the elements. The V showed a very strong positive correlation with Co, Al, Ba, and Cd, a strong correlation with Fe, B, Cr, Mn, and Cu, a strong negative association with Se, and a moderately negative association with Pb and Hg. An association was observed between the Hg, Pb, and Zn, with a strong positive correlation between Hg and Pb and moderate Hg–Zn and Pb–Zn correlations, which could mean that these metals arise from similar sources. The Se presented a moderately positive association only with Pb and Hg, several strong negative correlations with V, Al, Co, Fe, Ba, and Cd, and moderate negative correlations with Mn, B, Cr, and Cu. The As and Ni demonstrated an absence of significant correlations with the rest of the elements, which could indicate that contamination with these metals was from wastes composed only of As and Ni. The results of the principal component analysis after the varimax rotation are presented in Supplementary Table S8. A reduction in the four principal components was obtained, which explained 83.0% of the variance. The first component (PC1) explained 52.6% of the variance and indicated a strong positive association with Cd, Co, Fe, V, Al, Ba, B, Mn, and Cr, and a moderate correlation with Cu, so these elements could arise from common sources of contamination, while Se and pH had medium–strong negative loadings with this component. The second component (PC2), which explained 12.6% of the variance, presented a highly positive loading with Pb and Zn, and a moderate loading with Hg, so these three elements could arise from a common origin. From the PC2 component, Hg, Pb, and Zn had heterogeneous distributions and a higher variability, so these elements may be produced from human-generated sources. The third component (PC3) indicated 8.9% of the explained variance and presented a strong positive association with Ni, a medium–strong association with Hg, and a medium–weak association with pH. The Ni was not associated with any of the previous components (PC1 and PC2), while the Hg was also related to the PC2, so these two elements may originate from different sources. The fourth component (PC4) explained 8.8% of the variance, we were the presence of strong positive loadings with As and medium–high with Cu was observed. The Cu was also associated with PC1, so in the case of PC4, Cu and As could have a different contamination origin from the other components. It is worth mentioning that the As and Cu displayed rather heterogeneous distributions, so it is likely that they arose from anthropogenic sources. In addition, the Se did not show a positive association of higher than 0.4 in any of the four components, so its origin may be different from those of the rest of the elements.

Site S2

As shown in Supplementary Table S6, there was the majority of the correlations were positive, and few were negative. Among the associations observed, the Zn presented very strong positive correlations with Ba, strong associations with Hg, Cu, Mn, and Pb, moderate associations with Co, Al, Cr, and Cd, and low associations with the other elements, so these elements may arise from similar sources. It was observed that the Ba presented a very strong positive correlation with Zn, a strong correlation with Hg and Cu, and a moderate correlation with Mn, Pb, Co, Al, and Cr, so these elements may originate from similar sources of contamination. The Cd, showed strong positive correlations with B, Co, Mn, and moderate associations with Cr, Ni, Se, Fe, and Zn, so their sources of origin may be similar; in addition, the Cd showed weak associations with the rest of the elements. The Cu, showed highly significant positive correlations with Ba, Pb, Zn, and Hg, and moderate correlations with Al, Fe, Mn, Co, and Cr, while with the other elements, its associations were low. It was observed that the Ni had a moderate positive correlation with Cd, Cr, and Co, which indicated that when the Ni contents increase, the contents of these three elements also increase. The Pb showed strong positive correlations with Cu, Hg, and Zn, and moderate correlations with Ba and Fe, while with the other elements, it showed weak linear relationships, so these four elements may have sources of contamination in common. In the case of V, only a significant positive V/Fe association was obtained, which could indicate a possible common origin for these two metals. The As did not show significant correlations with any of the elements, which could indicate different behaviors and a possible source of contamination generated exclusively by wastes composed of this element. The results of the principal component analysis after the varimax rotation are presented in Supplementary Table S8. A reduction in the five principal components was obtained, which explained 87.5% of the total variance. The first component (PC1) explained 23.1% of the variance and showed a strong positive association with Hg, Cu, and Zn, high loadings with Pb, and moderate loadings with Ba and pH, so these elements may have common sources of contamination. In addition, these elements presented rather skewed and heterogeneous distributions, so they could arise from sources generated by human activity. The second component (PC2), which explained 21.2% of the variance, presented strong positive loadings with Al and Mn, medium–high loadings with Co, Ba, and Cd, and moderate loadings with Fe, indicating an origin that is potentially generated by similar sources. The third component (PC3) explained 19.0% of the variance and showed strong positive loadings with Ni and Se, moderate loadings with Cd, Cr, and B, and medium–low loadings with Co, so it may originate could from similar sources to these elements. Furthermore, the Cd and Co were also found to be associated with PC2, so these two elements may have more than one source of contamination. The fourth component (PC4) explained 13.8% of the variance and presented a very strong association with V, a medium–strong association with Fe, a medium association with B, and a medium–low association with Co. The elements B, Co, and Fe were contained in other components (PC2 and/or PC3), so their sources of origin were mixed, i.e., they had more than one type of origin. Nevertheless, this component was mainly dominated by sources generated by V. Finally, the fifth component (PC5) explained 10.4% of the variance and indicated strong positive loadings with As and moderate loadings with pH. It is worth mentioning that the As presented a heterogeneous distribution and an absence of correlations with the other elements, so this component probably arises from residues composed of As alone.

Site S3

As shown in Supplementary Table S7, there were few correlations between the metals compared to sites S1 and S2. As an example, the As presented few associations with the rest of the elements, with As/B and As/Cr the only relationships with significant positive correlations at a medium level, so they may have similar sources. For Cd, highly significant associations were identified with Fe, V, and Co, and moderate associations were found with Cu and Ba, so they may have some similar sources, while the rest of the elements presented weak correlations (positive and/or negative). The Cu was positively associated with Ba, Cd, Fe, and Mn, whose correlations were significant at a medium level. The V demonstrated a very strong, significant, and positive relationship with Co and a strong relationship with Cd and Fe, while with the rest of the elements, it presented low associations, so these four elements could arise from similar sources. Low correlations were observed between the Ba and almost all the elements, except for Al, Cd, and Cu, with which it showed moderate positive correlations, and As, with which it showed a negative correlation. In the case of the Cr, only Cr/As and Cr/Ni associations were significant, so these elements could arise from similar contamination sources. The Pb showed a moderate positive correlation with the Se and B, while a lack of linear relationships with the other elements studied was observed. It was observed that the Hg demonstrated a large number of weak associations, and only a moderately significant positive correlation with Mn. A similar situation occurred with the Zn, which also presented a moderately significant positive correlation with Mn only, and weak correlations with the rest of the heavy metals; it may have a similar source to Mn. Supplementary Table S8 presents the results of the principal component analysis after the varimax rotation. There was a reduction in six principal components, which explained 83.0% of the variance. The first component (PC1) explained 24.0% of the variance and presented very strong positive loadings of Cd, V, and Co, a strong loadings with Fe, and a medium loadings with Cu, in addition to a medium–low negative loading with Hg. Therefore, these associated elements may have similar origins, but their origin are not similar to that of Hg. The second component (PC2) explained 15.8% of the variance and presented strong positive loadings with Zn and Mn, moderate loadings with Cu, and medium–low loadings with Ba, so they may contain common origins. As the Cu is also associated with PC1, it could arise from two different sources. The third component (PC3) explained 14.4% of the variance and indicated very strong positive loadings with Ni, strong loadings with Cr, and moderate loadings with Se. Therefore, these elements may have similar sources. The fourth component (PC4) explained 10.4% of the variance and was related only to the As and B, so its presence at site S3 may be generated by point sources composed of residues containing these two elements. The fifth component (PC5) explained 9.7% of the variance and was associated only with Pb and Se, while the Se was also related to PC3, so this element may present two different sources of contamination, with some sources of origin similar to those of the Pb in PC4. The sixth component (PC6) explained 8.5% of the total variance, with the presence of a very strong positive loading with Al and a moderate loading with Ba, so this component indicates a different type of contamination origin, composed of these two elements. It is worth mentioning that the Hg presented low loadings in the six components, and, in addition, its correlations with the other elements were scarce, so its behavior and origin were different.
It is important to bear in mind that metals such as Pb, Cu, and Zn are common in a wide variety of wastes that are deposited in landfills. Some of the types of waste in which they are commonly present are batteries, lamps, cable covers, fertilizers and pesticides, leaded gasoline, pigments, chemical products [13], waste from car workshops, cleaning products, construction and demolition waste, and cooked and raw food [11]. Furthermore, Pb, is present in paints and galvanized sheets, among others. The metal, Cu, is found in various different pigments, and Zn is associated with cosmetics, expired medicines, scrap metal, and construction materials [11]. Additionally, it is suggested [13] that Hg is mainly associated with waste materials, such as fluorescent lamps, batteries, biodegradable and non-biodegradable packaging materials, and cement production. Furthermore, it is suggested [56] that As may arise from anthropogenic sources, such as preservatives.

3.4. Comparison with Contents of Heavy Metals in Landfills in Other Countries

Other studies of municipal landfills have not been carried out in Chile, while studies in Latin America are scarce. Therefore, the contents of this preliminary study were compared with those obtained from landfills in different countries, the results of which are presented in Supplementary Table S22. The authors of [57] reported the soil contamination in a municipal landfill in the area of New Hamburg in Brazil. From this preliminary study, a 10-cm-deep sample was taken as a comparison, which showed lower mean values of Cd and Zn than sites S1, S2, and S3, and lower mean values of Hg than sites S1 and S2 in the present preliminary study. A study at a former open solid-waste landfill in Havana (Cuba) [11], mainly reported high contents of Cu, Ni, Zn, and Pb, and slightly high contents of Co; only the Co showed lower mean contents than those presented in this study. When comparing with results from a hazardous-waste landfill in Catalonia (Spain), in 2018 [58], presented lower mean values of As, Cd, Cr (concerning S1 and S2), and Ni than those found in this study. The mean values presented in this study for As, Ba, Cu, Mn, Pb, and Zn were higher than those found in an industrial-waste landfill in southern Brazil [59]. The authors of [8] presented a study of soils from two landfills in Amakon and Kronum (Ghana), in which higher mean contents of As, Cr, Cu, Hg, Ni, Pb, and Zn were obtained at Amakon and Cr, Ni, and Zn at Kronum compared to the results obtained in the present study. The abandoned landfills in this study had higher mean contents of Cd, Cu, Fe, and Pb than those presented in [60], a study of 0–15-centimetr-deep samples from three landfills in southern Nigeria. It is worth mentioning that the aforementioned works did not have defined values for the contents of the heavy metals Al, B, Se, and V.

3.5. Geochemical Background Values

Since no threshold values indicating permissible levels of contents of different elements in soils have been established in Chile, geochemical background values were calculated using the methods of median + 2MAD, upper Whisker, and 95th percentile, with the lowest values obtained from each of these three methods chosen and presented in Table 1 and Supplementary Figure S1. Moreover, the geochemical background values obtained by using each statistical method and the percentage of samples that exceeded the reference thresholds are shown in Supplementary Tables S10–S12 for sites S1, S2, and S3, respectively. At site S1, the lowest values for Al, As, Ba, Cr, Hg, Mn, Se, and Zn were obtained by the median + 2MAD, while those for B, Cd, Co, Cu, Fe, Ni, Pb, and V were obtained by the 95th percentile. It was observed that several elements indicated samples that exceeded the determined limits, mainly Al, Ni, Hg, Cu, and Se, which may suggest the existence of contamination by these elements. For site S2, the lowest values for Al, As, B, Ba, Cd, Cr, Cu, Fe, Hg, Mn, Ni, Se, V, and Zn were obtained through the median + 2MAD, and those for Co and Pb were obtained through the 95th percentile. According to these results, except for Al and Mn, almost all the elements presented a high percentage of potentially contaminated samples, because they exceeded the threshold values to a large extent. Finally, at site S3, the lowest values for As, B, Ba, Cd, Co, Cr, Cu, Fe, Hg, Mn, Ni, Pb, Se, V, and Zn were obtained by the median + 2MAD, and for Al, they were obtained by the 95th percentile. At this site, several elements presented a significant number of samples with contents exceeding the background values, particularly Co, B, Cd, Zn, Mn, Ba, V, Fe, Pb, and Cu, in more than 50.0% of the samples. Therefore, in the three study sites, the vast majority of the elements may present a risk to soils due to the presence of possibly contaminated samples.

3.6. Ecological Risks

Supplementary Tables S13–S15 show the ecological-risk results for sites S1, S2, and S3, respectively. At site S1, the geoaccumulation index showed that Se and As were the elements with the highest levels of contamination, with more than 50.0% of their samples moderately-to-heavily contaminated, followed by Hg and Pb, with moderately-to-heavily contaminated and moderately contaminated samples, respectively. The enrichment factor indicated samples with moderate-to-extremely-high enrichment with Se and As, followed by one sample with significant enrichment with Hg, and moderate enrichment with Hg, Pb, and Zn in a smaller number of samples. Finally, the contamination factor indicated that, except for Mn, all the other elements had samples with some level of contamination, with all the As and Se samples contaminated, and at the highest levels, from moderate to very high.
Regarding site S2, the geoaccumulation index showed that the As had the highest contamination levels in the highest number of samples, ranging from moderately to extremely contaminated. This was followed by Cu and Hg, with one moderately contaminated sample. From the enrichment factor, it was found that, except for the Al, all the other elements presented samples with some level of enrichment, mostly moderate enrichment, while the As showed the highest levels, in samples with high and very high enrichment. Regarding the contamination factor, except for the Al and Mn, all the elements showed moderately contaminated samples, while the As, Cu, and Hg showed samples with considerable contamination, and the As showed very high level of contamination in 50.0% of its samples.
At site S3, the geoaccumulation index indicated that Pb was the element with the highest levels of contamination, with samples ranging from moderately to extremely contaminated, followed by one sample that was moderately contaminated by As. A similar situation was observed for the enrichment factor, with the Pb presenting samples with significant, very high, and extremely high enrichment, followed by the As, Hg, and Se samples, with moderate enrichment. In the contamination factor, all the elements indicated moderately contaminated samples, while the As and Pb showed samples with considerable contamination. In addition, the Pb was found to have a significant number of samples with very high contamination, specifically, 52.4% of its samples. Therefore, the vast majority of the elements generated contamination in the soils of sites S1, S2, and S3, particularly As, Se, Pb, Cu, and Hg.

3.7. Potential-Ecological-Risk Index (PERI)

Figure 4 and Supplementary Table S16 show each element’s ecological-risk factors (Eri) and the potential ecological-risk index (PERI) for the heavy metals in the soils at sites S1, S2, and S3. At site S1, the mean Eri values were as follows, in descending order: As > Hg > Cd > Cu > Pb > Co > Cr > Zn. A low potential ecological risk was found for Cd, Co, Cr, Cu, Pb, and Zn, while a moderate level was found for Hg, and a considerable was observed for As. At site S2, the mean Eri values were as follows in decreased order: As > Hg > Cd > Cu > Co > Pb > Cr > Zn. A low potential ecological risk was found for Cd, Co, Cr, Cu, Pb, and Zn, a moderate potential ecological risk was found for Hg, and considerable risk was found for As. For site S3, the mean Eri was as follows in descending order: Pb > Cd > Hg > As > Co > Cu > Cr > Zn. A low potential ecological risk was found for all the elements except for Pb, which indicated a high potential ecological risk. Figure 4 shows graphically the PERI results for sites S1, S2, and S3. At site S1, the mean PERI value was 222, presenting a moderate ecological risk, with the highest contributions from As (51.7%), Hg (29.8%), and Cd (10.7%). At site S2, the mean PERI value was 177, indicating that there was a moderate ecological risk, on average. Here, the highest contributions were mainly from As (45.8%), Hg (27.2%), and Cd (16.7%). Finally, the average PERI value at site S3 was 317, so the ecological risk was considerable, with the highest contribution generated by Pb (79.8%), which may have been influenced by the high content in one of its samples (800 mg/kg). Therefore, it can be concluded that, in general, As, Hg, Cd, and Pb were the elements with the highest PERI contributions, which could have been influenced by their high toxicity response factor (Tir) values [36].

3.8. Risk to Human Health

An assessment of the risk to health in children and adults, which may be caused by the presence of potentially hazardous elements in the soils of illegal landfills and/or former landfills corresponding to sites S1, S2, and S3, was carried out. Supplementary Table S3 presents the parameters used for the calculation of the carcinogenic and non-carcinogenic risks. Parameters such as gastrointestinal absorption factor (ABSGI), reference dose (RfD), and slope factor (SF) for the ingestion, dermal contact, and inhalation routes are presented in Supplementary Table S4.

3.8.1. Non-Carcinogenic Risk

Figure 5 and Supplementary Tables S18–S20 show the non-carcinogenic-risk index (HI) values on a percentile basis for sites S1, S2, and S3, respectively. In Supplementary Table S17, it can be seen that, in general, at the three sites studied, the risk for children was higher than for adults, and the order of the non-cancer-risk quotient (HQ) of the exposure routes was as follows, in descending order: ingestion > dermal contact > inhalation. The results obtained for children indicated that at site S1, 87.5% of the Co and 21.9% of the As samples had HI values higher than 1, so children are likely to experience non-carcinogenic effects from these elements. These were mainly generated via the ingestion route in 87.5% of the Co samples and 18.8% of the As samples. The rest of the elements did not present a possible risk to children, as their hazard indexes (HI) were lower than 1. Regarding site S2, it was found that, in general, the heavy metals studied did not present a risk to children’s health, as the HI values were lower than 1, except for As and Co, with only 5.0% of the samples showing values higher than 1. For site S3, the HI values for children were higher than 1 in 33.3% of the samples of Co, 9.5% of As, and 4.8% of Pb. Ingestion was the strongest route of exposure, with values above the risk limit in 28.6%, 9.5%, and 4.8% of the samples of Co, As and Pb, respectively, so children may experience adverse non-carcinogenic effects from these elements.
On the other hand, it was found that at S1, S2, and S3, adults were not exposed to adverse health effects from any of the elements studied, as the resulting HI values were less than 1 in all the samples. Therefore, at all three sites, children were the most vulnerable to heavy-metal contamination, as they had the highest HI values, mainly through the ingestion route.

3.8.2. Carcinogenic Risk

Figure 5 and Supplementary Table S21 show the total carcinogenic risk (TCR) values on a percentile basis for sites S1, S2, and S3. In Supplementary Table S17, it can be seen that, in general, at the three sites studied, the risk for children was higher than for adults, and the carcinogenic risk (CR) of the routes of exposure were as follows, in descending order: ingestion > dermal contact > inhalation. The results for the carcinogenic risk for children showed that at sites S1, S2, and S3, Cd was the only element that indicated a likelihood of some risk of children experiencing carcinogenic health effects, due to the presence of samples exceeding the CR > 1 × 10⁻⁴ limit at rates of 84.4% at site S1, 30.0% at site S2, and 33.3% at site S3. Ingestion (CRIng) was the main hazardous pathway, and the only route exceeding the risk limit, with rates of 75.0% of the samples from site S1, 15.0% from site S2, and 14.3% from site S3. The rest of the elements (As, Cr (VI), Ni, and Pb) did not present harmful effects on children, as the results obtained were lower than 1 × 10⁻⁴ in all their samples. Regarding the carcinogenic risk for adults, in all three study sites, all the CR samples of As, Cd, Cr (VI), Ni, and Pb were below the carcinogenic-risk limit of 1 × 10⁻⁴. Therefore, none of these potentially carcinogenic elements presented a risk of possible adverse health effects on adults. Therefore, unlike adults, children are more exposed to health risks due to heavy metals, mainly Cd, via the ingestion route.

4. Conclusions

The results of this preliminary study may provide important information that could be useful for future studies on landfills in Chile, because there is a lack of studies of this type, and landfills can become major sources of heavy metals, high contents of which can pose risks to soils, humans, and the environment. It was found that the highest variabilities were generated by As, Pb, Hg, Se, and Mn at S1, As, Cu, Pb, Hg, and Se at S2, and Pb, As, and Hg at S3, which caused their distributions to present greater heterogeneity, which may be an indication of possible anthropogenic sources. In general, sites S1 and S2 showed several correlations between elements, in contrast to site S3, where these correlations were much weaker. At all three sites, an absence of As correlations with almost all the other elements was observed, indicating different behavior in terms of its distribution, which was also observed on the spatial-distribution maps. In addition, a reduction in several principal components was obtained, four of which were at site S1, five were at site S2, and six were at site S3, indicating the presence of several different sources. The geochemical-background values determined for each element across the soils without human intervention indicated that, in general, there were high percentages of contents exceeding the established limits, particularly those of Al, Ni, Hg, Cu, and Se in S1, Ni, Co, As, Ba, and Se in S2, and Co, B, Cd, Zn, and Mn in S3, with more than 50.0% of their samples possibly contaminated. The ecological indices indicated that practically all the elements present in the samples featured some degree of contamination, while the elements that posed the greatest risks to the soils were mainly Se and As at site S1, As at site S2, and Pb at site S3, which demonstrated the highest percentage of samples with the highest levels of contamination and enrichment. Regarding the risk to human health, the results indicated that adults were not likely to experience non-carcinogenic or carcinogenic effects from potentially hazardous metals at any of the three sites studied. In contrast, for children, Co was the main element indicating a likelihood of non-carcinogenic health effects at all three sites studied, with the highest risk at site S1. In addition, the As at sites S1 and S2 and the Pb at site S3 were also found to present a level of health hazard to children, but to a lesser extent than the Co. In terms of the carcinogenic risk, the Cd indicated a risk of harmful health effects for children at sites S1, S2, and S3. It is therefore recommended that the respective municipalities of Temuco, Villarrica, and Lonquimay carry out more efficient waste management and control, taking actions such as the transfer of waste to authorized landfills and the closure of the perimeter of each landfill, as most are freely accessible to the community, which makes it easier for inhabitants to dump various types of waste. In addition, it is recommended that methods are developed to reduce and diminish the pollution present in soils, as soils are essential resources for the environment and living beings.

Supplementary Materials

The following supporting information can be downloaded at: https://www.mdpi.com/article/10.3390/min13081033/s1. Figure S1: Left: Spatial distribution Al (d), B (e), Ba (f), Co (g), Cr (h), Cu (i), Fe (j), Hg (k), Mn (l), Ni (m), Se (n), V (o) y Zn (p) in soils of studied sites; Right: Box-Whisker plots of trace elements concentrations (mg kg−1) in simples extracted in sites S1 (n = 32), S2 (n = 20) y S3 (n = 21). Red lines are the BG values for S1, S2, and S3; Table S1: Detection limit for trace elments (mg kg−1); Table S2: Grade standards for potential ecological risks; Table S3: Values of parameters used in the equations concerning human health risk; Table S4: Values to determine the Hazard Quotient and Carcinogenic Risk; Table S5: Spearman’s correlation matrix for the trace elements in soils of site S1; Table S6: Spearman´s correlation matrix for the trace elements in soils of site S2; Table S7: Spearman´s correlation matrix for the trace elements in soils of site S3; Table S8: PCA results of the rotated component for trace elements in soils S1, S2 and S3. Table S9: Median concentrations of trace elements (mg kg−1) in soil of sites S1, S2 and S3 compared to values found in other studies. Table S10: Background concentrations (mg kg−1) of trace elements in site S1. Table S11: Background concentrations (mg kg−1) of trace elements in site S2. Table S12: Background concentrations (mg kg−1) of trace elements in site S3. Table S13: Number of samples in each category of ecological risk assessment in site S1. Table S14: Number of samples in each category of ecological risk assessment in site S2. Table S15: Number of samples in each category of ecological risk assessment in site S3. Table S16: Potential ecological risk index of a single element. Table S17: Non carcinogenic and carcinogenic risk for different exposure, pathways for adults and children in soils of sites S1, S2, and S3. Table S18: Non carcinogenic risk (HI) for adults and children in soils of site S1. Table S19: Non carcinogenic risk (HI) for adults and children in soils of site S2. Table S20: Non carcinogenic risk (HI) for adults and children in soils of site S3. Table S21: Carcinogenic risk (CR) for adults and children in soils of site S1, S2 and S3. Table S22: Media concentrations of trace elements (mg kg−1) in soils of sites S1, S2 and S3 and comparison with other studies. References [61,62,63,64] are cited in the supplementary materials.

Author Contributions

Conceptualization, P.T., Ó.C. and C.R.; methodology, P.T., C.R., Ó.C. and N.R.; software, C.R., J.B., B.S., P.T. and N.R.; investigation, P.T., C.R., Ó.C., J.B. and N.R.; data curation, C.R., Ó.C. and B.S.; writing—review and editing, C.R., P.T., Ó.C., J.B., B.S. and N.R.; project administration, P.T., C.R. and Ó.C. All authors have read and agreed to the published version of the manuscript.

Funding

This research received no external funding.

Data Availability Statement

The data that support the findings of this work are available from the corresponding author (Ó.C.) upon request.

Acknowledgments

We thank the referees and the editor for their thorough and timely reviews.

Conflicts of Interest

The authors declare no conflict of interest.

References

  1. Barbieri, M.; Sappa, G.; Vitale, S.; Parisse, B.; Battistel, M. Soil control of trace metals concentrations in landfills: A case study of the largest landfill in Europe, Malagrotta, Rome. J. Geochem. Explor. 2014, 143, 146–154. [Google Scholar] [CrossRef]
  2. Devic, G.J.; Ilic, M.V.; Zildzovic, S.N.; Avdalovic, J.S.; Miletic, S.B.; Bulatovic, S.S.; Vrvic, M.M. Investigation of potentially toxic elements in urban sediments in Belgrade, Serbia. J. Environ. Sci. Health A Toxic Hazard. Subst. Environ. Eng. 2020, 55, 765–775. [Google Scholar] [CrossRef]
  3. Ağca, N.; Özdel, E. Assessment of spatial distribution and possible sources of heavy metals in the soils of Sariseki-Dörtyol District in Hatay Province (Turkey). Environ. Earth Sci. 2014, 71, 1033–1047. [Google Scholar] [CrossRef]
  4. Argyraki, A.; Kelepertzis, E. Urban soil geochemistry in Athens, Greece: The importance of local geology in controlling the distribution of potentially harmful trace elements. Sci. Total Environ. 2014, 482–483, 366–377. [Google Scholar] [CrossRef] [PubMed]
  5. Tume, P.; King, R.; González, E.; Bustamante, G.; Reverter, F.; Roca, N.; Bech, J. Trace element concentrations in schoolyard soils from the port city of Talcahuano, Chile. J. Geochem. Explor. 2014, 147, 229–236. [Google Scholar] [CrossRef]
  6. Osibote, A.; Oputu, O. Fate and partitioning of heavy metals in soils from landfill sites in Cape Town, South Africa: A health risk approach to data interpretation. Environ. Geochem. Health 2020, 42, 283–312. [Google Scholar] [CrossRef] [PubMed]
  7. Ogunbanjo, O.; Onawumi, O.; Gbadamosi, M.; Ogunlana, A.; Anselm, O. Chemical speciation of some heavy metals and human health risk assessment in soil around two municipal dumpsites in Sagamu, Ogun state, Nigeria. Chem. Speciat. Bioavailab. 2016, 28, 142–151. [Google Scholar] [CrossRef]
  8. Akanchise, T.; Boakye, S.; Borquaye, L.S.; Dodd, M.; Darko, G. Distribution of heavy metals in soils from abandoned dump sites in Kumasi, Ghana. Sci. Afr. 2020, 10, e00614. [Google Scholar] [CrossRef]
  9. Konstantinova, E.; Minkina, T.; Sushkova, S.; Konstantinov, A.; Rajput, V.D.; Sherstnev, A. Urban soil geochemistry of an intensively developing Siberian city: A case study of Tyumen, Russia. J. Environ. Manag. 2019, 239, 366–375. [Google Scholar] [CrossRef]
  10. Cittadino, A.; Ocello, N.; Majul, M.V.; Ajhuacho, R.; Dietrich, P.; Igarzabal, M.A. Heavy metal pollution and health risk assessment of soils from open dumps in the Metropolitan Area of Buenos Aires, Argentina. Environ. Monit. Assess. 2020, 192, 291. [Google Scholar] [CrossRef]
  11. Díaz Rizo, O.; Hernández Merlo, M.; Echeverría Castillo, F.; Arado López, J.O. Assessment of Metal Pollution in Soils From a Former Havana (Cuba) Solid Waste Open Dump. Bull. Environ. Contam. Toxicol. 2012, 88, 182–186. [Google Scholar] [CrossRef]
  12. Alghamdi, A.G.; Aly, A.A.; Ibrahim, H.M. Assessing the environmental impacts of municipal solid waste landfill leachate on groundwater and soil contamination in western Saudi Arabia. Arab. J. Geosci. 2021, 14, 350. [Google Scholar] [CrossRef]
  13. Obiri-Nyarko, F.; Duah, A.A.; Karikari, A.Y.; Agyekum, W.A.; Manu, E.; Tagoe, R. Assessment of heavy metal contamination in soils at the Kpone landfill site, Ghana: Implication for ecological and health risk assessment. Chemosphere 2021, 282, 131007. [Google Scholar] [CrossRef] [PubMed]
  14. Guo, G.; Wu, F.; Xie, F.; Zhang, R. Spatial distribution and pollution assessment of heavy metals in urban soils from southwest China. J. Environ. Sci. 2012, 24, 410–418. [Google Scholar] [CrossRef]
  15. Ahumada, I.; Escudero, P.; Ascar, L.; Mendoza, J.; Richter, P. Extractability of Arsenic, Copper, and Lead in Soils of a Mining and Agricultural Zone in Central Chile. Commun. Soil Sci. Plant Anal. 2004, 35, 1615–1634. [Google Scholar] [CrossRef]
  16. Corradini, F.; Meza, F.; Calderón, R. Trace element content in soil after a sediment-laden flood in northern Chile. J. Soils Sediments 2017, 17, 2500–2515. [Google Scholar] [CrossRef]
  17. Flynn, H.C.; Mc Mahon, V.; Diaz, G.C.; Demergasso, C.S.; Corbisier, P.; Meharg, A.A.; Paton, G.I. Assessment of bioavailable arsenic and copper in soils and sediments from the Antofagasta region of northern Chile. Sci. Total Environ. 2002, 286, 51–59. [Google Scholar] [CrossRef]
  18. Parra, S.; Bravo, M.A.; Quiroz, W.; Moreno, T.; Karanasiou, A.; Font, O.; Vidal, V.; Cereceda, F. Distribution of trace elements in particle size fractions for contaminated soils by a copper smelting from different zones of the Puchuncaví Valley (Chile). Chemosphere 2014, 111, 513–521. [Google Scholar] [CrossRef]
  19. Reyes, A.; Cuevas, J.; Fuentes, B.; Fernández, E.; Arce, W.; Guerrero, M.; Letelier, M.V. Distribution of potentially toxic elements in soils surrounding abandoned mining waste located in Taltal, Northern Chile. J. Geochem. Explor. 2021, 220, 106653. [Google Scholar] [CrossRef]
  20. Reyes, A.; Thiombane, M.; Panico, A.; Daniele, L.; Lima, A.; Di Bonito, M.; De Vivo, B. Source patterns of potentially toxic elements (PTEs) and mining activity contamination level in soils of Taltal City (northern Chile). Environ. Geochem. Health 2020, 42, 2573–2594. [Google Scholar] [CrossRef]
  21. Salmanighabeshi, S.; Palomo-Marín, M.R.; Bernalte, E.; Rueda-Holgado, F.; Miró-Rodríguez, C.; Fadic-Ruiz, X.; Vidal-Cortez, V.; Cereceda-Balic, F.; Pinilla-Gil, E. Long-term assessment of ecological risk from deposition of elemental pollutants in the vicinity of the industrial area of Puchuncaví-Ventanas, central Chile. Sci. Total Environ. 2015, 527–528, 335–343. [Google Scholar] [CrossRef]
  22. Tume, P.; Acevedo, V.; Roca, N.; Ferraro, F.X.; Bech, J. Potentially toxic elements concentrations in schoolyard soils in the city of Coronel, Chile. Environ. Geochem. Health 2021, 44, 1521–1535. [Google Scholar] [CrossRef]
  23. Tume, P.; Barrueto, K.; Olguin, M.; Torres, J.; Cifuentes, J.; Ferraro, F.X.; Roca, N.; Bech, J.; Cornejo, O. The influence of the industrial area on the pollution outside its borders: A case study from Quintero and Puchuncavi districts, Chile. Environ. Geochem. Health 2020, 42, 2557–2572. [Google Scholar] [CrossRef] [PubMed]
  24. Tume, P.; González, E.; King, R.W.; Cuitiño, L.; Roca, N.; Bech, J. Distinguishing between natural and anthropogenic sources for potentially toxic elements in urban soils of Talcahuano, Chile. J. Soils Sediments 2018, 18, 2335–2349. [Google Scholar] [CrossRef]
  25. Tume, P.; González, E.; King, R.W.; Monsalve, V.; Roca, N.; Bech, J. Spatial distribution of potentially harmful elements in urban soils, city of Talcahuano, Chile. J. Geochem. Explor. 2018, 184, 333–344. [Google Scholar] [CrossRef]
  26. Tume, P.; González, E.; Reyes, F.; Fuentes, J.P.; Roca, N.; Bech, J.; Medina, G. Sources analysis and health risk assessment of trace elements in urban soils of Hualpen, Chile. CATENA 2019, 175, 304–316. [Google Scholar] [CrossRef]
  27. Tume, P.; Roca, N.; Rubio, R.; King, R.; Bech, J. An assessment of the potentially hazardous element contamination in urban soils of Arica, Chile. J. Geochem. Explor. 2018, 184, 345–357. [Google Scholar] [CrossRef]
  28. CENMA. Informe Final Corregido 3. “Estudio de Riesgo Ambiental de Suelos de la Región de la Araucanía: Investigación Preliminar y Análisis Confirmatorio” (Contrato No: 608897-20-LP16); CENMA: Madrid, Spain, 2017. [Google Scholar]
  29. MAPA. Official Analytical Methods for Soils and Water; Spanish Ministry of Agriculture, Fisheries and Food: Madrid, Spain, 1994. [Google Scholar]
  30. RStudio Team. RStudio: Integrated Development Environment for R (Version 1.4.1106) [Computer Software]. 2021. Available online: http://www.rstudio.com/ (accessed on 18 September 2021).
  31. Reimann, C.; Filzmoser, P.; Hron, K.; Kynčlová, P.; Garrett, R.G. A new method for correlation analysis of compositional (environmental) data–a worked example. Sci. Total Environ. 2017, 607–608, 965–971. [Google Scholar] [CrossRef]
  32. Filzmoser, P.; Hron, K.; Reimann, C. Principal component analysis for compositional data with outliers. Environmetrics 2009, 20, 621–632. [Google Scholar] [CrossRef]
  33. Vaziri, A.; Nazarpour, A.; Ghanavati, N.; Babainejad, T.; Watts, M.J. An integrated approach for spatial distribution of potentially toxic elements (Cu, Pb and Zn) in topsoil. Sci. Rep. 2021, 11, 7806. [Google Scholar] [CrossRef]
  34. Reimann, C.; Filzmoser, P.; Fabian, K.; Hron, K.; Birke, M.; Demetriades, A.; Dinelli, E.; Ladenberger, A. The concept of compositional data analysis in practice—Total major element concentrations in agricultural and grazing land soils of Europe. Sci. Total Environ. 2012, 426, 196–210. [Google Scholar] [CrossRef] [PubMed]
  35. Matschullat, J.; Ottenstein, R.; Reimann, C. Geochemical background–can we calculate it? Environ. Geol. 2000, 39, 990–1000. [Google Scholar] [CrossRef]
  36. Neaman, A.; Valenzuela, P.; Tapia-Gatica, J.; Selles, I.; Novoselov, A.A.; Dovletyarova, E.A.; Yáñez, C.; Krutyakov, Y.A.; Stuckey, J.W. Chilean regulations on metal-polluted soils: The need to advance from adapting foreign laws towards developing sovereign legislation. Environ. Res. 2020, 185, 109429. [Google Scholar] [CrossRef]
  37. Reimann, C.; Filzmoser, P.; Garrett, R.G. Background and threshold: Critical comparison of methods of determination. Sci. Total Environ. 2005, 346, 1–16. [Google Scholar] [CrossRef] [PubMed]
  38. Jarva, J.; Tarvainen, T.; Reinikainen, J.; Eklund, M. TAPIR—Finnish national geochemical baseline database. Sci. Total Environ. 2010, 408, 4385–4395. [Google Scholar] [CrossRef]
  39. Ander, E.L.; Johnson, C.C.; Cave, M.R.; Palumbo-Roe, B.; Nathanail, C.P.; Lark, R.M. Methodology for the determination of normal background concentrations of contaminants in English soil. Sci. Total Environ. 2013, 454–455, 604–618. [Google Scholar] [CrossRef] [Green Version]
  40. da Silva, E.B.; Gao, P.; Xu, M.; Guan, D.; Tang, X.; Ma, L.Q. Background concentrations of trace metals As, Ba, Cd, Co, Cu, Ni, Pb, Se, and Zn in 214 Florida urban soils: Different cities and land uses. Environ. Pollut. 2020, 264, 114737. [Google Scholar] [CrossRef]
  41. Müller, G. Index of geoaccumulation in sediments of the Rhine River. GeoJournal 1969, 2, 108–118. [Google Scholar]
  42. Mazurek, R.; Kowalska, J.; Gąsiorek, M.; Zadrożny, P.; Józefowska, A.; Zaleski, T.; Kępka, W.; Tymczuk, M.; Orłowska, K. Assessment of heavy metals contamination in surface layers of Roztocze National Park forest soils (SE Poland) by indices of pollution. Chemosphere 2017, 168, 839–850. [Google Scholar] [CrossRef]
  43. Kowalska, J.B.; Mazurek, R.; Gąsiorek, M.; Zaleski, T. Pollution indices as useful tools for the comprehensive evaluation of the degree of soil contamination–A review. Environ. Geochem. Health 2018, 40, 2395–2420. [Google Scholar] [CrossRef] [Green Version]
  44. Loska, K.; Wiechuła, D.; Korus, I. Metal contamination of farming soils affected by industry. Environ. Int. 2004, 30, 159–165. [Google Scholar] [CrossRef]
  45. Aydi, A. Assessment of heavy metal contamination risk in soils of landfill of Bizerte (Tunisia) with a focus on application of pollution indicators. Environ. Earth Sci. 2015, 74, 3019–3027. [Google Scholar] [CrossRef]
  46. Hakanson, L. An ecological risk index for aquatic pollution control.a sedimentological approach. Water Res. 1980, 14, 975–1001. [Google Scholar] [CrossRef]
  47. Liu, B.; Xu, M.; Wang, J.; Wang, Z.; Zhao, L. Ecological risk assessment and heavy metal contamination in the surface sediments of Haizhou Bay, China. Mar. Pollut. Bull. 2021, 163, 111954. [Google Scholar] [CrossRef] [PubMed]
  48. Duan, B.; Zhang, W.; Zheng, H.; Wu, C.; Zhang, Q.; Bu, Y. Comparison of Health Risk Assessments of Heavy Metals and As in Sewage Sludge from Wastewater Treatment Plants (WWTPs) for Adults and Children in the Urban District of Taiyuan, China. Int. J. Environ. Res. Public Health 2017, 14, 1194. [Google Scholar] [CrossRef] [PubMed] [Green Version]
  49. Oh, S.; Bade, R.; Lee, H.; Choi, J.; Shin, W.S. Risk assessment of metal(loid)-contaminated soils before and after soil washing. Environ. Earth Sci. 2015, 74, 703–713. [Google Scholar] [CrossRef]
  50. Antoniadis, V.; Shaheen, S.M.; Levizou, E.; Shahid, M.; Niazi, N.K.; Vithanage, M.; Ok, Y.S.; Bolan, N.; Rinklebe, J. A critical prospective analysis of the potential toxicity of trace element regulation limits in soils worldwide: Are they protective concerning health risk assessment?-A review. Environ. Int. 2019, 127, 819–847. [Google Scholar] [CrossRef]
  51. USEPA. Supplemental Guidance for Developing Soil Screening Levels for Superfund Sites; United States Environment Protection Agency: Washington, DC, USA, 2002.
  52. USEPA. Risk Assessment Guidance for Superfund: Volume III-Part A, Process for Conducting Probabilistic Risk Assessment; EPA 540-R-02-002; Office of Emergency and Remedial Response: Washington, DC, USA, 2001.
  53. Zeng, F.; Wei, W.; Li, M.; Huang, R.; Yang, F.; Duan, Y. Heavy Metal Contamination in Rice-Producing Soils of Hunan Province, China and Potential Health Risks. Int. J. Environ. Res. Public Health 2015, 12, 15584–15593. [Google Scholar] [CrossRef]
  54. Khan, S.; Cao, Q.; Zheng, Y.M.; Huang, Y.Z.; Zhu, Y.G. Health risks of heavy metals in contaminated soils and food crops irrigated with wastewater in Beijing, China. Environ. Pollut. 2008, 152, 686–692. [Google Scholar] [CrossRef]
  55. Kabata-Pendias, A. Trace Elements in Soils and Plants, 3rd ed.; CRC Press: Boca Raton, FL, USA, 2001. [Google Scholar]
  56. Shankar, S.; Shanker, U.; Shikha. Arsenic Contamination of Groundwater: A Review of Sources, Prevalence, Health Risks, and Strategies for Mitigation. Sci. World J. 2014, 2014, 304524. [Google Scholar] [CrossRef]
  57. Schenato, F.; Schröder, N.; Martins, F. Assessment of Contaminated Soils by Heavy Metals in Municipal Solid Waste Landfills in Southern Brazil. 2008. Available online: https://www.researchgate.net/publication/228657405_Assessment_of_contaminated_soils_by_heavy_metals_in_municipal_solid_waste_landfills_in_southern_Brazil (accessed on 8 June 2021).
  58. Herrero, M.; Rovira, J.; Marquès, M.; Nadal, M.; Domingo, J.L. Human exposure to trace elements and PCDD/Fs around a hazardous waste landfill in Catalonia (Spain). Sci. Total Environ. 2020, 710, 136313. [Google Scholar] [CrossRef] [PubMed]
  59. Augustin, P., Jr.; Viero, A. Environmental impact and geochemical behavior of soil contaminants from an industrial waste landfill in Southern Brazil. Environ. Earth Sci. 2012, 67, 1521–1530. [Google Scholar] [CrossRef]
  60. Aja, D.; Okolo, C.C.; Nwite, N.J.; Njoku, C. Environmental risk assessment in selected dumpsites in Abakaliki metropolis, Ebonyi state, southeastern Nigeria. Environ. Chall. 2021, 4, 100143. [Google Scholar] [CrossRef]
  61. Liu, K.; Shang, Q.; Wan, C. Sources and Health Risks of Heavy Metals in PM2.5 in a Campus in a Typical Suburb Area of Taiyuan, North China. Atmosphere 2018, 9, 46. [Google Scholar] [CrossRef] [Green Version]
  62. California Environmental Protection Agency (CalEPA). Revised Toxicity Criteria Rule Appendix 1—Tables A and B. August; California Environmental Protection Agency (CalEPA): Sacramento, CA, USA, 2018.
  63. Cesaro, A.; Belgiorno, V.; Gorrasi, G.; Viscusi, G.; Vaccari, M.; Vinti, G.; Jandric, A.; Dias, M.I.; Hursthouse, A.; Salhofer, S. A relative risk assessment of the open burning of WEEE. Environ. Sci. Pollut. Res. Int. 2019, 26, 11042–11052. [Google Scholar] [CrossRef] [PubMed] [Green Version]
  64. Gabarrón, M.; Faz, A.; Acosta, J.A. Soil or Dust for Health Risk Assessment Studies in Urban Environment. Arch. Environ. Contam. Toxicol. 2017, 73, 442–455. [Google Scholar] [CrossRef]
Figure 1. (a) Chile; (b) La Araucanía Region, Chile. Study sites S1, S2, and S3.
Minerals 13 01033 g001
Figure 2. (a) Site S1, situated in Temuco commune. (b) Site S2, situated in Villarrica commune. (c) Site S3, situated in Lonquimay commune. (red circle = sampling point).
Minerals 13 01033 g002aMinerals 13 01033 g002b
Figure 3. Left: Spatial distribution maps of As (a), Cd (b), and Pb (c) in soils of studied sites. Right: Box–Whisker plots of trace-elements content (mg kg−1) in samples extracted at sites S1 (n = 32), S2 (n = 20), and S3 (n = 21). Red lines are the BG values for sites S1, S2, and S3. The BG value of S2 in (a) is not shown because its value is equal to that of S1 (0.83 mg kg−1), so the line of S1, which is straight, overlaps with the segmented line of S2.
Minerals 13 01033 g003aMinerals 13 01033 g003bMinerals 13 01033 g003c
Figure 4. PERI of PTE in soil samples from sites S1, S2, and S3.
Minerals 13 01033 g004
Figure 5. 95% upper limit (UCL95) of the non-carcinogenic hazard index (HI) and carcinogenic risk (CR) to children and adults from all elements in soils at sites S1, S2, and S3. At the three sites studied, children could experience non-carcinogenic effects from Co and in some samples from As, in addition to carcinogenic risk from Cd. Adults did not indicate a possible health risk.
Minerals 13 01033 g005
Table 1. Statistical summary of physical and chemical parameters (mg kg−1) found in soil samples at sites S1, S2, and S3.
Site pHAsBaCdCrCuHgNiPbVZn
S1Mean6.99.516518.226.285.30.0720.718.2193149
(n = 32)Median6.83.115817.225.284.30.0620.810.3182136
Min–max6.0–7.90.83–43.056.2–2889.6–27.513.8–44.144–1670.02–0.3615.3–27.61.1–75.8109–30271.2–425
SD a0.5611.968.64.98.323.10.063.219.757.768.5
CV b (%)8.11254227322788151083046
MAD c0.433.366.44.69.120.90.03313.668.441.2
Number of samples exceeding GBL 16196321232412514
GBL (background value) 0.8314322.83876.60.0417.817.6258145
S2Mean6.96.791.911.120.281.10.0623.410.411296.6
(n = 20)Median7.15.994.7112067.70.0521.49.811082.3
Min–max5.4–8.00.83–23.431.2–1584.9–15.412.2–28.424.3–3850.02–0.1913.1–50.11.1–31.565–16547.2–202
SD a0.626.742.83.14.674.80.0488.422.743.9
CV b (%)8.999.5472823927434812045
MAD c0.297.558.63.54.926.70.032.58.615.732.4
Number of samples exceeding GBL 111199101016867
GBL (background value) 0.8378.211.320.567.90.0519.312119102
S3Mean6.7668.712.56.849.90.0110.448.912076.6
(n = 21)Median6.70.836812.46.248.60.019.26.512175.7
Min–max6.3–7.50.83–30.730.6–86.39.6–15.54.7–12.730.2–72.40.01–0.046.3–25.21.1–80091.3–16454.4–117
SD a0.318.813.31.52.190.014.61731611.5
CV b (%)4.61501912321863453531315
MAD c0.260.8311.81.20.917.402.1816.57
Number of samples exceeding GBL 6171911112121619
GBL (background value) 8.959.210.112.347.80.0216.7110868.1
a Standard deviation. b Coefficient of variation. c Median absolute deviation.
Disclaimer/Publisher’s Note: The statements, opinions and data contained in all publications are solely those of the individual author(s) and contributor(s) and not of MDPI and/or the editor(s). MDPI and/or the editor(s) disclaim responsibility for any injury to people or property resulting from any ideas, methods, instructions or products referred to in the content.

