Article

Structure and Distribution of the Gold-Related Quartz Vein Systems in the Southwestern Part of the Barberton Greenstone Belt (South Africa, Eswatini)

1
Géosciences Montpellier, CNRS (Centre National de la Recherche Scientifique), University of Montpellier, CC60 Montpellier, France
2
Department of Geology, University of Johannesburg, Johannesburg P.O. Box 524, South Africa
*
Author to whom correspondence should be addressed.
Minerals 2023, 13(8), 1034; https://doi.org/10.3390/min13081034
Submission received: 5 June 2023 / Revised: 25 July 2023 / Accepted: 29 July 2023 / Published: 1 August 2023
(This article belongs to the Section Mineral Deposits)

Abstract

:
This study investigates the structural control of the numerous gold occurrences in the southern part of the Barberton Greenstone Belt in the Malolotja and Steynsdorp areas. The gold-bearing event distribution is studied using field structural geology associated with a petrological and microstructural analysis. Three major tectonic events have been identified in quartz veins and direct country rocks. The first event (De) created a regional schistosity (Se), probably associated with an early thrusting event. The second event (Df) is related to a large-scale folding, which formed the anticline at Steynsdorp and synform at Malolotja. It resulted from a main E–W direction of shortening and is responsible for the folding of the Se schistosity. It formed a N–S-striking axial planar cleavage (Sf), observed and associated with the emplacement of the main gold-bearing veins. The mineralised system exhibits a complex vein network, in which shallow dipping veins have developed coevally with steep west- and east-dipping veins. A third deformation event (Dl) produced by NE–SW shortening is related to the late barren hydrothermal quartz vein formation. Mineralogically, the veins are filled with abundant quartz, and scarce tourmaline and feldspars. Alteration halos composed of neoformed tourmaline and plagioclase within a talc and white mica matrix developed specifically during the late Dl event. A model of regional deformation giving rise to large-scale folds and quartz vein formation formed in response to E–W and NE–SW directions of shortening globally is proposed and discussed in this paper.

1. Introduction

The Archean geological record presents many singularities, which makes it distinct from the modern one. First of all, the Archean Eon is characterised by intense magmatic activity [1], with a hotter mantle [2,3] forming large continental Na-rich granite-gneissic crust of TTG (tonalite, trondhjemite, granodiorite [4]). Supracrustal rocks surrounding TTG domains, called greenstone belts, are also emblematic of the Archean Eon. They occur as elongated shapes of tight synforms and fault-bounded domains and are composed of volcano-sedimentary rocks, which were metamorphosed at greenschist to amphibolite facies conditions [5]. In addition, Archean geodynamics is inferred to differ from the modern one with a typical dome-and-keel geometry versus horizontal plate tectonics motion (e.g., [6,7]). The structural geology of greenstone belts is complicated by the fact that Archean deformation intensity seems weaker than in modern orogenic belts, with generally poorly expressed kinematic indicators [8], making it harder to unravel the tectonic evolution of Archean belts. Another particularity of the Archean domains is their metal enrichment, especially world-class gold deposits [9,10,11]. It is clear that, except for a few huge Mesozoic and Cenozoic epithermal/porphyry-type gold deposits (e.g., Rocky and the Andean Mountains, Central Asian Tian Shan, and Northern Pacific Basin), most of the world-class gold deposits are Archean. Structurally controlled orebodies are excellent markers of regional deformation [12], so combining structural observation of mineralised bodies and host rock allows for a better understanding of the tectonic evolution of the Archean study area.
The Barberton Greenstone Belt (BGB) in South Africa and Eswatini is an Archean belt with an estimated production of 342 tons of gold [13] with over 350 gold deposits and occurrences, including four major operating mines (Fairview, Sheba, New Consort, and Ages mines; Figure 1). The gold deposits and occurrences are distributed nonhomogeneously throughout the belt as most of them occur in volcano-sedimentary units near the margins of plutons along major tectonic structures, such as faults and folds [14]. Indeed, most of the gold deposits are located along the Moodies, Sheba, and Barbrook faults and Ulundi, Eureka, Steynsdorp, and Malolotja folds. The gold grade also appears to be heterogeneously distributed: major mines, such as New Consort, Sheba, and Fairview, are clustered in the Eureka and Ulundi synclines in the northern part of the belt, at the junction with the Jamestown schist belt. These three mines concentrate approximately 76% of the gold produced [15]. In contrast, there are low-grade clusters, such as Steynsdorp and Malolotja (this study), in which limited quantities of gold were extracted from historical small-scale artisanal mines (gold production estimated at about 1770 kg [16]).
This spatial distribution of gold deposits and occurrences and grade in the BGB seems structurally controlled; therefore, it is likely that gold mineralisation was formed and/or affected by the regional deformation of the belt. The most studied and best-known deposits are in Fairview, Sheba, and New Consort active mines (e.g., [17,18,19,20,21,22,23]). However, the southern gold-bearing occurrence cluster remains poorly studied. To fill this gap, this work focuses on the structural framework of gold-related occurrences within the southern part of the Barberton Greenstone Belt, especially in the Steynsdorp anticline and Malolotja synform, which host low-grade gold occurrences. This paper aims to establish the tectono-hydrothermal model of the southern part of the Barberton Greenstone Belt by studying vein systems, their alterations, and the host-rock structures. Using new detailed field, structural, microstructural, and mineralogical analysis of the study area, we investigate the structural control of the gold-related quartz veins in the southwestern part of the Barberton Greenstone Belt.

2. Geological Setting

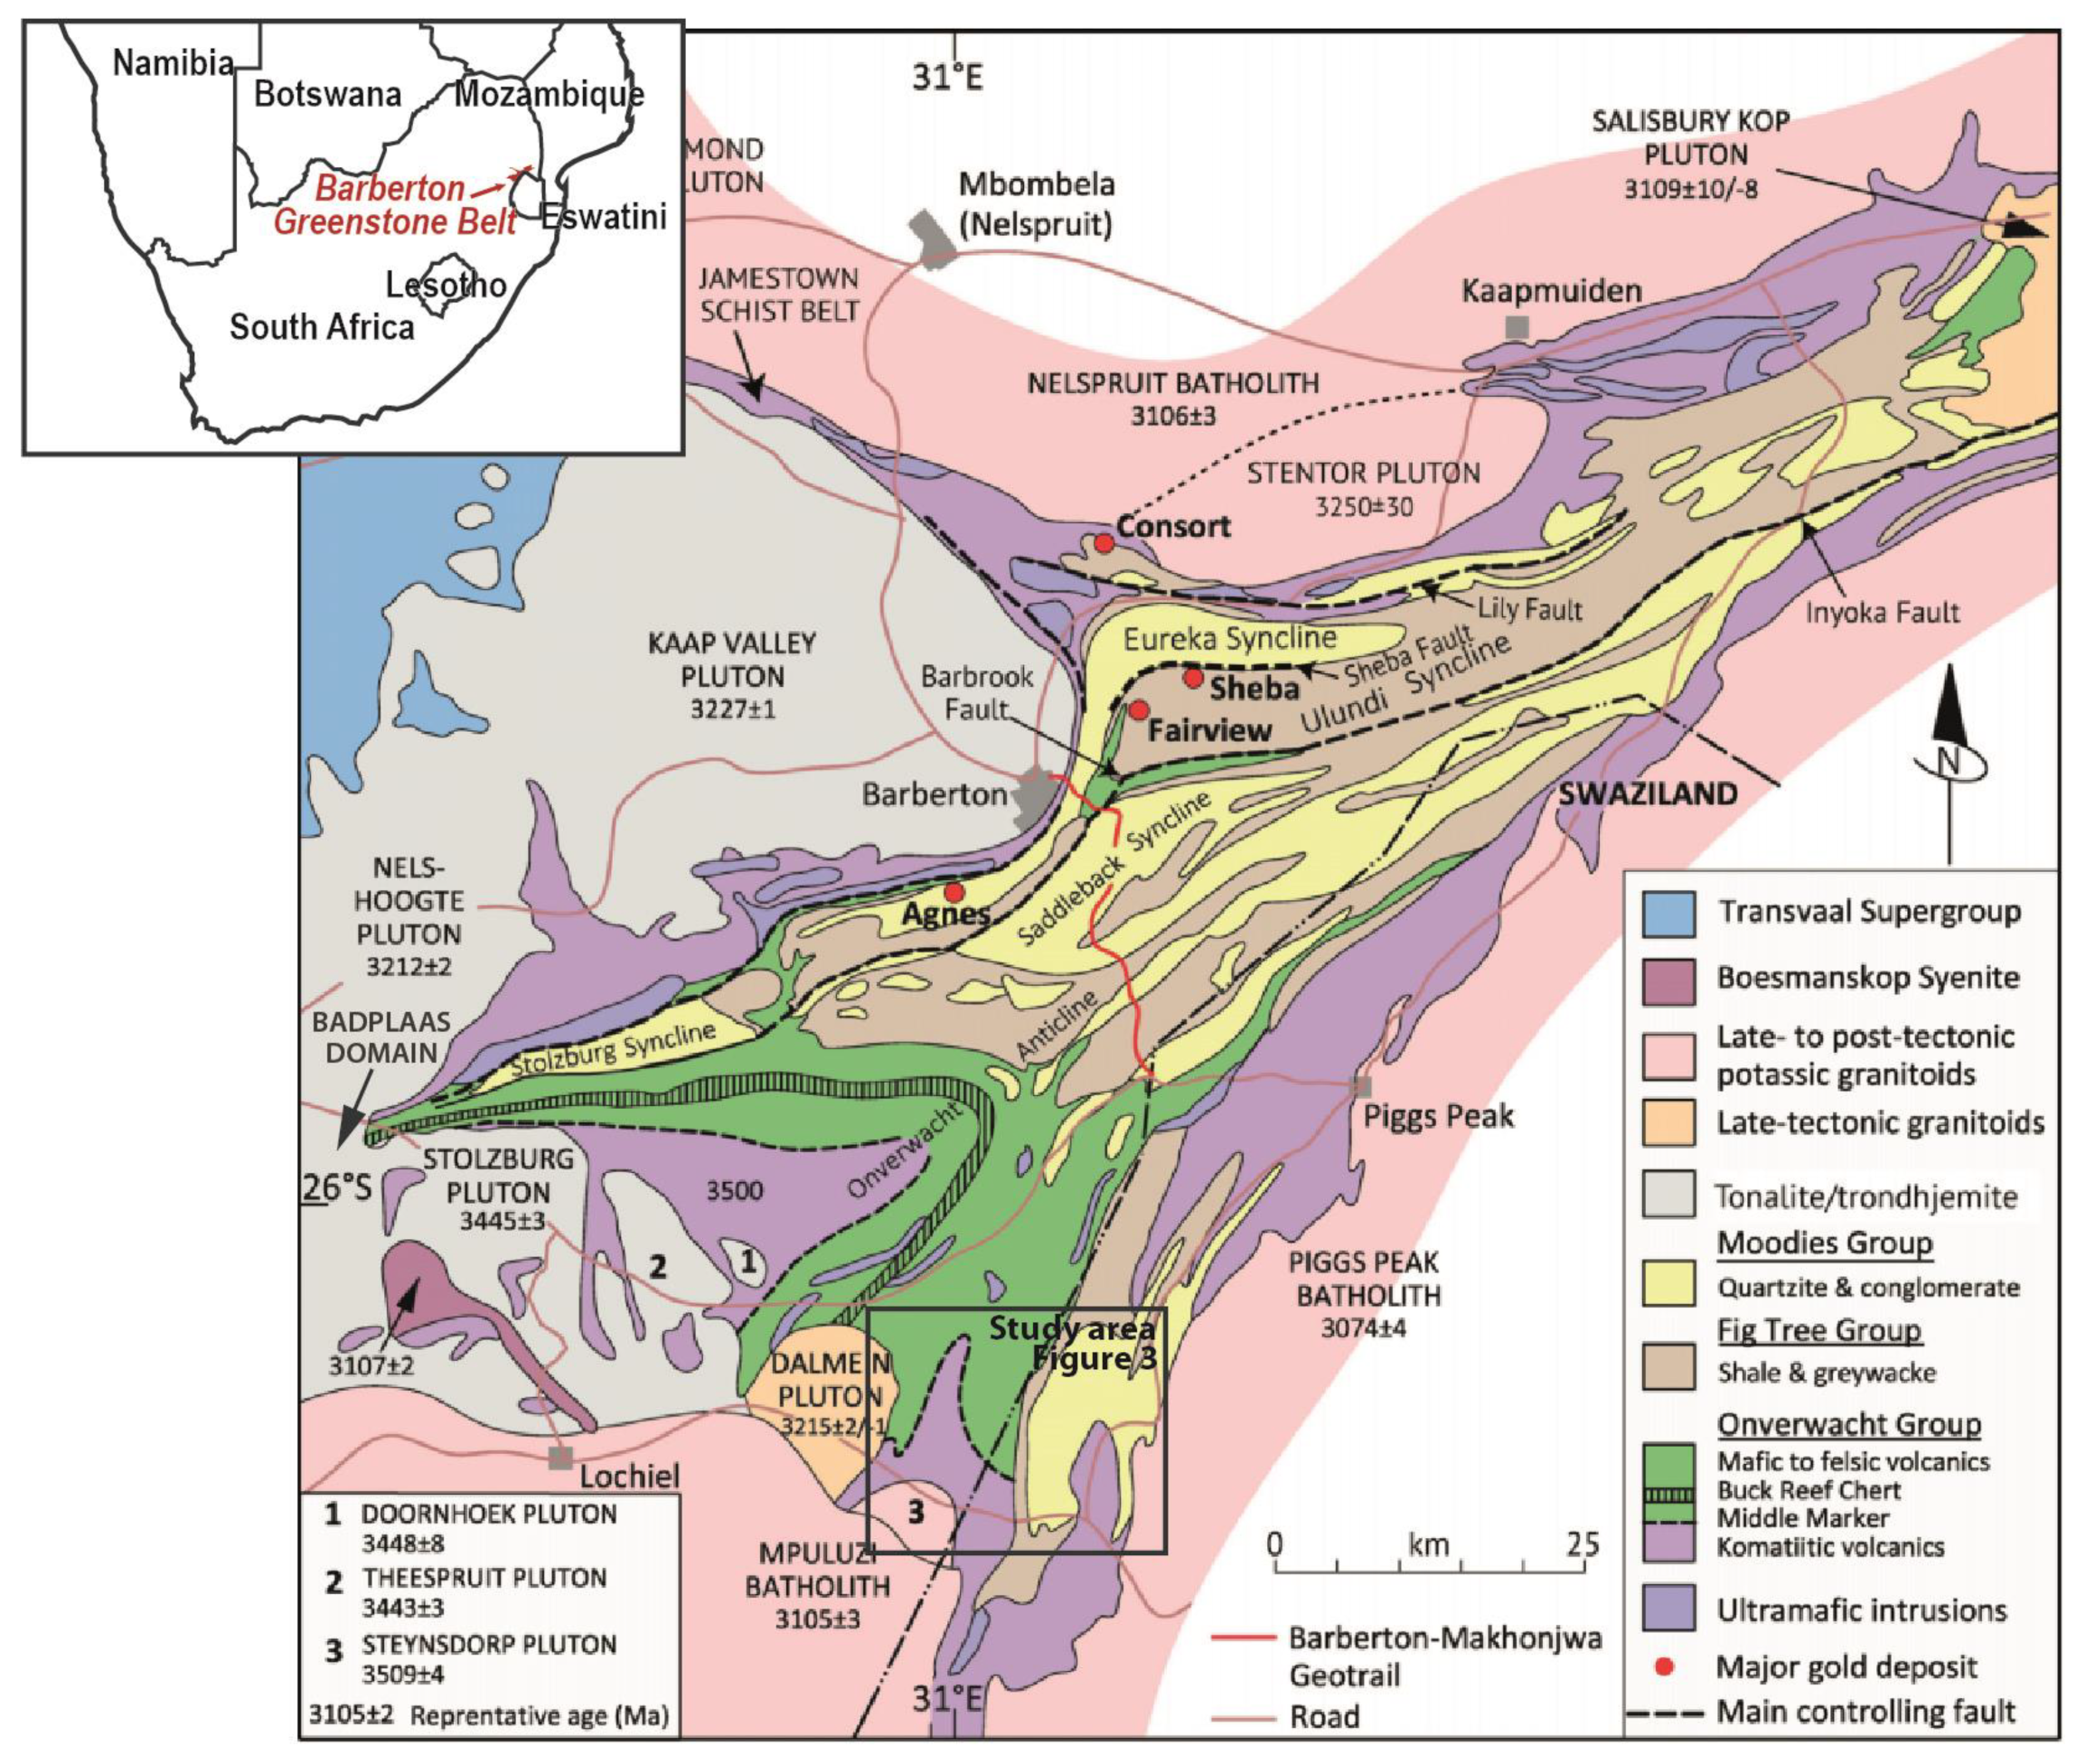
2.1. The Barberton Greenstone Belt and Surrounding Granitoids

The Barberton Greenstone Belt (BGB) is located along the northeastern edge of the Kaapvaal Craton, in the northeastern part of South Africa and the northwestern part of Eswatini. Measuring 120 km long and 50 km wide, this Archean belt is composed of volcano-sedimentary units surrounded by TTG rocks and intruded by numerous late potassic batholiths (Figure 1).
The stratigraphy of the BGB consists of three groups, from the oldest to the youngest—the Onverwacht, Fig Tree, and Moodies Groups [24]. The Onverwacht Group is mainly a mafic to ultramafic meta-volcano-sedimentary series [16,24,25] dated between ca. 3.55 and 3.29 Ga [26,27,28]. This group is composed of mafic to ultramafic volcanic units with interlayered felsic volcanic rocks and minor cherts [26,29]. The Fig Tree Group, dated at 3.28 to 3.22 Ga [26,27,28,30], is formed by felsic volcanic rocks and sedimentary units [26,31]. The Fig Tree Group is mainly a package of sandstones, shales, cherts, banded iron formations, and minor felsic volcanic rocks [31,32]. Last, the Moodies Group, dated from 3.22 to 3.21 Ga [33,34], represents the upper detrital series [35]. The Moodies Group is formed mainly of quartz-rich and felsic sandstones, conglomerates, and mudstones [33]. Facies and age differences between the SE and the NW parts of the BGB have been related to two distinct island arc terranes, named the southern and the northern terranes [36], or the eastern and the western domains [37].
Three main generations of TTGs were emplaced around the BGB. (i) South of the belt, the oldest one is the ca. 3.5 Ga Steynsdorp pluton [27,34], composed of highly deformed tonalite and trondhjemite [38,39]. (ii) The second generation is dated at 3440–3460 Ma and is represented by the TTGs forming the Stolzburg block [34,40], located in the southwestern part of the belt. The Stolzburg block is formed by three plutons, the Doornhoek trondhjemite, Theespruit gneiss, and Stolzburg gneiss, respectively, named from E to W. (iii) The latest generation of TTGs was formed at ca. 3.2 Ga, and they cluster mostly in two geographical domains. In the southwest part of the belt, the southwestern Badplaas domain includes the Rooihoogte pluton, the Batavia pluton, the Badplaas gneiss, and the Elandsfontein gneiss [28,41]. In the northeast part of the BGB, the Kaap Valley domain encompasses the Nelshoogte trondhjemite dated at 3236–3212 Ma [42,43] and the Kaap Valley tonalite dated at 3227 ± 1 Ma [34]. Located outside the main clusters, and to the south of the Stolzburg Block, the Dalmein pluton is the youngest TTG of the BGB. It is dated at 3215 ± 2 Ma and seems to crosscut the main NE–SW-trending structural grain of the BGB [30,34,44].
A late GMS (granite-monzogranite-syenite) suite, represented by four batholiths dated at around 3.1 Ga surrounds the BGB. The northern Nelspruit batholith is dated at 3106 ± 3 Ma [34], the eastern Pigg’s Peak granite is dated at 3140 ± 4 Ma or 3074 ± 4 Ma [43,45], and the southwestern Mpuluzi and the smallest Heerenveen batholiths are dated at 3107 + 4/−2 Ma and ca. 3110 Ma, respectively [34,46]. These large batholiths are synchronous with the Kees Zyn Doorns and Boesmanskop syenites located to the southwest of the BGB [47].
The Barberton Greenstone Belt was affected by lower greenschist facies of metamorphism [48,49], except within and in the vicinity of the Stolzburg block to the southwest [37,50,51,52] and around the Stentor pluton to the northeast [53] where higher grades of metamorphism were recorded. Metamorphic conditions of 650–700 °C and about 0.8–1.1 GPa [50,54] were reported within the southwestern block [37,51], while in the northeastern high-grade domain, the condition of the metamorphic peak was modelled to reach a temperature of 600–700 °C at a pressure of about 0.5 GPa [53].
The complex geological history of the Barberton Greenstone Belt led to contrasted tectonic models (e.g., [24,30,55,56,57]). We adopted the model classification of de Ronde and de Wit [30], which is more generalised for the belt scale (Figure 2). According to these authors, the architecture of the belt was shaped through five main tectono-metamorphic and magmatic phases:
  • At ca. 3.55 Ga, the mafic to ultramafic lavas of the lower Onverwacht Group were formed, likely on top of the Ancient Gneiss Complex [58,59,60]. A period of intra-oceanic activity may be genetically related to these lavas [60]. The subsequent melting of a continental shield gave rise to the Steynsdorp pluton [27,39]. Around 3458 Ma, an early D0 event occurred, which involved hydrothermal alteration [30].
  • At 3445–3416 Ma, an early phase of deformation D1 affected exclusively the Onverwacht Group [30]. This deformation was associated with the second generation of TTGs [30,34,39].
  • At 3229–3227 Ma, a second deformation phase, D2, affected the entire belt during NW–SE shortening. D2 occurred during the intrusion of several TTG plutons (Kaap Valley, Badplaas, Nelshoogte; [30]). This tectono-magmatic event may have been caused by the subduction of the SE block under an NW block [30,44,52,61,62] or by vertical mass redistribution driven by the density inversion between the rising lighter TTGs magmas and the overlying denser upper crustal material [63]. The D2 deformation is interpreted to be coeval with the formation of the Fig Tree Group in a foreland setting [64].
  • At 3226–3080 Ma, a renewed or continued NW–SE shortening accommodated by strike-slip shear zones created the D3 deformation and folded the earlier structures [30]. It marks the beginning of the collision and the suture formation between the two main NW and SE blocks [37]. In the belt, the Inyoka fault system corresponds to a large-scale thrust bringing the NW block in contact with the SE block [60]. Within the granite-gneiss block, this fault extends to a ductile deformation zone bringing in contact the Badplaas (NW) and the Stolzburg blocks (SE) [39,52]. In such a scenario, the Moodies Group sediments are interpreted as deposited in a syntectonic basin formed during the orogenic collapse that follows this event at 3.2 Ga [33].
  • At ca. 3080 Ma, the fourth and last deformation event D4 is characterised by extensional or transtension tectonics [30,65]. De Ronde and de Wit [30] connected this D4 deformation with the emplacement of late GMS batholiths.
Figure 2. Compilation of the major tectonic evolutionary models in the literature for the Barberton Greenstone Belt compiled by Dirks et al. [19]). The structural evolution proposed in this study is added (see Section 7 Discussion for explanation).
Minerals 13 01034 g002

2.2. Gold Mineralisation throughout the Barberton Greenstone Belt

Barberton’s gold mining history began in 1883 [15], and mining continues to this day through four main operating mines located to the northeast of the belt (see locations in Figure 1), three of which are also the most studied and best-known deposits: Fairview mine (e.g., [19,21]), Sheba mine (e.g., [17,18,19]) and New Consort mine (e.g., [20,22,23]). However, there are more than 300 gold occurrences in the entire Barberton Greenstone Belt [19], although most of the gold production currently comes from the four major active mines reported earlier.
The Sheba-Fairview complex is located in the northern part of the belt close to the Sheba Fault. The Sheba Fault juxtaposes the Moodies Group rocks of the Eureka syncline with the Fig Tree Group rocks of the Ulundi syncline (Figure 1). The gold mineralisation in the Sheba-Fairview complex is mainly described as a shear quartz-carbonate-sulphide lode, with sulphide dissemination in fractures or bedding parallel to shear zones [21,66], developed at greenschist facies conditions [67]. Alteration halos of fuchsite-carbonate-sericite-graphite are related to gold mineralisation [68]. The gold mineralisation occurs as refractory or micro-inclusions in sulphides (mostly in arsenopyrite and pyrite) or as free gold grains in veins and alteration halos [67,69]. Earlier work by de Ronde et al. [69] and de Ronde and de Wit [30] interpreted the gold event as the reactivation of older D2/D3 structures during late D3 NW–SE shortening. More recent research confirmed that mineralisation formed during a late stage of the D3 NW–SE shortening [68,70], although others related the gold-bearing event to the regional D4 extension tectonic event [19,71].
The New Consort gold mine is located further north of the Sheba and Fairview mines (Figure 1). It is situated on a band of BGB sandwiched between the Kaap Valley tonalite and the Stentor pluton, called the Jamestown schist belt [72]. New Consort mine is associated with highly deformed host rocks metamorphosed at amphibolite facies conditions [23,72,73]. Two mineralisation phases have been described by Otto et al. [23]. Earlier mineralisation is described as disseminated sulphides with calc-silicate alteration [23]. A second phase mineralisation is defined as high-grade brittle-ductile shear zones of quartz veining with silicate alteration and abundant arsenopyrite [22]. Gold mineralisation is associated with sulphides, mainly as native gold in arsenopyrite in veins and alteration halos [23]. The New Consort mineralisation is interpreted to be related to the de Ronde and de Wit [30] D3 event associated with diapiric emplacement of the neighbouring Nelspruit batholith or to D4 extensional shear zone network [22,73].
Several gold mineralisation ages have been published: New Consort gold mineralisation is dated at ca. 3027 ± 7 Ma [74], Golden Quarry (close to Sheba) at ca. 3009 ± 16–3017 ± 18 Ma [71], and Fairview at ca. 3084 ± 18 Ma [75]. The gold mineralisation age appears poorly constrained or shows that mineralisation took place over a long period.
Overall, there are two main theories on the interpretation of the Barberton gold mineralisation. According to different available models, it may have formed (i) either during a late phase of the NW–SE regional shortening episode, which reactivated older structures [21,66,69,70], (ii) or during a regional NW–SE extension phase, which postdated the tectonic and thermal stabilisation of the belt [23,71,74].

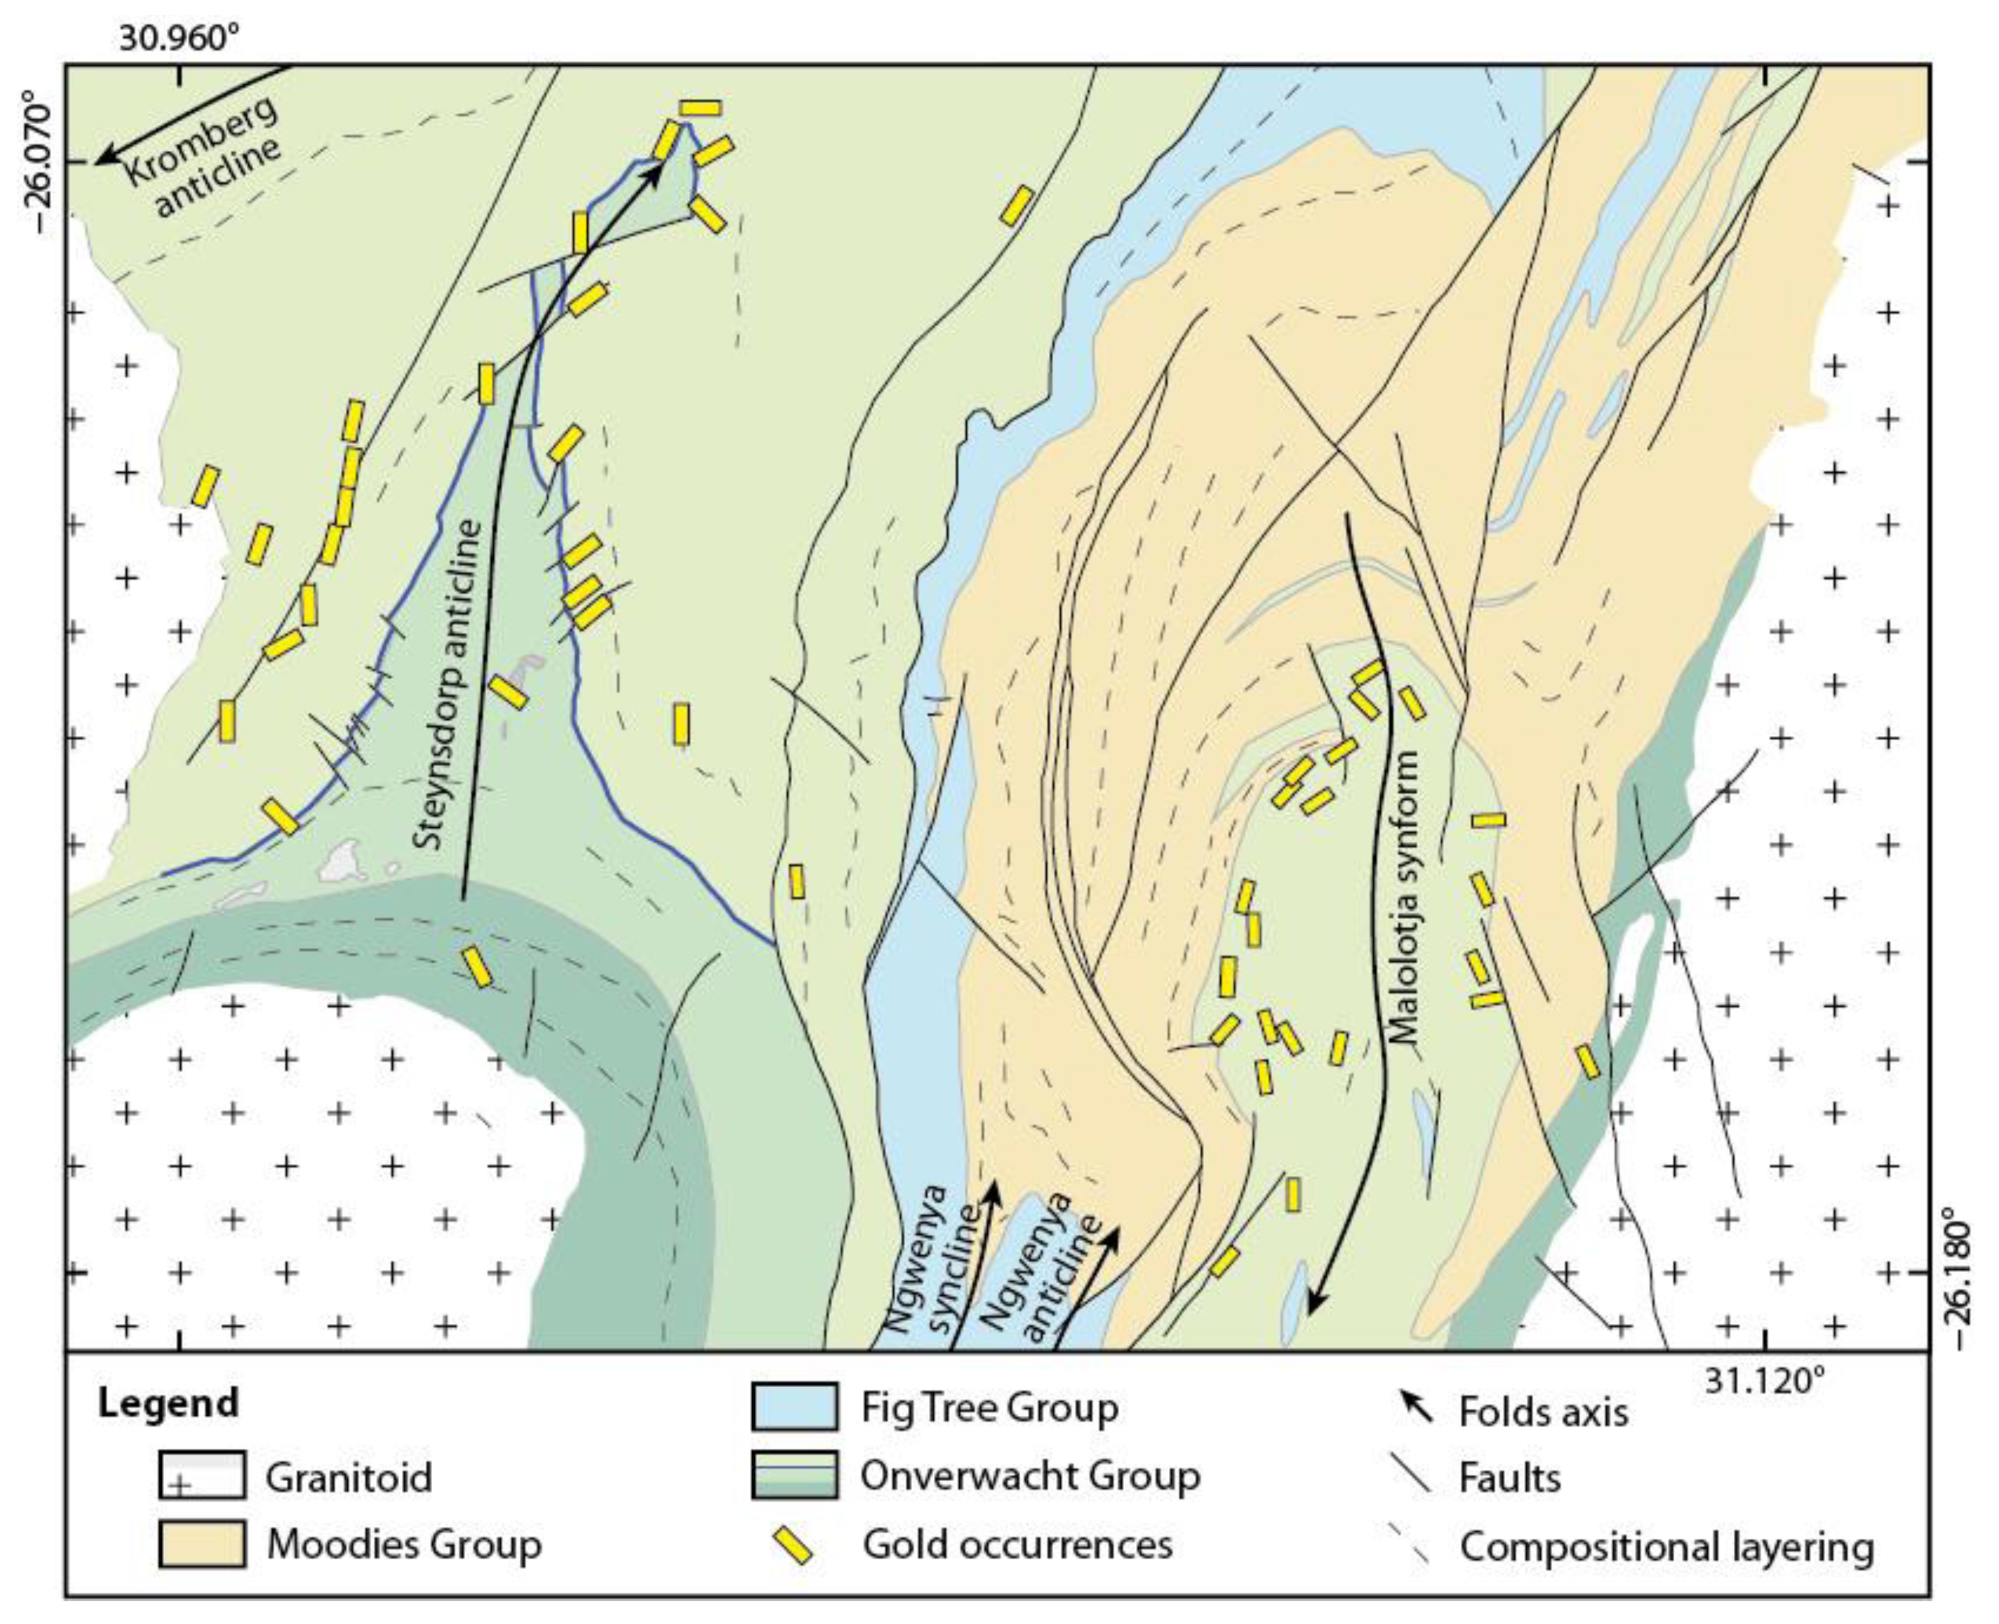
2.3. The Malolotja Synform and the Steynsdorp Anticline Areas and Their Gold Occurrences

The study area is located in the southwestern part of the Barberton Greenstone Belt, across the border between South Africa and Eswatini. This zone is formed of a succession of broadly NNE–SSW-trending regional folds, i.e., Kromberg antiform, Steynsdorp antiform, Ngwenya synform, Ngwenya antiform, and Malolotja synform (Figure 3; [65]). Two regional folds seem particularly well endowed with gold occurrences in this area: the Steynsdorp anticline and the Malolotja synform (Figure 3).
The Steynsdorp anticline is about 5 km wide and 11 km long, formed exclusively within the Onverwacht Group (Figure 3). It is located north of the BGB’s oldest pluton, the 3510 Ma Steynsdorp gneiss [27]. This fold is a north-plunging anticline, with a conical fold geometry in the vicinity of the pluton and a concentric geometry in the north [38]. Stratigraphically, the Steynsdorp anticline is formed by three of the seven individual formations that formed the overall Onverwacht Group (Sandspruit, Theespruit, Komati, Hooggenoeg, Noisy, Kromberg, and Mendon complexes; [76]). The stratigraphically and structurally lowest Theespruit Formation surrounds the Steynsdorp gneiss, while the upper Komati Formation with its Middle-Marker upper horizon (blue line in Figure 3) and Hooggenoeg Formation form the concentric part of the fold [29,38]. The Steynsdorp area has been interpreted to be the result of doming effect related to the Steynsdorp pluton emplacement during the regional WNW–ESE shortening [38]. An alternative model proposes the exhumation of the Steynsdorp gneiss and subsequent extensional detachment at the contact between the Komati Formation and the Theespruit Formation during a NE–SW extension forming a dome-and-keel structure [77,78]. The Steynsdorp anticline hosts more than 25 gold-related occurrences. The gold is mostly hosted as inclusion in pyrite and, to a lesser extent, in arsenopyrite; its source is interpreted to be the mafic to ultramafic volcanic rocks of the Onverwacht Group, based on trace element analyses of gold in Steynsdorp area rocks [29].
The Malolotja synform is about 4 km wide and 12 km long, to the west and adjacent to the 3140 Ma Pigg’s Peak batholith [45]. The Malolotja synform is cored by talc schists and cherts of the Onverwacht Group, which were recently correlated with Kromberg and Mendon Formations, based on new U-Pb ages [79]. The Moodies Group sandstones and minor conglomerates surround the Onverwacht Group core on the northern, western, and eastern sides of the fold, forming a tight and south-plunging synform [80]. This area has been interpreted to be refolded early NW-directed nappe of the upper Onverwacht Group over syntectonic sediments of the Moodies Group [79,80,81]. The Malolotja syncline hosts more than 20 gold occurrences, which are poorly documented in the available scientific literature. In the appendix of Anhaeusser [82], they are principally listed as “gold-quartz veins”.

3. Lithostratigraphy

Two lithological groups (Onverwacht and Moodies) and several intrusive rocks are present in the study area. The distribution of the Onverwacht and the Moodies Groups can be easily recognised in the landscape through their geomorphological difference. In the Malolotja area, for example, rocks of the Moodies Group form high-relief topography while the Onverwacht Group mainly forms valleys and rolling hills.
The Onverwacht Group in the Malolotja syncline is composed mainly of talc schists with variable carbonate content (magnesite and dolomite-ankerite, confirmed by energy-dispersive X-ray spectroscopy analyses) in compositional layers or disseminated in talc schists (Figure 4a,b). This unit is penetratively affected by a strong cleavage marked by iron-rich micas and talc. The carbonates are commonly completely weathered, and only boxworks remain (Figure 4a). In some areas, especially near mining works, the schists are highly altered and produce alternating mm thick brown-red, ochre, and green compositional layering (Figure 4c). This unit also consists of chert beds of variable (cm to m) thickness, of white, black, and green colour.
The Moodies Group at Malolotja synform is mainly composed of medium-to-coarse-grained quartz arenites, which locally contain quartz pebbles. Clasts are mainly composed of quartz, and minor K-feldspar and plagioclase with interstitial white mica. The local matrix-supported conglomerate is interlayered in the quartz arenite. Clasts in the conglomerate are subrounded to subangular pebble-to-cobble-sized white quartz and chert. The Malolotja syncline is intruded to the east by Pigg’s Peak batholith, which is granite cut by numerous pegmatite and aplitic veins.
In the Steynsdorp anticline, the lower structural unit is represented by the Steynsdorp granite-gneiss, recognisable as a north-convex half-dome in the landscape. It is a tonalite and shows a strong metamorphic foliation marked by the alignment of quartz, biotite, and feldspars. Numerous aplitic and pegmatitic veins transect the Steynsdorp granite-gneiss. The Steynsdorp gneiss and the rocks of the Onverwacht Group are separated by a tectonic contact. The Onverwacht Group stratigraphy in the Steynsdorp anticline is more varied than in the Malolotja synform. First, km thick beds of paragneiss, amphibolite, and quartzite occur, which were metamorphosed at amphibolite facies conditions. Lana et al. [77] calculated P-T conditions of metamorphism at 1.0–1.3 GPa and 640–660 °C for this unit. With increasing distance from the gneiss, the series becomes less metamorphosed with predominating talc schists and felsic schists. In the centre of the anticline, the area is covered by grass, and talc schists have been only locally observed. On both sides of the anticline, the series is composed of numerous weakly metamorphosed pillow lavas, especially in the east, and metabasalts with some iron-rich carbonate locally. These metabasalts can be foliated, visible by microcrystalline micas alignment. Rocks of the Onverwacht Group are cut by minor intrusive bodies, such as the Vlakplaats granodiorite, which is located about 1 km north of Steynsdorp gneiss (Figure 3), and shows a weak foliation. A felsic porphyry (described by Viljoen et al. [29]) is located close to the old Gypsy Queen mine (Figure 4d), east of the Steynsdorp anticline. It is formed by quartz, albite, and muscovite in a felsic microcrystalline matrix (Figure 4e). Another 10 m scale felsic porphyry, found in the hinge zone of the Steynsdorp antiform, is composed of large feldspar, chlorite, sulphides, and a feldspar matrix (Figure 4f). As everywhere in the BGB, there are several mafic dykes that cut across the study area. They mainly have a NW–SE strike.

4. Regional Deformation

Three cleavage planes or schistosities of different orientations and significance have been observed at the Malolotja synform and Steynsdorp antiform. According to these observations and their overprinting relationships, three tectonic deformation events have been identified (Figure 5 and Figure 6). The early deformation (De) formed the main cleavage (Se). The two other deformation phases are the main fold-related event (Df) and the late weaker deformation event (Dl). Stretching lineations are not very pronounced in the study area, except locally in the Steynsdorp gneiss and the surrounding Onverwacht Group rocks. They are metamorphosed at amphibolite facies conditions where a strong L-S tectonite exhibits a NNE plunge (this work and [77]). Another stretching lineation has been identified locally in the Malolotja zone, characterised by a SSW plunge associated with thrusting towards the NNW (e.g., Figure 4c). Because stretching lineations are poorly expressed, it has been decided to not represent them within the stereonets in Figure 5.

4.1. Early Event (De)

A regional cleavage Se affected the rocks of the Onverwacht and Moodies groups. In the Onverwacht Group talc carbonate schist, Se is marked by alignment of micas (muscovite and microcrystalline micas) and talc and is locally superimposed on compositional layering, i.e., layers varying in carbonate and pelitic content, likely representing a transposed bedding (Figure 6a,b,f,g). In carbonate-rich zones, dolomite, ankerite or magnesite porphyroclasts locally show recrystallised tails composed of talc and white mica.
In the Moodies Group, Se is subparallel to bedding (Figure 6c) and mainly observed as fine-grained schistosity (Figure 6d) with mm size muscovite sheets coaxially wrapping around quartz grains. On a regional scale, Se is folded and forms the Malolotja and Steynsdorp Ff folds with a steep N–S-striking axial plane. The Se cleavage is E–W striking and steeply dipping in hinge zones of the two regional folds—Se is dipping southwards in the Malolotja synform and northwards in the Steynsdorp antiform (Figure 5). At the outcrop scale, Se is commonly folded into cm to dm scale tight N–S-striking Ff folds or open-to-tight NW–SE-striking Fl folds (see Section 4.3). The folding of Se is clearly visible in the lower-hemisphere stereonet as girdles of poles to planes (Figure 5).

4.2. Main Fold-Related Event (Df)

Both areas are characterised by large-scale folds, shaped as a synform within the Malolotja area and as an anticline at Steynsdorp (Figure 5). Because these structures are well recognisable within the two areas, we call this tectonic event a “main fold-related event”. An Sf schistosity has been defined and mainly observed in the rocks of the Onverwacht Group. This schistosity is parallel to N–S striking and steep Ff fold axial planes (Figure 5 and Figure 6b). Sf is expressed as a crenulation cleavage and by the alignment of iron-rich micas, chlorite, and talc sheets (Figure 6b,h). Ff folding ranges from crenulation to km wavelength folds, responsible for the large-scale Malolotja synform and Steynsdorp antiform. Both km scale to crenulation Ff fold axes are commonly steep to subvertical (Figure 6a,b,e).

4.3. Late Event (Dl)

A third deformation Dl is inferred from observations of NW–SE-trending open-to-tight folds and associated with steeply dipping axial planar cleavage (Figure 6e,i). Dl is common in the Malolotja syncline area and only locally observed in the Steynsdorp domain. Dl has not been observed in the Moodies Group and is only restricted to the Onverwacht lithologies. Dl is evident in the eastern limb of the Malolotja synform where it results in steep knee-shape folds of the composite compositional layering and Se cleavage (Welcome gold occurrence, Figure 6e–g). Microscale observations demonstrate that Dl also affects the Sf cleavage forming an open crenulation fold associated with crenulation cleavage Sl marked by the alignment of microcrystalline iron-rich micas and talc (Figure 6f,g,i).

5. Hydrothermal Vein System

5.1. Vein Macroscopic Study

The 3D block diagram in Figure 7 compiles the distribution of the main outcrops related to the hydrothermal vein system in the study area. Gold occurrences are almost exclusively located in the Onverwacht Group rocks (see also Figure 3). The majority of the mineralised outcrops correspond to former mining areas with small excavations (5–30 m deep), shafts, trenches, and old galleries. Thanks to the structural study of all these outcrops, we propose to classify the hydrothermal features in three distinct generations.

5.1.1. Early Veins System

The early vein system, commonly observed and studied within the Malolotja area, is formed by a network of cm to dm thick white quartz veins, subparallel to the Se schistosity and commonly folded (Figure 8). These veins have either a sigmoid shape wrapped by the Se schistosity (Figure 8a) or a folded appearance and show acute angle relation with Se (Figure 8b). Orientation of the early veins is very variable, although most of the veins have dip angles between 20 and 50°. It is evident that early veins are highly folded (Lo 119, Primrose, Figure 8b,c, see location in Figure 7) and have a similar attitude to the cleavage Se, i.e., intensively folded.

5.1.2. Mineralised Veins System

Veins belonging to the mineralised system are here regarded as the ones occurring within or close to a mineralised occurrence indicated within the Barberton Greenstone Belt metallogenic map [14] (Figure 3). Gold occurrences in the study area correspond to small-scale former mines and mining exploration; no archival information on the gold ores has been found. Due to the proximity of the veins to the mineralised occurrence in the metallogenic map, as well as clear field evidence of historical mining activities of these veins, they are considered mineralisation-related veins even though no gold rate has been measured. Indeed, it remains impossible in such outcrops to analyse the form and the distribution of gold within such structures.
Mineralised veins always cut the schistosities Se (and in a few places the Sf, Figure 9a–c,f) and are mm to m thick. They preferentially occur in the talc schists of the Onverwacht Group. The mineralised vein system is mainly characterised by at least three types of veins: shallow-dipping (Figure 9a–d), steeply west- or east-dipping, and subvertical (Figure 9a–c,e,f and Figure 10). The horizontal veins are commonly folded into open-to-tight buckles (e.g., no 817 occurrence in Ivanhoe mine), with an axial plane parallel to the Sf cleavage (Figure 9b). Subvertical veins locally show reverse top-to-the-east kinematics (occurrence 819, west limb of Steynsdorp, Figure 9f). In places, the veins show varied dip angles from horizontal and west-dipping to vertical and form complex vein networks (Rosehill, Primrose, Ivanhoe; Figure 9e and Figure 10a). In these areas, mutually intersecting veins are generally N–S striking, dipping to the west, and exist in petrographic continuity (Figure 9b,e).
In the Malolotja area, the veins are mostly N–S striking, although a small cluster of veins that strike N150 and dip steeply to the east exists in Primrose and Rosehill occurrences (Figure 10a). The Malolotja mineralisation-related vein poles form a NE–SW-striking great circle (Figure 10a). Although no clear field evidence of mineralised quartz veins folded by the late Fl folds has been reported, the great circle in Figure 10a might be interpreted to represent folded veins with a NW–SE-striking axial plane, i.e., parallel to the Fl axial planes (Figure 6e) and schistosity Sl (Figure 5). In the Steynsdorp area, veins are mainly shallowly east-dipping or steeply west-dipping and locally steeply south-dipping (Figure 10b).
Mineralised veins in the eastern sector of the Steynsdorp anticline do not follow the above-mentioned typology. Here, the quartz veins are located along fractured corridors that strike N40 to N70 in a pillow lava host rock (Figure 9g). Some horizontal or steeply plunging slickenlines and drag folds in the host rock have been observed in the fractured zones, associated with dextral motion in the Unity occurrence and sinistral/oblique one in the Idaho occurrence (see locations in Figure 7).
In addition to quartz, veins are composed of elongated tourmaline grains and, more rarely, K-feldspar and plagioclase (Figure 9b,d). Shallow-dipping veins exhibit, in several places, vertical comb quartz or quartz fibres and tourmalines (Figure 9b,d).
The vein system observed at the She mine does not fit with the vein generations scheme described above. In this area, the schistosity and parallel compositional layering are striking N70 and dipping 40° to the SSE, carrying a strong down-dip mineral lineation. Sigmoidal quartz and K-feldspar veins attest to a reverse sense of shear (top-to-the-NNW, Figure 4c). The mineralised quartz veins form either sigmoids wrapped by the schistosity or dm wide schistosity-parallel veins. These veins are composed of quartz-feldspar-tourmaline-chlorite-sulphides. Here, K-feldspar has been observed in the core or the sigmoidal quartz veins. The schistosity at the She mine is possibly Se, although Se elsewhere does not usually carry a lineation and is not associated with asymmetric objects showing clear kinematics. More work is needed to confidently assign the She mine schistosity to the De event.

5.1.3. Late Vein System

Some veins appear to be late and are interpreted to be unmineralised because they occur far from historical mines and diggings. Clearly, these veins have not been explored historically and are, therefore, thought to be barren. Most of them have been observed at Malolotja.
On the western limb of the Malolotja synform, numerous large metric quartz veins, slightly folded, globally strike N050–070°E (Figure 11a,b). More to the east, another complex quartz vein system is observed, representing a dextral N170°E “en échelon” system. In the Waverley Reefs area, west of Malolotja, a mineralised quartz vein system is clearly cut and displaced by subhorizontal quartz veins that are supposed to be late and barren (Figure 11e).
Even if vein systems are better expressed within the Onverwacht rocks, one outcrop in the Moodies Group in Malolotja exhibits a complex network of veins (Lo.37, Figure 12; see location in Figure 7). Two sets of cm thick white quartz veins have been observed. The first one is striking N040 and associated with dextral pull-apart and drag folds whereas the second one, less expressed, is represented by thin veins striking N100 to N140, in sinistral places (Figure 12). These observations suggest an emplacement of the veins during a global dextral shearing, as confirmed by the observation of a weakly expressed horizontal stretching lineation on vertical Se cleavage (most likely parallel with the vertical limb of the large-scale Ff fold).
The structural control of this late hydrothermal event is a key point of the tectono-hydrothermal evolution of the study area and will be discussed further in this work. Our preliminary suggestion is that it is controlled by a NE–SW shortening, compatible with the Dl event observed in the country rocks of the late vein system (see Section 4.3).

5.2. Vein Microscopic Study

5.2.1. Petrography

The paragenetic evolution of the vein systems in the Malolotja and Steynsdorp areas is summarised in Figure 13 and detailed here.
Early veins are composed mainly of quartz and carbonates (Figure 14a). Mineralised veins are filled with quartz with Na, Ca, and K-feldspars on their edges (confirmed by energy-dispersive X-ray spectroscopy analyses that allow confirming the presence or absence of the Na, Ca, or K elements in feldspar grains). Numerous veins, especially in the Steynsdorp area, have elongated tourmalines and few carbonates, whereas others exhibit muscovite and chlorite (Figure 14b,c). Sulphides are rarely preserved and commonly replaced by iron oxides (Figure 14d). However, pyrites and some rare chalcopyrite have been recognised in this mineralised vein system (Figure 14d). The late veins are mainly composed of quartz with minor K and Na-feldspars (confirmed by energy-dispersive X-ray spectroscopy analyses allowing for the detection of the presence or absence of the Na, Ca, or K elements in feldspar grains), and μm to mm size muscovite grains.

5.2.2. Microstructures

The early quartz vein system is mainly formed by comb quartz and anhedral carbonate infilling, which are weak or not recrystallised (Figure 14a).
In contrast, mineralised veins present a larger variety of microstructures. As already mentioned, subhorizontal or shallow-dipping veins have a comb or fibre minerals (quartz, tourmaline, feldspar) perpendicular or slightly oblique to the vein edge, clearly recording the direction of the opening (Figure 9b and Figure 14c,e). It is common that vertical tourmalines or feldspars are truncated by horizontal fractures filled with quartz (Figure 14c). Some of the mineralised, shallow-dipping veins show moderate recrystallised quartz features, while recrystallisation is stronger in N–S-striking steep veins associated with reverse kinematics and, also, within the NE–SW-striking steep veins along fault planes in the eastern limb of the Steynsdorp anticline. All these veins exhibit quartz grains with undulatory extinction and bulging microstructures (Figure 14f). Subgrain rotation recrystallisation of previously formed comb-quartz grains is locally observed. Locally, quartz in the mineralised veins shows discrete μm wide transverse conjugate recrystallised bands (Figure 14g). The bisector of the acute angle between the conjugate bands is NE–SW trending, hence suggesting that these recrystallised bands formed during the late NE–SW shortening event.
Quartz veins of the late system are unexpectedly highly deformed, visible by more intensive subgrain rotation formation (Figure 14h). Compared with the veins associated with mineralisation, the late vein system consistently exhibits more pronounced recrystallisation microstructures, whereas they are less developed in the mineralised system. Consequently, although the mineralised system locally shows significant recrystallisation of quartz with, for example, numerous 10 μm wide subgrain formations, the late system is considered highly recrystallised due to systematic observations of subgrain rotation around quartz crystals.

5.3. Alteration

Macroscopically, several features related to alteration processes have been recognised around the three generations of vein systems and are presented here.
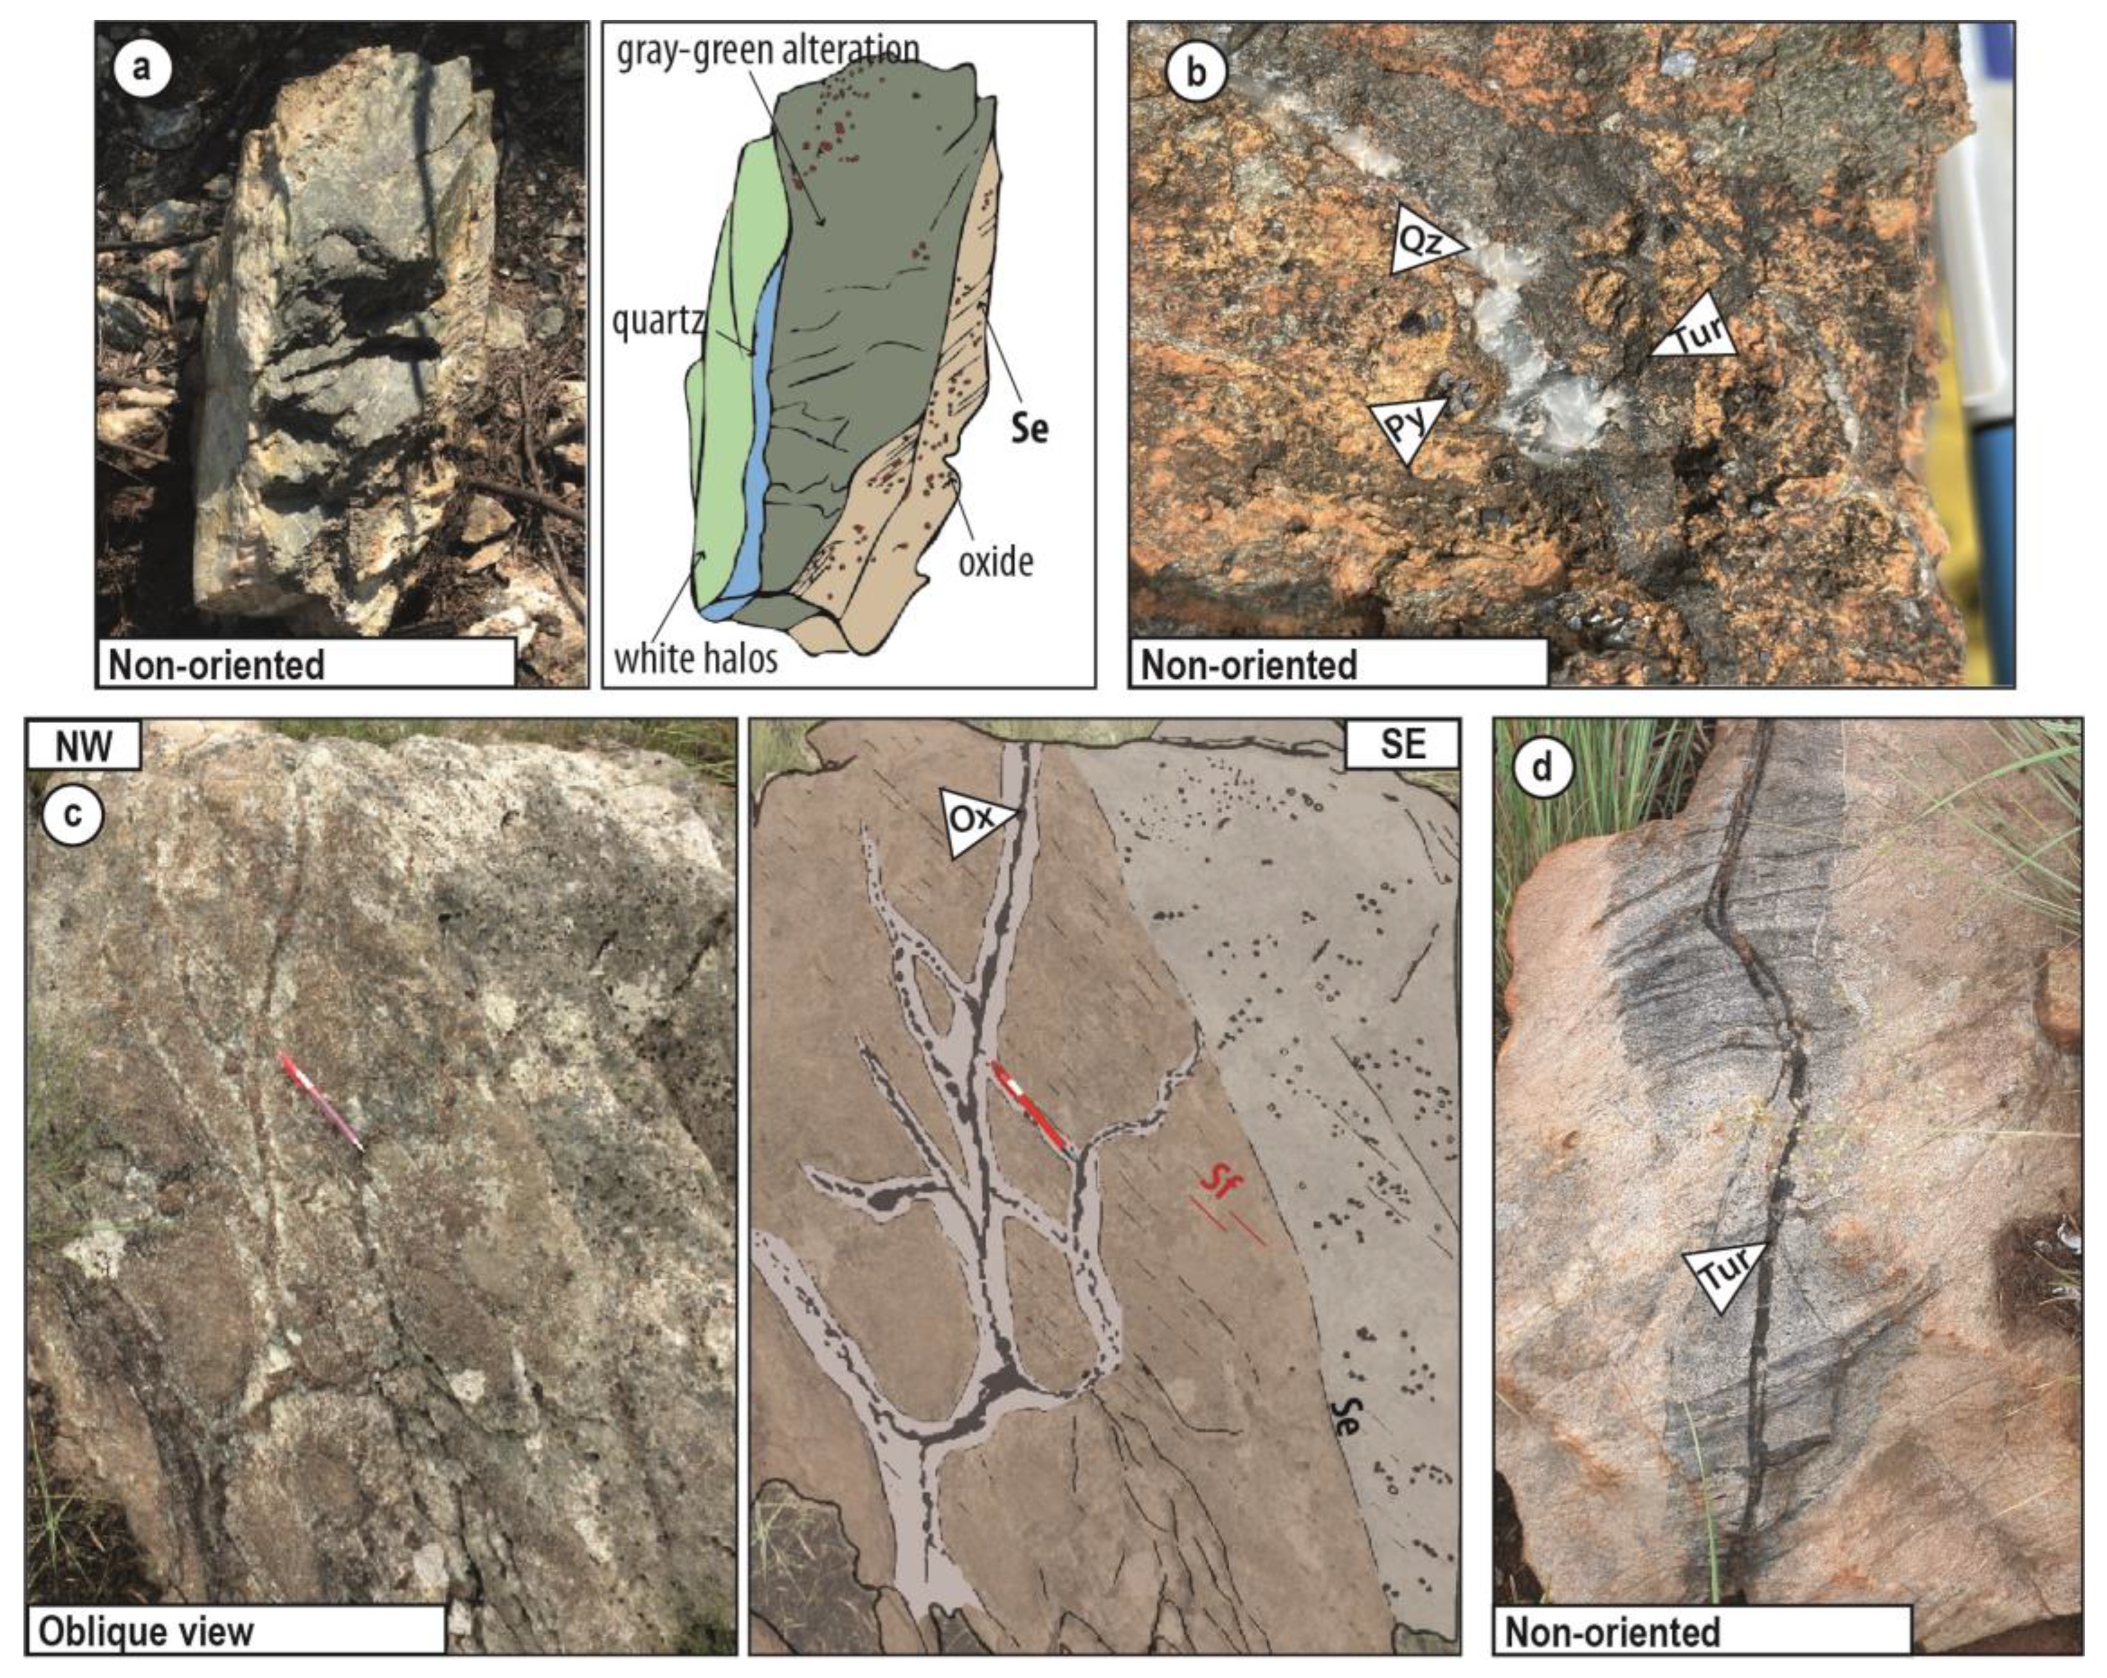
  • Although most of the early veins do not show alteration features, few of them exhibit greenish-to-whitish mm to dm scale alteration halos, mainly in the Malolotja area (Figure 8a).
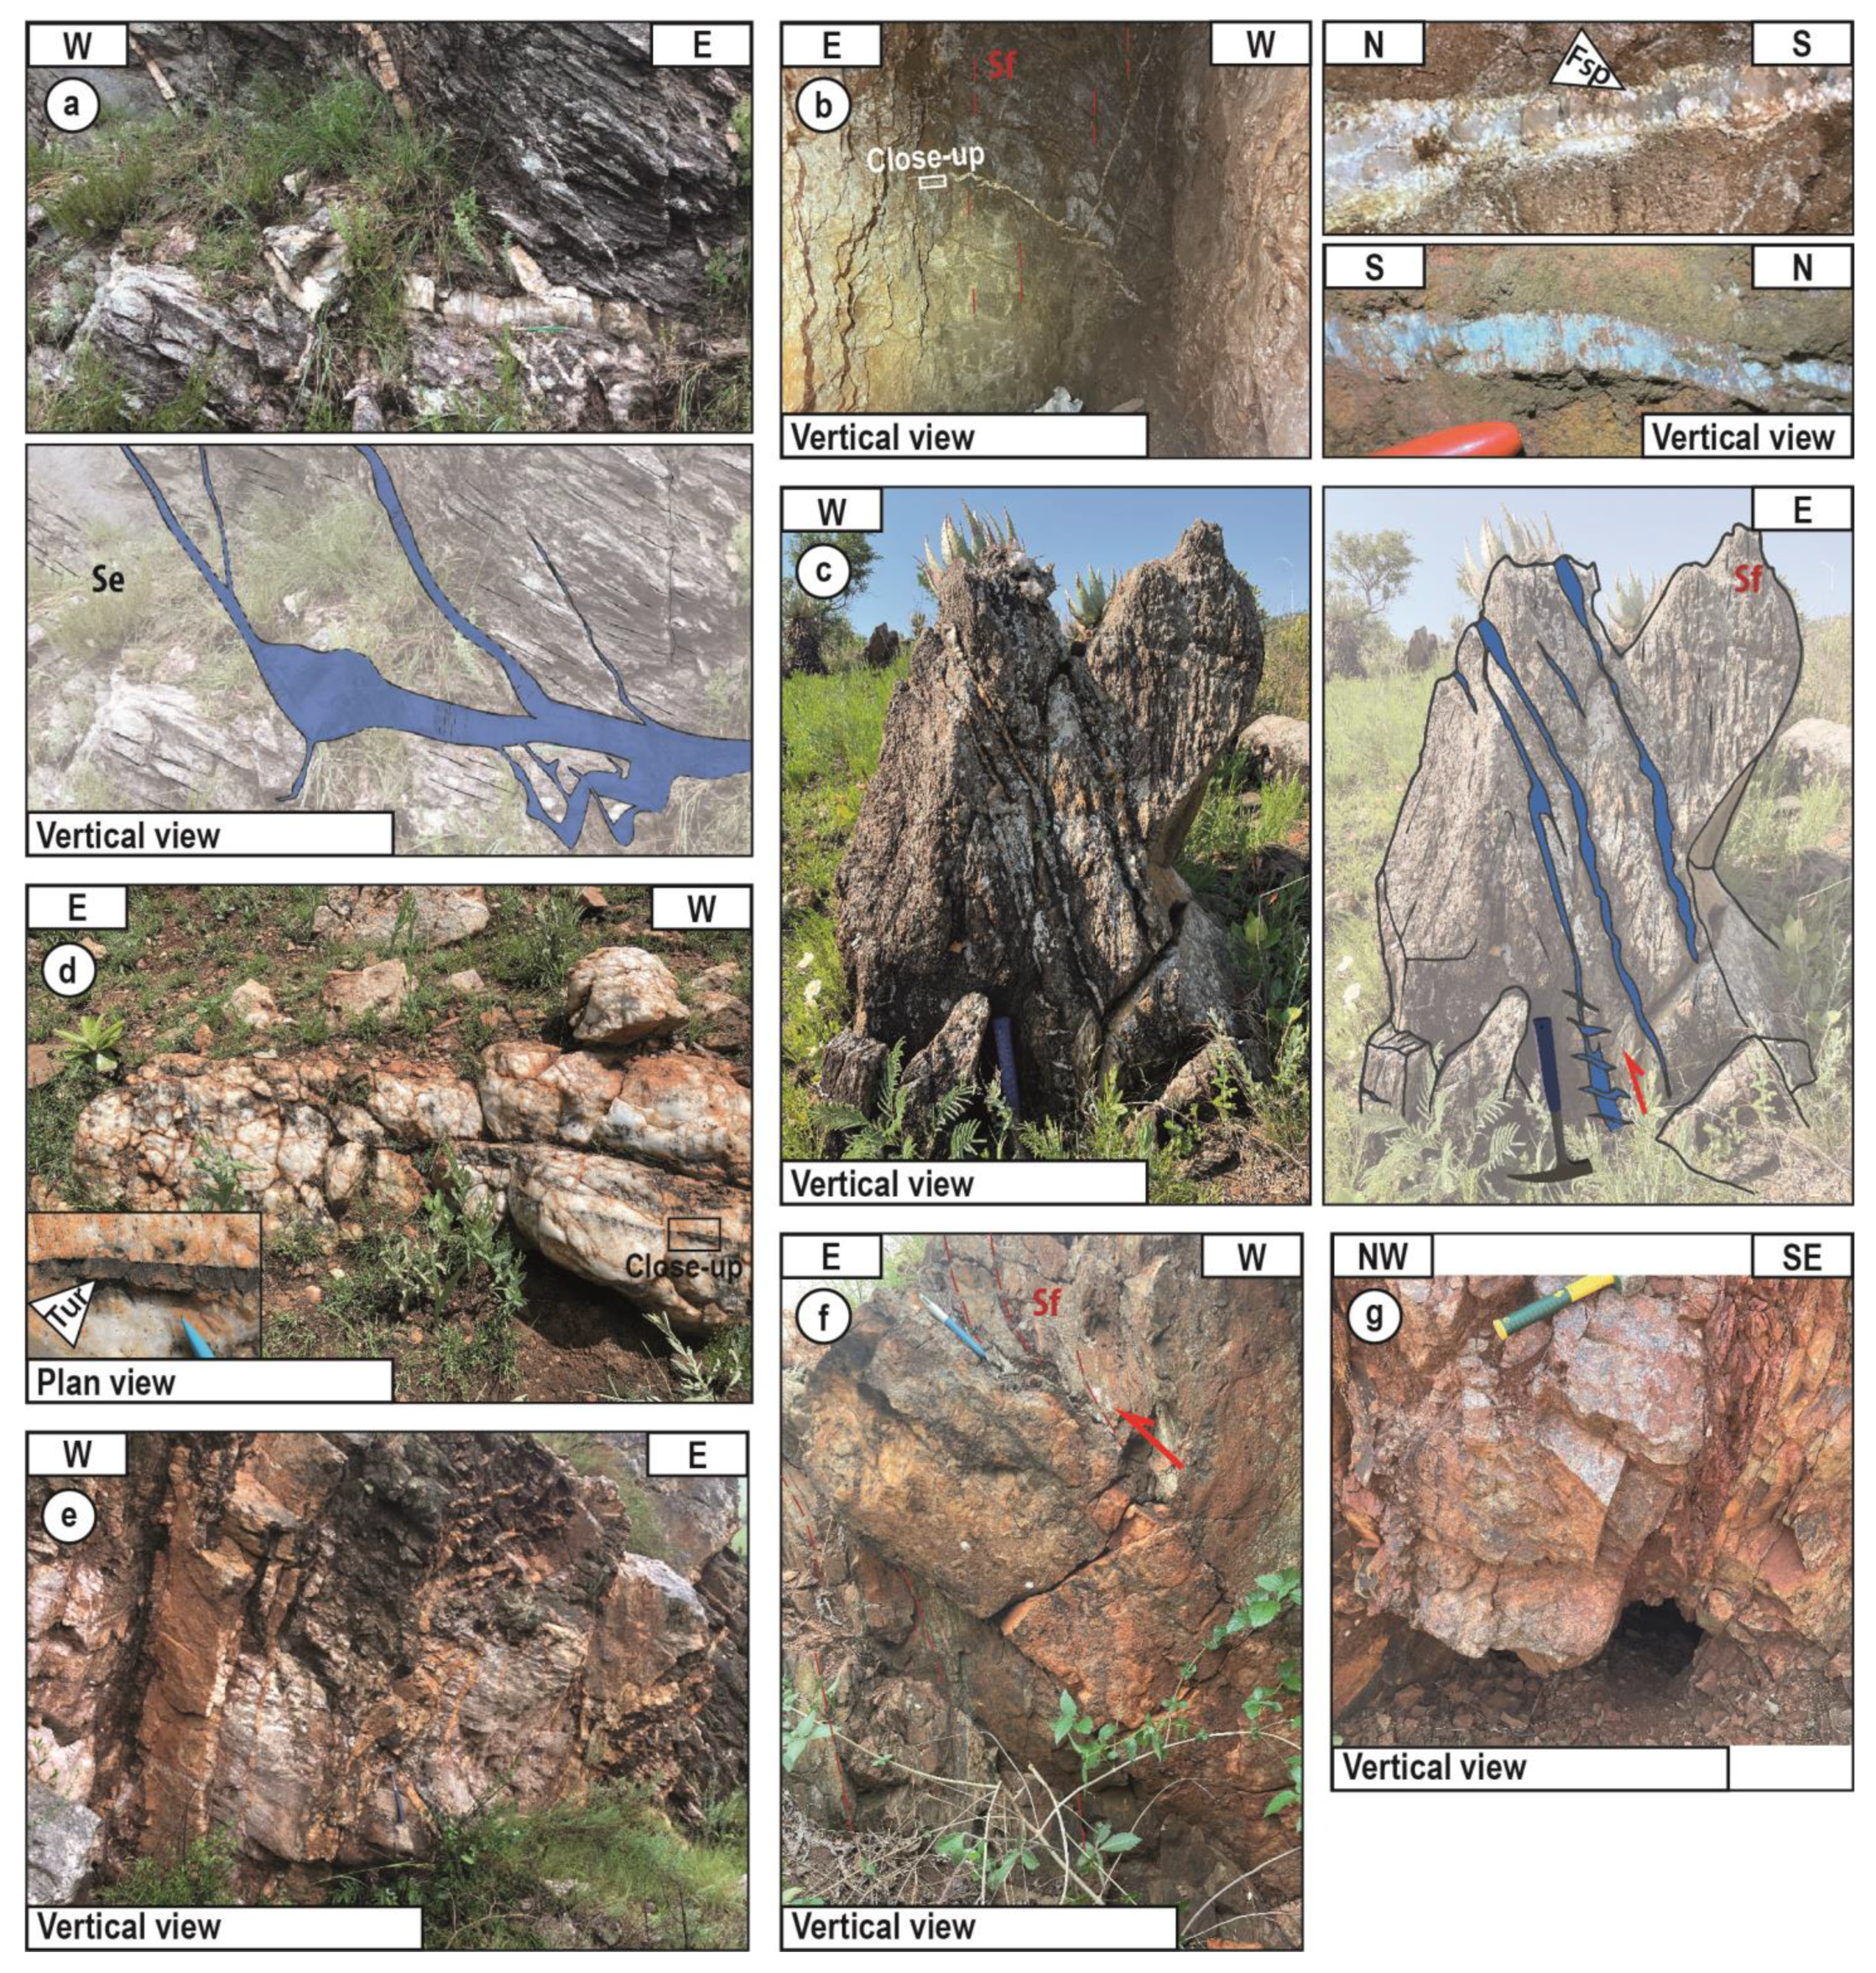
  • At Malolotja, green alteration halos around quartz veins of the Primrose occurrence traduces the existence of alteration (Figure 15a). At Steynsdorp, mm large cubes of pyrites and ankerite crystals are found in the host rock adjacent to mineralised quartz veins (Figure 15b). Brown/red leaching of the country rock is also observed in the vicinity of mining areas (e.g., She mine, Waverley Reefs, Welcome, Figure 4c).
  • NE–SW-striking tourmaline or oxide veins have been observed locally in the eastern limb of the Malolotja synform in both the Onverwacht and Moodies Groups (Figure 15c,d). These veins are supposed to be part of the late barren system. Both veins exhibit alteration effects with, respectively, leaching (Figure 15c) and/or tourmaline impregnation (Figure 15d). One of the best alteration features observed within the entire studied area is the large alteration halo present at the edge of the late vein of the outcrop Lo.43, in which mm large radial or elongated tourmaline is visible (Figure 11b–d).
Microscopically, the green and white alteration halos principally found around the veins (the three types—early, mineralised, and late) at Malolotja correspond to widespread talc, muscovite, and chlorite micrograins, in which larger albite and tourmaline grains occur. Alteration at Steynsdorp appears less developed and is represented by iron-rich carbonates and pyrite disseminations. Other alteration assemblages, including tourmalines, micas, and iron oxide impregnations, such as host rock leaching, are encountered. When oriented, these alteration-related features strike N40. As already mentioned, alteration linked to the late vein system is well expressed (Figure 11b–d) and corresponds, microscopically, to the development of large tourmaline and feldspar crystals often elongated in the core of the alteration-related talc and mica thin matrix (Figure 14i). Tourmaline can have various shapes and textures (i.e., radial, Figure 11c) but often occurs as truncated crystals (Figure 11d). This observation represents a strong argument in favour of syntectonic filling of the different vein systems.

6. Interpretation

6.1. Main Results

The new contributions of our structural and mineralogical study of the southern part of the Barberton Greenstone Belt quartz vein systems are summarised as follows:
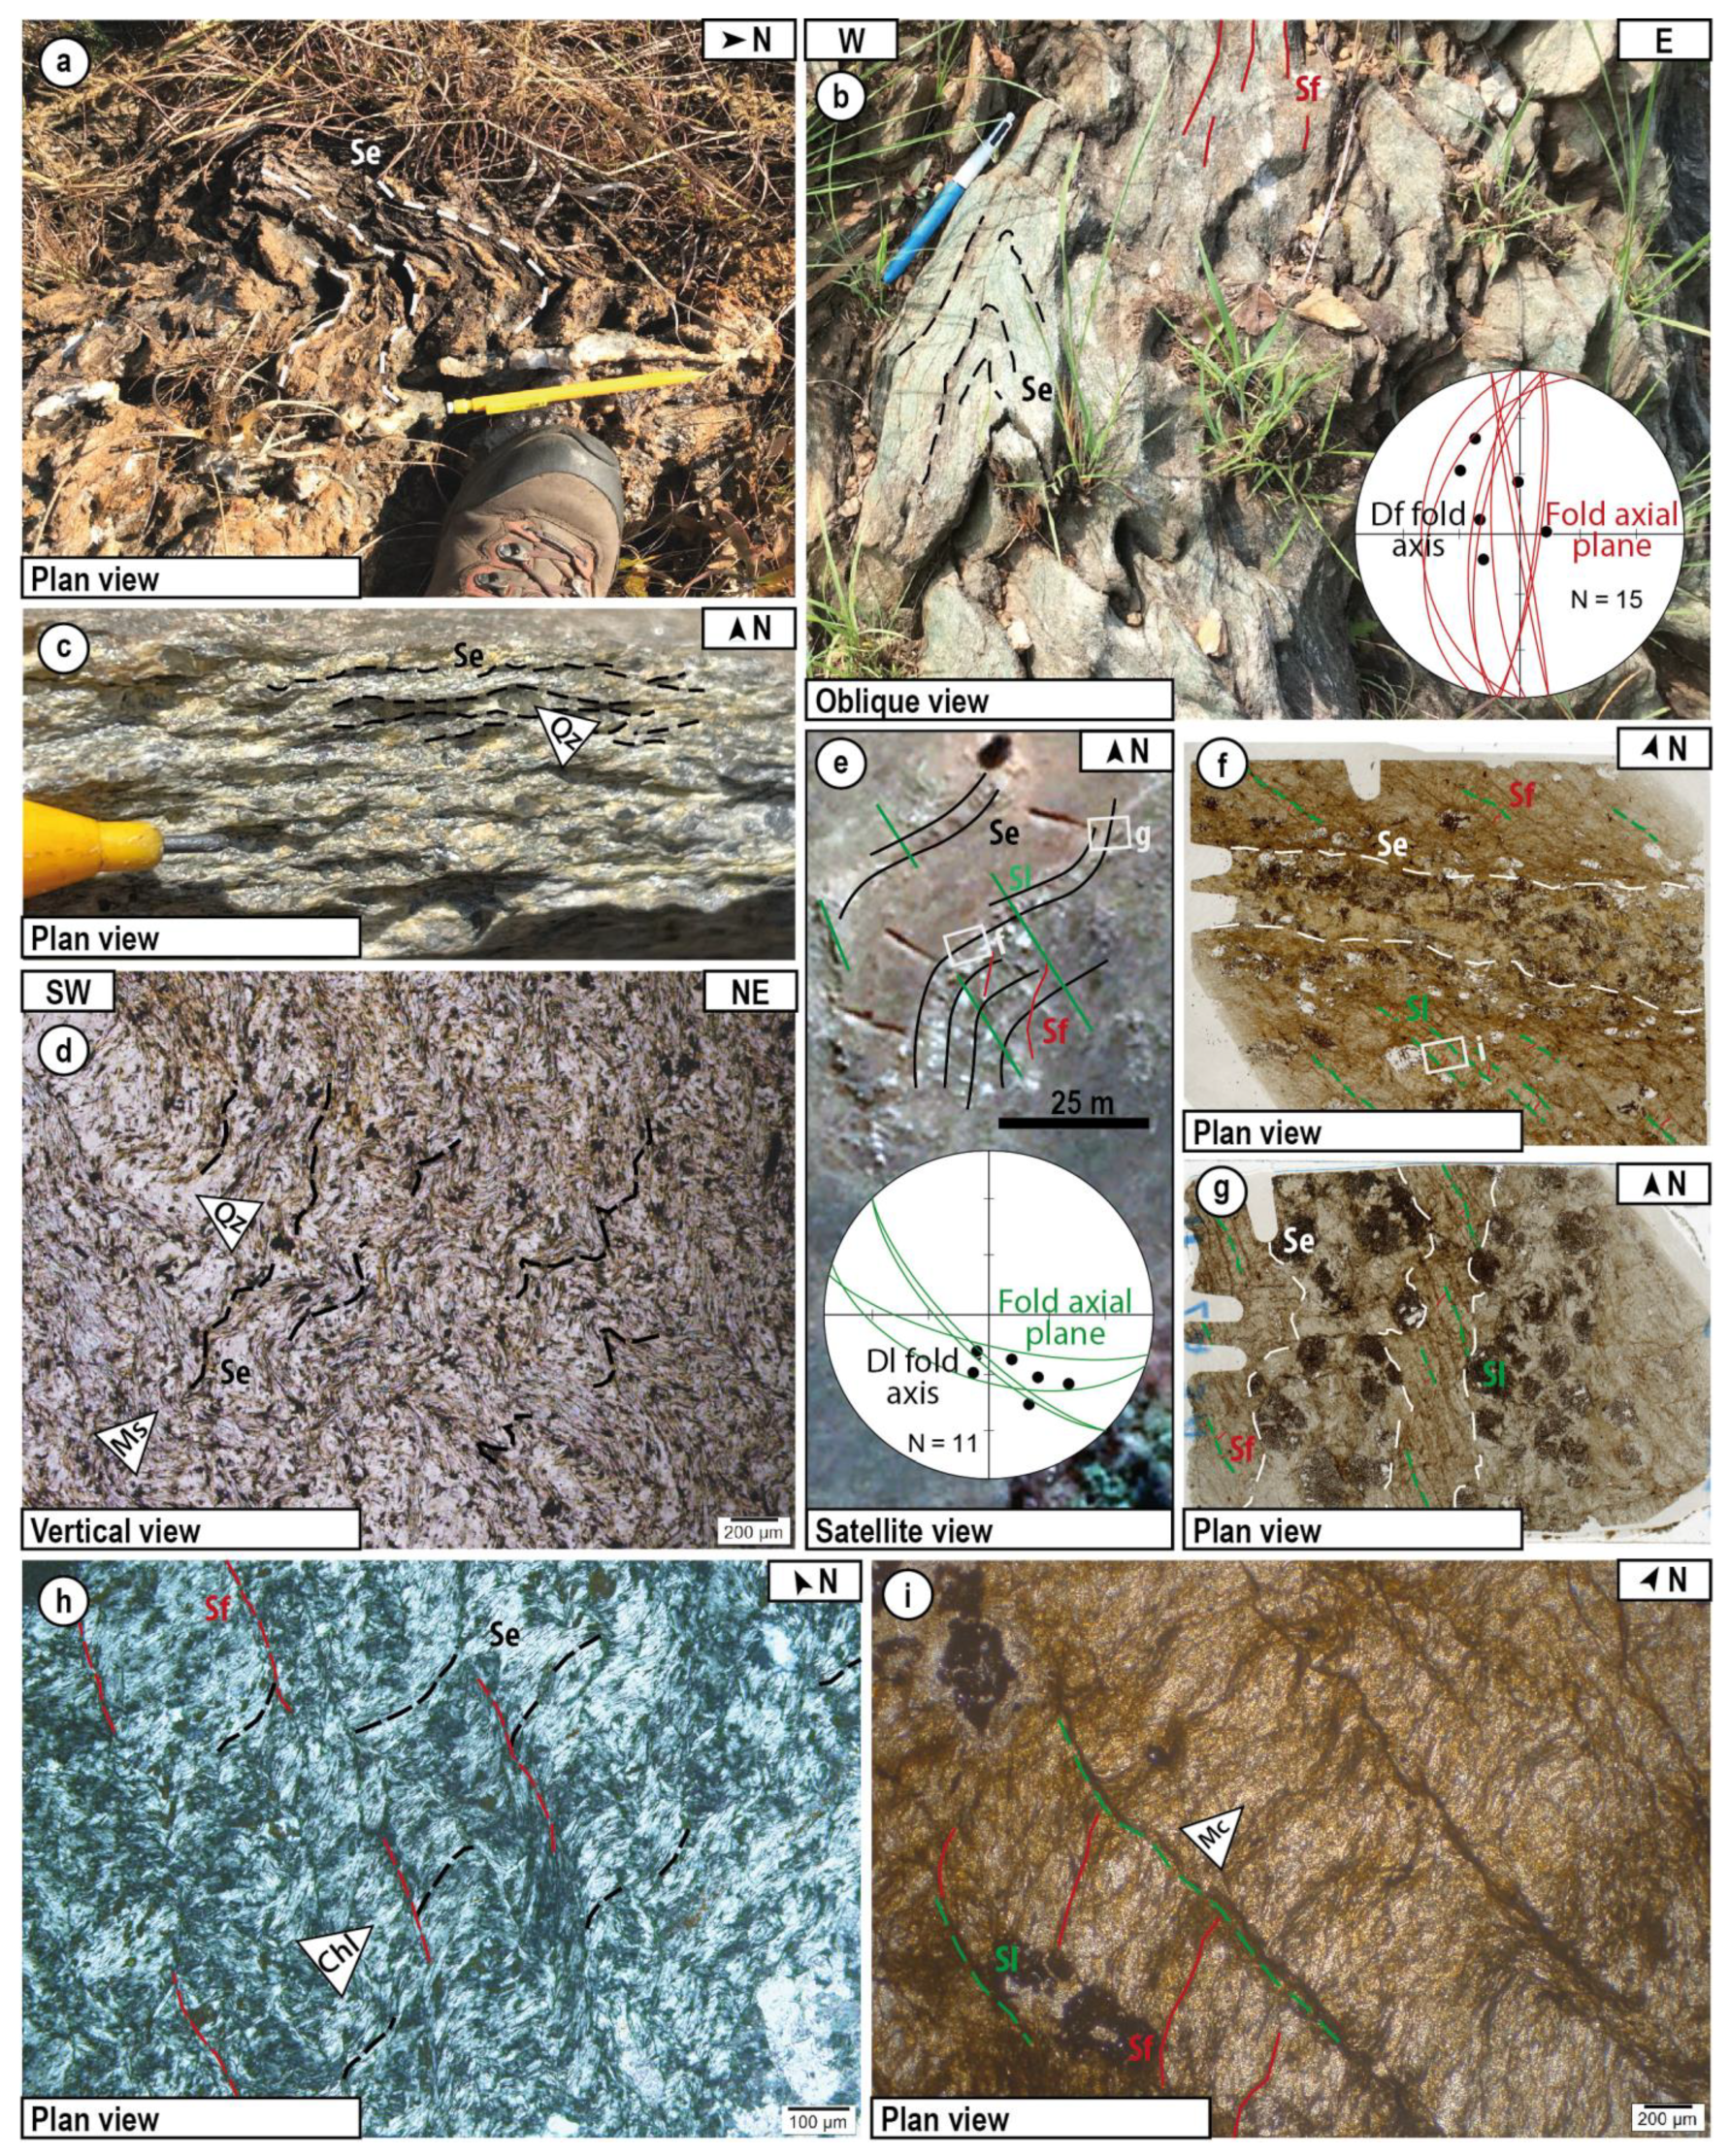
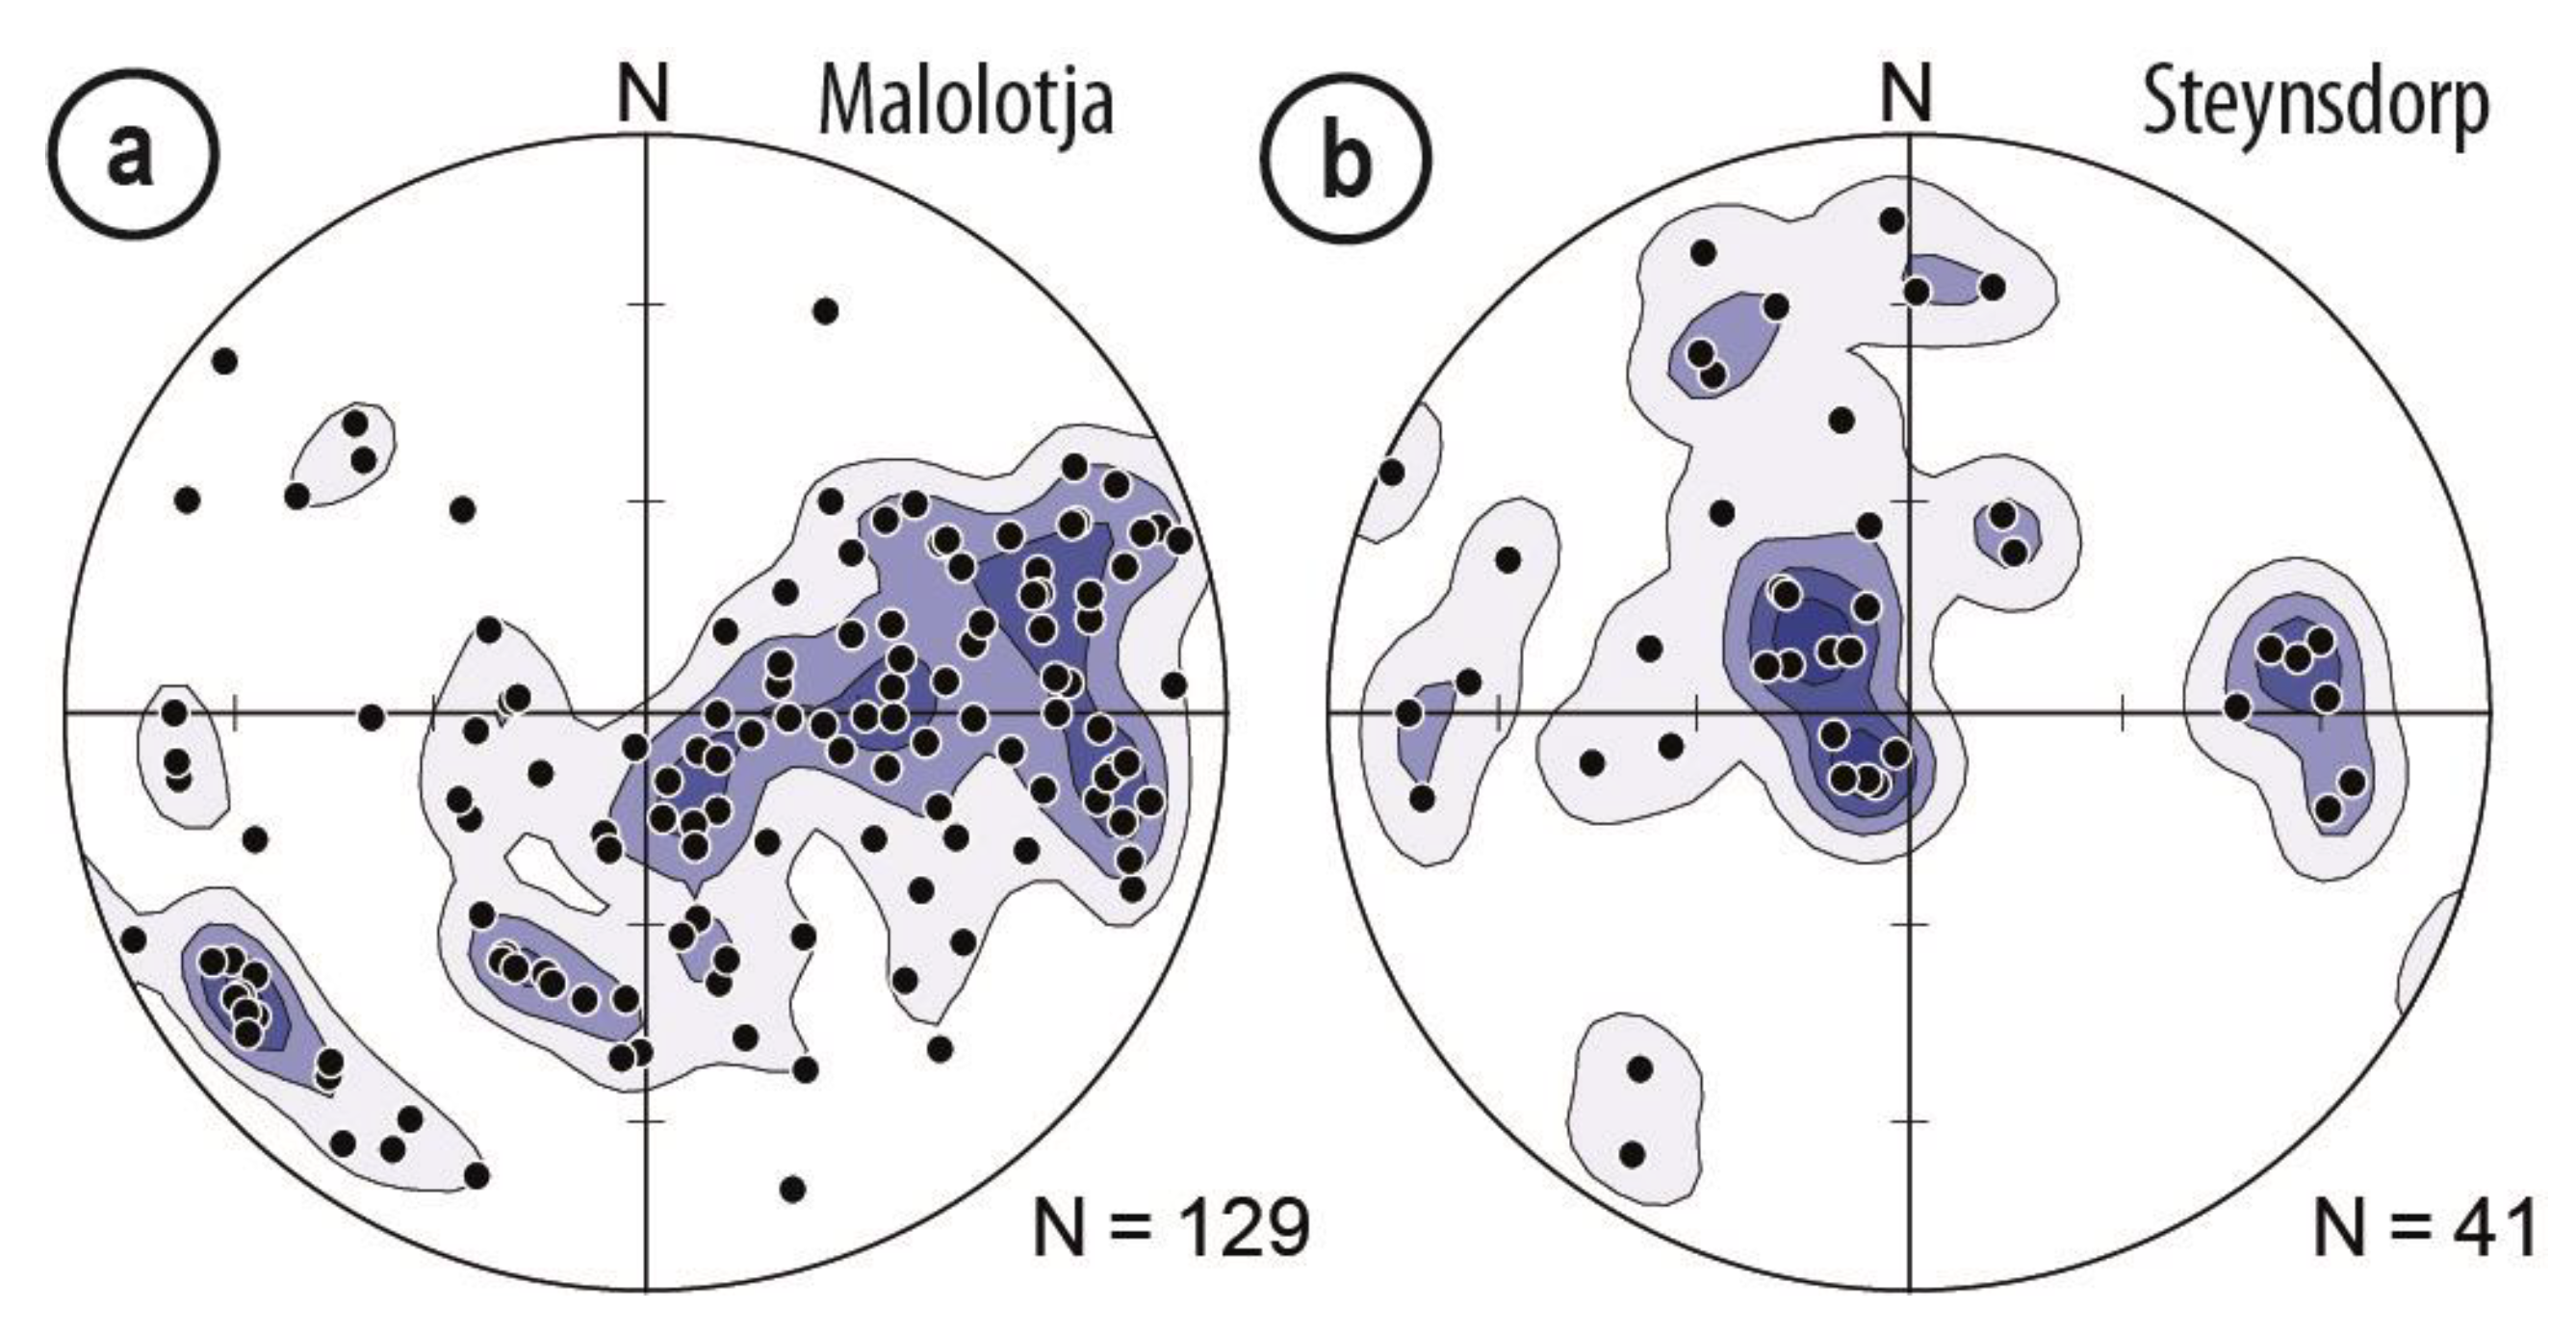
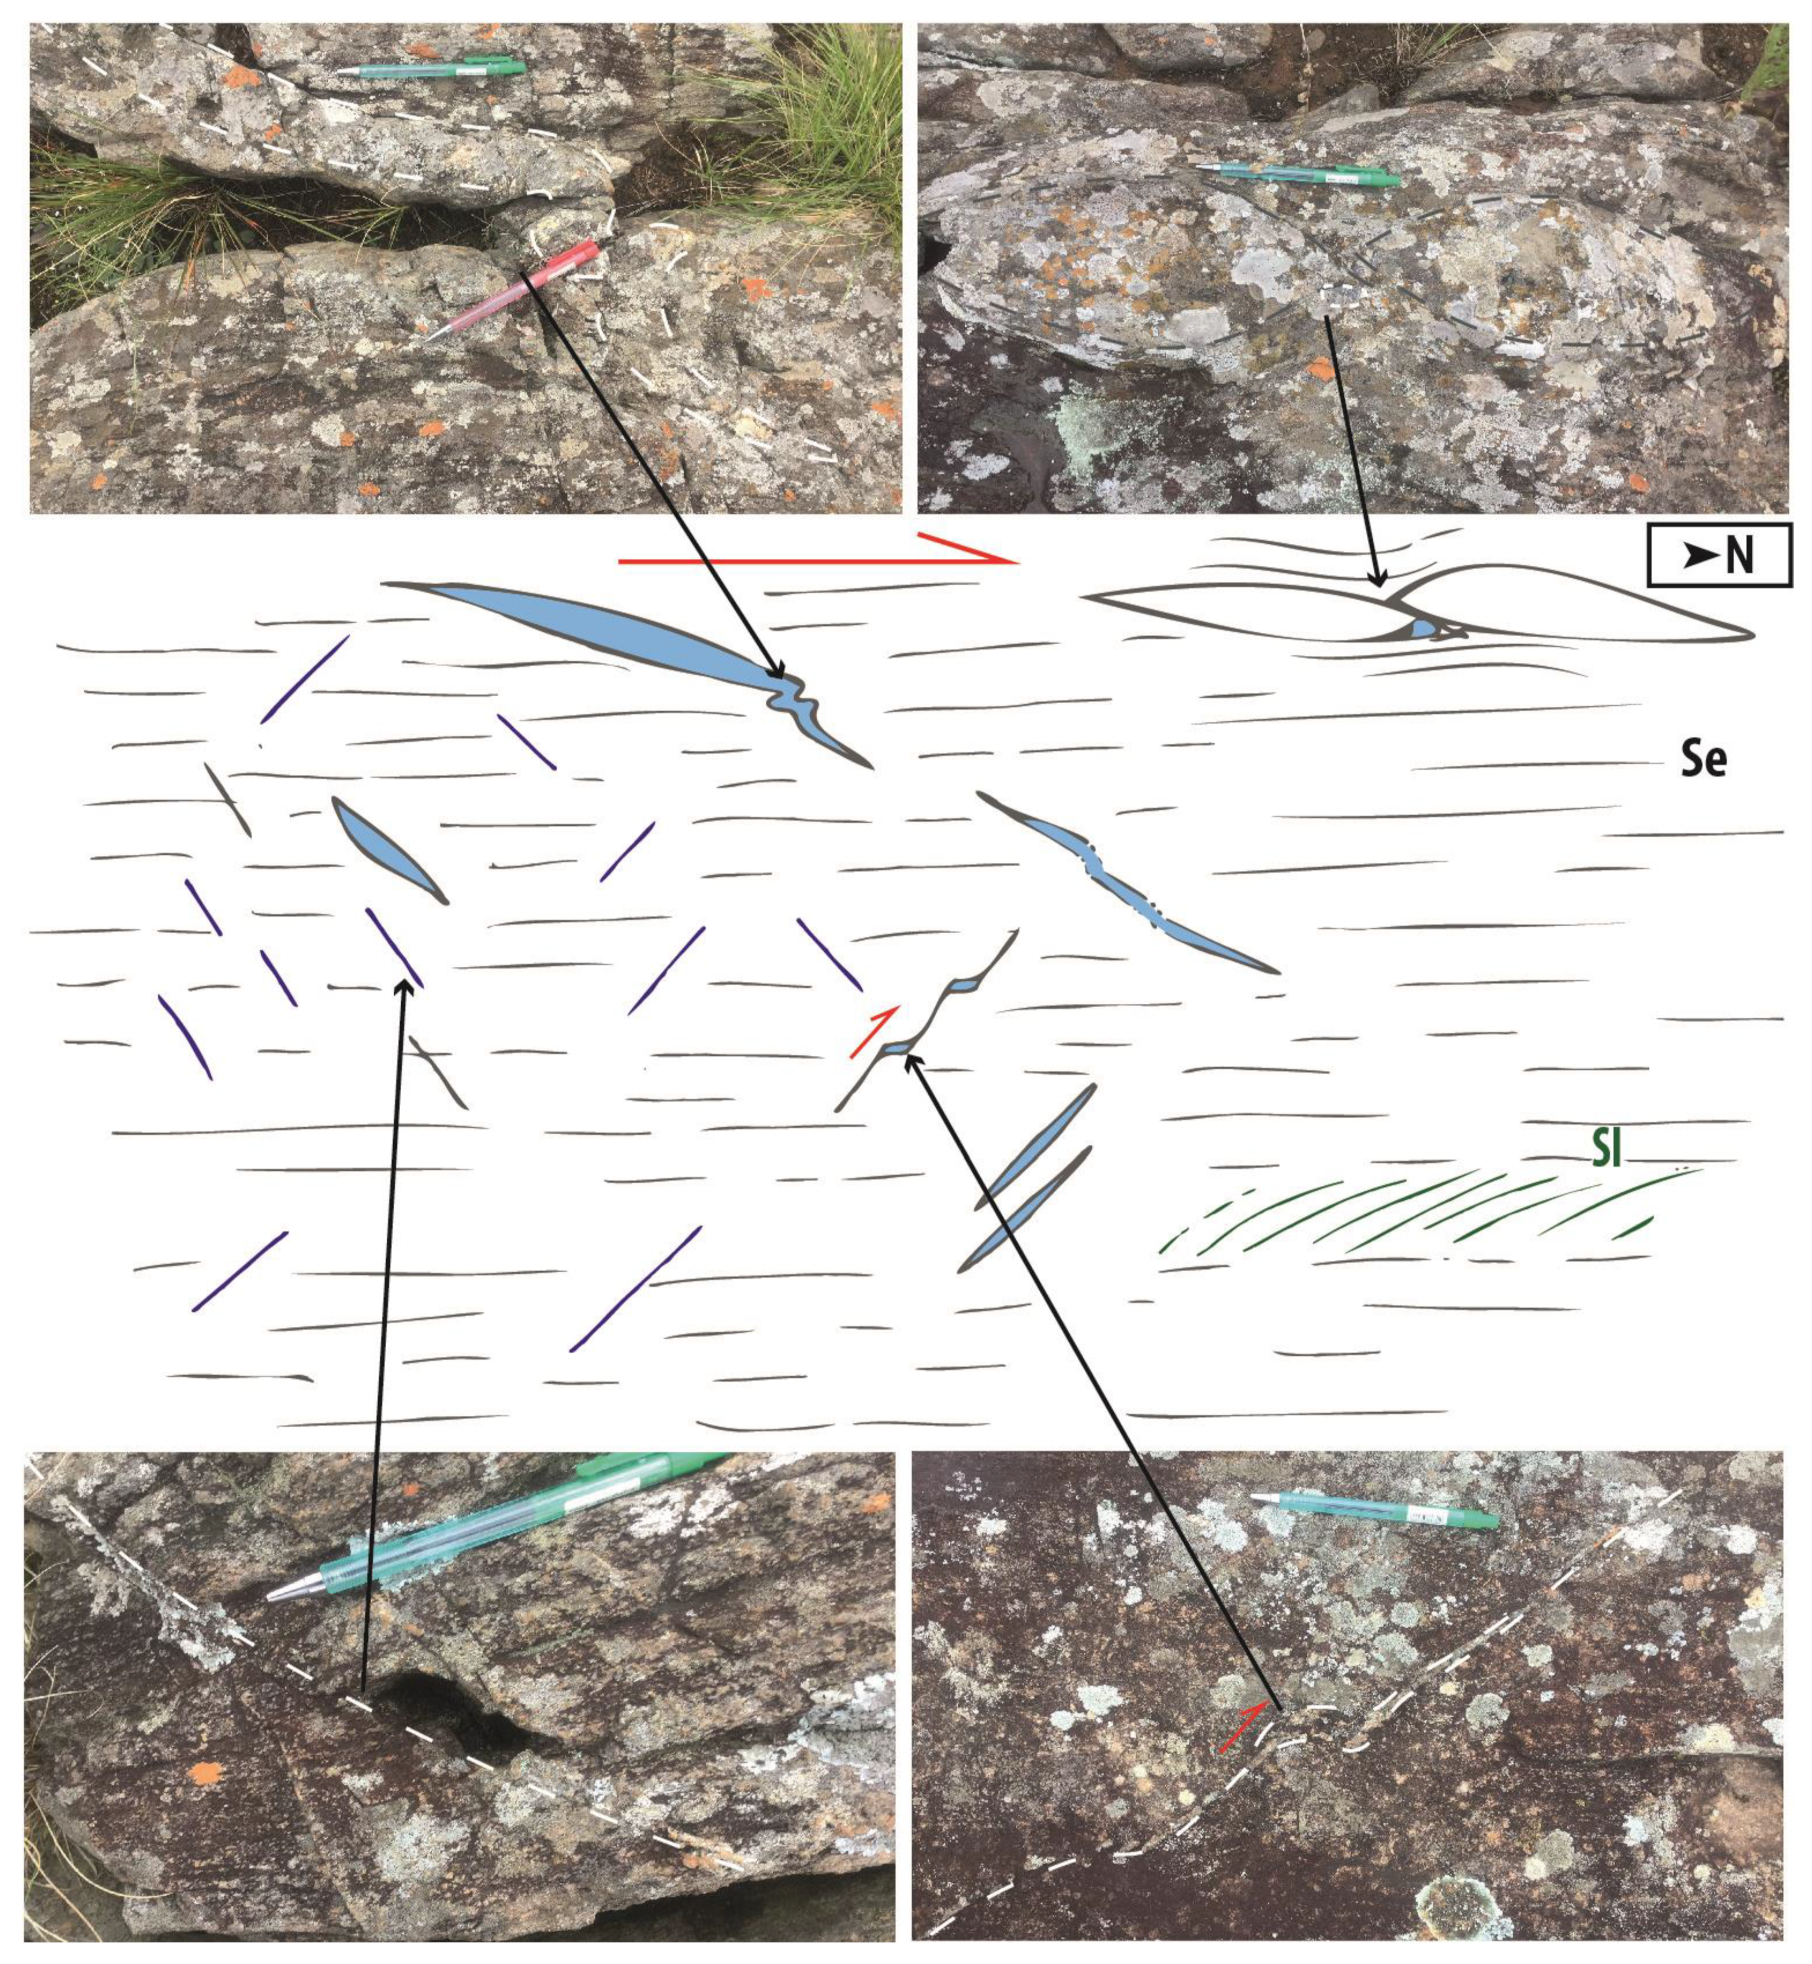
  • Three main tectonic events have been identified in the vein systems and adjacent country rocks. Three schistosities and associated folds are recognised: (i) Se cleavage (De early event), which is interpreted to be initially E–W striking and dipping to the north at Steynsdorp and to the south at Malolotja; (ii) Sf cleavage (main fold-related event) related to the large-scale N–S-trending folds; (iii) and Sl cleavage (late Dl event) N130°E striking. Stretching lineation occasionally occurs but is not well expressed in the study area.
  • Similarly, three generations of veins have been established:
    -
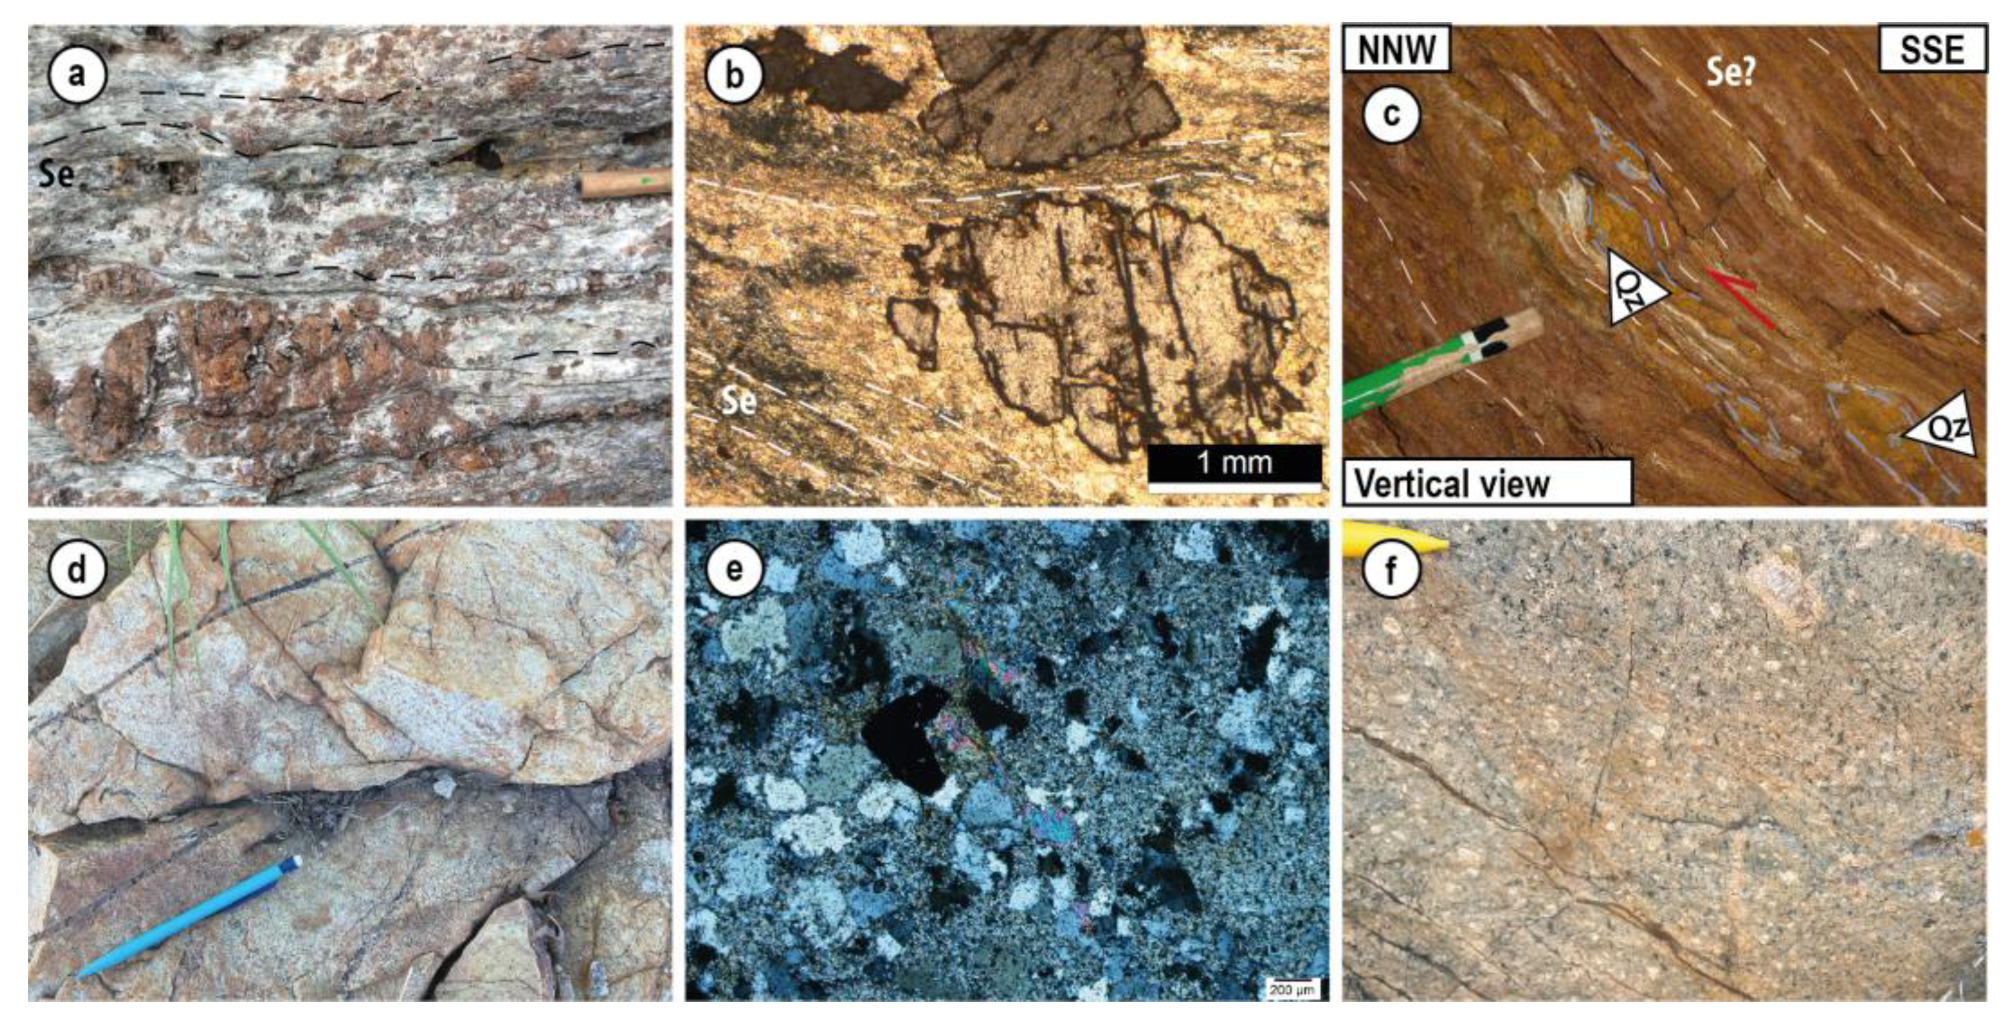
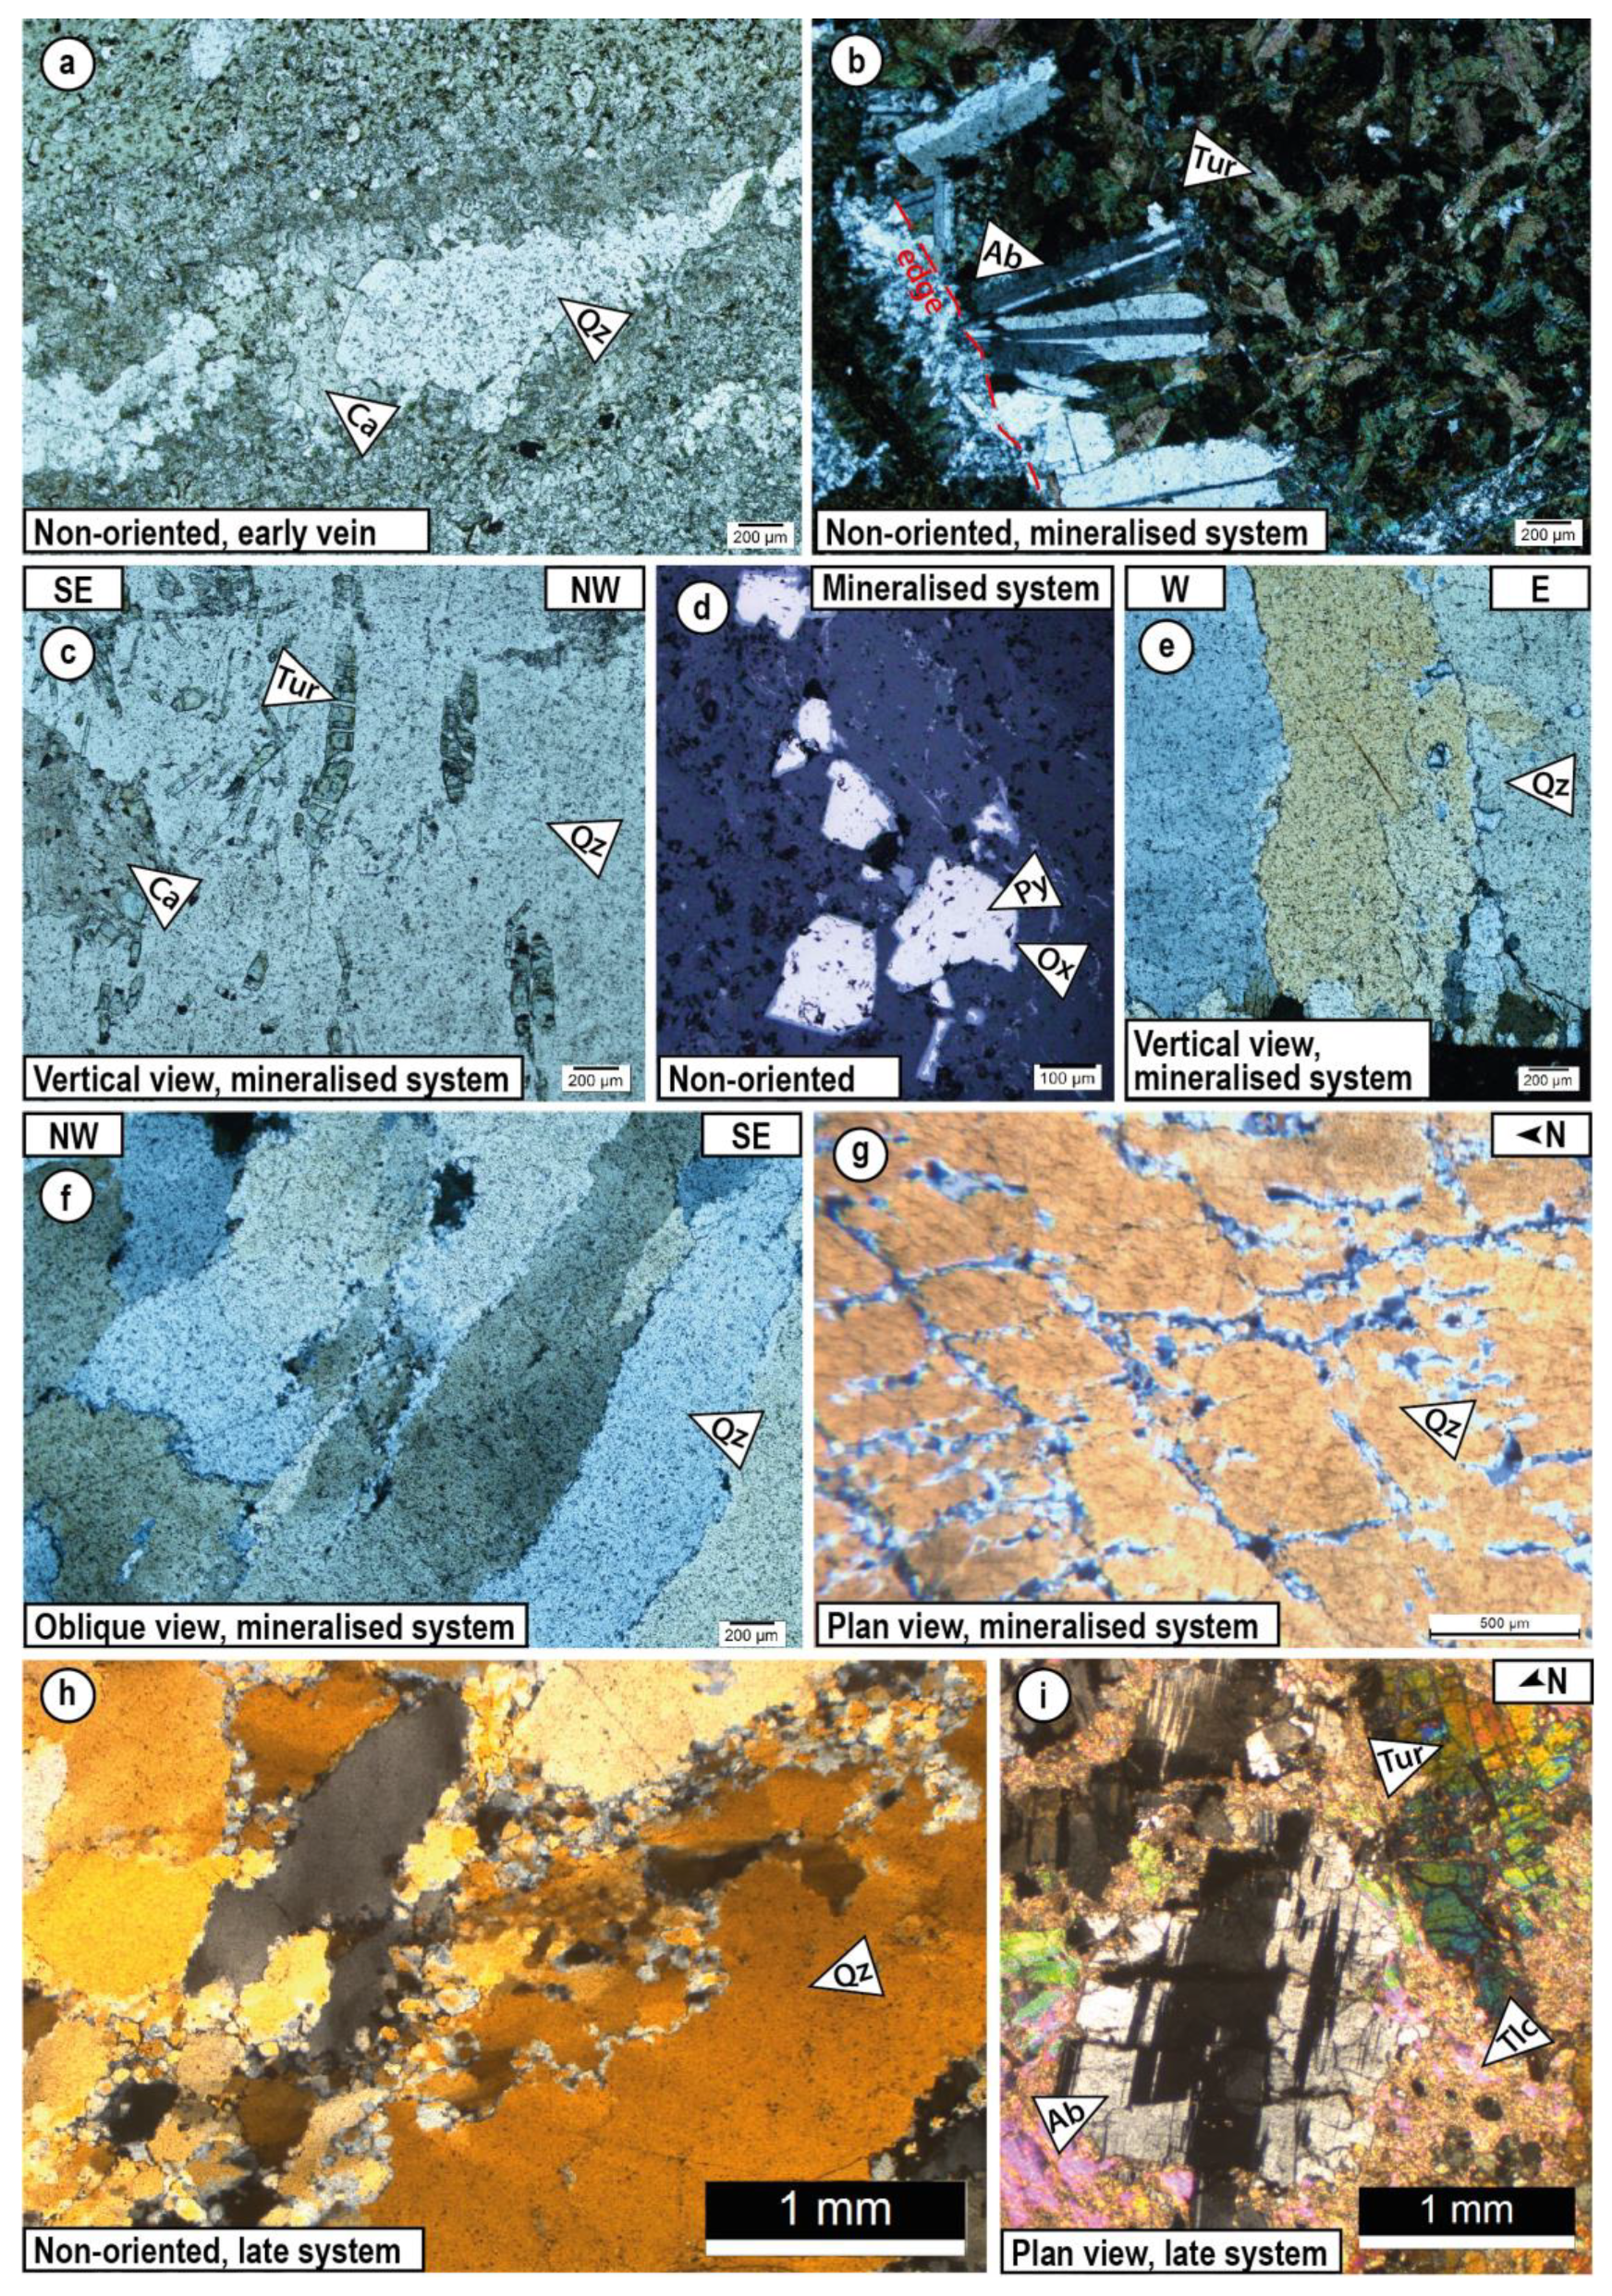
    Early veins are cm to dm thick, mostly sigmoid in shape, and wrapped by Se and/or folded by Df events. Veins are mostly filled by quartz and carbonates with or without green alteration halos composed of talc, tourmaline, and albite.
    -
    Mineralised veins have various orientations: shallow-dipping, steeply east- and steeply west-dipping. They are the most abundant, thicker (cm to m thick), interconnected, and thus coeval (Figure 16). The steep veins have orientations varying from N–S-striking (most frequent) to N140–150-striking. The mineralogy of these veins is mainly quartz, carbonates, feldspar, tourmaline, and sulphides with alteration halos of pyrite, tourmaline, feldspar, and talc.
    -
    A late vein system was observed exclusively in the Malolotja area. Their geometry is variable, i.e., flat sheared veins, oblique dipping tension gashes, weakly folded N050-striking steeply dipping to the NW metric veins. These veins are composed of quartz, feldspar, and muscovite with an albite, tourmaline, and muscovite alteration halo, similar to the ones of the mineralised system, even if best-expressed.

6.2. Tectono-Hydrothermal Evolution of the Southern Barberton Greenstone Belt

A three-stage model for the tectonic evolution of the southern part of the Barberton Greenstone Belt that considers the hydrothermal events formation is proposed here (Figure 17).
  • The initial stage shows a subvertical to south-dipping Se schistosity in the Malolotja area, likely related to the Onverwacht Group overthrust on the Moodies Group rocks, as suggested by Heubeck et al. [79] and Lamb and Paris [84] (Figure 17a). At Steynsdorp, the Se schistosity is subvertical to north dipping. According to Lana et al. [65], Se formed as a response to unroofing of the Steynsdorp metamorphic core complex. Early quartz veins formed during this stage and were subsequently folded by the following events. Early quartz veins are related to this event (Figure 17a).
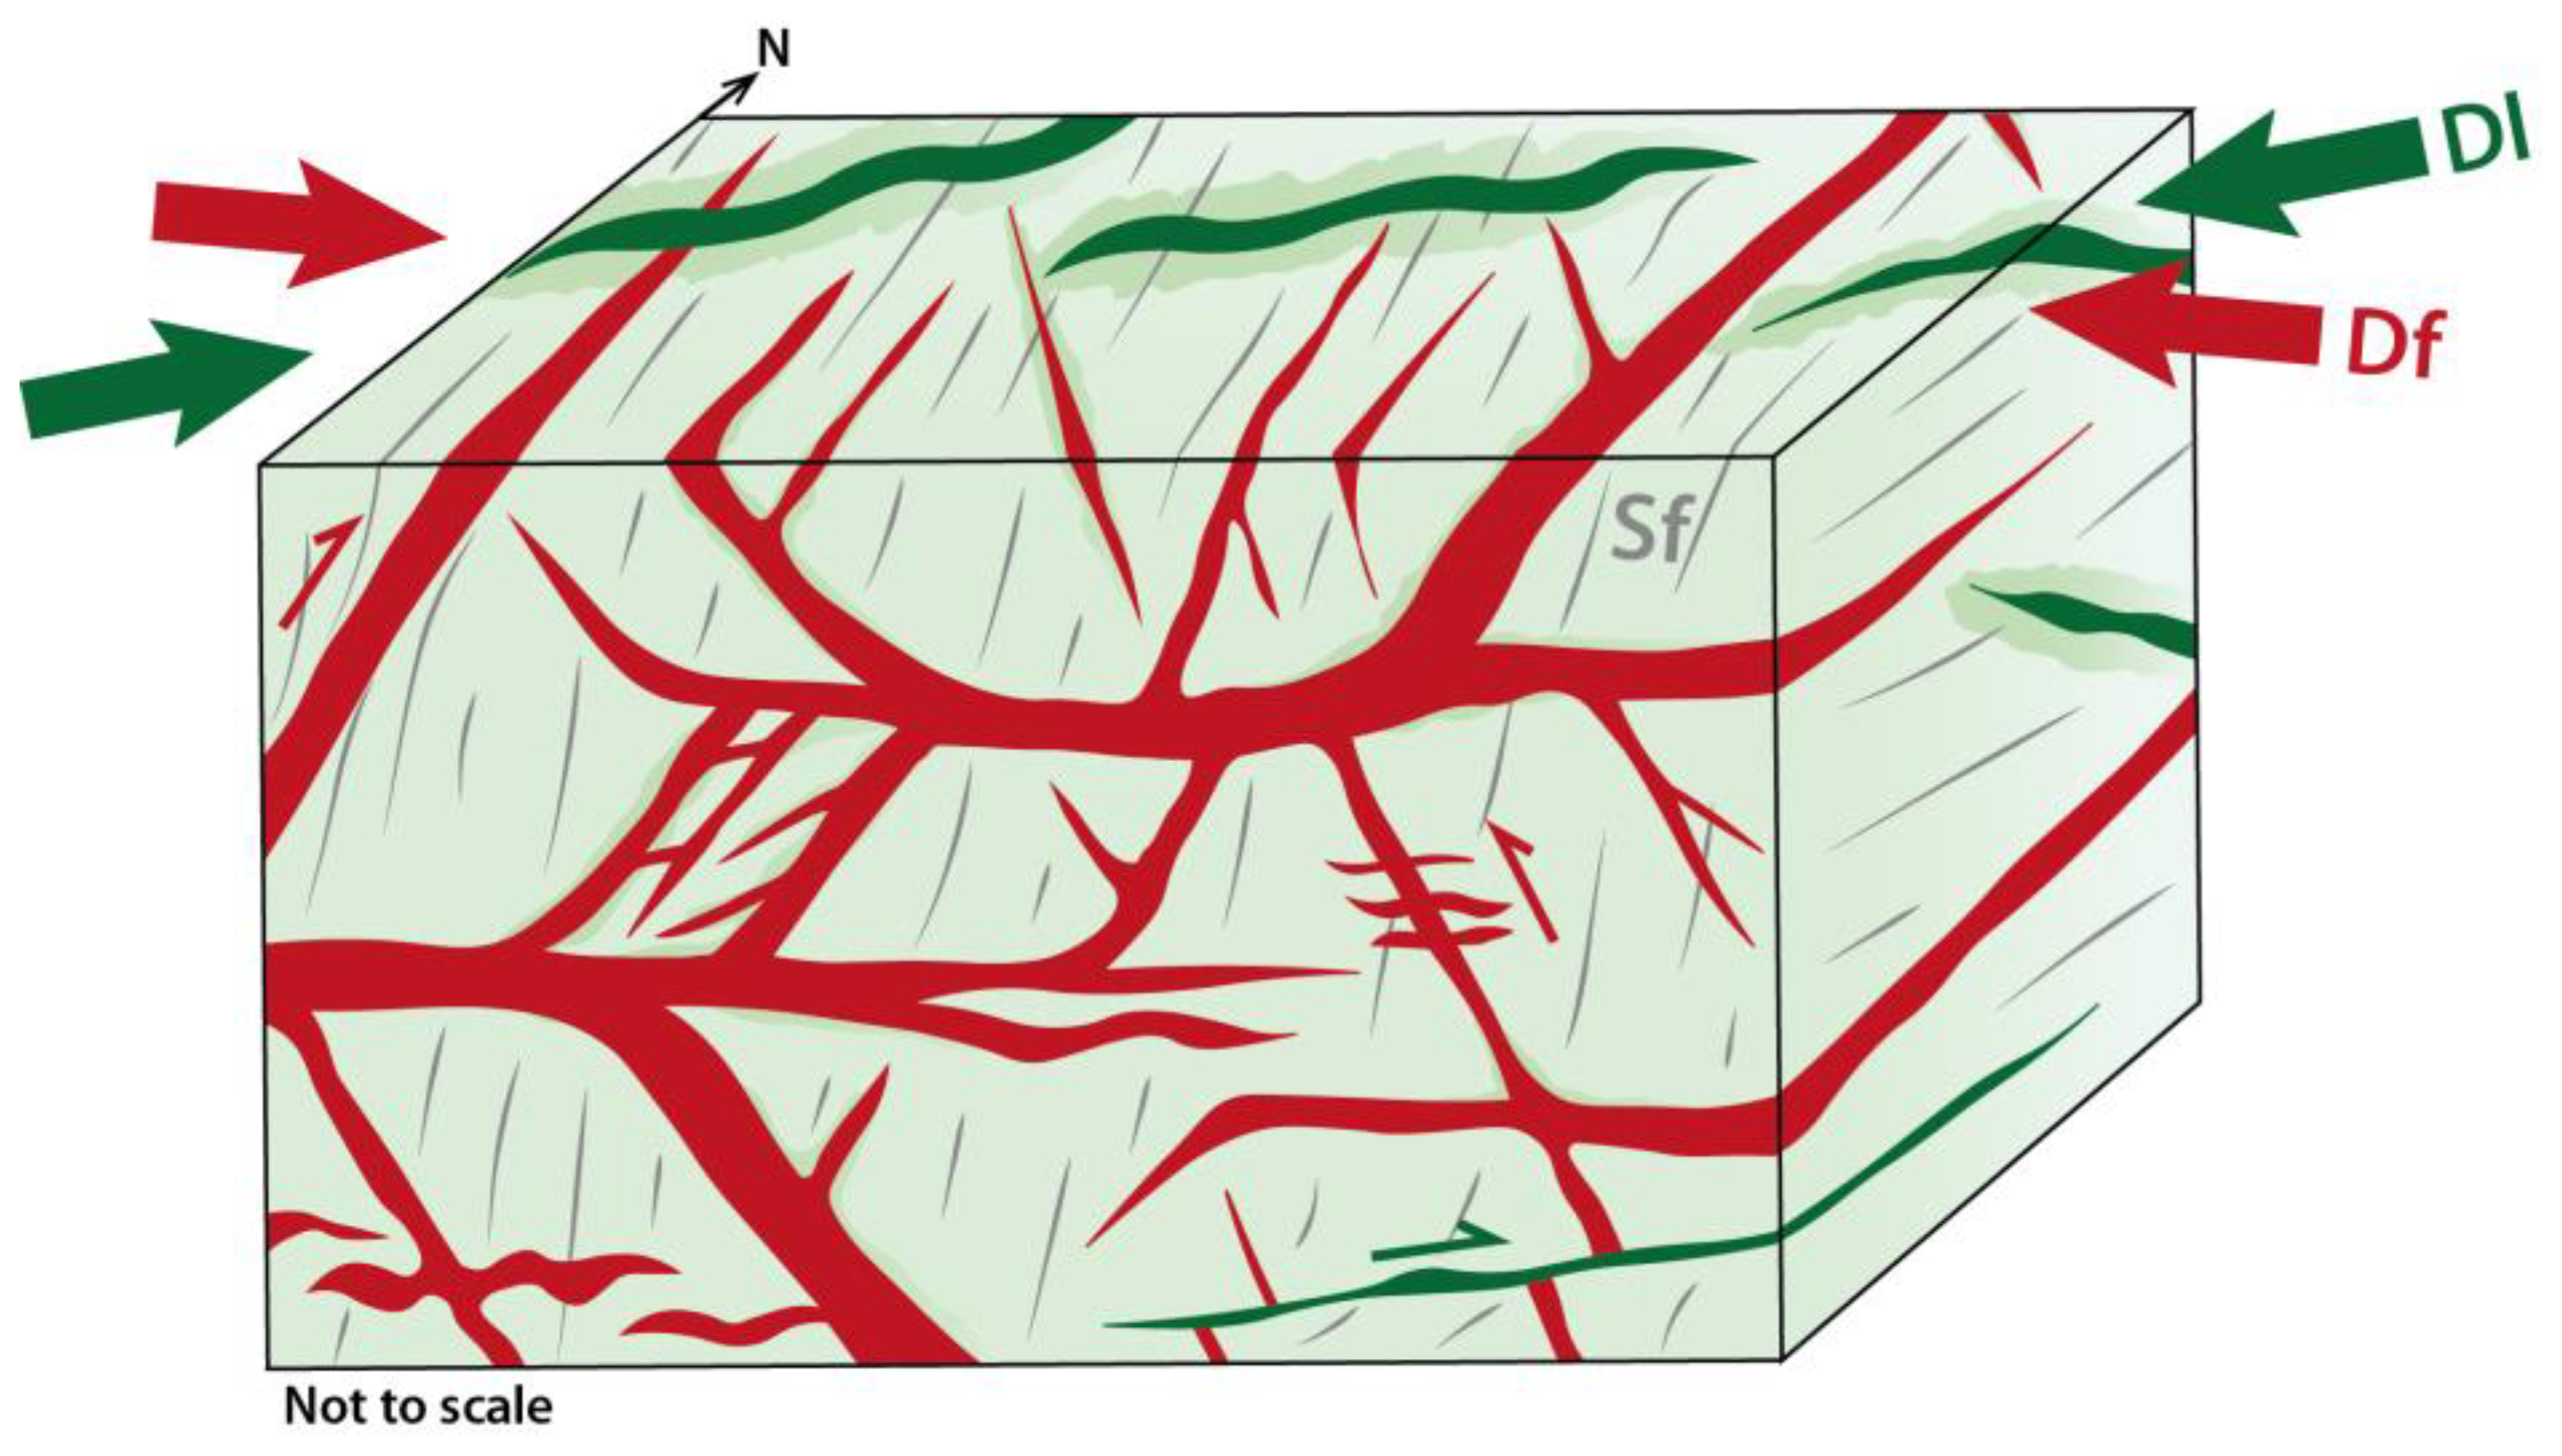
  • The second event, Df, results in this southern part of BGB from E–W shortening and corresponds to the formation of large-scale folds, i.e., the Steynsdorp anticline and Malolotja synform. The E–W shortening direction is obtained as normal to the Sf schistosity plane, presuming that the deformation Df is coaxial. This inference is based on consistent cleavage orientations, fold geometry (e.g., similar fold axial plane orientations and axis, Figure 6b), and lack of stretching lineation associated with Df. An associated N–S-striking axial planar schistosity Sf is created in several places (in red in Figure 17b). During this stage, most of the gold-bearing and/or gold-related hydrothermal quartz veins are emplaced, i.e., the horizontal and steep veins (Figure 16 and Figure 17b). The association between horizontal and steep veins demonstrates their syntectonic character (see the discussion below), also confirmed by (i) upright Ff folding of the horizontal veins formed and opened in mode I character and (ii) internal texture of horizontal veins, showing vertically elongated tourmaline and quartz grains, indicative of vertical (sometimes slightly oblique) opening. In addition to the vertical tourmalines, feldspars and fibres and comb quartz are perpendicular to the vein edges (Figure 9b,d and Figure 14c)—the local development of elongated and/or truncated tourmaline and feldspar in alteration halo also confirms the syntectonic character (Figure 13). Generally, N–S-striking, steeply west-dipping veins formed during reverse faulting (e.g., Figure 9f and Figure 16). The associated shallower veins (either dipping towards the west or the east) opened as shear planes in an R or R’ position. The complexity of this model lies in the fact that all these veins are synchronous (e.g., Rosehill and Primrose, Figure 9a,e and Figure 16). Moreover, some of the flat-to-shallow-dipping veins are folded by Sf (e.g., Ivanhoe, Figure 9b and Figure 16) or contain vertically truncated tourmalines (e.g., Figure 14c), which confirms the syntectonic character of these veins and that they formed syn in the late Df.
  • The third hydrothermal and deformation event is mainly recorded in the Malolotja area as the result of a NE–SW shortening, as determined by taking the axis parallel to the Sl poles. This deformation produced local folds and a NW–SE-striking Sl cleavage (in green in Figure 17c). In addition, this deformation controlled the emplacement of a late vein system, typified by N050-striking veins (Figure 11b, Figure 16 and Figure 17c) or shear veins displacing existing veins (Figure 11e). Currently, there is no indication justifying that this late vein system was associated with gold precipitation and/or concentration. Only the N050–070-striking veins of the late vein system have been represented in Figure 16.
Figure 17. Three-stage tectonic evolution of the southern part of the Barberton Greenstone Belt and close-up synthetic bloc views of associated quartz vein systems, showing the structural control on the emplacement of gold-related hydrothermal features. (a) Early stage. (b) Main Fold-related stage. (c) Late stage. See the text for an explanation.
Minerals 13 01034 g017
This evolution model herein proposed considers the deformation of the host rock in parallel to the different observed vein system emplacement within the southern part of the BGB. Three deformations and hydrothermal events have been highlighted. The last two stages are significantly documented by numerous field and microstructural observations. However, several points, such as the surprising distribution of mineralisation occurrences strictly following the geometry of the first-order folds, still need to be understood. Another surprising result is the fact that late veins microscopically appear affected by intense recrystallisation processes (Figure 14h), whereas the earlier mineralised veins remain less internally deformed (Figure 14f,g). All these points will be discussed further in the text.

7. Discussion

7.1. Vein Formation Model

In this study, we propose a tectono-hydrothermal model in which a complex vein system, illustrated in the schematic synthetic sketch of Figure 16, controls the formation of the gold-related hydrothermal event in the southern part of the Barberton Greenstone Belt. We, therefore, suggest that a formation model of the mineralised vein system controlled by the vertical opening of horizontal veins coevals with the formation of steeper N–S-striking shear veins associated with reverse motion, which are oriented at an obtuse angle to the shortening direction of the Df deformation. (i.e., red veins in Figure 16). Additionally, another system of late barren veins opens parallel to the finite shortening axes of the Dl deformation, similar to ‘en echelons’ veins (i.e., green veins in Figure 16). Although this complex vein system is entirely new and undescribed in the southern part of the belt, a similar vein pattern has been described in the northern part of the belt, particularly in the Sheba/Fairview gold mines (Figure 1; i.e., [21,66,85]). The mineralised vein formation model described here, with flat vein opening in mode I and associated with steep reverse and normal veins (see above), shares similarities with the one described by Gloyn-Jones and Kisters [21] and operates in coherence with the model described by Sibson [86] that combines steeply dipping veins and low-angle folded ones. Our model also shares some similarities with the ones by Cerda et al. [66,85]. However, three significant divergences subsist:
  • The fact that all veins in our case are supposed to be coeval, in contrast to the ones described by Sheba for which a relative chronology has been defined (e.g., [66,68]).
  • The orientations of the mineralised veins, which are generally striking N–S to N150 in our case, whereas they are mainly oriented NE–SW to ENE–WSW in the Sheba/Fairview systems. The structural control of the gold mineralisation is therefore interpreted with different shortening directions, i.e., E–W shortening in our case study while in the Fairview-Sheba area, they are controlled by NW–SE shortening [68,70]. The explanation of such a difference is proposed in the next chapter of the discussion. However, we note that the mineralisation-related veins are oriented perpendicular to the shortening axis direction in both models.
  • It is worth noting that the Sheba/Fairview domains have been intensively exploited and are still active, whereas Malolotja/Steynsdorp areas were historically exploited with a minor gold production.
Mineralised systems showing horizontal veins associated with steep mineralised veins have been reported in several cases of gold-bearing quartz veins in Archean greenstone belts, such as the Abitibi (Canada; [87]) or the Norseman-Wiluna (Australia; [88]). Whether this specific geometry typically represents vein systems emplaced within the Archean continental crust cannot be confirmed. Such a point has been discussed by Foster and Piper [89], who clearly make a relationship between gold metallogeny, complex vein systems, and the multiplicity of tectono-thermal events that dominate during the Archean formation of the craton. Examples from the Barberton, Zimbabwe, and Tanzanian cratons have been cited.
The gold occurrences both in Malolotja and Steynsdorp areas are exclusively hosted by the Onverwacht Group rocks (Figure 3 and Figure 7). This fact underlines that they are significantly structurally controlled and most likely linked with fold geometry and formation (see Section 6). In addition, this distribution can be also consistent with the hypothesis of Viljoen et al. [29], suggesting that the mafic to ultramafic rocks of the Onverwacht Group show substantial anomalies and, thus, are good candidates for gold sources.

7.2. Significance of the Deformation Events

The initial stage of our tectono-hydrothermal model, illustrated in Figure 17, is not well constrained by our data. In the Malolotja synform, Lamb [81] and Heubeck et al. [79] propose an early thrust towards the NW, which has been folded afterwards. The De deformation in our model may be related to this thrust event, putting the Onverwacht Group on the Moodies Group (Figure 17a). In the study area, few observations consistent with this early thrusting event have been recorded, with evidence of local reverse shear to the NNW in the hinge zone of the Malolotja synform (Figure 4c). On the contrary, the Se schistosity dips to the north at Steynsdorp. This difference in dip may be due to the doming effect related to the Steynsdorp pluton [38], which can be expressed by the NNE-plunging mineral lineation.
The Df deformation is induced by E–W shortening forming the large-scale Malolotja and Steynsdorp folds. This E–W shortening deformation visible in the southern part of the belt is interpreted as similar to the main and major NW–SE event that affected the closure of the BGB [30] but rotated locally to form the arc geometry of the belt. Indeed, the geometry of the belt and the rotation of the large-scale structures, such as faults and folds, from NE–SW to N–S striking in the south of the belt are in line with this interpretation. Because this fold-related deformation affects the Moodies Group, it probably postdates the main shortening events (i.e., D2 event [30]; Figure 2). Lamb [80] described the Malolotja syncline as D3 folds, and the Df deformation observed in this study probably corresponds to the main D3 NW–SE shortening of the belt suggested by de Ronde and de Wit ([30]; Figure 2).
A NE–SW shortening event has never been reported or described at the scale of the Barberton Greenstone Belt. The regional extent and tectonic significance of this event are therefore enigmatic. De Wit et al. [90] observed km wavelength NW–SE-striking folds to the WSW of the Stolzburg syncline that is compatible with a NE–SW shortening direction. As they refold earlier structures related to the main NW–SE shortening event, they are interpreted as late. Van Kranendonk et al. [91] also documented the existence of a NW–SE-striking, steeply dipping mylonite zone with a down-dip stretching lineation. Because a reverse motion is described, this mylonite zone is, therefore, formed by NE–SW shortening. In their work, Van Kranendonk et al. [91] noted that the mylonitic zone is along strike with the undeformed, NW–SE striking ca. 3107 Ma Kees Zyn Doorns syenite, which is coeval with the vast Mpuluzi batholith (Figure 1; [34]). Static recrystallisation of minerals related to contact metamorphism is also described. This can question a potential link between the late emplacement of the ca. 3.1 Ga batholiths and the formation of the late Dl event. No clear answer can be provided at this stage, but two facts need consideration: (i) the more recrystallised aspect of late quartz veins illustrated in Figure 14h; (ii) the persistence and maybe the increase of tourmaline, K-feldspar, and albite content both within veins and alteration halos of the late quartz vein system.
Two additional arguments can also question the chronological relationships between Dl and Df events although clear overprinting criteria are described (Figure 6i):
  • Mineralogically, the two events show similar infilling and alteration halos (Figure 13).
  • The mineralised vein system shows the coexistence of N–S and NW–SE-striking steep veins (Figure 10 and Figure 16)—the fact that can be explained by simultaneous actions of Df and Dl events.
Indeed, our evolutionary model takes into account this hypothesis and proposes that earlier effects of the NE–SW shortening direction (Dl) may have occurred during the late stage of the Df deformation (Figure 17b). The final stage would be dominated by the late Dl event in continuity with the achievement of the Df folding (Figure 17c).
The shortening direction of the Df and Dl events are obtained assuming they are coaxial deformations. This suggests a regime of homogeneous strain distribution and geometric preservation. However, it cannot be excluded that the deformation can be partitioned between noncoaxial and coaxial domains as expressed by the feeling that some vein outcrops are associated with top-to-the-west verging (not illustrated here).

7.3. Timing of the Mineralisation Event

Several gold mineralisation ages have been published exclusively in the northern part of the Barberton Greenstone Belt. At Fairview mine, de Ronde et al. [75] dated a porphyry body crosscut by the mineralisation at ca. 3126 Ma (U-Pb zircon), thus representing the oldest age for mineralisation. These authors also dated a hydrothermal rutile that provides a lower bracket at ca. 3084 Ma (U-Pb). Other younger ages have been published at the New Consort mine (Figure 1) by dating a hydrothermal titanite linked to the alteration at 3027 ± 7 Ma (U-Pb [74]). The dating of a felsic dyke interpreted as coeval with the gold mineralisation at Golden Quarry (near Sheba mine) also provides ca. 3015 Ma (U-Pb zircon [71]). Overall, two periods of mineralisation seem to emerge from the literature, the first one at 3126–3084 Ma and a younger one at 3027–3015 Ma. Thus, the ages of the gold mineralisation appear to be spread over a long period of time, suggesting at least two mineralisation episodes and/or that the dating of the mineralisation is not well constrained. The first mineralisation at 3126–3084 Ma is interpreted to be controlled by the late D3 event dated at 3227–3084 Ma by de Ronde and de Wit ([30]; Figure 2), whereas the second one (3027–3015 Ma) maybe post-D3, during the stabilisation of the Kaapvaal Craton estimated around 3.1–2.7 Ga [92].
Regarding the different events proposed in the literature and summarised in Figure 2, an attempt to correlate deformation events and the two episodes of hydrothermal events of our study (Df and Dl) and, consequently, gold formation in the southern part of the BGB is discussed here. No absolute mineralisation dating is available in this part of the belt. In the model proposed in this study, the main mineralisation stage is supposed to be syn to late Df according to Figure 17. This could be compatible with the D3 event in the de Ronde and de Wit model ([30]; Figure 2) and relatively similar to the ages obtained in the Fairview mine by de Ronde et al. [75]. If accepting the potential continuity between Df and Dl (see the discussion above) and their association with gold-related hydrothermal veins, one can suppose here that gold in the southern part of the BGB can be a long-lived event beginning during the late stage of the main shortening event (D3/Df) and ending, with a lower grade, during Dl.

8. Conclusions

Detailed field structural analysis, associated with the petrological and microstructural study of the southern part of the Barberton Greenstone Belt, straddling the international border between South Africa and Eswatini, allowed for the understanding of the structural control of the numerous quartz veins and the deformation of the host rock. The present study demonstrates that the Onverwacht and Moodies Group rocks in the southern part of the belt experienced three deformation events manifested by the development of deformation structures and associated hydrothermal veins. The first event produced a locally preserved composite foliation Se, which is E–W striking and may be related to a thrusting event. The second event is related to large-scale folding forming the Steynsdorp anticline and Malolotja synform, a N–S-striking axial planar cleavage Sf, coeval to the emplacement of a complex network of gold-related veins in response to E–W shortening. Such E–W shortening is attributed to the main regional NW–SE closure of the BGB. A third deformation event locally overprints all previous structures. It is produced by NE–SW shortening and is also related to late hydrothermal and barren quartz veins. The origin of the NE–SW shortening that formed the late veins is enigmatic. The deformation of the study area and its variations over time formed different hydrothermal vein systems. Vein and their host-rock deformation study in this part of the famous Barberton Greenstone Belt provides a good case study for a better understanding of the tectono-hydrothermal evolution of a portion of the Archean domain.

Author Contributions

Conceptualization, L.T., A.C. and J.L.; fieldwork, L.T., A.C. and J.L.; formal analysis, L.T., A.C. and J.L.; investigation, L.T., A.C. and J.L.; microscopy, L.T., A.C. and J.L.; writing—original draft preparation, L.T., A.C. and J.L.; writing—review and editing, L.T., A.C. and J.L.; supervision, A.C. and J.L. All authors have read and agreed to the published version of the manuscript.

Funding

L. Travers was granted an ED GAIA scholarship to work on her doctorate project. The IRP BuCOMO also funded this research.

Data Availability Statement

The data presented in this study are available on request from the corresponding author.

Acknowledgments

This work benefited greatly from the scientific and financial support of Jean-François Moyen and the IRP BuCOMO (https://bucomo.fr/ accessed on 29 July 2023). Christoph Heubeck and Andrea Els are particularly acknowledged for their strong support and significant help during all our field trips in the Barberton area. Barberton Adventure, Astrid Christianson, Johan Eksteen (Mpumalanga Tourism & Parks Agency), Cornelius Mashaba, Teddy Dlamini (and their team from the Malolotja Nature Reserve) and Thomas Moinet are acknowledged for their assistance in the field.

Conflicts of Interest

The authors declare no conflict of interest.

References

  1. Belousova, E.A.; Kostitsyn, Y.A.; Griffin, W.L.; Begg, G.C.; O’Reilly, S.Y.; Pearson, N.J. The Growth of the Continental Crust: Constraints from Zircon Hf-Isotope Data. Lithos 2010, 119, 457–466. [Google Scholar] [CrossRef]
  2. Herzberg, C.; Condie, K.; Korenaga, J. Thermal History of the Earth and Its Petrological Expression. Earth Planet. Sci. Lett. 2010, 292, 79–88. [Google Scholar] [CrossRef]
  3. Nisbet, E.G.; Cheadle, M.J.; Arndt, N.T.; Bickle, M.J. Constraining the Potential Temperature of the Archaean Mantle: A Review of the Evidence from Komatiites. Lithos 1993, 30, 291–307. [Google Scholar] [CrossRef]
  4. Martin, H. Chapter 6 The Archean Grey Gneisses and the Genesis of Continental Crust. In Developments in Precambrian Geology; Elsevier: Amsterdam, The Netherlands, 1994; Volume 11, pp. 205–259. ISBN 978-0-444-81621-4. [Google Scholar]
  5. Condie, K.C. Archean Greenstone Belts; Elsevier: Amsterdam, The Netherlands, 1981; ISBN 978-0-08-086902-5. [Google Scholar]
  6. Gorman, B.E.; Pearce, T.H.; Birkett, T.C. On the Structure of Archean Greenstone Belts. Precambrian Res. 1978, 6, 23–41. [Google Scholar] [CrossRef]
  7. Van Hunen, J.; Moyen, J.-F. Archean Subduction: Fact or Fiction? Annu. Rev. Earth Planet. Sci. 2012, 40, 195–219. [Google Scholar] [CrossRef] [Green Version]
  8. Gapais, D. Tectonics-Mineralisation Relationships within Weak Continental Lithospheres: A New Structural Framework for Precambrian Cratons. BSGF-Earth Sci. Bull. 2018, 189, 14. [Google Scholar] [CrossRef]
  9. Barley, M.E.; Groves, D.I. Supercontinent Cycles and the Distribution of Metal Deposits through Time. Geology 1992, 20, 291. [Google Scholar] [CrossRef]
  10. Goldfarb, R.J.; Groves, D.I.; Gardoll, S. Orogenic Gold and Geologic Time: A Global Synthesis. Ore Geol. Rev. 2001, 18, 1–75. [Google Scholar] [CrossRef]
  11. Groves, D.I.; Vielreicher, R.M.; Goldfarb, R.J.; Condie, K.C. Controls on the Heterogeneous Distribution of Mineral Deposits through Time. Geol. Soc. Lond. Spec. Publ. 2005, 248, 71–101. [Google Scholar] [CrossRef]
  12. Boullier, A.-M.; Robert, F. Palaeoseismic Events Recorded in Archaean Gold-Quartz Vein Networks, Val d’Or, Abitibi, Quebec, Canada. J. Struct. Geol. 1992, 14, 161–179. [Google Scholar] [CrossRef]
  13. Anhaeusser, C.R. The Geology and Tectonic Evolution of the Northwest Part of the Barberton Greenstone Belt, South Africa: A Review. S. Afr. J. Geol. 2019, 122, 421–454. [Google Scholar] [CrossRef]
  14. Ward, J.H.W. (Map Compiler) Metallogenic Map of the Barberton Greenstone Belt, South Africa and Swaziland; 1:100000; Council for Geoscience: Pretoria, South Africa, 2000. [Google Scholar]
  15. Pearton, T.; Viljoen, M. Gold on the Kaapvaal Craton, Outside the Witwatersrand Basin, South Africa. S. Afr. J. Geol. 2017, 120, 101–132. [Google Scholar] [CrossRef]
  16. Anhaeusser, C.R. Archean Metallogeny in Southern Africa. Econ. Geol. 1976, 71, 16–43. [Google Scholar] [CrossRef]
  17. Agangi, A.; Hofmann, A.; Przybyłowicz, W. Trace Element Zoning of Sulfides and Quartz at Sheba and Fairview Gold Mines: Clues to Mesoarchean Mineralisation in the Barberton Greenstone Belt, South Africa. Ore Geol. Rev. 2014, 56, 94–114. [Google Scholar] [CrossRef]
  18. Altigani, M.A.H. Insights on Mineralogy and Chemistry of Fairview Gold Mine, Barberton Greenstone Belt, South Africa. Indones. J. Geosci. 2021, 8, 73–99. [Google Scholar] [CrossRef]
  19. Dirks, P.H.G.M.; Charlesworth, E.G.; Munyai, M.R. Cratonic Extension and Archaen Gold Mineralisation in the Sheba-Fairview Mine, Barberton Greenstone Belt, South Africa. S. Afr. J. Geol. 2009, 112, 291–316. [Google Scholar] [CrossRef] [Green Version]
  20. Dziggel, A.; Otto, A.; Kisters, A.F.M.; Meyer, F.M. Chapter 5.8 Tectono-Metamorphic Controls on Archean Gold Mineralization in the Barberton Greenstone Belt, South Africa: An Example from the New Consort Gold Mine. In Developments in Precambrian Geology; Elsevier: Amsterdam, The Netherlands, 2007; Volume 15, pp. 699–727. ISBN 978-0-444-52810-0. [Google Scholar]
  21. Gloyn-Jones, J.; Kisters, A. Ore-Shoot Formation in the Main Reef Complex of the Fairview Mine—Multiphase Gold Mineralization during Regional Folding, Barberton Greenstone Belt, South Africa. Miner. Depos. 2019, 54, 1157–1178. [Google Scholar] [CrossRef]
  22. Munyai, M.R.; Dirks, P.H.G.M.; Charlesworth, E.G. Archaean Gold Mineralisation during Post-Orogenic Extension in the New Consort Gold Mine, Barberton Greenstone Belt, South Africa. S. Afr. J. Geol. 2011, 114, 121–144. [Google Scholar] [CrossRef]
  23. Otto, A.; Dziggel, A.; Kisters, A.F.M.; Meyer, F.M. The New Consort Gold Mine, Barberton Greenstone Belt, South Africa: Orogenic Gold Mineralization in a Condensed Metamorphic Profile. Miner. Depos. 2007, 42, 715–735. [Google Scholar] [CrossRef]
  24. Jackson, M.P.A.; Eriksson, K.A.; Harris, C.W. Early Archean Foredeep Sedimentation Related to Crustal Shortening: A Reinterpretation of the Barberton Sequence, Southern Africa. Tectonophysics 1987, 136, 197–221. [Google Scholar] [CrossRef]
  25. Lowe, D.R.; Byerly, G.R. Ironstone Bodies of the Barberton Greenstone Belt, South Africa: Products of a Cenozoic Hydrological System, Not Archean Hydrothermal Vents! Geol. Soc. Am. Bull. 2007, 119, 65–87. [Google Scholar] [CrossRef]
  26. Byerly, G.R.; Kröner, A.; Lowe, D.R.; Todt, W.; Walsh, M.M. Prolonged Magmatism and Time Constraints for Sediment Deposition in the Early Archean Barberton Greenstone Belt: Evidence from the Upper Onverwacht and Fig Tree Groups. Precambrian Res. 1996, 78, 125–138. [Google Scholar] [CrossRef]
  27. Kröner, A.; Hegner, E.; Wendt, J.I.; Byerly, G.R. The Oldest Part of the Barberton Granitoid-Greenstone Terrain, South Africa: Evidence for Crust Formation between 3.5 and 3.7 Ga. Precambrian Res. 1996, 78, 105–124. [Google Scholar] [CrossRef]
  28. Poujol, M.; Robb, L.J.; Anhaeusser, C.R.; Gericke, B. A Review of the Geochronological Constraints on the Evolution of the Kaapvaal Craton, South Africa. Precambrian Res. 2003, 127, 181–213. [Google Scholar] [CrossRef]
  29. Viljoen, R.P.; Saager, R.; Viljoen, M.J. Metallogenesis and Ore Control in the Steynsdorp Goldfield, Barberton Mountain Land, South Africa. Econ. Geol. 1969, 64, 778–797. [Google Scholar] [CrossRef]
  30. De Ronde, C.E.J.; de Wit, M.J. Tectonic History of the Barberton Greenstone Belt, South Africa: 490 Million Years of Archean Crustal Evolution. Tectonics 1994, 13, 983–1005. [Google Scholar] [CrossRef]
  31. Hofmann, A. The Geochemistry of Sedimentary Rocks from the Fig Tree Group, Barberton Greenstone Belt: Implications for Tectonic, Hydrothermal and Surface Processes during Mid-Archaean Times. Precambrian Res. 2005, 143, 23–49. [Google Scholar] [CrossRef]
  32. Drabon, N.; Heubeck, C.E.; Lowe, D.R. Evolution of an Archean Fan Delta and Its Implications for the Initiation of Uplift and Deformation in the Barberton Greenstone Belt, South Africa. J. Sediment. Res. 2019, 89, 849–874. [Google Scholar] [CrossRef]
  33. Heubeck, C.; Lowe, D.R. Depositional and Tectonic Setting of the Archean Moodies Group, Barberton Greenstone Belt, South Africa. Precambrian Res. 1994, 68, 257–290. [Google Scholar] [CrossRef] [PubMed]
  34. Kamo, S.L.; Davis, D.W. Reassessment of Archean Crustal Development in the Barberton Mountain Land, South Africa, Based on U-Pb Dating. Tectonics 1994, 13, 167–192. [Google Scholar] [CrossRef]
  35. Heubeck, C.; Lowe, D.R. Late Syndepositional Deformation and Detachment Tectonics in the Barberton Greenstone Belt, South Africa. Tectonics 1994, 13, 1514–1536. [Google Scholar] [CrossRef]
  36. De Wit, M.J.; de Ronde, C.E.J.; Tredoux, M.; Roering, C.; Hart, R.J.; Armstrong, R.A.; Green, R.W.E.; Peberdy, E.; Hart, R.A. Formation of an Archaean Continent. Nature 1992, 357, 553–562. [Google Scholar] [CrossRef]
  37. Stevens, G.; Moyen, J.-F. Chapter 5.7 Metamorphism in the Barberton Granite Greenstone Terrain: A Record of Paleoarchean Accretion. In Developments in Precambrian Geology; Elsevier: Amsterdam, The Netherlands, 2007; Volume 15, pp. 669–698. ISBN 978-0-444-52810-0. [Google Scholar]
  38. Kisters, A.F.M.; Anhaeusser, C.R. The Structural Significance of the Steynsdorp Pluton and Anticline within the Tectonomagmatic Framework of the Barberton Mountain Land. S. Afr. J. Geol. 1995, 98, 43–51. [Google Scholar]
  39. Moyen, J.-F.; Stevens, G.; Kisters, A.F.M.; Belcher, R.W. Chapter 5.6 TTG Plutons of the Barberton Granitoid-Greenstone Terrain, South Africa. In Developments in Precambrian Geology; Elsevier: Amsterdam, The Netherlands, 2007; Volume 15, pp. 607–667. ISBN 978-0-444-52810-0. [Google Scholar]
  40. Moyen, J.-F.; Stevens, G.; Kisters, A.F.M.; Belcher, R.W.; Lemirre, B. TTG Plutons of the Barberton Granitoid-Greenstone Terrain, South Africa. In Earth’s Oldest Rocks; Elsevier: Amsterdam, The Netherlands, 2019; pp. 615–653. ISBN 978-0-444-63901-1. [Google Scholar]
  41. Kisters, A.F.M.; Belcher, R.W.; Poujol, M.; Dziggel, A. Continental Growth and Convergence-Related Arc Plutonism in the Mesoarchaean: Evidence from the Barberton Granitoid-Greenstone Terrain, South Africa. Precambrian Res. 2010, 178, 15–26. [Google Scholar] [CrossRef]
  42. De Ronde, C.E.J.; Kamo, S.L. An Archean Arc-Arc Collisional Event: A Short-Lived (ca 3 Myr) Episode, Weltevreden Area, Barberton Greenstone Belt, South Africa. J. Afr. Earth Sci. 2000, 30, 219–248. [Google Scholar] [CrossRef]
  43. Robb, L.J.; Brandl, G.; Anhaeusser, C.R.; Poujol, M.; Johnson, M.R.; Thomas, R.J. Archaean Granitoid Intrusions. In The Geology of South Africa; Geological Society of South Africa/Council for Geoscience: Johannesburg/Pretoria, South Africa, 2006; pp. 57–94. [Google Scholar]
  44. Kisters, A.F.M.; Stevens, G.; Dziggel, A.; Armstrong, R.A. Extensional Detachment Faulting and Core-Complex Formation in the Southern Barberton Granite–Greenstone Terrain, South Africa: Evidence for a 3.2 Ga Orogenic Collapse. Precambrian Res. 2003, 127, 355–378. [Google Scholar] [CrossRef]
  45. Schoene, B.; Bowring, S.A. Determining Accurate Temperature–Time Paths from U–Pb Thermochronology: An Example from the Kaapvaal Craton, Southern Africa. Geochim. Cosmochim. Acta 2007, 71, 165–185. [Google Scholar] [CrossRef]
  46. Moyen, J.-F.; Zeh, A.; Cuney, M.; Dziggel, A.; Carrouée, S. The Multiple Ways of Recycling Archaean Crust: A Case Study from the ca. 3.1 Ga Granitoids from the Barberton Greenstone Belt, South Africa. Precambrian Res. 2021, 353, 105998. [Google Scholar] [CrossRef]
  47. Anhaeusser, C.R.; Robb, L.J.; Barton, J.M.J. Mineralogy, Petrology and Origin of the Boesmanskop Syeno-Granite Complex, Barberton Mountain Land, South Africa. Spec. Publ.-Geol. Soc. S. Afr. 1983, 9, 169–183. [Google Scholar]
  48. Grosch, E.G.; Vidal, O.; Abu-Alam, T.; McLoughlin, N. P-T Constraints on the Metamorphic Evolution of the Paleoarchean Kromberg Type-Section, Barberton Greenstone Belt, South Africa. J. Pet. 2012, 53, 513–545. [Google Scholar] [CrossRef] [Green Version]
  49. Tice, M.M.; Bostick, B.C.; Lowe, D.R. Thermal History of the 3.5–3.2 Ga Onverwacht and Fig Tree Groups, Barberton Greenstone Belt, South Africa, Inferred by Raman Microspectroscopy of Carbonaceous Material. Geology 2004, 32, 37. [Google Scholar] [CrossRef] [Green Version]
  50. Cutts, K.A.; Stevens, G.; Hoffmann, J.E.; Buick, I.S.; Frei, D.; Munker, C. Paleo- to Mesoarchean Polymetamorphism in the Barberton Granite-Greenstone Belt, South Africa: Constraints from U-Pb Monazite and Lu-Hf Garnet Geochronology on the Tectonic Processes That Shaped the Belt. Geol. Soc. Am. Bull. 2014, 126, 251–270. [Google Scholar] [CrossRef] [Green Version]
  51. Diener, J.F.A.; Stevens, G.; Kisters, A.F.M.; Poujol, M. Metamorphism and Exhumation of the Basal Parts of the Barberton Greenstone Belt, South Africa: Constraining the Rates of Mesoarchaean Tectonism. Precambrian Res. 2005, 143, 87–112. [Google Scholar] [CrossRef]
  52. Moyen, J.-F.; Stevens, G.; Kisters, A. Record of Mid-Archaean Subduction from Metamorphism in the Barberton Terrain, South Africa. Nature 2006, 442, 559–562. [Google Scholar] [CrossRef]
  53. Dziggel, A.; Knipfer, S.; Kisters, A.F.M.; Meyer, F.M. P-T and Structural Evolution during Exhumation of High-T, Medium-P Basement Rocks in the Barberton Mountain Land, South Africa: Metamorphic Evolution, Barberton Mountain Land. J. Metamorph. Geol. 2006, 24, 535–551. [Google Scholar] [CrossRef]
  54. Dziggel, A.; Stevens, G.; Poujol, M.; Anhaeusser, C.R.; Armstrong, R.A. Metamorphism of the Granite–Greenstone Terrane South of the Barberton Greenstone Belt, South Africa: An Insight into the Tectono-Thermal Evolution of the ‘Lower’ Portions of the Onverwacht Group. Precambrian Res. 2002, 114, 221–247. [Google Scholar] [CrossRef]
  55. Lowe, D.R.; Byerly, G.R.; Heubeck, C. Structural Divisions and Development of the West-Central Part of the Barberton Greenstone Belt. In Geologic Evolution of the Barberton Greenstone Belt, South Africa; Lowe, D.R., Byerly, G.R., Eds.; Geological Society of America: New York, NY, USA, 1999; Volume 329, ISBN 978-0-8137-2329-7. [Google Scholar]
  56. Ramsay, J.G. Structural Investigations in the Barberton Mountian Land, Eastern Transvaal. S. Afr. J. Geol. 1963, 66, 353–401. [Google Scholar]
  57. Van Kranendonk, M.J. Gliding and Overthrust Nappe Tectonics of the Barberton Greenstone Belt Revisited: A Review of Deformation Styles and Processes. S. Afr. J. Geol. 2021, 124, 181–210. [Google Scholar] [CrossRef]
  58. Anhaeusser, C.R. The Evolution of the Early Precambrian Crust of Southern Africa. Philos. Trans. R. Soc. Lond. 1973, 273, 359–388. [Google Scholar]
  59. Hoffmann, J.E.; Kröner, A.; Hegner, E.; Viehmann, S.; Xie, H.; Iaccheri, L.M.; Schneider, K.P.; Hofmann, A.; Wong, J.; Geng, H.; et al. Source Composition, Fractional Crystallization and Magma Mixing Processes in the 3.48–3.43 Ga Tsawela Tonalite Suite (Ancient Gneiss Complex, Swaziland)—Implications for Palaeoarchaean Geodynamics. Precambrian Res. 2016, 276, 43–66. [Google Scholar] [CrossRef]
  60. Lowe, D.R. Accretionary History of the Archean Barberton Greenstone Belt (3.55–3.22 Ga), Southern Africa. Geology 1994, 22, 1099. [Google Scholar] [CrossRef] [PubMed]
  61. Armstrong, R.A.; Compston, W.; de Wit, M.J.; Williams, I.S. The Stratigraphy of the 3.5–3.2 Ga Barberton Greenstone Belt Revisited: A Single Zircon Ion Microprobe Study. Earth Planet. Sci. Lett. 1990, 101, 90–106. [Google Scholar] [CrossRef]
  62. Kohler, E.A.; Anhaeusser, C.R. Geology and Geodynamic Setting of Archaean Silicic Metavolcaniclastic Rocks of the Bien Venue Formation, Fig Tree Group, Northeast Barberton Greenstone Belt, South Africa. Precambrian Res. 2002, 116, 199–235. [Google Scholar] [CrossRef]
  63. Van Kranendonk, M.J.; Kröner, A.; Hegner, E.; Connelly, J. Age, Lithology and Structural Evolution of the c. 3.53 Ga Theespruit Formation in the Tjakastad Area, Southwestern Barberton Greenstone Belt, South Africa, with Implications for Archaean Tectonics. Chem. Geol. 2009, 261, 115–139. [Google Scholar] [CrossRef]
  64. Drabon, N.; Lowe, D.R. Progressive Accretion Recorded in Sedimentary Rocks of the 3.28–3.23 Ga Fig Tree Group, Barberton Greenstone Belt. GSA Bull. 2021, 134, 1258–1276. [Google Scholar] [CrossRef]
  65. Lana, C.; Buick, I.; Stevens, G.; Rossouw, R.; De Wet, W. 3230–3200 Ma Post-Orogenic Extension and Mid-Crustal Magmatism along the Southeastern Margin of the Barberton Greenstone Belt, South Africa. J. Struct. Geol. 2011, 33, 844–858. [Google Scholar] [CrossRef]
  66. Cerda, L.R.P.; Jones, C.; Kisters, A. The Effects of Fault-Zone Architecture, Wall-Rock Competence and Fluid Pressure Variations on Hydrothermal Veining and Gold Mineralization along the Sheba Fault, Barberton Greenstone Belt, South Africa. J. Afr. Earth Sci. 2022, 192, 104554. [Google Scholar] [CrossRef]
  67. Agangi, A.; Hofmann, A.; Eickmann, B.; Marin-Carbonne, J. Mesoarchaean Gold Mineralisation in the Barberton Greenstone Belt: A Review. In The Archaean Geology of the Kaapvaal Craton, Southern Africa; Kröner, A., Hofmann, A., Eds.; Regional Geology Reviews; Springer International Publishing: Cham, Switzerland, 2019; pp. 171–184. ISBN 978-3-319-78651-3. [Google Scholar]
  68. Gloyn-Jones, J.; Kisters, A. Regional Folding, Low-Angle Thrusting and Permeability Networks: Structural Controls of Gold Mineralization in the Hope Reef at Fairview Mine, Barberton Greenstone Belt, South Africa. Ore Geol. Rev. 2018, 102, 585–603. [Google Scholar] [CrossRef]
  69. De Ronde, C.E.J.; Spooner, E.T.C.; de Wit, M.J.; Bray, C.J. Shear Zone-Related, Au Quartz Vein Deposits in the Barberton Greenstone Belt, South Africa; Field and Petrographic Characteristics, Fluid Properties, and Light Stable Isotope Geochemistry. Econ. Geol. 1992, 87, 366–402. [Google Scholar] [CrossRef]
  70. Jones, C.; Kisters, A. Regional and Local Controls of Hydrothermal Fluid Flow and Gold Mineralization in the Sheba and Fairview Mines, Barberton Greenstone Belt, South Africa. Ore Geol. Rev. 2022, 144, 104805. [Google Scholar] [CrossRef]
  71. Dirks, P.H.G.M.; Charlesworth, E.G.; Munyai, M.R.; Wormald, R. Stress Analysis, Post-Orogenic Extension and 3.01Ga Gold Mineralisation in the Barberton Greenstone Belt, South Africa. Precambrian Res. 2013, 226, 157–184. [Google Scholar] [CrossRef]
  72. Anhaeusser, C.R. The Geology of the Jamestown Hills Area of the Barberton Mountain Land, South Africa. S. Afr. J. Geol. 1972, 75, 225–263. [Google Scholar]
  73. Viljoen, M.J. The Geology of the Lily Syncline and Portion of the Eureka Syncline Between the Consort Mine and Joe’s Luck Siding, Barberton Mountain Land. Master’s Thesis, University of the Witwatersrand, Johannesburg, South Africa, 1963. [Google Scholar]
  74. Dziggel, A.; Poujol, M.; Otto, A.; Kisters, A.F.M.; Trieloff, M.; Schwarz, W.H.; Meyer, F.M. New U–Pb and 40Ar/39Ar Ages from the Northern Margin of the Barberton Greenstone Belt, South Africa: Implications for the Formation of Mesoarchaean Gold Deposits. Precambrian Res. 2010, 179, 206–220. [Google Scholar] [CrossRef]
  75. De Ronde, C.E.J.; Kamo, S.; Davis, D.W.; De Wit, M.J.; Spooner, E.T.C. Field, Geochemical and U-Pb Isotopic Constraints from Hypabyssal Felsic Intrusions within the Barberton Greenstone Belt, South Africa: Implications for Tectonics and the Timing of Gold Mineralization. Precambrian Res. 1991, 49, 261–280. [Google Scholar] [CrossRef]
  76. Furnes, H.; de Wit, M.; Robins, B. A Review of New Interpretations of the Tectonostratigraphy, Geochemistry and Evolution of the Onverwacht Suite, Barberton Greenstone Belt, South Africa. Gondwana Res. 2013, 23, 403–428. [Google Scholar] [CrossRef]
  77. Lana, C.; Kisters, A.; Stevens, G. Exhumation of Mesoarchean TTG Gneisses from the Middle Crust: Insights from the Steynsdorp Core Complex, Barberton Granitoid-Greenstone Terrain, South Africa. Geol. Soc. Am. Bull. 2010, 122, 183–197. [Google Scholar] [CrossRef]
  78. Lana, C.; Tohver, E.; Cawood, P. Quantifying Rates of Dome-and-Keel Formation in the Barberton Granitoid-Greenstone Belt, South Africa. Precambrian Res. 2010, 177, 199–211. [Google Scholar] [CrossRef]
  79. Heubeck, C.; Thomsen, T.B.; Heredia, B.D.; Zeh, A.; Balling, P. The Malolotsha Klippe: Large-Scale Subhorizontal Tectonics Along the Southern Margin of the Archean Barberton Greenstone Belt, Eswatini. Tectonics 2023, 42, e2022TC007359. [Google Scholar] [CrossRef]
  80. Lamb, S. Archean Synsedimentary Tectonic Deformation—A Comparison with the Quaternary. Geology 1987, 15, 565. [Google Scholar] [CrossRef]
  81. Lamb, S.H. Structures on the Eastern Margin of the Archaean Barberton Greenstone Belt, Northwest Swaziland. In Precambrian Tectonics Illustrated; E. Schweizerbart’sche: Stuttgart, Germany, 1984; pp. 19–39. [Google Scholar]
  82. Anhaeusser, C.R. Archaean Gold Mineralization in the Baberton Mountain Land. Miner. Depos. S. Afr. 1986, I&II, 113–154. [Google Scholar]
  83. Whitney, D.L.; Evans, B.W. Abbreviations for Names of Rock-Forming Minerals. Am. Mineral. 2010, 95, 185–187. [Google Scholar] [CrossRef]
  84. Lamb, S.; Paris, I. Post-Onverwacht Group Stratigraphy in the SE Part of the Archaean Barbeton Greenstone Belt. J. Afr. Earth Sci. 1988, 7, 285–306. [Google Scholar] [CrossRef]
  85. Cerda, L.R.P.; Jones, C.; Kisters, A. Multi-Stage Alteration, Rheological Switches and High-Grade Gold Mineralization at Sheba Mine, Barberton Greenstone Belt, South Africa. Ore Geol. Rev. 2020, 127, 103852. [Google Scholar] [CrossRef]
  86. Sibson, R.H. Earthquake Faulting as a Structural Process. J. Struct. Geol. 1989, 11, 1–14. [Google Scholar] [CrossRef]
  87. Robert, F.; Boullier, A.-M.; Firdaous, K. Gold-Quartz Veins in Metamorphic Terranes and Their Bearing on the Role of Fluids in Faulting. J. Geophys. Res. 1995, 100, 12861–12879. [Google Scholar] [CrossRef]
  88. Nguyen, P.T.; Harris, L.B.; Powell, C.M.; Cox, S.F. Fault-Valve Behaviour in Optimally Oriented Shear Zones: An Example at the Revenge Gold Mine, Kambalda, Western Australia. J. Struct. Geol. 1998, 20, 1625–1640. [Google Scholar] [CrossRef]
  89. Foster, R.P.; Piper, D.P. Archaean Lode Gold Deposits in Africa: Crustal Setting, Metallogenesis and Cratonization. Ore Geol. Rev. 1993, 8, 303–347. [Google Scholar] [CrossRef]
  90. De Wit, M.J.; Fripp, R.E.P.; Stanistreet, I.G. Tectonic, and Stratigraphic Implications of New Field Observations along the Southern Part of the Barberton Greenstone Belt. Spec. Publ.-Geol. Soc. S. Afr. 1983, 9, 21–29. [Google Scholar]
  91. Van Kranendonk, M.J.; Kröner, A.; Hoffmann, J.E.; Nagel, T.; Anhaeusser, C.R. Just Another Drip: Re-Analysis of a Proposed Mesoarchean Suture from the Barberton Mountain Land, South Africa. Precambrian Res. 2014, 254, 19–35. [Google Scholar] [CrossRef]
  92. Schoene, B.; Dudas, F.O.L.; Bowring, S.A.; de Wit, M. Sm-Nd Isotopic Mapping of Lithospheric Growth and Stabilization in the Eastern Kaapvaal Craton. Terra Nova 2009, 21, 219–228. [Google Scholar] [CrossRef]
Figure 1. Geological map of the Barberton Greenstone Belt (modified from Anhaeusser [13]; published with the permission of the Geological Society of South Africa) showing the three stratigraphic groups (Moodies, Fig Tree, and Onverwacht), the main TTGs, the late batholiths, and the four principal gold deposits. The black rectangular box depicts the location of this study area.
Minerals 13 01034 g001
Figure 3. Geological map of the southern part of the Barberton Greenstone Belt and main gold-related occurrences (modified from Barberton Greenstone Belt metallogenic map [14] and Lana et al. [65]).
Minerals 13 01034 g003
Figure 4. Field and microscopic views of the various lithologies within the Malolotja and Steynsdorp areas. (a) Field aspect of altered porphyritic magnesite in talc schist of the Onverwacht Group, Malolotja syncline. (b) Photomicrograph in plane-polarised light of iron oxide in the border of altered magnesite (note the Se cleavage), surrounded by a microcrystalline talc schist matrix, the Onverwacht Group, Malolotja syncline. (c) Weathered schist in She mine, with sigmoidal quartz lenses asymmetry (view parallel to stretching lineation and perpendicular to compositional layering, the Onverwacht Group), Qz = quartz. (d) Felsic porphyry at the old Gypsy Queen mine, east of the Steynsdorp anticline. (e) Microscopic view of the felsic porphyry composed of quartz, feldspar, and muscovite in a felsic microcrystalline matrix (crossed polars). (f) Felsic rock located in the hinge zone of the Steynsdorp antiform, showing a porphyritic texture and composed of large mm to cm size porphyritic feldspar, chlorite, and sulphides in a microcrystalline felsic groundmass.
Minerals 13 01034 g004
Figure 5. Structural map of the Steynsdorp antiform and the Malolotja synform with Se, Sf, and Sl cleavage distribution. Planar structural data are presented as poles to planes on equal-area lower hemisphere projections, with the associated main direction (dashed great circles). The background maps are two inset views of Figure 3 focused on the Steynsdorp (left map) and Malolotja (right map) sectors.
Minerals 13 01034 g005
Figure 6. Field and petrographic observations documenting the three deformation events at Malolotja synform and Steynsdorp antiform. (a) Df-folded schistosity Se (white dashed line) west of the Malolotja synform in the Onverwacht Group rocks. (b) Se schistosity (black dashed line) outlining a tight fold Ff, with a N–S-striking axial plane Sf schistosity (red line), west of the Steynsdorp antiform in the Onverwacht Group. (Inset) Stereonet of Ff fold axial planes (red great circle) and Ff fold axis (black dot), lower hemisphere projection. (c) Se schistosity (black dashed line) in the fine-grained Moodies Group sandstone (NE of the Malolotja synform) composed of mica sheets surrounding detrital quartz grains. (d) Photomicrograph of the Moodies Group sandstone (plane-polarised light) showing the Se cleavage defined by muscovite alignment crenulated by Dl. (e) East of the Malolotja synform, Google Earth satellite image of 100 m scale fold affecting Se and Sf cleavages in the Onverwacht Group rocks. Locations of the thin sections shown in (f,g) are indicated. (Inset) Stereonet of Fl fold axial planes (green great circles) and Fl fold axis (black dot), lower hemisphere projections. (f) Thin section scan of a sample collected in the NE–SW-striking limbs of the Fl fold showing relationships between Se, Sf, and Sl. Location of the sections (i) is indicated. (g) Idem within the NNE–SSW-striking limbs. Within the two images (f,g), Se (white dashed line) is parallel to the compositional layering (S0), Sf (red line) is preserved in Dl microlithons, and Sl (green dashed line) is NW–SE striking. (h) Photomicrograph (crossed polars) of crenulated cleavage Se defined by chlorite in the Onverwacht Group schist of the Steynsdorp antiform. Chlorite marks the axial plane of the Ff fold. (i) Close-up photomicrograph (plane-polarised light) of thin section scan showing the overprinting relations between Sl and Sf cleavages. All images are oriented. Arrow indicates the north in all horizontal views; all others are observed in vertical or oblique planes. The abbreviations follow Whitney and Evans [83]; Chl = chlorite, Mc = microcline, Ms = muscovite, Qz = quartz.
Minerals 13 01034 g006
Figure 7. Simplified block diagram showing the distribution of the studied gold occurrences and outcrops within the Malolotja and Steynsdorp areas. See the text for an explanation.
Minerals 13 01034 g007
Figure 8. Field observations of the early vein system. (a) dm thick sigmoid quartz vein at a low angle to subparallel to the Se schistosity. Note the cm thick green talc alteration halo. (b) Photo and sketch of cm thick quartz vein, variably sigmoid and folded by Se (Primrose deposit). (c) Photo and sketch of cm thick quartz vein subparallel to the Se schistosity and highly folded in Ff folds.
Minerals 13 01034 g008
Figure 9. Field observations of the mineralised quartz vein system. (a) Photo and sketch of a subhorizontal quartz vein, coeval to steeply east-dipping quartz veins, both cutting the Se schistosity (Primrose mine). (b) Shallow-dipping folded vein coeval with steeply east-dipping quartz veins. Two close-up views of the veins show elongated feldspars grains perpendicular to the vein edge and/or comb texture of vertical quartz fibres (Ivanhoe mine). (c) Field photograph and sketch of a set of steep east-dipping quartz veins cutting Sf schistosity, which are in turn truncated by horizontal and echelon quartz vein (id 817 occurrences). (d) Horizontal quartz vein with elongated vertical tourmaline (Post office occurrence). (e) West-dipping steep quartz veins in a complex network system (Rosehill mine). (f) West-dipping quartz vein with Sf drag fold attesting reverse motion. Note that the vein is internally brecciated (id 819 occurrence). (g) Subvertical quartz vein parallel to a fault zone in pillow lava host rock (Idaho mine). Fsp = feldspar, tur = tourmaline.
Minerals 13 01034 g009
Figure 10. Stereonets of mineralised quartz veins in the study area shown as poles to planes. (a) Quartz veins in Primrose, Rosehill, Ivanhoe, and Waverley Reefs ancient mines in the Malolotja area. (b) Quartz veins in the 817, 818, 819, and Post Office gold occurrences in the Steynsdorp area.
Minerals 13 01034 g010
Figure 11. Field observation of the late vein system. (a) Panorama view of N50-striking metric quartz vein and location of the photography (b). Note the localisation of the vein across supposed stratigraphic bedding. (b) Dm thick slightly folded quartz vein and its white-greenish alteration halos, cutting the Se schistosity. Locations of the (c,d) photographs are also indicated. (c) Radial tourmaline rods in the alteration halos. (d) In the alteration halos, truncated tourmalines (truncation shown by a white arrow) are parallel to the Se schistosity. (e). Centimetric late quartz vein cutting and displacing a mineralised quartz vein. Tur = tourmaline.
Minerals 13 01034 g011
Figure 12. Sketch in map view summarising field observations pertaining to the late vein system in the Moodies Group located at Lo.37 see Figure 7.
Minerals 13 01034 g012
Figure 13. The paragenetic sequence of veins and alteration halos.
Minerals 13 01034 g013
Figure 14. Microscopic observations of the three vein systems. (a) Early quartz-carbonate vein. (b) Albite at the edge of a tourmaline-quartz mineralisation-related vein (plane-polarised light). (c) Vertical and truncated tourmaline in a horizontal quartz-carbonate mineralisation-related vein (plane-polarised light). (d) Euhedral pyrites in a mineralised quartz vein with oxidised rims (reflected light). (e) Subvertical quartz fibres in a horizontal quartz mineralisation-related vein (crossed polars). (f) Comb quartz showing incipient bulging and some subgrain recrystallisation of a mineralisation-related vein (crossed polars). (g) Recrystallised quartz localised in conjugate bands in a quartz mineralisation-related vein (crossed polars). (h) Recrystallised quartz of a late vein (crossed polars). (i) Albite and tourmaline in an alteration halo of a late vein (crossed polars). Ab = albite, Ca = carbonate, Py= pyrite, Ox = oxide, Qz = Quartz, Tlc = talc, Tur = tourmaline.
Minerals 13 01034 g014
Figure 15. Field observations of the alteration features. (a) Field photograph and associated sketch of a vein from the Primrose occurrence showing well-developed greenish alteration halo. (b) Mm scale euhedral pyrites surrounding a quartz-tourmaline vein (occurrence id. 817). (c) Photo and sketch of oxide veins and associated white leaching alteration halos (Welcome occurrence). (d) Tourmaline vein surrounded by tourmaline impregnation in quartzites of the Moodies Group (close to location Lo. 37). Ox = oxide, Py = pyrite, Qz = quartz, Tur = tourmaline.
Minerals 13 01034 g015
Figure 16. Synthetic sketch illustrating the distribution of the mineralised (red) and barren (green) vein system at the outcrop scale. Note the coexistence between horizontal and steeply dipping westward and eastward veins. Both have N–S and NNW–SSE strikes, although N–S veins dominate. The red and green arrows display, respectively, the Df and Dl deformations, and the grey line is the Sf schistosity.
Minerals 13 01034 g016
Disclaimer/Publisher’s Note: The statements, opinions and data contained in all publications are solely those of the individual author(s) and contributor(s) and not of MDPI and/or the editor(s). MDPI and/or the editor(s) disclaim responsibility for any injury to people or property resulting from any ideas, methods, instructions or products referred to in the content.

