Article

Molecular Dynamics Study on Crack Angle Effect on Amorphous Silica Fracture Performance

1
School of Chemical and Environmental Engineering, China University of Mining and Technology (Beijing), Beijing 100083, China
2
School of Mechanical Electronic and Information Engineering, China University of Mining and Technology (Beijing), Beijing 100083, China
*
Author to whom correspondence should be addressed.
Minerals 2023, 13(8), 1068; https://doi.org/10.3390/min13081068
Submission received: 27 June 2023 / Revised: 30 July 2023 / Accepted: 10 August 2023 / Published: 11 August 2023
(This article belongs to the Section Mineral Processing and Extractive Metallurgy)

Abstract

:
To investigate the effect of crack angle on the fracture performance of brittle materials under tensile load, a molecular dynamics simulation method based on ReaxFF is used to establish an amorphous silica model through the high-temperature melting and annealing process. Under the simulation environment of 300 K, 1.013 × 10⁵ Pa and 5 × 10⁹ s−1, the impact of crack angle on the fracture performance of the model from three perspectives is analyzed: material mechanical properties, micro fracture process, and energy evolution. The result indicates that as the crack angle increases, the ultimate strain and stress of the model decrease accordingly. The crack propagation path of the model will exhibit a “Z” shape due to the coupling effect of tensile and shear stress. The elastic energy efficiency and new surface energy efficiency of the model increase with the increase in crack angle, and the most new surface is generated at 45° crack angle. The linear regression model and asymptotic regression model are used to fit the trends of elastic energy efficiency and new surface energy efficiency with crack angle, respectively, with correlation coefficients R2 of 0.986 and 0.994. In the actual comminution process, the input energy required for crushing as well as the surface area and morphology of the material after crushing can be changed by adjusting the angle between the load and the main crack of the material being broken.

1. Introduction

Mineral comminution consumes a huge amount of energy, with electricity used for crushing and grinding accounting for approximately 3.3% of the total electricity consumption in the world [1]. At the same time, the energy efficiency of the crushing process is low, which is about 1% in mineral ball milling and rod milling [2] and 3%–5% in crushing [3]. Even in high energy-efficient quasi-static uniaxial compression crushing, the highest energy efficiency is only 8% [4,5]. At present, research on comminution theory is mostly based on three theories: Rittinger theory, Kick theory, and Bond theory. The research of comminution mainly stays at the macro level, and the relationship between energy and particle size is often used to characterize the comminution process [6,7,8,9,10]. However, a large number of random defects of the broken material deeply hinder revealing the essential factors influencing the comminution phenomenon at the macro level and make traditional research results lack universality. Therefore, a microscopic in-depth study of the comminution mechanism and energy evolution of mineral comminution is of great significance for understanding the mineral comminution process and enabling energy-saving operation of the comminution system.
In recent years, scholars have conducted break tests of specimens with pre-cracks under laboratory conditions. Liu et al. [11] investigated the mechanical, acoustic, and failure modes of sandstone cylindrical specimens with different crack angles through direct tensile test, uniaxial compression test, and PFC2D simulation. Li et al. [12] explored the effect of crack angle on the mechanical properties, energy evolution, and damage evolution of sandstone under uniaxial compression test. Lv et al. [13] studied the mechanical properties, acoustic emission behavior, and failure modes of coal shale composites with different crack angles through theoretical analysis, uniaxial compression experiment, and RFPA numerical simulation method. Most of the break experiments on specimens with pre-cracks are macro experiments, and it is urgent to enrich the theory of fracture mechanics from a micro perspective.
With the development of molecular dynamics (MD) simulation technology, the method of exploring the micro fracture mechanism of material comminution process without being restricted by external conditions has been realized. Scholars have extensively investigated the fracture process of materials with specific defects under tensile load using MD simulation methods. Fang et al. [14] investigated the fracture behavior of a silicon model with pre-cracks with different lengths and angles under tensile load at different system temperatures. Chowdhury et al. [15] explored the differences in mechanical properties and fracture mechanisms of quartz glass models with surface cracks of different lengths under tensile load. Truong Vo et al. [16] studied the effects of different pore structures, load directions, and model porosity on the mechanical properties of quartz glass models under tensile load. Mei et al. [17] investigated the effect of water molecules under tensile load on the elastic and plastic properties of quartz glass. At present, research on material fracture process using MD simulation mostly focuses on material mechanical properties, and there is little research on the micro fracture process of material with narrow cracks.
The blasting used for mining engineering and the piercing used for mineral processing engineering when breaking minerals with a crusher are mainly tensile failures. Among them, the externally applied tensile load always forms a certain angle with the pre-existing cracks in the material, thereby affecting the distribution of local loads. In this condition, the cracks are subjected to both tensile load (Type I load) and shear load (Type II load) [11,18,19], as shown in Figure 1, where θ is the initial crack angle, and β is the crack angle (as defined in Section 2.3). The energy consumed in crushing and the surface morphology of the comminution products will change with the change from the pre-existing crack angle in the broken material, thereby affecting the energy consumption of the comminution equipment and the effectiveness of the following sorting process.
The ores processed in mineral engineering are mostly brittle materials. Quartz glass (amorphous SiO2) is a typical brittle material and belongs to amorphous solid. Compared with crystal, quartz glass is isotropic, cheap, and simple to model. It can better control variables in simulation and experimental tests, so as to obtain more accurate results. In this study, MD simulation method is used under the ReaxFF [20]. After preparing and verifying the rationality of the amorphous SiO2 model, the influence of different crack angles on the fracture performance of amorphous SiO2 is analyzed from its mechanical properties, micro fracture process, and energy evolution under the same system conditions. This study aims to provide theoretical support for the energy-saving and efficient crushing and following sorting processes in mineral processing and to enrich the theory of fracture mechanics.

2. Simulation Methods

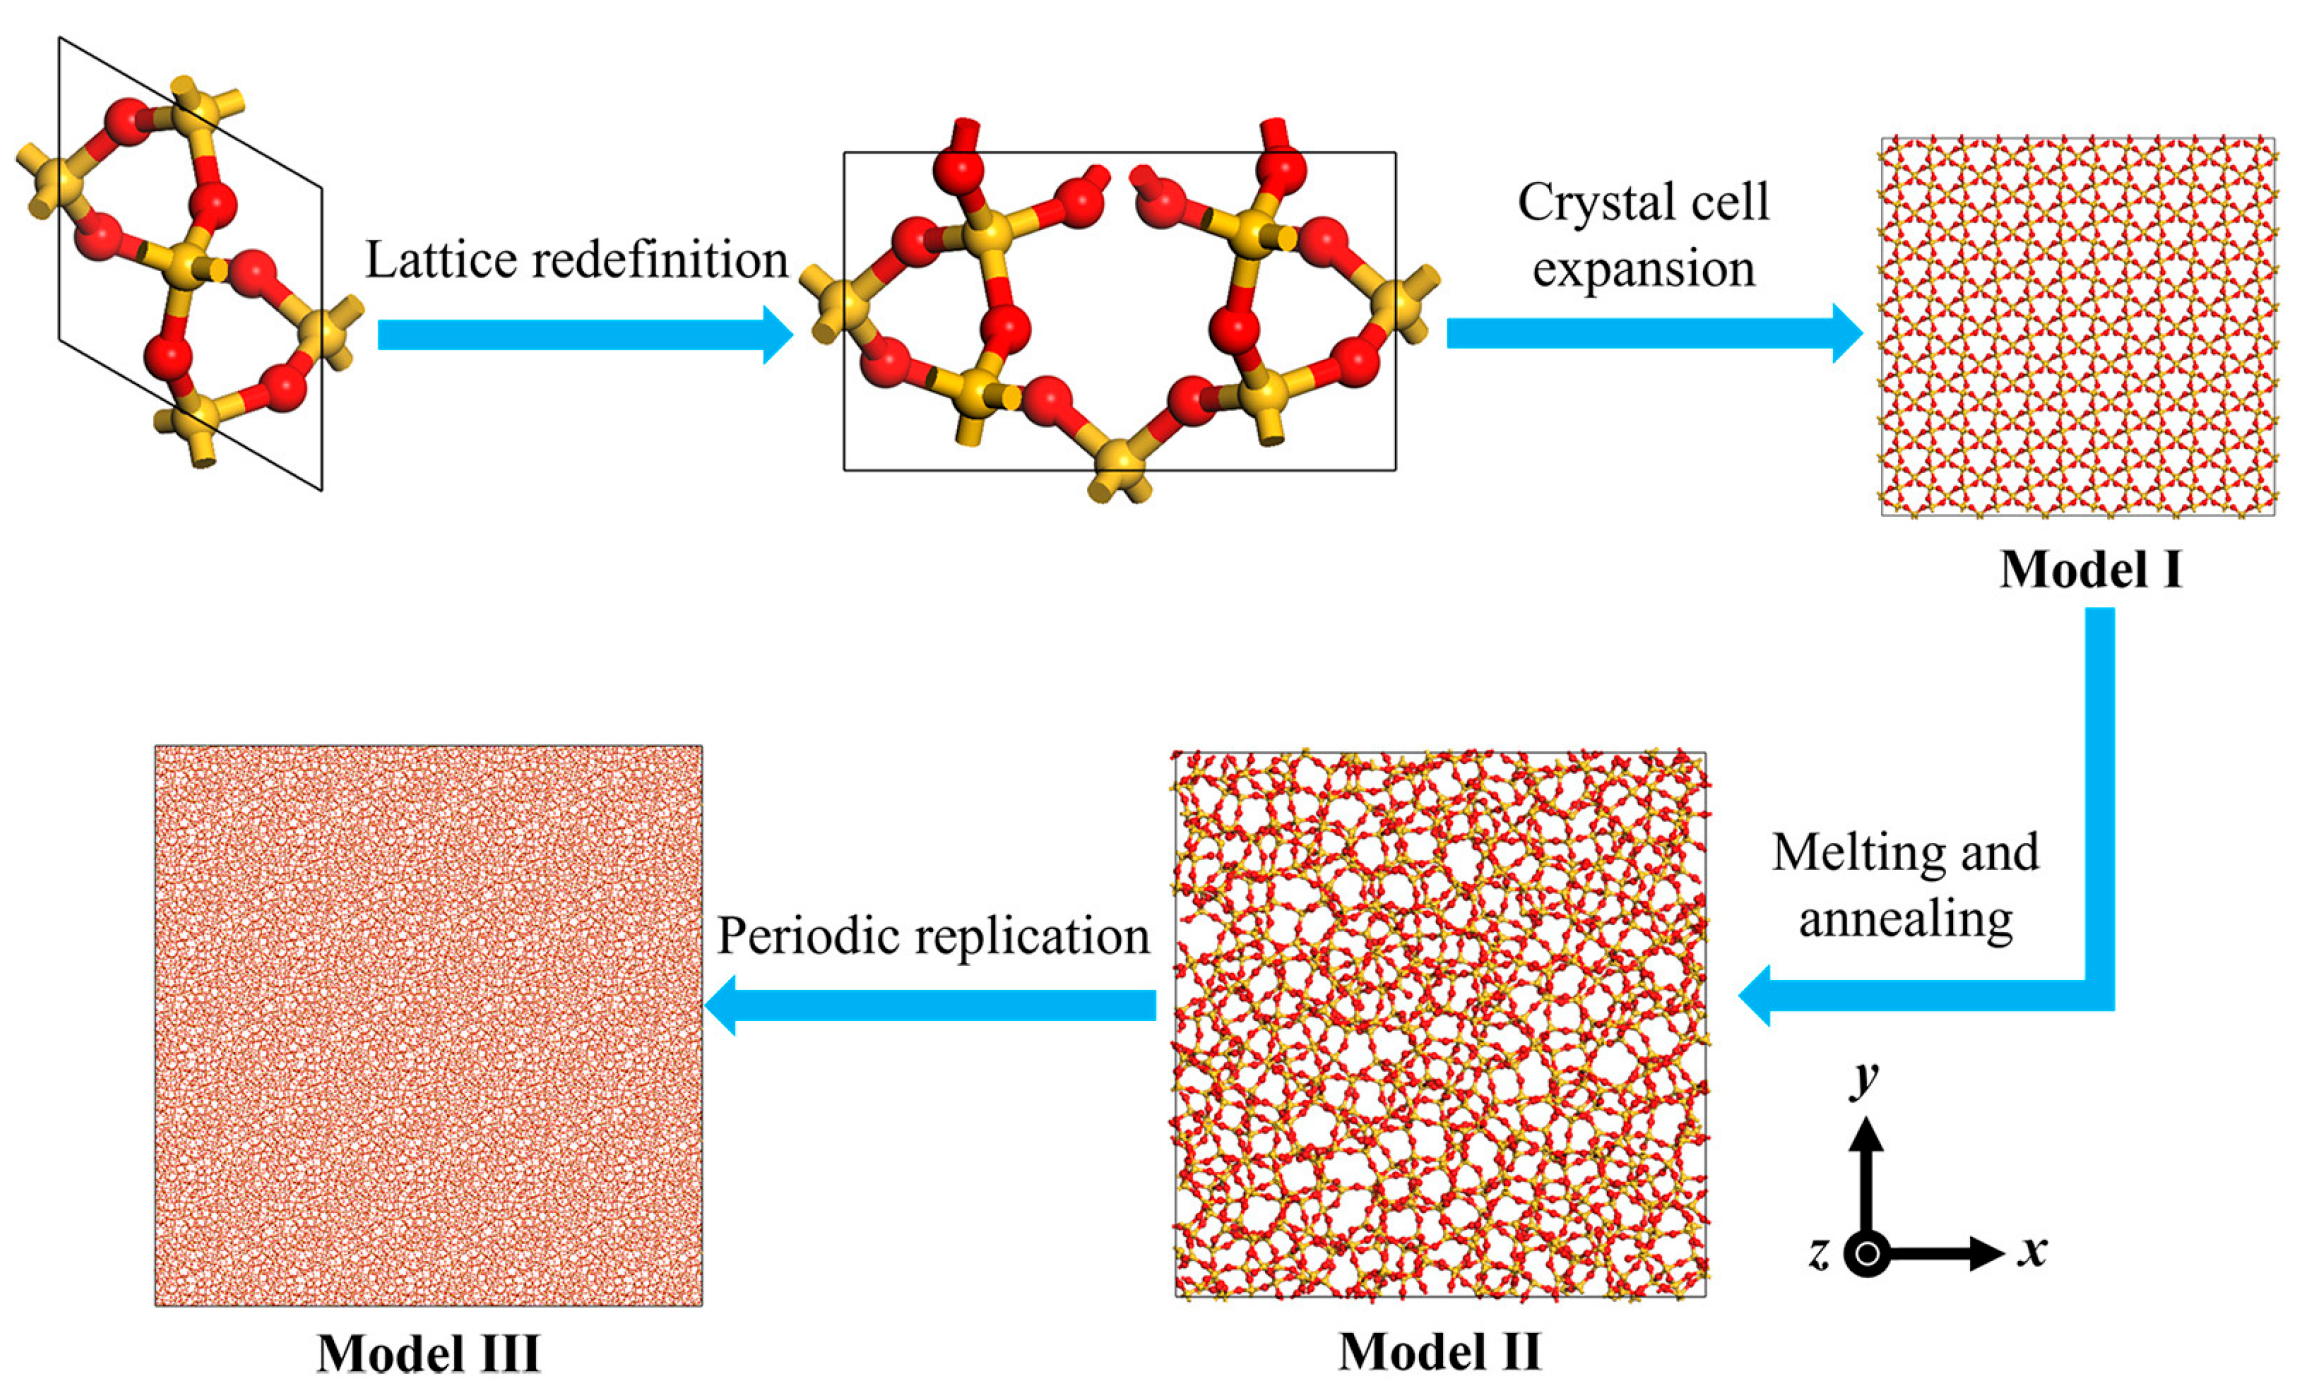
2.1. Amorphous SiO2 Model Development

In order to create an amorphous SiO2 model with pre-cracks at different angles, high-temperature melting and annealing process is conducted to α-quartz under the ReaxFF [21] force field to prepare a complete amorphous SiO2 model, as shown in Figure 2. First, Materials Studio software is used to import a α-quartz crystal cell. After redefining and expanding the lattice, the SiO2 crystal model I is obtained. Then, model I is imported into LAMMPS software, and the system is relaxed for 50 ps at 4000 K in NVT ensemble to obtain SiO2 high-temperature molten state structure. The pressure of the system is controlled to 1.013 × 10⁵ Pa by the Nose-Hoover barostat, and the system is cooled to 300 K at an annealing rate of 5 K/ps in NPT ensemble. After annealing, the system is relaxed at 300 K and 1.013 × 10⁵ Pa in NPT ensemble to obtain amorphous SiO2 model II. Model III is obtained by periodically replicating model II and relaxing the system for 50 ps [14,15,20,22,23]. The simulation time step is set to 0.5 fs. The main parameters of the three models are shown in Table 1. Vo et al. [24] indicated that when the atomic number scale is larger than 5 × 10⁴ in periodic boundary conditions, the mechanical properties of the model will be relatively stable. Thus, the atomic scale of Model III can meet the accuracy of the following simulation experiment.

2.2. Amorphous SiO2 Model Parameters Comparison

2.2.1. Specific Surface Energy

Atomistic slicing method [25] is used to calculate the specific surface energy of amorphous SiO2 (Model III), as shown in Figure 3. First, the atoms at both ends of the model are removed to avoid the influence of periodic boundary in the direction where the specific surface energy needs to be measured, and the total energy of the system is calculated. Afterwards, the model is cut in the middle and a vacuum layer with a thickness of 0.5 nm is established to prevent the interaction between the atoms in the two parts after slicing, and the total energy of the system is calculated again. The subscript of the model number in Figure 3 represents the position of the cut plane; for example, x0.25 represents the cut plane at position 0.25x.
γ = E t o t a l E t o t a l 2 A
Equation (1) is the calculation formula for the specific surface energy γ of the model, where E t o t a l is the total energy of the system before slicing, E t o t a l is the total energy of the system after slicing, and A represents the cross-sectional area in the slicing direction.
According to Table 2, the γ of the model is 2.13~2.51 J/m2, with an average value of 2.333 J/m2, which is close to Chowdhury’s [15] and Rimsza‘s [26] simulation results of 2.75 J/m2 and 2.0 J/m2, respectively, slightly lower than Wiederhorn’s experimental value of 3.5–5.3 J/m2 [27] and Rouxel’s experimental value of 3.62 J/m2 [28].

2.2.2. Density and Radial Distribution Function (RDF)

From Table 3 and Figure 4, it can be seen that the density, RDF peak position, and other structural parameters of the model are in good agreement with the simulation results of Fogarty [20] and Vo [24], and the experimental results of Mozzi [29].

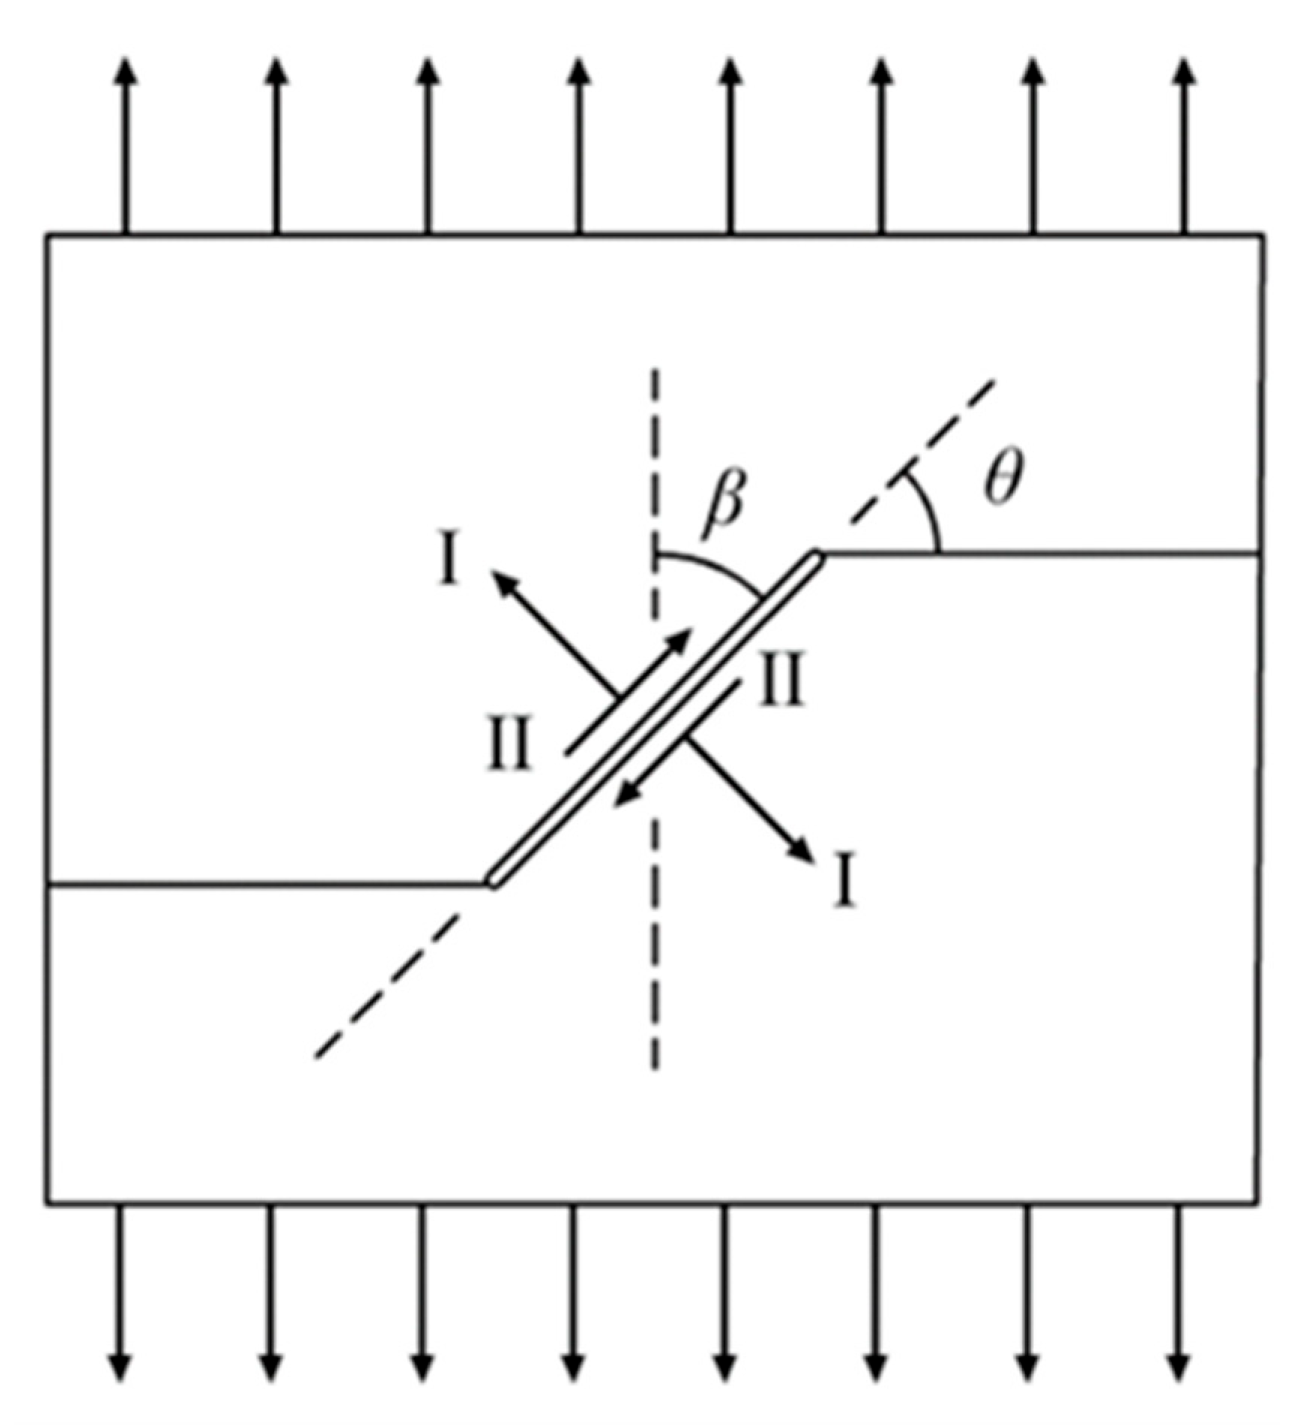
2.3. Crack Model and Tensile Process

Crack models with the same length and different angles are obtained by deleting atoms in a specific region selected in Model III. The crack length and width are 5 nm and 0.5 nm, respectively. As shown in Figure 5, the crack angle β is defined as the angle between the long edge of the crack and the direction of tensile load (y-direction), β = 0°, 30°, 45°, 60°, 90°. The system temperature and pressure are set to 300 K and 1.013 × 10⁵ Pa. The crack models are relaxed for 10 ps in NPT ensemble [14,15]. Sanjib’s study pointed out that the transition strain rate of simulation is 2.5 × 10¹¹ s−1 [23]. In this study, the strain rate ε y y is set as 5 × 10⁹ s−1 [15].

3. Results and Discussion

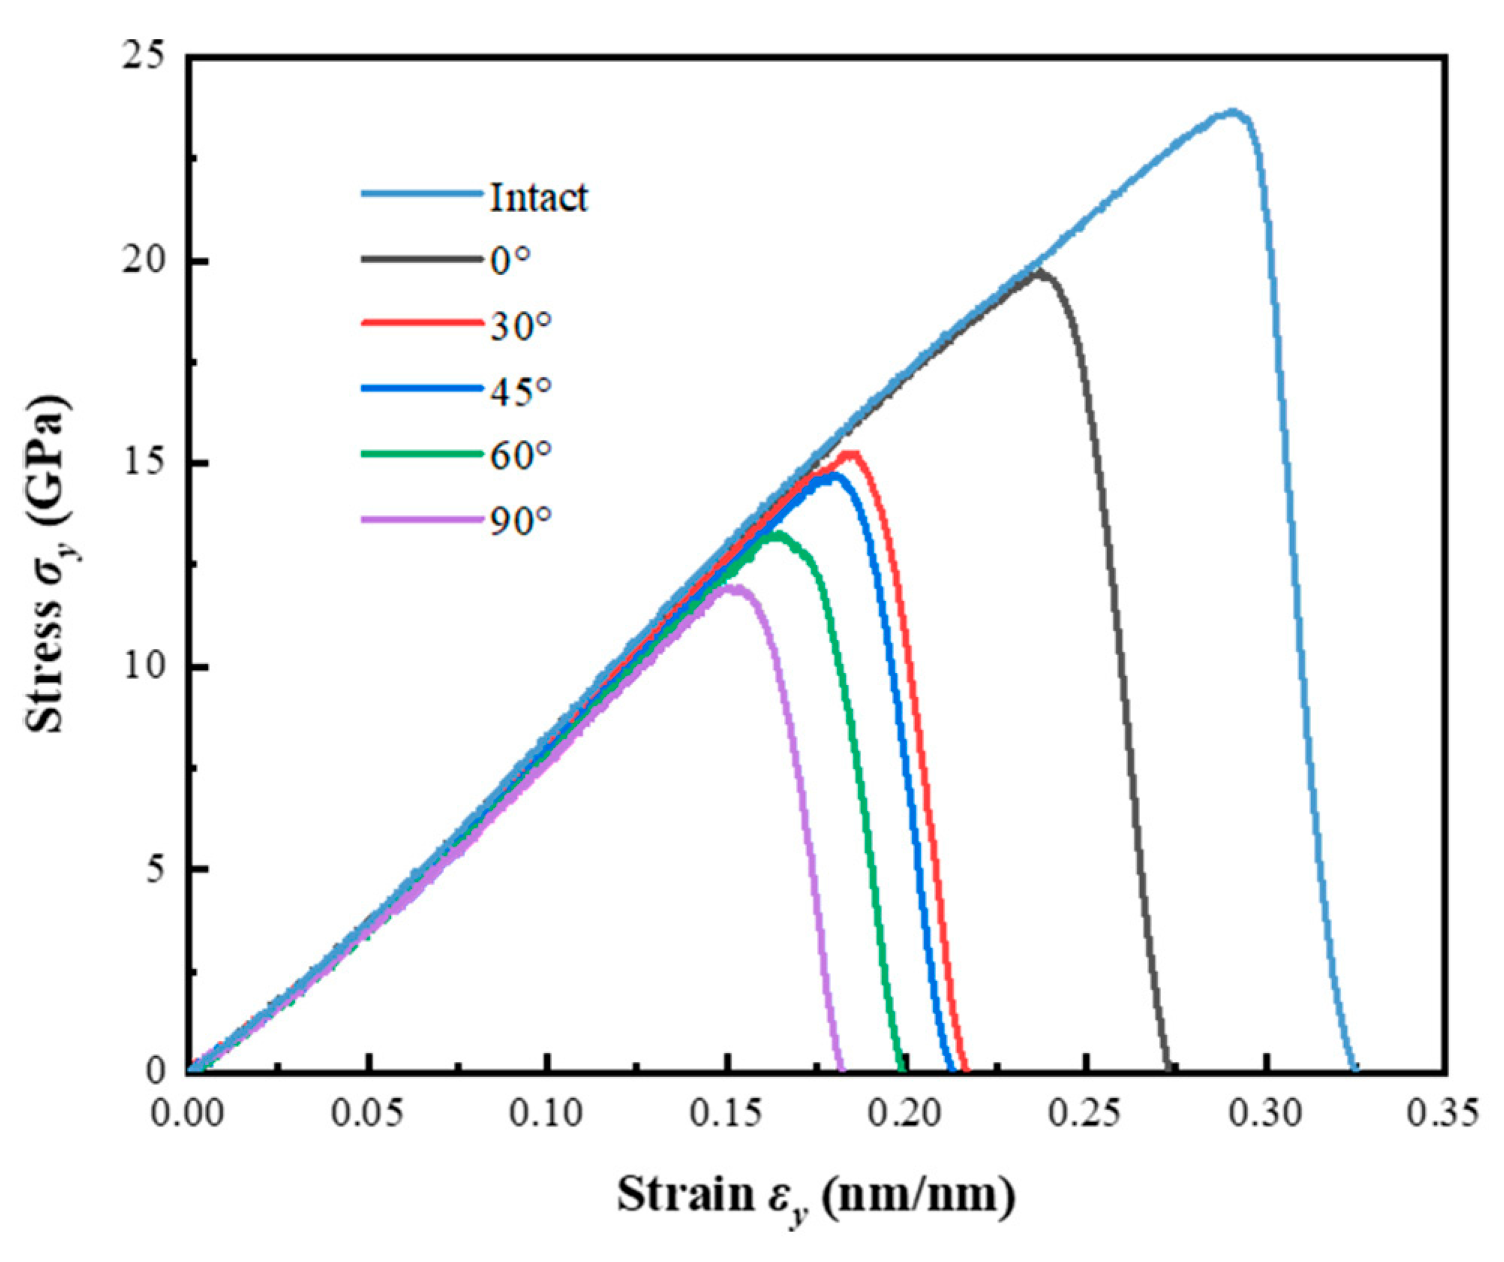
3.1. The Influence of Crack Angle on Mechanical Properties

The effect of crack angle on the mechanical properties of amorphous SiO2 is characterized by the stress–strain curve of the model in the tensile process, as well as the corresponding stress, strain, and Young’s modulus. The Young’s modulus E is obtained by fitting the slope of the stress–strain curve from 0 to 0.05 of the strain [23,24]. Equation (2) is defined by Virial engineering stress [15,30], where σ represents the stress of the deformation, F is the total force of atomic interactions in the loading direction, and A 0 is the initial cross-sectional area of the model perpendicular to the loading direction. Equation (3) is the calculation formula for strain of deformation, where L and L 0 are the lengths in the loading direction of the model before and after deformation, respectively.
σ = F A 0
ε = Δ L L 0 = L L 0 L 0
OVITO software [31] is used to visualize the simulation process. The effect of crack angle on the mechanical properties of the crack models is shown in Figure 6 and Table 4.
Owing to the presence of cracks, the ultimate stress σ m a x and strain ε m a x of the model significantly decreased. The σ m a x and ε m a x of the 0° and 90° crack models are 81.44% and 56.70% of the intact models, respectively. With the increase in crack angle β , the σ m a x and ε m a x of the crack models decrease, and significantly decrease within the range of 0° to 30°. The Young’s modulus E of the 0° and 90° crack models is 99.47% and 94.73% of the intact models, respectively. Although the Young’s modulus also decreases with the increase in crack angle, the decrease is relatively small. The occurrence of the above phenomenon is due to the influence of crack angle on the components of tensile and shear loads around the crack when applying far-field tensile loads to the model.

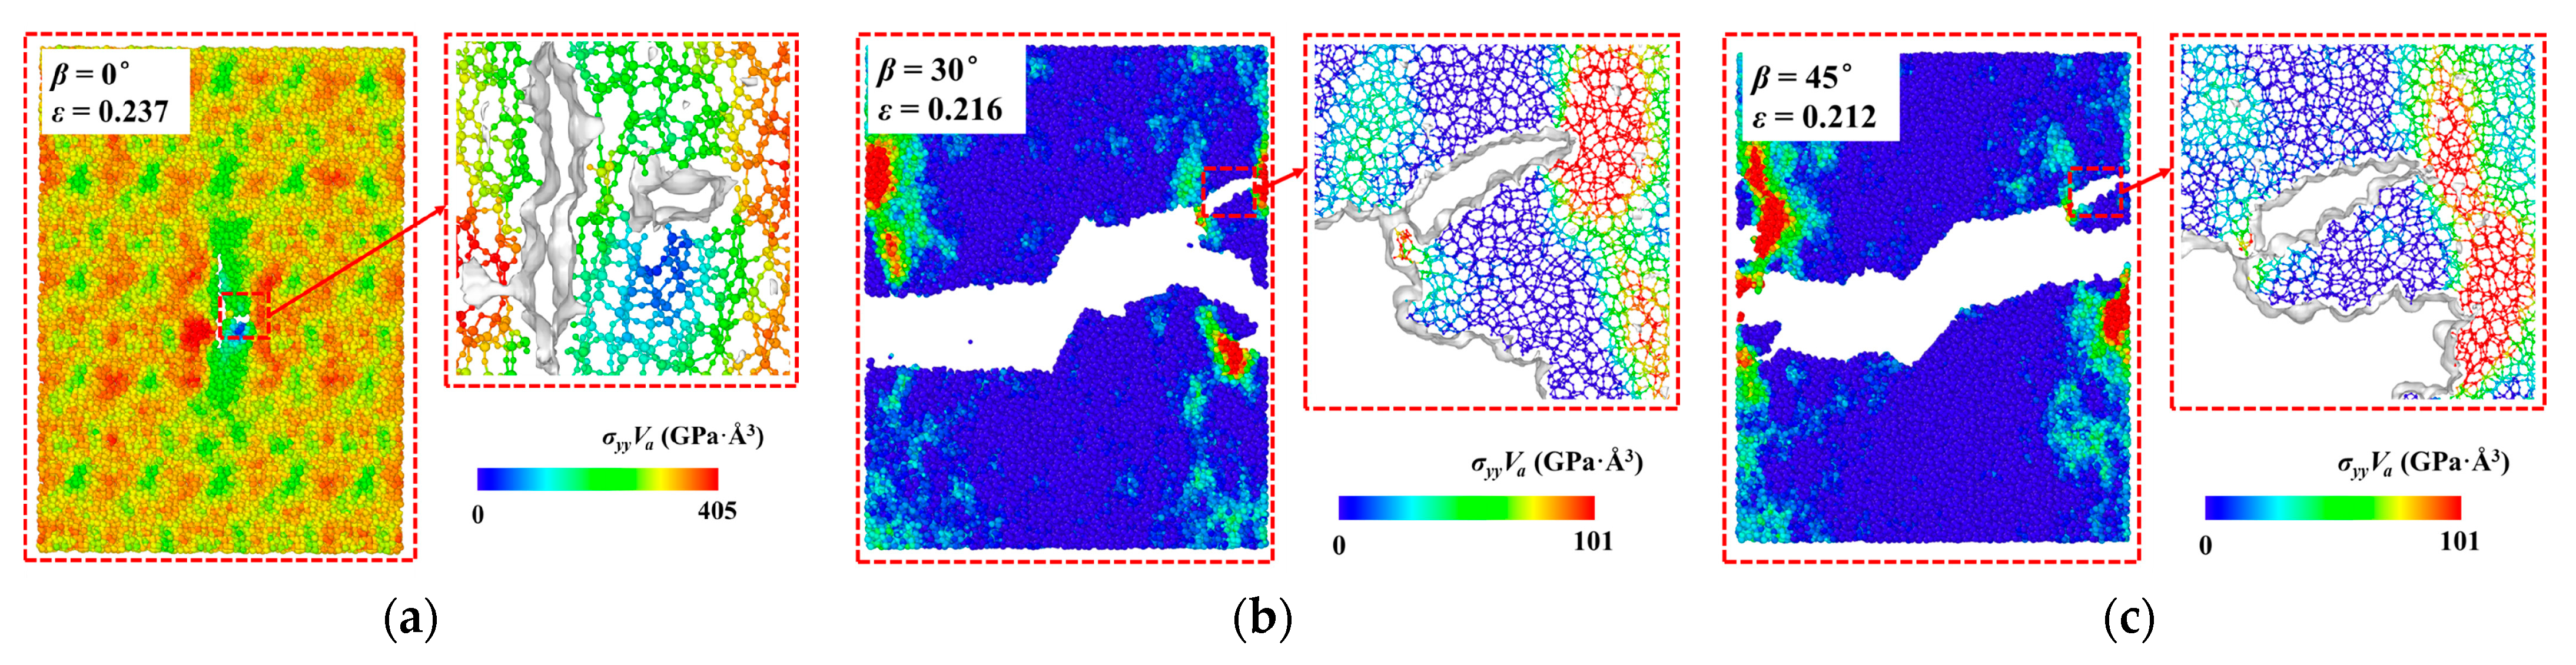
3.2. The Influence of Crack Angle on Crack Propagation

In this section, the influence of crack angle on crack propagation of the model is explored by discussing the stress cloud diagrams in y-direction and bond length distribution in the fracture process.
The stress distribution of the 0° crack model before crack propagation is mainly around the larger primary pores and the long edge of the pre-crack in the model, as shown in Figure 7a. When the strain reaches the extreme value, the fracture of the Si-O bond first occurs at the original hole near the pre-crack, as shown in Figure 8a. Subsequently, the crack propagates perpendicular to the load direction, and the model ultimately completely fractures at the strain of 0.273.
Before crack propagation, due to the minimum curvature radius at the crack tips and the presence of tensile load components around the pre-cracks, the stresses of the 30°, 45°, 60°, and 90° crack models are concentrated at both ends of the pre-cracks, and they start to crack when the models reach the ultimate strains. The crack models completely fracture when the strains reach 0.217, 0.213, 0.199, and 0.182, respectively, as shown in Figure 7b–e. The crack propagation paths of the 30°, 45°, and 60° crack models exhibit a “Z” shape, meaning that the crack propagation direction develops perpendicular to the direction of far-field tensile stress under the correction effect of shear stress [18]. The 30° and 45° crack models exhibit obvious crack branching and healing phenomena in the fracture process due to the strong coupling effect of the tensile and shear loads, as shown in Figure 8b,c.
The bond length distribution of the crack models is statistically analyzed by the OVITO Python module in OVITO software. Table 5 and Figure 9 show the distribution and average length of Si-O bonds of different crack models when the time reaches ultimate strain, 0.015 strain after ultimate strain, and when stresses reach 0.
As the strain increases during the fracture, the average bond length of the Si-O bonds of the crack models decreases, and the final average bond length is 1.582~1.584 Å, indicating the models’ fracturing is caused by the Si-O bonds breaking. Different crack models’ average bond length of the ultimate strain decreases from 1.630 Å at 0° to 1.602 Å at 90°, indicating that the larger the crack angle is, the lower the maximum potential energy that the material can store. The difference in bond length between the ultimate strain and the 0.015 strain after the ultimate strain of the 0°, 30°, 45°, 60°, and 90° crack models are 0.010 Å, 0.010 Å, 0.008 Å, 0.004 Å, and 0.004 Å. The differences in bond length between the ultimate strain and when ultimate stresses equal 0 of the crack models are 0.048 Å, 0.029 Å, 0.026 Å, 0.023 Å, and 0.020 Å. Due to the different tensile and shear load components caused by the crack angle, different crack propagation paths and crack healing phenomena are generated, which leads to nonlinear changes between the average bond length in the fracture process and the crack angle.

3.3. The Influence of Crack Angle on Energy Evolution

In this section, crack models’ deformation and fracture are characterized by the energy evolution including input energy, elastic energy, and new surface energy.
The input energy E i n p u t is defined as the external energy required for the model deformation or complete fracture. For the cuboid crack model in this paper, the calculation formula for E i n p u t at a certain time of tension is shown in Equation (4) [24], where L x , L y and L z are the dimensions of the model along the x, y and z axes before tension, as well as ε and σ are the strain and stress of the model in the tensile direction (y-direction).
E i n p u t = L x × L y × L z 0 ε σ d ε
For the tensile deformation process, the input energy is mainly stored in the model in the form of elastic energy [5]. The elastic energy of the model can be calculated by the difference in total energy of the system before and after the tension, as shown in Figure 10. The calculation formula for elastic energy E e is shown in Equation (5), where E 0 is the total energy of the system before tension, and E 1 is the total energy of the system at ultimate strain.
E e = E 1 E 0
The new surface energy is defined as the energy required to form a new surface after the model completely fractured and stabilized [3]. The new surface energy is a quantitative characterization of atomic or molecular bond breakage and morphology of the surface. The surface area of the model is measured by the Construction Surface Mesh module in OVITO software [32]. The calculation formula for new surface energy E Δ S is shown in Equation (6), where S 0 is the surface area of the pre-crack in the model before tension, S 1 is the surface area of the model when the system reaches completely stabilized after fracturing (seeing Figure 7), and γ is the specific surface energy of the model ( γ = 2.333 J/m2).
E Δ S = Δ S × γ = S 1 S 0 × γ
With the crack angle increases, the maximum elastic energy stored at the ultimate strain decreases from 1.735 × 10⁻¹⁵ J at 0° to 6.634 × 10⁻¹⁶ J at 90° with the former being 2.615 times the latter. The decrease in elastic energy is the largest in 0°~30°, as shown in Figure 11. The corresponding input energy decreases from 1.954 × 10⁻¹⁵ J at 0° to 7.084 × 10⁻¹⁶ J at 90° with the former being 2.758 times the latter. The elastic energy efficiency (i.e., E e / E i n p u t ) increases from 88.796% at 0° to 93.654% at 90° with a slow and steady increase. A linear regression model is used to fit the trend of elastic energy efficiency, with a correlation coefficient R2 of 0.986. It can be seen from Figure 7 that the increase in the crack angle will affect the components of tensile and shear loads around the crack, making the stress concentration area at the crack tip decrease with the increase in the crack angle, thus affecting the elastic energy and energy efficiency at the ultimate strain. The input energy at elastic deformation stage is mainly converted into elastic energy and dissipative energy.
As the crack angle increases, the new surface energy at the time of the model completely fractured first increases and then decreases, as shown in Figure 12. The maximum and minimum values of the new surface energy are 1.761 × 10⁻¹⁶ J at 45° and 1.216 × 10⁻¹⁶ J at 90°, respectively, with the former being 1.448 times the latter. The input energy required for the model completely fractured decreases with the increase in crack angle, from 2.317 × 10⁻¹⁵ J at 0° to 9.188 × 10⁻¹⁶ J at 90°. New surface energy efficiency (i.e., E Δ S / E i n p u t ) increases from 5.249% at 0° to 14.067% at 90°, with the latter being 2.678 times the former. The efficiency also increases significantly in 0°~45°, and then stabilizes. A progressive regression model is used to fit the trend of new surface energy efficiency, with a correlation coefficient R2 of 0.994. The fracture stage of the model is the process of converting input energy and elastic energy into dissipative energy and new surface energy. Input energy plays a dominant role in new surface energy efficiency, and the coupling effect between tensile and shear loads is most obvious when the crack angle is around 45°.

4. Conclusions

In this study, the system temperature and pressure are set to 300 K and 1.013 × 10⁵ Pa under the ReaxFF, respectively. Then, the amorphous SiO2 model is obtained through the high-temperature melting and annealing process from 4000 K to 300 K. The rationality is verified by comparing the material properties including density, RDF, and specific surface energy of the model, and the average specific surface energy of the model is 2.333 J/m2.
The strain rate is set to 5 × 10⁹ s−1, and the influence of crack angle on the fracture performance of amorphous SiO2 model is investigated from three aspects: material mechanical properties, micro fracture process, and energy evolution. The results are as follows:
(1)
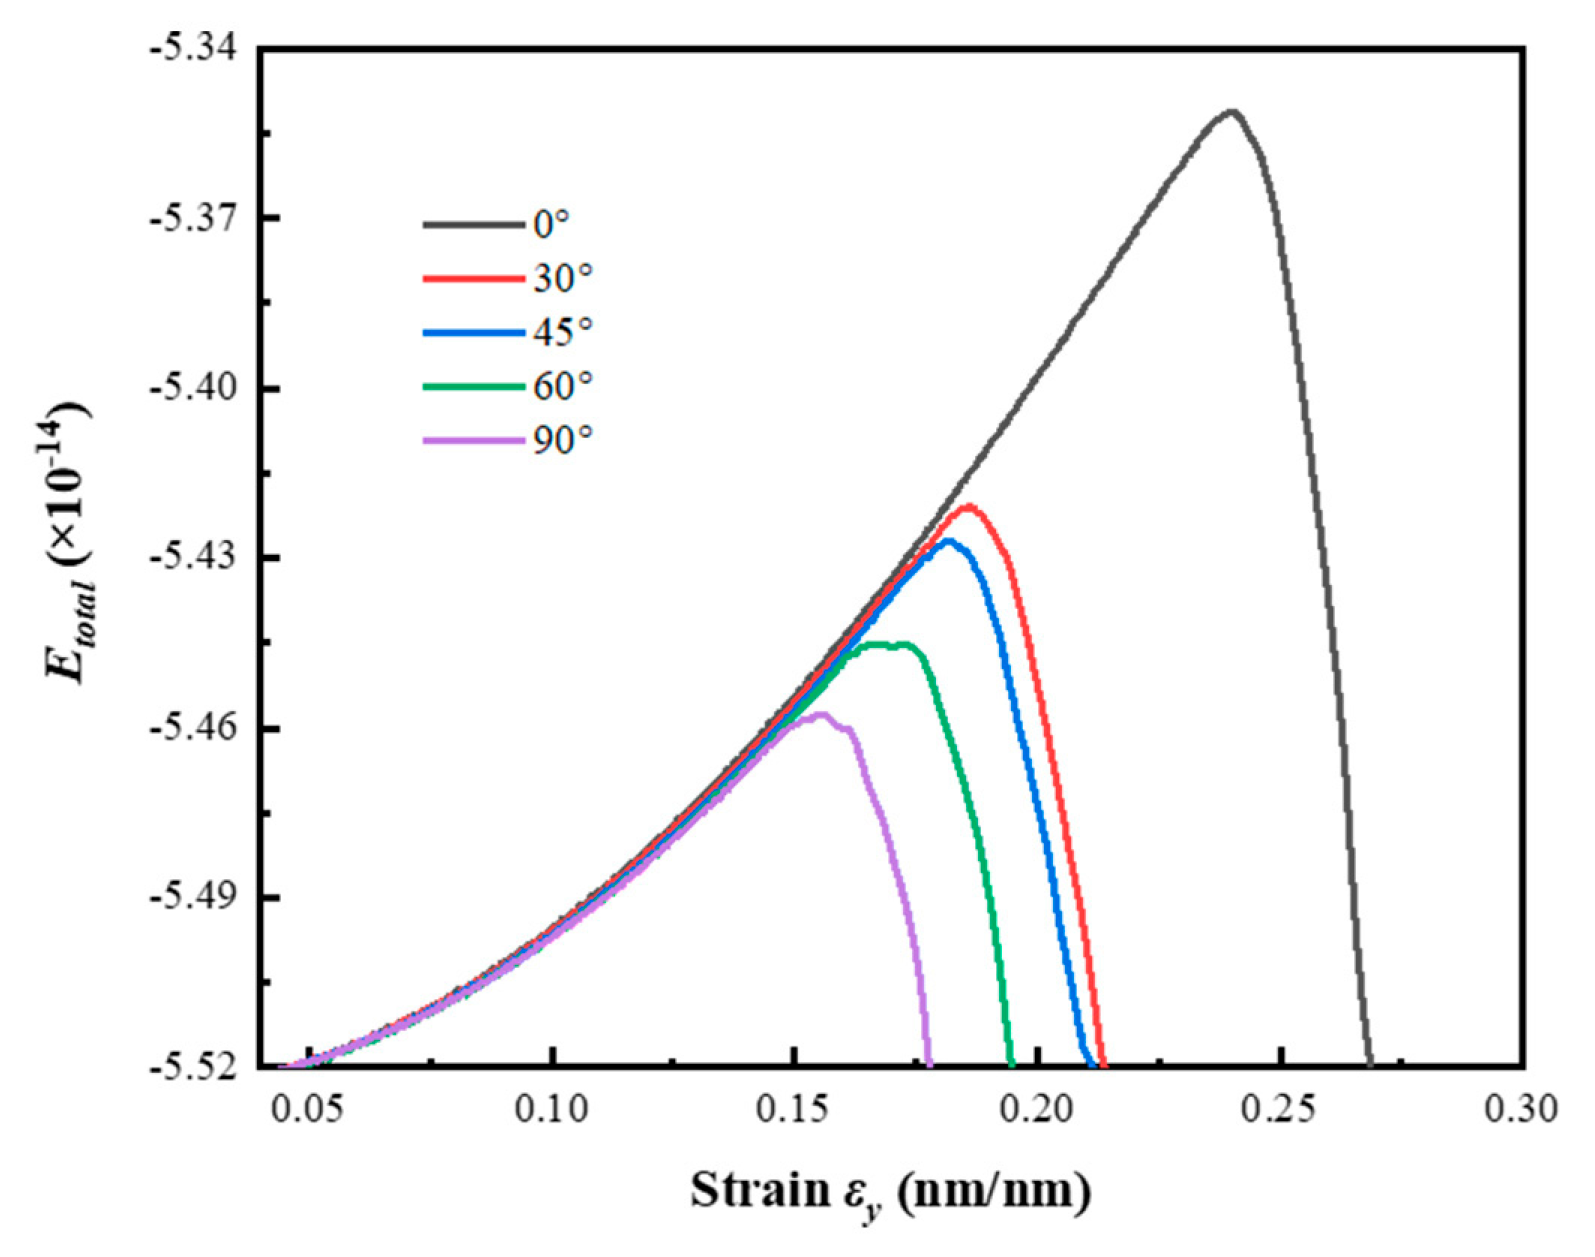
As the crack angle increases, the ultimate stress σ m a x and strain ε m a x of the model gradually decrease from 19.727 GPa and 0.237 at 0° to 11.971 GPa and 0.150 at 90°. The tensile and shear components around the crack will vary from the change of crack angle.
(2)
The crack propagation path in the fracture process exhibits a “Z” shape due to the coupling effect of tensile and shear loads, and the crack branching and healing phenomena occur at crack angles of 30° and 45°. The average bond length and crack angle of the model during the fracture exhibit a nonlinear trend.
(3)
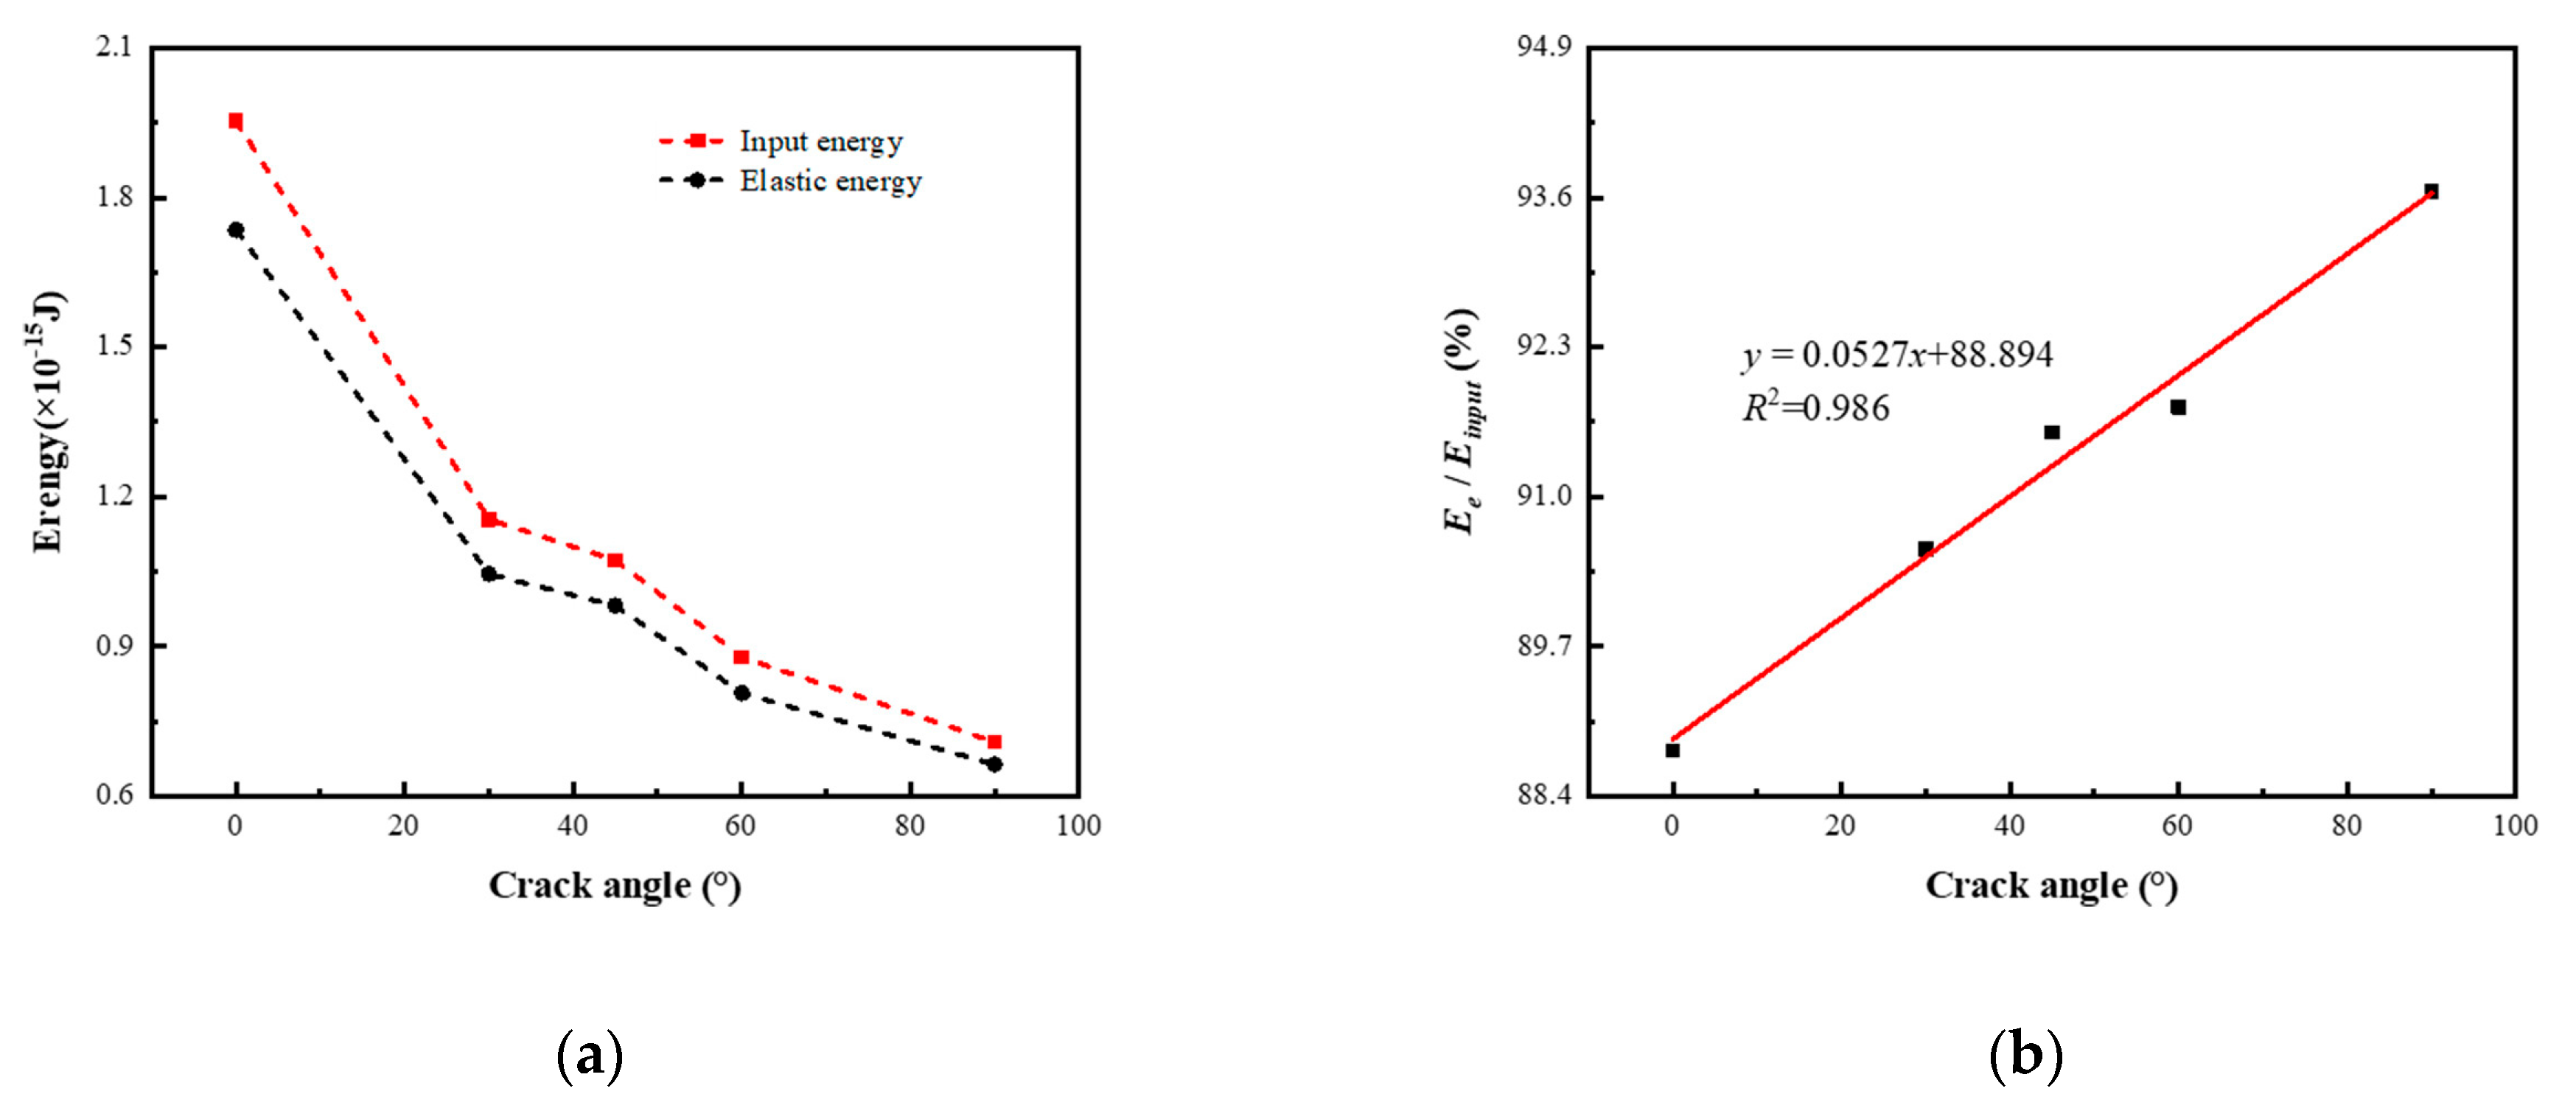
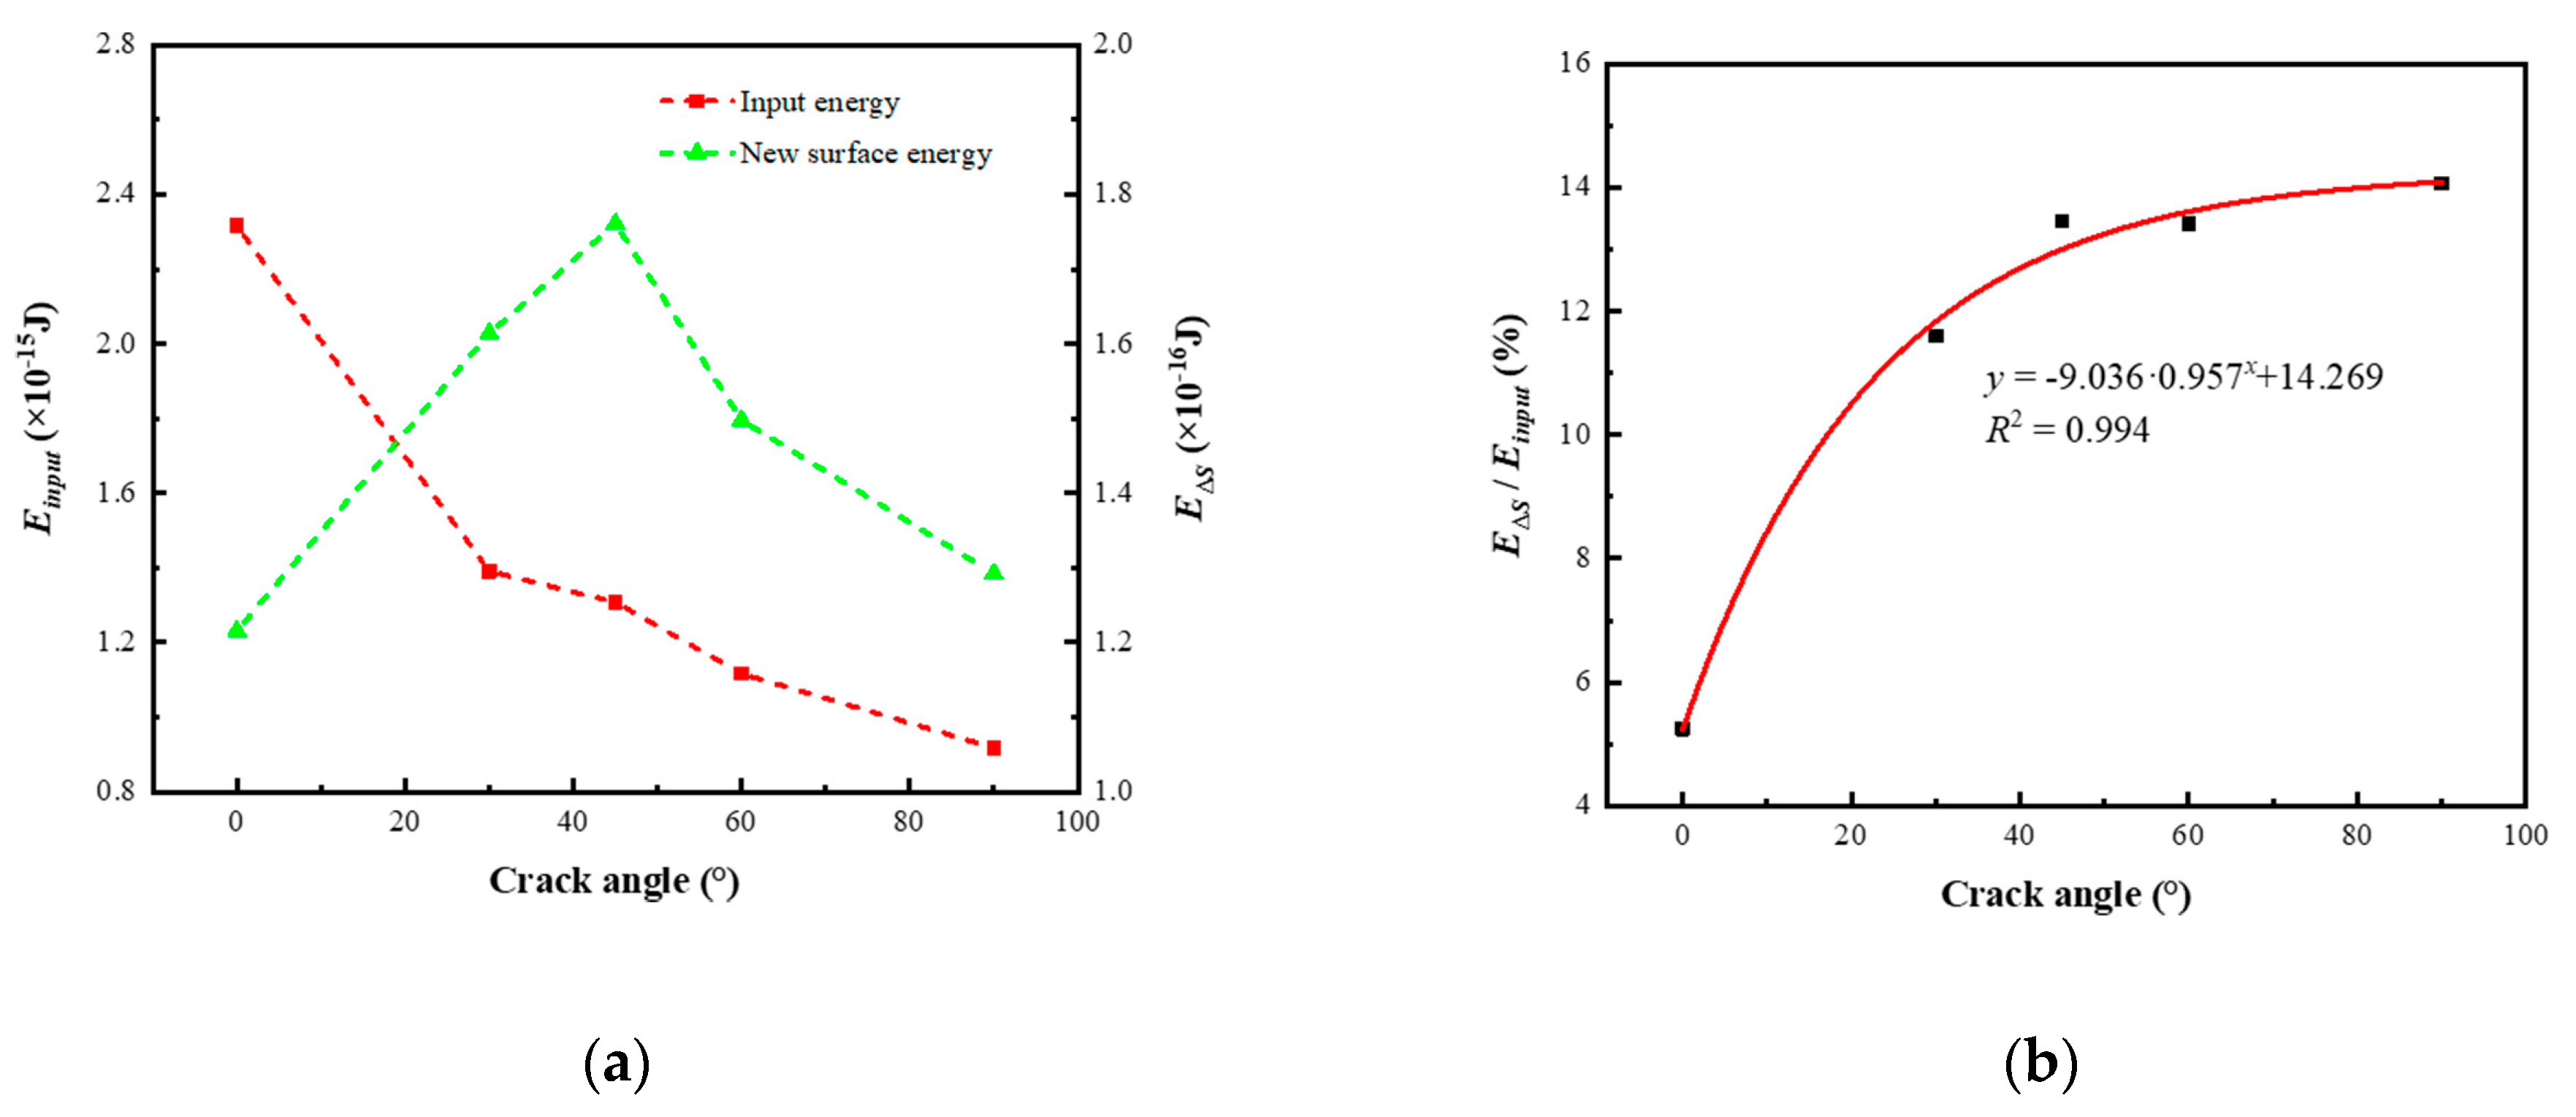
As the crack angle increases, the maximum elastic energy stored in the model at the ultimate strain gradually decreases, with a maximum value of 2.758 times the minimum value. The elastic energy efficiency gradually increases with the increase in crack angle, and the R2 fitted by the linear regression model for its trend is 0.986. As the crack angle increases, the new surface energy at the time of the model completely fractured first increases and then decreases, and its maximum value at 45° is 1.448 times the minimum value at 90°. The new surface energy efficiency gradually increases and stabilizes with the increase in crack angle, and its maximum value is 2.678 times the minimum value. The R2 fitted by the progressive regression model for the new surface energy efficiency is 0.994.
In the actual crushing process, applying the load in the direction perpendicular to the main crack of the broken material can easily achieve energy-saving crushing of the material. By making the load at a certain angle to the main crack of the broken material, the area of the new surface after crushing can be controlled to a certain extent, thereby affecting the adsorption state of flotation reagents on the material and the separation performance.

Author Contributions

X.C.: Conceptualization, methodology, software, formal analysis, investigation, writing—original draft. Y.P.: writing—review and editing, project administration, funding acquisition. C.Z.: conceptualization, writing—review and editing, supervision. Y.B.: software, validation, writing—review and editing. P.L.: validation, data curation, visualization. C.W.: validation, data curation, visualization. C.T.: visualization, writing—review and editing. All authors have read and agreed to the published version of the manuscript.

Funding

This research was funded by National Natural Science Foundation of China, grant number 52074308.

Data Availability Statement

The data that support the findings of this study are available from the author, Xingjian Cao, upon reasonable request.

Conflicts of Interest

The authors declare that they have no known competing financial interests or personal relationships that could have appeared to influence the work reported in this paper.

References

  1. Yahyaei, M.; Hilden, M.; Shi, F.; Liu, L.X.; Ballantyne, G.; Palaniandy, S. Comminution. In Production, Handling and Characterization of Particulate Materials; Merkus, H.G., Meesters, G.M.H., Eds.; Springer International Publishing: Cham, Switzerland, 2016; pp. 157–199. [Google Scholar]
  2. Fuerstenau, D.W.; Abouzeid, A.-Z.M. The energy efficiency of ball milling in comminution. Int. J. Miner. Process. 2002, 67, 161–185. [Google Scholar] [CrossRef]
  3. Zhang, Z.X.; Ouchterlony, F. Energy Requirement for Rock Breakage in Laboratory Experiments and Engineering Operations: A Review. Rock Mech. Rock Eng. 2021, 55, 629–667. [Google Scholar] [CrossRef]
  4. Guo, Q.; Zhou, Q.; Pan, Y.T.; Zhu, C.Y.; Wei, Y.H. The accurate algorithm of new surface area of single particle comminution, incorporating particle shape and roughness. Physicochem. Probl. Miner. Process. 2021, 57, 259–272. [Google Scholar] [CrossRef]
  5. Guo, Q.; Pan, Y.T.; Zhou, Q.; Zhang, C.; Bi, Y.K. Kinetic Energy Calculation in Granite Particles Comminution Considering Movement Characteristics and Spatial Distribution. Minerals 2021, 11, 15. [Google Scholar] [CrossRef]
  6. Liu, X.M.; Zhang, M.; Hu, N.; Yang, H.R.; Lu, J.F. Calculation model of coal comminution energy consumption. Miner. Eng. 2016, 92, 21–27. [Google Scholar] [CrossRef]
  7. Nadolski, S.; Klein, B.; Kumar, A.; Davaanyam, Z. An energy benchmarking model for mineral comminution. Miner. Eng. 2014, 65, 178–186. [Google Scholar] [CrossRef]
  8. Hukki, R.T. Proposal for a solomnic settlement between the theories of von Rittinger, Kick and Bond. Trans. AIME 1961, 220, 403–408. [Google Scholar]
  9. Martins, S. Size-energy relationship exponents in comminution. Miner. Eng. 2020, 149, 12. [Google Scholar] [CrossRef]
  10. Martins, S. Size-energy relationship in comminution, incorporating scaling laws and heat. Int. J. Miner. Process. 2016, 153, 29–43. [Google Scholar] [CrossRef]
  11. Liu, Z.L.; Ma, C.D.; Wei, X.A.; Xie, W.B. Experimental study on mechanical properties and failure modes of pre-existing cracks in sandstone during uniaxial tension/compression testing. Eng. Fract. Mech. 2021, 255, 16. [Google Scholar] [CrossRef]
  12. Li, X.W.; Yao, Z.S.; Liu, X.H.; Huang, X.W. Energy Evolution and Damage Mechanism of Fractured Sandstone with Different Angles. Energies 2022, 15, 16. [Google Scholar] [CrossRef]
  13. Lv, H.Y.; Wang, D.F.; Cheng, Z.B.; Zhang, Y.N.; Zhou, T. Study on Mechanical Characteristics and Failure Modes of Coal-Mudstone Combined Body with Prefabricated Crack. Mathematics 2022, 10, 177. [Google Scholar] [CrossRef]
  14. Fang, T.H.; Shen, C.Y.; Fan, Y.C.; Chang, W.J. Fracture characteristics of silicene nanosheet with a crack under tension estimated using molecular dynamics simulation. Superlattices Microstruct. 2019, 129, 124–129. [Google Scholar] [CrossRef]
  15. Chowdhury, S.C.; Wise, E.A.; Ganesh, R.; Gillespie, J.W. Effects of surface crack on the mechanical properties of Silica: A molecular dynamics simulation study. Eng. Fract. Mech. 2019, 207, 99–108. [Google Scholar] [CrossRef]
  16. Vo, T.; He, B.; Blum, M.; Damone, A.; Newell, P. Molecular scale insight of pore morphology relation with mechanical properties of amorphous silica using ReaxFF. Comput. Mater. Sci. 2020, 183, 10. [Google Scholar] [CrossRef]
  17. Mei, H.; Yang, Y.J.; van Duin, A.C.T.; Sinnott, S.B.; Mauro, J.C.; Liu, L.S.; Fu, Z.Y. Effects of water on the mechanical properties of silica glass using molecular dynamics. Acta Mater. 2019, 178, 36–44. [Google Scholar] [CrossRef]
  18. Lawn, B. Fracture of Brittle Solids, 2nd ed.; Cambridge University Press: Cambridge, UK, 1993. [Google Scholar] [CrossRef]
  19. Erdogan, F.; Sih, G.C. On the Crack Extension in Plates Under Plane Loading and Transverse Shear. J. Basic Eng. 1963, 85, 519–525. [Google Scholar] [CrossRef]
  20. Fogarty, J.C.; Aktulga, H.M.; Grama, A.Y.; van Duin, A.C.T.; Pandit, S.A. A reactive molecular dynamics simulation of the silica-water interface. J. Chem. Phys. 2010, 132, 10. [Google Scholar] [CrossRef]
  21. Van Duin, A.C.T.; Dasgupta, S.; Lorant, F.; Goddard, W.A. ReaxFF: A reactive force field for hydrocarbons. J. Phys. Chem. A 2001, 105, 9396–9409. [Google Scholar] [CrossRef] [Green Version]
  22. Xie, Y.F.; Feng, F.; Li, Y.J.; Hu, Z.Q.; Shao, J.L.; Mei, Y. Mechanical and microstructural response of densified silica glass under uniaxial compression: Atomistic simulations. Chin. Phys. B 2020, 29, 8. [Google Scholar] [CrossRef]
  23. Chowdhury, S.C.; Haque, B.Z.; Gillespie, J.W. Molecular dynamics simulations of the structure and mechanical properties of silica glass using ReaxFF. J. Mater. Sci. 2016, 51, 10139–10159. [Google Scholar] [CrossRef]
  24. Vo, T.; Reeder, B.; Damone, A.; Newell, P. Effect of Domain Size, Boundary, and Loading Conditions on Mechanical Properties of Amorphous Silica: A Reactive Molecular Dynamics Study. Nanomaterials 2020, 10, 16. [Google Scholar] [CrossRef] [Green Version]
  25. Wang, H.B.; Hao, Y.L.; Chen, S.H.; Cheng, M.; Li, C.L.; Sun, S.Q.; Hu, S.Q. DFT study of imidazoles adsorption on the grain boundary of Cu (100) surface. Corros. Sci. 2018, 137, 33–42. [Google Scholar] [CrossRef]
  26. Rimsza, J.M.; Jones, R.E.; Criscenti, L.J. Surface Structure and Stability of Partially Hydroxylated Silica Surfaces. Langmuir 2017, 33, 3882–3891. [Google Scholar] [CrossRef] [PubMed]
  27. Wiederhorn, S.M. Fracture Surface Energy of Glass. J. Am. Ceram. Soc. 1969, 52, 99–105. [Google Scholar] [CrossRef]
  28. Rouxel, T. Fracture surface energy and toughness of inorganic glasses. Scr. Mater. 2017, 137, 109–113. [Google Scholar] [CrossRef]
  29. Mozzi, R.L.; Warren, B.E. The structure of vitreous silica. J. Appl. Crystallogr. 1969, 2, 164–172. [Google Scholar] [CrossRef]
  30. Tsai, D.H. The virial theorem and stress calculation in molecular dynamics. J. Chem. Phys. 1979, 70, 1375–1382. [Google Scholar] [CrossRef]
  31. Stukowski, A. Visualization and analysis of atomistic simulation data with OVITO-the Open Visualization Tool. Model. Simul. Mater. Sci. Eng. 2010, 18, 7. [Google Scholar] [CrossRef]
  32. Rimsza, J.M.; Jones, R.E.; Criscenti, L.J. Chemical Effects on Subcritical Fracture in Silica from Molecular Dynamics Simulations. J. Geophys. Res. Solid Earth 2018, 123, 9341–9354. [Google Scholar] [CrossRef]
Figure 1. Schematic diagram of coupling between Type I and II load under tensile load.
Minerals 13 01068 g001
Figure 2. Development of amorphous SiO2 model.
Minerals 13 01068 g002
Figure 3. Amorphous SiO2 slicing (x0.25).
Minerals 13 01068 g003
Figure 4. RDF diagram of amorphous SiO2 model (Model III).
Minerals 13 01068 g004
Figure 5. Schematic diagram of crack models.
Minerals 13 01068 g005
Figure 6. Stress–strain curves of different crack models.
Minerals 13 01068 g006
Figure 7. Stress cloud diagrams of the fracture process of different crack models at crack angles of (a) 0°, (b) 30°, (c) 45°, (d) 60°, and (e) 90°. (The five pictures in one row of a crack model correspond to the time of 0.015 strain before ultimate strain, ultimate strain, 0.015 strain after ultimate strain, when stress is 0, and when the fracture surface is completely stable.)
Minerals 13 01068 g007
Figure 8. Fracture detail diagrams of crack model at (a) β = 0 ° ε = 0.237 (b) β = 30 ° ε = 0.216 and (c) β = 45 ° ε = 0.212 .
Minerals 13 01068 g008
Figure 9. The distribution of Si-O bond length in the fracture process of (a) 0°, (b) 30 °, (c) 45 °, (d) 60 °, and (e) 90 ° crack models.
Minerals 13 01068 g009
Figure 10. System energy of different crack models.
Minerals 13 01068 g010
Figure 11. Input energy, elastic energy, and elastic energy efficiency of different crack models. (a) The relationship between input energy, elastic energy and crack angle before fracture; (b) the elastic energy efficiency of different crack models before fracture.
Minerals 13 01068 g011
Figure 12. Input energy, new surface energy, and new surface energy efficiency of different crack models. (a) The relationship between input energy, new surface energy and crack angle after fracture; (b) the new surface energy efficiency of different crack models after fracture.
Minerals 13 01068 g012
Table 1. SiO2 model parameters.
ModelDimensions LX × LY × LZ (nm)Density (g/cm3)Number of Atoms
I5.10 × 4.91 × 1.082.652160
II5.24 × 5.38 × 1.182.162160
III26.21 × 26.93 × 1.182.1654,000
Table 2. Specific surface energy of amorphous SiO2 (model III) at different positions.
Slicing Position A (nm2) E t o t a l E t o t a l (×1015) E s u r f (J/m2)
x0.2531.6330.1442.277
x0.5031.6330.1402.211
x0.7531.6330.1582.491
y0.2530.9050.1392.252
y0.5030.9050.1542.483
y0.7530.9050.1322.136
z0.25705.5343.5322.503
z0.50705.5343.3232.355
z0.75705.5343.2292.288
Table 3. Structural parameters of amorphous SiO2 model (Model III).
Structural ParametersOur Simulation ResultsPrevious Simulation Results [20,24]Experimental Results [29]
Density (g/cm3)2.162.142.20
Si-Si RDF 1st peak position (nm)0.30750.30710.3077
Si-Si RDF 2nd peak position (nm)0.50750.51930.5182
O-O RDF 1st peak position (nm)0.25250.25380.2626
O-O RDF 2nd peak position (nm)0.49250.48960.5097
Si-O RDF 1st peak position (nm)0.15750.16330.1608
Si-O RDF 2nd peak position (nm)0.38750.39690.4061
Table 4. Mechanical parameters of different crack models.
Crack Angle ε m a x (nm/nm) σ m a x (GPa) E (GPa)
Intact0.29123.70573.981
0.23719.72773.586
30°0.18515.24572.488
45°0.18014.72270.674
60°0.16513.27570.489
90°0.15011.97170.082
Table 5. The average bond length of different crack models in the fracture process.
Crack Angleε, nm/nmAverage Bond Length, Å
0.2371.630
0.2521.620
0.2731.582
30°0.1851.612
0.2001.602
0.2171.583
45°0.1801.610
0.1951.602
0.2131.584
60°0.1651.606
0.1801.602
0.1991.583
90°0.1501.602
0.1651.598
0.1821.582
Disclaimer/Publisher’s Note: The statements, opinions and data contained in all publications are solely those of the individual author(s) and contributor(s) and not of MDPI and/or the editor(s). MDPI and/or the editor(s) disclaim responsibility for any injury to people or property resulting from any ideas, methods, instructions or products referred to in the content.

