

Assessing the Activity of Eastern Himalayan Extensional Structures: Evidence from Low-Temperature Thermochronology of Granitic Rocks from Yadong
 , ,
, ,
Abstract
1. Introduction
2. Geological Setting
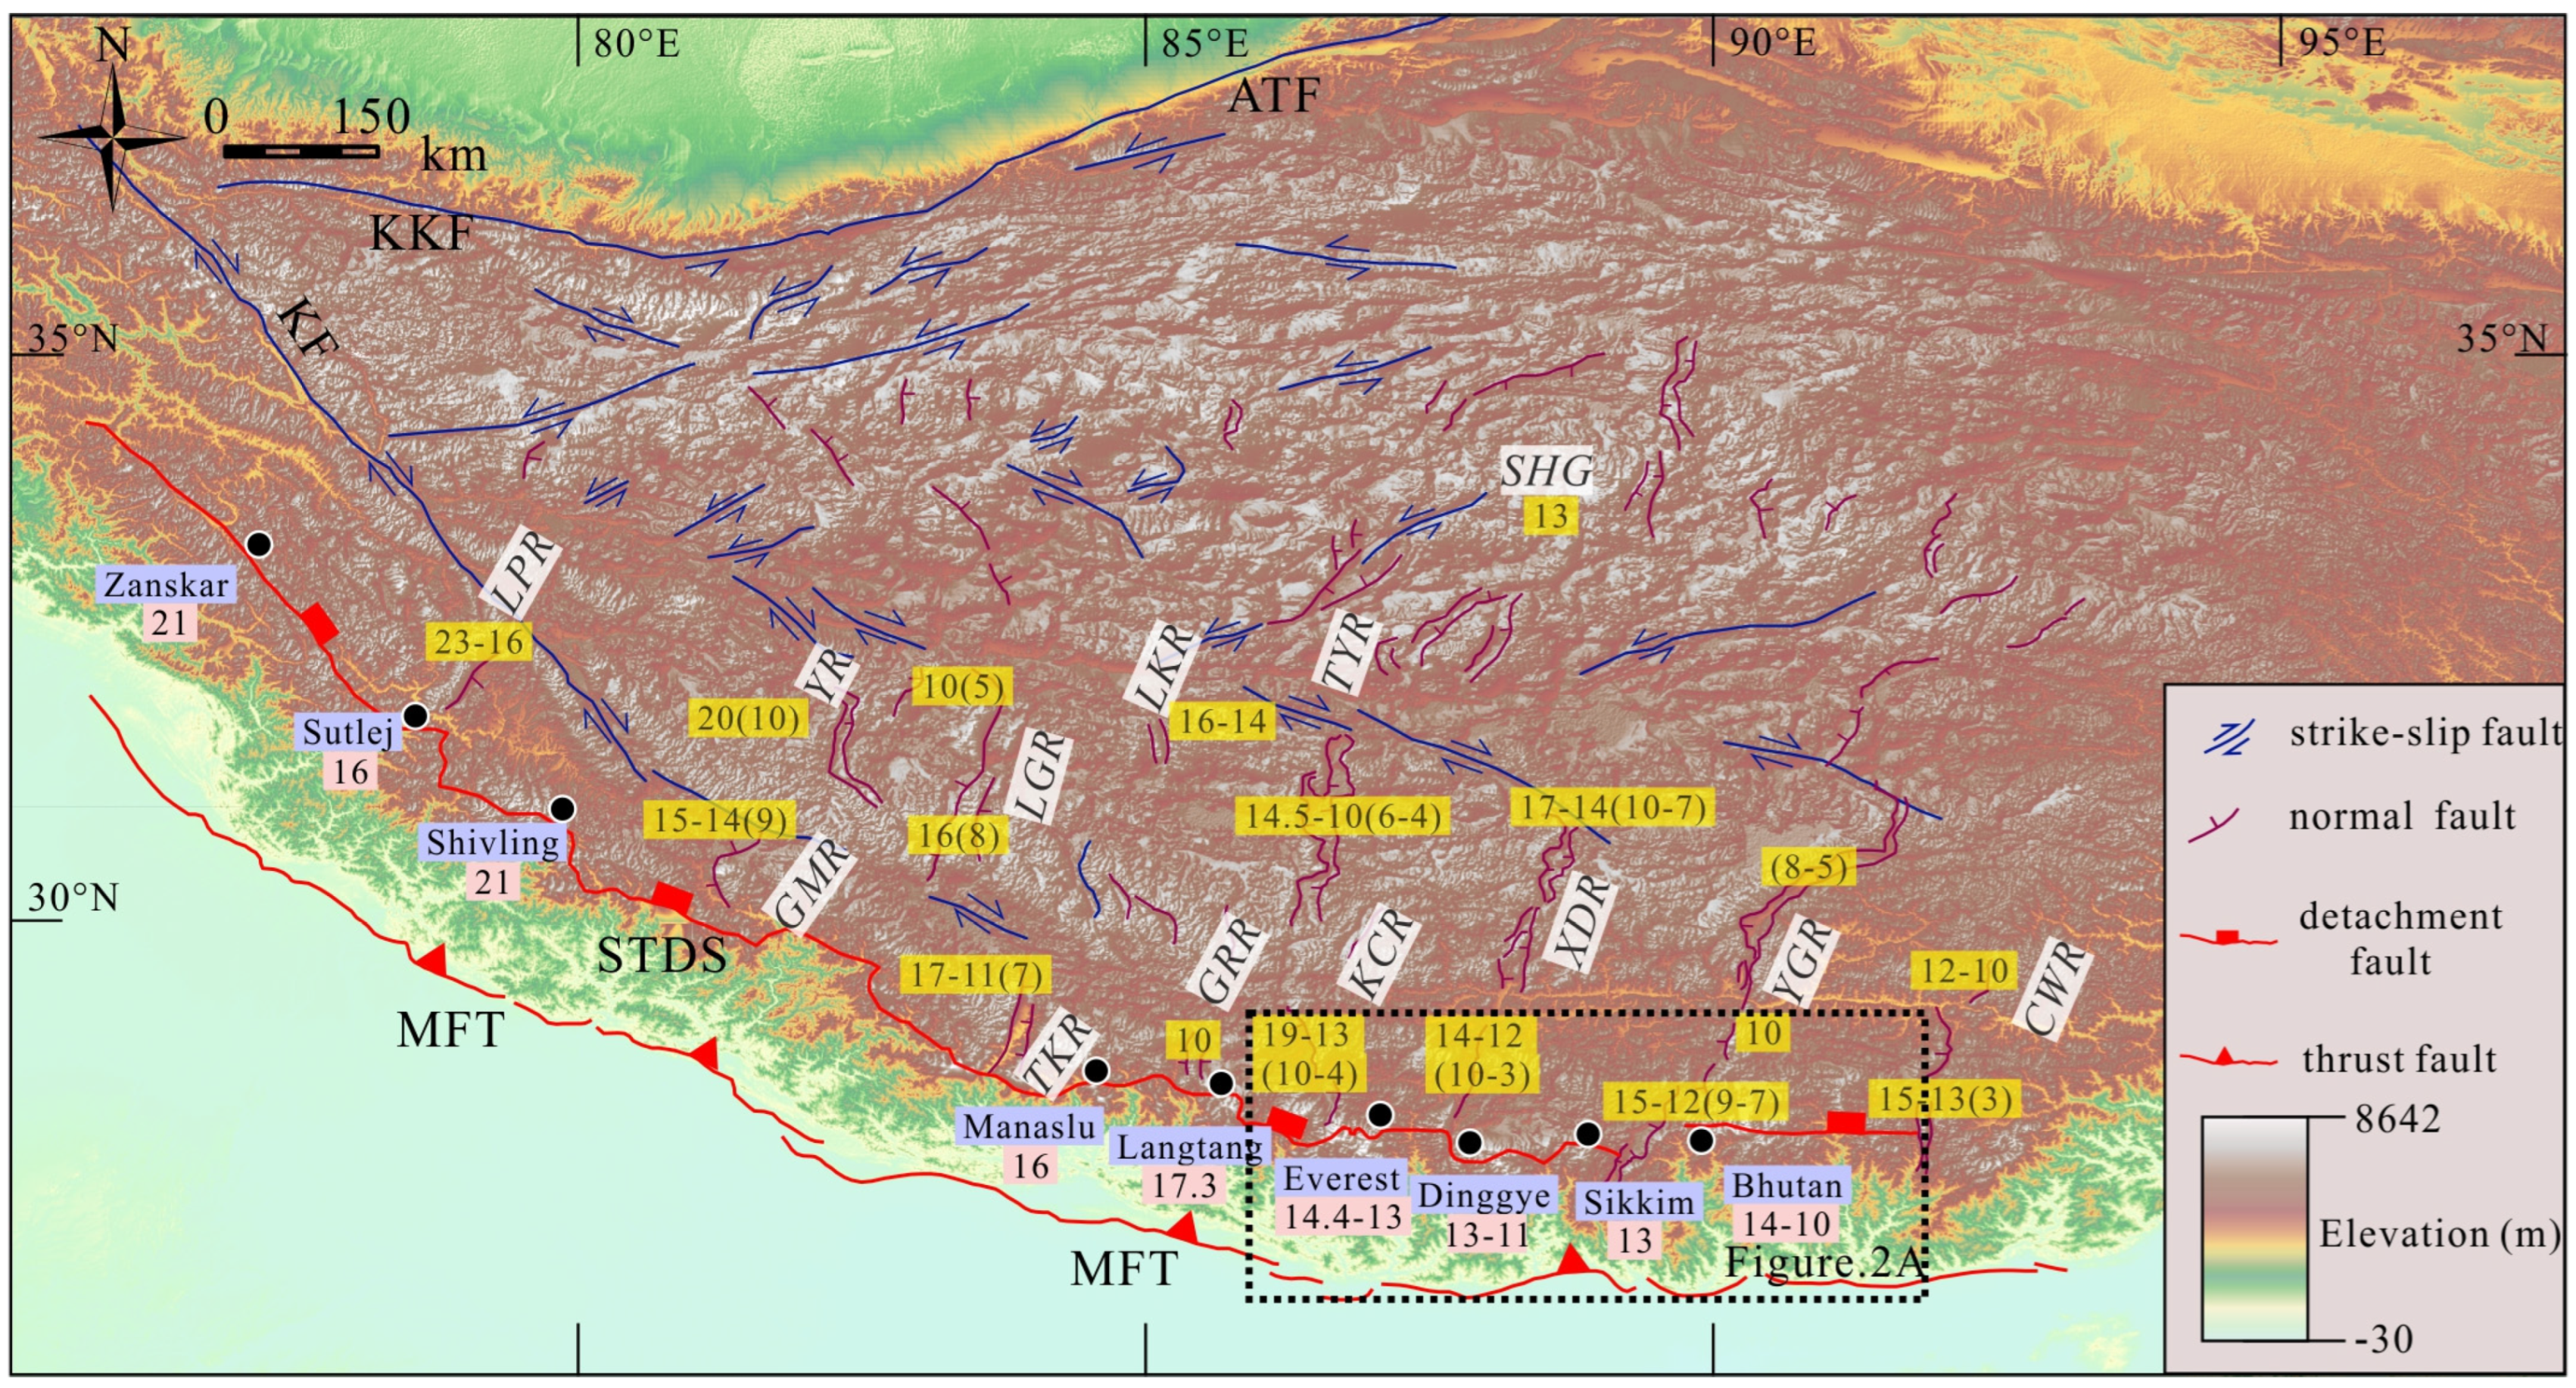
2.1. Himalayan Orogenic Belt
2.2. Structure and Deformation of the STDS
2.3. Geological Characteristics of the NSTRs
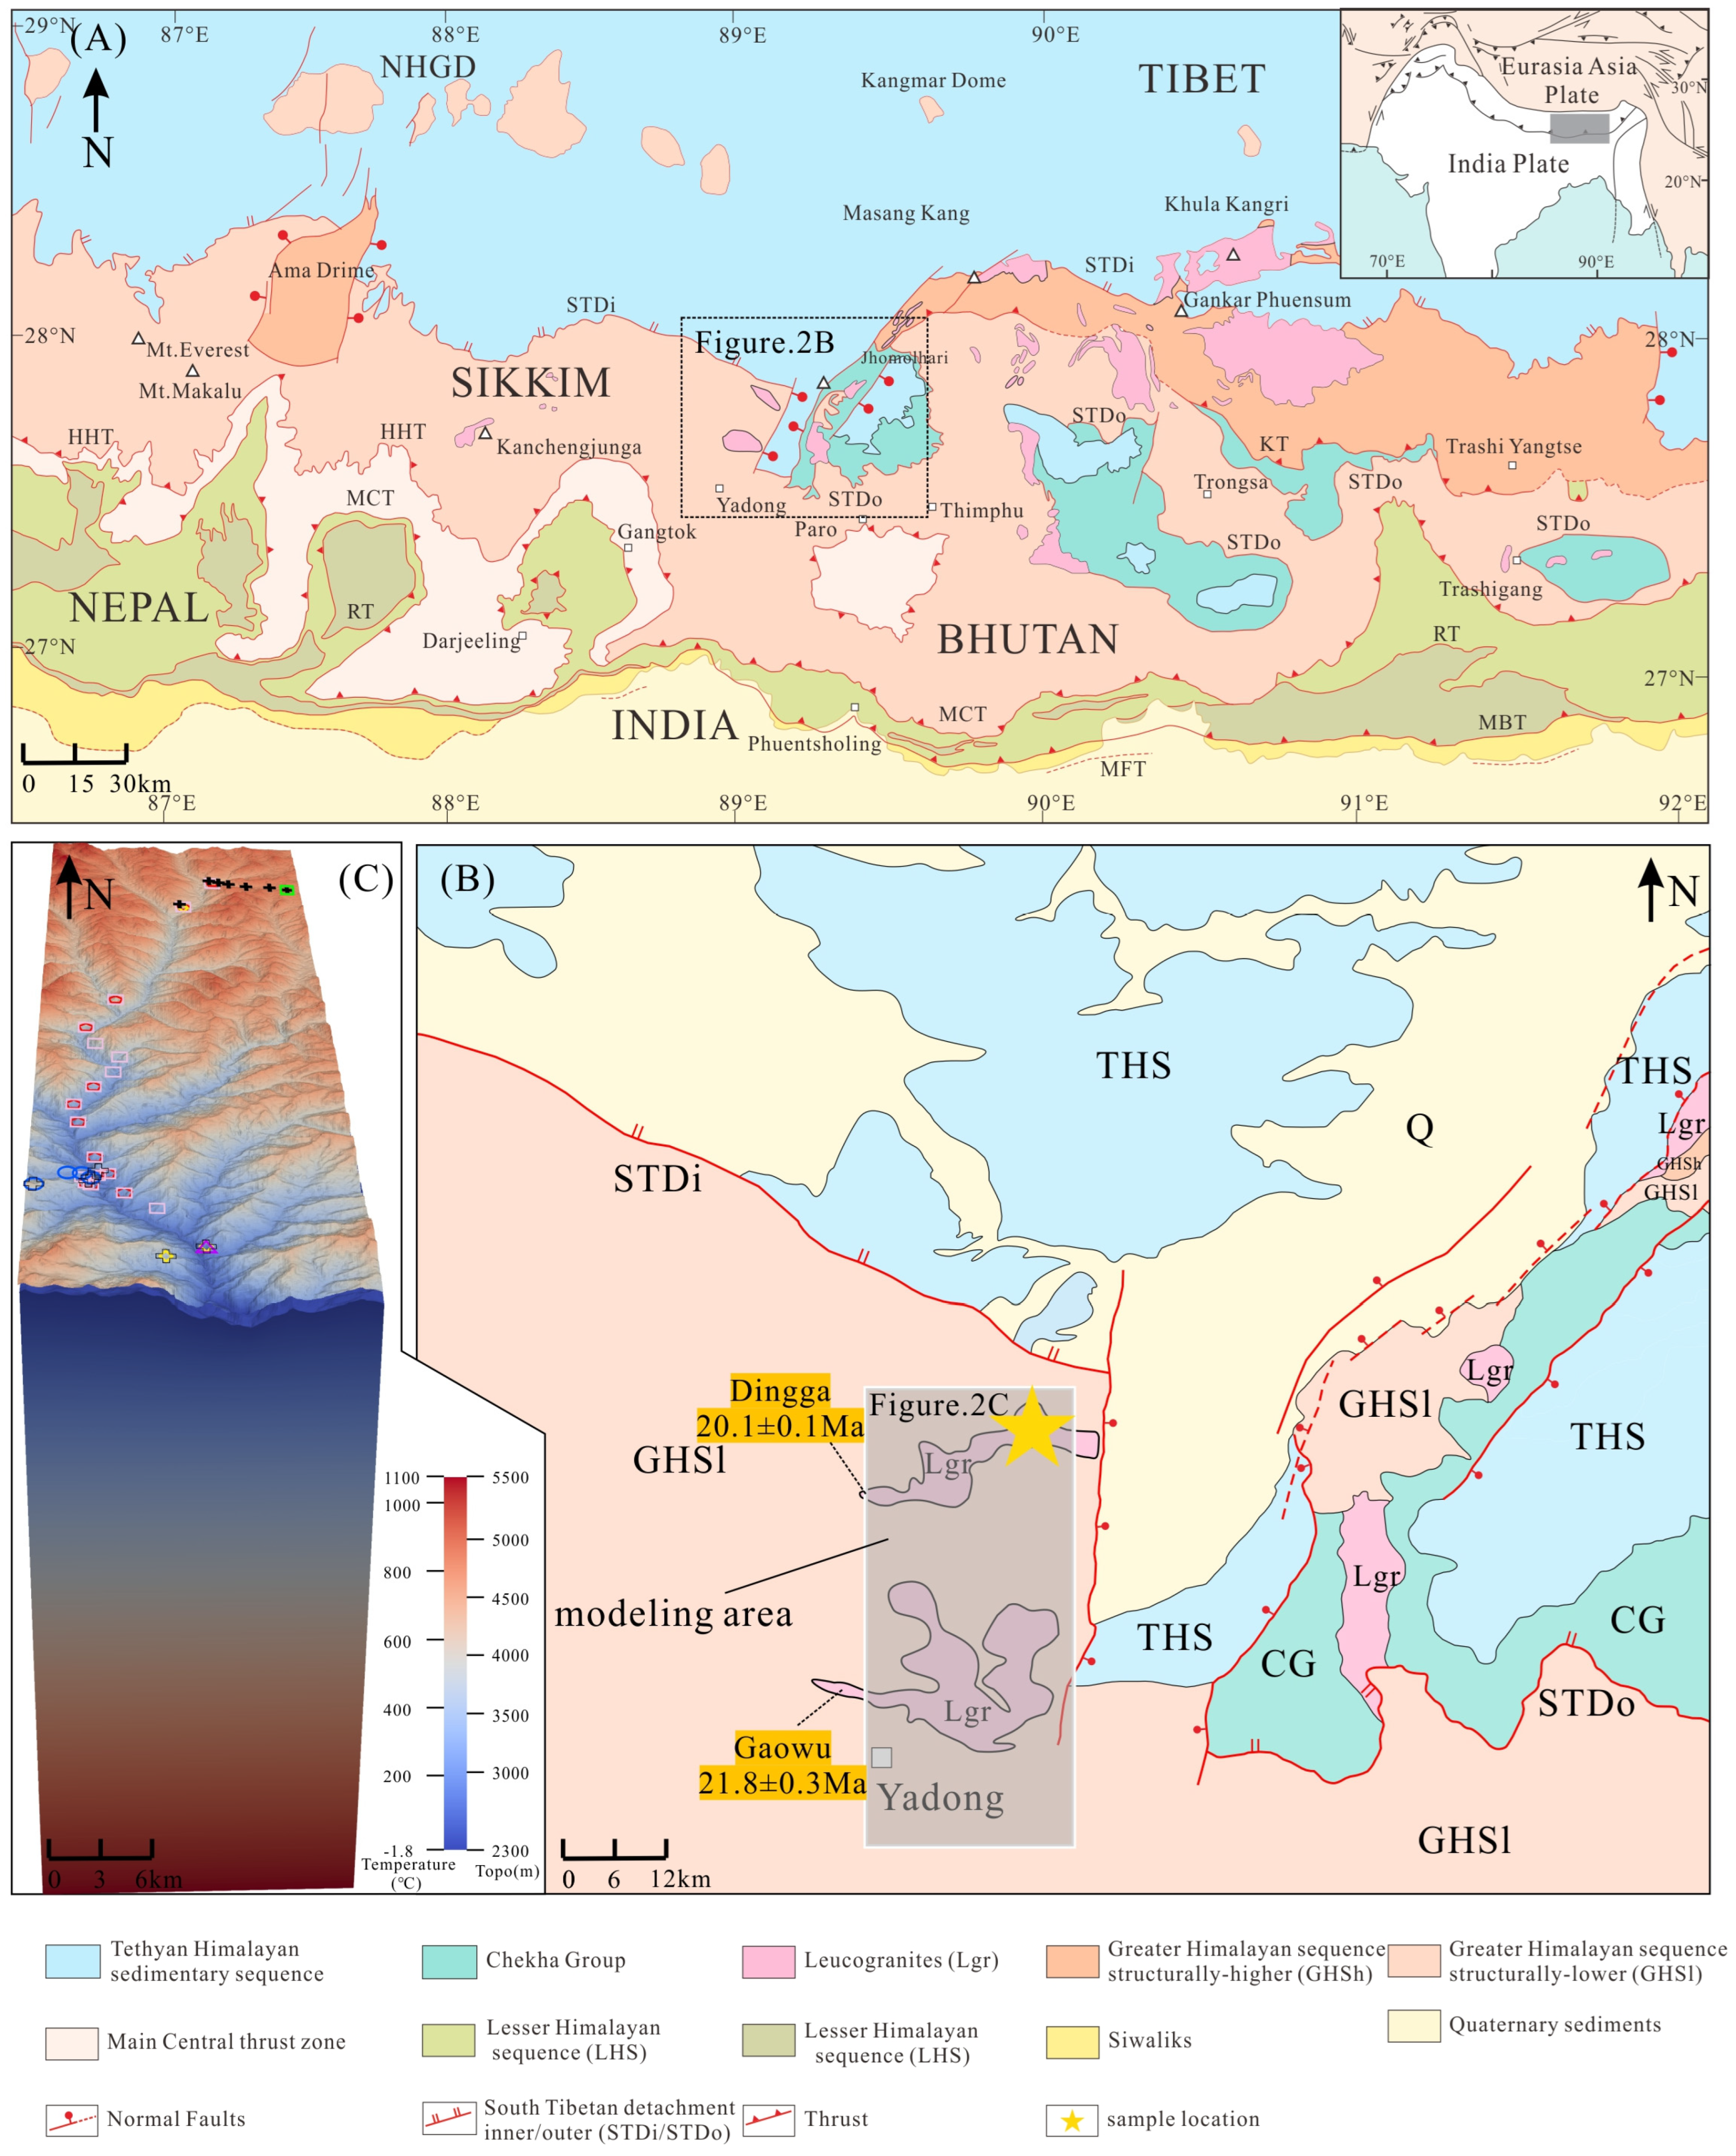
2.4. Yadong Regional Structural Setting
3. Methods
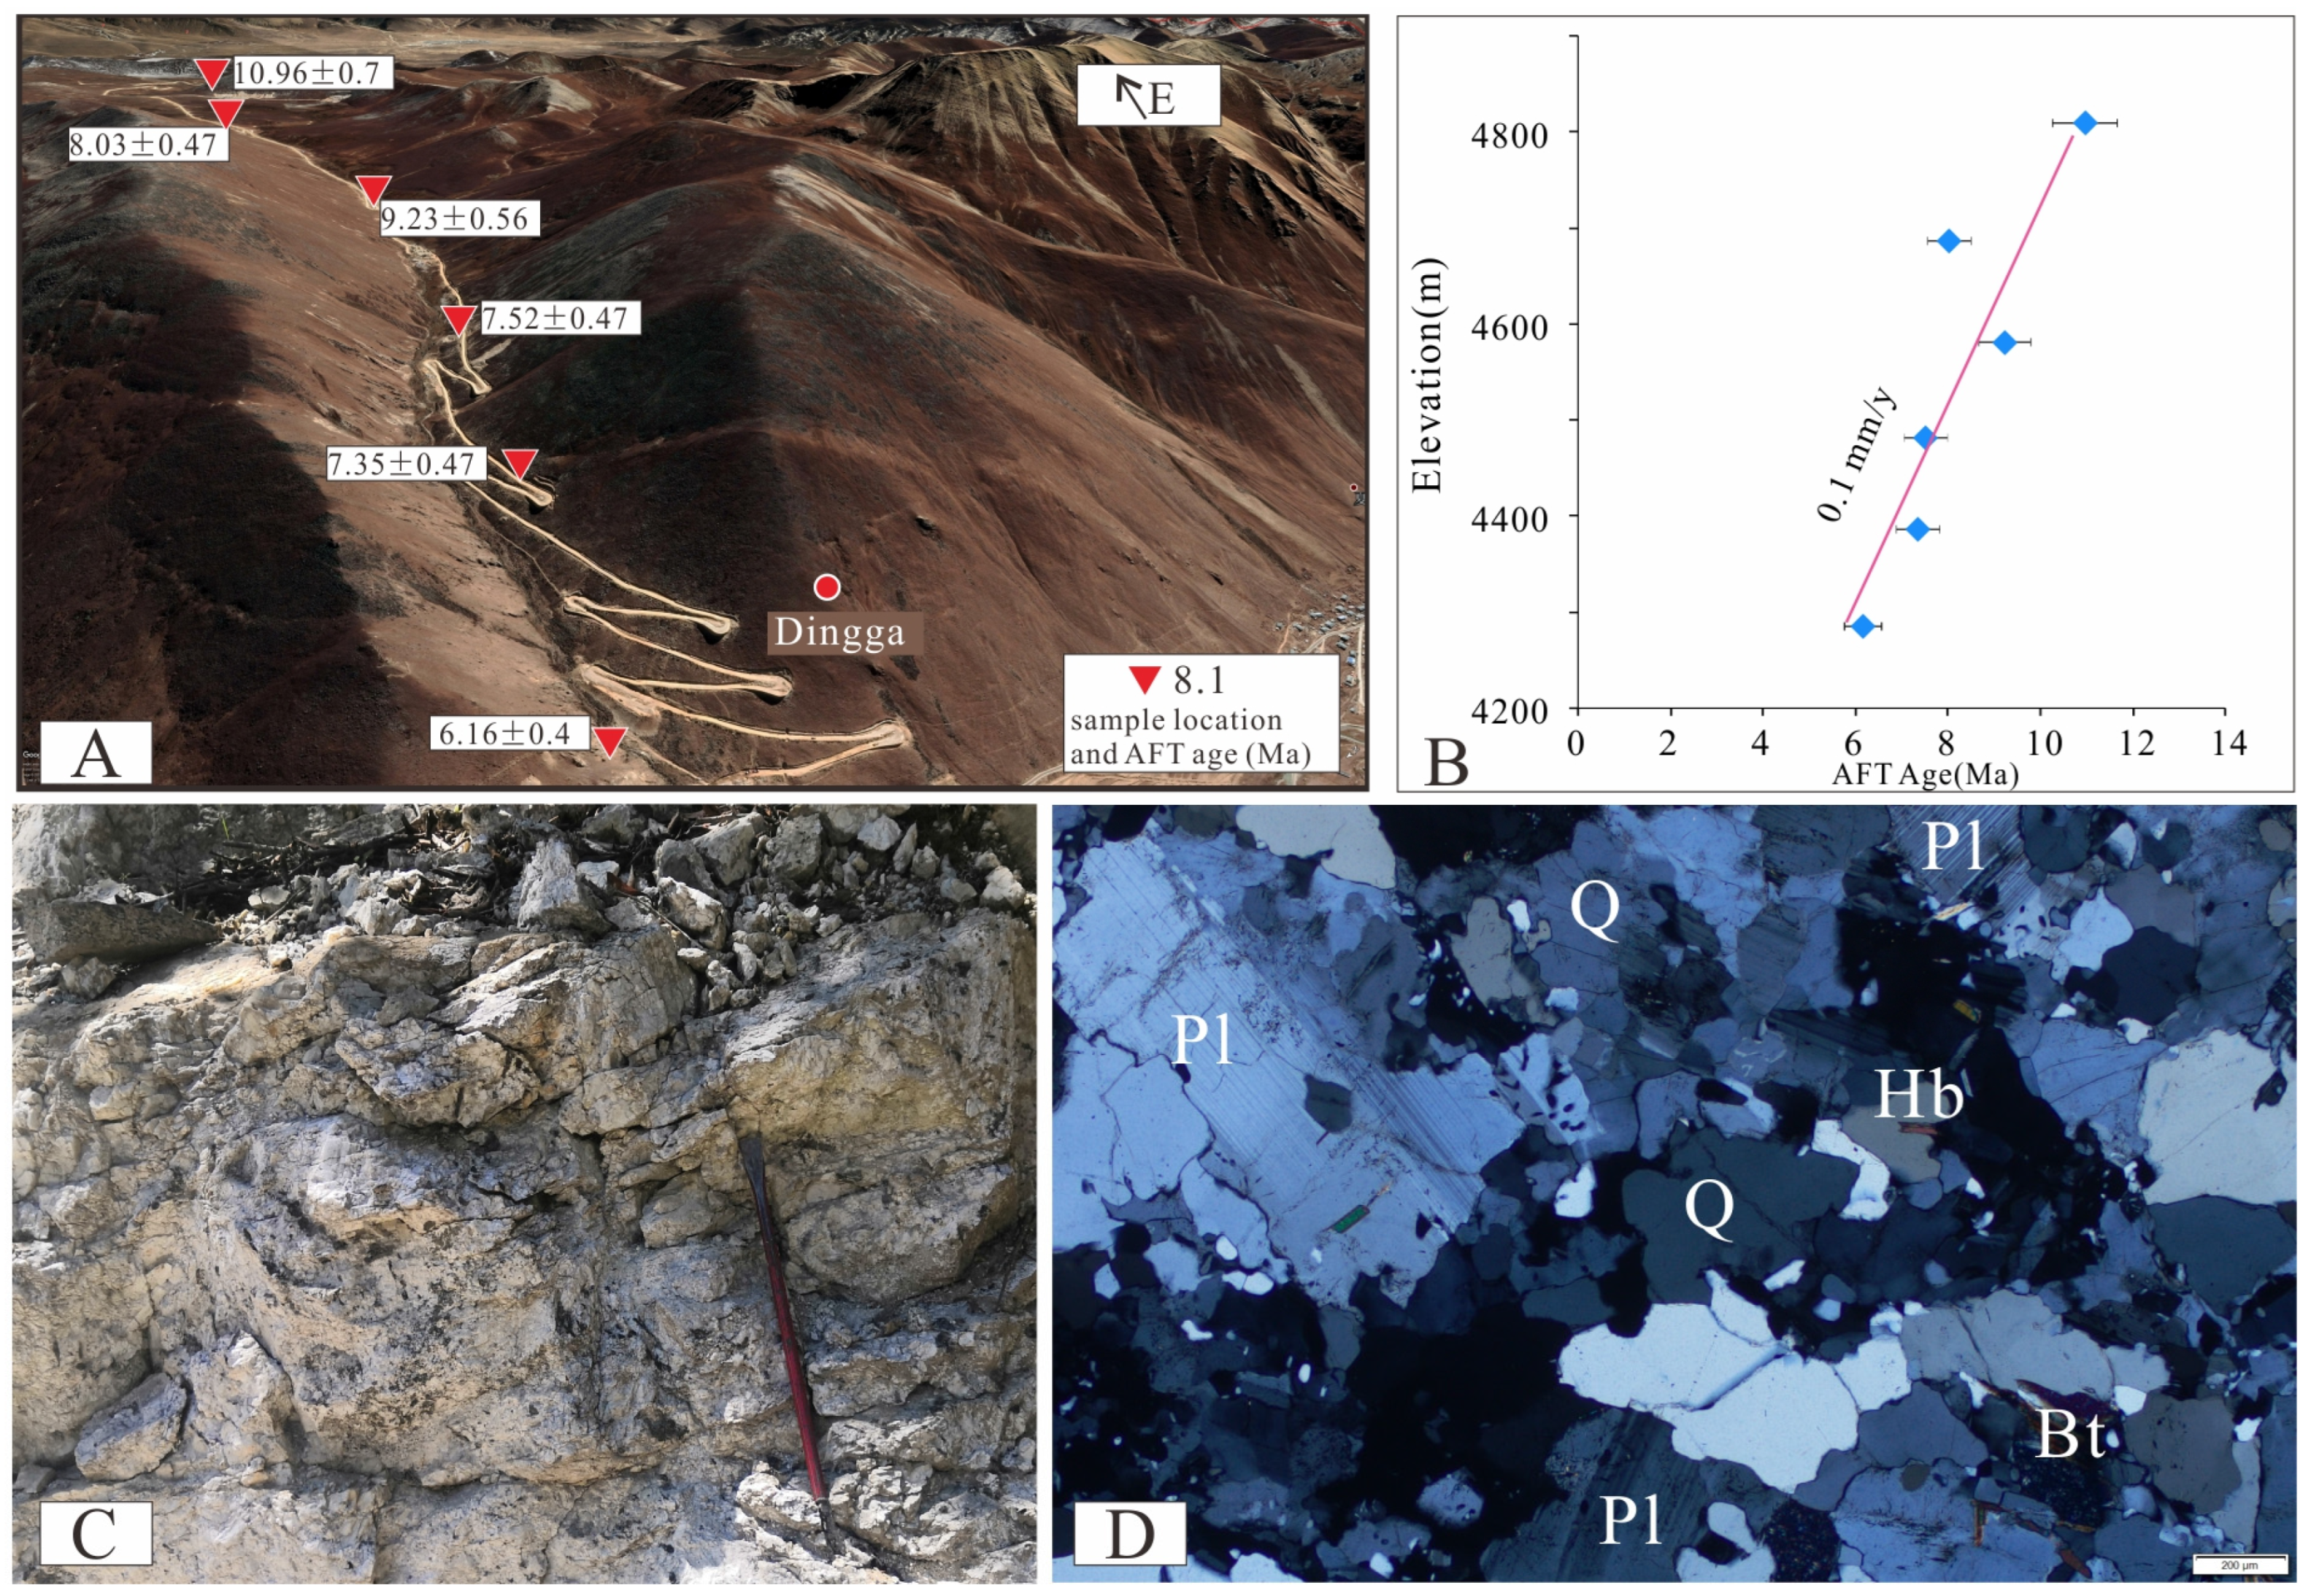
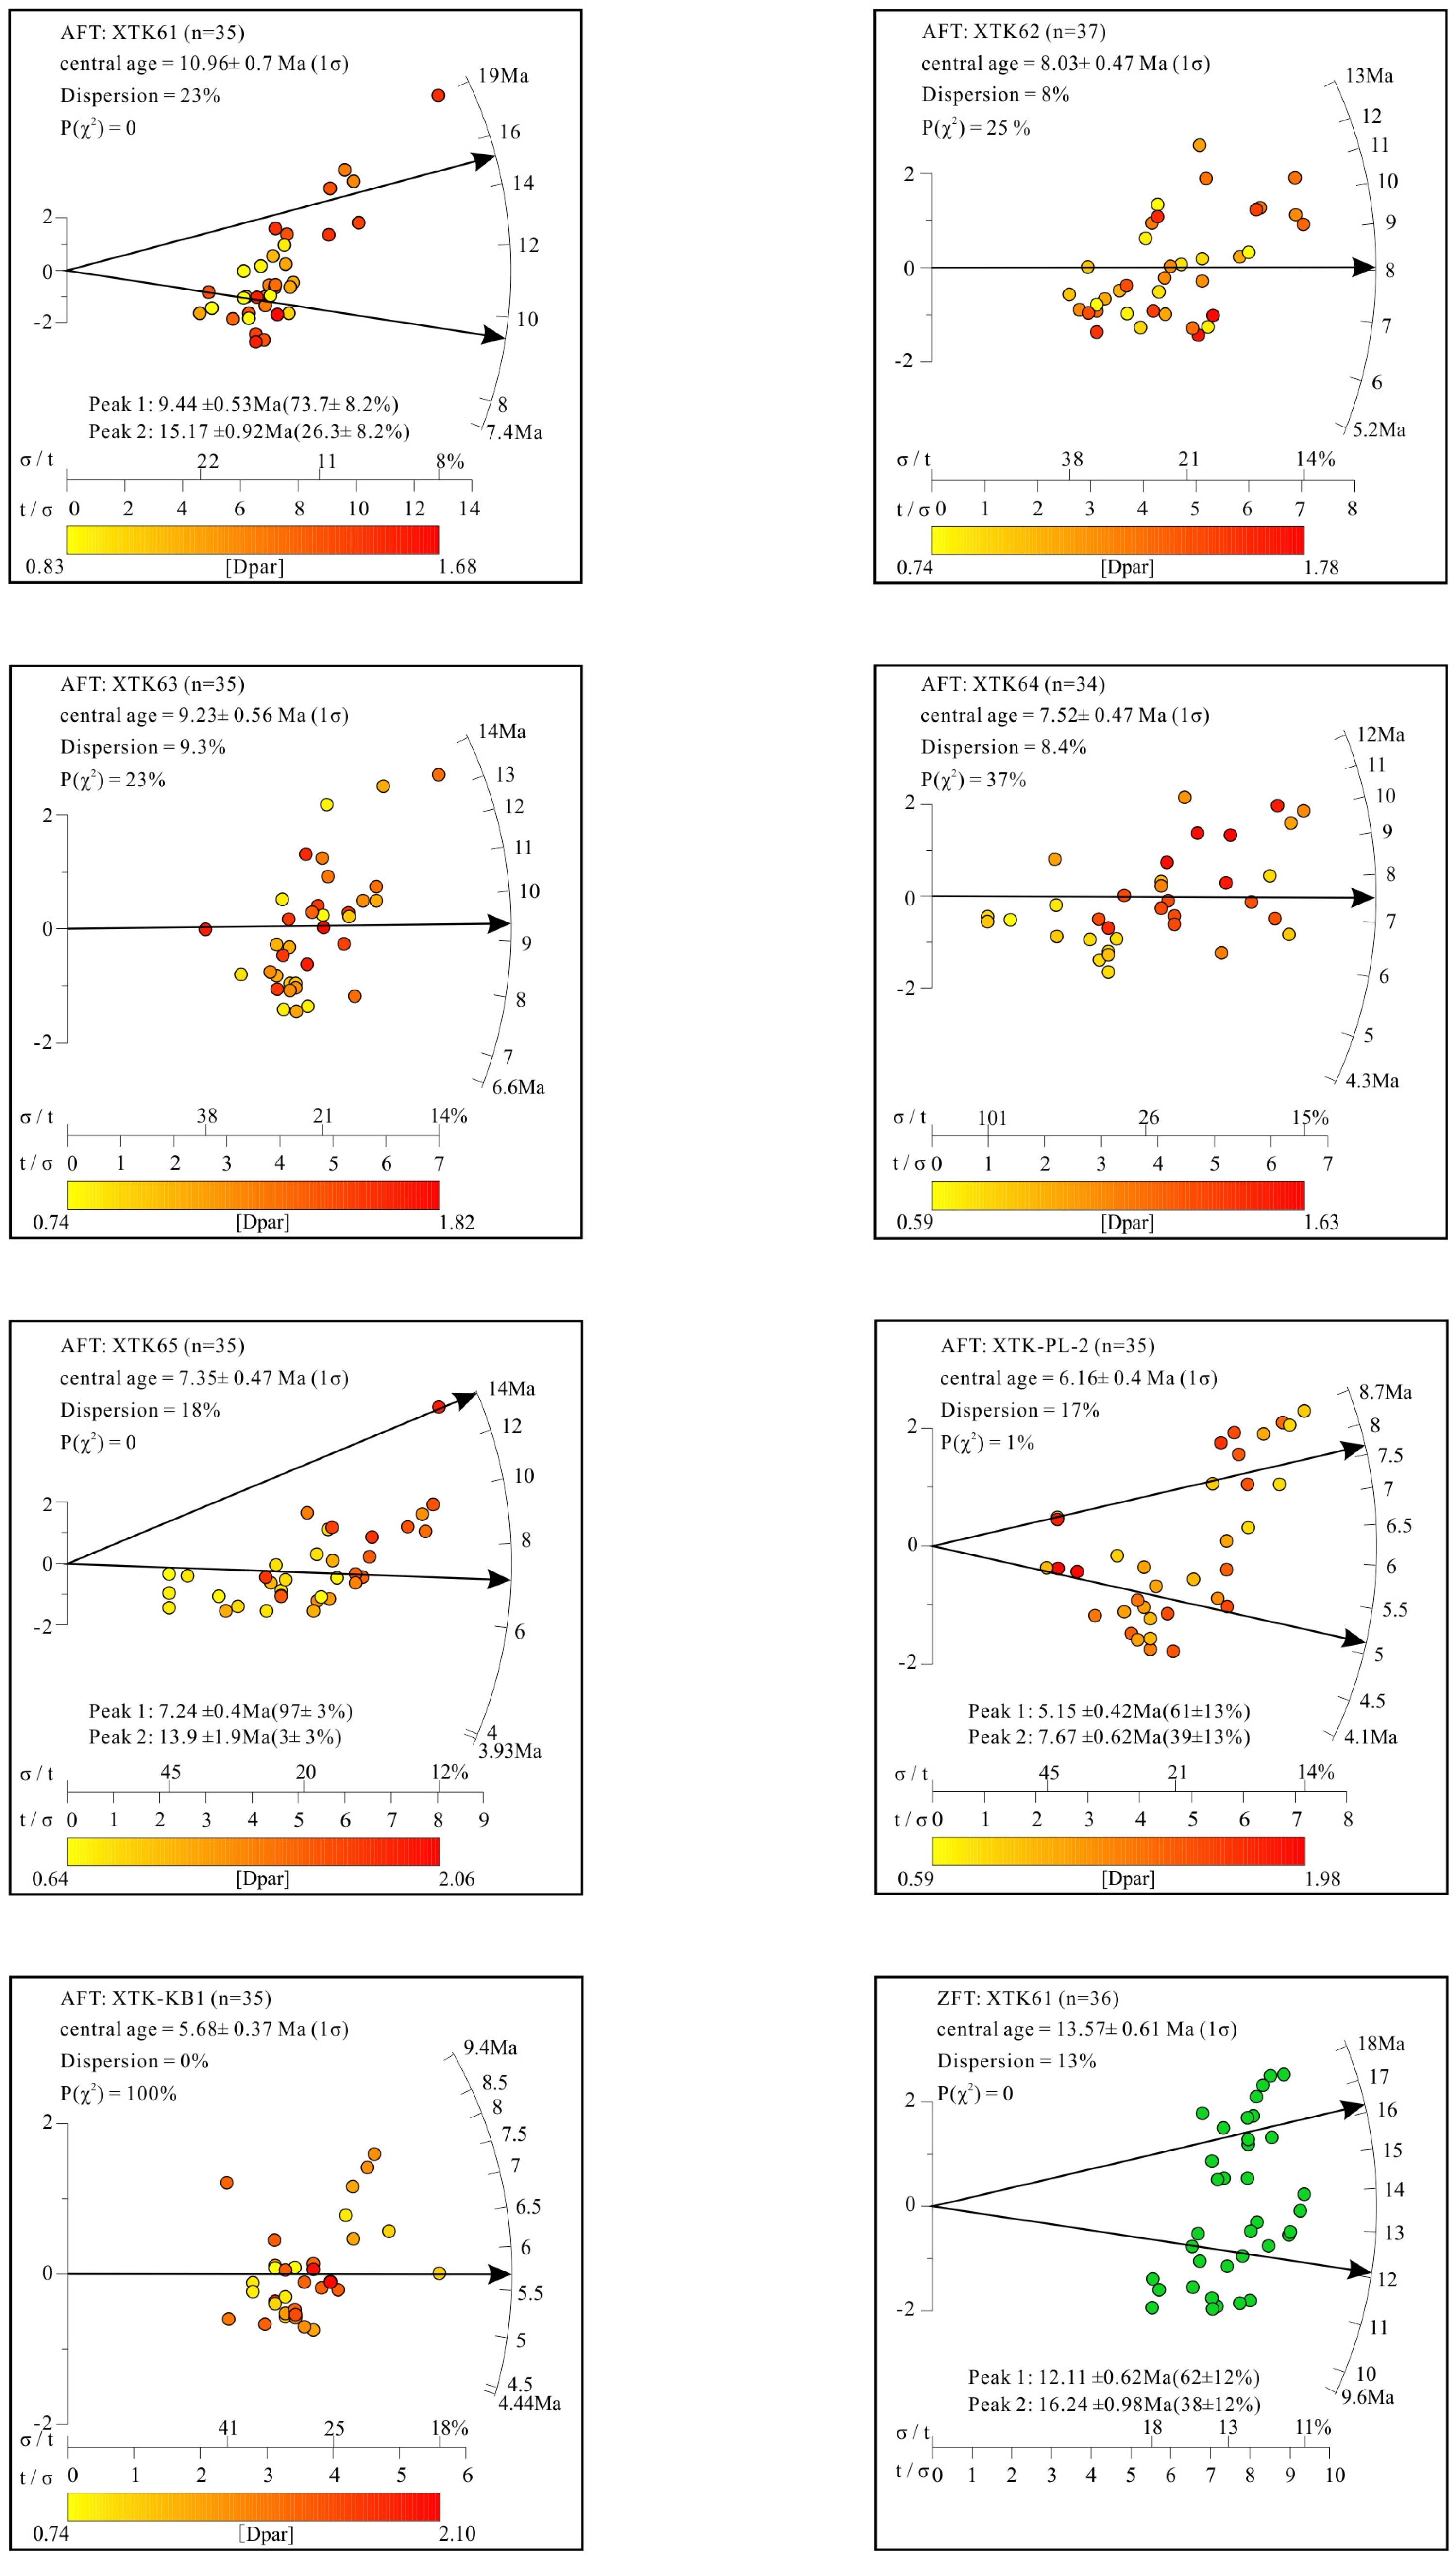
4. Results
5. Thermal History and Thermokinematic Numerical Modeling
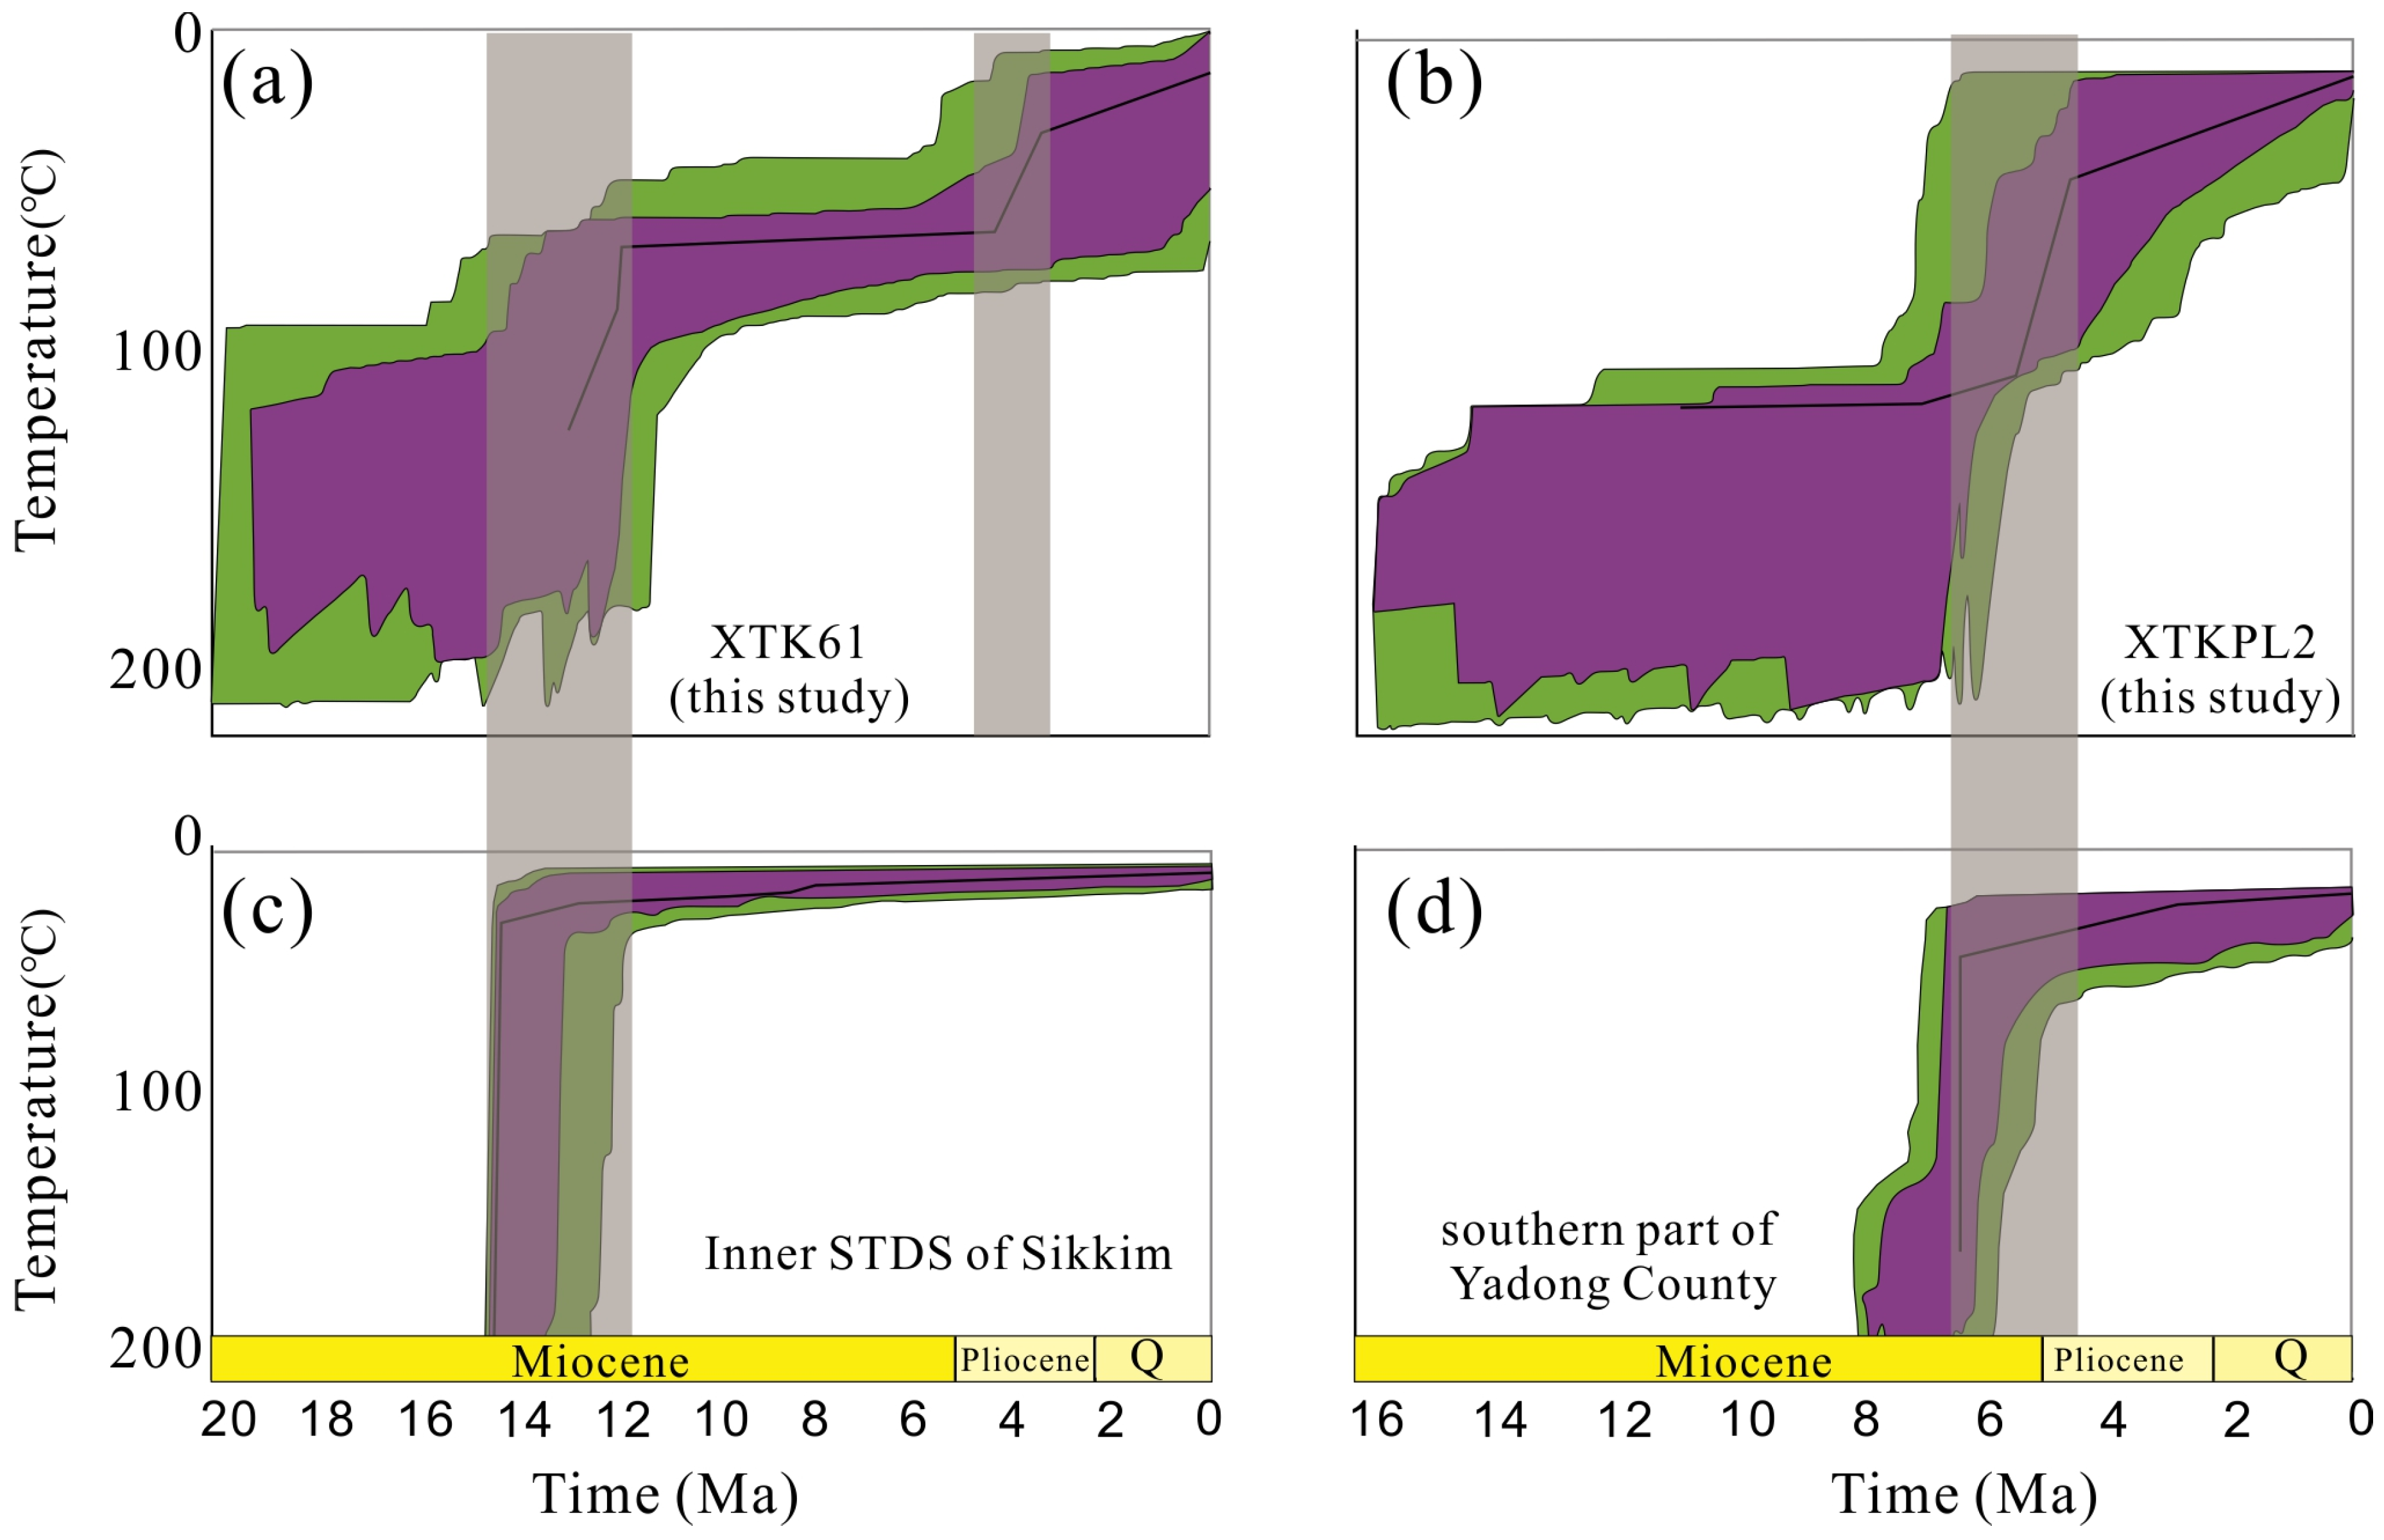
5.1. Thermal History from HeFTy Modeling
5.2. Pecube Model Setup
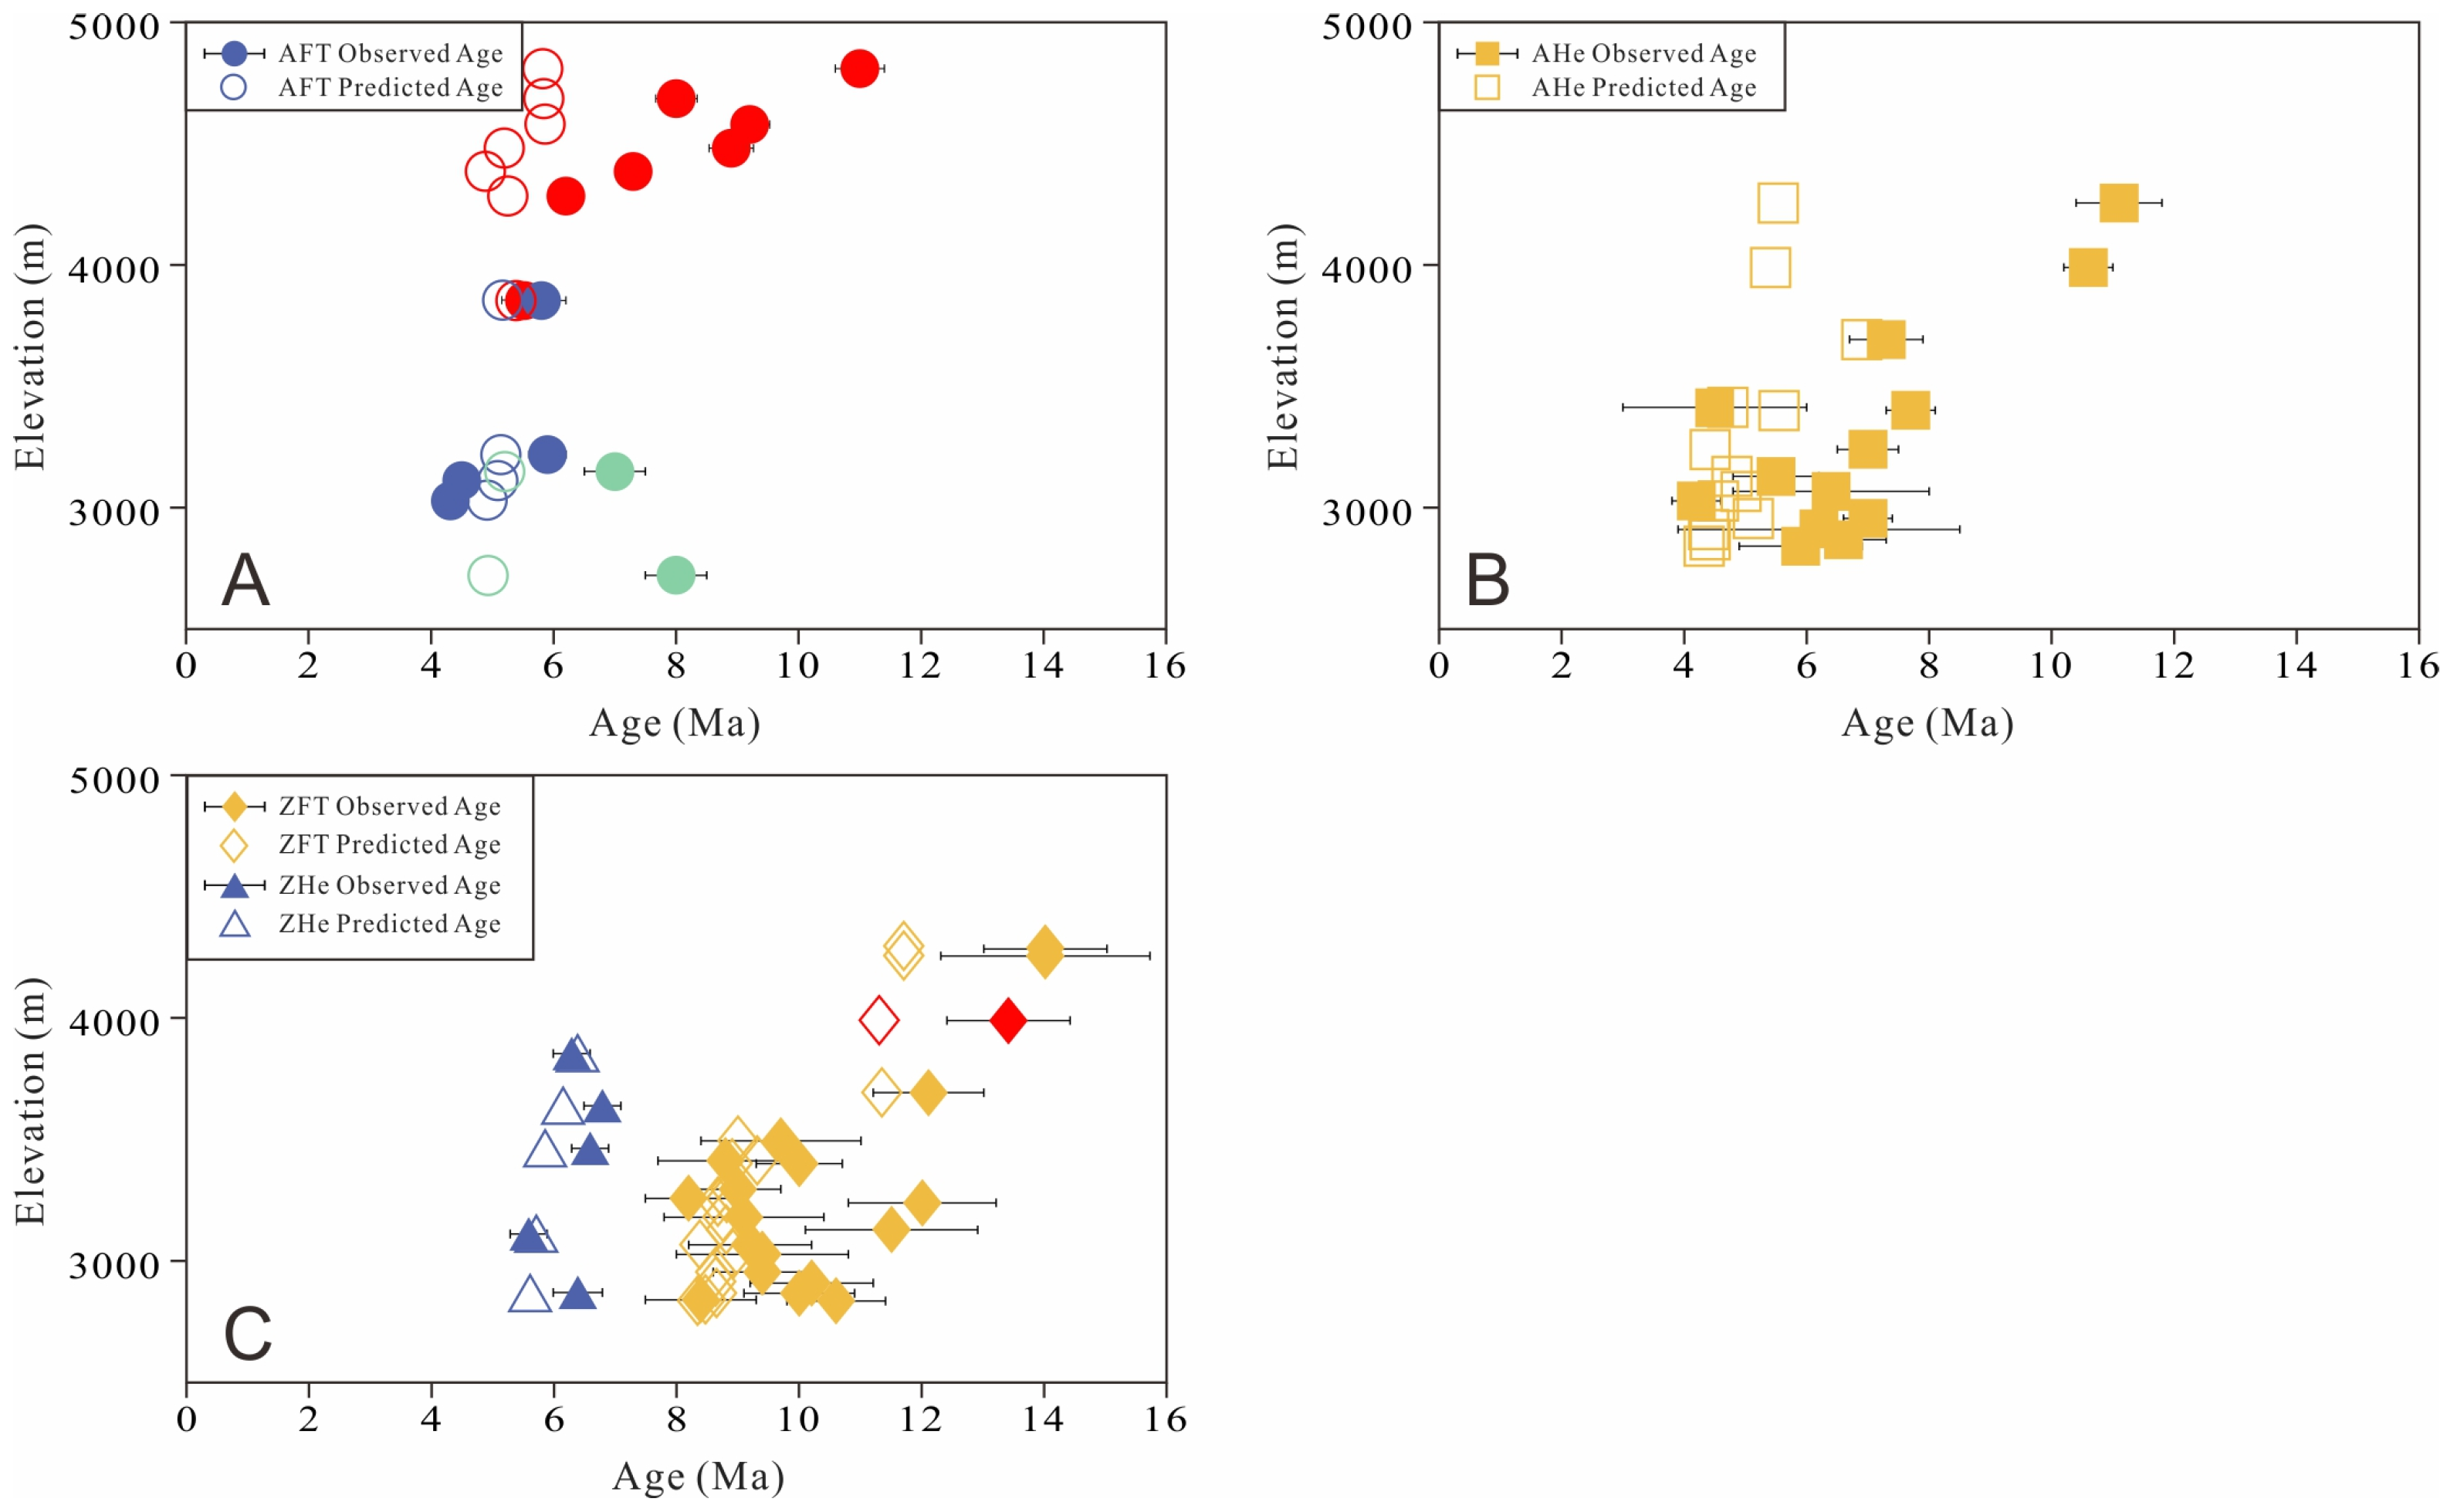
5.3. Modeling Results
5.3.1. YD01 Scenario
5.3.2. Scenario YD02
5.3.3. YD03 Scenario
5.3.4. YD04 Scenario
5.3.5. YD05 Scenario
6. Discussion
6.1. New Constraints on the Movement of STDS
6.2. New Constraints on the Movement of NSTRs
7. Conclusions
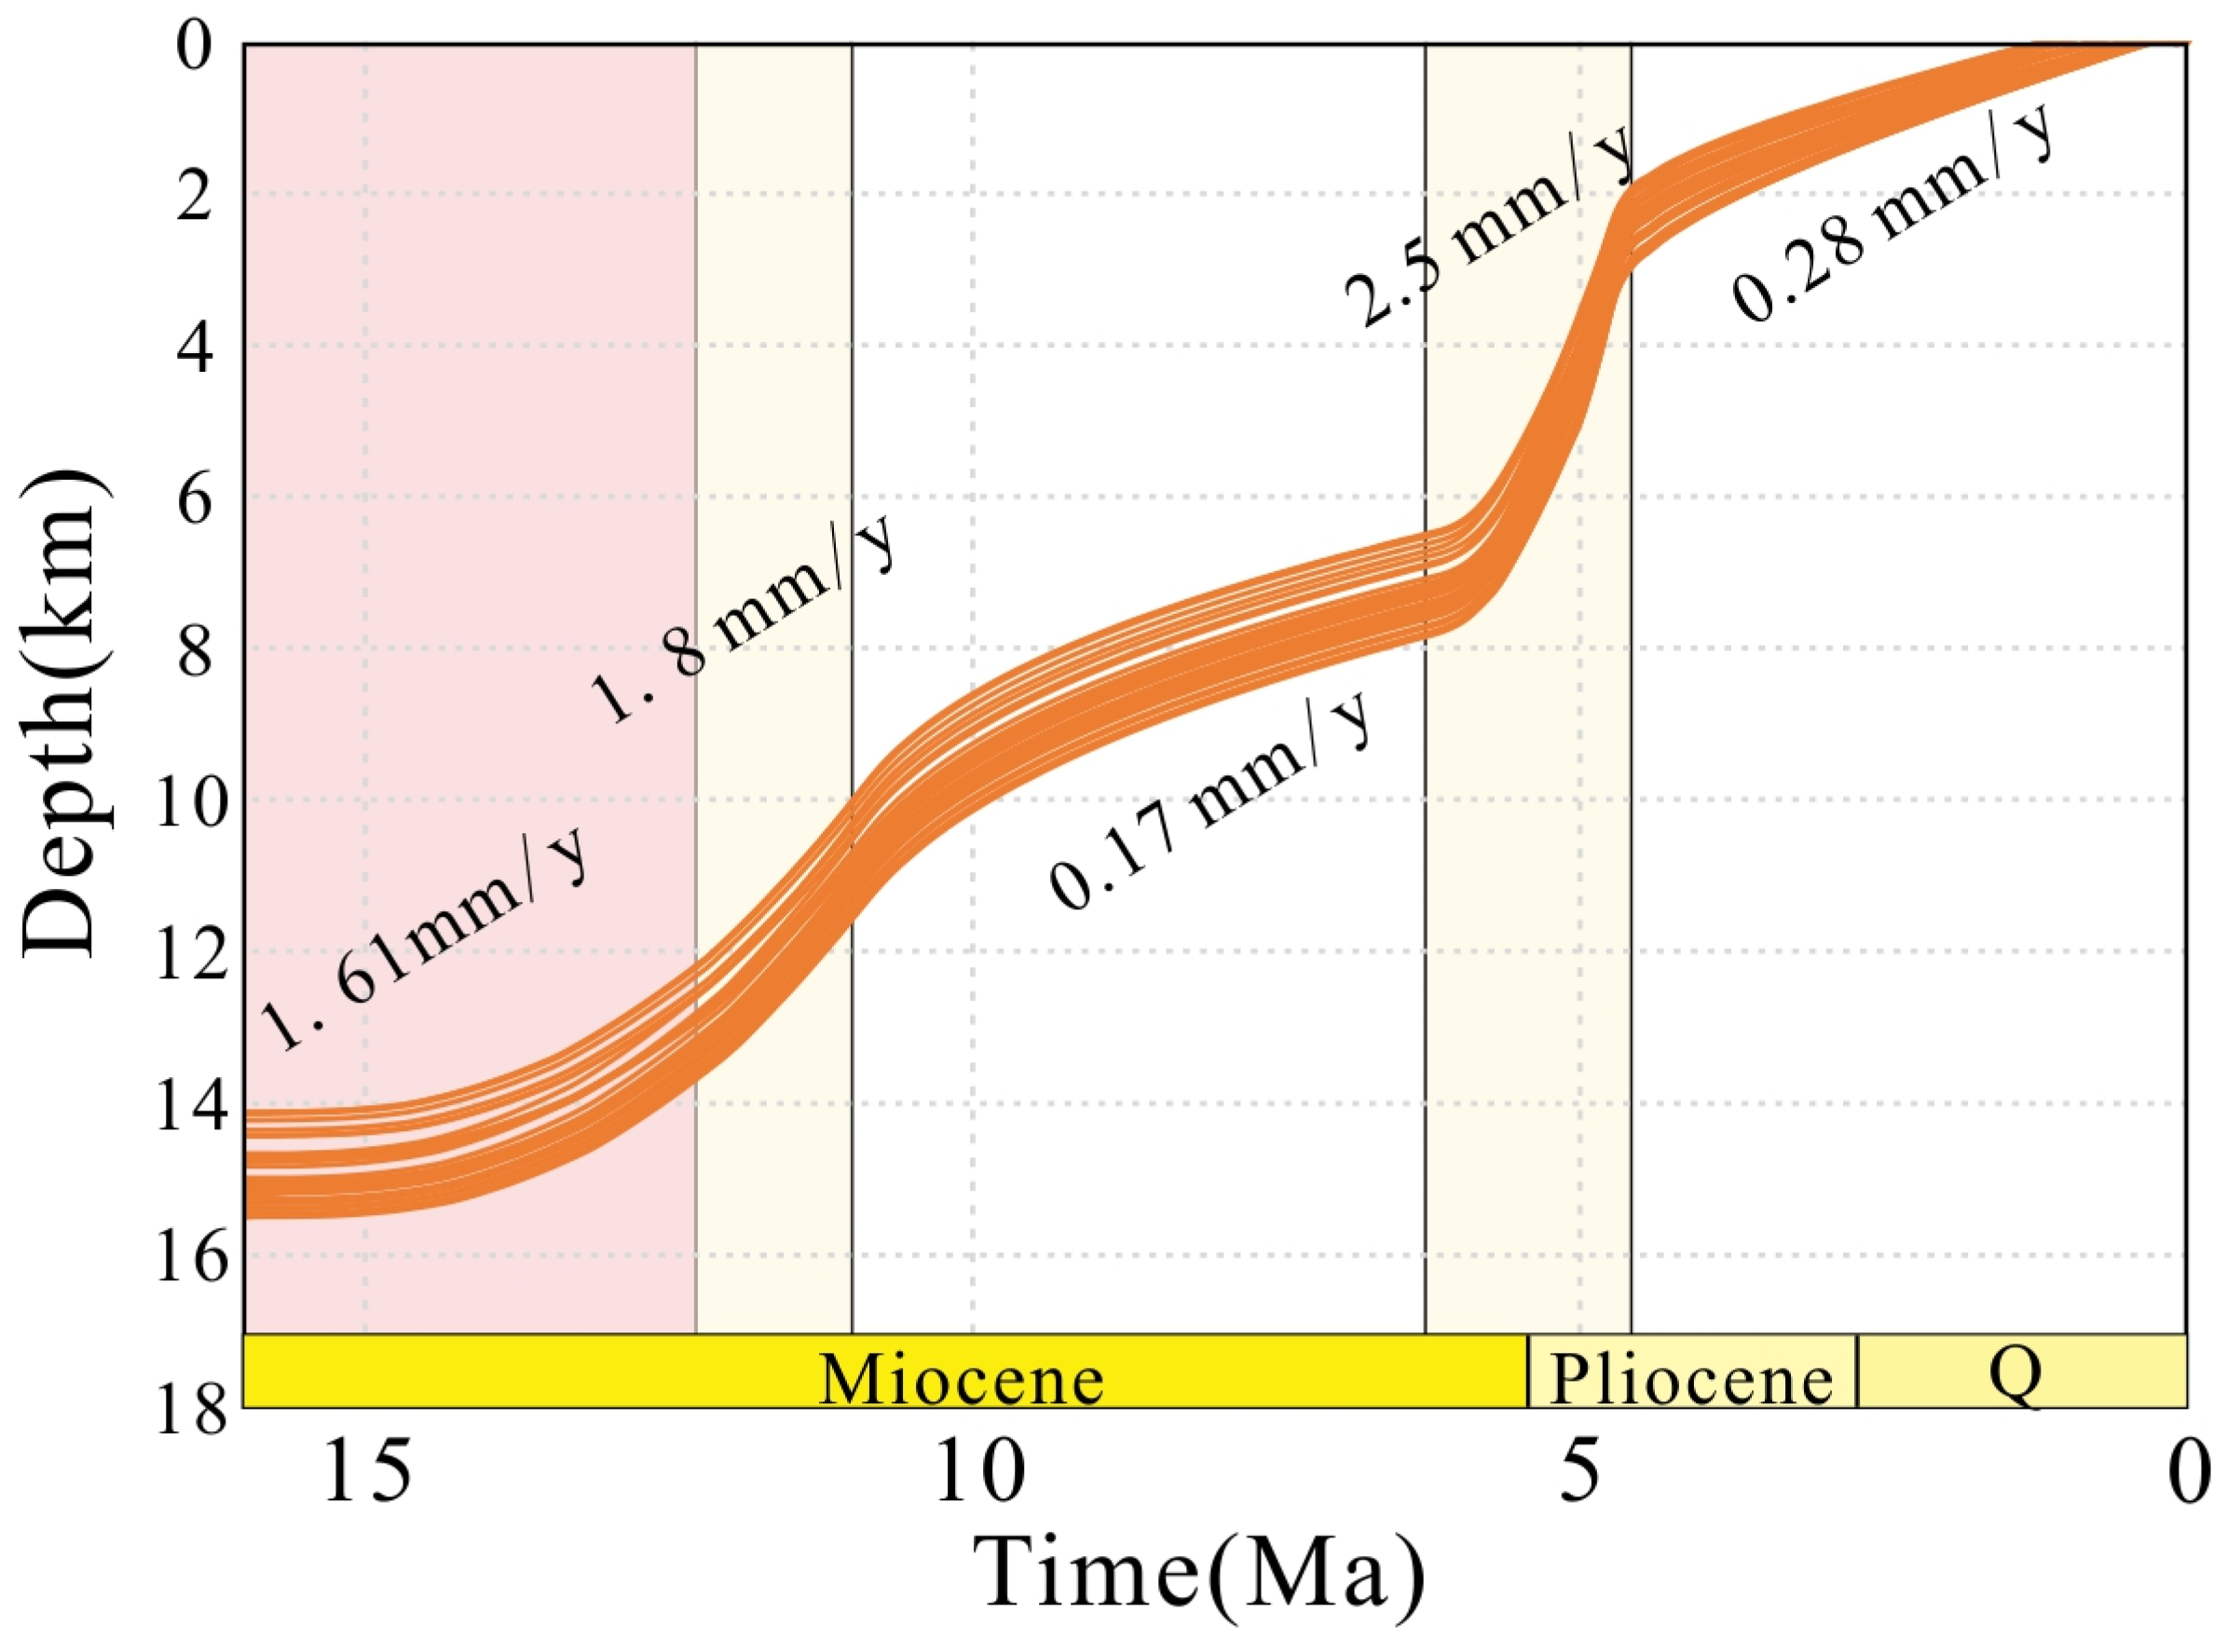
- The region has undergone five distinct phases of cooling since the middle Miocene, which included three pulses of faster exhumation caused by the slip on extensional structures.
- There is notable diachronicity in the cessation of movement along the strike of the STDS, with the activity of the STDS leading to the first period of rapid exhumation-related cooling, which ceased at 12–11 Ma.
- The Yadong fault initiated at approximately 12 Ma and experienced pulses of rapid exhumation between 6.2 and 4.7 Ma. These two periods of activity contributed to the rapid exhumation of the region in the middle Miocene and early Pliocene.
Supplementary Materials
Author Contributions
Funding
Data Availability Statement
Conflicts of Interest
References
- Mahéo, G.; Leloup, P.H.; Valli, F.; Lacassin, R.; Arnaud, N.; Paquette, J.L.; Fernandez, A.; Haibing, L.; Farley, K.A.; Tapponnier, P. Post 4 Ma initiation of normal faulting in southern Tibet. Constraints from the Kung Co half graben. Earth Planet. Sci. Lett. 2007, 256, 233–243. [Google Scholar] [CrossRef]
- Hodges, K.V. Tectonics of the Himalaya and southern Tibet from two perspectives. GSA Bull. 2000, 112, 324–350. [Google Scholar] [CrossRef]
- Wang, C.; Dai, J.; Zhao, X.; Li, Y.; Graham, S.A.; He, D.; Ran, B.; Meng, J. Outward-growth of the Tibetan Plateau during the Cenozoic: A review. Tectonophysics 2014, 621, 1–43. [Google Scholar] [CrossRef]
- Burchfiel, B.C.; Zhiliang, C.; Hodges, K.V.; Yuping, L.; Royden, L.H.; Changrong, D.; Jiene, X.; Burchfiel, B.C.; Zhiliang, C.; Hodges, K.V.; et al. The South Tibetan Detachment System, Himalayan Orogen: Extension Contemporaneous with and Parallel to Shortening in a Collisional Mountain Belt; Geological Society of America: Boulder, CO, USA, 1992; Volume 269. [Google Scholar]
- Hodges, K.V.; Parrish, R.R.; Housh, T.B.; Lux, D.R.; Burchfiel, B.C.; Royden, L.H.; Chen, Z. Simultaneous Miocene Extension and Shortening in the Himalayan Orogen. Science 1992, 258, 1466–1470. [Google Scholar] [CrossRef] [PubMed]
- Yin, A. Cenozoic tectonic evolution of the Himalayan orogen as constrained by along-strike variation of structural geometry, exhumation history, and foreland sedimentation. Earth-Sci. Rev. 2006, 76, 1–131. [Google Scholar] [CrossRef]
- Molnar, P.; Tapponnier, P. Active tectonics of Tibet. J. Geophys. Res. Solid Earth 1978, 83, 5361–5375. [Google Scholar] [CrossRef]
- Pan, Y.; Kidd, W.S.F. Nyainqentanglha shear zone: A late Miocene extensional detachment in the southern Tibetan Plateau. Geology 1992, 20, 775–778. [Google Scholar] [CrossRef]
- Molnar, P.; England, P.; Martinod, J. Mantle dynamics, uplift of the Tibetan Plateau, and the Indian Monsoon. Rev. Geophys. 1993, 31, 357–396. [Google Scholar] [CrossRef]
- Styron, R.; Taylor, M.; Sundell, K. Accelerated extension of Tibet linked to the northward underthrusting of Indian crust. Nat. Geosci. 2015, 8, 131–134. [Google Scholar] [CrossRef]
- Burg, J.P.; Brunel, M.; Gapais, D.; Chen, G.M.; Liu, G.H. Deformation of leucogranites of the crystalline Main Central Sheet in southern Tibet (China). J. Struct. Geol. 1984, 6, 535–542. [Google Scholar] [CrossRef]
- Cooper, F.J.; Hodges, K.V.; Parrish, R.R.; Roberts, N.M.W.; Horstwood, M.S.A. Synchronous N-S and E-W extension at the Tibet-to-Himalaya transition in NW Bhutan. Tectonics 2015, 34, 1375–1395. [Google Scholar] [CrossRef]
- Hintersberger, E.; Thiede, R.C.; Strecker, M.R.; Hacker, B.R. East-west extension in the NW Indian Himalaya. GSA Bull. 2010, 122, 1499–1515. [Google Scholar] [CrossRef]
- Thiede, R.C.; Arrowsmith, J.R.N.; Bookhagen, B.; McWilliams, M.; Sobel, E.R.; Strecker, M.R. Dome formation and extension in the Tethyan Himalaya, Leo Pargil, northwest India. GSA Bull. 2006, 118, 635–650. [Google Scholar] [CrossRef]
- Langille, J.M.; Jessup, M.J.; Cottle, J.M.; Lederer, G.; Ahmad, T. Timing of metamorphism, melting and exhumation of the Leo Pargil dome, northwest India. J. Metamorph. Geol. 2012, 30, 769–791. [Google Scholar] [CrossRef]
- McCallister, A.T.; Taylor, M.H.; Murphy, M.A.; Styron, R.H.; Stockli, D.F. Thermochronologic constraints on the late Cenozoic exhumation history of the Gurla Mandhata metamorphic core complex, Southwestern Tibet. Tectonics 2014, 33, 27–52. [Google Scholar] [CrossRef]
- Murphy, M.A.; Yin, A.; Kapp, P.; Harrison, T.M.; Manning, C.E.; Ryerson, F.J.; Lin, D.; Jinghui, G. Structural evolution of the Gurla Mandhata detachment system, southwest Tibet: Implications for the eastward extent of the Karakoram fault system. GSA Bull. 2002, 114, 428–447. [Google Scholar] [CrossRef]
- Murphy, M.A.; Copeland, P. Transtensional deformation in the central Himalaya and its role in accommodating growth of the Himalayan orogen. Tectonics 2005, 24, TC4012. [Google Scholar] [CrossRef]
- Li, H. The Initial Timing, Extension Rates of the N-S Trends Normal Faults in Tibetan Plateau and its Deep Process and Dynamics; China University of Geosciences: Beijing, China, 2020. [Google Scholar]
- Woodruff, W.H., Jr.; Horton, B.K.; Kapp, P.; Stockli, D.F. Late Cenozoic evolution of the Lunggar extensional basin, Tibet: Implications for basin growth and exhumation in hinterland plateaus. GSA Bull. 2013, 125, 343–358. [Google Scholar] [CrossRef]
- Sundell, K.E.; Taylor, M.H.; Styron, R.H.; Stockli, D.F.; Kapp, P.; Hager, C.; Liu, D.; Ding, L. Evidence for constriction and Pliocene acceleration of east-west extension in the North Lunggar rift region of west central Tibet. Tectonics 2013, 32, 1454–1479. [Google Scholar] [CrossRef]
- Styron, R.H.; Taylor, M.H.; Sundell, K.E.; Stockli, D.F.; Oalmann, J.A.G.; Möller, A.; McCallister, A.T.; Liu, D.; Ding, L. Miocene initiation and acceleration of extension in the South Lunggar rift, western Tibet: Evolution of an active detachment system from structural mapping and (U-Th)/He thermochronology. Tectonics 2013, 32, 880–907. [Google Scholar] [CrossRef]
- Larson, K.P.; Kellett, D.A.; Cottle, J.M.; Camacho, A.; Brubacher, A.D. Mid-Miocene initiation of E-W extension and recoupling of the Himalaya. Terra Nova 2020, 32, 151–158. [Google Scholar] [CrossRef]
- Garzione, C.N.; DeCelles, P.G.; Hodkinson, D.G.; Ojha, T.P.; Upreti, B.N. East-west extension and Miocene environmental change in the southern Tibetan plateau: Thakkhola graben, central Nepal. GSA Bull. 2003, 115, 3–20. [Google Scholar] [CrossRef]
- Garzione, C.N.; Dettman, D.L.; Quade, J.; DeCelles, P.G.; Butler, R.F. High times on the Tibetan Plateau: Paleoelevation of the Thakkhola graben, Nepal. Geology 2000, 28, 339–342. [Google Scholar] [CrossRef]
- Coleman, M.; Hodges, K. Evidence for Tibetan plateau uplift before 14 Myr ago from a new minimum age for east–west extension. Nature 1995, 374, 49–52. [Google Scholar] [CrossRef]
- Laskowski, A.K.; Kapp, P.; Ding, L.; Campbell, C.; Liu, X. Tectonic evolution of the Yarlung suture zone, Lopu Range region, southern Tibet. Tectonics 2017, 36, 108–136. [Google Scholar] [CrossRef]
- Sanchez, V.I.; Murphy, M.A.; Robinson, A.C.; Lapen, T.J.; Heizler, M.T. Tectonic evolution of the India–Asia suture zone since Middle Eocene time, Lopukangri area, south-central Tibet. J. Asian Earth Sci. 2013, 62, 205–220. [Google Scholar] [CrossRef]
- Shen, T.; Wang, G.; Leloup, P.H.; van der Beek, P.; Bernet, M.; Cao, K.; Wang, A.; Liu, C.; Zhang, K. Controls on Cenozoic exhumation of the Tethyan Himalaya from fission-track thermochronology and detrital zircon U-Pb geochronology in the Gyirong basin area, southern Tibet. Tectonics 2016, 35, 1713–1734. [Google Scholar] [CrossRef]
- Mitsuishi, M.; Wallis, S.R.; Aoya, M.; Lee, J.; Wang, Y. E–W extension at 19 Ma in the Kung Co area, S. Tibet: Evidence for contemporaneous E–W and N–S extension in the Himalayan orogen. Earth Planet. Sci. Lett. 2012, 325–326, 10–20. [Google Scholar] [CrossRef]
- Lee, J.; Hager, C.; Wallis, S.R.; Stockli, D.F.; Whitehouse, M.J.; Aoya, M.; Wang, Y. Middle to late Miocene extremely rapid exhumation and thermal reequilibration in the Kung Co rift, southern Tibet. Tectonics 2011, 30, TC2007. [Google Scholar] [CrossRef]
- Dewane, T.J.; Stockli, D.F.; Hager, C.; Taylor, M.; Ding, L.; Lee, J.; Wallis, S. Timing of Cenozoic E-W Extension in the Tangra Yum Co-Kung Co Rift, south-central Tibet. Eos. Trans. AGU Fall Meet. Suppl. 2006, 87, T34C-04. [Google Scholar]
- Wolff, R.; Hetzel, R.; Dunkl, I.; Xu, Q.; Bröcker, M.; Anczkiewicz, A.A. High-Angle Normal Faulting at the Tangra Yumco Graben (Southern Tibet) since ~15 Ma. J. Geol. 2019, 127, 15–36. [Google Scholar] [CrossRef]
- Blisniuk, P.M.; Hacker, B.R.; Glodny, J.; Ratschbacher, L.; Bi, S.; Wu, Z.; McWilliams, M.O.; Calvert, A. Normal faulting in central Tibet since at least 13.5 Myr ago. Nature 2001, 412, 628–632. [Google Scholar] [CrossRef] [PubMed]
- Cottle, J.M.; Jessup, M.J.; Newell, D.L.; Horstwood, M.S.A.; Noble, S.R.; Parrish, R.R.; Waters, D.J.; Searle, M.P. Geochronology of granulitized eclogite from the Ama Drime Massif: Implications for the tectonic evolution of the South Tibetan Himalaya. Tectonics 2009, 28, TC1002. [Google Scholar] [CrossRef]
- Kali, E.; Leloup, P.H.; Arnaud, N.; Mahéo, G.; Liu, D.; Boutonnet, E.; Van der Woerd, J.; Liu, X.; Liu-Zeng, J.; Li, H. Exhumation history of the deepest central Himalayan rocks, Ama Drime range: Key pressure-temperature-deformation-time constraints on orogenic models. Tectonics 2010, 29, TC2014. [Google Scholar] [CrossRef]
- Zhang, J.; Guo, L. Structure and geochronology of the southern Xainza-Dinggye rift and its relationship to the south Tibetan detachment system. J. Asian Earth Sci. 2007, 29, 722–736. [Google Scholar] [CrossRef]
- Hager, C.; Stockli, D.; Dewane, T.; Gehrels, G.; Ding, L. Anatomy and crustal evolution of the central Lhasa terrane (S-Tibet) revealed by investigations in the Xainza rift. In Proceedings of the EGU General Assembly Conference Abstracts, Vienna, Austria, 1 April 2009; p. 11346. [Google Scholar]
- Orme, D.A. Burial and exhumation history of the Xigaze forearc basin, Yarlung suture zone, Tibet. Geosci. Front. 2019, 10, 895–908. [Google Scholar] [CrossRef]
- Jessup, M.J.; Newell, D.L.; Cottle, J.M.; Berger, A.L.; Spotila, J.A. Orogen-parallel extension and exhumation enhanced by denudation in the trans-Himalayan Arun River gorge, Ama Drime Massif, Tibet-Nepal. Geology 2008, 36, 587–590. [Google Scholar] [CrossRef]
- Hager, C. Integrated Tectonic and Quantitative Thermochronometric Investigation of the Xainza Rift, Tibet; University of Kansas: Lawrence, KS, USA, 2014. [Google Scholar]
- Ratschbacher, L.; Krumrei, I.; Blumenwitz, M.; Staiger, M.; Gloaguen, R.; Miller, B.V.; Samson, S.D.; Edwards, M.A.; Appel, E. Rifting and strike-slip shear in central Tibet and the geometry, age and kinematics of upper crustal extension in Tibet. Geol. Soc. Lond. Spec. Publ. 2011, 353, 127–163. [Google Scholar] [CrossRef]
- Wu, Z.; Jiang, W.; Zhou, J.; Li, Y. Thermochronological analysis of the thermal history and tectonic geomorphological evolution process of typical rock masses in the hinterland of the Qinghai Tibet Plateau. Acta Geol. Sin. 2001, 75, 468–476. [Google Scholar]
- Wu, Z.; Jiang, W.; Wu, Z.; Zhang, S. Dating of Typical Basin and Range Tectonics in Central Tibetan Plateau. Acta Geosci. Sin. 2002, 23, 6. [Google Scholar]
- Harrison, T.M.; Copeland, P.; Kidd, W.S.F.; Lovera, O.M. Activation of the Nyainqentanghla Shear Zone: Implications for uplift of the southern Tibetan Plateau. Tectonics 1995, 14, 658–676. [Google Scholar] [CrossRef]
- Edwards, M.A.; Harrison, T.M. When did the roof collapse? Late Miocene north-south extension in the high Himalaya revealed by Th-Pb monazite dating of the Khula Kangri granite. Geology 1997, 25, 543–546. [Google Scholar] [CrossRef]
- Wang, S. Study on the Tectonic Geomorphology and Active Timing of Yadong Rift, Southern Tibet; China University of Geosciences: Beijing, China, 2020. [Google Scholar]
- HA, G.; WU, Z.; HE, L.; WANG, S. Late Cenozoic sedimentary evolution of Pagri-Duoqing Co graben, southern end of Yadong-Gulu Rift, Southern Tibet. Acta Geol. Sin.-Engl. Ed. 2018, 92, 972–987. [Google Scholar] [CrossRef]
- Antolín, B.; Schill, E.; Grujic, D.; Baule, S.; Quidelleur, X.; Appel, E.; Waldhör, M. E–W extension and block rotation of the southeastern Tibet: Unravelling late deformation stages in the eastern Himalayas (NW Bhutan) by means of pyrrhotite remanences. J. Struct. Geol. 2012, 42, 19–33. [Google Scholar] [CrossRef]
- Bian, S.; Gong, J.; Zuza, A.V.; Yang, R.; Chen, L.; Ji, J.; Yu, X.; Tian, Y.; Yu, Z.; Cheng, X.; et al. Along-Strike Variation in the Initiation Timing of the North-Trending Rifts in Southern Tibet as Revealed from the Yadong-Gulu Rift. Tectonics 2022, 41, e2021TC007091. [Google Scholar] [CrossRef]
- Stockli, D.; Taylor, M.; Yin, A.; Harrison, M.; D’Andrea, J.; Kapp, P.; Ding, L. Late Miocene-Pliocene inception of E-W extension in Tibet as evidenced by apatite (U-Th)/He data. Geol. Soc. Am. Abstr. 2002, 34, 182–188. [Google Scholar]
- Shen, T.; Wang, G.; van der Beek, P.; Bernet, M.; Chen, Y.; Zhang, P.; Wang, A.; Cao, K. Impacts of late Miocene normal faulting on Yarlung Tsangpo River evolution, southeastern Tibet. GSA Bull. 2022, 134, 3142–3154. [Google Scholar] [CrossRef]
- Bian, S.; Gong, J.; Zuza, A.V.; Yang, R.; Tian, Y.; Ji, J.; Chen, H.; Xu, Q.; Chen, L.; Lin, X.; et al. Late Pliocene onset of the Cona rift, eastern Himalaya, confirms eastward propagation of extension in Himalayan-Tibetan orogen. Earth Planet. Sci. Lett. 2020, 544, 116383. [Google Scholar] [CrossRef]
- Walker, J.D.; Martin, M.W.; Bowring, S.A.; Searle, M.P.; Waters, D.J.; Hodges, K.V. Metamorphism, Melting, and Extension: Age Constraints from the High Himalayan Slab of Southeast Zanskar and Northwest Lahaul. J. Geol. 1999, 107, 473–495. [Google Scholar] [CrossRef]
- Vannay, J.-C.; Grasemann, B.; Rahn, M.; Frank, W.; Carter, A.; Baudraz, V.; Cosca, M. Miocene to Holocene exhumation of metamorphic crustal wedges in the NW Himalaya: Evidence for tectonic extrusion coupled to fluvial erosion. Tectonics 2004, 23, TC1014. [Google Scholar] [CrossRef]
- Searle, M.P.; Noble, S.R.; Hurford, A.J.; Rex, D.C. Age of crustal melting, emplacement and exhumation history of the Shivling leucogranite, Garhwal Himalaya. Geol. Mag. 1999, 136, 513–525. [Google Scholar] [CrossRef]
- Guillot, S.P.; Hodges, K.; Fort, P.L.; Pecher, A. New constraints on the age of the Manaslu leucogranite: Evidence for episodic tectonic denudation in the central Himalayas. Geology 1994, 22, 559–562. [Google Scholar] [CrossRef]
- Searle, M.P.; Parrish, R.R.; Hodges, K.V.; Hurford, A.; Ayres, M.W.; Whitehouse, M.J. Shisha Pangma Leucogranite, South Tibetan Himalaya: Field Relations, Geochemistry, Age, Origin, and Emplacement. J. Geol. 1997, 105, 295–318. [Google Scholar] [CrossRef]
- Sakai, H.; Sawada, M.; Takigami, Y.; Orihashi, Y.; Danhara, T.; Iwano, H.; Kuwahara, Y.; Dong, Q.; Cai, H.; Li, J. Geology of the summit limestone of Mount Qomolangma (Everest) and cooling history of the Yellow Band under the Qomolangma detachment. Isl. Arc 2005, 14, 297–310. [Google Scholar] [CrossRef]
- Cottle, J.M.; Waters, D.J.; Riley, D.; Beyssac, O.; Jessup, M.J. Metamorphic history of the South Tibetan Detachment System, Mt. Everest region, revealed by RSCM thermometry and phase equilibria modelling. J. Metamorph. Geol. 2011, 29, 561–582. [Google Scholar] [CrossRef]
- Leloup, P.H.; Mahéo, G.; Arnaud, N.; Kali, E.; Boutonnet, E.; Liu, D.; Xiaohan, L.; Haibing, L. The South Tibet detachment shear zone in the Dinggye area: Time constraints on extrusion models of the Himalayas. Earth Planet. Sci. Lett. 2010, 292, 1–16. [Google Scholar] [CrossRef]
- Jessup, M.J.; Cottle, J.M. Progression from South-Directed Extrusion to Orogen-Parallel Extension in the Southern Margin of the Tibetan Plateau, Mount Everest Region, Tibet. J. Geol. 2010, 118, 467–486. [Google Scholar] [CrossRef]
- Gu, D.; Zhang, J.; Lin, C.; Fan, Y.; Feng, L.; Zheng, J. Geochronological and metamorphic constraints on the exhumation of the Ama Drime Massif: Implications for the mid-Miocene evolution of Himalayan extensional structures. Tectonophysics 2022, 836, 229408. [Google Scholar] [CrossRef]
- Kellett, D.A.; Grujic, D.; Coutand, I.; Cottle, J.; Mukul, M. The South Tibetan detachment system facilitates ultra rapid cooling of granulite-facies rocks in Sikkim Himalaya. Tectonics 2013, 32, 252–270. [Google Scholar] [CrossRef]
- Montomoli, C.; Carosi, R.; Rubatto, D.; Visonà, D.; Iaccarino, S. Tectonic activity along the inner margin of the South Tibetan Detachment constrained by syntectonic leucogranite emplacement in Western Bhutan. Ital. J. Geosci. 2017, 136, 5–14. [Google Scholar] [CrossRef]
- Kellett, D.A.; Grujic, D.; Erdmann, S. Miocene structural reorganization of the South Tibetan detachment, eastern Himalaya: Implications for continental collision. Lithosphere 2009, 1, 259–281. [Google Scholar] [CrossRef]
- Kellett, D.A.; Grujic, D.; Warren, C.; Cottle, J.; Jamieson, R.; Tenzin, T. Metamorphic history of a syn-convergent orogen-parallel detachment: The South Tibetan detachment system, Bhutan Himalaya. J. Metamorph. Geol. 2010, 28, 785–808. [Google Scholar] [CrossRef]
- Chambers, J.; Parrish, R.; Argles, T.; Harris, N.; Horstwood, M. A short-duration pulse of ductile normal shear on the outer South Tibetan detachment in Bhutan: Alternating channel flow and critical taper mechanics of the eastern Himalaya. Tectonics 2011, 30, TC2005. [Google Scholar] [CrossRef]
- Maluski, H.; Matte, P.; Brunel, M.; Xiao, X. Argon 39-argon 40 dating of metamorphic and plutonic events in the north and high Himalaya belts (southern Tibet-China). Tectonics 1988, 7, 299–326. [Google Scholar] [CrossRef]
- Grujic, D.; Coutand, I.; Bookhagen, B.; Bonnet, S.P.; Blythe, A.; Duncan, C. Climatic forcing of erosion, landscape, and tectonics in the Bhutan Himalayas. Geology 2006, 34, 801–804. [Google Scholar] [CrossRef]
- Grujic, D.; Warren, C.J.; Wooden, J.L. Rapid synconvergent exhumation of Miocene-aged lower orogenic crust in the eastern Himalaya. Lithosphere 2011, 3, 346–366. [Google Scholar] [CrossRef]
- Warren, C.J.; Grujic, D.; Kellett, D.A.; Cottle, J.; Jamieson, R.A.; Ghalley, K.S. Probing the depths of the India-Asia collision: U-Th-Pb monazite chronology of granulites from NW Bhutan. Tectonics 2011, 30, TC2004. [Google Scholar] [CrossRef]
- Carosi, R.; Lombardo, B.; Molli, G.; Musumeci, G.; Pertusati, P.C. The south Tibetan detachment system in the Rongbuk valley, Everest region. Deformation features and geological implications. J. Asian Earth Sci. 1998, 16, 299–311. [Google Scholar] [CrossRef]
- Cooper, F.J.; Adams, B.A.; Edwards, C.S.; Hodges, K.V. Large normal-sense displacement on the South Tibetan fault system in the eastern Himalaya. Geology 2012, 40, 971–974. [Google Scholar] [CrossRef]
- Liu, Z.-C.; Wu, F.-Y.; Qiu, Z.-L.; Wang, J.-G.; Liu, X.-C.; Ji, W.-Q.; Liu, C.-Z. Leucogranite geochronological constraints on the termination of the South Tibetan Detachment in eastern Himalaya. Tectonophysics 2017, 721, 106–122. [Google Scholar] [CrossRef]
- Stübner, K.; Grujic, D.; Parrish, R.R.; Roberts, N.M.W.; Kronz, A.; Wooden, J.; Ahmad, T. Monazite geochronology unravels the timing of crustal thickening in NW Himalaya. Lithos 2014, 210–211, 111–128. [Google Scholar] [CrossRef]
- Carosi, R.; Montomoli, C.; Rubatto, D.; Visonà, D. Leucogranite intruding the South Tibetan Detachment in western Nepal: Implications for exhumation models in the Himalayas. Terra Nova 2013, 25, 478–489. [Google Scholar] [CrossRef]
- Molnar, P.; Tapponnier, P. Cenozoic Tectonics of Asia: Effects of a Continental Collision. Science 1975, 189, 419–426. [Google Scholar] [CrossRef] [PubMed]
- Taylor, M.; Yin, A. Active structures of the Himalayan-Tibetan orogen and their relationships to earthquake distribution, contemporary strain field, and Cenozoic volcanism. Geosphere 2009, 5, 199–214. [Google Scholar] [CrossRef]
- Nania, L.; Montomoli, C.; Iaccarino, S.; Vincenzo, G.D.; Carosi, R. A thermal event in the Dolpo region (Nepal): A consequence of the shift from orogen perpendicular to orogen parallel extension in central Himalaya? J. Geol. Soc. 2022, 179, jgs2020–jgs2261. [Google Scholar] [CrossRef]
- Gong, J.; Ji, J.; Han, B.; Chen, J.; Sun, D.; Li, B.; Zhou, J.; Tu, J.; Zhong, D. Early subduction–exhumation and late channel flow of the Greater Himalayan Sequence: Implications from the Yadong section in the eastern Himalaya. Int. Geol. Rev. 2012, 54, 1184–1202. [Google Scholar] [CrossRef]
- Wang, A.; Min, K.; Wang, G.; Cao, K.; Shen, T.; Jiang, P.; Wei, J. Slow exhumation of the Greater Himalaya in the Yadong region, the transition between the Central and Eastern Himalaya, during the Late Neogene. J. Geol. Soc. 2019, 176, 1207–1217. [Google Scholar] [CrossRef]
- Dong, H.; Larson, K.P.; Kellett, D.A.; Xu, Z.; Li, G.; Cao, H.; Yi, Z.; Zeng, L. Timing of slip across the South Tibetan detachment system and Yadong–Gulu graben, Eastern Himalaya. J. Geol. Soc. 2020, 178, jgs2019–jgs2197. [Google Scholar] [CrossRef]
- Wagner, G.A.; van den Haute, P. Fission-Track Dating; Kluwer: Alphen aan den Rijn, The Netherlands, 1992. [Google Scholar]
- Bernet, M. A field-based estimate of the zircon fission-track closure temperature. Chem. Geol. 2009, 259, 181–189. [Google Scholar] [CrossRef]
- Wagner, G.A.; Reimer, G.M.; Jäger, E. Cooling Ages Derived by Apatite Fission-Track, Mica Rb-Sr and K-Ar Dating: The Uplift and Cooling History of the Central Alps; Società Cooperativa Tipografica: Padova, Italy, 1977. [Google Scholar]
- Wagner, G.A.; Reimer, G.M. Fission track tectonics: The tectonic interpretation of fission track apatite ages. Earth Planet. Sci. Lett. 1972, 14, 263–268. [Google Scholar] [CrossRef]
- Yin, A.; Harrison, T.M. Geologic Evolution of the Himalayan-Tibetan Orogen. Annu. Rev. Earth Planet. Sci. 2000, 28, 211–280. [Google Scholar] [CrossRef]
- Kellett, D.A.; Cottle, J.M.; Larson, K.P. The South Tibetan Detachment System: History, advances, definition and future directions. Geol. Soc. Lond. Spec. Publ. 2019, 483, 377–400. [Google Scholar] [CrossRef]
- Le Fort, P. Himalayas: The collided range. Present knowledge of the continental arc. Am. J. Sci. 1975, 275, 144. [Google Scholar]
- Searle, M.P.; Law, R.D.; Godin, L.; Larson, K.P.; Streule, M.J.; Cottle, J.M.; Jessup, M.J. Defining the Himalayan Main Central Thrust in Nepal. J. Geol. Soc. 2008, 165, 523–534. [Google Scholar] [CrossRef]
- Allégre, C.J.; Courtillot, V.; Tapponnier, P.; Hirn, A.; Mattauer, M.; Coulon, C.; Jaeger, J.J.; Achache, J.; Schärer, U.; Marcoux, J.; et al. Structure and evolution of the Himalaya–Tibet orogenic belt. Nature 1984, 307, 17–22. [Google Scholar] [CrossRef]
- Long, S.; McQuarrie, N.; Tobgay, T.; Grujic, D.; Hollister, L. Geologic Map of Bhutan. J. Maps 2011, 7, 184–192. [Google Scholar] [CrossRef]
- Kellett, D.A.; Grujic, D. New insight into the South Tibetan detachment system: Not a single progressive deformation. Tectonics 2012, 31, TC2007. [Google Scholar] [CrossRef]
- Searle, M.P.; Simpson, R.L.; Law, R.D.; Parrish, R.R.; Waters, D.J. The structural geometry, metamorphic and magmatic evolution of the Everest massif, High Himalaya of Nepal–South Tibet. J. Geol. Soc. 2003, 160, 345–366. [Google Scholar] [CrossRef]
- Jessup, M.J.; Cottle, J.M.; Searle, M.P.; Law, R.D.; Newell, D.L.; Tracy, R.J.; Waters, D.J. P–T–t–D paths of Everest Series schist, Nepal. J. Metamorph. Geol. 2008, 26, 717–739. [Google Scholar] [CrossRef]
- Law, R.D.; Jessup, M.J.; Searle, M.P.; Francsis, M.K.; Waters, D.J.; Cottle, J.M. Telescoping of isotherms beneath the South Tibetan Detachment System, Mount Everest Massif. J. Struct. Geol. 2011, 33, 1569–1594. [Google Scholar] [CrossRef]
- Leger, R.M.; Webb, A.A.G.; Henry, D.J.; Craig, J.A.; Dubey, P. Metamorphic field gradients across the Himachal Himalaya, northwest India: Implications for the emplacement of the Himalayan crystalline core. Tectonics 2013, 32, 540–557. [Google Scholar] [CrossRef]
- Carosi, R.; Montomoli, C.; Visonà, D. Is there any detachment in the Lower Dolpo (western Nepal)? Comptes Rendus Geosci. 2002, 334, 933–940. [Google Scholar] [CrossRef]
- Montomoli, C.; Iaccarino, S.; Antolin, B.; Appel, E.; Carosi, R.; Dunkl, I.; Lin, D.; Visonà, D. Tectono-metamorphic evolution of the Tethyan Sedimentary Sequence (Himalayas, SE Tibet). Ital. J. Geosci. 2017, 136, 73–88. [Google Scholar] [CrossRef]
- Dunkl, I.; AntolÍn, B.; Wemmer, K.; Rantitsch, G.; Kienast, M.; Montomoli, C.; Ding, L.; Carosi, R.; Appel, E.; Bay, R.E.; et al. Metamorphic evolution of the Tethyan Himalayan flysch in SE Tibet. Geol. Soc. Lond. Spec. Publ. 2011, 353, 45–69. [Google Scholar] [CrossRef]
- Sylvester, P.J. Post-collisional strongly peraluminous granites. Lithos 1998, 45, 29–44. [Google Scholar] [CrossRef]
- Visonà, D.; Lombardo, B. Two-mica and tourmaline leucogranites from the Everest–Makalu region (Nepal–Tibet). Himalayan leucogranite genesis by isobaric heating? Lithos 2002, 62, 125–150. [Google Scholar] [CrossRef]
- Searle, M.P.; Cottle, J.M.; Streule, M.J.; Waters, D.J. Crustal melt granites and migmatites along the Himalaya: Melt source, segregation, transport and granite emplacement mechanisms. Earth Environ. Sci. Trans. R. Soc. Edinb. 2009, 100, 219–233. [Google Scholar] [CrossRef]
- Tapponnier, P.; Mercier, J.L.; Armijo, R.; Tonglin, H.; Ji, Z. Field evidence for active normal faulting in Tibet. Nature 1981, 294, 410–414. [Google Scholar] [CrossRef]
- Guo, X.; Gao, R.; Zhao, J.; Xu, X.; Lu, Z.; Klemperer, S.L.; Liu, H. Deep-seated lithospheric geometry in revealing collapse of the Tibetan Plateau. Earth-Sci. Rev. 2018, 185, 751–762. [Google Scholar] [CrossRef]
- Yan, H.; Long, X.; Li, J.; Wang, Q.; Wang, X.-C.; Wu, B.; Wang, J.; Gou, L. Miocene adakites in south Tibet: Partial melting of the thickened Lhasa juvenile mafic lower crust with the involvement of ancient Indian continental crust compositions. GSA Bull. 2019, 132, 1273–1290. [Google Scholar] [CrossRef]
- Wang, R.; Richards, J.P.; Zhou, L.-M.; Hou, Z.-Q.; Stern, R.A.; Creaser, R.A.; Zhu, J.-J. The role of Indian and Tibetan lithosphere in spatial distribution of Cenozoic magmatism and porphyry Cu–Mo deposits in the Gangdese belt, southern Tibet. Earth-Sci. Rev. 2015, 150, 68–94. [Google Scholar] [CrossRef]
- Ji, J.Q.; Zhong, D.L.; Song, B.; Chu, M.F.; Wen, D.J. Metamorphism, geochemistry and U-Pb zircon SHRIMP geochronology of the high-pressure granulites in the central Greater Himalayas. Acta Petrol. Sin. 2004, 20, 1283–1300. [Google Scholar]
- Bellemans, F.; De Corte, F.; Van, D.; Haute, P. Composition of srm and cn u-doped glasses: Significance for their use as thermal neutron fluence monitors in fission track dating. Radiat. Meas. 1995, 24, 153–160. [Google Scholar] [CrossRef]
- Hurford, A.J.; Green, P.F. The zeta age calibration of fission-track dating. Chem. Geol. 1983, 41, 285–317. [Google Scholar] [CrossRef]
- Hurford, A.J. Standardization of fission track dating calibration: Recommendation by the Fission Track Working Group of the I.U.G.S. Subcommission on Geochronology. Chem. Geol. Isot. Geosci. Sect. 1990, 80, 171–178. [Google Scholar] [CrossRef]
- Braun, J. Pecube: A new finite-element code to solve the 3D heat transport equation including the effects of a time-varying, finite amplitude surface topography. Comput. Geosci. 2003, 29, 787–794. [Google Scholar] [CrossRef]
- Vermeesch, P. RadialPlotter: A Java application for fission track, luminescence and other radial plots. Radiat. Meas. Radiat Meas 2009, 44, 409–410. [Google Scholar] [CrossRef]
- Gleadow, A.J.W.; Duddy, I.R.; Green, P.F.; Lovering, J.F. Confined fission track lengths in apatite: A diagnostic tool for thermal history analysis. Contrib. Mineral. Petrol. 1986, 94, 405–415. [Google Scholar] [CrossRef]
- Su, W.; He, Z.; Zhong, L.; Glorie, S.; Zhong, K.; Jepson, G.; De Grave, J. Late Oligocene—Miocene morpho-tectonic evolution of the central Gangdese batholith constrained by low-temperature thermochronology. Tectonophysics 2022, 840, 229559. [Google Scholar] [CrossRef]
- Thiede, R.C. Tectonic and Climatic Controls on Orogenic Processes: The Northwest Himalaya, India. Ph.D. Thesis, Universität Potsdam, Potsdam, Germany, 2005. [Google Scholar]
- Zeng, L.; Gao, L.-E.; Xie, K.; Liu-Zeng, J. Mid-Eocene high Sr/Y granites in the Northern Himalayan Gneiss Domes: Melting thickened lower continental crust. Earth Planet. Sci. Lett. 2011, 303, 251–266. [Google Scholar] [CrossRef]
- Hou, Z.-Q.; Zheng, Y.-C.; Zeng, L.-S.; Gao, L.-E.; Huang, K.-X.; Li, W.; Li, Q.-Y.; Fu, Q.; Liang, W.; Sun, Q.-Z. Eocene–Oligocene granitoids in southern Tibet: Constraints on crustal anatexis and tectonic evolution of the Himalayan orogen. Earth Planet. Sci. Lett. 2012, 349–350, 38–52. [Google Scholar] [CrossRef]
- Ketcham, R.A.; Carter, A.; Donelick, R.A.; Barbarand, J.; Hurford, A.J. Improved modeling of fission-track annealing in apatite. Am. Mineral. 2007, 92, 799–810. [Google Scholar] [CrossRef]
- Braun, J.; van der Beek, P.; Valla, P.; Robert, X.; Herman, F.; Glotzbach, C.; Pedersen, V.; Perry, C.; Simon-Labric, T.; Prigent, C. Quantifying rates of landscape evolution and tectonic processes by thermochronology and numerical modeling of crustal heat transport using PECUBE. Tectonophysics 2012, 524–525, 1–28. [Google Scholar] [CrossRef]
- Chen, B.; Liu, J.; Kaban, M.K.; Sun, Y.; Chen, C.; Du, J. Elastic thickness, mechanical anisotropy and deformation of the southeastern Tibetan Plateau. Tectonophysics 2014, 637, 45–56. [Google Scholar] [CrossRef]
- Valla, P.G.; Herman, F.; van der Beek, P.A.; Braun, J. Inversion of thermochronological age-elevation profiles to extract independent estimates of denudation and relief history—I: Theory and conceptual model. Earth Planet. Sci. Lett. 2010, 295, 511–522. [Google Scholar] [CrossRef]
- Carrapa, B.; Robert, X.; DeCelles, P.G.; Orme, D.A.; Thomson, S.N.; Schoenbohm, L.M. Asymmetric exhumation of the Mount Everest region: Implications for the tectono-topographic evolution of the Himalaya. Geology 2016, 44, 611–614. [Google Scholar] [CrossRef]
- Naito, N.; Ageta, Y.; Iwata, S.; Matsuda, Y.; Suzuki, R.; Karma; Yabuki, H. Glacier shrinkages and climate conditions around Jichu Dramo Glacier in the Bhutan Himalayas from 1998 to 2003. Bull. Glaciol. Res. 2006, 23, 51–61. [Google Scholar]
- Hodges, K.; Bowring, S.; Davidek, K.; Hawkins, D.; Krol, M. Evidence for rapid displacement on Himalayan normal faults and the importance of tectonic denudation in the evolution of mountain ranges. Geology 1998, 26, 483–486. [Google Scholar] [CrossRef]
- Murphy, M.A.; Mark Harrison, T. Relationship between leucogranites and the Qomolangma detachment in the Rongbuk Valley, south Tibet. Geology 1999, 27, 831–834. [Google Scholar] [CrossRef]
- Simpson, R.L.; Parrish, R.R.; Searle, M.P.; Waters, D.J. Two episodes of monazite crystallization during metamorphism and crustal melting in the Everest region of the Nepalese Himalaya. Geology 2000, 28, 403–406. [Google Scholar] [CrossRef]
- Schultz, M.H.; Hodges, K.V.; Ehlers, T.A.; van Soest, M.; Wartho, J.-A. Thermochronologic constraints on the slip history of the South Tibetan detachment system in the Everest region, southern Tibet. Earth Planet. Sci. Lett. 2017, 459, 105–117. [Google Scholar] [CrossRef]
- Webb, A.A.G.; Guo, H.; Clift, P.D.; Husson, L.; Müller, T.; Costantino, D.; Yin, A.; Xu, Z.; Cao, H.; Wang, Q. The Himalaya in 3D: Slab dynamics controlled mountain building and monsoon intensification. Lithosphere 2017, 9, 637–651. [Google Scholar] [CrossRef]
- He, L. Sedimentary Evolution and Its Tectonic significances of the Pali Basin in Yadong County, Southern Tibet. Master Thesis, China University of Geosciences, Beijing, China, 2018. [Google Scholar]
- Wang, S.; Shen, X.; Chevalier, M.-L.; Replumaz, A.; Zheng, Y.; Li, H.; Pan, J.; Li, K.; Xu, X. Illite K-Ar and (U-Th)/He low-temperature thermochronology reveal onset timing of Yadong-Gulu rift in southern Tibetan Plateau. Front. Earth Sci. 2022, 10, 993796. [Google Scholar] [CrossRef]
- Wolff, R.; Hetzel, R.; Hölzer, K.; Dunkl, I.; Xu, Q.; Anczkiewicz, A.A.; Li, Z. Rift propagation in south Tibet controlled by under-thrusting of India: A case study of the Tangra Yumco graben (south Tibet). J. Geol. Soc. 2023, 180, jgs2022–jgs2090. [Google Scholar] [CrossRef]
- Li, Y.; Li, X.; Wang, C.; Wei, Y.; Chen, X.; He, J.; Xu, M.; Hou, Y. Miocene adakitic intrusions in the Zhongba terrane: Implications for the origin and geochemical variations of post-collisional adakitic rocks in southern Tibet. Gondwana Res. 2017, 41, 65–76. [Google Scholar] [CrossRef]
- Tian, S.-H.; Yang, Z.-S.; Hou, Z.-Q.; Mo, X.-X.; Hu, W.-J.; Zhao, Y.; Zhao, X.-Y. Subduction of the Indian lower crust beneath southern Tibet revealed by the post-collisional potassic and ultrapotassic rocks in SW Tibet. Gondwana Res. 2017, 41, 29–50. [Google Scholar] [CrossRef]
- Liang, X.; Chen, Y.; Tian, X.; Chen, Y.J.; Ni, J.; Gallegos, A.; Klemperer, S.L.; Wang, M.; Xu, T.; Sun, C.; et al. 3D imaging of subducting and fragmenting Indian continental lithosphere beneath southern and central Tibet using body-wave finite-frequency tomography. Earth Planet. Sci. Lett. 2016, 443, 162–175. [Google Scholar] [CrossRef]
- Wang, G.; Wei, W.; Ye, G.; Jin, S.; Jing, J.; Zhang, L.; Dong, H.; Xie, C.; Omisore, B.O.; Guo, Z. 3-D electrical structure across the Yadong-Gulu rift revealed by magnetotelluric data: New insights on the extension of the upper crust and the geometry of the underthrusting Indian lithospheric slab in southern Tibet. Earth Planet. Sci. Lett. 2017, 474, 172–179. [Google Scholar] [CrossRef]
- Hou, Z.; Yang, Z.; Lu, Y.; Kemp, A.; Zheng, Y.; Li, Q.; Tang, J.; Yang, Z.; Duan, L. A genetic linkage between subduction- and collision-related porphyry Cu deposits in continental collision zones. Geology 2015, 43, 247–250. [Google Scholar] [CrossRef]
- Sambridge, M. Geophysical inversion with a neighbourhood algorithm—I. Searching a parameter space. Geophys. J. Int. 1999, 138, 479–494. [Google Scholar] [CrossRef]
- Sambridge, M. Geophysical inversion with a neighbourhood algorithm—II. Appraising the ensemble. Geophys. J. Int. 1999, 138, 727–746. [Google Scholar] [CrossRef]


| Sample No. | Longitude (°) | Latitude (°) | Elevation (m) | N | ρs (105/cm2) (Ns) | ρi (105/cm2) (Ni) | ρd (105/cm2) (N) | P(χ2) (%) | Central Age (Ma) (±1σ) | MTL (μm) |
|---|---|---|---|---|---|---|---|---|---|---|
| AFT result | ||||||||||
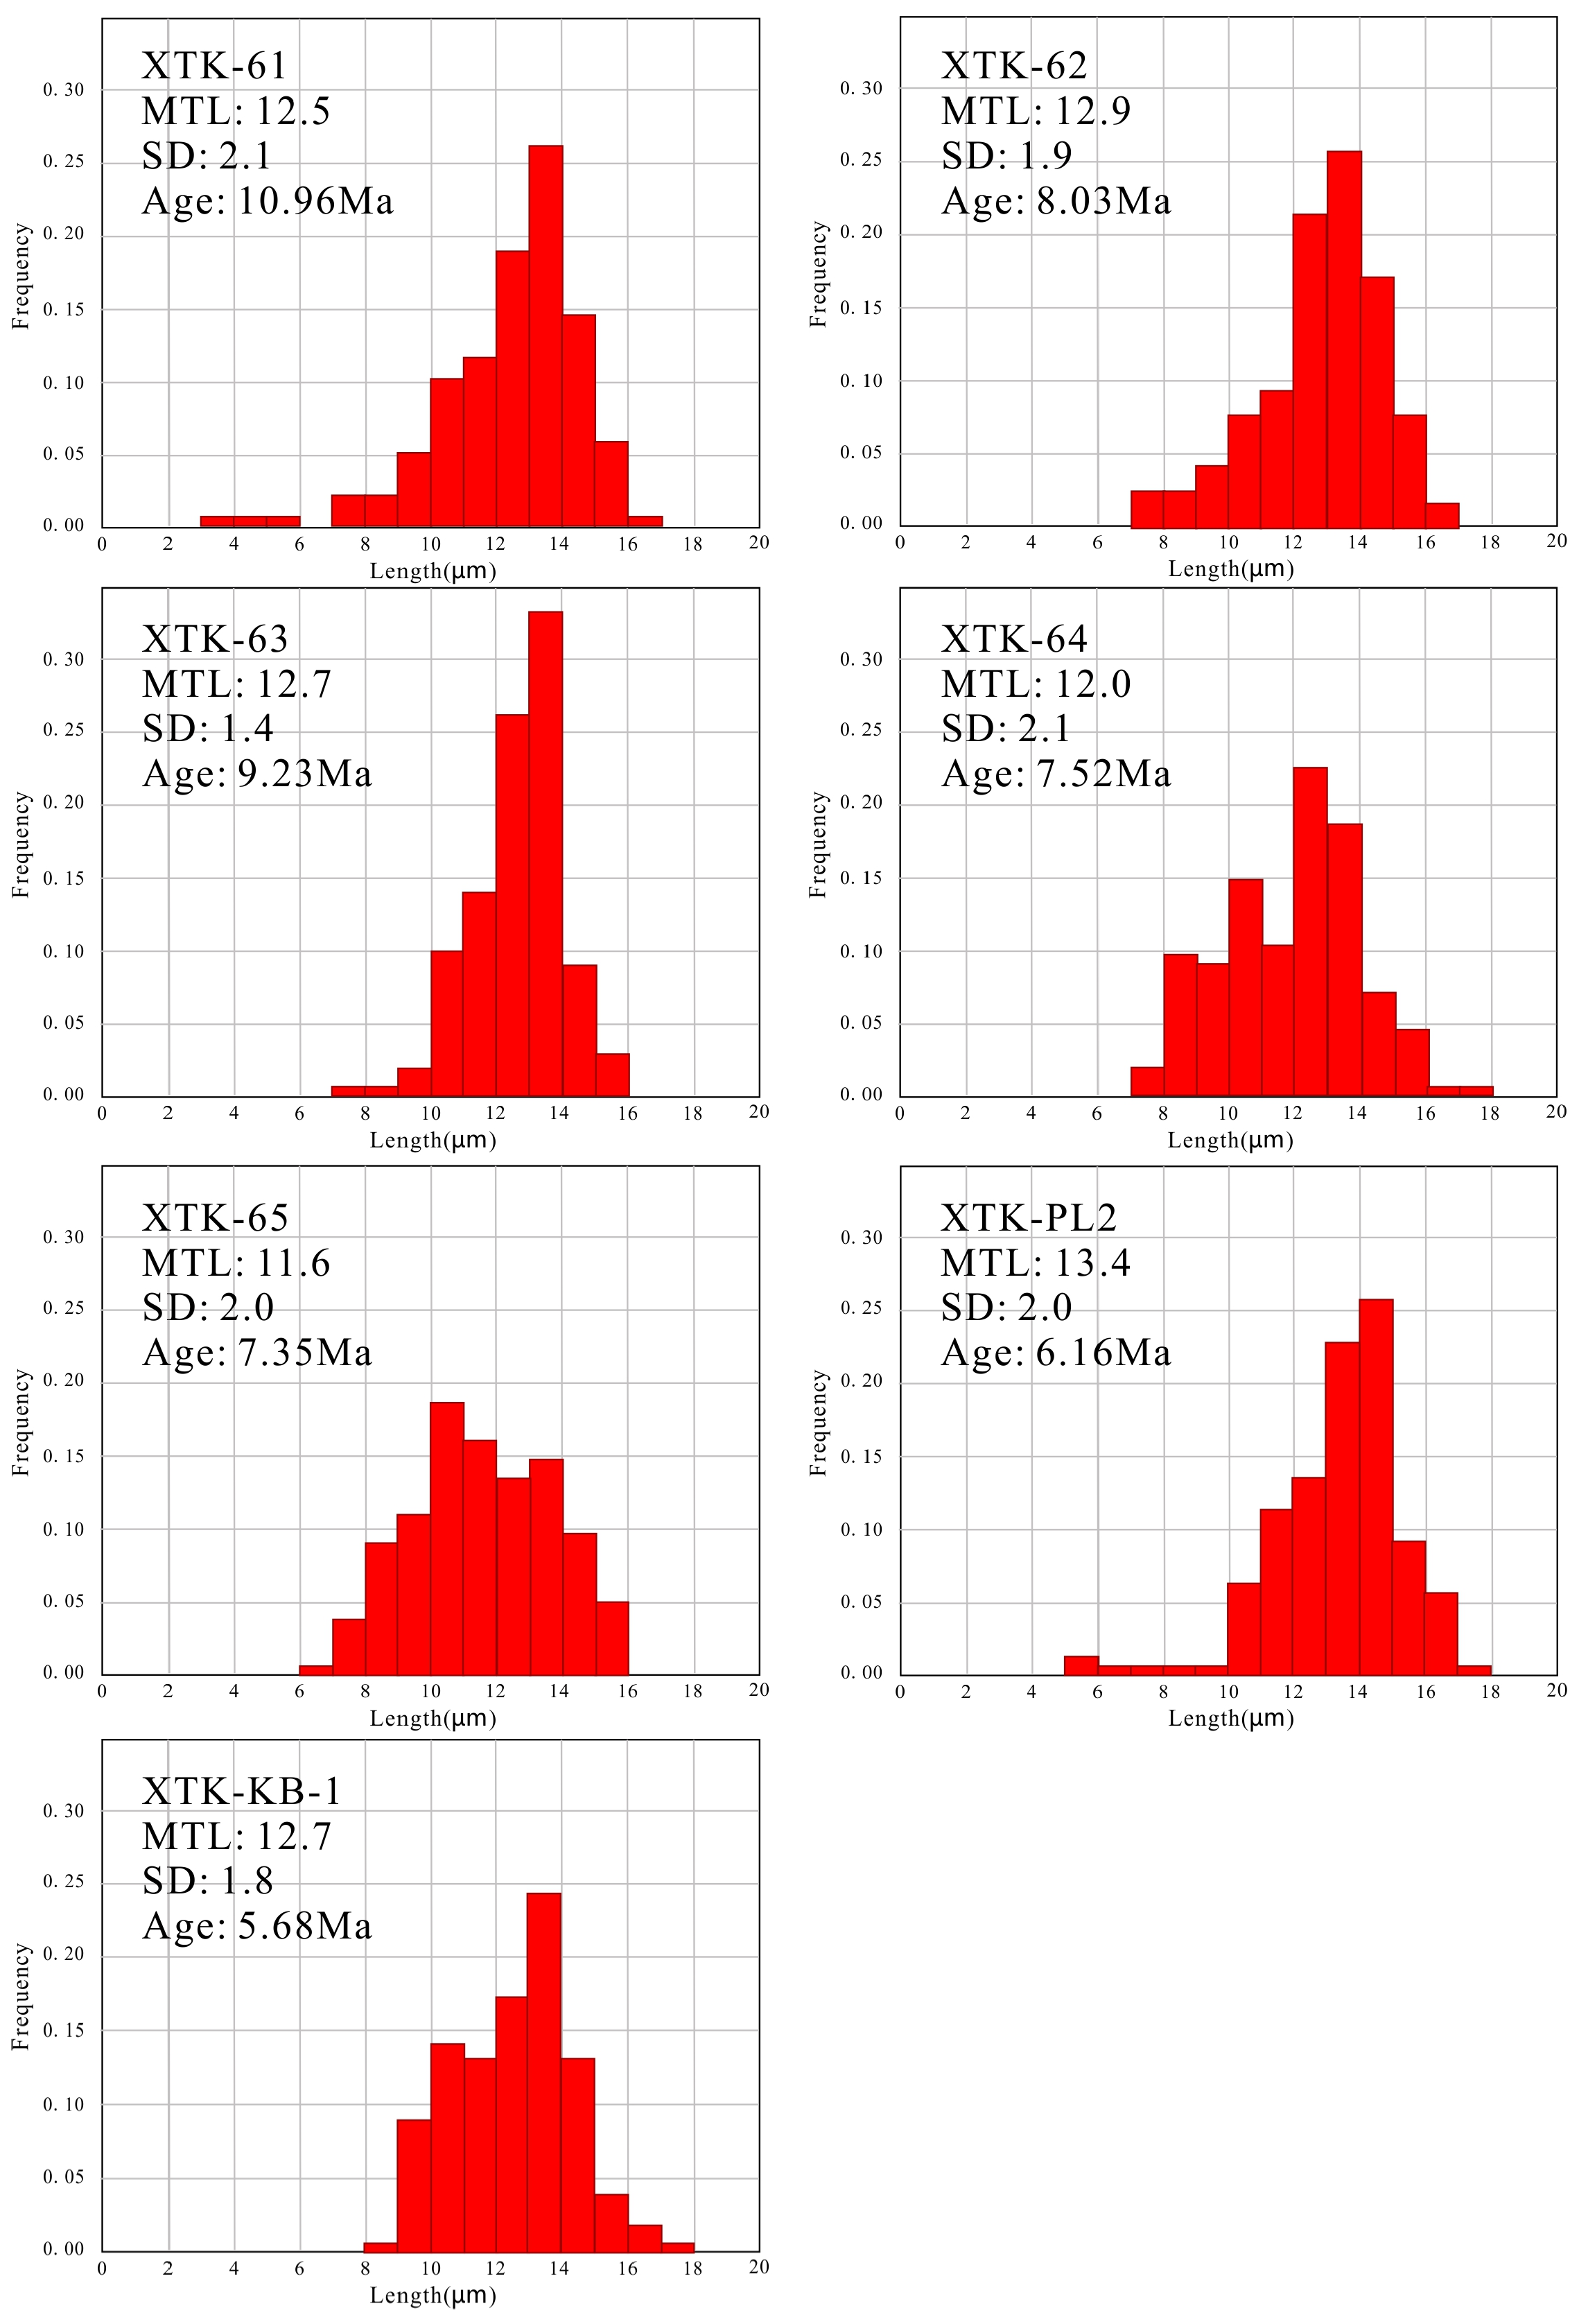
| XTK61 | 89.055 | 27.784 | 4809 | 35 | 3.056 (2041) | 78.109 (52,173) | 14.721 (6630) | 0 | 10.96 ± 0.7 | 12.5 ± 2.1 |
| XTK62 | 89.042 | 27.787 | 4686 | 37 | 1.061 (842) | 40.228 (31,912) | 15.615 (6630) | 25 | 8.03 ± 0.47 | 12.9 ± 1.9 |
| XTK63 | 89.025 | 27.788 | 4581 | 35 | 1.517 (797) | 52.974 (27,828) | 16.509 (6630) | 23 | 9.23 ± 0.56 | 12.7 ± 1.4 |
| XTK64 | 89.012 | 27.791 | 4482 | 34 | 1.187 (679) | 37.476 (21,444) | 12.933 (6630) | 37 | 7.52 ± 0.47 | 12.0 ± 2.1 |
| XTK65 | 89.004 | 27.793 | 4386 | 35 | 1.147 (1067) | 41.445 (38,557) | 13.827 (6630) | 0 | 7.35 ± 0.47 | 11.6 ± 2 |
| XTK-PL2 | 88.997 | 27.795 | 4285 | 35 | 1.193 (867) | 58.429 (42,445) | 15.615 (6630) | 1 | 6.16 ± 0.4 | 13.4 ± 2 |
| XTK-KB1 | 88.974 | 27.757 | 3855 | 35 | 0.619 (478) | 31.321 (24,200) | 14.721 (6630) | 100 | 5.68 ± 0.37 | 12.7 ± 1.8 |
| ZFT result | ||||||||||
| XTK-61 | 89.055 | 27.784 | 4809 | 36 | 31.389 (2777) | 107.517 (9512) | 10.56 (6844) | 0 | 13.57 ± 0.61 | |
| Thermal Parameters | Value | Reference |
|---|---|---|
| Crustal density (kg/m3) | 2700 | [121] |
| Mantle density (kg/m3) | 3200 | [121] |
| Young’s modulus (Pa) | 1.1011 | [121] |
| Poisson ratio | 0.25 | [121] |
| Equivalent elastic thickness(km) | 22.8 | [122] |
| sea level temperature (°C) | 15 | [123] |
| model thickness (km) | 35 | [124] |
| Thermal diffusivity (km2/Myr) | 25 | [121] |
| Atmospheric lapse rate (°C/km) | 6 | [125] |
| Radiogenic heat production (°C/Myr) | 9 | [121] |
| Model Name | YD01 | YD02 | YD03 | YD04 | YD05 |
|---|---|---|---|---|---|
| Best misfit | 4.99 | 4.06 | 4.91 | 4.06 | 4.18 |
| Tb (°C) | 947 (900:1200) | 904 (900:1200) | 1125 (900:1200) | 1077 (900:1200) | 1038 (900:1200) |
| Topographic evolution | nil | nil | nil | nil | 0.1/5 |
| Exhumation stage | 3 | 4 | 4 | 5 | 5 |
| Stage 1 (Ma) | 16–11 | 16–11 | 16–12.1 | 16–12.3 | 16–15.1 |
| E 1 (km/Myr) | 1.46 | 1.25 | 0.98 | 1.61 | 3.77 |
| Stage 2 (Ma) | 11–6.2 | 11–6.2 | 12.1–11 | 12.3–11 | 15.1–11 |
| E 2 (km/Myr) | 0.47 | 0.49 | 0.33 | 1.79 | 0.89 |
| Stage 3 (Ma) | 6.2–0 | 6.2–5 | 11–6.2 | 11–6.2 | 11–6.2 |
| E 3 (km/Myr) | 0.6 | 2.9 | 0.34 | 0.17 | 0.39 |
| Stage 4 (Ma) | nil | 5–0 | 6.2–0 | 6.2–4.7 | 6.2–5.7 |
| E 4 (km/Myr) | nil | 0.29 | 0.1 | 2.52 | 1.77 |
| Stage5 (Ma) | nil | nil | nil | 4.7–0 | 5.7–0 |
| E 5 (km/Myr) | nil | nil | nil | 0.28 | 1.11 |
Disclaimer/Publisher’s Note: The statements, opinions and data contained in all publications are solely those of the individual author(s) and contributor(s) and not of MDPI and/or the editor(s). MDPI and/or the editor(s) disclaim responsibility for any injury to people or property resulting from any ideas, methods, instructions or products referred to in the content. |
© 2024 by the authors. Licensee MDPI, Basel, Switzerland. This article is an open access article distributed under the terms and conditions of the Creative Commons Attribution (CC BY) license (https://creativecommons.org/licenses/by/4.0/).
Share and Cite
Xu, T.; Li, Y.; Stuart, F.M.; Ma, Z.; Bi, W.; Jia, Y.; Yang, B. Assessing the Activity of Eastern Himalayan Extensional Structures: Evidence from Low-Temperature Thermochronology of Granitic Rocks from Yadong. Minerals 2024, 14, 66. https://doi.org/10.3390/min14010066
Xu T, Li Y, Stuart FM, Ma Z, Bi W, Jia Y, Yang B. Assessing the Activity of Eastern Himalayan Extensional Structures: Evidence from Low-Temperature Thermochronology of Granitic Rocks from Yadong. Minerals. 2024; 14(1):66. https://doi.org/10.3390/min14010066
Chicago/Turabian StyleXu, Tiankun, Yalin Li, Finlay M. Stuart, Zining Ma, Wenjun Bi, Yongyong Jia, and Bo Yang. 2024. "Assessing the Activity of Eastern Himalayan Extensional Structures: Evidence from Low-Temperature Thermochronology of Granitic Rocks from Yadong" Minerals 14, no. 1: 66. https://doi.org/10.3390/min14010066
APA StyleXu, T., Li, Y., Stuart, F. M., Ma, Z., Bi, W., Jia, Y., & Yang, B. (2024). Assessing the Activity of Eastern Himalayan Extensional Structures: Evidence from Low-Temperature Thermochronology of Granitic Rocks from Yadong. Minerals, 14(1), 66. https://doi.org/10.3390/min14010066