Article

Two-Dimensional Hydration and Triple-Interlayer Lattice Structures in Sulfate-Intercalated Graphene Oxide Nanosheets

1
Ceramic Total Solution Center, Korea Institute of Ceramic Engineering and Technology (KICET), Jinju 52851, Republic of Korea
2
Graphene Research Lab., CRESIN Co., Ltd., Seongju 40040, Republic of Korea
*
Author to whom correspondence should be addressed.
These authors contributed equally to this work.
Minerals 2024, 14(10), 1030; https://doi.org/10.3390/min14101030
Submission received: 19 September 2024 / Revised: 8 October 2024 / Accepted: 11 October 2024 / Published: 14 October 2024
(This article belongs to the Special Issue Graphite Minerals and Graphene, 2nd Edition)

Abstract

:
Sulfate anions (SO42−) are pivotal in various scientific and industrial domains, including mineralogy, biology, and materials science. While extensive research has elucidated sulfate hydration in bulk solids, liquids, and gaseous clusters, a significant gap persists in understanding sulfate interactions within two-dimensional materials, particularly graphene oxide (GO) nanosheets. This study investigates the intricate hydration phenomena and novel triple-interlayer lattice configurations that emerge from sulfate intercalation in GO nanosheets. Utilizing a straightforward methodology for obtaining precise X-ray measurements of confined nanospaces, we analyzed the temperature-dependent behavior and structural characteristics of these systems. Our findings reveal how sulfate ions modulate interlayer spacing, the dynamics of GO layers, and phase transitions. This research offers an atomic-scale understanding of hybrid hydration behaviors within confined SO4-H2O nano-environments, advancing our knowledge of sulfate interactions in two-dimensional materials.

1. Introduction

Sulfate anions (SO42−) and hydrated sulfate minerals are abundant on Mars [1,2] and play significant roles in various geological and biological processes on Earth [3,4,5,6,7]. These anions are essential components of the sulfur cycle (organic sulfide–sulfide–sulfur–sulfate) [8,9], and their hydration states serve as critical links connecting geological and biological systems. More than 100 sulfate minerals exist, including hydrous sulfates like gypsum (CaSO4·2H2O) and anhydrous sulfates such as anhydrite (CaSO4) and barite (BaSO4) [3,4,5,6,7]. These minerals have substantial industrial applications, particularly in construction materials [5,6,7]. In biological systems, sulfates are crucial for protein solvation, as described by the Hofmeister series, and are vital for the synthesis of amino acids and coenzymes essential for cellular functions and enzymatic activities [10,11].
Graphite can lead to sulfide-rich schists, influencing the formation of metal sulfides [12,13]. The interaction between graphite and sulfates is particularly important for material applications, driven by phenomena such as graphite intercalation and oxidation [14,15,16,17]. A fundamental aspect of sulfate chemistry is the ability of sulfate anions to hydrate in water, forming complexes capable of establishing up to two hydrogen bonds per oxygen atom [18,19,20,21,22,23,24,25,26,27,28]. In aqueous environments, water molecules engage in hydrogen bonding with sulfate ions, requiring multi-cell structures to effectively neutralize the strong localized charge. Spectroscopic and theoretical models have provided valuable insights into sulfate behavior in various hydrated states (SO42−(H2O)n, where n = 3, 6, 12, 24, 36, 39), elucidating aspects such as Coulomb interactions, hydrogen bonding, and cluster stability [18,19,20,21,22,23,24,25,26,27,28]. While significant progress has been made in understanding sulfate hydration in solid, liquid, and gaseous clusters, the interactions of sulfate anions within confined nanoscopic environments remain underexplored.
Graphene oxide (GO), produced through the acidic oxidation of graphite, is a layered material characterized by carbon basal planes interspersed with oxygen-containing functional groups, including carboxyl (–COOH), hydroxyl (–OH), and epoxide (–O–) groups [29,30,31,32,33,34]. In aqueous dispersions, GO forms a network of hydrogen bonds with surrounding water molecules [20,21]. Semi-dried GO nanosheets and films exhibit a sandwich-like arrangement with alternating layers of liquid-phase water and solid-phase GO, making them of significant interest for applications in liquid crystals, electrochemistry, and energy conversion [18,35,36,37].
Despite advancements in understanding the individual hydration behaviors of sulfate anions and GO, the interplay between sulfate hydration and GO nanosheets remains insufficiently characterized. This study aims to address this gap by investigating the hybrid hydration dynamics of sulfate anions intercalated within GO nanosheets. Our research reveals the formation of novel triple-interlayer lattice structures within sulfate-intercalated GO (s-GO) and provides detailed measurements of the two-dimensional interlayer nanospaces. These findings enhance our understanding of the transition from zero-dimensional gaseous clusters to bulk hydration states and offer new perspectives on hybrid hydration phenomena in confined nanoscopic environments.

2. Materials and Methods

2.1. Preparation of GO and s-GO

GO was synthesized using a modified Hummers’ method [38,39]. High-purity graphite powder (99.9995%, 325 mesh, Alfa, Holbrook, NY, USA) was oxidized in a mixture of concentrated sulfuric acid (95.0%, JUNSEI, Tokyo, Japan), sodium nitrate (99%, Aldrich, St. Louis, MO, USA), and potassium permanganate (99%, Aldrich). Initially, the graphite powder was combined with concentrated sulfuric acid and subjected to stepwise oxidation. The resulting GO dispersion was then centrifuged at 10,000 rpm to separate the GO from the reaction mixture. The supernatant was discarded, and the crude GO was sequentially washed with a 3% sulfuric acid solution and a 0.5% hydrogen peroxide solution (30%, Aldrich), followed by multiple washes with deionized water to remove residual acids and reagents. For sulfate intercalation, the GO was washed five times to yield sample GOI and twelve times to yield sample GOII.

2.2. Sample Preparation for Characterization

Structural and morphological characterizations were conducted using X-ray diffraction (XRD; BRUKER, D8 ADVANCE), field-emission scanning electron microscopy (FE-SEM; HELLIOS Nanolab), and field-emission transmission electron microscopy (FE-TEM; JEOL, JSM 6700F). The distribution of lateral sizes of the produced GO was measured using a particle size analyzer (CILAS, 1090). Fourier transform infrared spectroscopy (FT-IR; Thermo Scientific, Nicolet iN10 MX, Waltham, MA, USA) was employed to analyze the functional groups present in GO, sulfate anions, and hydrated water. To enhance conductivity during field-emission scanning electron microscopy (FE-SEM) observations, a Pt coating was applied. The samples were further characterized using thermogravimetric analysis (TGA; Hitachi High-Tech, STA200RV, Tokyo, Japan; maximum temperature: 200 °C; heating rate: 5 °C/min; N2 flow: 20 mL/min) and derivative thermogravimetry (DTG). For X-ray diffraction (XRD) analysis, GO slurries were prepared by dispersing the GO samples in deionized water. The slurries were drop-coated onto amorphous glass substrates and subjected to vacuum drying at various temperatures (50, 100, and 200 °C) for 10 h. This controlled drying process allowed us to investigate the impact of thermal conditions on intercalated water molecules and structural modifications in GO and s-GO. XRD measurements were calibrated using a certified corundum alumina standard (NIST SRM 1976b), with cell parameters of a = 4.759 136 Å and c = 12.993 372 Å. XRD peaks of GO and s-GO structures were fitted with a Lorentzian function using Cu Kα1 (1.54059 Å) radiation, excluding the Kα2 component (Bruker, TOPAS-64 V6 software, Billerica, MA, USA). Quantitative phase analysis was performed using an integrated intensity method (Qphase) [40,41], which was used to assess specific hkl peaks of each phase, incorporating structural factors, multiplicity factors of Miller indices, and scattering factors of atomic coordinates.
Quantifying the carbon, oxygen, and hydrogen content in organic compounds, particularly when associated with water, presents significant challenges and can lead to substantial errors in elemental analysis. Additionally, isolating pure graphene oxide (GO) while accurately determining its composition through drying and heat treatment is problematic due to the overlapping desorption temperatures of water molecules—which are strongly hydrogen-bonded to oxidized groups—and carboxyl groups, which have lower thermal stability [38,39]. To overcome these challenges, we utilized energy-dispersive X-ray spectroscopy (EDS) for the relative quantification of carbon, oxygen, and sulfur, intentionally excluding hydrogen to avoid inaccuracies. To mitigate issues related to sample morphology, thickness, and depth, thin films of the samples were prepared and subjected to controlled vacuum heat treatment. This approach enhances the precision of elemental analysis, facilitating accurate relative comparisons of carbon, oxygen, and sulfur concentrations while minimizing the impact of hydration states and other extraneous factors.

3. Results and Discussion

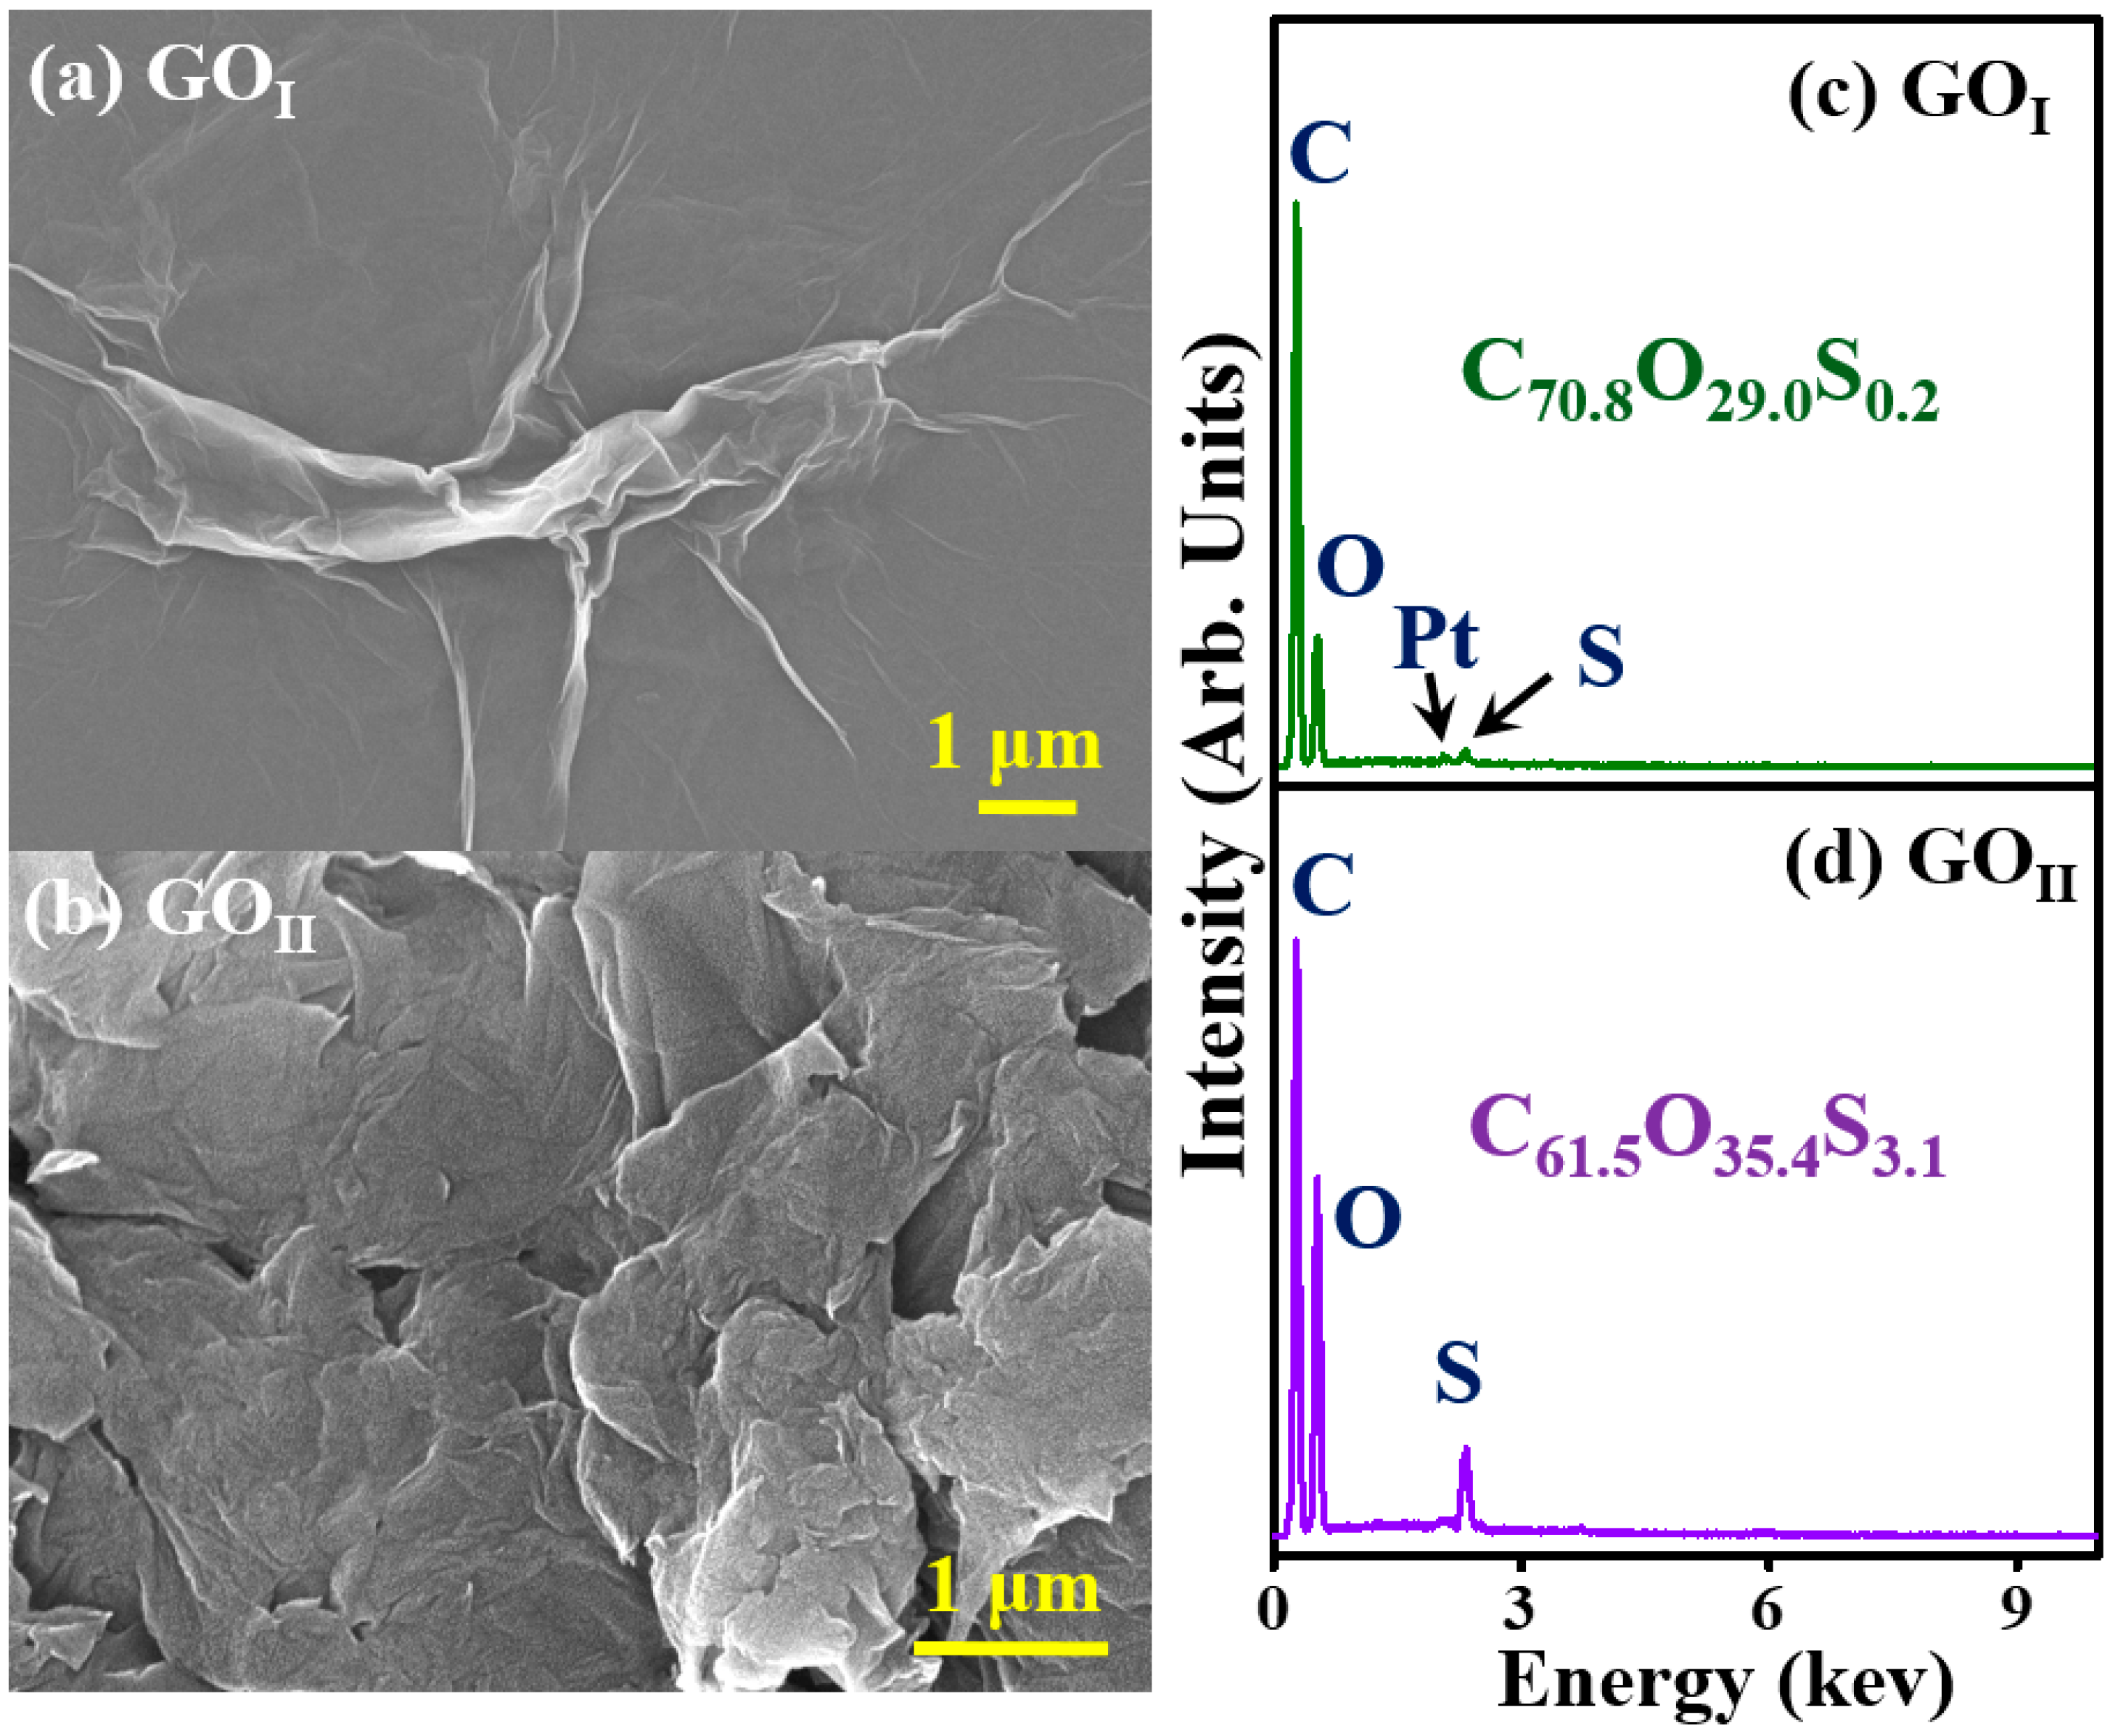
3.1. Morphology and Composition of GOI and GOII

Figure 1a,b present FE-SEM images of GOI and GOII, respectively. The surface of GOI exhibits partial wrinkling [38,39], suggesting a well-preserved two-dimensional (2D) structure that remains uniformly distributed. In contrast, GOII demonstrates significant roughness and pronounced agglomeration. The EDS results (Figure 1c,d) reveal that the molar compositions of GOI and GOII are C70.8O29.0S0.2 and C61.5O35.4S3.1, respectively. The sulfur detected in GO can be attributed to functional groups such as sulfonyl acids and cyclic sulfates [16], as well as solvated SO42− ions [30]. The substantial decrease in sulfur content from 3.1% in GOII to 0.2% in GOI upon increasing washing with deionized water suggests that the sulfur in GOII primarily originates from soluble SO42− ions. Assuming that this sulfur is predominantly from sulfate ions, the molar compositions of GOI and GOII (except on hydrogen and water) are expressed as C71.4O28.4(SO4)0.2 and C70.2O26.3(SO4)3.5, respectively. These compositions correspond to the weight percentages of C64.4O34.2(SO4)1.4 and C52.7O26.3(SO4)21.0.
Figure 2a,b display the lateral size distributions of GOI and GOII, respectively, both of which exhibit binodal size distributions. This phenomenon reflects size reduction during the extensive oxidation of graphite, facilitating the formation of oxygen functional groups and subsequent exfoliation. The size range of GOII (600–800 nm and 3400–4800 nm) is slightly smaller than that of GOI (700–900 nm and 3500–5300 nm). Figure 2c,d present FE-TEM images of GOI and GOII, revealing their characteristic morphologies: a flatly spread state for GOI and a heavily aggregated state for GOII. This transition suggests that individual 2D GO particles experience slight shrinkage in solution, subsequently leading to severe aggregation in their powder states.
Despite the relatively low molar sulfur fraction (3.1%), the substantial weight percentage of intercalated sulfate anions (21.0%) significantly impacts both surface morphology and interlayer lattice structure. FE-TEM and FE-SEM analyses indicated that the presence of sulfur in GOII promotes a transformation from a relatively flat 2D surface to one characterized by severe roughening and aggregation.

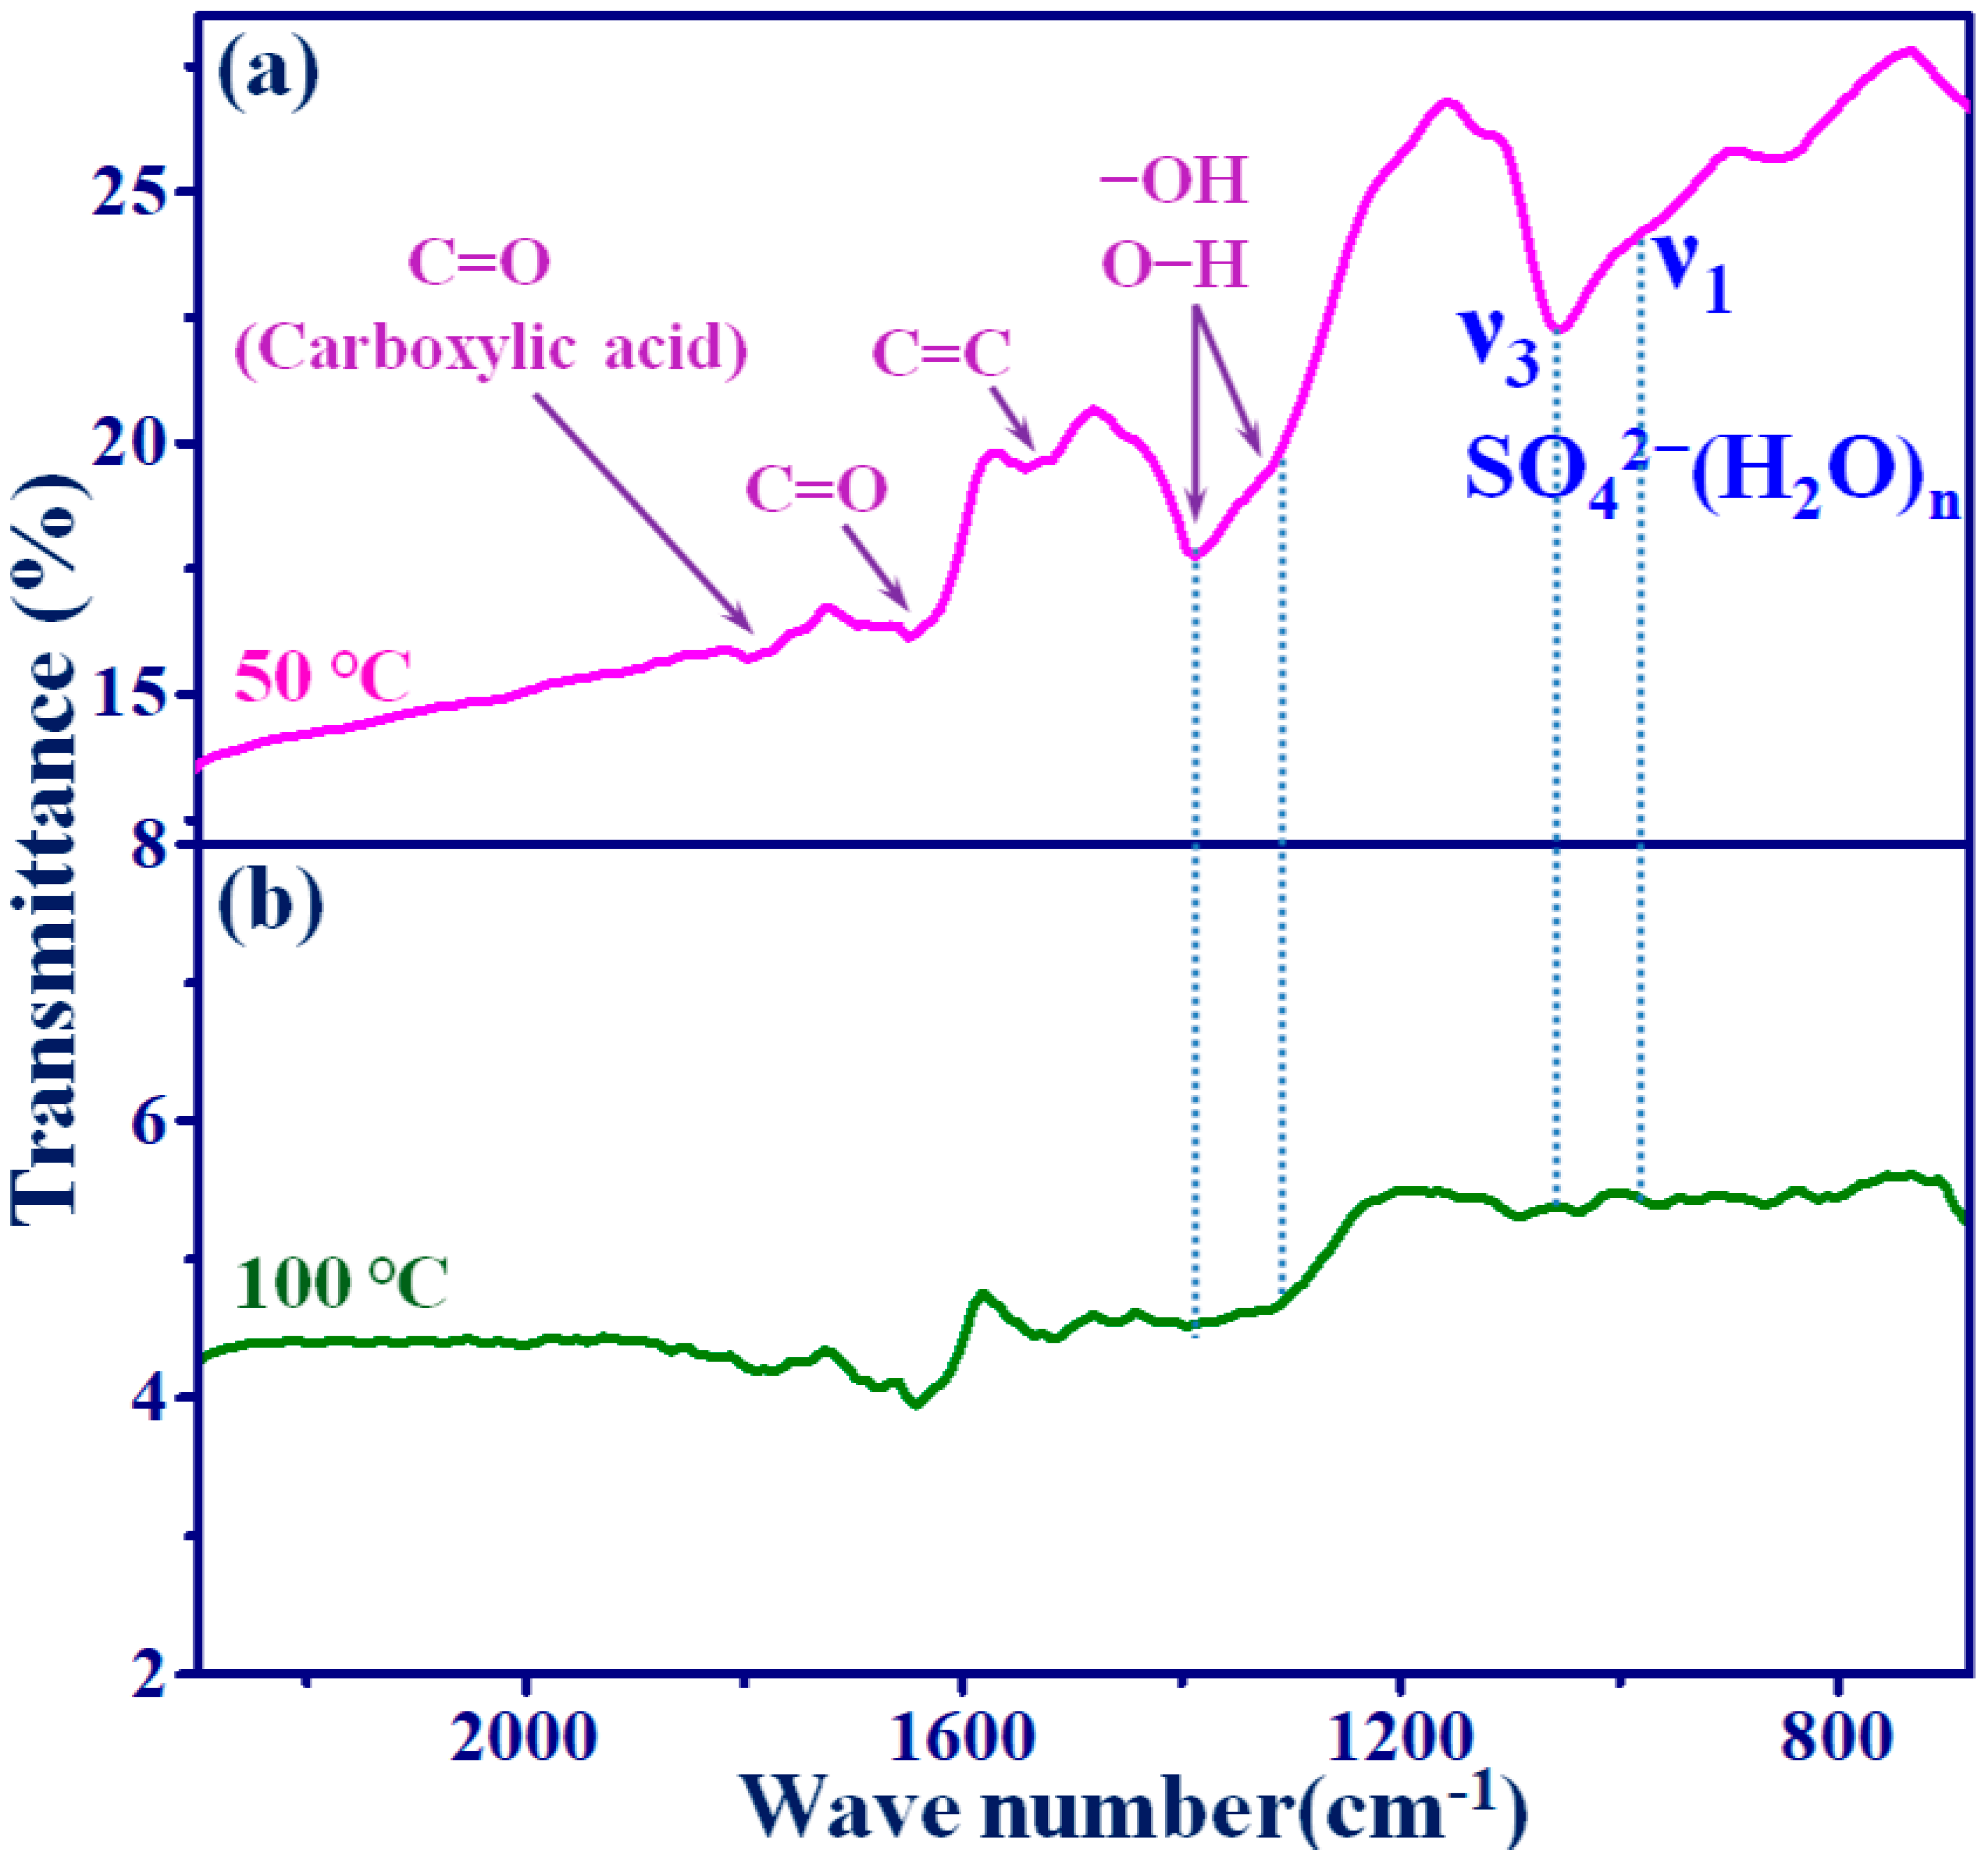
3.2. FT-IR Analysis of GOI and GOII

Figure 3a presents the FT-IR spectrum of the product subjected to thermal treatment at 50 °C (s-GO50). This spectrum reveals characteristic absorption bands associated with oxygen-containing function groups and sulfate anions presents in the s-GO nanosheets. Prominent peaks include those around 1780, 1650, and 1530 cm−1, corresponding to C=O stretching vibrations of carboxylic acids, ketones, and C=C bonds, respectively, typical of pure graphene oxide [33,34,38,39]. Additionally, the peaks at approximately 976 cm−11) and1060 cm−13) were attributed to the S–O stretching modes of sulfate anions [42,43]. While the ν1 and ν3 modes are known to correlate with the number of H2O molecules in gas-phase sulfate hydration clusters [18,19,20,21,22,23,24,25,26,27,28], in this study, a direct relationship with water molecules remains unestablished. Instead, subsequent measurements of interlayer nanospace in GO will help in proposing a model for water molecule binding. Figure 3b shows the FT-IR spectrum of s-GO nanosheets after undergoing thermal annealing at 100 °C (s-GO100). The spectrum reveals a marked reduction in the intensity of the broad hydroxyl peak centered around 1300–1390 cm−1, attributed to –OH and O–H groups. Concurrently, there is a notable decrease in the intensity of the sulfate-related peaks, indicating a significant loss of water molecules associated with the sulfate anions [18,19,20,21,22,23,24,25,26,27,28]. The diminished sulfate peak intensity further corroborates the decrease in the hydration shell of the sulfate anions. These observations underscore the impact of thermal treatment on the hydration dynamics and structural integrity of the 2D s-GO nanosheets, demonstrating the changes in hydration kinetics and structural properties induced by heat.

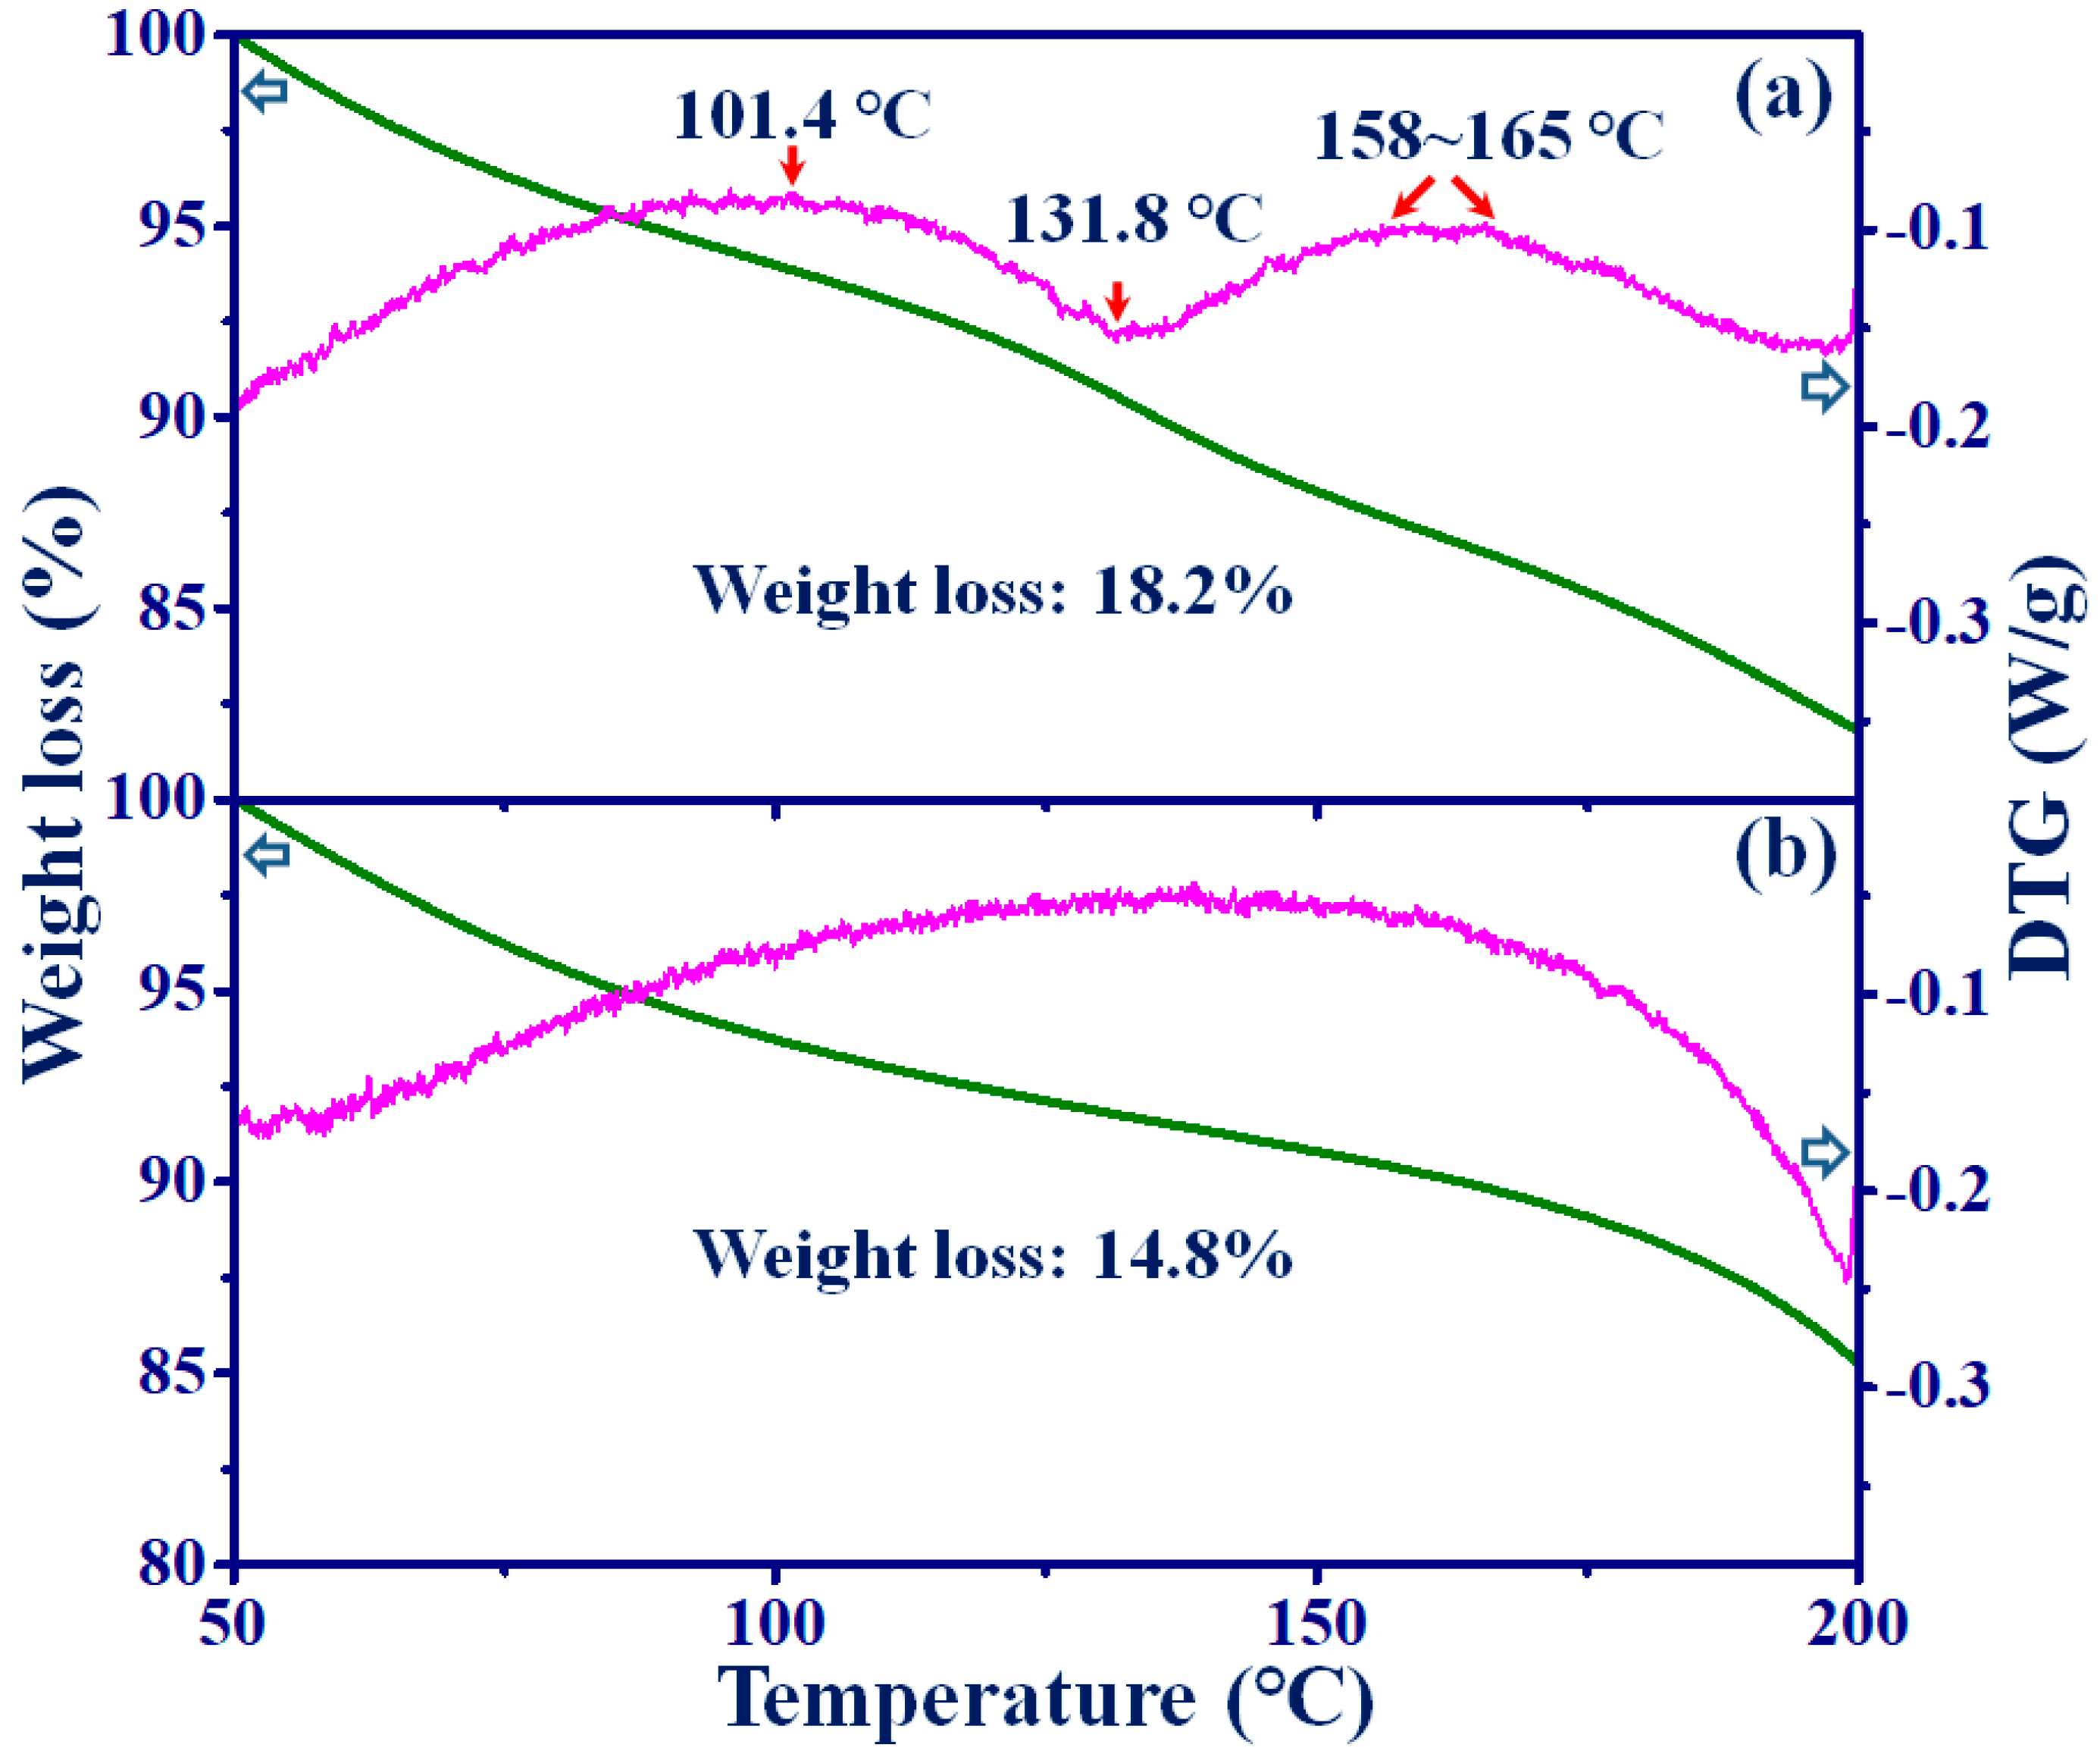
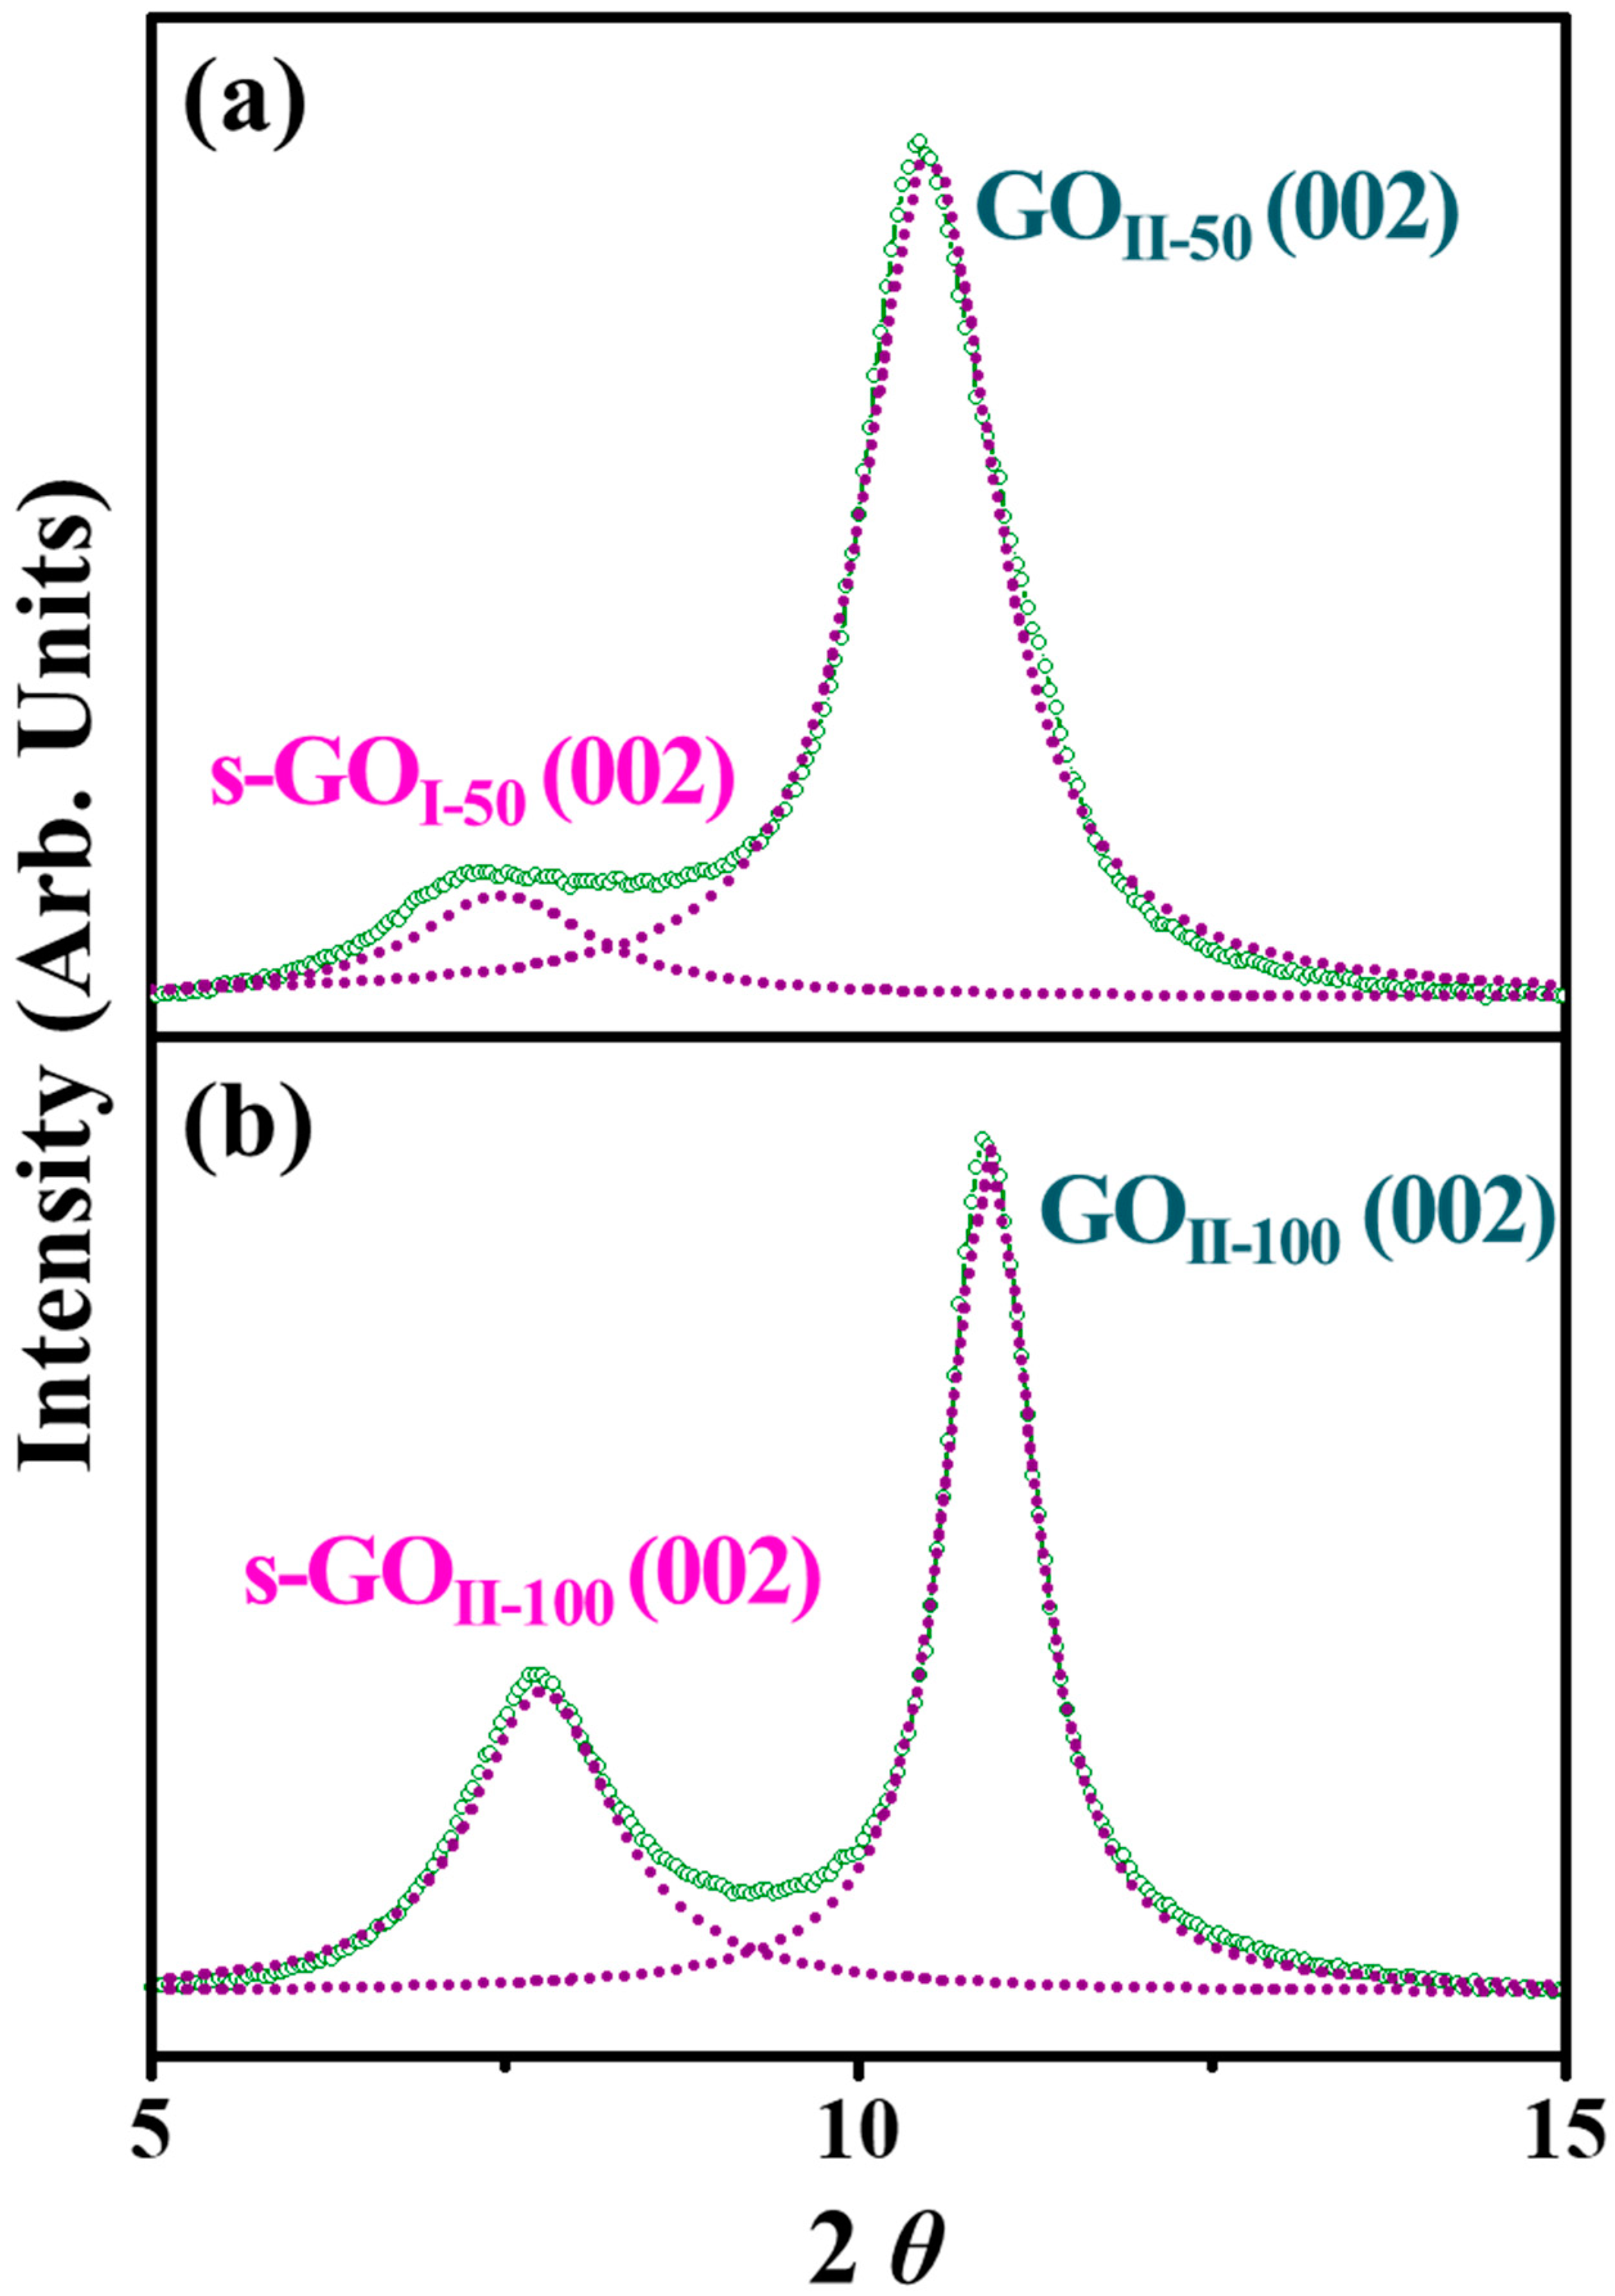
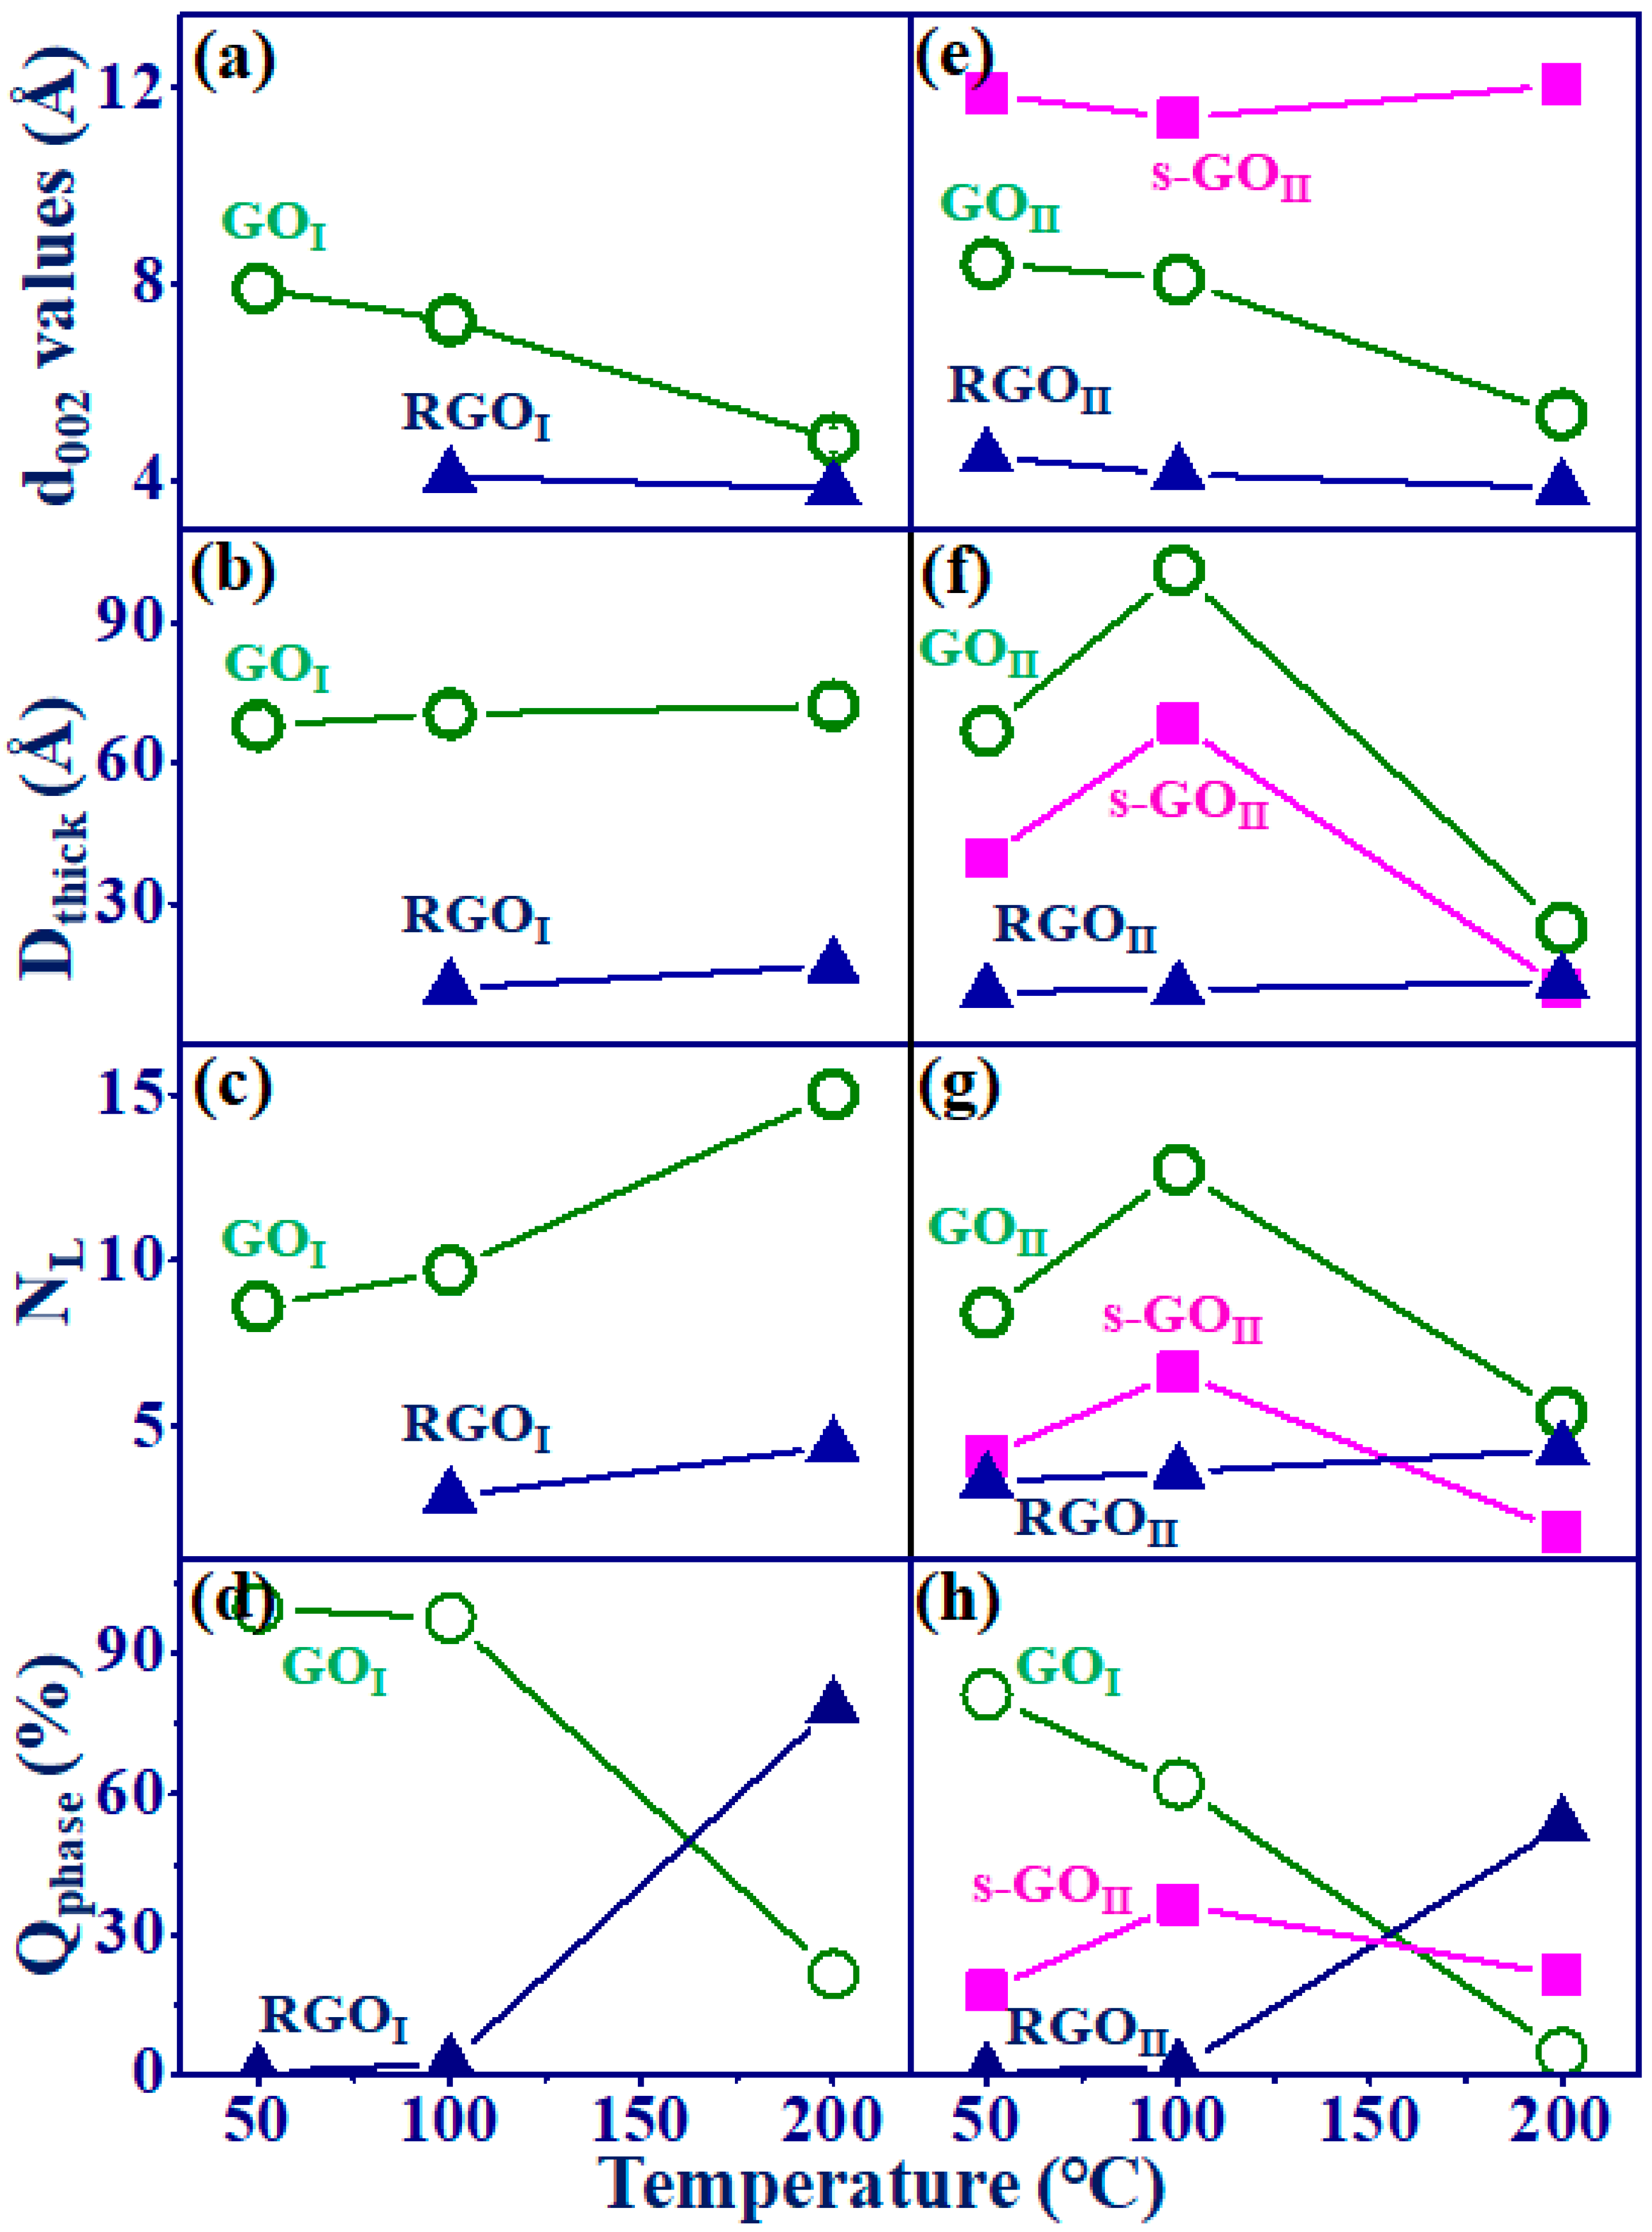
3.3. TGA and XRD Analysis

Figure 4 shows the TGA/DTG curves of GOI (a) and GOII (d) over the temperature range of 50–200 °C. The TGA curves reveal weight losses of 18.2% for GOI and 14.8% for GOII. Notably, the DTG curve of GOI exhibits three inflection points: two maxima at 101.4 °C and 158–165 °C and one minimum at 131.8 °C. In contrast, GOII displays a smooth curve that gradually increases before decreasing. These observations suggest that the temperature of 101.4 °C corresponds to the evaporation of intercalated free water, while 131.8 °C marks the onset of the evaporation of hydrogen-bonded water molecules. The range of 158–165 °C indicates the simultaneous evaporation of hydrogen-bonded H2O and the partial thermal reduction of carboxylic acids (150~200 °C). The different thermal behavior of GOII compared to GOI can be attributed to the suppression of water evaporation resulting from the strong hydrogen bonding of sulfate ions. The 3.4%-lower weight loss observed in GOII relative to GOI can be ascribed to the higher critical temperature for water evaporation due to the strong hydrogen-bonding effects of sulfate ions.
Figure 5 displays the XRD patterns of GOI (a–c) and GOII (d–f) at temperatures of 50, 100, and 200 °C. For GOI, two series of peaks can be observed: (1) GOI-50 → GOI-100 → GOI-200 (a–c) and (2) reduced graphene oxide (RGO) and RGOI-100 → RGOI-200 (b,c). For GOII, three series of peaks can be noted: (1) GOII-50 → GOII-100 → GOII-200 (d–f), (2) RGOII-50 → RGOII-100 → RGOII-200 (d–f), and (3) s-GOII-50 → s-GOII-100 → s-GOII-200 (d–f). The (002) peaks for GOI and GOII shift to higher 2θ values with an increase in temperature and transform into broad RGO (200) peaks at 200 °C (Figure 5c,f). It has been reported that free water vaporizes below 100–140 °C, while most H2O molecules tightly bound to oxygen functional groups are removed between 140 and 170 °C [33,34,39]. Based on the results presented in Figure 4 and the literature, the shift and transformation to reduced graphene oxide (RGO) can be attributed to the vaporization of intercalated water between 50 and 130–150 °C, as well as the partial removal of carboxylic acid groups above 150–200 °C [34,35,40]. Consequently, Figure 5c,f exhibit the coexistence of pure GO and partially reduced RGO. Notably, Figure 5d,e reveal the simultaneous presence of GOII and s-GOII. Lorentzian peak fitting (Figure 6) indicates that both GOII and s-GOII exhibit symmetric (002) peaks and significantly good crystallinity. The co-occurrence of these two graphene oxides with high crystallinity is an unusual observation.
XRD analysis provides critical insights into the crystalline structure and temperature-dependent variations in the (002) planes of GO. The Lorentzian fitting of XRD peaks yields key parameters, including the 2θ value, d002 spacing, the full width at half maximum (FWHM), crystallite thickness (Dthick), and phase quantity (Qphase). The number of layers (NL) of GO and RGO was calculated using the following equation: NL = Dthick/d002 [39,40]. These parameters are illustrated in Figure 7 and summarized in Table 1. As the temperature increased, single-phase GO with a composition of C70.8O29.0S0.2 gradually transitioned into a new phase of RGOI between 100 and 200 °C. This phase transition was characterized by lattice contraction (Figure 7a), increased layer growth (Figure 7b,c), and a reduction in phase quantity (Figure 7d). The observed lattice contraction and increase in NL for both GO and RGOI phases are attributed to annealing effects, including the removal of free water and oxygen functional groups. At 50 °C, the multiphase GO with a composition C61.5O35.4S3.1 consists of three phases: GOII, s-GO, and RGOII. The d002 values for s-GOII (11.382–11.880 Å) are consistently larger than those for GOI (7.253–7.904 Å) and GOII (8.095–8.420 Å), indicating that the s-GOII structure is significantly influenced by the intercalated sulfate anions. Between 50 and 100 °C, the d002 values, Dthick, NL, and Qphase for GOII, s-GO, and RGOII (Figure 7e–h) exhibit trends similar to those observed for GOI and RGOI. However, from 100 and 200 °C, the Dthick and NL for GOII, as well as the d002, Dthick, NL, and Qphase for s-GO, show a decreasing trend. This indicates a close structural relationship between GO and s-GO, with sulfate ions playing a significant role in modulating the GO layered structure as the temperature increases.

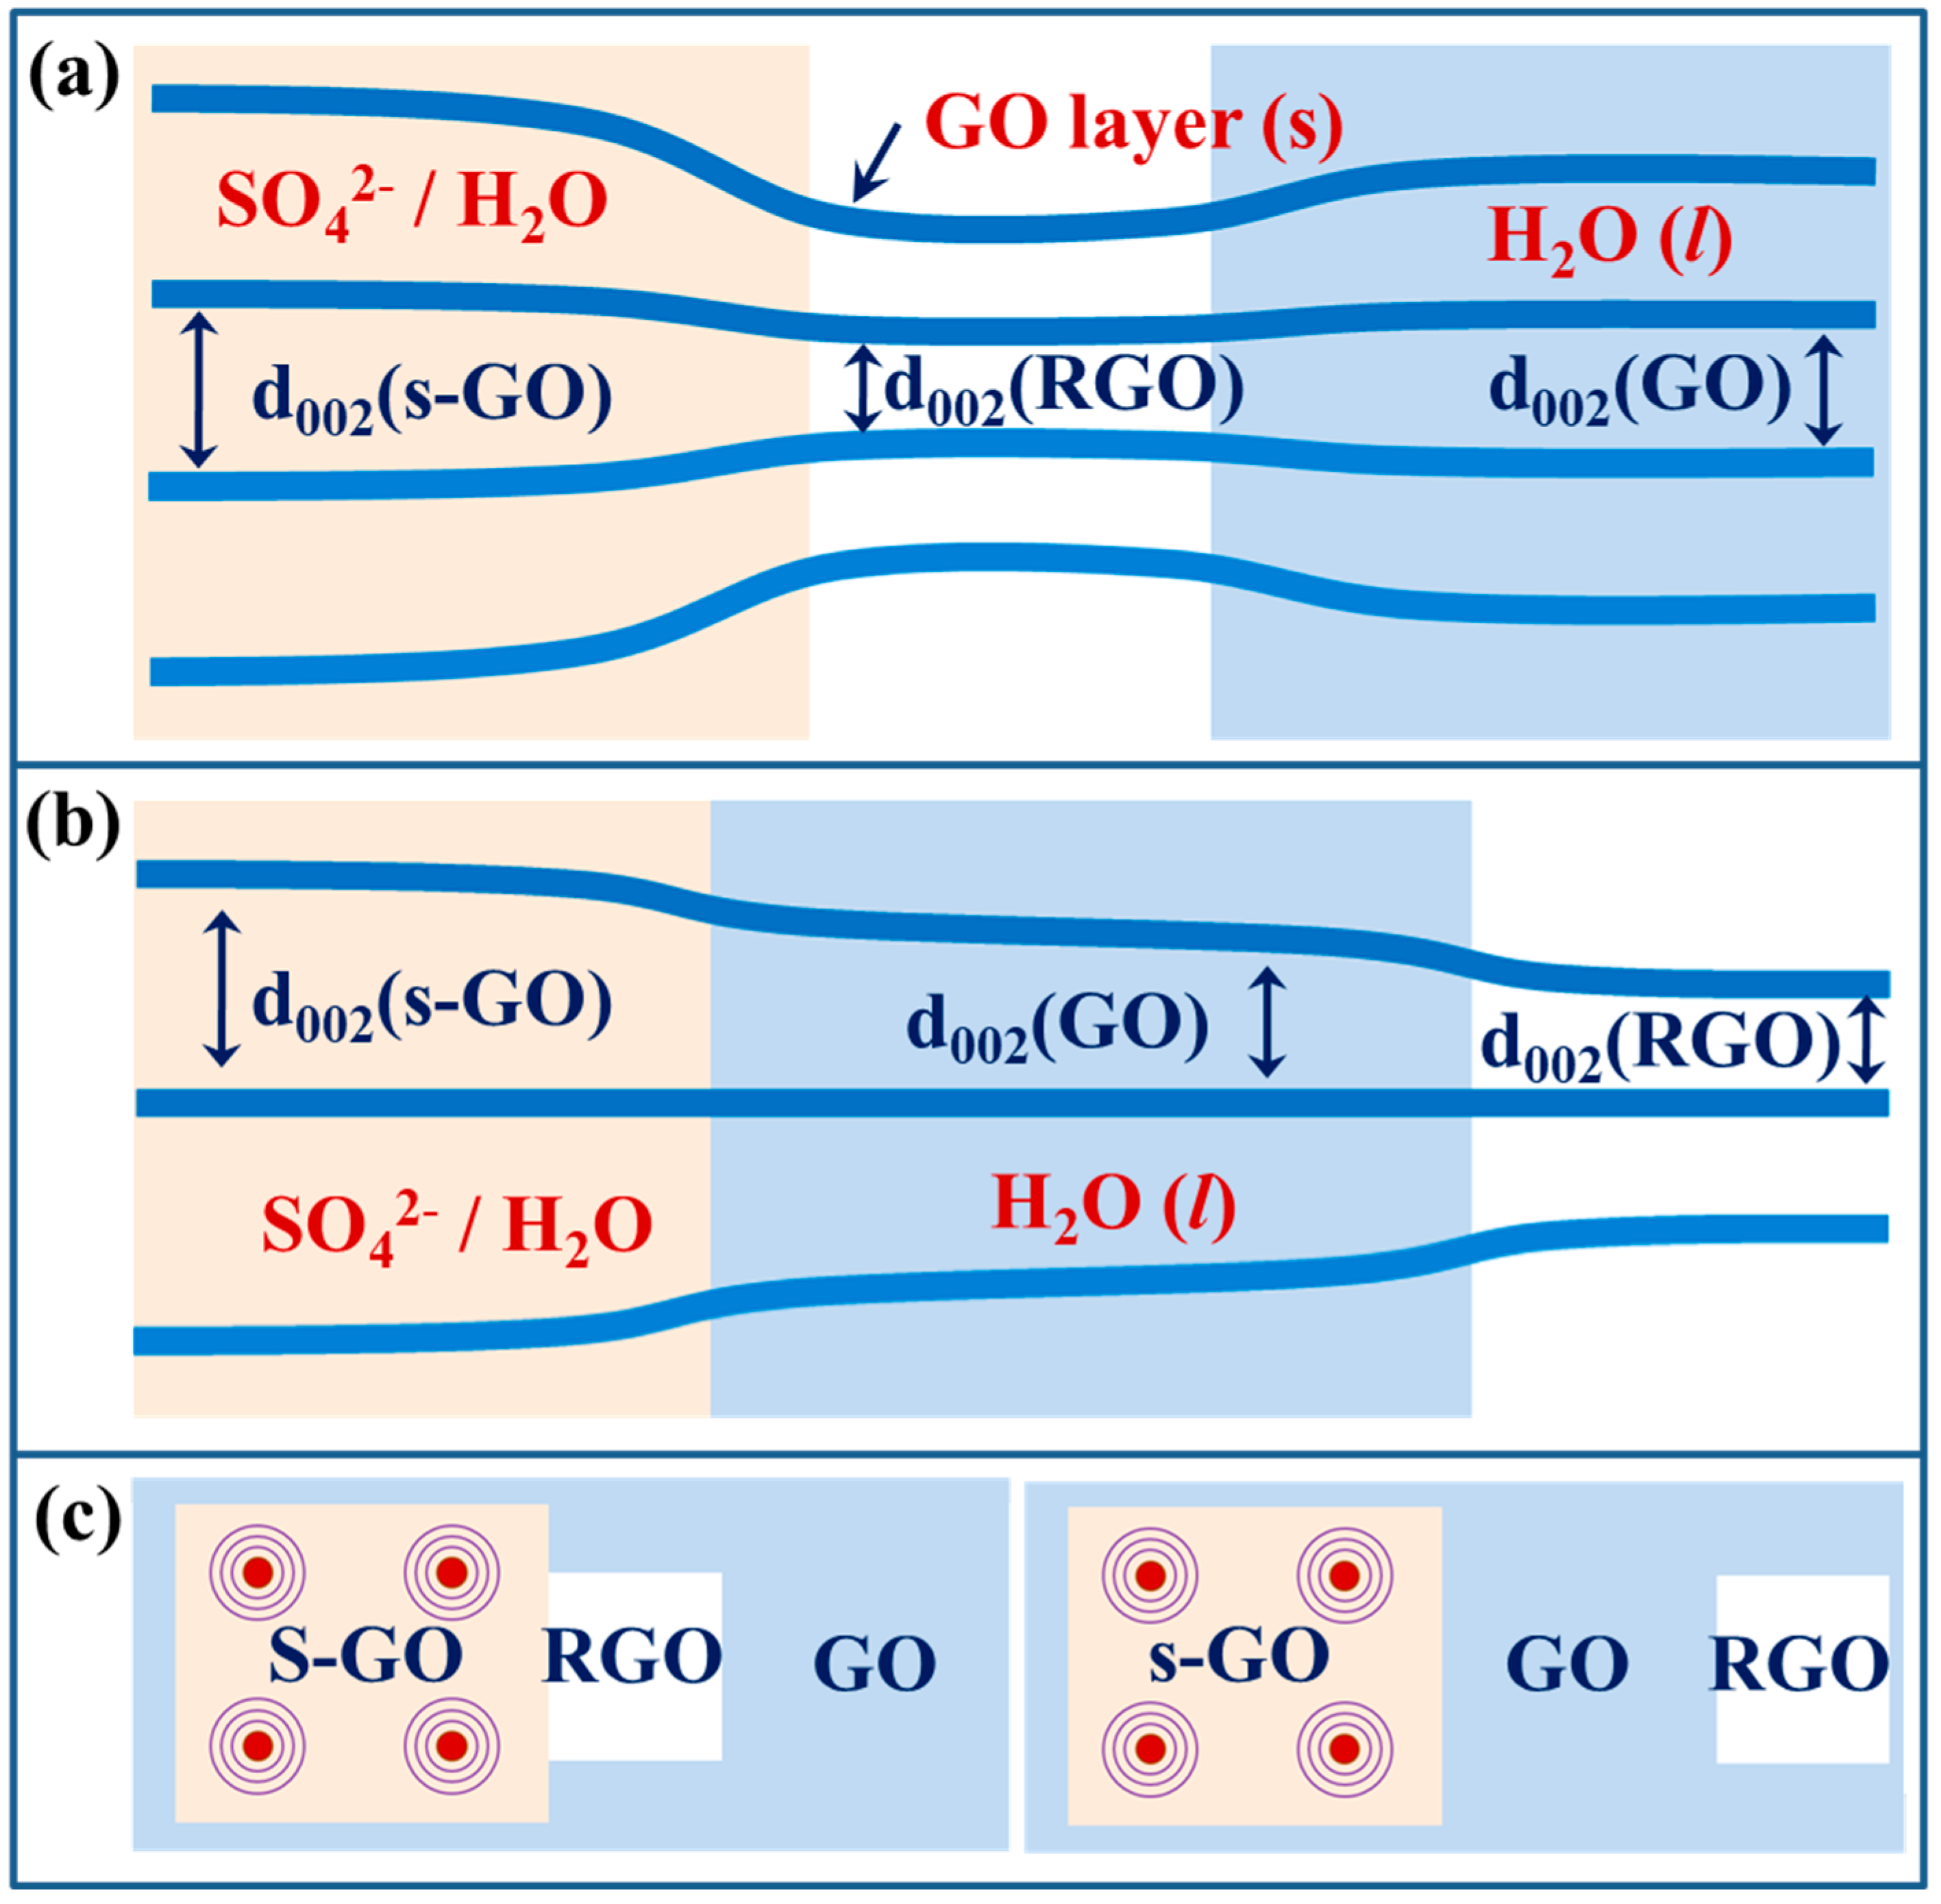
3.4. 2D-Orientated Hydration of Intercalated Sulfate Anions

Based on three key factors—namely, the high interlayer pressure of graphene oxide (GO) (~1.2 GPa) [44], the 2D-space-confined growth of nanomaterials [45], and the stability of asymmetric SO42−(H2O)n=9,12 clusters [22,27]—we hypothesize that the hydration of intercalated sulfate anions in GO exhibits anisotropic growth. The stability of the large interlayer lattices in s-GO at 100 °C, as confirmed via X-ray diffraction, suggests that 2D-oriented hydration can proceed via a 2D shell-by-shell mechanism, distinct from the spherical shell-by-shell growth observed in traditional clusters [11,22]. GO typically contains three types of water: free water, water tightly bound to oxygen groups via hydrogen bonds, and water adsorbed onto the surface of GO (basal carbon) [29,30,31,32,33,34,35,36,37,38]. In contrast, s-GO introduces four additional interactions: (1) Coulomb interactions between the sulfate anion and H2O molecules, (2) intramolecular H-bonding within the hydration shell, (3) interactions between the outer hydration shell and the GO surface (C and O), and (4) interactions between H2O molecules bound to oxygen groups and the sulfate anion/hydration shell. The central sulfate anion interacts with water through Coulomb forces, weak interactions with the GO surface [46], and hydrogen bonding with water bound to oxygen groups.
Estimates of the number of allowable molecules and interactions along the z-direction with the sulfate anion were made. According to Tan et al. [24], one layer of water corresponds to an interlayer distance of approximately 0.6 nm, with about 0.8–1.0 nm for two layers and 1.2 nm for three layers. Given the interlayer distances of GO (8.420 Å) and s-GO (11.880 Å), this suggests that a maximum of two and three H2O layers can form, respectively. Considering the ionic diameter of sulfate (4.84 Å in crystal form and 7.63 Å in a solution [25]) and the hydrogen-bond network size of sulfate anions in gas-phase clusters (~7 Å) [18], the hydrated anion and hydration network sizes in our experiment are expected to range between 7 and 7.63 Å. Models of SO42−(H2O)n=30–50 clusters indicate that the size of the second hydration shell structure ranges from 1.2 to 1.42 nm [18,23]. This size exceeds the largest d002-spacing of s-GO (11.880 Å) but is close to the typical minimum interlayer distance of GO nanosheets freely solvated in water (~14 Å [29]). Clusters with n = 13–30 may also exceed the interlayer spacing due to partially filled second-shell structures.
For a central anion (7–7.63 Å) with a first hydration shell, the shell diameter is approximately 12.9–13.53 Å (H2O size: 2.95 Å [11]). This suggests that no spherical hydration shell can fit into the s-GO lattice. However, if one H2O molecule binds vertically (along the z-axis) to one side of the sulfate anion, the combined size of the anion and H2O is 9.95–10.58 Å, which is acceptable for the s-GO interlayer lattice. Additionally, if two hydrogen bonds are formed vertically above and below the sulfate anion, the combined size becomes 10.84–11.47 Å (an H-bond length of 1.86–1.98 Å, on average 1.92 Å [22]), which is also acceptable for s-GO. If one H2O molecule and one hydrogen bond are included, the size becomes 11.87–12.50 Å. The minimum size of 11.87 Å aligns with the measured value of 11.880 Å, suggesting that the maximum allowable combination along the z-axis is one H2O molecule and two hydrogen bonds. Consequently, the central anion can directly interact with either the GO surface or H2O molecules bound to oxygen groups along the z axis.
Considering the spatial distribution of the four tetragonal oxygen atoms of the sulfate anion and the high interlayer pressure of GO (~1.2 GPa [44]), the allowable bonds can extend to multiple and oblique bonds. Theoretical calculations indicate that the typical interlayer bond length in pure GO without water is 5.1–6.0 Å due to van der Waals forces [26], which is consistent with XRD measurements of 5.254–6.053 Å (at 170–180 °C) [39]. Thus, the allowable margin for intercalated molecule sizes is 6.78 Å, derived by subtracting the minimum value (5.1 Å) from the maximum measured value (11.880 Å). This margin is slightly smaller than the hydrogen bond network size of the sulfate anion (~7 Å), likely due to the high interlayer pressure and multiple oblique bonds.
Figure 8a illustrates simplified models of the allowable molecules and interactions in the 2D hydration structure (section view), while Figure 8b shows the top view of the 2D hydration structure formed within GO. However, due to the presence of numerous nanopores in real GO [40], spherical hydration shells may form in the nanopores, with interlayer distances for one missing layer reaching 23.8 Å (Figure 8c), including free OH groups at the outermost water-like gas-phase of SO42−(H2O)n=40–50 clusters [18,26].

3.5. Triple-Interlayer Lattices of s-GO Nanosheets

Figure 5b,d,e reveal broad (002) peaks with very low intensity in RGO, even at temperatures ranging from 50 to 100 °C (see the magnified XRD patterns in the insets). The observed broad peaks, magnified in the insets, suggest that RGO formation under these conditions is unlikely, given the strong acidic environments during GO synthesis [30,31,32,39] and the fact that the thermal reduction of GO typically begins at 180–200 °C [33,34,39]. Therefore, the phases of GOI-100 and RGOI-100 (Figure 5b), GOII-50 and RGOII-50 (Figure 5d), and GOII-100 and RGOII-100 (Figure 5e) likely coexist as a single nanosheet, with dimensions ranging from several hundred nanometers to several micrometers (Figure 1b), rather than as separate sheets. Smirnov et al. [47] reported that GO films can form regions lacking water. In our experiments, RGO structures may emerge as less-oxidized carbon basal planes of GO upon removal of intercalated free water through vacuum annealing at 50–100 °C.
Given the homogeneous dispersion of sulfate ions in the film, a state facilitated by their high solubility in water, it is plausible that s-GO lattices coexist with GO lattices within a single extensive nanosheet rather than forming separate sheets. Thus, nanocrystals of GOII-50 and GOII-100 (Figure 5d,e) may exhibit triple-layer d002 lattice structures (d002 (GO), d002 (s-GO), and d002 (RGO)), as depicted in the model in Figure 9. Figure 9a,b present section views of two types of triple-interlayer lattices (the arrangement of three lattices). The order of interlayer distance is d002 (s-GO) > d002 (GO) > d002 (RGO). The RGO lattice in the model lacks liquid layers. Consequently, the SO42−/H2O (s-GO) and H2O (GO) layers exclude portions of RGO lattices. However, these RGO regions may exist at local discrete points within the widespread 2D hydration system (top view in Figure 9c). Due to the intercalated sulfate, the temperature-dependent 2θ values for GOII (10.506 → 10.930 → 16.623° with an increase in temperature) are consistently smaller (indicating larger d002 values) than those for GOI (11.194 → 12.202 → 18.340°). Similarly, RGOII consistently showed smaller 2θ values at all temperatures compared to those of RGOI (see Figure 6 and Table 1). This suggests that GOII and RGOII are significantly influenced by the surrounding s-GO lattice, which has a larger interlayer spacing.
As shown in Figure 7a, the d002 value of GOI decreases substantially with an increasing temperature (50 → 100 → 200 °C) in the following order: 7.904 → 7.253 → 4.837 Å (a). The Dthick and NL values (Dthick/d002) increase in the order of 68.0 → 70.5 → 72.3 Å (Figure 7b) and 8.6 → 9.7 → 15.0 layers (Figure 7c), respectively. These changes are attributed to the thermal treatment. Conversely, the Dthick and NL values for GOII and s-GOII increase up to 100 °C but then decrease from 100 to 200 °C (Figure 7d–f). This indicates that, unlike GOI, the GOII and s-GOII lattices become unstable, with hindered crystalline growth during layer-by-layer stacking at 100–200 °C. At 200 °C, the NL of s-GOII-200 is estimated to be 0.9, with an increased d002 value (Figure 7d), suggesting the loss of the crystalline structure of s-GOII-200 and the formation of an amorphous-like structure. Therefore, the sulfate-containing s-GOII lattice became unstable above 100 °C and collapses by 200 °C.
The intercalated water in s-GO is more resistant to evaporation and movement compared to GO due to the high-density hydration of sulfate anions (2.9 times that of bulk water) and reduced mobility caused by multiple interactions between the SO42−/H2O clusters and the GO surface. This results in a large interlayer spacing in s-GO, a property that is maintained up to 100 °C. The 0.498 Å reduction in interlayer spacing from 50 to 100 °C can be attributed to the evaporation of free water, while hydrated water remained bound to the anions. Above a critical temperature between 100 and 200 °C, the movements of SO42−/H2O hydration shells on either side of a single s-GO layer facilitates lattice position changes due to the mass motion of sulfate anions (21.0% of the total mass of s-GO). This phenomenon leads to the loss of the triple-interlayer lattice structure (Figure 8). Ultimately, three distinct nanocrystalline structures persist, namely, pure GO without H2O (GOII-200), partially reduced RGO (RGOII-200), and a sulfate-containing amorphous-like structure devoid of H2O (s-GOII-200), as shown in Figure 5f.
GO nanosheets produced from the same batch exhibit nearly identical XRD results under consistent drying conditions. However, the surface properties of GO can vary significantly due to factors such as the type of graphite raw material, the acid used, and the oxidation process. Consequently, these GOs may display different interlayer distances, even under the same sampling conditions. Nevertheless, this study provides clear data on the two-dimensional hydration state related to the absolute interlayer distance, which can be applied to various forms of GO.

4. Conclusions

GO nanosheets exhibit significant interactions with H2O molecules. The incorporation of sulfate anions into these layers results in hybrid hydration, leading to the formation of sulfate-intercalated s-GO. In this study, the two-dimensional nanospaces were precisely characterized using XRD, which revealed the 2D hybrid hydration between GO–H2O–SO42− systems. Specifically, GO nanosheets provide an anisotropic framework for the 2D space, facilitating the lateral shell-by-shell growth of SO42− and H2O. The s-GO nanosheets display triple-interlayer lattices, characterized by the following ordering: d002 (s-GO) > d002 (GO) > d002 (RGO). The quantity of nanocrystals follows the following trend: GO > s-GO >> RGO. Within the framework of our 2D hydration model, SO42−/H2O (s-GO) hydration shells are distributed within a liquid H2O layer, with minor amounts of RGO potentially being present at discrete locations within the extensive SO42−/H2O (s-GO) and H2O (GO) 2D hydration systems. Notably, these hydration and crystalline structures become unstable and collapse between 100 and 200 °C. This study lays the groundwork for future experimental designs aimed at exploring 2D hydration models for various anions and cations, with implications for hybrid hydration behavior in confined nano-environments, sulfate mineralogy, protein solvation mechanisms, and layered structural engineering.

Author Contributions

Conceptualization: S.H.H.; validation: S.H.H.; sample production and experimentation: H.J.A. and S.J.K.; instrumental analysis: H.J.A., S.J.K., H.G.K. and Y.J.; writing—original draft preparation: S.H.H.; writing—review and editing: all authors; supervision: S.H.H.; project administration: S.H.H.; funding acquisition: S.H.H. All authors have read and agreed to the published version of the manuscript.

Funding

This research was funded by the Ministry of Trade of the Industry and Energy (MTIE) under project grant 20228A10100040.

Data Availability Statement

Data are contained within the article.

Acknowledgments

This work was supported by the project titled “RFCC Catalyst Remanufacturing Project (20228A10100040)” funded by the Ministry of Trade, Industry and Energy (MTIE).

Conflicts of Interest

Author Youngho Jee was employed by the company Graphene Research Lab., CRESIN Co., Ltd. The remaining authors declare that the research was conducted in the absence of any commercial or financial relationships that could be construed as a potential conflict of interest. The funders had no role in the design of the study, the collection, analyses, or interpretation of data, the writing of the manuscript, or the decision to publish the results.

References

  1. Bai, H.; Bi, X.; Liu, C.; Shi, E.; Cao, H.; Xin, Y.; Fu, X.; Qiao, L.; Zhang, J.; Wu, Z.; et al. Spatial distributions and origin of hydrated sulfate minerals at the mineral bowl in Ophir Chasma, Mars. Planet. Space Sci. 2021, 207, 105323. [Google Scholar] [CrossRef]
  2. Gill, K.K.; Jagniecki, E.A.; Benison, K.C.; Gibson, M.E. A Mars-analog sulfate mineral, mirabilite, preserves biosignatures. Geology 2023, 51, 818–822. [Google Scholar] [CrossRef]
  3. Perkins, D. Mineralogy, LibreTextsTM; University of North Dakota: Grand Forks, ND, USA, 2023. [Google Scholar]
  4. Johan, P.R.; Buseck, P.R. Mineralogy and Instrumentation. In Encyclopedia of Physical Science and Technology, 3rd ed.; Academic Press: Cambridge, MA, USA, 2003. [Google Scholar]
  5. Tomasz, M.S.; Stawski Alexander, E.S.; Driessche, V. Editorial for Special Issue “Formation of Sulfate Minerals in Natural and Industrial Environments”. Mineral 2022, 12, 299. [Google Scholar] [CrossRef]
  6. Radha, S.; Kamath, P.V. Polytypism in Sulfate-Intercalated Layered Double Hydroxides of Zn and M(III) (M = Al, Cr): Observation of Cation Ordering in the Metal Hydroxide Layers. Inorg. Chem. 2013, 52, 4834. [Google Scholar] [CrossRef]
  7. Ida, S.; Shiga, D.; Koinuma, M.; Matsumoto, Y. Synthesis of Hexagonal Nickel Hydroxide Nanosheets by Exfoliation of Layered Nickel Hydroxide Intercalated with Dodecyl Sulfate Ions. J. Am. Chem. Soc. 2008, 130, 14038. [Google Scholar] [CrossRef]
  8. Jorgensen, S.E.; Fath, B.D. Encyclopedia of Ecology. Sulfur Cycle 2008, 4, 3424–3431. Available online: https://drs.nio.org/drs/handle/2264/1462 (accessed on 10 October 2024).
  9. Jørgensen, B.B.; Findlay, A.J.; Pellerin, A. The Biogeochemical Sulfur Cycle of Marine Sediments. Front. Microbiol. 2019, 10, 809. [Google Scholar] [CrossRef]
  10. Hofmeister, F. Zur Lehre von der Wirkung der Salze: Zweite Mittheilung. Arch. Exp. Pathol. Pharmacol. 1888, 24, 247. [Google Scholar] [CrossRef]
  11. O’Brien, J.T.; Prell, J.S.; Bush, M.F.; Williams, E.R. Sulfate ion patterns water at long distance. J. Am. Chem. Soc. 2010, 132, 8248. [Google Scholar] [CrossRef] [PubMed]
  12. Ren, Y.; Li, J.; Sun, X.; Li, Z.; Sun, Z. Genesis of Metal Sulfides and Its Significance on Graphite Mineralization in the Huangyangshan Graphite Deposit, East Junggar, Xinjiang Province, China. Minerals 2022, 12, 1450. [Google Scholar] [CrossRef]
  13. Ferry, J.M. Petrology of graphitic sulfide-rich schists from South-central Maine: An example of desulfidation during prograde regional metamorphism. Am. Min. 1981, 66, 908–930. Available online: https://pubs.geoscienceworld.org/msa/ammin/article/66/9-10/908/41318 (accessed on 10 October 2024).
  14. Eiger, S. Graphite sulphate—A precursor to graphene. Chem. Commun. 2015, 51, 3162. [Google Scholar] [CrossRef]
  15. Ng, Y.Z.; Beh, K.P.; Suhaimi, F.H.A.; Abdalraheem, R.; Lim, H.S.; Jafri, M.Z.M.; Yam, F.K. Effect of the Sulfate Concentration on the Graphene Film Produced by Electrochemical Exfoliation. Solid State Phenomena 2019, 290, 127–133. [Google Scholar] [CrossRef]
  16. Hong, Y.; Wang, Z.; Jin, X. Sulfuric Acid Intercalated Graphite Oxide for Graphene Preparation. Sci. Rep. 2013, 3, 3439. [Google Scholar] [CrossRef] [PubMed]
  17. Kim, S.L.; Hsu, J.H.; Yu, C. Intercalated graphene oxide for flexible and practically large thermoelectric voltage generation and simultaneous energy storage. Nano Energy 2018, 48, 582. [Google Scholar] [CrossRef]
  18. DiTucci, M.J.; Stachl, C.N.; Williams, E.R. Long distance ion-water interactions in aqueous sulfate nanodrops persist to ambient temperature in the upper atmosphere. Chem. Sci. 2018, 9, 3970. [Google Scholar] [CrossRef] [PubMed]
  19. Kulichenko, M.; Fedik, N.; Bozhenko, K.V.; Boldyrev, A.I. Hydrated Sulfate Cluster SO42− (H2O)n (n = 1−40): Charge Distribution Throught, Solvation Shells and Stabilization. J. Phys. Chem. B 2019, 123, 4065. [Google Scholar] [CrossRef]
  20. Bush, M.F.; Saykally, R.J.; Williams, E.R. Evidence for Water Ring in the Hexahydrated Sulfate Dianion from IR Spectroscopy. J. Am. Chem. Soc. 2007, 129, 2220–2221. [Google Scholar] [CrossRef] [PubMed]
  21. Wang, X.B.; Nicholas, J.B.; Wang, L.S. Electronic Instability of Isolated SO42− and its Solvation Stabilization. J. Chem. Phys. 2000, 113, 10837–10840. [Google Scholar] [CrossRef]
  22. Thaunay, F.; Clavaguéra, C.; Ohanessian, G. Hydration of the sulfate dianion in cold nanodroplets: SO42−(H2O)12 and SO42−(H2O)13. Phys. Chem. Chem. Phys. 2015, 17, 25935. [Google Scholar] [CrossRef]
  23. DiTucci, M.J.; Williams, E.R. Nanometer patterning of water by tetraanionic ferrocyanide stabilizied in aqueous nanodrops. Chem. Sci. 2017, 8, 1391. [Google Scholar] [CrossRef] [PubMed]
  24. Tan, Q.; Fan, Y.; Song, Z.; Chen, J. Effects of interlayer spacing and oxidation degree of graphene oxide nanosheets on water permeation: A molecular dynamics study. J. Mol. Model. 2022, 28, 57. [Google Scholar] [CrossRef] [PubMed]
  25. Marcus, Y. Ionic radii in aqueous solutions. Chem. Rev. 1988, 88, 1475. [Google Scholar] [CrossRef]
  26. Medhekar, N.V.; Ramasubramaniam, A.; Ruoff, R.S.; Shenoy, V.B. Hydrogen bond networks in graphene oxide composite paper: Structure and mechanical properties. ACS Nano 2010, 4, 2300. [Google Scholar] [CrossRef] [PubMed]
  27. Thaunay, F.; Hassan, A.A.; Cooper, R.J.; Williams, E.R.; Clavaguéra, C.; Ohanessian, G. Hydration of the sulfate dianion in size-selected water clusters: From SO42−(H2O)9 to SO42−(H2O)13. Int. J. Mass Spec. 2017, 418, 15. [Google Scholar] [CrossRef]
  28. Mukhopadhyay, A.; Cole, W.T.S.; Saykally, R.J. The water dimer I: Experimental characterization. Chem. Phys. Lett. 2015, 633, 13–26. [Google Scholar] [CrossRef]
  29. Mouhat, F.; Coudert, F.X.; Bocquet, M.L. Structure and chemistry of graphene oxide in liquid water from first principles. Nat. Comm. 2020, 11, 1566. [Google Scholar] [CrossRef]
  30. Rezania, B.; Severin, N.; Talyzin, A.V.; Rabe, J.P. Hydration of bilayered graphene oxide. Nano Lett. 2014, 14, 3993. [Google Scholar] [CrossRef]
  31. He, H.; Klinowski, J.; Forster, M.; Lerf, A. A new structural model for graphite oxide. Chem. Phys. Lett. 1998, 287, 53. [Google Scholar] [CrossRef]
  32. Jeong, H.K.; Lee, Y.P.; Jin, M.H.; Kim, E.S.; Bae, J.J.; Lee, Y.H. Thermal stability of graphite oxide. Chem. Phys. Lett. 2009, 470, 255. [Google Scholar] [CrossRef]
  33. Surekha, G.; Krishnaiah, K.V.; Ravi, N.; Suvarna, R.P. FTIR, Raman and XRD analysis of graphene oxide films prepared by modified Hummers method. J. Phys. Conf. Ser. 2020, 1495, 012012. [Google Scholar] [CrossRef]
  34. Rattana; Chaiyakun, S.; Witit-anun, N.; Nuntawong, N.; Chindaudom, P.; Oaew, S.; Kedkeaw, C.; Limsuwan, P. Preparation and characterization of graphene oxide nanosheets. Procedia Eng. 2012, 32, 759–764. [Google Scholar] [CrossRef]
  35. Kim, J.E.; Han, T.H.; Lee, S.H.; Kim, J.Y.; Ahn, C.W.; Yun, J.M.; Kim, S.O. Graphene oxide liquid crystals. Angew. Chem. Int. Edgl. 2011, 50, 3043–3047. [Google Scholar] [CrossRef] [PubMed]
  36. Chen, D.; Feng, H.; Li, J. Graphene oxide: Preparation, functionalization, and electrochemical applications. Chem. Rev. 2012, 112, 6027–6053. [Google Scholar] [CrossRef]
  37. Moissette, A.; Fuzellier, H.; Burneau, A.; Dubessy, J.; Lelaurain, M. Uranyl-sulfate graphite intercalation compounds–I. Their synthesis and stability. Carbon 1995, 33, 809–815. [Google Scholar] [CrossRef]
  38. Huh, S.H. Thermal Reduction of Graphene Oxide. Physics and Applications of Graphene—Experiments. Chapter 2011, 5, 73. [Google Scholar] [CrossRef]
  39. Ju, H.M.; Huh, S.H.; Choi, S.H.; Lee, H.L. X-ray Diffraction Patterns of Thermally-reduced Graphenes. Mater. Lett. 2010, 64, 1649–1652. [Google Scholar] [CrossRef]
  40. Cullity, B.D.; Stock, S.R. Elements of X-ray Diffraction, 3rd ed.; Prentice Hall: Upper Saddle River, NJ, USA, 2001. [Google Scholar]
  41. Pardal, J.M.; Tavares, S.S.M.; Fonseca, M.P.C. Study of the austenite quantification by X-ray diffraction in the 18Ni-CO-Mo maraging 300 steel. J. Mater. Sci. 2006, 41, 2301–2307. [Google Scholar] [CrossRef]
  42. Kiefer, J.; Stärk, A.; Kiefer, A.L.; Glade, H. Infrared Spectroscopic Analysis of the Inorganic Deposits from Water in Domestic and Technical Heat Exchangers. Energies 2018, 11, 798. [Google Scholar] [CrossRef]
  43. Zhou, J.; Santambrogio, G.; Brümmer, M.; Moore, D.T.; Wöste, L.; Meijer, G.; Neumark, D.M.; Asmis, K.R. Infrared spectroscopy of hydrated sulfate dianions. J. Chem. Phys. 2006, 125, 111102. [Google Scholar] [CrossRef]
  44. Vasu1, K.S.; Prestat, E.; Abraham, J.; Dix, J.; Kashtiban, R.J.; Beheshtian, J.; Sloan, J.; Carbone, P.; Amal, M.N.; Haigh, S.J.; et al. Van der Waals pressure and its effect on trapped interlayer molecules. Nat. Commun. 2016, 7, 12168. [Google Scholar] [CrossRef] [PubMed]
  45. Dong, S.; Wang, H.; Wu, H.; Jiu, J.; Zhao, J. Nanoconfined Crystal Growth of Copper-Intercalated Graphene Oxide Interlayers. J. Phys. Chem. C 2022, 126, 17344–17352. [Google Scholar] [CrossRef]
  46. Hou, D.; Zhang, Q.; Wang, M.; Zhang, J.; Wang, P.; Ge, Y. Molecular dynamics study on water and ions on the surface of graphene oxide sheet: Effects of functional groups. Comput. Mater. Sci. 2019, 167, 237–247. [Google Scholar] [CrossRef]
  47. Smirnov, V.A.; Vasil’ev, V.P.; Denisov, N.N.; Baskakova, Y.V.; Dubovitskii, V.A. Electric behavior of interlayer water in graphene oxide films. Chem. Phys. Lett. 2016, 648, 87–90. [Google Scholar] [CrossRef]
Figure 1. Field-emission scanning electron microscopy (FE-SEM) images and energy-dispersive spectroscopy (EDS) spectra of graphene oxide (GO) samples. (a) FE-SEM image of GOI. (b) FE-SEM image of GOII. (c) EDS spectrum of GOI. (d) EDS spectrum of GOII.
Minerals 14 01030 g001
Figure 2. Particle size analyses of GOI (a) and GOII (b). Field-emission transmission electron microscopy (FE-TEM) images of GOI (c) and GOII (d).
Minerals 14 01030 g002
Figure 3. Fourier-transform infrared (FT-IR) spectra of sulfate-intercalated graphene oxide (s-GO) at different temperatures: (a) s-GO50 at 50 °C and (b) s-GO100 at 100 °C.
Minerals 14 01030 g003
Figure 4. Thermogravimetric analysis (TGA) and derivative thermogravimetry (DTG) curves for (a) GOI and (b) GOII.
Minerals 14 01030 g004
Figure 5. X-ray diffraction (XRD) patterns of GOI and GOII at various temperatures. (ac) XRD patterns of GOI at 50 °C, 100 °C, and 200 °C, respectively. (df) XRD patterns of GOII at 50 °C, 100 °C, and 200 °C, respectively. Insets show magnified images of the (002) peak for reduced graphene oxide (RGO).
Minerals 14 01030 g005
Figure 6. Lorentzian fitting analysis of the coexisting peaks for s-GOII and GOII: (a) fitting analysis at 50 °C and (b) fitting analysis at 100 °C.
Minerals 14 01030 g006
Figure 7. Temperature-dependent variations in structural parameters: (a) interlayer spacing (d002), (b) thickness (Dthick), (c) number of layers (NL), and (d) phase quantity (Qphase)for GOI and RGOI; (e) d002, (f) Dthick, (g) NL, and (h) Qphase for s-GOII, GOII, and RGOII.
Minerals 14 01030 g007
Figure 8. Models of the 2D hydration structure: (a) simplified section view of allowable molecules and interactions within 2D hydration structure. (b) top view of the 2D hydration structure formed locally within GO; (c) spherical hydration shell within a nanopore, showing the free OH groups (dangling bonds) at the outermost layer of water.
Minerals 14 01030 g008
Figure 9. Nanocrystalline structures with triple interlayer lattices: (a,b) section views showing s-GO–RGO–GO and s-GO–GO–RGO configurations; (c) top views of the triple-lattice structures.
Minerals 14 01030 g009
Table 1. X-ray diffraction (XRD) fitting values for the (002) peak, including 2θ and full width at half maximum (FWHM). The table also provides estimated interlayer spacing (d002), thickness (Dthick), number of layers (NL), and phase quantity (Qphase) for graphene oxide (GO), sulfate-intercalated graphene oxide (s-GO), and reduced graphene oxide (RGO) at temperatures ranging from 50 to 200 °C.
T (°C)2D Materialsa 2θ (°)b FWHM (°)c d002 (Å)d Dthick (Å)e NLf Qphase (%)
50GOI-5011.1941.167.90468.08.699.5
100GOI-10012.2021.127.25370.59.797.5
RGOI-10021.7656.694.08312.02.92.5
200GOI-20018.3401.104.83772.315.021.5
RGOI-20023.2394.803.82816.74.478.5
50s-GOII-507.4411.9811.88039.83.318.0
GOII-5010.5061.188.42066.97.981.2
RGOII-5019.8387.144.47511.22.50.8
100s-GOII-1007.7671.1511.38268.56.036.4
GOII-10010.9300.788.095101.212.562.1
RGOII-10021.5226.904.12911.62.81.5
200s-GOII-2007.3007.2012.05012.00.921.2
GOII-20016.6233.205.33324.84.715.4
RGOII-20023.1666.023.83913.33.553.4
Errors: a (±0.005), b (±0.05), c (±0.01), d (±1.5), e (±0.5), and f (±0.5).
Disclaimer/Publisher’s Note: The statements, opinions and data contained in all publications are solely those of the individual author(s) and contributor(s) and not of MDPI and/or the editor(s). MDPI and/or the editor(s) disclaim responsibility for any injury to people or property resulting from any ideas, methods, instructions or products referred to in the content.

