Abstract
The Abu Darag sub-basin in Egypt is a significant hydrocarbon province. This study provides the first thorough evaluation of the petroleum system in the Northern Gulf of Suez, specifically targeting regions with tectonically influenced paleo highs. The research is novel in its holistic approach, linking tectonic activity with hydrocarbon generation and accumulation, particularly in the Nukhul Formation. In the NDARAG-1 well, with the Nukhul Formation serving as its main reservoir, petrophysical analysis estimates an average net pay of 126 ft in the Nukhul Formation, with 19% average shale volume, 17% average effective porosity, and 57% average water saturation. Geochemical evaluation of the shales in the Thebes, Matulla, Raha, and Nubia-A formations indicate source rock potential ranging from fair to very good, with TOC values between 0.5 wt% and 5.4 wt%. The burial history model outlines gradual subsidence and sediment deposition from the Paleozoic to the Early Cretaceous, followed by significant compression and uplift during the Late Cretaceous. Early oil generation in the Nubia-A Lower shales began during the Early Cretaceous (~132 Ma) at a depth of 4000 ft while it occurred in the Early Miocene (~22 Ma) at a depth of 7400 ft. The Nubia-A Lower Member is identified as the key source rock, with vitrinite reflectance values above 0.70%. Continuous subsidence during the Eocene led to the deposition of the Nukhul, Rudeis, and Kareem formations. Oil generation in the Nubia-A Lower shales occurred during both the Early Cretaceous and Early Miocene. The main risk to hydrocarbon accumulation in the Abu Darag sub-basin is related to potential seal failures due to the erosion and/or non-deposition of the Belayim, South Gharib, and Zeit evaporites. The only producing wells are situated in the northwest of the study area, where conditions are conducive to hydrocarbon entrapment and preservation, and secondary migration has occurred in a northwestward direction.
1. Introduction
The Gulf of Suez (GOS) is a major petroleum province in Egypt. Geologically, it is divided into three parts: northern, middle, and southern [1]. Total Energies (formerly Total) made the north Darag (NDARAG) discovery [2] whereas other discoveries, such as the Warda oil discovery, were made by BP (formerly British Petroleum) in the offshore Gulf of Suez area. Many wells in the Abu Darag sub-basin, northern GOS, are wet except for the Nukhul Formation oil discovery in the north Darag wells [3]. The pre-Miocene strata serve as the primary sources of hydrocarbons in the northern GOS [4]. Intervals within several formations, including the Nubia, Matulla, Wata, Sudr, and Thebes formations, were identified as remaining active within the hydrocarbon generation limits. The timing of oil migration and expulsion in the GOS occurred after the deposition of the South Gharib evaporites, which serve as the main seal in the region [4]. Many researchers studied the structure, reservoir potential, and petroleum system of the Gulf of Suez, but the studies of the Jurassic section are rare [5,6,7,8].
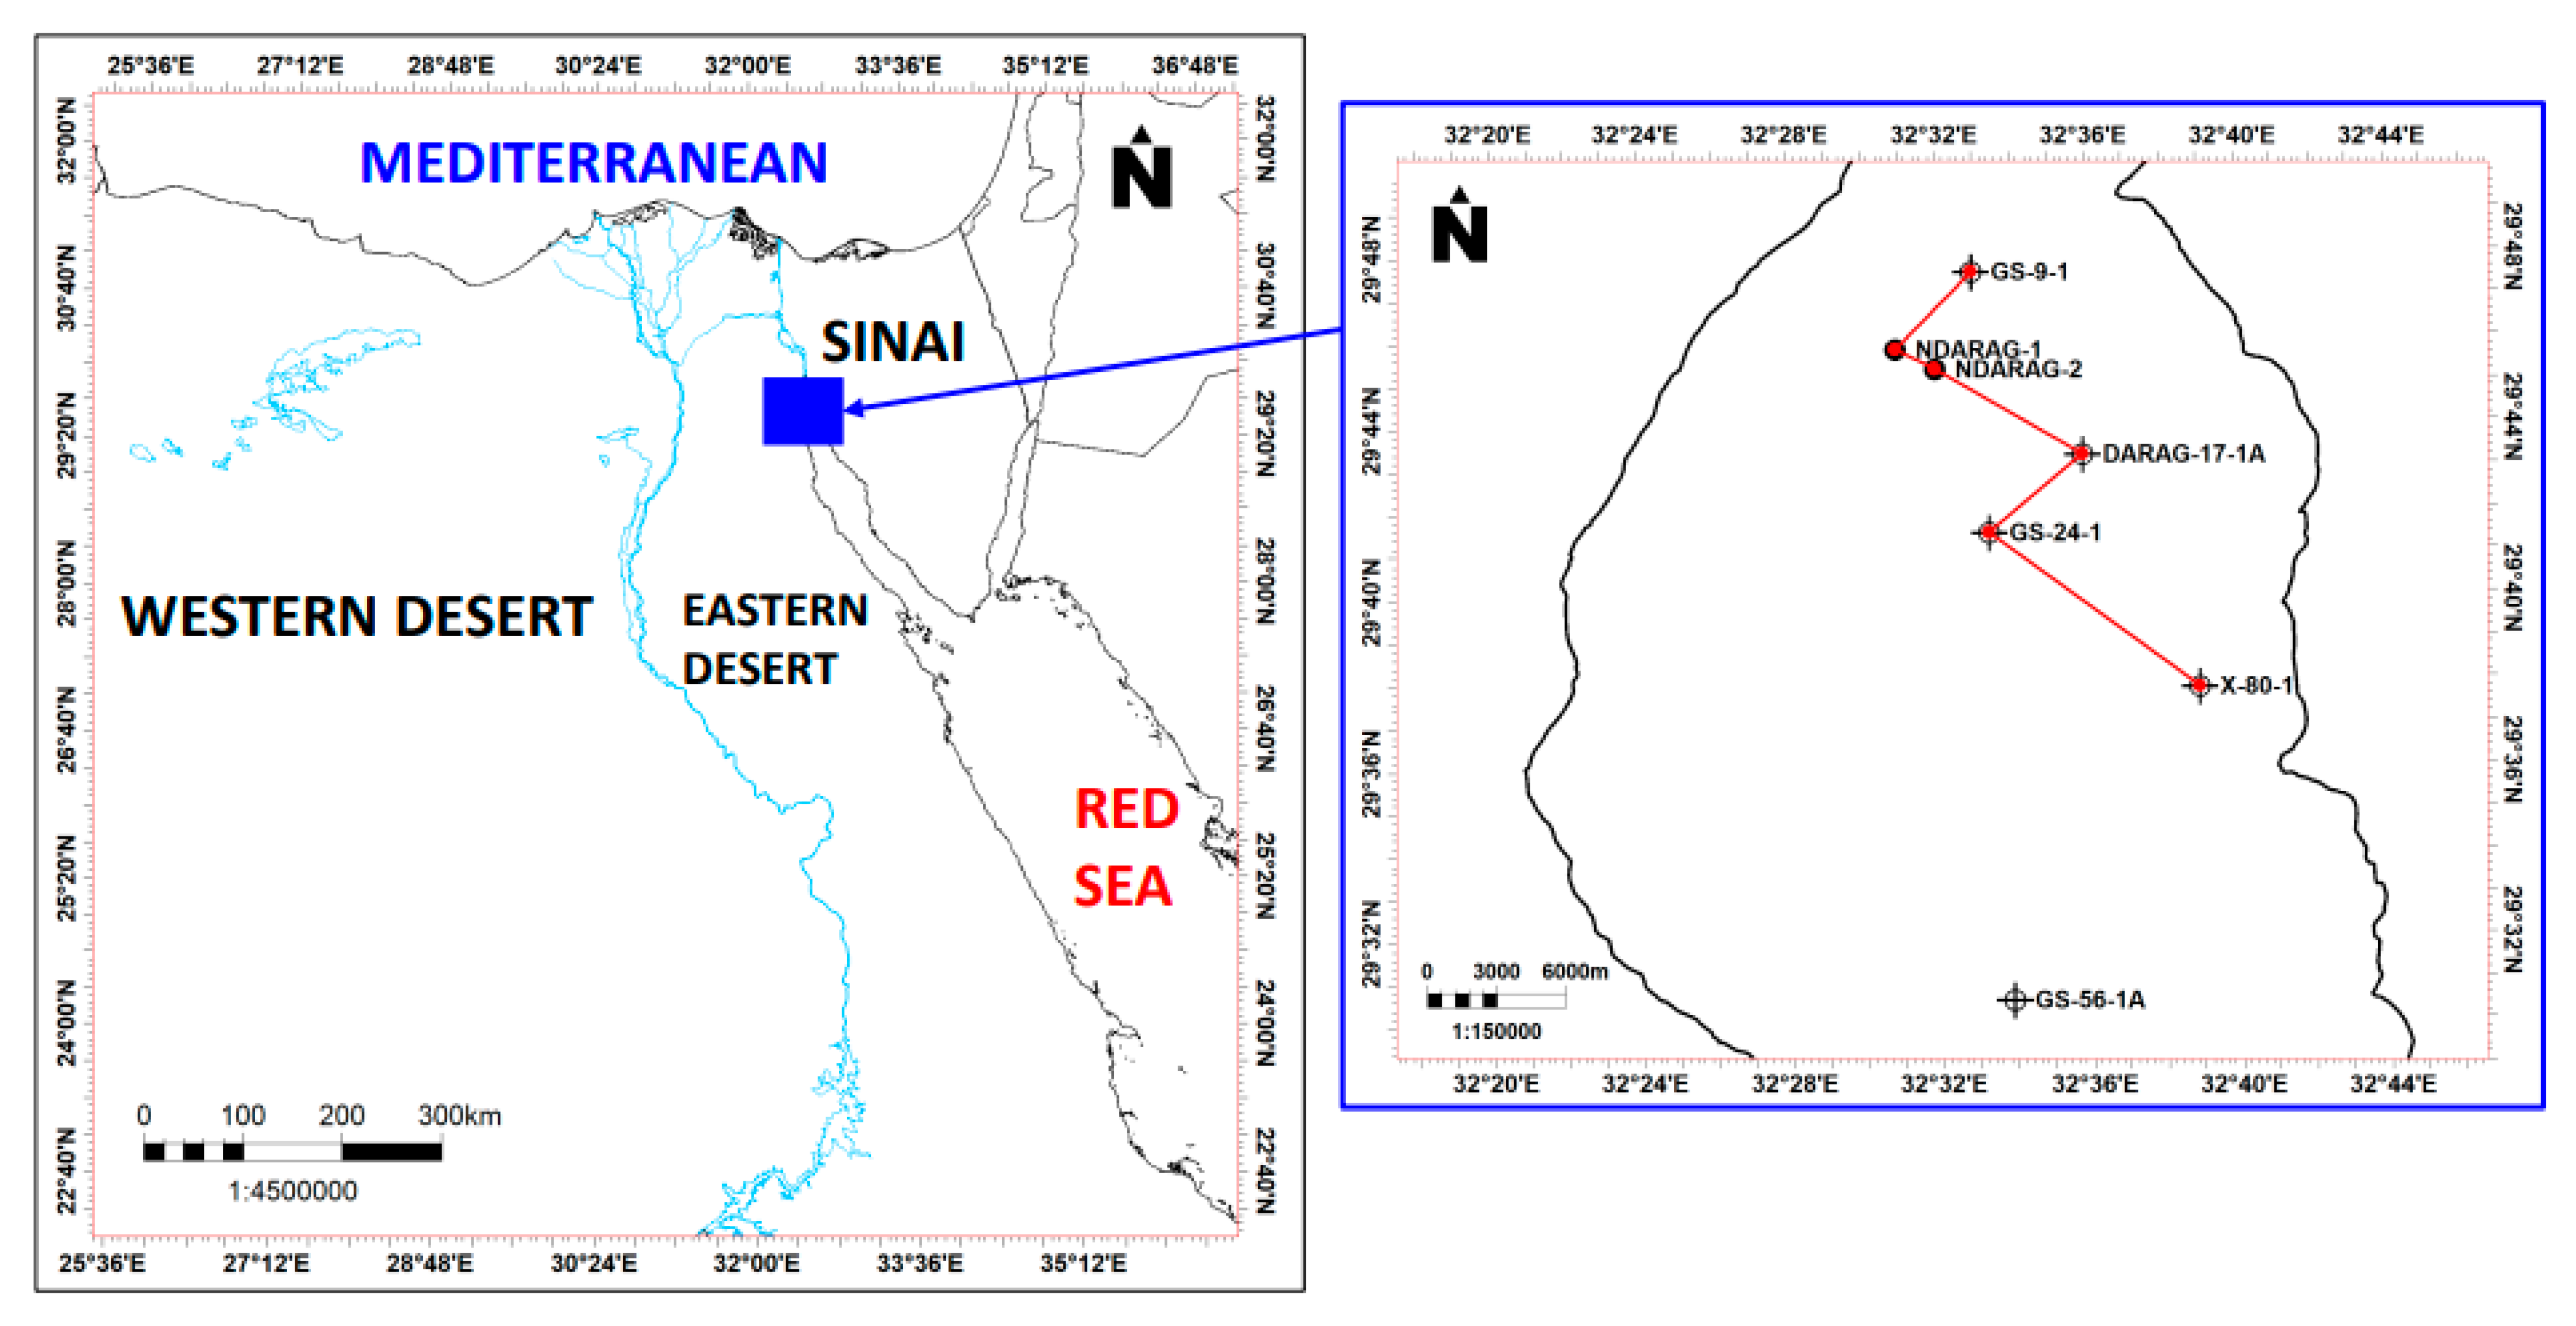
The main goal of this investigation is the assessment of Abu Darag sub-basin’s hydrocarbon potential, which is situated in the area with geographical coordinates of approximately latitudes 29°32′ to 29°48′ and longitudes 32°20′ to 32°44′ (Figure 1).
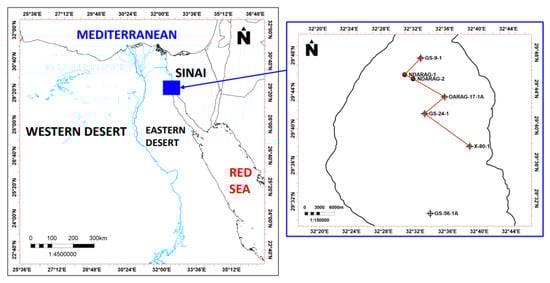
Figure 1.
The location of the studied area in the northern part of Gulf of Suez Basin, as marked by the blue square. The well correlation is shown by the solid red line.
The objective of the present study is to model the petroleum system including the effective source rocks capability of generating hydrocarbons, their time of migration, the preservation of migrated and accumulated hydrocarbons, and to shed light onto the Jurassic shales (Nubia-A) as a major source rock in the basin. The petroleum system modeling also aims to understand the subsurface geological characteristics, including the presence of potential source rocks, reservoirs, and seals, within this specific area. A detailed geochemical, petrophysical, and basin modeling investigation form the primary focus of this study. The geochemical study involves the interpretation of analytical results such as vitrinite reflectance (Ro%) measurements, Rock-Eval pyrolysis data, and total organic carbon (TOC wt%) content [9,10]. Basin modeling that includes geochemical and geothermal burial histories was used to obtain further insight into the time of hydrocarbon generation and magnitude of erosional processes, as well as the migration. By combining geological and geochemical data, the basin modeling enabled us to reconstruct the sedimentary basin’s thermal and burial history [11]. Vitrinite reflectance measurements are crucial for verifying and calibrating these models, as they provide direct constraints on the thermal history experienced by the organic matter within the subsurface rocks [12].
2. Geologic Setting
The GOS, along with the Red Sea and the Gulf of Aqaba, constitutes the northern branches of the extensive East African Rift system. Tectonic stresses are pulling apart the African continent, leading to the gradual division and extension of the continental crust into this rift system [1,13]. The GOS is characterized as a narrow and shallow body of water, with an average depth of no more than 55 ft. Its current structure began to form during the Oligocene–Miocene period, marked by a regenerated depression that is oriented northwest-southeast. The GOS originated in the Early Paleozoic by subsidence and tensional movements along NW-SE trending normal faults, leading to the formation of the Suez graben or rift basin during the Oligocene.
This geological process is closely associated with the creation of hydrocarbon source rocks, where the thickness of overburden during rifting increases and thermal maturity also increases [14,15]. Structural characteristics within the GOS are governed by two main fault trends: transverse faults running E-W (or ENE-WSW), which are often inactive, and longitudinal faults parallel to the rift axis and the Gulf’s faulted borders, trending NNW to SSE [14]. The GOS is divided into three zones—northern, central, and southern—each with its distinct geological context. The stratigraphic framework of the GOS is characterized by three tectonostratigraphic sequences, pre-rift, syn-rift, and post-rift (Figure 2), providing a comprehensive understanding of its geological evolution [16].
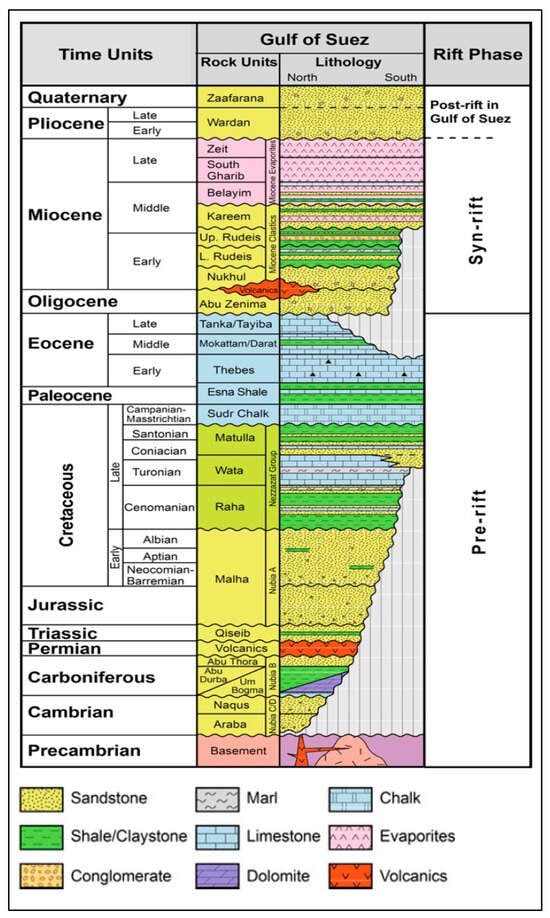
Figure 2.
Gulf of Suez stratigraphy (modified after [16]).
2.1. Pre-Rift Sequences (Cambrian to Oligocene)
In the Gulf of Suez, the pre-rift sequences consist of thick alternating siliciclastic/carbonate sedimentary units that overlie Precambrian basement rocks.
2.1.1. Nubia Sandstone (Paleozoic to Early Cretaceous)
The predominant component in this formation is sandstone, with minor streaks of shale and carbonate. In the Suez Rift, this sandstone is up to 1800 ft thick. The Nubia Sandstone is divided into two main formations: the Nubia-B Formation (Carboniferous–Permian) and the Nubia-A Formation (Jurassic–Early Cretaceous) (Figure 3). Within the Nubia-A Formation, there are two distinct members: the Nubia-A Lower Member (Jurassic), ranging from 7270 to 9400 ft, and the Nubia-A Upper Member (Early Cretaceous), ranging from 7070 to 7270 ft, which corresponds to the Malha Formation in outcrops of the Aptian–Albian age (Figure 3).
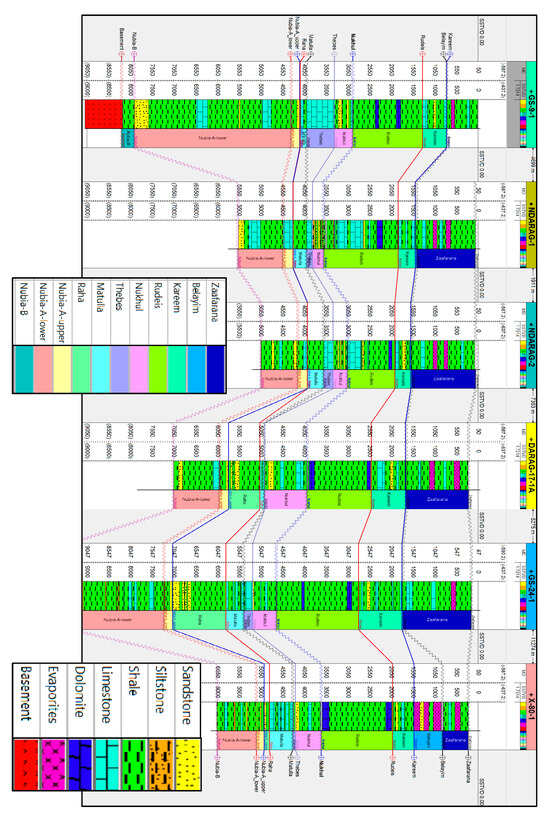
Figure 3.
Well correlation between GS-9-1, NDarag-1, NDarag-2, Darag-17-A, GS-24-1, and X-80-1 wells in the north Abu Darag sub-basin. For location, see Figure 1.
In the Permo–Carboniferous Nubia-B Formation, shale is the predominating lithology, encountered only in the GS-9-1 well in the northern part of the study area. The Jurassic–Early Cretaceous Nubia-A Formation is characterized by a thick lower part (approximately 1000–2000 ft) comprising shale with sandstone and limestone intercalations, and a thin upper part (approximately 100–200 ft) with shale and limestone intercalations. The Nubia-A Formation is separated from the Nubia-B Formation by a significant unconformity due to Triassic regional uplift (Figure 3). This unconformity can be detected in the GS-9-1 well only where the Jurassic Nubia-A Formation lies unconformably on the Carboniferous Nubia-B Formation.
2.1.2. Mixed-Facies Sequence (Upper Cretaceous)
The Upper Cretaceous marine sequence consists of the Coniacian–Santonian Matulla Formation, the Turonian Wata Formation, and the Cenomanian Raha Formation. The Raha Formation is made up of calcareous shale, thin limestone intercalations, and fine-grained pyritic and glauconitic sandstone. The Wata Formation features interspersed sandstone and shale strata with extensive sequences of fossiliferous dolomite and limestone. The Matulla Formation includes lower fluvial-marine sandstone and upper shale units [17], with a thickness of 100 to 500 ft, found in the studied wells. The lower Eocene Thebes Formation unconformably overlies the Matulla Formation, where the Campanian-Maastrichtian Sudr Chalk and Paleocene to Early Eocene Esna Shale are completely absent (Figure 3) due to tectonic uplift and the effects of the Syrian Arc System swell [18].
2.2. Syn-Rift Sequences
The early phases of the region’s rifting are represented by the red beds of the Abu Zenima Formation and Early Rift Volcanics (Figure 3). The Abu Zenima Formation is geographically localized around the Abu Zenima area on the eastern border of the Suez Rift [19] and is not reported in the studied wells.
2.2.1. Nukhul Formation (Aquitanian)
The Nukhul Formation was deposited in marginal marine to shelf settings, over pre-rift and early rift rock strata. It can reach notable thicknesses of up to 500 ft in downdip sections of inclined fault blocks. The 500 ft-thick Nukhul Formation was intersected in all wells and comprises shale with interbed sandstone and limestone (Figure 3). The sandstones of the Nukhul Formation are considered as the main reservoir in the north Abu Darag sub-basin [3].
2.2.2. Rudeis Formation (Langhian–Burdigalian)
It is divided into two sections: the Lower Rudeis (Burdigalian) and the Upper Rudeis (Langhian), separated by an angular unconformity. This unconformity is linked to the mid-Clysmic event, as proposed by [20,21]. The Early Miocene Lower Rudeis Formation is characterized by shale with dolomitic limestone interbeds, which overlays the Nukhul Formation unconformably (Figure 3).
2.2.3. Kareem Formation (Langhian-Serravallian)
The Kareem Formation has anhydrite at its base (Figure 3), which suggests that the sea level dropped following the Upper Rudeis’ deposition. The Kareem Formation’s sands reflect elevation of the rift shoulders, suggesting a break between the Kareem and Rudeis Formations [22].
2.2.4. Belayim Formation (Serravallian)
The Sidri and Hammam Faraun members are clastic/carbonate members that alternate with the two evaporite members, the Baba and Feiran members. The principal characteristics of the Hammam Faraun Member are reefal carbonate rocks in the eastern onshore section of the Suez Rift and the southern half of the Esh El Mellaha Block on the western side of the rift [23]. The thick evaporites of the Belayim Formation are only encountered in the X-80-1 well in the southern part of the Abu Darag sub-basin (Figure 3).
2.3. Post-Rift Sequences (Pliocene-Recent)
The Wardan and Zaafarana formations, representing the strata in the Suez Rift’s post-rift sequence, indicate persistent extensional tectonic activity during their deposition (Figure 2). The thickening of these sedimentary layers suggests continuous fault displacement throughout the Pliocene and more recent epochs [24]. Despite their recognition as effective seals in the Gulf of Suez Petroleum Province, the thick evaporites of the Late Miocene South Gharib and Zeit formations are notably absent in the studied wells, likely due to significant tectonic paleo-highs. The Quaternary Zaafarana Formation comprises sandstone, shale, and limestone interbeds with anhydrite overlaying unconformably the middle Miocene Kareem and Belayim formations (Figure 3).
3. Materials and Methods
For this investigation, 69 cutting samples were selected from the GS-24-1 well (Table 1) because this well penetrated a sequence from the Jurassic to the Miocene. A cut of each sample was washed and any contaminants or cavings were removed. Solvent cleaning by acetone was used to dissolve and remove the hydrocarbon-based mud additives. The process does not leave behind any residue and helps to further clean the sample after the initial oil removal. It also ensures that the hydrocarbon-based mud additives do not interfere with subsequent analyses and testing. The sample was then air dried at room temperature, to prevent any loss of free hydrocarbons. Rock material was pulverized and passed through a 40 mesh sieve. Between 20.0 and 200.0 mg of pulverized rock was then accurately weighed into a Pyrex beaker and reacted with 10% (vol) concentrated HCI to dissolve carbonate minerals. The acid mixture was heated to 70 °C if dolomite was present. Once the reaction was complete, the sample was transferred to a microfiber filter paper using a Millipore filter apparatus. The filter paper, with the sample, was then transferred to a LECO crucible and dried. CO2 generated by the combustion of organic matter (OM) in the sample was quantitatively measured using an infrared detector.

Table 1.
The GS-24-1 well’s total organic carbon and Rock-Eval pyrolysis data.
A Rock-Eval 6® (Vinci Technologies, Nanterre, France) instrument [25] was used to determine total organic carbon (TOC, wt%), Tmax (°C), and the amount of hydrocarbon released (mg HC/g rock) as measured under the S1 and S2 peaks. Care was taken to not saturate the Flame Ionization Detector (FID). The detector had a limit set by the manufacturer, which for Rock-Eval 6 was 125 mV (or S2 > 33 mg HC/g rock) [26]. Similarly, samples with an FID response lower than 0.1 mV (or S2 < 0.3–0.5 mg HC/g rock) were considered to fall below the reliable linearity range for the FID. The amount of CO and CO2 released during pyrolysis, and then during oxidation, was measured to quantify the portion of oxygen-containing OM (S3 peak; mg CO2/g rock) and refractory inert carbon (residual carbon; RC wt.%), respectively.
For vitrinite reflectance measurements (Table 2), cuttings were grinded to pass through a 40 mesh sieve. Depending on the TOC and S2 values, approximately 5–20 g per sample were placed in a suitable cup for acid digestion. Concentrated HCl and HF were used in this process. After acid digestion, the separated organic matter was rinsed, sieved, and floated on a heavy liquid. A small portion of the float material was used to prepare the slides for kerogen typing. The remaining floating organic matter/kerogen concentrate was used to prepare the vitrinite plugs (pellets) for Vitrinite Reflectance (Ro%) analysis. Vitrinite reflectance measurements were carried out following the protocol outlined in ISO 7404-2 [27], ISO 7404-5 [27], and ASTM D7708-14 [28]. About 10 g of kerogen concentrate sample were crushed into small fractions (ca. 840 µm) and homogenized into fine particles, which were then mixed in an epoxy resin (EpoThin “EpoThin is manufactured by Buehler Ltd., headquartered in Lake Bluff, IL, USA”) and a hardener (2:1 by volume) to produce the pellets. The pellets were grinded using cloths of 320 µm and 600 µm, respectively, and polished via two stages of alumina powder (0.3 µm and 0.05 µm) and water. A Zeiss Axio Imager® A2m microscope was used for VRo analysis, which was conducted under oil immersion objective (50×) with noil = 1.514 at 23 °C and a magnification of 500×.
Table 2.
The GS-24-1 well’s Ro%data.
Basin modeling of the Abu Darag sub-basin was accomplished by using geological data from the GS-24-1 well including formation tops, thicknesses (Table 3), and ages as obtained from a paleontological report [29].
Table 3.
The geological data used to construct the burial history model of the GS-24-1 well, including formation tops, thicknesses, erosion, and geological times.
The thicknesses of the eroded sections along major unconformities were calculated using the Vitrinite reflectance-depth plot according to the method of [12,30,31]. The missing times have been determined based on the palynological and foraminiferal report for the GS-24-1 well [29], and the thicknesses of other eroded units are correlated to the central part of the Gulf of Suez to obtain the average thickness as have been discussed in [18,32]. The burial history model was built using PetroMod 1D IES 2007. Other data used includes composite logs, mud logs, and electric well logs from the GS-9-1, North Darag (NDARAG-1 and 2), Darag-17-1A, X-80-1, GS-24-1, and GS-56-1 wells. The electric well logs include gamma ray (GR), resistivity (LLD, LLS, MSFL), neutron, density, and photoelectric measurement used for the petrophysical analysis of hydrocarbon bearing reservoirs. The petrophysical analysis was performed according to the workflow proposed by [33]. Well correlations and maturity maps were constructed using Schlumberger’s Petrel software 2020.
4. Results
4.1. Source Rock Evaluation
To assess the hydrocarbon potential of the Thebes, the Matulla, and Raha formations, and the Nubia-A Upper and Nubia-A Lower Members a number of geochemical parameters were used, as the use of TOC alone is unreliable when evaluating mature and over mature source rocks where TOC reflects the quantity of the residual (non-generating) organic matter, not the quality [34]. The 69 samples from the GS-24-1 well that were analyzed (Table 1) indicated that the sedimentary section contains source rocks with fair to excellent potential based on TOC values of 0.52 wt%–5.47 wt% and using the cut-off values of [35]. All samples from the Thebes, Matulla, and Raha formations and from the Nubia-A (Upper) and Nubia-A (Lower) members are plotted in the indigenous hydrocarbon zone (Figure 4).
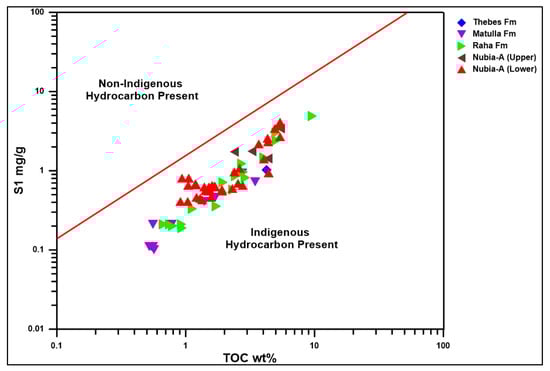
Figure 4.
Diagram of S1 vs. TOC (modified after [36]).
The quantity of the organic material increased from the Thebes Formation to the Nubia-A (Lower) Member where the TOC and S2 parameters indicate that the Thebes samples (TOC of 0.5 wt%–4.2 wt%, S2 of 0.8–27.1 mg/g) and Matulla (TOC of 0.5 wt%–3.4 wt%, S2 0.4–18.7 mg/g) have fair to very good source rock potential [35] (Figure 5).
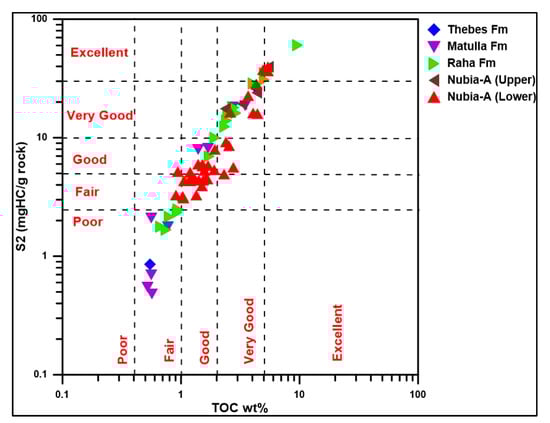
Figure 5.
S2 vs. TOC diagram (modified after [35]).
Additionally, the Raha Formation and the Nubia-A (Upper) Member (TOC of 2.3 wt%–5.4 wt%, S2 of 17.6–39.7 mg/g), and Nubia-A (Lower) Member (TOC of 0.9 wt%–5.4 wt%, S2 of 3.0–39.9 mg/g) are fair to excellent source rock potential [35] (Figure 5).
According to the plot by [37], most studied samples have fair to good oil source rock potential (Figure 6).
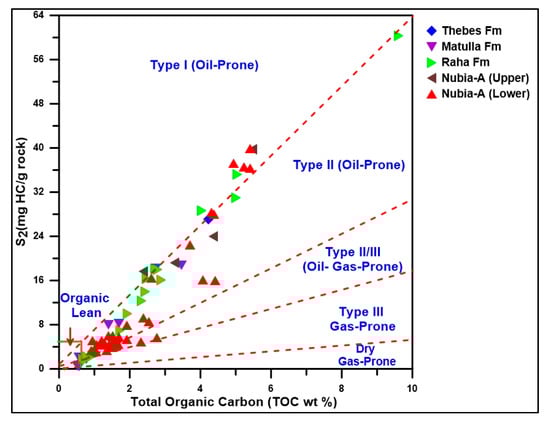
Figure 6.
Plot of S2 vs. TOC (based on [38]).
According to the plots of [38] and the hydrogen index values [39], the Thebes (HI: 156–642 mg HC/g TOC) and the Matulla (HI: 84–665 mg HC/g TOC) formations contain source rocks rich in kerogen Type II (oil-prone) and mixed Type II/III) (oil/gas prone) (Figure 7). The Raha Formation (HI: 223–698 mg HC/g TOC), the Nubia-A (Upper) Member (HI: 550–741 mg HC/g TOC), and the Nubia-A (Lower) Member (HI: 204–753 mg HC/g TOC) are oil-prone (contain Type I and Type II kerogen) and mixed oil/gas (contain Type II/III kerogen) (Figure 7).
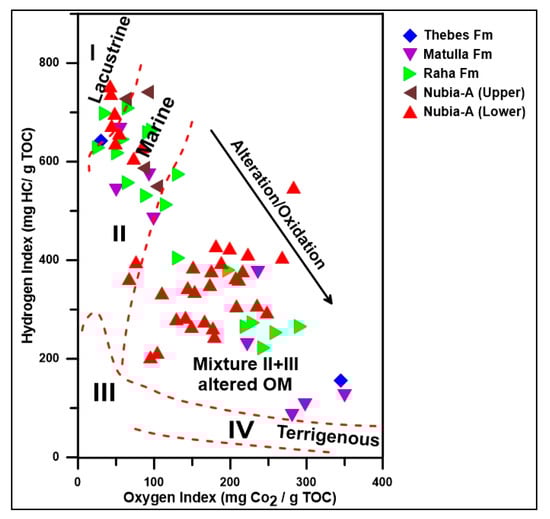
Figure 7.
Plot of HI vs. OI (based on [39]).
The composition of organic matter and its thermal maturity are two important geochemical parameters [12,31,40]. Thermal maturity causes changes in the geochemical parameters (TOC, S2, HI, PI, and Tmax). The organic matter of the samples varied in maturity from the beginning of the oil window to the peak of the oil window. Vitrinite reflectance (Ro%) is an important indicator of organic matter maturity, which can also be used in the calibration of the burial history model.
In this investigation, ten chosen samples had their vitrinite reflectance assessed. The Ro% increased with depth, as expected, and the plot showed that the Matulla and Raha formations, and the Nubia-A (Upper) Member are situated in the beginning of the oil window. The Nubia-A Lower Member is the effective source rock where Ro% values range from 0.68% to 0.77% (Table 2) and is situated near the peak of the oil window (Figure 8). The comparison between Tmax values (range from 424 to 436 °C) and Ro%values (range from 0.65% to 0.77%) is more reliable to indicate the maturity impacts, where the organic matter in the Matulla and Raha formations and the Nubia-A (Upper) Member is situated in the beginning of the oil window. The organic matter in the Nubia-A Lower Member is situated near the peak of the oil window.
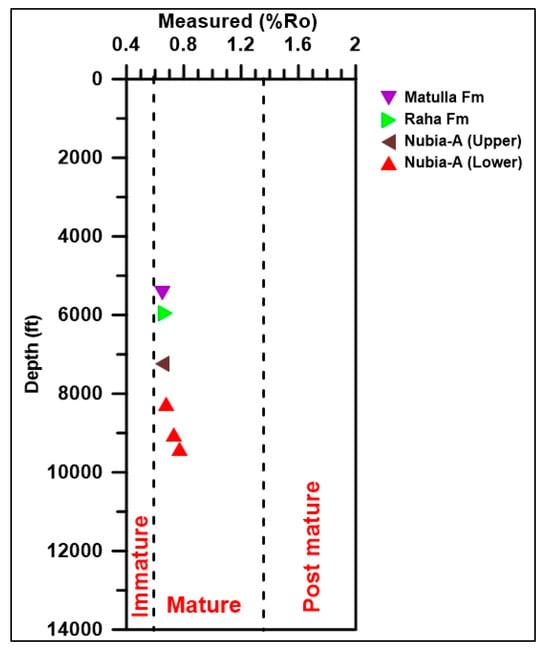
Figure 8.
Measured vitrinite Ro% vs. depth profile (in feet) of GS-24-1 well (based on [35]).
4.2. Reservoir Petrophysics
The Gulf of Suez’s Miocene and Paleozoic sandstone formations provide a substantial reserve for hydrocarbon exploration and extraction [41].
The Miocene sandstones, especially the Nukhul Formation, are among the Gulf of Suez’s most significant reservoir units. The Nukhul Formation also thins toward the Gulf of Suez’s edges after reaching its greatest thickness in the central offshore region [32]. This reservoir produces gas and oil from the Hareed Field as well as from the Rudeis, Sidri, GS 173, Zeit Bay, Ashrafi, Gemsa, Hilal, SE, and Darag fields [32,41]. It accounts for about 11.5% of the region’s production potential, with porosities ranging from 17% to 25% [41].
The structure map to the top of the Nukhul Formation in North Darag shows that the formation dips almost uniformly from the NE to the SW (Figure 9). Sandstone and shale interbeds alternate in the Nukhul Formation in the NDARAG-1 borehole. The petrophysical analysis calculated 126 ft average net pay (NEP), 19% average shale volume (Vsh), 17% average effective porosity (PHIE), and 57% average water saturation (SW) (Figure 10).
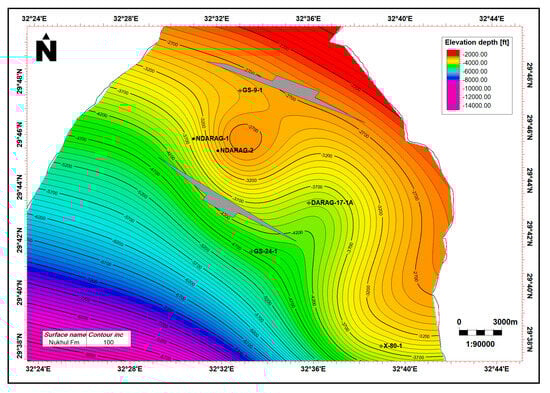
Figure 9.
A structure map to the top of the Nukhul Formation in the north Abu Darag sub-basin. The gray lines represent normal faults.

Figure 10.
A litho-saturation cross-plot of the Nukhul Formation in the NDARAG-1 well.
The Paleozoic sandstones are mature and well-sorted. Reservoirs are found in the Nubian sandstone and make up the pre-rift reservoirs in the area. They are characterized by up to 60% recovery factors and net pay thicknesses reaching 300 ft. They exhibit good permeabilities of about 400 mD and porosity values of up to 29%.
4.3. Basin Modeling
From the Paleozoic to the Holocene, a complex history of tectonic and sedimentary processes is reflected in the GOS’s geological development [41]. In the Paleozoic, which was characterized by only slight tectonic movements, Precambrian crystalline strata were covered by terrigenous clastic deposits. Paleozoic strata were folded and uplifted by the Hercynian Orogeny, which caused a pause in sedimentation in numerous regions. As a result of these tectonic events, Cenomanian strata lie unconformably on top of Carboniferous strata in several parts of the GOS [16]. Sandstones and fluvio-marine red shales were deposited from the Permian–Triassic to the Jurassic because of minor transgressions and local subsidence where grabens and depressions were created because of tension-induced rifting of the continental crust [4].
Later, nonmarine sandstone and shale deposits filled these grabens during the Early Cretaceous. At this time, normal faults persisted, leading the graben system to progressively sink and form a deep basin. Mesozoic and Paleogene strata were deformed by significant tectonic compression in the Late Miocene–Pliocene time, where a sequence of folds developed in regions impacted by tectonic compression [8]. The modeling of the Abu Darag sub-basin was performed by constructing a 1D model for the GS-24-1 well. The 1D model demonstrates the subsidence history, sedimentation rates, maturation history, and starting time and development of hydrocarbon generation at the well location and provides valuable information about the basin’s history [42].
4.3.1. Boundary Conditions and Model Calibration
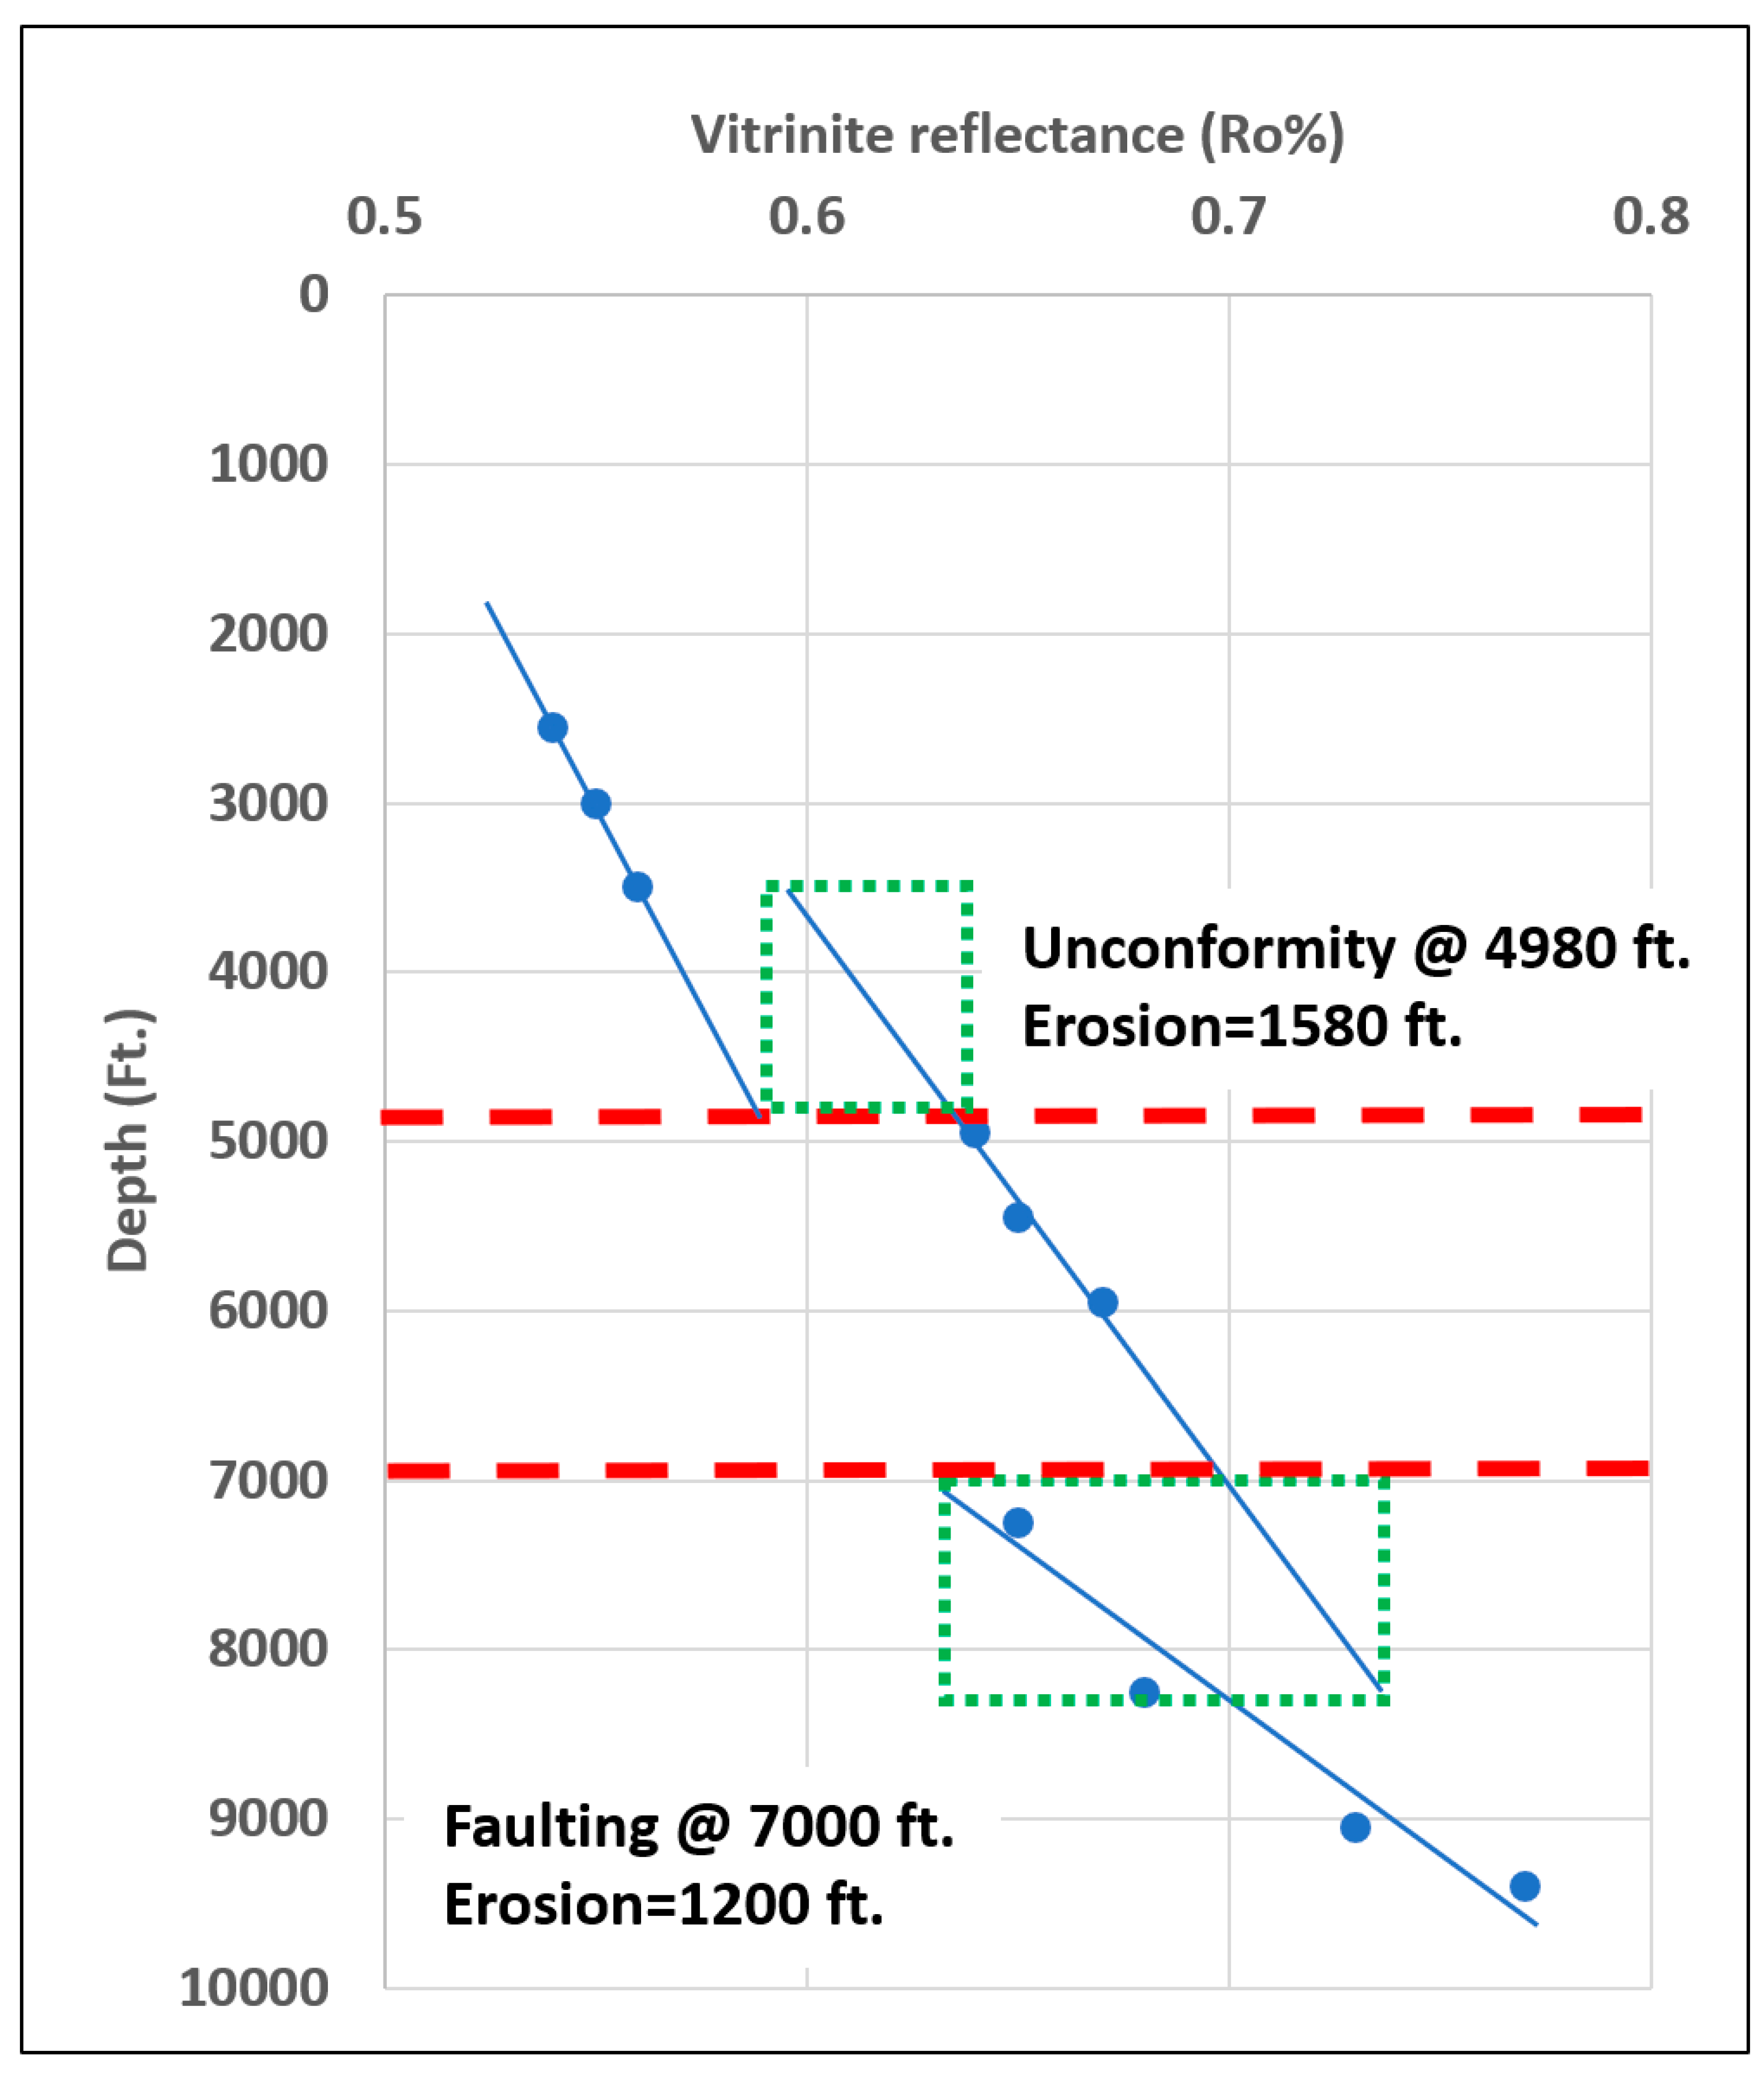
An increase in temperature in response to geothermal gradient results in an increase in vitrinite reflectance (Ro%) with depth, thus an increase in thermal maturity. Both the vitrinite reflectance and geothermal gradient values should show a gradual increase with depth and burial, unless the vitrinite reflectance values are affected by uplift and erosion [43]. The basin model shows the effect of erosion in the Cretaceous and Oligocene times, and the Dow method [30] was used here to estimate the amount of erosion using the vitrinite reflectance data. Dow [30] developed a method using a linear depth-versus-vitrinite reflectance plot to calculate the thickness of a missed section when this linear relationship is affected by unconformity, faulting, or volcanic influence. The depth-versus-vitrinite reflectance plot of the GS-24-1 well showed two missing sections (Figure 11). The first missing section is due to faulting and equals 1200 ft in thickness at 7000 ft depth. It is related to faulting and uplifting by the end of the Early Cretaceous. The second missing section is due to erosion and equals 1580 ft in thickness at 4900 ft depth. It is related to uplifting and erosion in the Oligocene, where the Abu Zenima Formation is absent. Other unconformities were detected by means of paleontology [29] and well correlation, i.e., Esna Shale and Belayim formations are absent in the Abu Darag sub-basin while they are present in the Central GOS [18,32]. According to Dow [30], in maturity profiles in faulted geological settings, the vertical displacements can be calculated by projection as unconformities. In the case of the GS-24-1 maturity profile (Figure 11), there are no rocks having higher maturity present on top of rocks having lower maturity. The maturity increases with depth from 5000 to ~10,000 feet, offsetting the maturity profile because of faulting. Faulting, and probable uplift of the faulted blocks followed by erosion, could be the cause of this maturity profile offsetting.
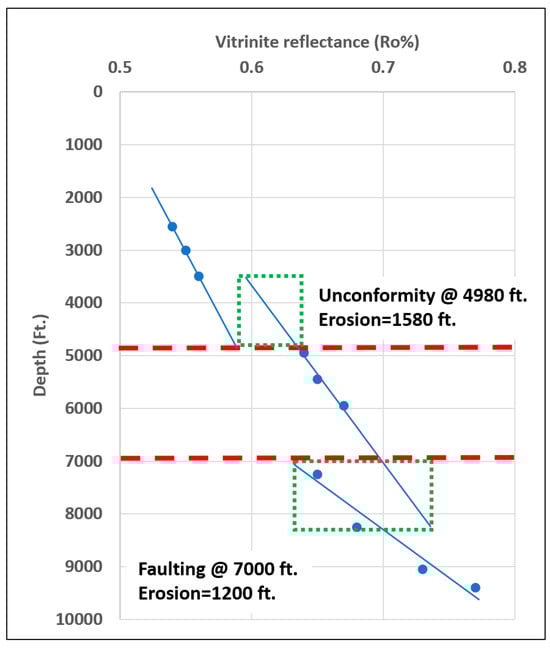
Figure 11.
An estimation of the amount of eroded section in the GS-24-1 well (modified after [30]).
The temperature of the sediment–water interface at the top and the paleo-heat flow at the bottom are the boundary conditions required to build a 1D basin model [44,45]. Based on the paleontological and foraminiferal analysis of ditch samples for the GS-24-1 well, an approximate paleowater depth has been determined [29]. Paleolatitude and water depth, which are synthesized, affect the temperature at the sediment–water interface [46].
The boundary conditions of the GS-24-1 wells are represented in Figure 12a–c. Based on paleontological data, the oldest paleowater depth recorded was 50 ft during the Carboniferous–Permian (330 Ma) in the Abu Darag sub-basin (Figure 12a). The maximum paleowater depth (400 ft) was recorded during the Late Cenomanian to Turonian (93 Ma). Based on the current geographic latitude of 29° north of the paleowater depth, the sediment–water interface temperature (SWIT) was computed. The SWIT (Figure 12b) reached a maximum of 30 °C during the Late Jurassic (150 Ma) and a minimum of 18 °C recently. In the northernmost sub-basin and near the intersection with the Red Sea, the mean heat flow increases from ~57 mW/m2 in the northern most sub-basin to ~86 mW/m2 near the junction with the Red Sea [47]. The assumed heat flow value in this study ranges between 55 and 65 [mW/m2], as shown in Figure 12c, and the used heat flow is in accordance with [47]. According to [48], the heat flow for continental Paleozoic, Mesozoic, and Cenozoic sedimentary rocks is between 61 and 64 mW/m2, and this is lower than in the Oceanic crust (101 ± 2.2 mW/m2). The assumed heat flow value was calibrated by the measured vitrinite reflectance for the modeled well [49,50] (Table 2). The corrected bottom hole temperature (CBHT) in the GS-24-1 well equals 133 °C at 9350 ft. depth, and the calculated geothermal gradient equals 12.7 °C/1000 ft. The modeled temperature gradient is well calibrated by the calculated temperature gradient, as shown in Figure 13.
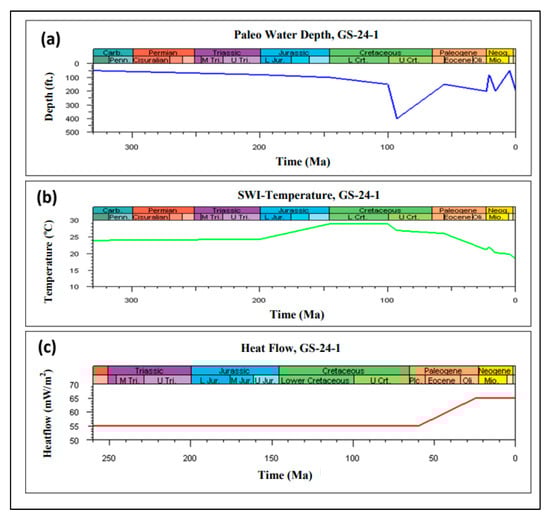
Figure 12.
Boundary conditions for GS-24-1 well: (a) paleowater depth, (b) surface water temperature interface, (c) heat flow.
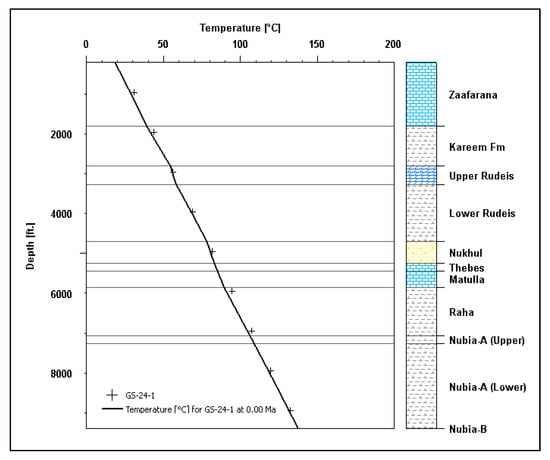
Figure 13.
Geothermal gradient and modeled temperature for GS-24-1 well.
4.3.2. Sedimentation and Subsidence Rate
The accumulation of sediments in a basin is the result of the interaction of subsidence rate, sediment influx, and the height of the water column [31,51]. The sedimentation rate may be computed by measuring the amount of sedimentary succession that accumulated over time, and periods of erosion or non-deposition are also included. The sedimentation rate models of the GS-24-1 well (Figure 14) show that the first sequence was initiated by the deposition of Paleozoic clastics on the Precambrian basement with the lowest sedimentation rate (~2 m/Ma or ~7 ft/Ma) during the deposition of the Nubia-A and Nubia-B formations in the Abu Darag sub-basin. This is because the rate of deposition is low where tectonic subsidence rate is low, and sediment influx is also low.
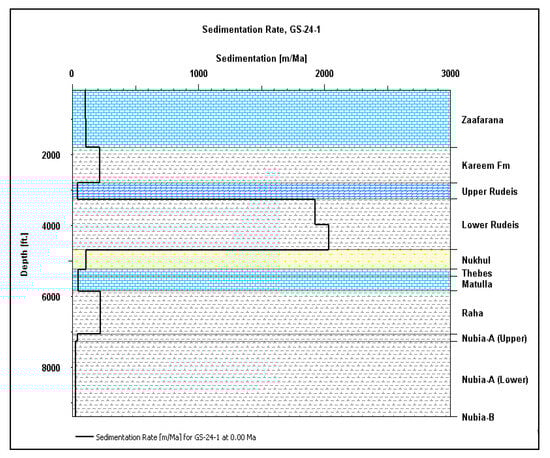
Figure 14.
The sedimentation rate model of the GS-24-1 well.
The rate of deposition increased during the Cenomanian age (~20 m/Ma or ~67 ft/Ma) when the marine shales of the Raha Formation were deposited because of a marine transgression. The carbonates of the Matulla and Thebes formations were deposited at a lower rate (~5 m/Ma or 16 ft/Ma) during the Late Cretaceous to Eocene time at the end of deposition of the pre-rift sequence. The second sequence started in the Early Miocene where rifting was initiated by the deposition of the Nukhul Formation clastics with a sedimentation rate of ~10 m/Ma (~33 ft/Ma). The maximum sedimentation rate recorded in this cycle is approximately 2000 m/Ma (~7000 ft/Ma) when the shales and sandstones of the Lower Rudeis Member were deposited. This is because rifting and subsidence continued at a higher sedimentation rate than rift initiation. By the end of this sequence, the Upper Rudeis Member and the Kareem and Zaafarana formations were deposited with lower rates (~10–20 m/Ma or ~33–67 ft/Ma).
4.3.3. Burial History Modeling and Hydrocarbon Generation
The burial history model of the GS-24-1 well was constructed by the Petromod 1D IES software (2007) using the vitrinite reflectance cracking method of [52]. This method is commonly used in petroleum geology to simulate the thermal maturation of organic matter in sedimentary basins over geological time scales. It helps to understand the generation and migration of hydrocarbons in the subsurface. Vitrinite reflectance was calculated using EASY %Ro method (simplified Vitrinite method). The model (Figure 15) shows gradual subsidence and deposition of the Abu Darag sub-basin from the end of the Paleozoic until the end of Early Cretaceous (260–110 Ma). During the Late Cretaceous (110–100 Ma), the basin was subjected to a major uplift, followed by erosion. By the end of the Cretaceous (95–66 Ma), the basin continued to subside. The Esna shale of the Paleocene age (66–56 Ma) is absent due to uplift and erosion as evident from paleontology and lithological description in the GS-24-1 well. A thick accumulation of fluvial and fluvio-marine deposits took place during the Eocene (56–33 Ma), which coincided with the syn-rift phase of the GOS’s geologic history. The Oligocene Abu Zenima Formation is absent due to uplift caused by tectonic movements (~33–23 Ma). Throughout the Miocene, rifting persisted, resulting in the deposition of the limestone, sandstone, and shale of the Rudeis, Kareem, and Nukhul formations (~23–11 Ma). By the end of the Miocene (~11–5 Ma), a minor uplift caused the erosion of the Belayim, South Gharib, and Zeit evaporites.
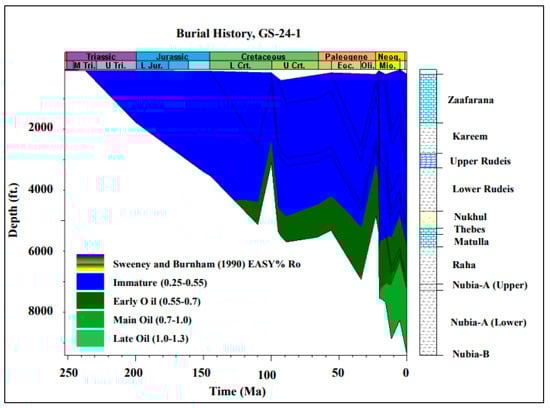
Figure 15.
The GS-24-1 well’s burial history model.
Based on the constructed burial history model (Figure 14), the onset and depth of early oil generation (%VRo 0.55–0.70) and main oil generation (%VRo 0.70–1.0) are summarized in Table 4. The model in Figure 15 is well calibrated because Nubia-A (Lower) is in the main oil generation (0.7%–1.0%VRo) and is not in the late generation. In addition, three samples in Nubia-A (Lower) have %VRo values of 0.68, 0.73, and 0.77 at depths 8250, 9050, and 9400 ft, respectively.
Table 4.
The onset and depth of the early and main oil generation in the GS-24-1 well.
The early oil generation occurred during the Early Cretaceous (~132 Ma) and the depth of early oil window is located at a depth of 4000 ft. The main oil generation occurred during the Early Miocene (~22 Ma) and the depth of the early oil window is located at a depth of 7400 ft. Only the Nubia-A Lower Member entered the main oil window and is proved to be an effective source rock capable of generating hydrocarbons in the study area.
4.3.4. Maturity Mapping
The basic kinetic models of [53] were used to compute maturity and transformation ratio. Two boundary conditions are required for the temperature calculation: the basal heat flow with thermal conductivity of the overburden and the sediment–water interface temperature (SWIT). Geothermal gradient is a function of the basal heat flow and thermal conductivity. The average thermal gradient value in the study area was assigned as 2.5 °F/100 ft and the sediment–water interface temperature was 77 °F. The modeled well was extrapolated into a 2D map in Figure 15 and Figure 16. The idea in the Exploration Geology module in the Petrel software is to extrapolate maturity data from one well using the simple kinetic model of [53] and using the geothermal gradient in other wells as an indication of thermal maturity with depth. The structure map of the Nubia-A Lower Member was selected to calculate maturity and hydrocarbon generation as a 2D model, since it is the main and effective source rock based on the 1D burial history modeling results. The age of the Nubia-A Lower Member was set as 200 Ma (Jurassic age) with paleowater depth of 80 ft. The average thickness of the Nubia-A Lower Member equals 1300 ft. The resulting vitrinite reflectance map indicates that most of the area is located in the main oil window (Ro% 0.75%–1.0%) at depths greater than 5000 ft (Figure 16).
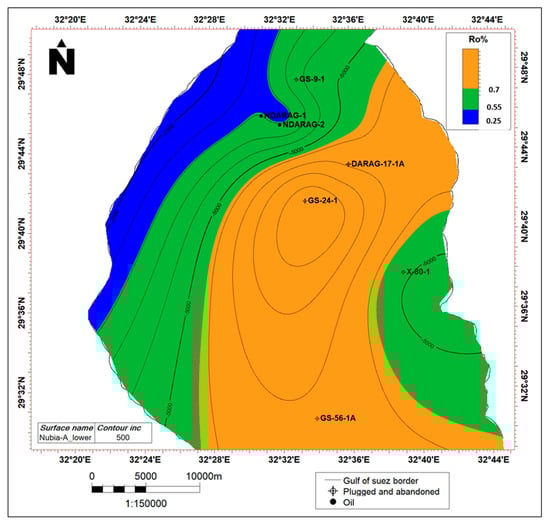
Figure 16.
Vitrinite reflectance (VRo%) map of Nubia-A Lower Member. Contour lines in feet.
The early oil window (Ro% 0.55%–0.75%) is located in the northwest and southeast of the study area at depths between 3000 and 5000 ft. In general, the maturity of the Jurassic Nubia-A Lower Member increases toward the GS-24-1 well, which is located in the deeper part of the study area, and decreases toward the northwest and southeast. The transformation ratio, which is a quantitative change in the original organic material based on the total organic carbon and the hydrogen index in the source rock, represents the formation of hydrocarbons. The transformation ratio (TR) of the active hydrocarbon kitchen is greater than 20% [54]. The computed transformation ratio map shows that the active hydrocarbon kitchen occupies most of the area at depth below 5500 ft, and the northwestern part of the study area is inactive (TR is <10%), while hydrocarbon generation increases to the middle of the Abu Darag sub-basin where TR is >60% (Figure 17).
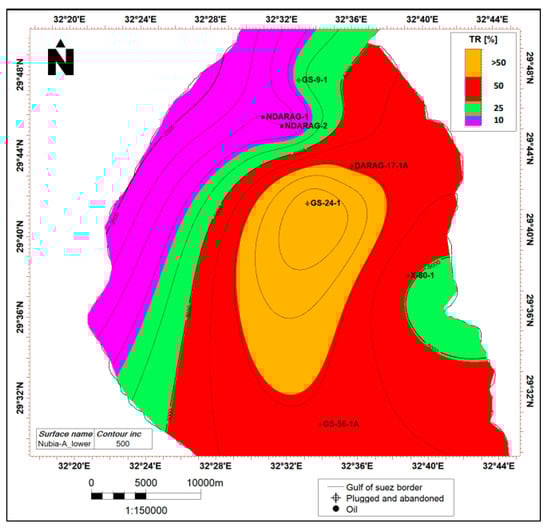
Figure 17.
Transformation ratio (TR%) map of Nubia-A Lower Member. Contour lines in feet.
4.4. Peroleum System of Abu Darag Sub-Basin
A petroleum system includes all elements of petroleum generation and accumulation in a basin [55]. These components include geological formations that create petroleum traps, such as source, reservoir, and seal rocks, as well as impermeable faults that act as seals for the movement of hydrocarbons, and permeable faults which act as migration pathways for hydrocarbons. The petroleum system events chart for the Abu Darag sub-basin is shown in Figure 18. It is based on the GS-24-1 well and includes all elements of a petroleum system. The timing of these elements is important for the entrapment of the generated hydrocarbons. The probable shale source rocks were deposited from the Jurassic to the Eocene throughout the geologic history of the basin and only the Nubia-A Lower Member is proved to be the effective source rock in the basin according to its organic geochemical data. The sandstone reservoir rocks of the Nukhul and Rudeis formations were deposited during the Miocene (23–5.3 Ma). Oil generation, migration, and accumulation began in the Late Oligocene (~22 Ma). The structural traps evolved during the period from Late Cretaceous to Late Miocene (100–15 Ma). Those traps were later charged by hydrocarbons through migration and accumulation, which is characteristic of all the northern Gulf of Suez sub-basins in Egypt. Migration could occur when hydrocarbons move directly from the low permeable source rock to the permeable reservoir upon generation and expulsion [9]. Migration could also be secondary and vertical along fault planes or lateral by up-dip migration and fault juxtaposition [55].
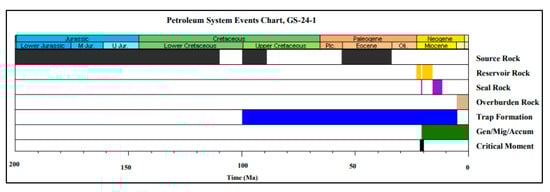
Figure 18.
The Petroleum System in the Abu Darag sub-basin, based on the GS-24-1 well.
The only producing wells are located in the northwestern part of the study area, in the North Darag wells, where conditions are favorable for hydrocarbon entrapment and preservation and also where structures are well developed. Thus, secondary migration could have taken place in a northwest direction where faults are located and may play an important role if they are permeable or by juxtaposition. The main risk for hydrocarbon accumulation in the Abu Darag sub-basin is the absence of a seal due to the erosion and/or non-deposition of the Belayim, South Gharib, and Zeit evaporites, which are the most effective seals in the GOS basin [41].
5. Discussion
The geochemical assessment of the Thebes, Matulla, Raha, and Nubia-A (Upper and Lower) formations from the GS-24-1 well provides a comprehensive evaluation of their hydrocarbon potential, indicating significant variability and overall favorable conditions for hydrocarbon generation. Total organic carbon (TOC) values across these formations range from 0.52 wt% to 5.47 wt%, classifying them as having fair to excellent source rock quality. This range suggests that the sedimentary section includes a spectrum of organic richness, with certain intervals displaying particularly high organic content that enhances their potential for hydrocarbon generation.
HI values reveal that the Thebes and Matulla formations are characterized by a mixture of oil-prone kerogen Types I and II, alongside some Type II/III, which indicates a capacity for both oil and gas generation. The Raha Formation and Nubia-A (Upper and Lower) members are predominantly oil-prone, with higher HI values indicative of more favorable conditions for oil generation. With HI values ranging from 204 to 753 mg HC/g TOC, these formations lean more towards oil-prone organic matter, particularly rich in Types I and II kerogen. This suggests a primary oil generation capacity with some potential for mixed oil/gas in the Nubia-A Lower Member.
The assessment of thermal maturity across the formations demonstrates that the Nubia-A (Lower) Member has the highest maturity levels among the samples analyzed, where the vitrinite reflectance (Ro%) values ranging from 0.68% to 0.77% indicate that this member lies near the peak of the oil window, suggesting optimal conditions for hydrocarbon generation. Complementing this, the Tmax values (424 to 436 °C) reinforce the interpretation of maturity and indicate that the organic matter in the Matulla and Raha formations, as well as the Nubia-A (Upper) Member, is at the beginning stages of the oil window, pointing to a potential for future hydrocarbon generation as maturation continues. Whereas the Nubia-A (Lower) Member stands out as the most promising source rock within this stratigraphic section, due to its advanced maturity, favorable TOC values, and high kerogen quality, suggesting strong potential for effective hydrocarbon generation. The combination of favorable TOC and HI values, along with optimal thermal maturity, positions this formation as a key target for further exploration and development in hydrocarbon resource assessment.
According to 1D basin modeling, the early oil generation occurred during the Early Cretaceous (~132 Ma) at a depth of 4000 ft., while the main oil generation occurred during the Early Miocene (~22 Ma) at a depth of 7400 ft. Only the Nubia-A Lower Member entered the main oil window and has proven to be an effective source rock in the study area. The maturity mapping of the Abu Darag sub-basin, using the Nubia-A Lower Member depth structure map, showed that the resulting vitrinite reflectance map indicates that most of the area is located in the main oil window (Ro% 0.75%–1.0%). The computed transformation ratio map shows that the active hydrocarbon kitchen occupies most of the area and the northwestern part of the study area is inactive (TR is <10%), while hydrocarbon generation increases to the middle of the Abu Darag sub-basin where the TR is >60%. The sandstone reservoir rocks of the Nukhul and Rudeis formations were deposited during the Miocene (23–5.3 Ma). Oil generation, migration, and accumulation began in the Late Oligocene (~22 Ma). The structural traps evolved during the period from Late Cretaceous to Late Miocene (100–15 Ma). Those traps were later charged by hydrocarbons through migration and accumulation. The producing wells are located in the northwestern part of the study area, where conditions are favorable for hydrocarbon entrapment and preservation and also where structures are well developed. Thus, secondary migration could have taken place in a northwest direction. The main risk for hydrocarbon accumulation in the Abu Darag sub-basin is the absence of a seal due to the erosion and/or non-deposition of the evaporites.
6. Conclusions
- The present study concludes that the Gulf of Suez’s Miocene and Paleozoic sandstone formations offer a significant resource for hydrocarbon exploration and extraction. The mature, well-sorted sandstones contain reservoirs with up to 60% recovery factors, good permeabilities of about 400 mD, and porosity values of up to 29%.
- The Nukhul Formation shows a titled fault block bound by two major normal faults trending WNW-ESE.
- The petrophysical analysis in the North Darag-1 well calculated 126 ft average net pay (NEP), 19% average shale volume (Vsh), 17% average effective porosity (PHIE), and 57% average water saturation (SW). Sedimentation rate models of the GS-24-1 well showed two sequences. The first sequence shows that the rate of deposition increased during the Cenomanian when the marine shales of the Raha Formation were deposited. The second sequence was initiated in the Early Miocene when rifting started along with the deposition of shales and sandstones of the Lower Rudeis Member.
- The burial history model shows gradual subsidence and deposition in the Abu Darag sub-basin from the Paleozoic until the Early Cretaceous. By the end of Early Cretaceous, the basin was subjected to a major compression and uplift followed by erosion. In the extreme northern GOS, the effects of the Syrian Arc System have led to the absence of Upper Cretaceous–Paleocene deposits. This was followed by subsidence during the Early Eocene epoch and subsequently, the area underwent uplift during the Oligocene, which occurred during the syn-rift phase. Throughout the Miocene, rifting persisted, resulting in the deposition of the Rudeis, Kareem, and Nukhul formations. The Belayim, South Gharib, and Zeit evaporites were eroded before the end of the Miocene due to uplift which is considered as the main risk for hydrocarbon accumulation. The early oil generation took place in the Early Cretaceous, and the early oil window is 4000 ft deep. The Early Miocene saw the most oil generation, and this window of time was 7400 ft deep. In the research region, only the Nubia-A Lower Member (Late Triassic–Late Jurassic) has been shown to be a viable source rock capable of producing hydrocarbons.
- The modeled vitrinite reflectance map of Nubia-A Lower Member indicates that most of the area is located within the main oil window (Ro% 0.75%–1.0%) at a depth > 5000 ft. The maturity of the Jurassic Nubia-A Lower Member increases toward the GS-24-1 well and decreases toward the northwest and southeast. The northwestern part is inactive (TR < 10%), while hydrocarbon generation increases to the middle of the Abu Darag sub-basin where TR is >60%. The geologic traps formed during the Late Cretaceous and Miocene rifting phase and were later charged by hydrocarbons through migration and accumulation in the Late Oligocene.
Author Contributions
Conceptualization, S.F., M.F., A.S.Z., M.A., A.S., K.A.-K., T.G. and L.J.; Data Curation, S.F., M.F., A.S.Z., M.A., A.S., K.A.-K., T.G. and L.J.; Formal Analysis, S.F., M.F., A.S.Z., M.A., A.S., K.A.-K., T.G. and L.J.; Funding Acquisition, A.S.Z., L.J. and T.G.; Investigation, S.F., M.F., A.S.Z., M.A., A.S., T.G. and L.J.; Methodology, S.F., M.F., A.S.Z., M.A., A.S., K.A.-K., T.G. and L.J.; Project Administration, S.F., M.F., A.S.Z., M.A., A.S., K.A.-K., T.G. and L.J.; Resources, S.F., M.F., A.S.Z., M.A., A.S., K.A.-K., T.G. and L.J.; Software, S.F., M.F., A.S.Z., M.A., A.S., K.A.-K., T.G. and L.J.; Supervision, S.F., M.F., A.S.Z., M.A., A.S., K.A.-K., T.G. and L.J.; Validation, S.F., M.F., A.S.Z., M.A., A.S., K.A.-K., T.G. and L.J.; Visualization, S.F., M.F., A.S.Z., M.A., A.S., K.A.-K., T.G. and L.J.; Writing—Original Draft, S.F., M.F., A.S.Z., M.A., A.S., T.G. and L.J.; Writing—Review and Editing, S.F., M.F., A.S.Z., M.A., A.S., K.A.-K., T.G. and L.J. All authors have read and agreed to the published version of the manuscript.
Funding
L.J. and the CORE lab are supported by the Fundação de Amparo à Pesquisa do Estado de São Paulo (FAPESP) project 2016/24946-9. A.S.Z. is also supported by FAPESP grant number 2022/08285-3.
Data Availability Statement
Data supporting this paper are available based on request.
Acknowledgments
The authors would like to thank the EGPC and the Gulf of Suez Petroleum Company for allowing them to use the geochemical data and electric well logs for the wells that are being investigated for this study. K.A.-K thanks the Research Support project number (RSP-2024R139), King Saud University, Riyadh, Saudi Arabia.
Conflicts of Interest
The authors declare no conflicts of interest. M.F and A.S are employees of Khalda Petroleum Company and Egyptian General Petroleum Corporation, respectively. The paper reflects the views of the scientists and not the company.
References
- Said, R. The Geology of Egypt; Balkema: Rotterdam, The Netherland; Brookfield, WI, USA, 1990; p. 734. [Google Scholar]
- Shahin, A.N.; Hassouba, A.H.; Sharaf, L.M. Assessment of Petroleum Potential in the Northern Gulf of Suez. In Proceedings of the 12th Petroleum Exploration and Production Conference, Cairo, Egypt, 12–15 November 1994; Part I of II; pp. 152–174. [Google Scholar]
- Azab, A.A.; El-Khafeef, A.A. Fault Blocks of Abu Darag Basin, Northern Gulf of Suez, Egypt, as Deduced from Potential Field Data Interpretation. Discov. J. 2014, 25, 11. [Google Scholar]
- Shahin, A.N. Oil Window in the Gulf of Suez Basin, Egypt. AAPG Bulletin; American Association of Petroleum Geologists: Tulsa, OK, USA, 1 August 1988; p. 72. [Google Scholar]
- El-Gendy, N.; Barakat, M.; Abdallah, H. Reservoir Assessment of the Nubian Sandstone Reservoir in South Central Gulf of Suez, Egypt. J. Afr. Earth Sci. 2017, 129, 596–609. [Google Scholar] [CrossRef]
- Abdullah, E.A.; Al-Areeq, N.M.; Al-Masgari, A.; Barakat, M.K. Petrophysical Evaluation of the Upper Qishn Clastic Reservoir in Sharyoof Oil Field, Sayun-Masilah Basin, Yemen. ARPN J. Eng. Appl. Sci. 2021, 16, 2375–2394. [Google Scholar]
- Abdelwahab, F.M.; El Gendy, N.H.; Barakat, M.K.; Mohamed, M.S.; El-Tohamy, A.M.; El Terb, R.A.; El Feky, M.G. Radionuclide Content and Radiation Dose Rates of Uraniferous and Mineralized Granites at GV Occurrence in Gabal Gattar, Northeastern Desert, Egypt. Proc. J. Phys. Conf. Ser. 2022, 2305, 012006. [Google Scholar] [CrossRef]
- Azab, A.A.; Nabawy, B.S.; Mogren, S.; Saqr, K.; Ibrahim, E.; Qadri, S.T.; Barakat, M.K. Structural Assessment and Petrophysical Evaluation of the Pre-Cenomanian Nubian Sandstone in the October Oil Field, Central Gulf of Suez, Egypt. J. Afr. Earth Sci. 2024, 218, 105351. [Google Scholar] [CrossRef]
- Tissot, B.P.; Welte, D.H. Petroleum Formation and Occurrence; Springer: Berlin/Heidelberg, Germany, 2013. [Google Scholar]
- Espitalie, J.; Deroo, G.; Marquis, F. Rock-Eval Pyrolysis and Its Applications. Rev. De L Inst. Fr. Du Pet. 1985, 40, 563–579. [Google Scholar] [CrossRef]
- Welte, D.H.; Horsfield, B.; Baker, D.R. Petroleum and Basin Evolution; Springer: Berlin/Heidelberg, Germany, 1997; Volume 535. [Google Scholar]
- Waples, D.W. Geochemistry in Petroleum Exploration; Springer: Berlin/Heidelberg, Germany, 2013. [Google Scholar]
- Schlumberger Well Evaluation Conference, Cairo, Egypt; Schlumberger Middle East Surface: Abu Dubai, United Arab Emirates, 1984; Chapter 1; pp. 1–64.
- Schlumberger Well Evaluation Conference, Cairo, Egypt; Technical Editing Services, Ltd.: Chester, UK, 1995; p. 87.
- Bosworth, W.; Tari, G. Hydrocarbon Accumulation in Basins with Multiple Phases of Extension and Inversion: Examples from the Western Desert (Egypt) and the Western Black Sea. Solid Earth Discuss 2020, 2020, 1–31. [Google Scholar] [CrossRef]
- Moustafa, A.R.; Khalil, S.M. Structural Setting and Tectonic Evolution of the Gulf of Suez, NW Red Sea and Gulf of Aqaba Rift Systems. In The Geology of Egypt; Hamimi, Z., El-Barkooky, A., Martínez Frías, J., Fritz, H., Abd El-Rahman, Y., Eds.; Regional Geology Reviews; Springer International Publishing: Cham, Switzerland, 2020; pp. 295–342. ISBN 978-3-030-15264-2. [Google Scholar]
- Ghorab, M.A. Abnormal Stratigraphic Features in Ras Gharib Oilfield; Dar El-Kitab: Casablanca, Morocco, 1961. [Google Scholar]
- Farouk, S.; Sen, S.; Saada, S.A.; Eldosouky, A.M.; Elsayed, R.; Kassem, A.A.; Al-Kahtany, K.; Abdeldaim, A. Characterization of Upper Cretaceous Matulla and Wata Clastic Reservoirs from October Field, Central Gulf of Suez, Egypt. Geomech. Geophys. Geo-Energ. Geo-Resour. 2023, 9, 106. [Google Scholar] [CrossRef]
- Hantar, G. Remarks on the Distribution of Miocene Sediments in the Gulf of Suez Region. In Proceedings of the 5th Arabian Petroleum Congress, Cairo, Egypt, 16–23 March 1965; Cairo University: Cairo, Egypt, 1965; pp. 1–13. [Google Scholar]
- Garfunkel, Z. The Tectonics of the Suez Rift. Geol. Surv. Isr. Bull. 1977, 71, 1–44. [Google Scholar]
- Abu Shama, A.; El-Nahrawy, S.; Farouk, S.; Jovane, L.; Al-Kahtany, K.; Zaky, A.S. Calcareous Nannofossil Biostratigraphy, Bioevents, and Palaeoecological Interpretation of the Lower-Middle Miocene Outcrops in West Central Sinai (Egypt). Front. Earth Sci. 2024, 12, 1442241. [Google Scholar] [CrossRef]
- Evans, A.L. Miocene Sandstone Provenance Relations in the Gulf of Suez: Insights into Synrift Unroofing and Uplift History. AAPG Bull. 1990, 74, 1386–1400. [Google Scholar]
- Moustafa, A.R. Geologic Maps of the Eastern Side of the Suez Rift (Western Sinai Peninsula), Egypt. AAPG Map Ser. Scale 2004, 1, 9. [Google Scholar]
- Awney, F.; Hussein, R.; Nakhla, A. Blayim Marine and Land Oil Fields Structural Styles. In Proceedings of the Tenth EGPC Petroleum Exploration and Production Conference, Cairo, Egypt, 17–20 November 1990; Volume 1, pp. 400–430. [Google Scholar]
- Lafargue, E.; Marquis, F.; Pillot, D. Rock-Eval 6 Applications in Hydrocarbon Exploration, Production, and Soil Contamination Studies. Rev. L’institut Français Pétrole 1998, 53, 421–437. [Google Scholar] [CrossRef]
- Behar, F.; Beaumont, V.; Penteado, H.D.B. Rock-Eval 6 Technology: Performances and Developments. Oil Gas Sci. Technol. 2001, 56, 111–134. [Google Scholar] [CrossRef]
- ISO 7404-2; Methods for the Petrographic Analysis of Coals. ISO: Geneva, Switzerland, 2009.
- ASTM D7708-14; Standard Test Method for Microscopical Determination of the Reflectance of Vitrinite Dispersed in Sedimentary Rocks. ASTM International: West Conshohocken, PA, USA, 2014. [CrossRef]
- GUPCO GS-24-1; Final Well Report Well (Internal Report). Gulf of Suez Petroleum Company: Cairo, Egypt, 1977.
- Dow, W.G. Kerogen Studies and Geological Interpretations. J. Geochem. Explor. 1977, 7, 79–99. [Google Scholar] [CrossRef]
- Allen, A.P.; Allen, R.J. Basin Analysis: Principles and Applications, 2nd ed.; Blackwell Scientific Publications: Oxford, UK, 2005. [Google Scholar]
- Farouk, S.; Sen, S.; Belal, N.; Omran, M.A.; Assal, E.M.; Sarhan, M.A. Assessment of the Petrophysical Properties and Hydrocarbon Potential of the Lower Miocene Nukhul Formation in the Abu Rudeis-Sidri Field, Gulf of Suez Basin, Egypt. Geomech. Geophys. Geo-Energ. Geo-Resour. 2023, 9, 36. [Google Scholar] [CrossRef]
- Rider, M.H. The Geological Interpretation of Well Logs; Blackie: Glasgow, Scotland, 1986. [Google Scholar]
- Peters, K.E. Guidelines for Evaluating Petroleum Source Rock Using Programmed Pyrolysis. AAPG Bull. 1986, 70, 318–329. [Google Scholar]
- Peters, K.E.; Cassa, M.R. Applied Source Rock Geochemistry: Chapter 5: Part II. Essential Elements; AAPG: Tulsa, OK, USA, 1994. [Google Scholar]
- Jarvie, D.M.; Morelos, A.; Han, Z. Detection of Pay Zones and Pay Quality, Gulf of Mexico: Application of Geochemical Techniques; AAPG: Tulsa, OK, USA, 2001. [Google Scholar]
- Delvaux, D.; Martin, H.; Leplat, P.; Paulet, J. Geochemical Characterization of Sedimentary Organic Matter by Means of Pyrolysis Kinetic Parameters. Org. Geochem. 1990, 16, 175–187. [Google Scholar] [CrossRef]
- Vandenbroucke, M.; Largeau, C. Kerogen Origin, Evolution and Structure. Org. Geochem. 2007, 38, 719–833. [Google Scholar] [CrossRef]
- Vega-Ortiz, C.; Beti, D.R.; Setoyama, E.; McLennan, J.D.; Ring, T.A.; Levey, R.; Martínez-Romero, N. Source Rock Evaluation in the Central-Western Flank of the Tampico Misantla Basin, Mexico. J. South Am. Earth Sci. 2020, 100, 102552. [Google Scholar] [CrossRef]
- Amoako, K.; Zhong, N.; Osei-Boakye, N.P.; Apesegah, E. The Organic Geochemistry of Crude Oil in the Saltpond Basin (Ghana): Organic Source Input, Depositional Environment, and Thermal Maturity. Acta. Geochim. 2024, 43, 424–440. [Google Scholar] [CrossRef]
- Alsharhan, A.S. Petroleum Geology and Potential Hydrocarbon Plays in the Gulf of Suez Rift Basin, Egypt. AAPG Bull. 2003, 87, 143–180. [Google Scholar]
- Khaled, K.A.; Attia, G.M.; Metwalli, F.I.; Fagelnour, M.S. Subsurface Geology and Petroleum System in the Eastern Offshore Area, Nile Delta, Egypt. J. Appl. Sci. Res. 2014, 10, 254–270. [Google Scholar]
- Suggate, R.P. Relations between depth of burial, vitrinite reflectance and geothermal gradient. J. Pet. Geol. 1998, 21, 5–32. [Google Scholar] [CrossRef]
- Ahmed, M.A.A. Geodynamic Evolution and Petroleum System of Abu Gharadig Basin, North Western Desert, Egypt. Ph.D. Thesis, RWTH Aachen University, Aachen, Germany, 2008. [Google Scholar]
- Elmaadawy, K.G. Thermal Maturity Modelling for the Pre-Miocene Source Rocks in Ras Garra Area, Suez Rift Basin, Egypt. J. Afr. Earth Sci. 2020, 163, 103746. [Google Scholar] [CrossRef]
- Wygrala, B.P. Integrated Study of an Oil Field in the Southern Po Basin, Northern Italy. Ph.D. Thesis, University of Cologne, Cologne, Germany, 1989. [Google Scholar]
- Steckler, M.S.; Feinstein, S.; Kohn, B.P.; Lavier, L.L.; Eyal, M. Pattern of Mantle Thinning from Subsidence and Heat Flow Measurements in the Gulf of Suez: Evidence for the Rotation of Sinai and Along-strike Flow from the Red Sea. Tectonics 1998, 17, 903–920. [Google Scholar] [CrossRef]
- Pollack, H.N.; Hurter, S.J.; Johnson, J.R. Heat Flow from the Earth’s Interior: Analysis of the Global Data Set. Rev. Geophys. 1993, 31, 267–280. [Google Scholar] [CrossRef]
- Fagelnour, M.; Gamil, I.; El Toukhy, M.; Gharieb, A.; Saad, H. Source Rock Potentiality, Basin Modeling, and Oil to Source Correlation in Northern Shushan Basin, Western Desert, Egypt. In Proceedings of the Offshore Mediterranean Conference and Exhibition, Ravenna, Italy, 27–29 March 2019; OMC: Ravenna, Italy, 2019. [Google Scholar]
- Farouk, S.; Arafat, M.; Fagelnour, M.S.; Al-Kahtany, K.; Gentzis, T. Petroleum System Assessment of the Beni Suef Basin, Western Desert, Egypt. J. Afr. Earth Sci. 2024, 217, 105345. [Google Scholar] [CrossRef]
- Allen, A.P.; Allen, R.J. Basin Analysis: Principles and Applications, 1st ed.; Blackwell Scientific Publications: Oxford, UK, 1990. [Google Scholar]
- Sweeney, J.J.; Burnham, A.K. Evaluation of a Simple Model of Vitrinite Reflectance Based on Chemical Kinetics. AAPG Bull. 1990, 74, 1559–1570. [Google Scholar]
- Pepper, A.S.; Corvi, P.J. Simple Kinetic Models of Petroleum Formation. Part I: Oil and Gas Generation from Kerogen. Mar. Pet. Geol. 1995, 12, 291–319. [Google Scholar] [CrossRef]
- Moretti, I.; Kerdraon, Y.; Rodrigo, G.; Huerta, F.; Griso, J.J.; Sami, M.; Said, M.; Ali, H. South Alamein Petroleum System (Western Desert, Egypt). Pet. Geosci. 2010, 16, 121–132. [Google Scholar] [CrossRef]
- Walters, C.C. The Origin of Petroleum. In Practical Advances in Petroleum Processing; Hsu, C.S., Robinson, P.R., Eds.; Springer: New York, NY, 2006; pp. 79–101. ISBN 978-0-387-25811-9. [Google Scholar]


Disclaimer/Publisher’s Note: The statements, opinions and data contained in all publications are solely those of the individual author(s) and contributor(s) and not of MDPI and/or the editor(s). MDPI and/or the editor(s) disclaim responsibility for any injury to people or property resulting from any ideas, methods, instructions or products referred to in the content. |
© 2024 by the authors. Licensee MDPI, Basel, Switzerland. This article is an open access article distributed under the terms and conditions of the Creative Commons Attribution (CC BY) license (https://creativecommons.org/licenses/by/4.0/).