Abstract
Recent advances in the use of portable/handheld laser-induced breakdown spectroscopy (LIBS) instrumentation have allowed its use directly in the field. In this study, a portable/handheld LIBS demo kit was tested to detect the titanium (Ti) content in some quartz veinlets hosted by hornfels collected from the contact aureole of a Pliocene granite from Italy. Results of the present study demonstrate the promising potential of LIBS in the rapid detection of low and very variable Ti contents in quartz, which can be used as a preliminary test for the estimation of the temperature of quartz crystallization in the laboratory. However, to date, the limited availability of matrix-matched calibration samples, the refinement of sampling protocols, as well as the development of suitable algorithms for data processing and spectral analysis still require further investigation.
1. Introduction
An interesting case study in the field of geosciences research is the Titanium-in-Quartz (TitaniQ) geothermometer [1], which is based on the empirical measurement of titanium (Ti) incorporated into synthetic quartz at a temperature of 600–1000 °C at 1 GPa, where aTi = 1, i.e., rutile (TiO2), is present. Thus, TitaniQ represents a geothermometer that can be used to trace the temperature of geological thermodynamic processes by quantifying the amount of Ti substitution for Si occurring in quartz grains of several rock types. In particular, the crystallization temperatures at typical crustal pressures can be calculated if Ti is incorporated in crystallized quartz under equilibrium conditions and if TiO2 activity is reasonably constrained. According to this approach, the Ti concentration (ppm) is measured in the laboratory by electron probe microanalysis (EPMA), assisted by backscattered-electron imaging (BEI) or by Laser Ablation—Inductively Coupled Plasma—Mass Spectrometry (LA-ICP-MS) to avoid Ti overestimation. Despite the high analytical accuracy achieved by these techniques, the analytical procedures involved are cumbersome and expensive and require the transportation of the samples to the laboratory.
In this context, a substantial contribution to limit laboratory analytical work can be provided by portable/handheld laser-induced breakdown spectroscopy (LIBS) instruments that allow for a preliminary analysis of the elements of interest directly in the field. In recent years, fostered by technology developments, these instruments have gained significant interest with regard to geochemical applications thanks to their capability of fast qualitative, semi-quantitative or quantitative compositional analysis of various types of minerals and rocks directly in the field [2,3,4]. Two main types of portable field LIBS instruments are available, i.e., (i) a person-portable, compact, light, handheld, comfortable-to-hold unit that consists of two components connected by a cord, is battery-operated, and is suitable for use by one person; and (ii) transportable systems that are laboratory-equivalent instruments and are transported by vehicle, operated by several people, and may need some installation work [2]. However, some challenging issues need to be resolved in order to increase the potential of these LIBS-based technologies and improve their analytical performance and rapidity. These include the limited availability of matrix-matched calibration samples, the refinement of sampling protocols, as well as the development of suitable algorithms for data processing and spectral analysis [2]. Furthermore, the analytical and practical advantages of LIBS will be powered by, for instance, the possibility of remote optical access, avoiding the use of ionizing radiations or chemical reagents, and a minimum or no need for sample preparation or pretreatment. It is worth mentioning that LIBS should not be regarded as competitive but preliminary to other analytical techniques, as it allows the screening (e.g., identification and classification) and pre-selection of samples and analytes of interest, which, if necessary, would then be transported and analyzed by more accurate techniques in the laboratory, thus reducing the analytical costs and time.
The most common approach for performing quantitative LIBS analysis relies on the construction of calibration curves that employ matrix-matched standards that, unfortunately, are often limited or unavailable as in the case of geological and environmental samples. However, calibration-free LIBS (CF-LIBS) represents an alternative method to perform quantitative analysis without the need for the calibration stage [5,6,7]. The CF-LIBS standardless approach was later developed in another version, the so-called One-Point calibration-free LIBS (OP-CF-LIBS) method, which employs only one standard sample with a known composition that has a matrix similar to that of the target to be analyzed [8]. Both CF-LIBS and OP-CF-LIBS methods require the measurement of broadband spectra (i.e., 200–900 nm), which include the emission peaks of all the elements present in the sample, and an accurate plasma characterization, i.e., the calculation of its temperature and electron density, assuming that the generated plasmas are close to local thermodynamic equilibrium (LTE) conditions. The temperature can be calculated by the Saha–Boltzmann plot, whereas the calculations of the electron density require either the measurement of the Hα line or the use of a high-resolution spectrometer for the Stark broadening measurement of other elements (e.g., Mg, Ca). Thus, the limited spectral range and the lower spectral resolution achievable by the compact spectrometers used in portable/handheld LIBS equipment may limit the use of the CF-LIBS approaches.
Bearing in mind the above-mentioned issues, the objective of this work was to test the performance of a portable/handheld LIBS instrument prototype, aiming to achieve a semi-quantitative elemental analysis of small amounts (about 70 ppm) of Ti in quartz levels and veinlets commonly found in rocks of metamorphic basements. In particular, the analytical technique was tested on veinlets from a metamorphic contact aureole related to the emplacement of a magmatic body emplaced in the upper continental crust.
2. Materials and Methods
2.1. Material
A geologically relevant hornfels collected from the contact aureole of the Pliocene small granitic pluton of Gavorrano, Tuscany, Italy [9], was investigated. The sample is composed of biotite, quartz, K-feldspar, andalusite, corundum, rutile, tourmaline, suggesting peak P-T conditions of about 150 MPa and 660 °C [9], with late chlorite and calcite, witnessing local re-equilibration under fluid-present conditions. Two successive generations of quartz veinlets can be observed in the hornfels (Figure 1). Greyish deformed veinlets of the first generation are tightly folded and locally thinned during deformation in the ductile domain. In turn, tapering veinlets of the second generation are thicker, characterized by a coarser quartz grain size and appear unaffected by high-T deformation. Only the first-generation veinlets are believed to be formed during the acme of contact metamorphism. As the solubility of Ti in quartz increases with temperature, only the former veinlets are suitable for testing Ti content by LIBS. Referring to the calibration of the TitaniQ by Huang and Audetat [10] and to the P-T conditions of metamorphism, the maximum Ti content should be in the order of about 70 ppm.

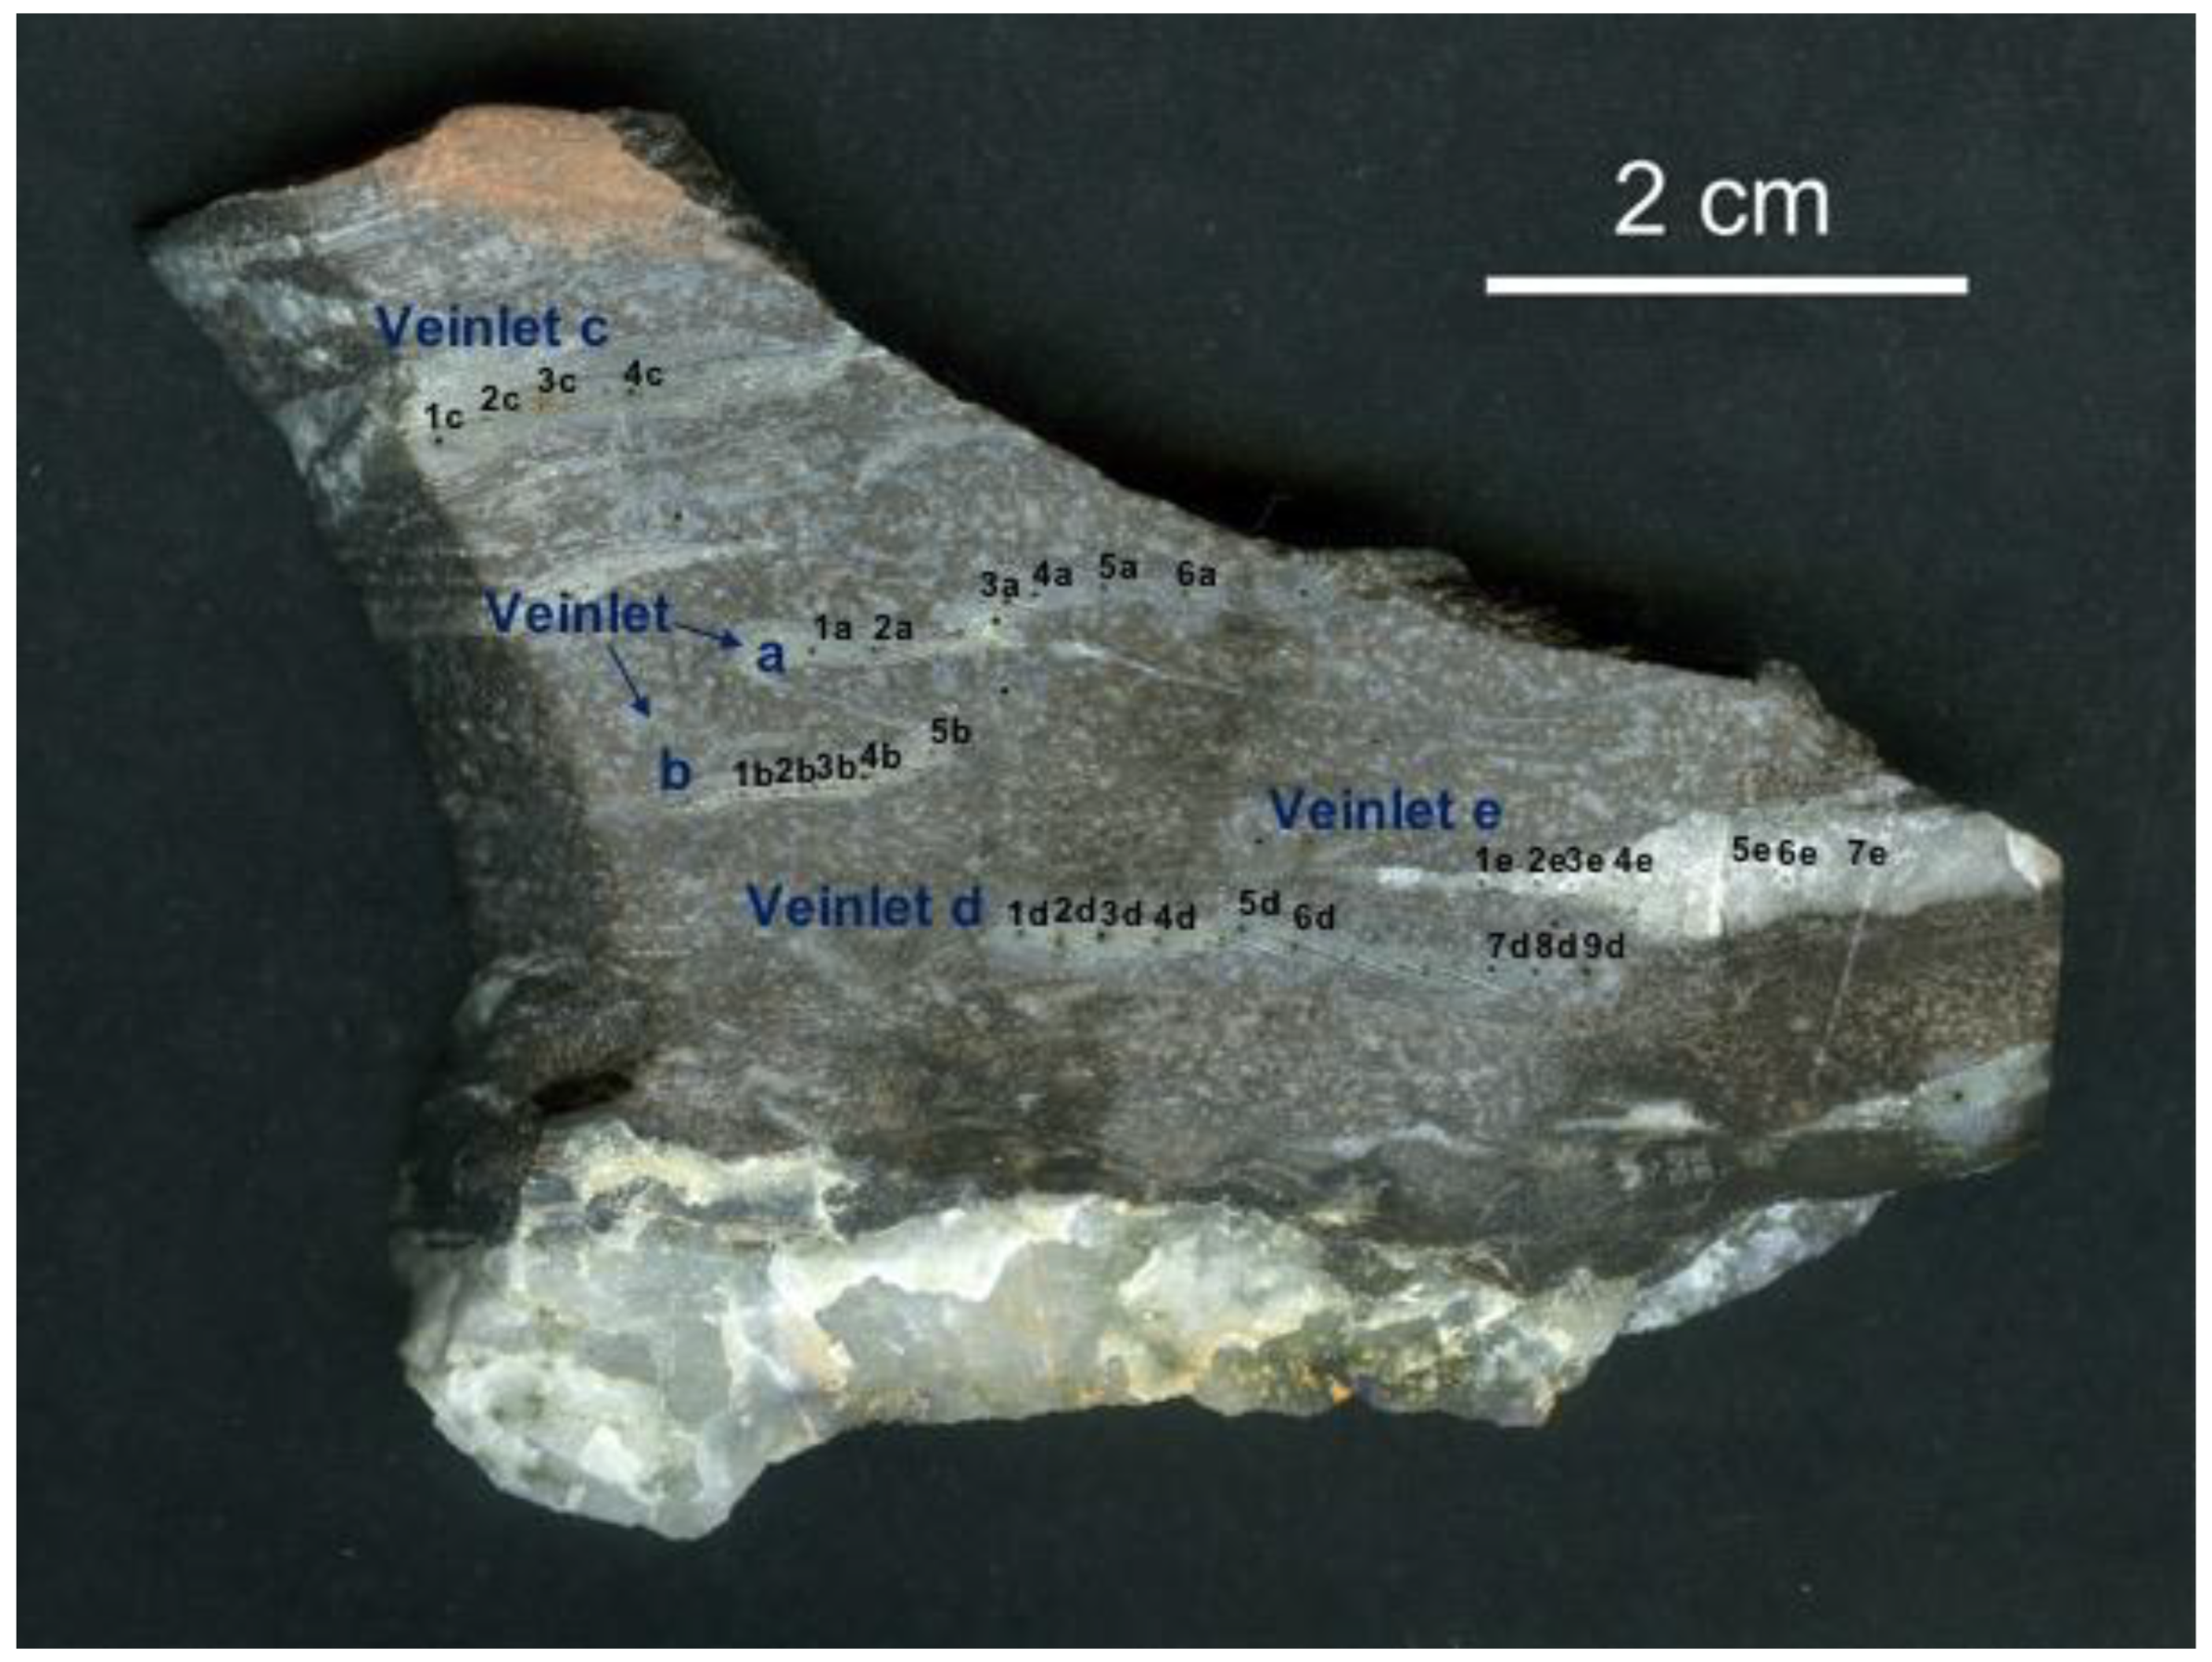
Figure 1.
The five quartz veinlets analyzed in the various LIBS positions on the hornfels sample collected from the metamorphic contact aureole of the Gavorrano granite.
2.2. Experimental Setup, Spectra Acquisition and Processing
A portable/handheld LIBS system prototype assembled by Lumibird (Bozeman, MT, USA) and Avantes (Louisville, KY, USA) was employed. The laser used is the ultra-compact diode-pumped pulsed 1574 nm Falcon 157 from Lumibird that is configured to fire a burst of several shots at a repetition rate of 40 Hz and 4.5 mJ output energy per pulse with a pulse width of 6 ns and a focused beam size of 70 µm. Diode current compensation is used to reduce the output energy variation over the operational temperature range from 5 °C to 35 °C. The diode current can be adjusted directly by disabling the current compensation. The focal distance for the best signal was fixed at 17 mm from the front of the laser head. The laser setup was coupled with a Lumibird Control Box and a Falcon AC power control box. The laser light was delivered to the target sample via a system consisting of a laser-focusing lens and a light-collecting lens to transmit the plasma emission to the spectrometer through a fiber optic cable. The spectrometer used is an AvaSpec-Mini4096CL from Avantes with a CMOS detector and advanced electronics covering the spectral range from 190 to 375 nm with an average resolution of 0.18 nm.
LIBS spectra were acquired on various positions along 5 quartz veinlets located on the sample surface (Figure 1). At each position, 10 laser shots were delivered, and the corresponding individual LIBS spectra were recorded where the main emission lines of the elements of interest were detected (Section 3.1). After acquisition, the raw data were processed by specifically designed algorithms implemented in MATLAB and Python environments. The algorithms included successive steps of pre-processing (i.e., averaging the 10 spectra measured for each veinlet and position and subtraction of the continuum background from the resulting spectra), spectral analysis, plasma characterization, and calculation of the relative spatial variation in Ti concentration. Self-absorption and matrix effects were also evaluated.
2.3. Calculation of the Plasma Temperature and Electron Density
The most commonly used approach for the determination of the temperature and the electron density of LIBS plasmas is the Saha–Boltzmann plot, which is based on the previous determination of the electron density via (i) the Stark broadening effect or (ii) the Saha–Boltzmann equation. In the former approach, the measurement of the Stark width of a selected spectral line with a known value of its broadening coefficient is required [11]. In the latter approach, the emission intensity ratio of two lines corresponding to successive ionization states of the same element is employed [12]. In most cases, the Hα Balmer emission line (at λα = 656.28 nm) is selected as this line is, in general, well-isolated, free of self-absorption, and has a considerably larger Stark broadening than any other element. Although a proper measurement of the Hα line profile can be achieved even by using a spectrometer with a low spectral resolution, this line was not available for the spectral range of our system. Moreover, the spectral resolution of the spectrometer was about 0.18 nm, which is larger than the expected Stark widths of the other elements detected (~0.01 nm), thus preventing the use of the Stark broadening approach to determine the electron density. Therefore, the Saha–Boltzmann method was used from which the electron density was derived from the intensity ratio of two lines corresponding to atomic (I) and single-ionized species (II), according to the following equation [12]:
where Ne (m−3) is the electron number density, me (kg) is the electron mass, h (J s) is the Planck’s constant, k (J K−1) is the Boltzmann constant, T (K) is the temperature, II (a.u.) and III (a.u.) are the emission line intensities of the considered transitions, Aki (s−1) are the transition probabilities, gk (dimensionless) are the degeneracies of the upper energy levels, and E∞ (eV) is the ionization energy of the neutral species.
2.4. Calculation of the Relative Abundance (Concentration) of Ti
Assuming a homogeneous plasma in LTE, optically thin conditions and a stoichiometric ablation, the wavelength-integrated emission intensity Izα (J s−1 m−1 sr−1 nm−1) of a spectral line emitted by an atom of the element α in the ionization state z along the line of sight is given by the following equation [13]:
where F is an unknown experimental factor depending on the instrumental setup and accounting for the absolute efficiency and units, h (J s) is the Planck constant, c (m s−1) is the speed of light in a vacuum, k (eV K−1) is the Boltzmann constant, λ0 (nm) is the central wavelength of the transition, Aki (s−1) is the transition probability, N (m−3) is the total density of all elements in the plasma, ri (T,Ne) is the ionization factor, Cα (at wt%) is the concentration of the element α in the sample, gj (dimensionless) is the degeneration of the upper level of the transition, Ek (eV) is the energy of the upper level, and Uαz (T) (dimensionless) is the partition function of the emitting species. According to Equation (2), the emission intensity of a spectral line is proportional to the concentration of the element in the sample and also depends on its spectroscopic parameters, the ionization degree, the total density of elements in the plasma, the temperature and the electron density.
From Equation (2), the Ti concentration at the (i)-position is given by
A direct calculation of the Ti concentrations c(i)Ti is unfeasible as F and N are unknown parameters. Thus, assuming negligible matrix effects and considering that the line self-absorption is also negligible, the relative variation (RV%) of the elemental concentration of Ti could be calculated according to the following equation [14]:
where denotes the variation in Ti concentration at the sampling point (i) with respect to the mean concentration of n measurement points on a given veinlet, namely . Furthermore, and are the net intensity measured at point (i) (wavelength-integrated and background subtracted) and the mean intensity, respectively, Equation (2). Noteworthily, in Equation (2), the Ti concentration depends mainly on the emission intensity while all parameters depending on kT and Ne do not change significantly. Therefore, all the constants and parameters cancel out in the ratio of Equation (4), except for the concentration of the analyte in the sample, allowing the direct calculation of the RV% of Ti concentrations.
3. Results and Discussion
3.1. LIBS Spectra
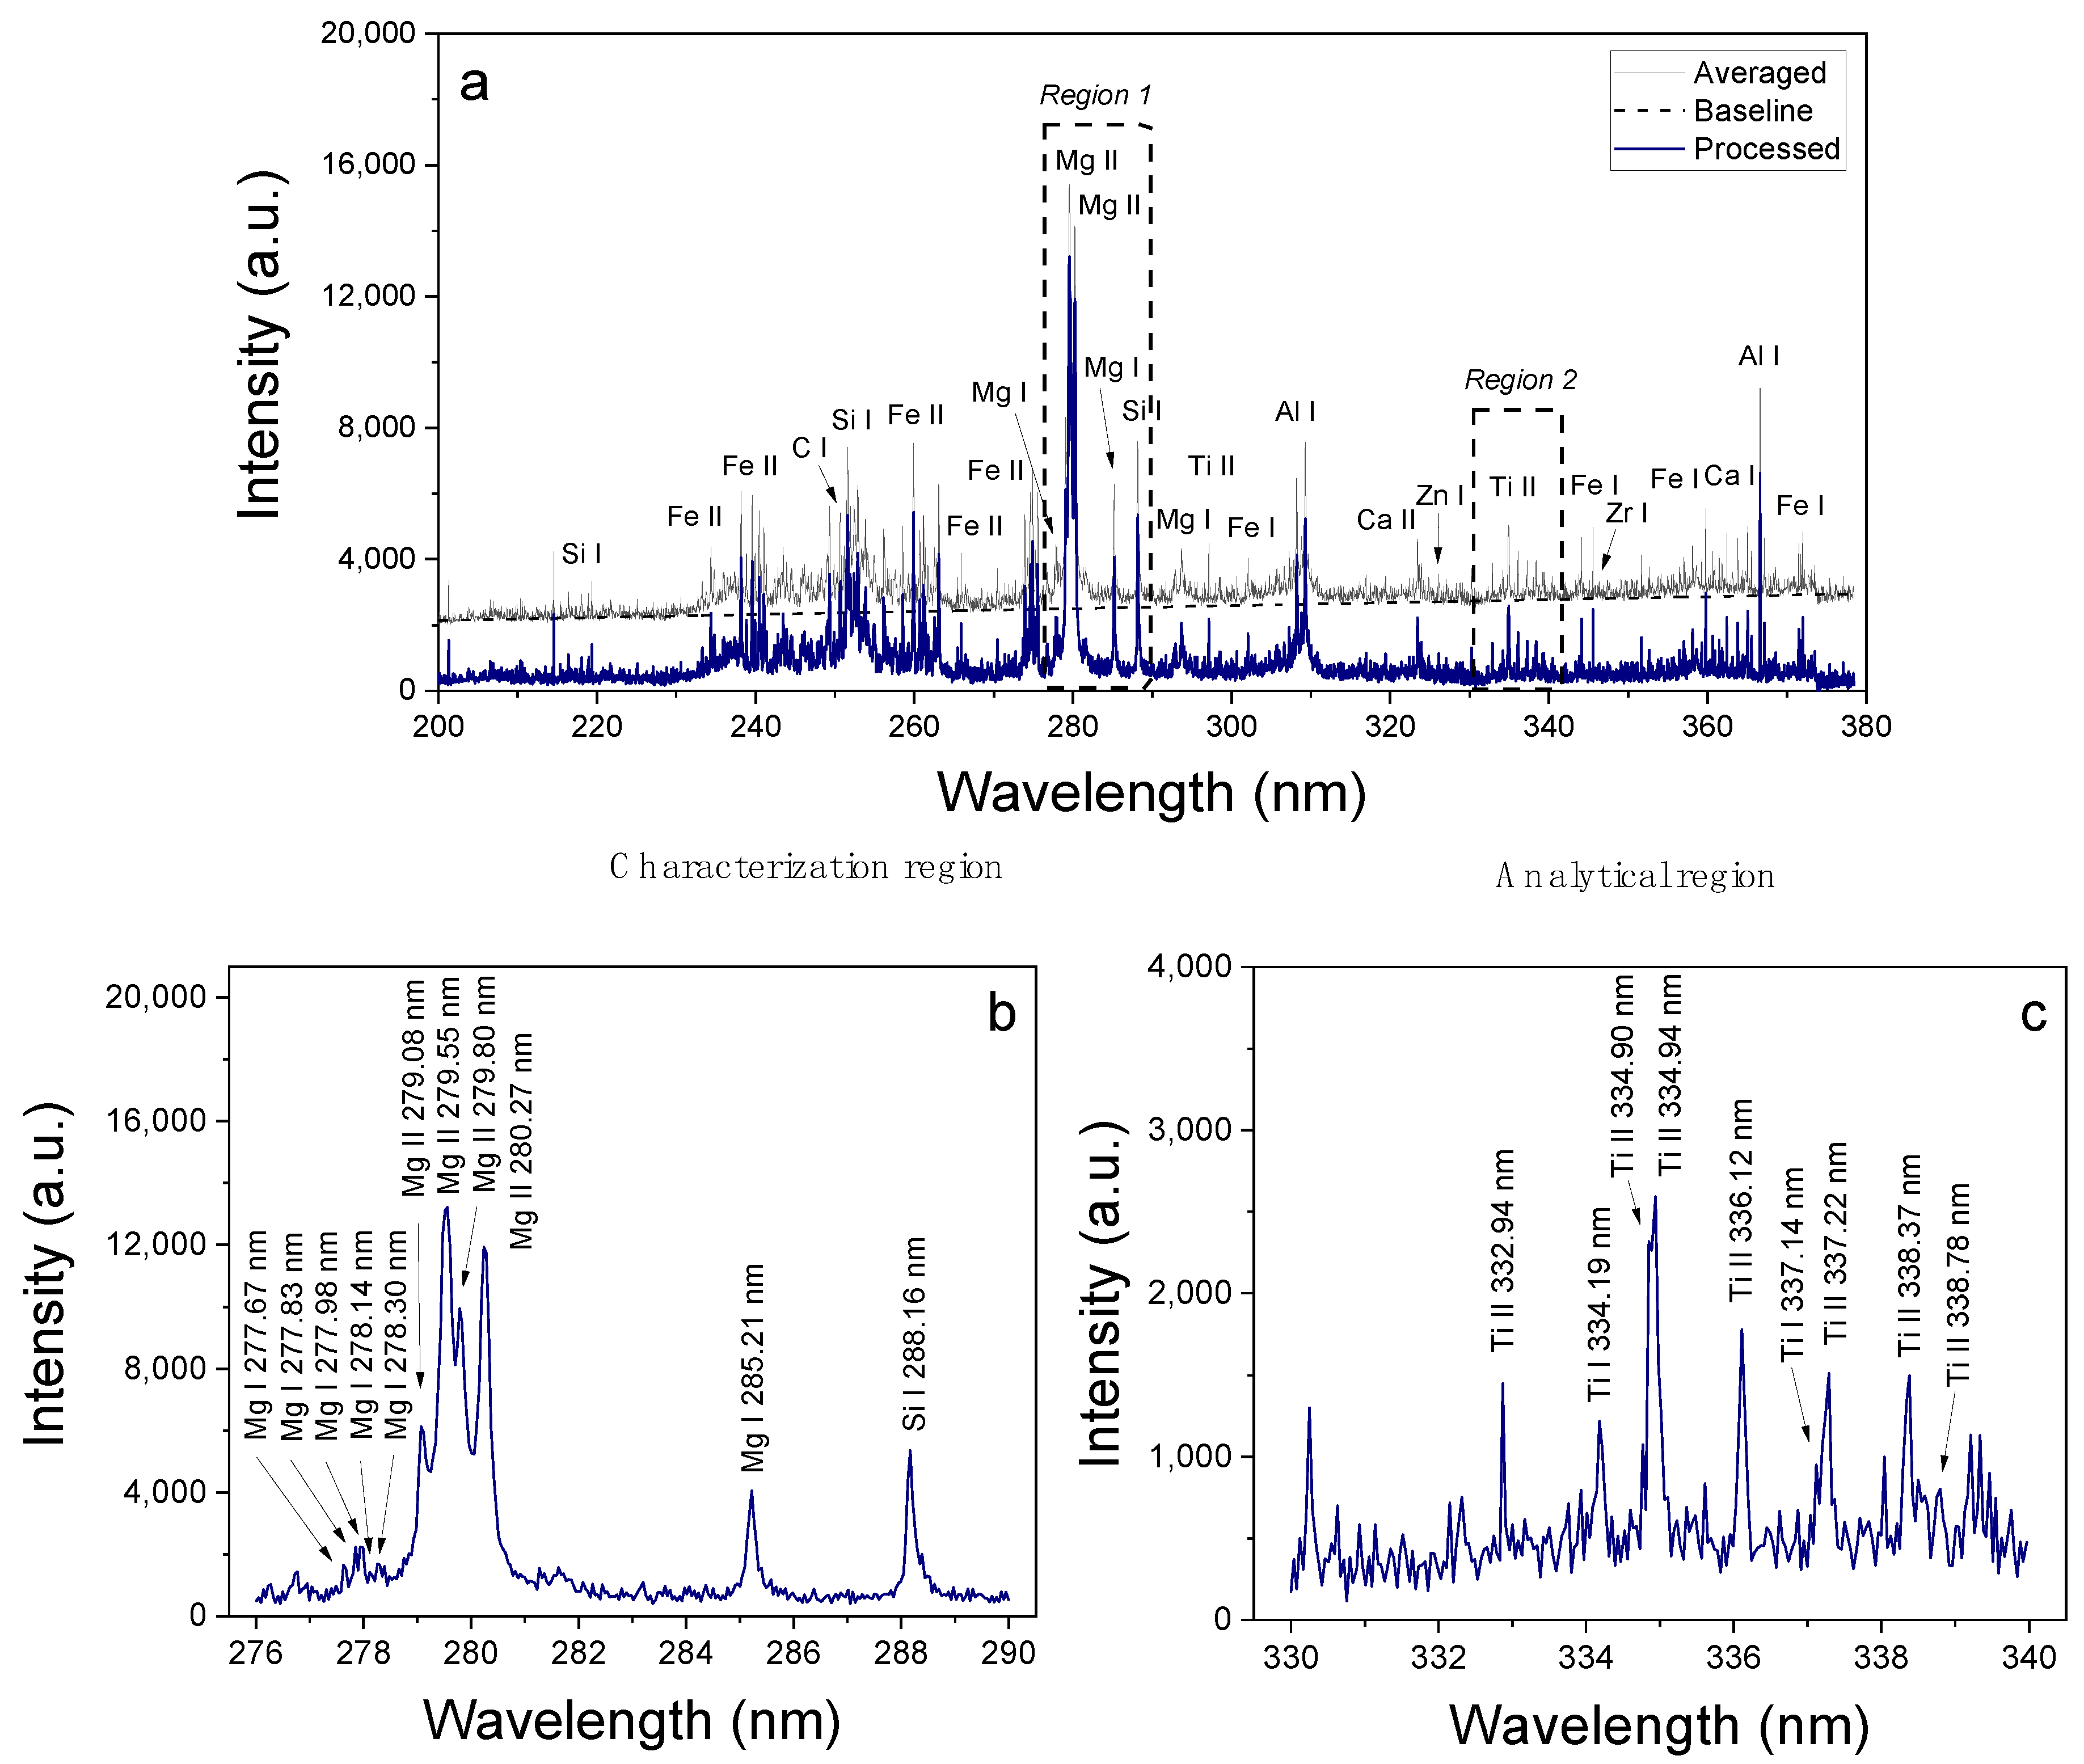
A typical spectrum of veinlet a is shown in Figure 2. The element identification was achieved based on the National Institute of Standards and Technology (NIST) Atomic Spectra Database [15]. Intense emission peaks of neutral and single-ionized species of Fe, Mg, and Si were detected as major components. Furthermore, weaker spectral lines corresponding to traces of other trace elements, such as C, Ti, Al, Zn, and Zr, were also detected. However, Ti was not detected on the quartz lens; thus, this surface area was not considered for further processing. Thus, the focus was on the analysis of the spectral emission of Ti along the veinlets (Figure 2c), as well as on the measurement of Mg and Si emission lines for plasma characterization (Figure 2b). The analytical spectral lines of Ti, Mg, and Si were fit with a Gaussian function to obtain their net intensities yielded by the integrated areas of the line profiles after subtracting the background baseline.
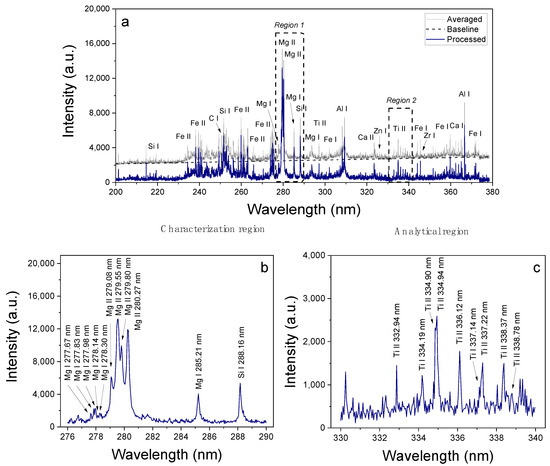
Figure 2.
Representative pre-processed LIBS spectra acquired from veinlet a at position #1a (a). Enlarged spectral regions of Mg I–II and Si I lines used for plasma characterization (b), and Ti I–II lines used for compositional analysis (c). Selected analytical lines are labeled with an arrow.
3.2. Plasma Characterization
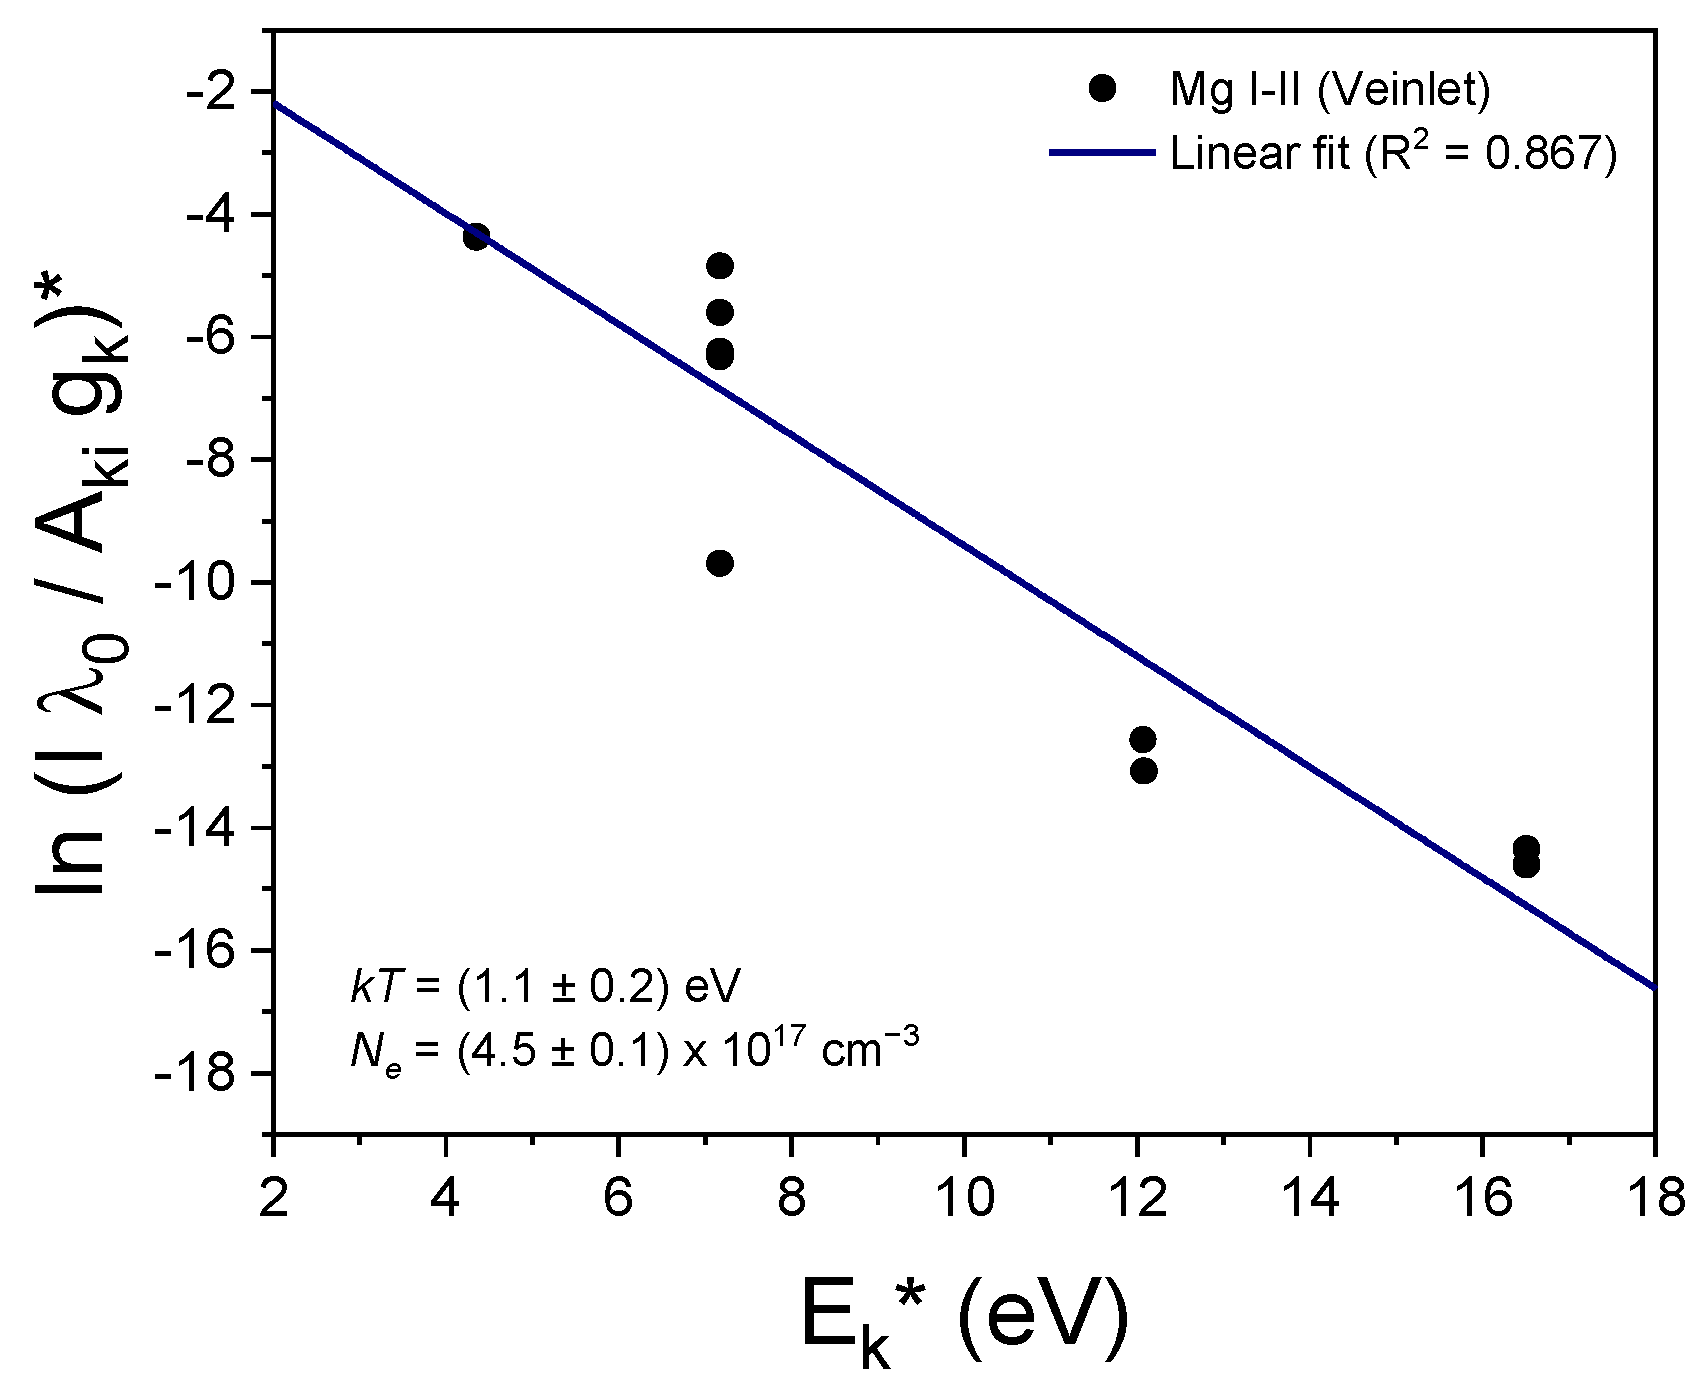
The plasma electron density and temperature were calculated by using the Saha–Boltzmann approach [11], employing a set of ten Mg I and Mg II selected spectral lines (Figure 2b) with energy levels in the range 4.422–8.864 eV and well-known transition probabilities (Table 1). For each veinlet position, the electron density was calculated by Equation (1) using the spatially integrated intensity ratios of the Mg I 285.21 nm and Mg II 279.55 nm–280.27 nm resonant lines at an estimated plasma temperature of 11,600 K, which is typical in LIBS experiments [4]. The obtained electron density was then employed for the construction of the Saha–Boltzmann plot to obtain the plasma temperature, and after that, the value of the electron density was iteratively recalculated (Figure 3).

Table 1.
Spectral lines used for plasma characterization (Mg and Si) and compositional analysis of Ti. Data from NIST database [15].
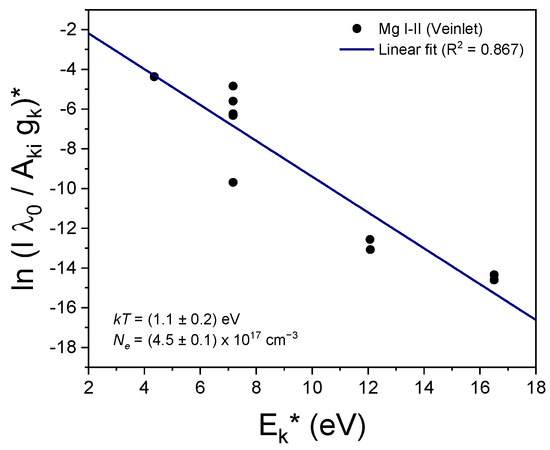
Figure 3.
Representative Saha–Boltzmann plot obtained using Mg I–II lines (Table 1) for veinlet a at position #1a. The superscript * indicates the modified values for the abscissas and ordinates according to Ref. [11].
3.3. Self-Absorption and Matrix Effects
For characterization purposes, lines not suffering from strong self-absorption at the conditions of measurement should be used. To assess the degree of self-absorption of the measured Mg I and Mg II lines employed for plasma characterization, the experimental ratios of two lines belonging to the same multiplet (i.e., Mg II at 279.55 nm and Mg II at 280.27 nm) obtained for the different positions were compared with the theoretical intensity ratio expected in an optically thin plasma, namely I279.55/I280.27 = (Aki279.55 gk279.55)/(Aki280.27gk280.27) ≈ 2. A decrease in the observed intensity ratio would be indicative of self-absorption. On the other hand, if the experimental ratio is approximately equal to the theoretical value, then self-absorption is negligible [16]. The averaged experimental ratio achieved was 1.3 ± 0.1 for all the veinlets, which indicated that self-absorption was low to moderate. Taking into account that optically thin lines are usually weak and hardly detected (e.g., due to spectral interference) a compromise between the self-absorption of analytical lines and their emission intensities was adopted. For this reason, the analytical Mg I–II lines listed in Table 1 were chosen as they were not considerably self-absorbed and featured a suitable signal-to-background ratio (SBR).
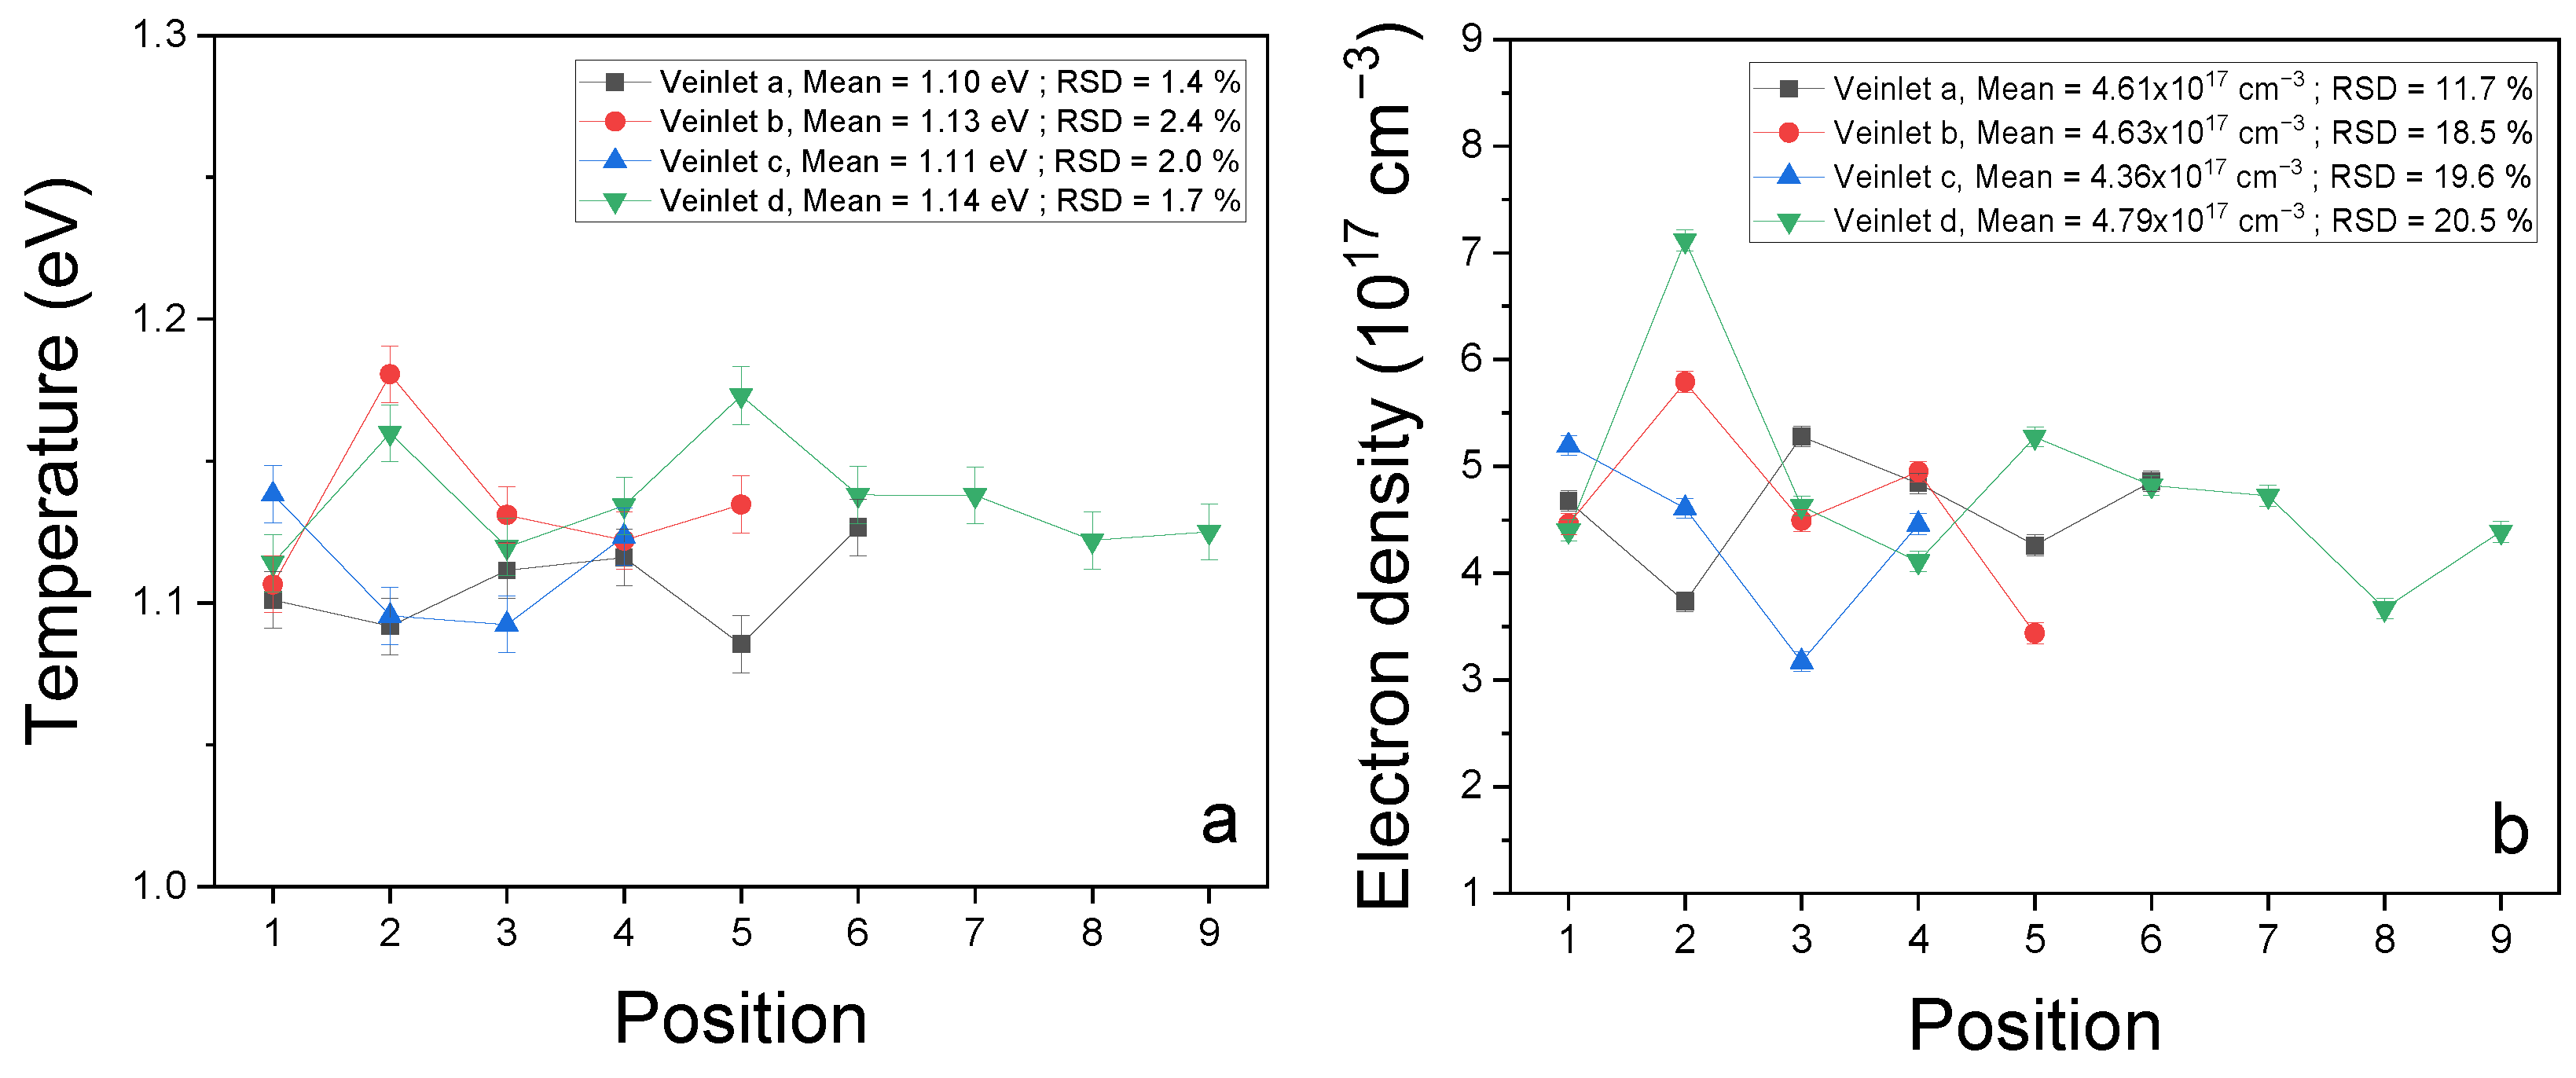
Matrix effects could involve a change in the parameters of plasmas generated at different positions, thus originating variations in the emission intensities, which can hinder the spatial differences in the concentrations of the elements of interest, i.e., Ti. The possible occurrence of matrix effects in our experiment was evaluated by characterizing the plasmas induced at different positions along the veinlets using the Saha–Boltzmann plots (Figure 4). The resulting averaged values for the temperature and electron density for the different veinlets were kT = (1.12 ± 0.02) eV and Ne = (4.6 ± 0.8) × 1017 cm−3 with relative standard deviations (RSD) ≤ 2.4% and ≤20.5%, respectively. These RSD values were of the same order as those measured in previous research [17] for minerals and rocks featuring small grains where the variations were related to a combination of fluctuations due to the laser energy and the roughness of the surface. The agreement of the temperature and the electron density values supports the absence of relevant matrix effects in the measurements.
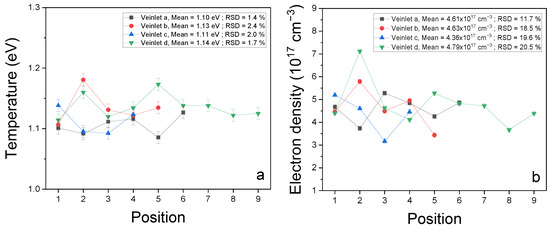
Figure 4.
Temperature (a) and electron density (b) values calculated for the laser-induced plasma along the veinlets analyzed at different positions. The mean values and relative standard deviations (RSD) are shown for each veinlet.
3.4. Relative Variation in Ti Concentration
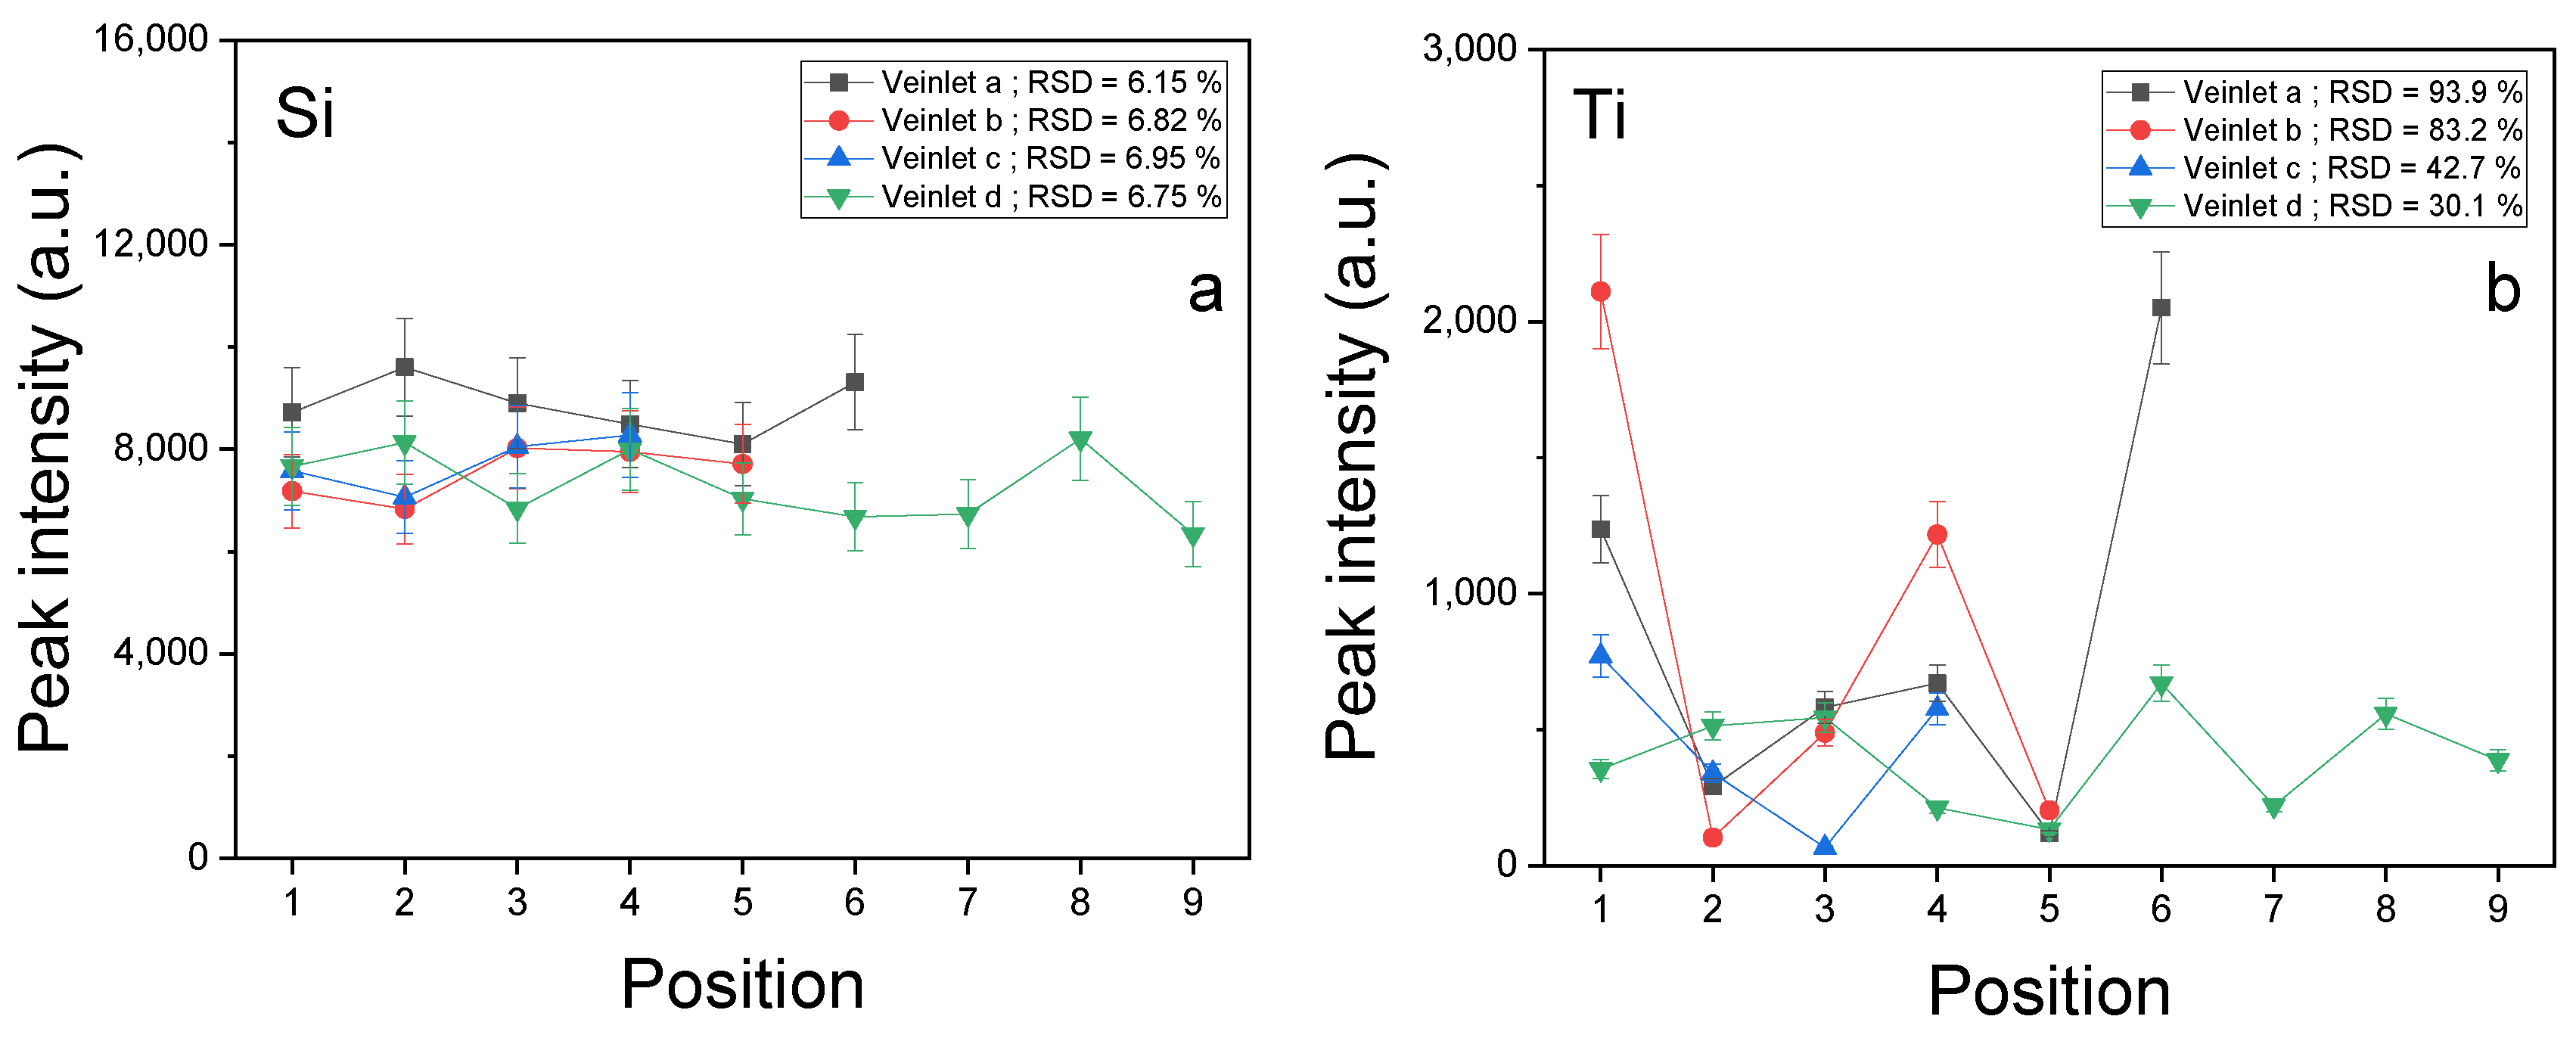
The intensities of the spectral lines of Ti I at 336.11 nm and Si I at 288.16 nm were selected as corresponding to their elemental concentrations in the sample, as they feature a suitable SBR and are free of spectral interference from other elements (Figure 2a,b). The total emission intensities of Ti and Si were measured at different positions along the veinlets (Figure 5). As Si is the major element in the sample and Ti is present at a trace level, Si concentration can be considered constant along the veinlets, and the low RSD values (≤7%) of the Si I emission intensity can be related to typical fluctuations in LIBS experiments (Figure 5a). In contrast, the RSD values for Ti I were between 30% and 94%, which are significantly larger than those of the matrix; thus, they can be associated with the variation in Ti concentration along the veinlets (Figure 5b).

Figure 5.
Net intensities measured for Si I (a) and Ti I (b) along the analyzed veinlets at different positions. The relative standard deviations (RSD) are shown for each veinlet.
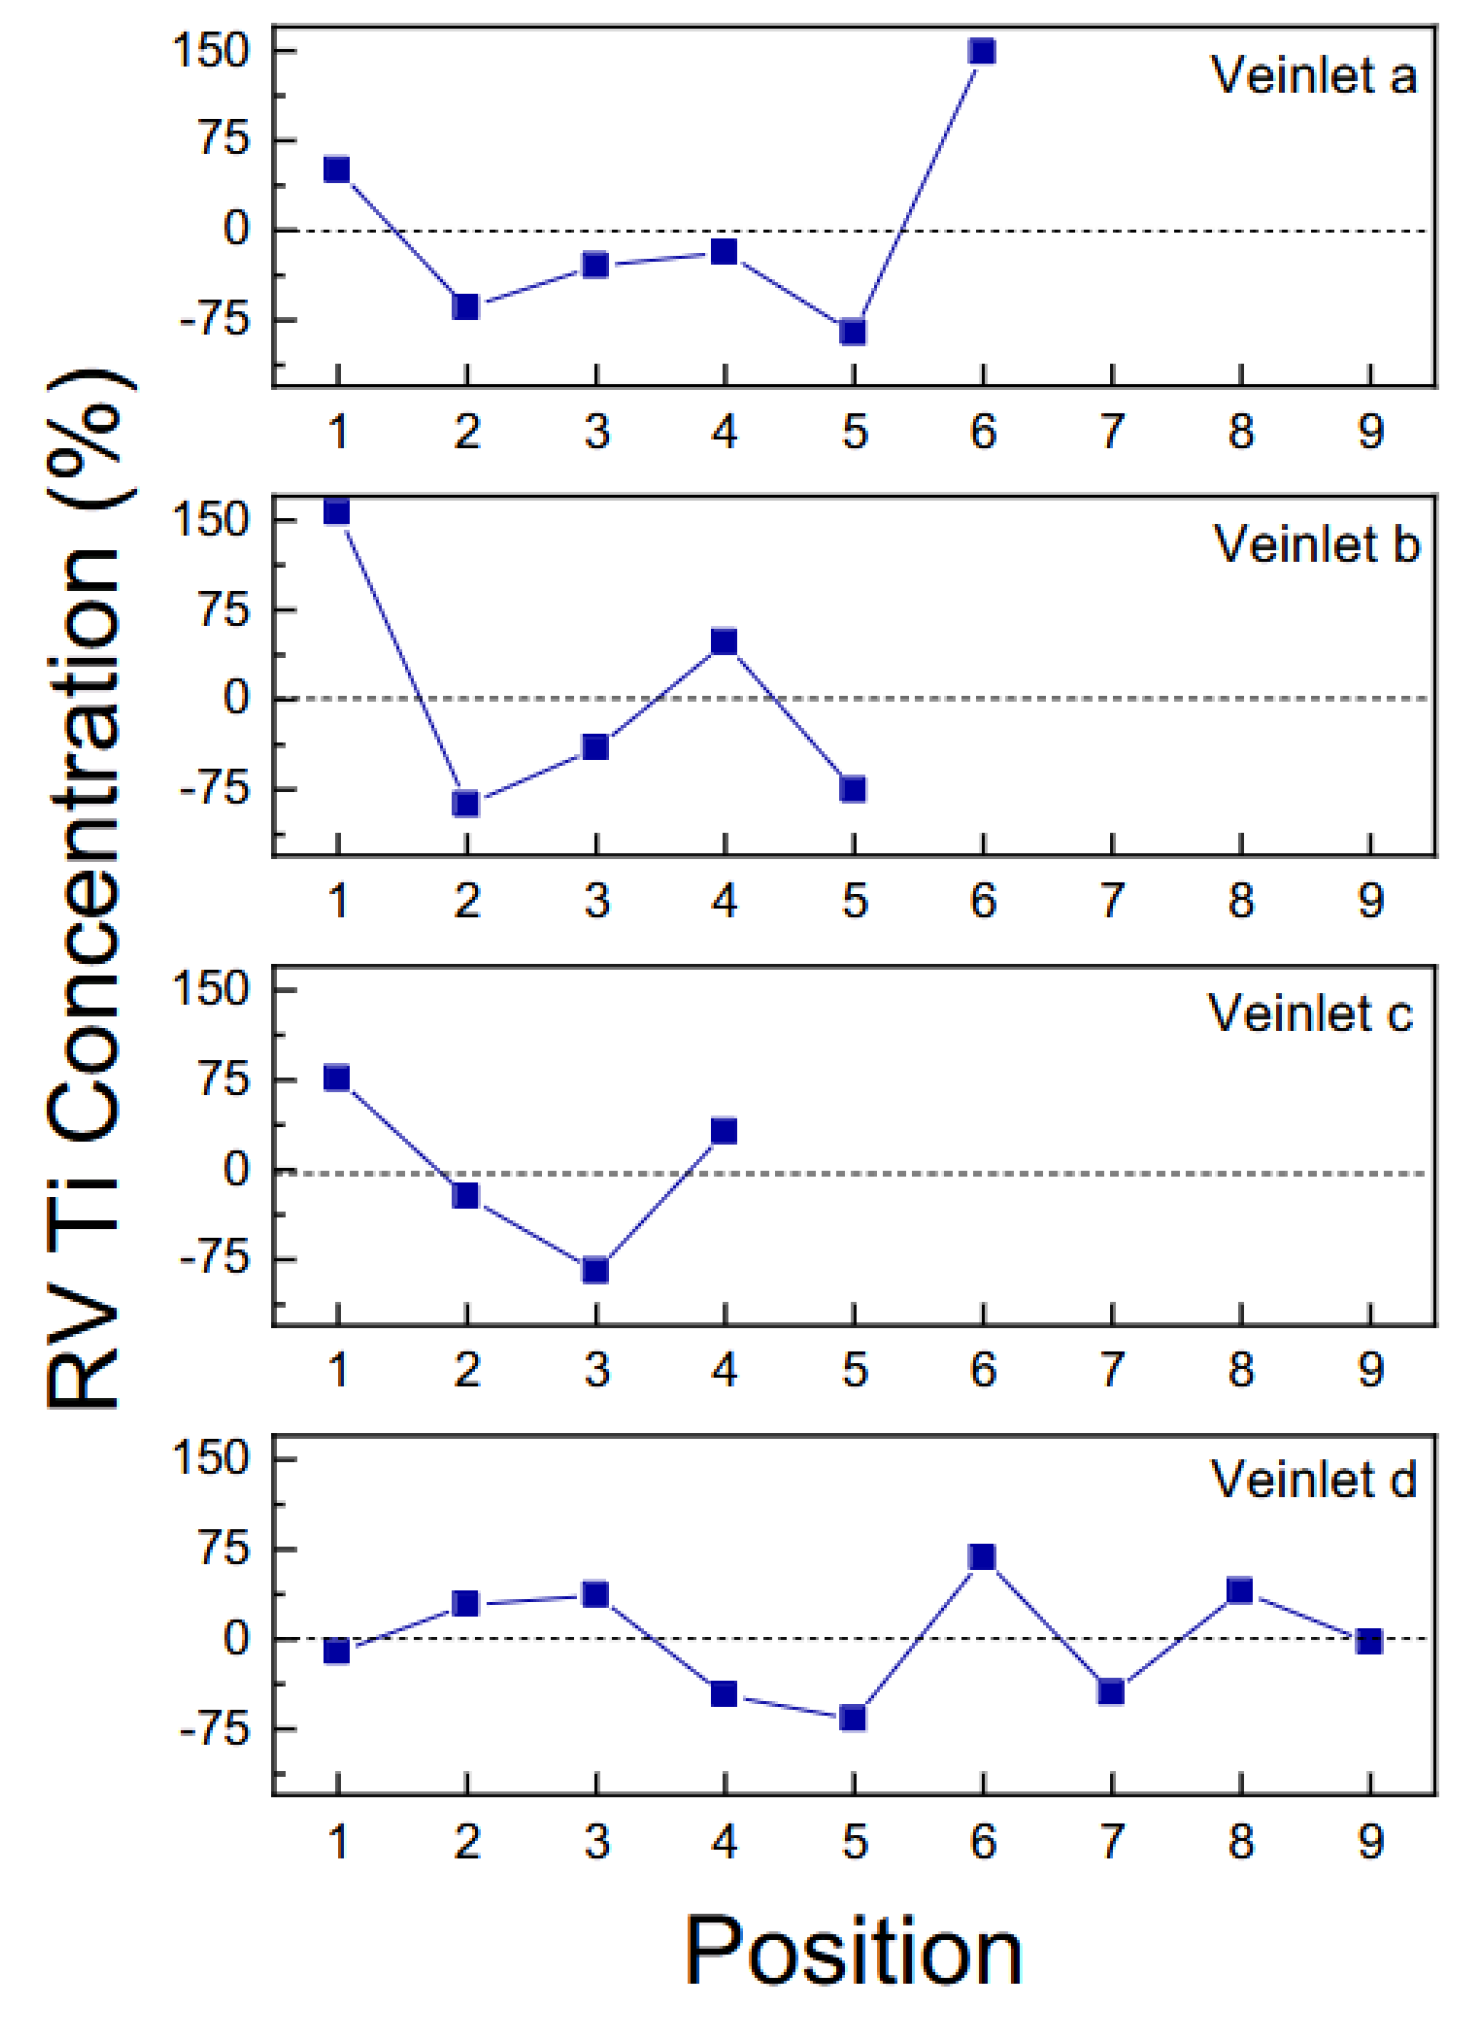
The spatial variation in the elemental Ti concentration in the different veinlets was calculated by Equation (4) using the measured emission intensities of the analytical line of Ti I at different positions, as shown in Figure 6.
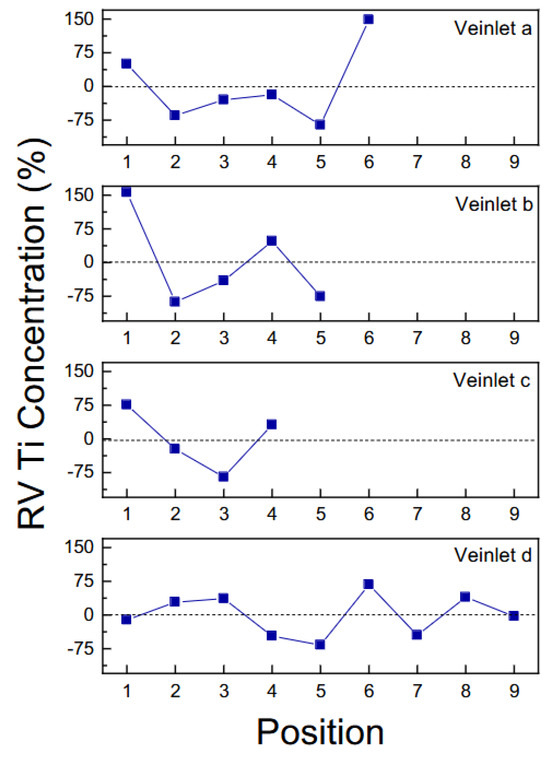
Figure 6.
Relative variations (%) of Ti concentration along the analyzed veinlets at different positions.
As previously mentioned, Ti is only detected in the first-generation veinlets (Figure 1, veinlets a, b, c, and d) that formed during the peak of contact metamorphism and experienced severe deformation in the ductile domain. Although veinlets a and b are geologically part of the same single deformed veinlet (micro-folding), they have been considered separate only to simplify the LIBS measurements. In contrast, second-generation veinlets (Figure 1, veinlet e) formed after the severe deformation event in a late cooling phase and did not show the presence of Ti, which is in agreement with the dependence of quartz Ti content on temperature. For the same reason, the second-generation vein (much thicker) on the lower part of the hand specimen of Figure 1 was not analyzed.
Two possible alternative hypotheses can be proposed to account for the variations in Ti content shown in Figure 6. The first one is that the Ti content in the quartz veinlets may not be homogeneous when the thermal perturbation is fast, as in the case of the metamorphic contact aureole related to the emplacement of a granitic body in the upper continental crust due to the rapid cooling of the magma. This interpretation agrees with the cathodoluminescence images of quartz observed by Morgan et al. [18] for the well-known Ballachulisch contact aureole [19], which highlights clear variations in brightness that may be partly related to the unattained homogenization of the Ti content. Considering the small size of the magmatic body (the Gavorrano granite) and its shallow level of emplacement, this effect could be even more accentuated for the hornfels sample analyzed in this study. The other hypothesis, which is supported by the local presence of rare chlorite and calcite [9], might be related to a partial re-equilibration in fluid-present conditions during the cooling of the contact aureole.
The results obtained in the present study thus indicated the promising potential of LIBS in quickly detecting the spatial distribution of the elemental concentration of Ti in quartz veinlets in the field, which would allow the sampling plan to be targeted by only collecting samples of interest for further laboratory analyses by other more accurate techniques. In order to perform a rigorous quantitative analysis of Ti concentration directly in the field, calibration curves, which directly relate the measured intensities of Ti LIBS spectral lines to the element concentration of certified reference materials (CRMs) measured under the same analytical conditions, must be constructed in the laboratory prior to field exploration.
4. Conclusions
This work attempted to develop a methodological approach and protocol based on a portable/handheld LIBS prototype instrument able to detect small amounts of Ti and achieve the compositional Ti variation in appropriate quartz veinlets directly in the field with the aim of a possible further application for the TitaniQ geothermometer. The LIBS technique features several unique advantages, such as low destructivity, quick in-field elemental analyses, confirmation of sample homogeneity and representativeness, compositional variation screening, ability to focus on the most important areas of concentration ranges to confirm the most relevant differences, and ability to obtain useful preliminary data.
Furthermore, the present study demonstrated the possibility of detecting and analyzing Ti semiquantitatively using a portable/handheld LIBS directly in the quartz veinlets of hornfels in a situation where internal, flat, or polished surfaces are not available. However, to carry out quantitative analysis using a portable/handheld LIBS, the availability of a matched CRM, either synthetic or a well-characterized similar sample, is essential to achieve an accurate quantification of Ti. The choice of the most suitable CRMs is an arduous task as the composition of the sample studied is highly variable and the CRMs selected must include the same kind and concentration ranges of elements expected to be present in them. A more straightforward approach envisaged for future work is to calculate the relative variations in Ti concentrations with respect to one point of reference (OPR) of the same sample for which the amount of Ti can be determined with a conventional technique. The geochemical community would greatly benefit from a certified composition of such reference materials, which are crucial for any advancement in the use of portable/handheld LIBS. Finally, the possibility of integrating LIBS with other analytical methods, such as LA-ICP-MS, in a single device would provide LIBS with additional versatility.
Author Contributions
Conceptualization, G.S.S., D.D.P. and A.C.; methodology, G.S.S.; validation, G.S.S., D.D.P. and A.C.; formal analysis, G.S.S. and D.D.P.; investigation, G.S.S. and D.D.P.; data curation, G.S.S. and D.D.P.; writing—original draft preparation, D.D.P. and G.S.S.; writing—review and editing, G.S.S., D.D.P., A.C. and O.D.P.; supervision, G.S.S. All authors have read and agreed to the published version of the manuscript.
Funding
This research received no external funding.
Data Availability Statement
The data that support the findings of this study are available from the corresponding author upon reasonable request.
Acknowledgments
The authors acknowledge R. Sade from Lumibird and D. Lenski from Avantes for providing us with the Falcon 157 laser and the AvaSpec-Mini4096CL spectrometer. D.D.P acknowledges the support of the Consejo Nacional de Investigaciones Científicas y Técnicas (CONICET) of Argentina.
Conflicts of Interest
The authors declare no conflicts of interest.
References
- Wark, D.A.; Watson, E.B. TitaniQ: A titanium-in-quartz geothermometer. Contrib. Mineral. Petrol. 2006, 152, 743–754. [Google Scholar] [CrossRef]
- Senesi, G.S.; Harmon, R.S.; Hark, R.R. Field-portable and handheld laser-induced breakdown spectroscopy: Historical review, current status and future prospects. Spectrochim. Acta B At. Spectrosc. 2021, 175, 106013. [Google Scholar] [CrossRef]
- Senesi, G.S.; Harmon, R.S.; Hark, R.R. Field-portable and handheld LIBS. In Laser-Induced Breakdown Spectroscopy, 2nd ed.; Singh, J.P., Thakur, S.N., Eds.; Elsevier: Amsterdam, The Netherlands, 2020; pp. 537–560. [Google Scholar]
- Harmon, R.S.; Senesi, G.S. Laser-induced breakdown spectroscopy—A geochemical tool for the 21st century. Appl. Geochem. 2021, 128, 104929. [Google Scholar] [CrossRef]
- Ciucci, A.; Corsi, M.; Palleschi, V.; Rastelli, S.; Salvetti, A.; Tognoni, E. New procedure for quantitative elemental analysis by laser-induced plasma spectroscopy. Appl. Spectrosc. 1999, 53, 960–964. [Google Scholar] [CrossRef]
- Corsi, M.; Cristoforetti, G.; Hidalgo, M.; Legnaioli, S.; Palleschi, V.; Salvetti, A.; Tognoni, E.; Vallebona, C. Double pulse, calibration-free laser-induced breakdown spectroscopy: A new technique for in situ standard-less analysis of polluted soils. Appl. Geochem. 2006, 21, 748–755. [Google Scholar] [CrossRef]
- Tognoni, E.; Cristoforetti, G.; Legnaioli, S.; Palleschi, V. Calibration-free laser induced breakdown spectroscopy: State of the art. Spectrochim. Acta Part B At. Spectrosc. 2010, 65, 1–14. [Google Scholar] [CrossRef]
- Cavalcanti, G.H.; Teixeira, D.C.; Legnaioli, S.; Lorenzetti, G.; Pardini, L.; Palleschi, V. One-point calibration for calibration-free laser-induced breakdown spectroscopy quantitative analysis. Spectrochim. Acta B At. Spectrosc. 2013, 87, 51–56. [Google Scholar] [CrossRef]
- Brogi, A.; Caggianelli, A.; Liotta, D.; Zucchi, M.; Spina, A.; Capezzuoli, E.; Casini, A.; Buracchi, E. The Gavorrano Monzogranite (Northern Apennines): An Updated Review of Host Rock Protoliths, Thermal Metamorphism and Tectonic Setting. Geosciences 2021, 11, 124. [Google Scholar] [CrossRef]
- Huang, R.; Audetat, A. The titanium-in-quartz (TitaniQ) thermobarometer: A critical examination and re-calibration. Geochim. Cosmochim. Acta 2012, 84, 75–89. [Google Scholar] [CrossRef]
- Aragón, C.; Aguilera, J.A. Characterization of laser induced plasmas by optical emission spectroscopy: A review of experiments and methods. Spectrochim. Acta B At. Spectrosc. 2008, 63, 893–916. [Google Scholar] [CrossRef]
- Tognoni, E.; Palleschi, V.; Corsi, M.; Cristoforetti, G.; Omenetto, N.; Gorhushkin, I.; Smith, B.W.; Winefordner, J.D. From sample to signal in laser-induced breakdown spectroscopy: A complex route to quantitative analysis. In Laser-Induced Breakdown Spectroscopy (LIBS) Fundamentals and Applications; Miziolek, A.W., Palleschi, V., Schechter, I., Eds.; Cambridge University Press: New York, NY, USA, 2006; pp. 122–170. [Google Scholar]
- Zwicker, H. Evaluation of Plasma Parameters in Optically Thick Plasmas. In Plasma Diagnostics; Lochte Holtgreven, W., Ed.; North-Holland Publishing Company: Amsterdam, The Netherlands, 1968; pp. 214–248. [Google Scholar]
- Ma, Q.L.; Motto-Ros, V.; Lei, W.Q.; Boueri, M.; Zheng, L.J.; Zeng, H.P.; Bar-Matthews, M.; Ayalon, A.; Panczer, G.; Yua, J. Multi-elemental mapping of a speleothem using laser-induced breakdown spectroscopy. Spectrochim. Acta B At. Spectrosc. 2010, 65, 707–714. [Google Scholar] [CrossRef]
- NIST Atomic Spectra Database (Version 5.8). Available online: https://physics.nist.gov/PhysRefData/ASD/lines_form.html (accessed on 17 February 2023).
- Díaz Pace, D.M.; Molina, J.; Rodríguez, C.I. Rapid Assessment of Extractability of Macronutrients from Yerba Mate (Illex paraguariensis) Leaves Based on Laser-Induced Breakdown Spectroscopy. Chemosensors 2024, 12, 18. [Google Scholar] [CrossRef]
- Díaz Pace, D.M.; Gabriele, N.A.; Garcimuño, M.; D’Angelo, C.A.; Bertuccelli, G.; Bertuccelli, D. Analysis of Minerals and Rocks by Laser-Induced Breakdown Spectroscopy. Spectr. Lett. 2011, 44, 399–411. [Google Scholar] [CrossRef]
- Morgan, D.J.; Jollands, M.C.; Lloyd, G.E.; Banks, D. Using titanium-in-quartz geothermometry and geospeedometry to recover temperatures in the aureole of the ballachulish igneous complex, NW Scotland. Geol. Soc. Spec. Publ. 2014, 394, 145–165. [Google Scholar] [CrossRef]
- Voll, G. The setting of the Ballachulish intrusive igneous complex in the Scottish Highlands. In Equilibrium and Kinetics in Contact Metamorphism: The Ballachulish Igneous Complex and Its Aureole; Voll, G., Töpel, J., Pattison, D.R.M., Seifert, F., Eds.; Springer: Heidelberg, Germany, 1991; pp. 3–17. [Google Scholar]
Disclaimer/Publisher’s Note: The statements, opinions and data contained in all publications are solely those of the individual author(s) and contributor(s) and not of MDPI and/or the editor(s). MDPI and/or the editor(s) disclaim responsibility for any injury to people or property resulting from any ideas, methods, instructions or products referred to in the content. |
© 2024 by the authors. Licensee MDPI, Basel, Switzerland. This article is an open access article distributed under the terms and conditions of the Creative Commons Attribution (CC BY) license (https://creativecommons.org/licenses/by/4.0/).